Buildings and Urban Intelligence

Fall 2023 Buildings and Urban Intelligence


Fall 2023 Buildings and Urban Intelligence
Rapidly increasing urban sprawl is evolving into a scenario where about 70% of the world’s population would be living in urban areas by the year 2050. Increased urbanization coupled with an explosion in availability of high-resolution data has opened new avenues of understanding and operating buildings, both as an entity as well in swarms.
The course explores the creation of a digital twin for upcoming and/or existing neighborhoods based on the fragmented data streams both from individual buildings as well as larger urban areas to make predictive assessments that will allow technology and policy recommendations in the following domains;
Energy and carbon flows / Community
The relative orientation, design and massing of buildings in a new neighborhood can have a profound effect on the operational energy and hence carbon emissions from catering to the energy needs of the neighborhood. Case studies include but not limited to building retrofits, transactive exchange of energy between buildings and community demand response.
Climate change and socially just adaptation
Urbanization exacerbates the impact of higher temperatures that are resulting from climate change. Case studies explore the architectural and urban design choices that a cohort of buildings at block/neighborhood level can adopt resulting in improved local microclimate and mitigation of heat related hazard in built spaces as well as open urban areas.
Studio Instructor Mayuri Rajput
Teaching Associate Xinzhu Chen
Students
Ashutosh Lohana, Bianca Deng, Haoyun Yang, Jialiang Xiang, Mingjie Guo, Tomoyuki Tasaki
Final Review Critic Yu Qian Ang
If the readers are more interested in a particular project, they can reach out to the instructor for more information.
11
Urban Heat Island and Pedestrian Visual Comfort: Analyzing the Role of Pavement Materials in Walkable Cities
Ashutosh Lohana
17 Effective Retrofitting: Energy and Cost Efficient Measures for Existing Brick Buildings
Bianca Deng
21 Finding the Best Layout Location for Affordable Housing
Haoyun Yang
23 Optimizing Overhangs for SouthFacing Windows with high SHGC in Chicago, USA
Jialiang Xiang
25 Rejuvenate Charlame St: Sustainable updates for affordable housing
Mingjie Guo
27 How can urban planners use UBEM practically?
Tomoyuki Tasaki
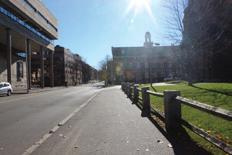
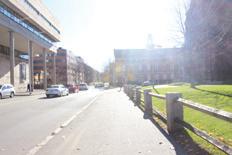
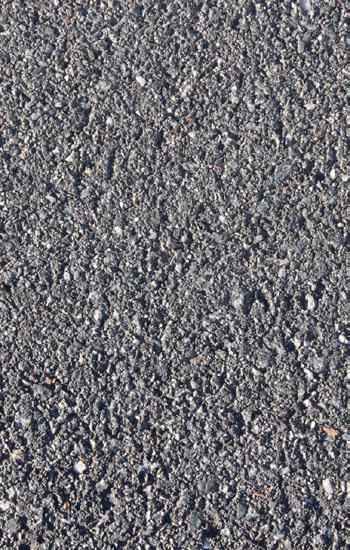
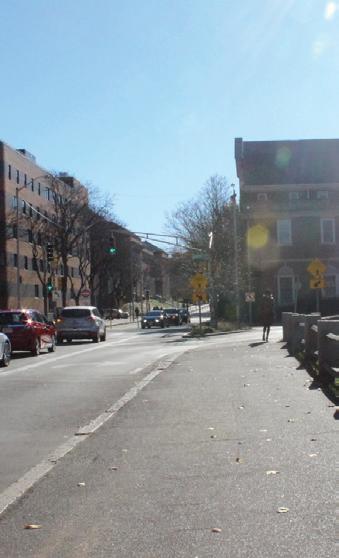
As the global emphasis on walkable cities grows, the adoption of thermally viable and visually comfortable pavement materials becomes crucial. While highly reflective materials have been widely employed to enhance outdoor thermal comfort, they often induce visual discomfort for occupants of adjacent buildings and pedestrians due to outdoor glare.
Urban Heat Island researchers and policymakers advocate for the adoption of reflective pavements as a proactive measure to mitigate urban air temperature (AB 296 Assembly BillBill Analysis n.d.). However, recent studies have uncovered a potential drawback, indicating that the use of reflective pavements may inadvertently amplify building energy consumption by redirecting solar radiation onto building surfaces (AzariJafari et al. 2021).
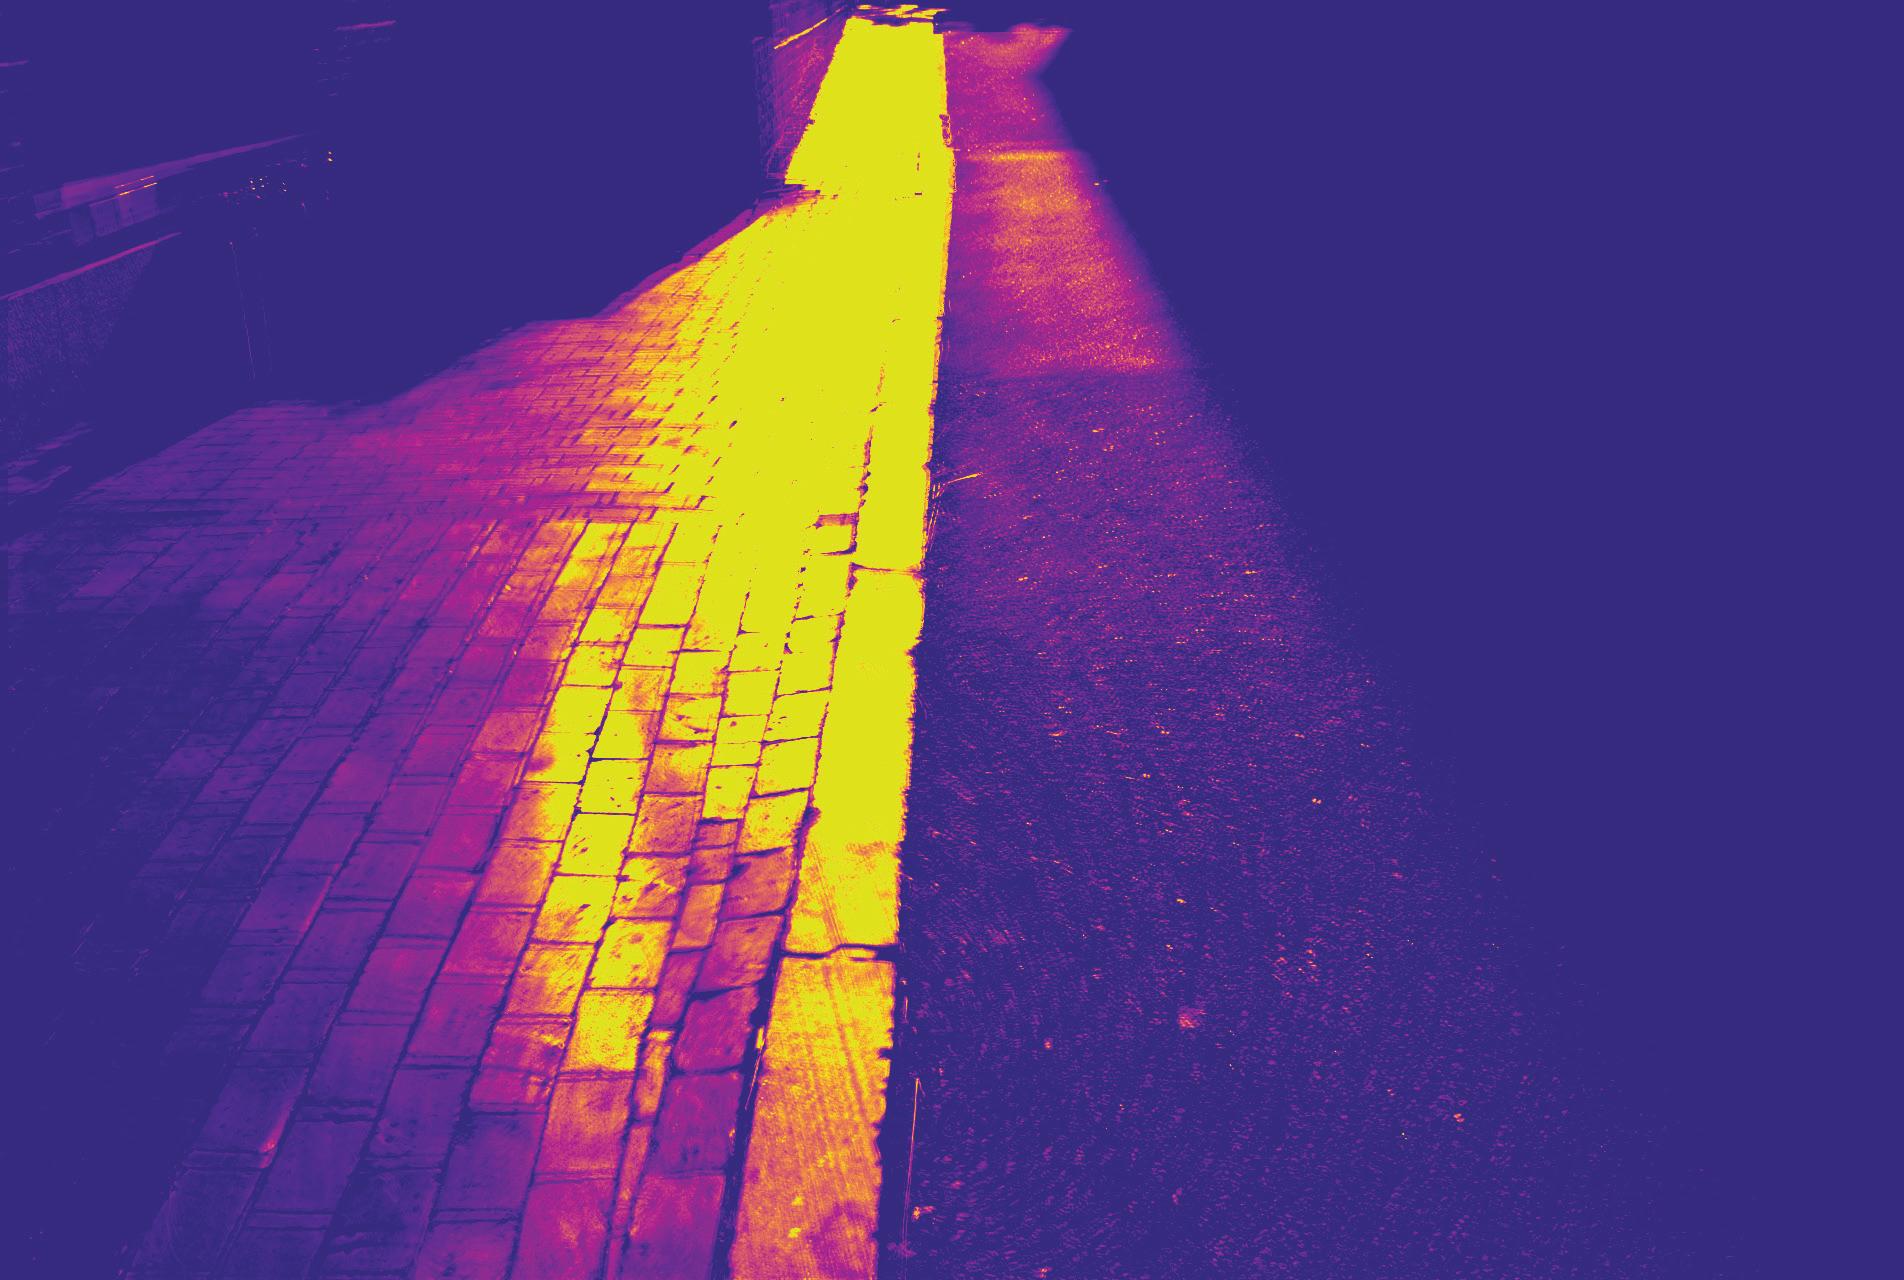
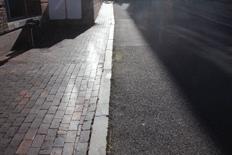
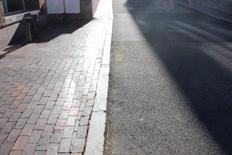
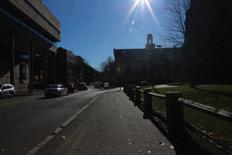
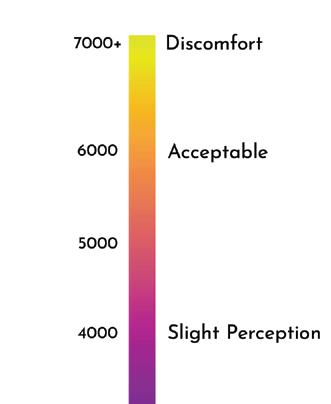
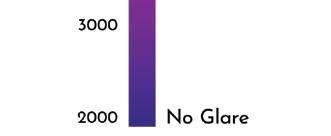
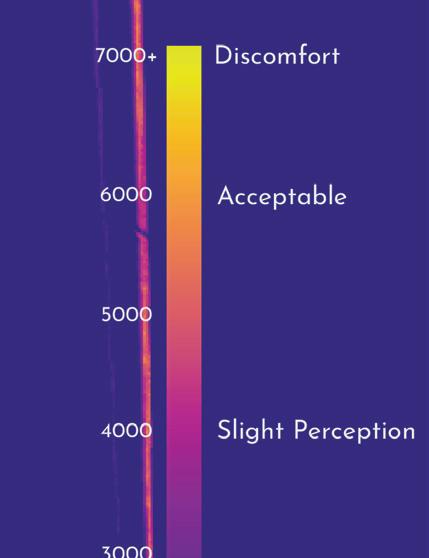
This research recognizes the dual significance of thermal and visual comfort, striving to pinpoint pavement materials that seamlessly integrate both aspects. In Part 1, the research establishes a framework for outdoor visual comfort, evaluating pavement materials’ albedo and luminance. Luminance, measured by a meter, and High Dynamic Range Imaging (HDRI) capture authentic scenes, translated into False Colour HDR Calibrations via Climate Studio. Results are compared with glare comfort standards.
Part 2 investigates diverse paving materials’ impact on Energy Use Intensity (EUI) using the Urban Weather Generator (UWG) to create material-specific EPW files. The Urban Modeling Interface (UMI) calculates the Urban Heat Island (UHI) effect on EUI, simulating a residential building for each EPW file.











Firstname Lastname

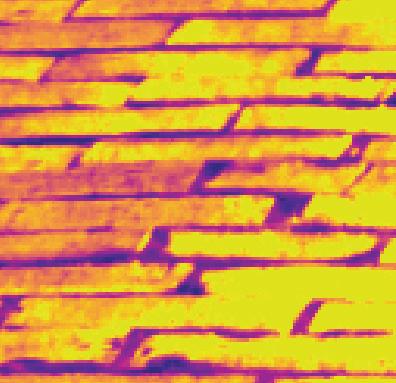


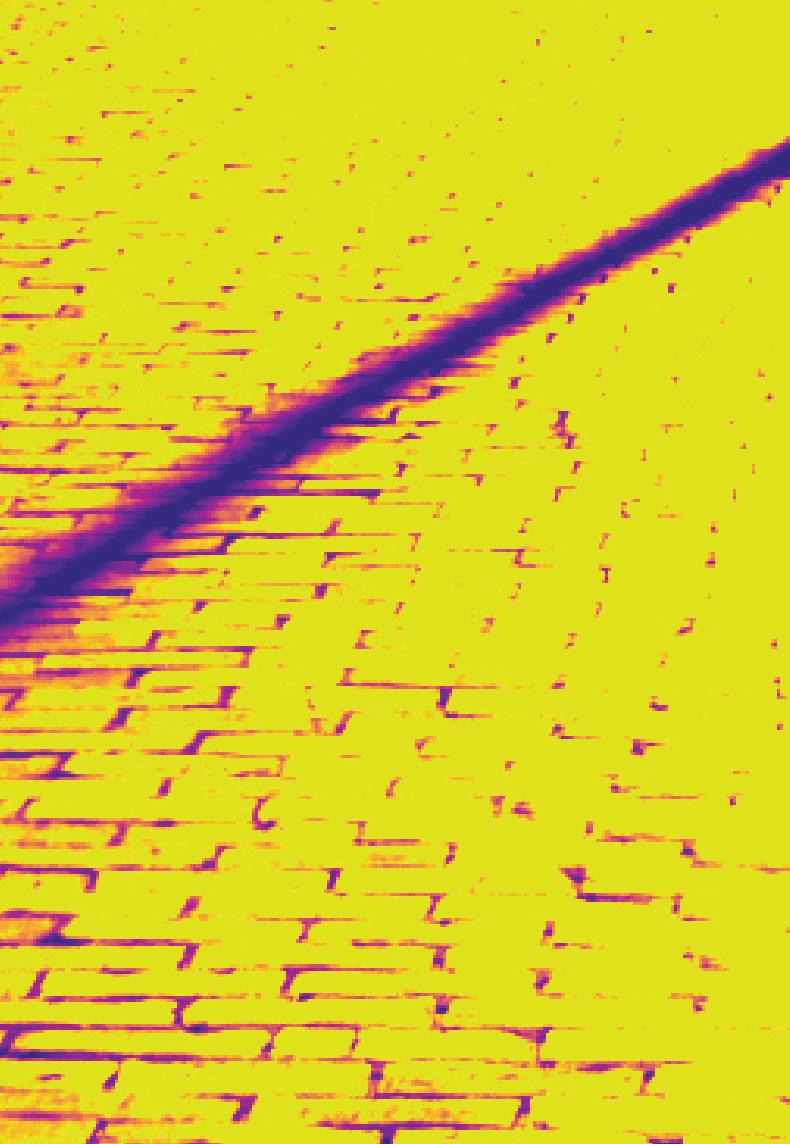

 12000 cd/m2
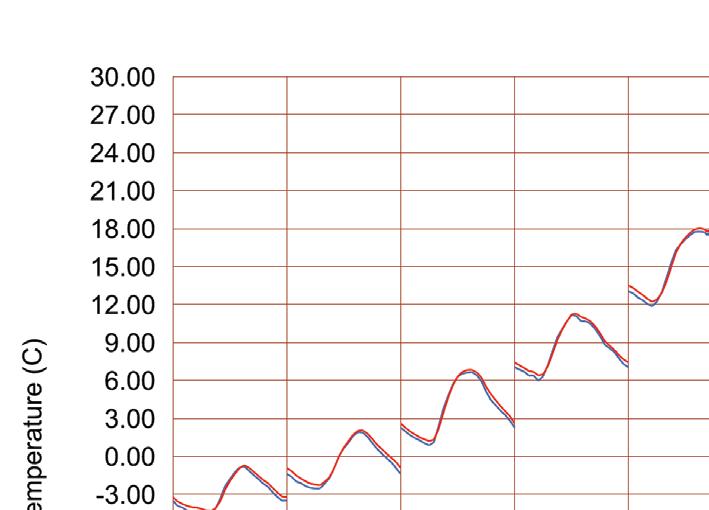
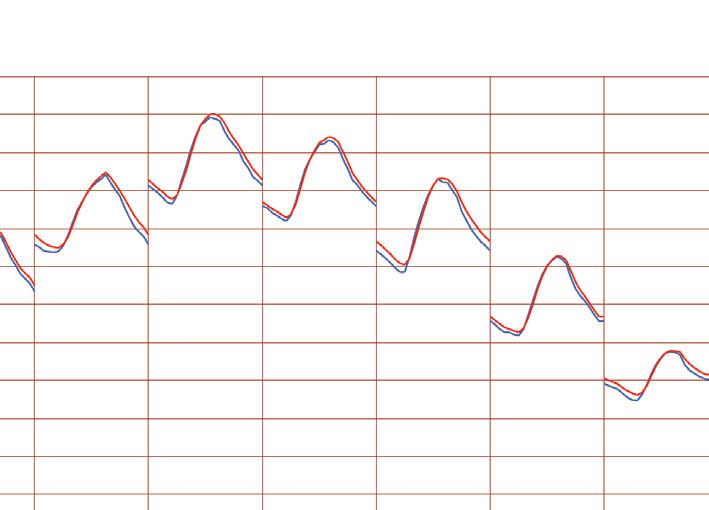

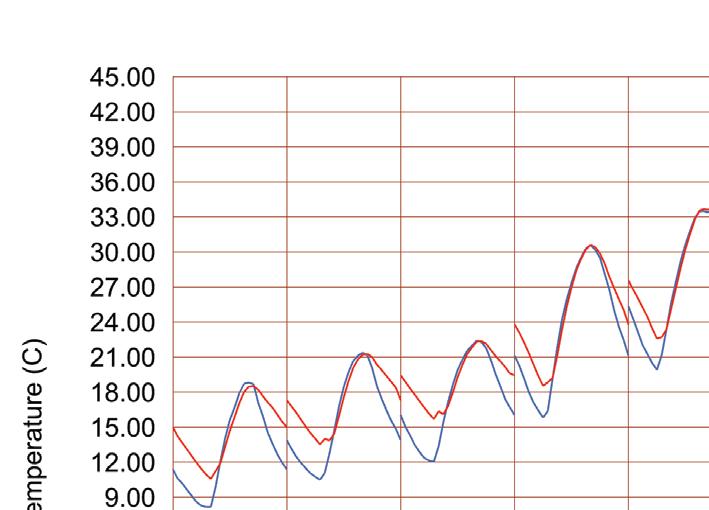


Above: The UWG simulation discloses a substantial increase in night-hour temperatures for Phoenix, ranging from 3-5 degrees annually, attributed to the Urban Heat Island (UHI) effect. Conversely, Boston experiences a milder night-hour temperature rise, ranging from 0.3-2 degrees, particularly between Apr-Nov.
Following page: UMI Simulation results for Boston and Phoenix depicting change in EUI consumption as a result of UHI effects. The UMI simulation reveals that in a hot zone like Phoenix (ASHRAE 2B), the UHI contributes to a 5 KWH/m2 increase in the neighborhood’s energy consumption, accompanied by elevated cooling loads. In contrast, Boston’s (Cold, ASHRAE 5A) neighborhood EUI is reduced by 2 KWH/m2, reflecting decreased heating loads.

Boston Urban Heat Island Effect for Asphalt

Original EPW:
- Total Site Energy: 149 kWh/m2
- Cooling: 13 kWh/m2
- Heating: 54 kWh/m2
New EPW:
- Total Site Energy: 147 kWh/m2
- Cooling: 13 kWh/m2
- Heating: 52 kWh/m2
Phoenix Urban Heat Island Effect for Asphalt

Original EPW:
- Total Site Energy: 115 kWh/m2
- Cooling: 32 kWh/m2
- Heating: 2 kWh/m2
New EPW:
- Total Site Energy: 120 kWh/m2
- Cooling: 38 kWh/m2
- Heating: 1 kWh/m2

This project delves into examining the effectiveness of the current retrofitting incentives offered by Mass Save, through a focused case study on historical brick buildings in Boston’s Bay Village. The primary objective is to identify strategies for upgrading buildings constructed before the 1975 energy codes, ensuring that these enhancements do not undermine their historical integrity. Given the stringent facade preservation regulations governing these buildings, the project navigates through the complexities of retrofitting strategies within these constraints.
A significant part of the study involves the utilization of GIS data and UMI tools to categorize the buildings into three distinct groups based on various factors such as age, material, and current energy efficiency levels. This classification aids in tailoring retrofitting strategies that are both effective and respectful of each building’s historical significance.
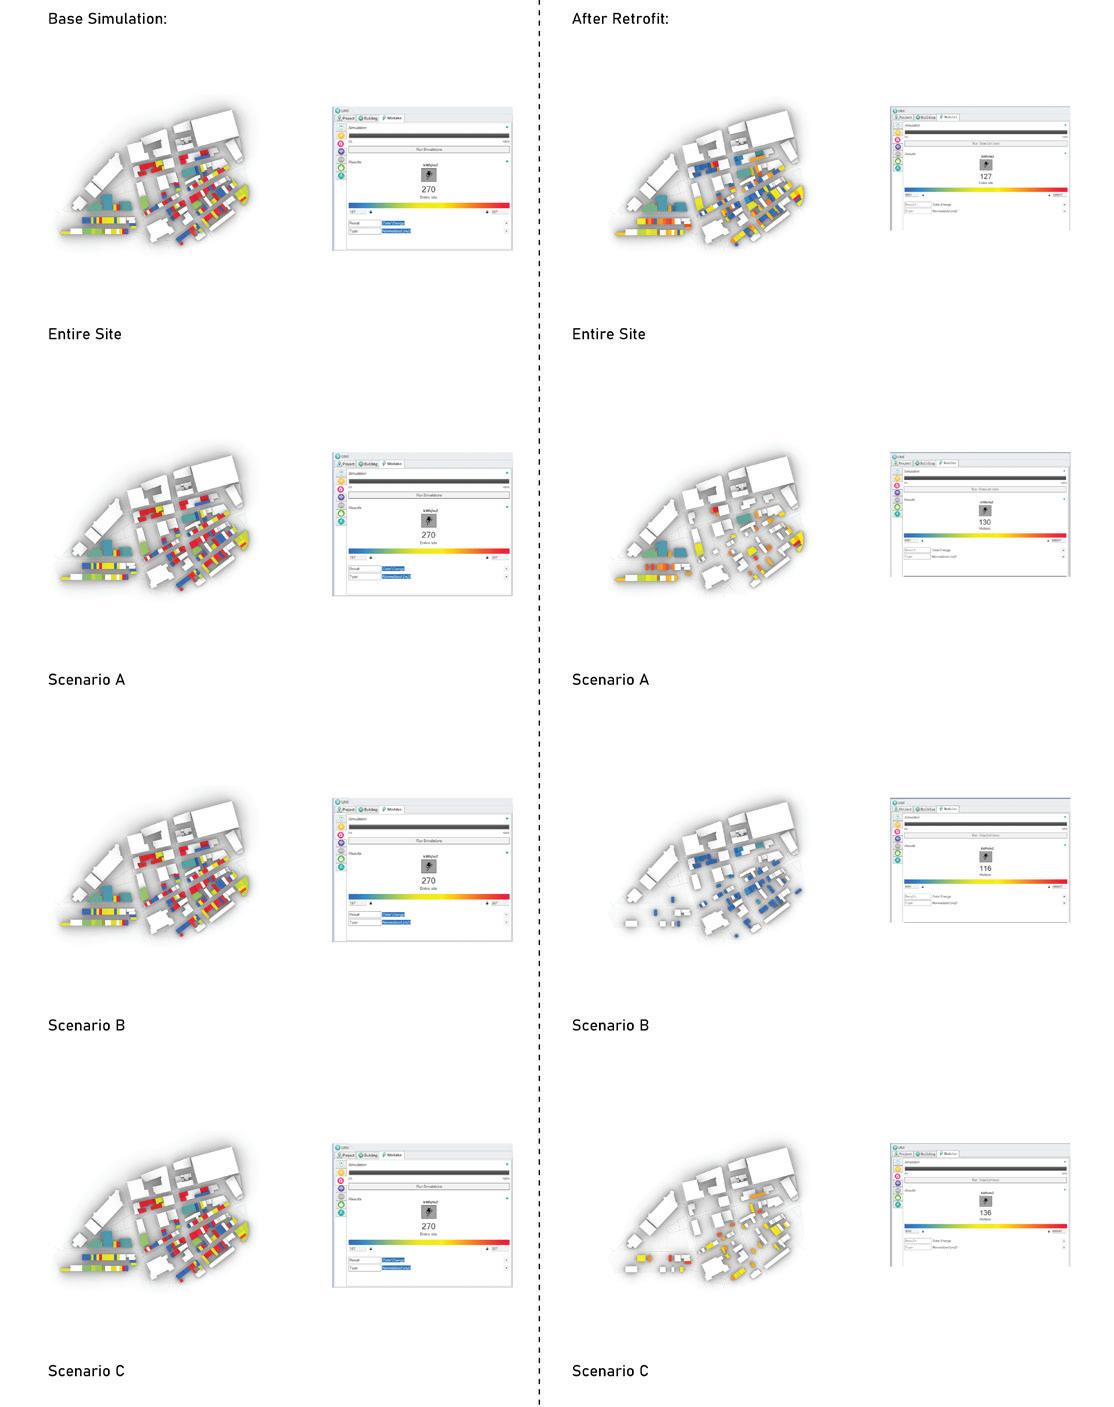
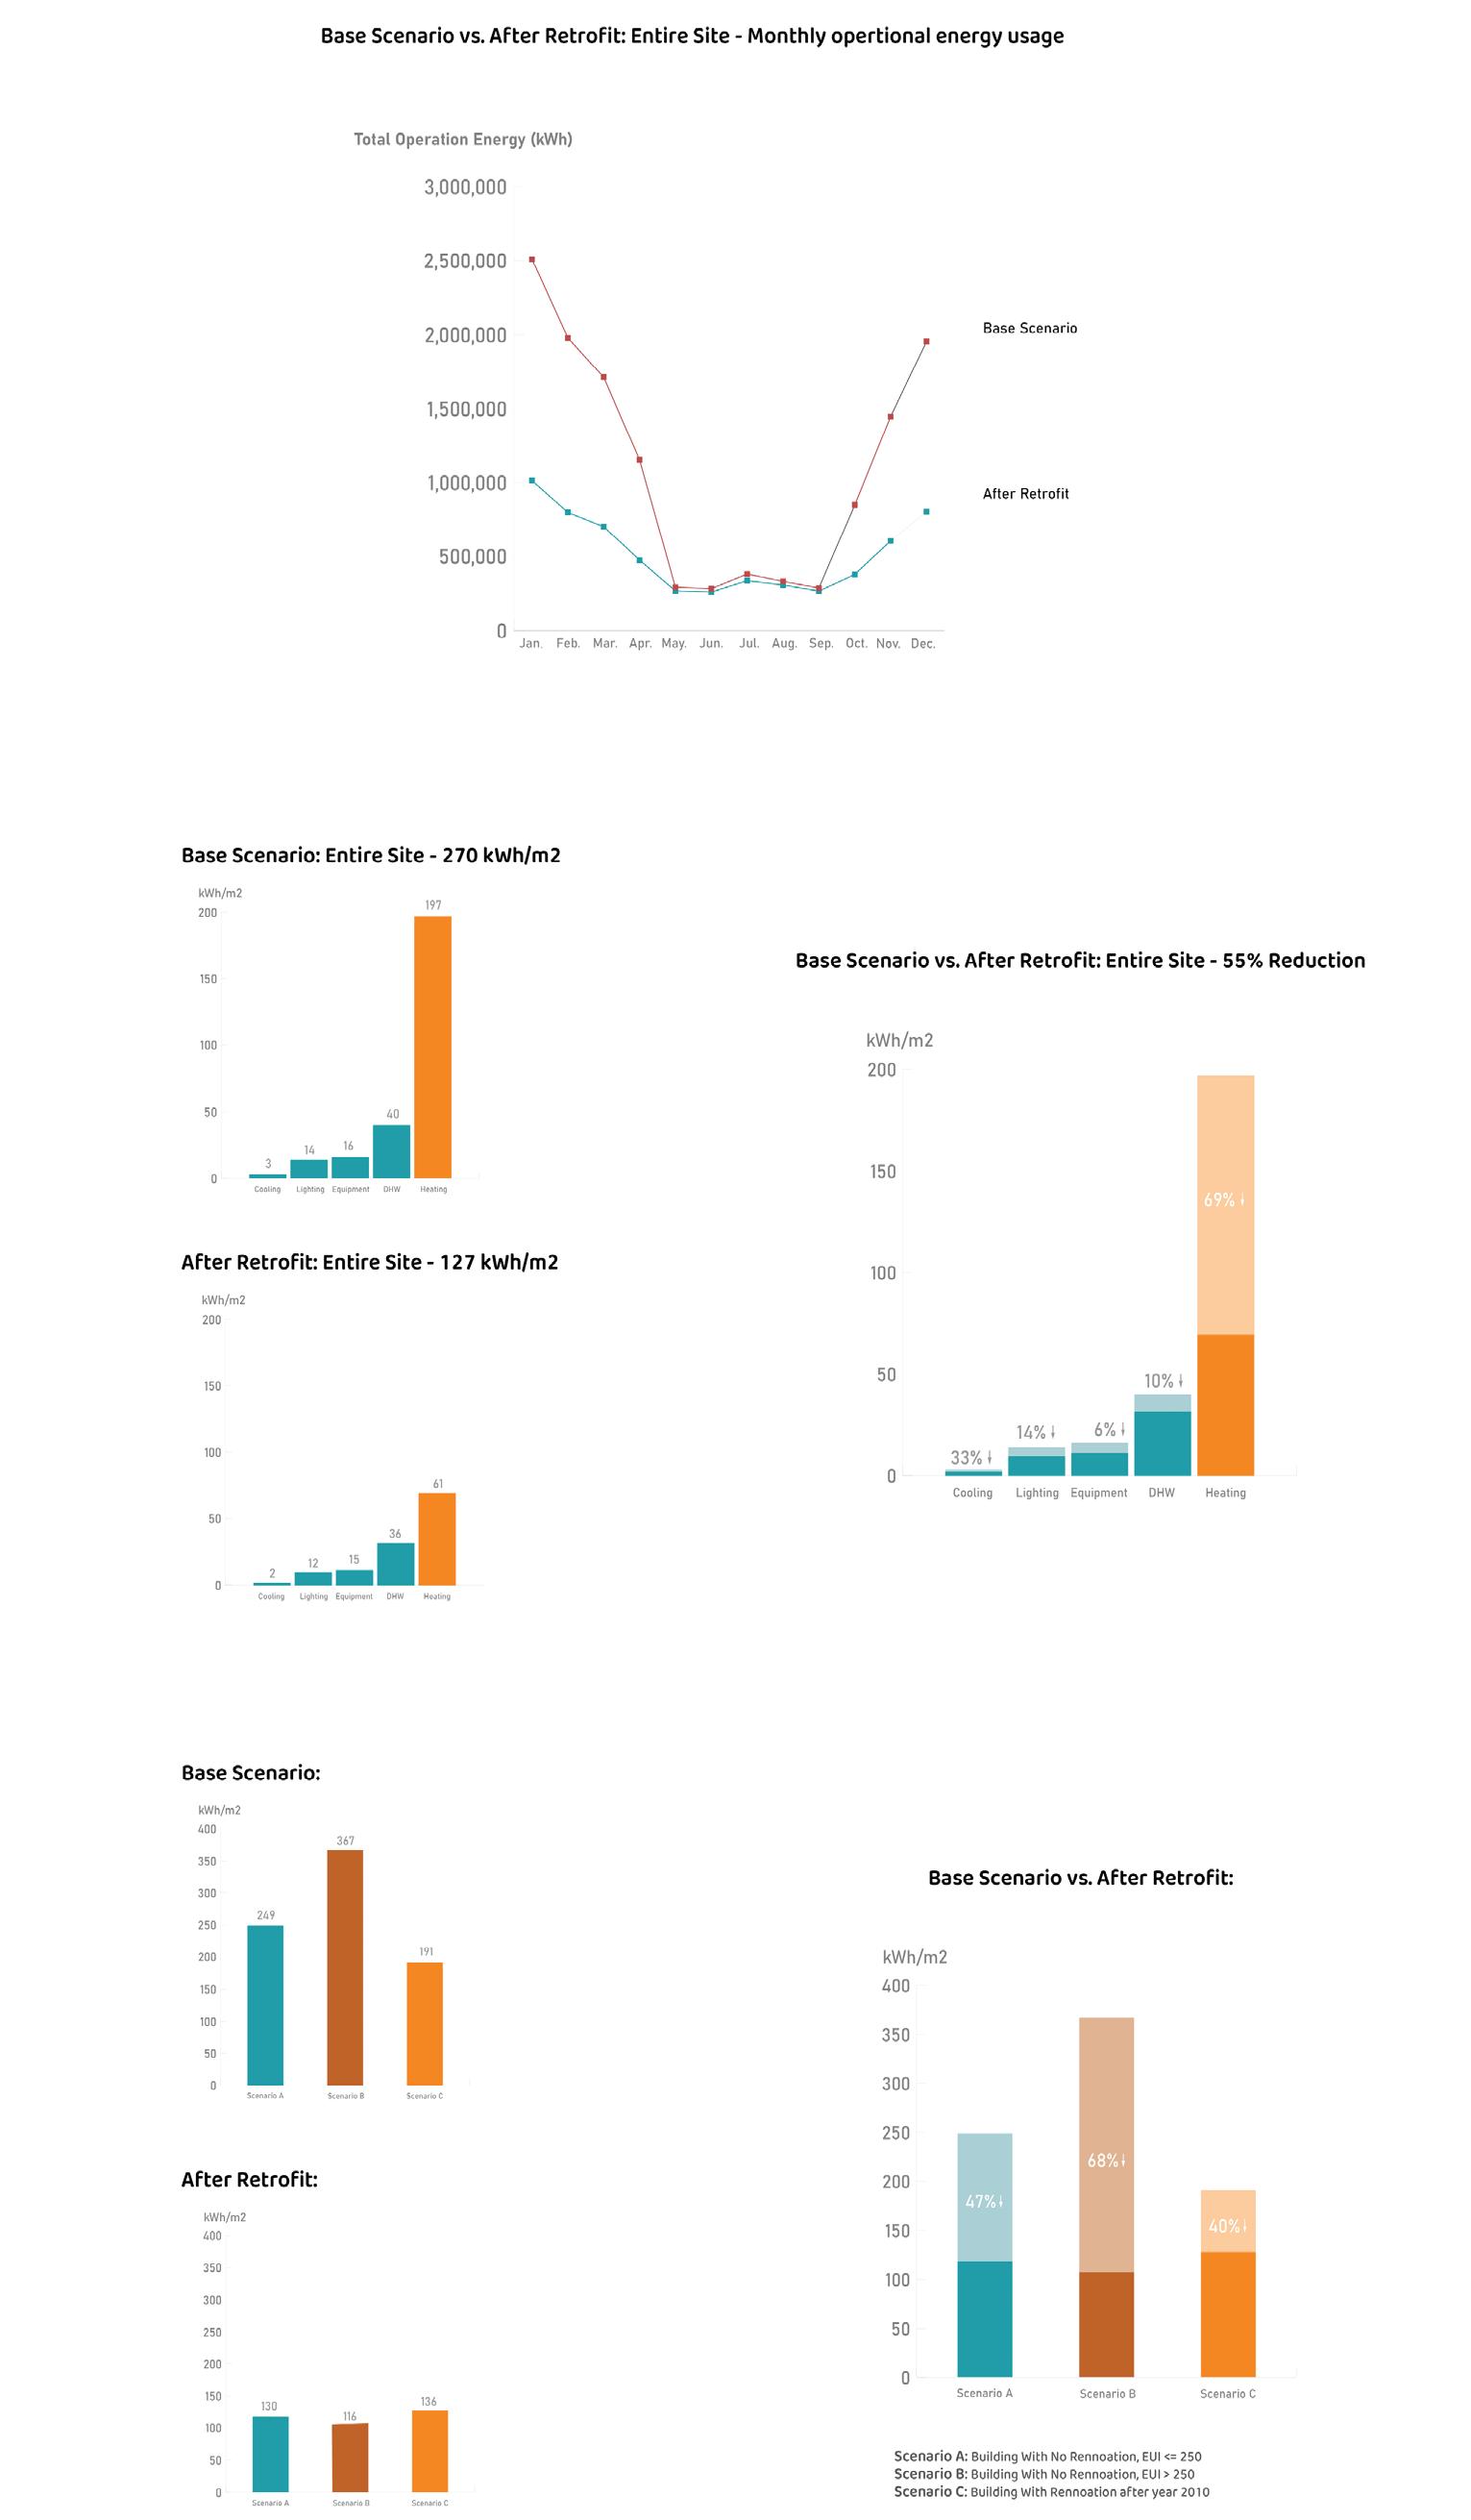
The simulations conducted post-retrofitting reveal notable improvements in Energy Use Intensity (EUI). However, these improvements are not sufficient to align with the standards set by the Boston Zero Carbon Building Zoning Initiative. This outcome underscores a critical gap in the current incentive structures provided by MASS SAVE, pointing towards the need for more economic support for property owners in historical districts.
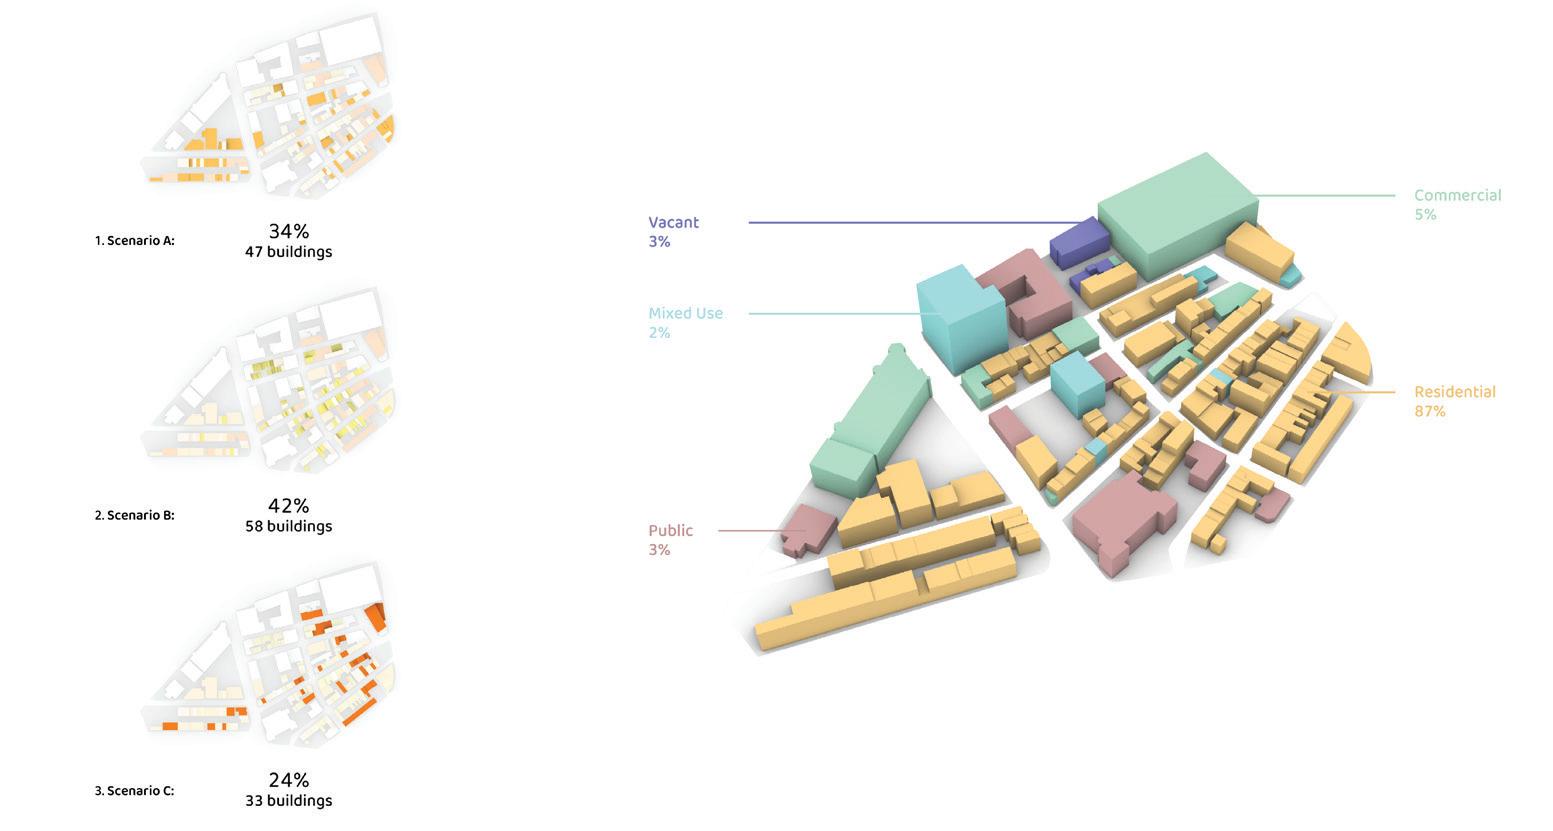
Top: Buildings are divided into three scenarios: Scenario A: Buildings constructed before 1975 with an existing EUI of 250 kWh/m^2 or smaller, Scenario B: Buildings constructed before 1975 with an existing EUI above 250 kWh/m^2, and Scenario C: Buildings constructed before 1975 but renovated post-2010.
Bottom: Simulations for the three defined scenarios are performed using the Urban Modeling Interface (UMI) tools. For each scenario, two simulations are conducted: one representing the existing condition of the buildings, and another depicting the post-retrofit condition.
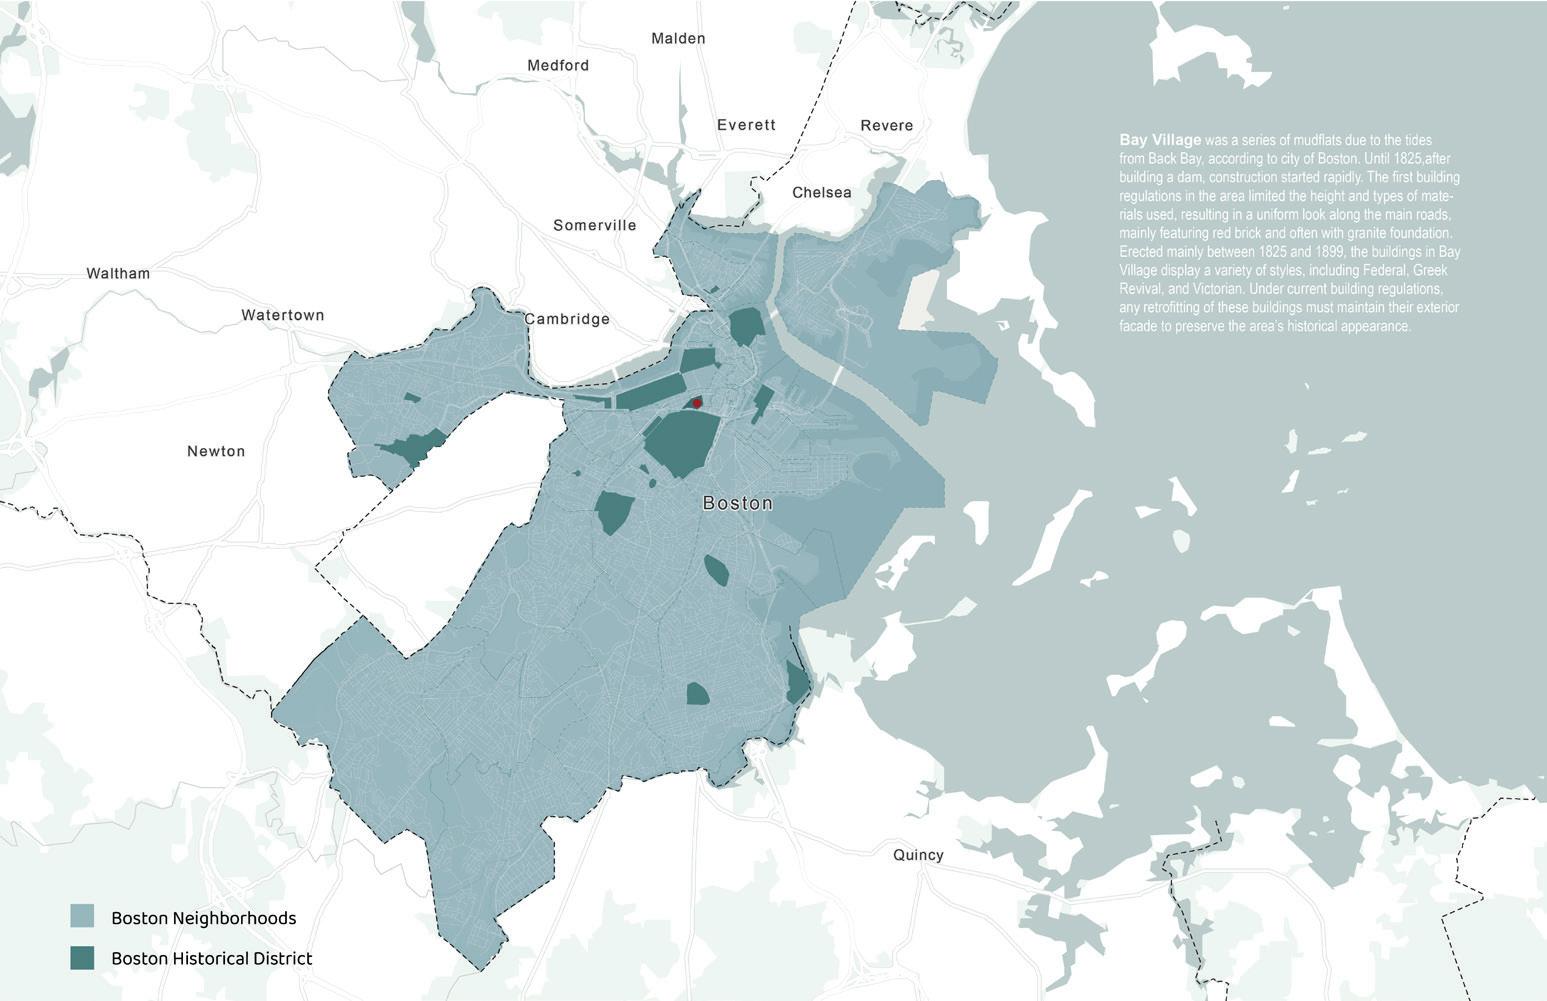
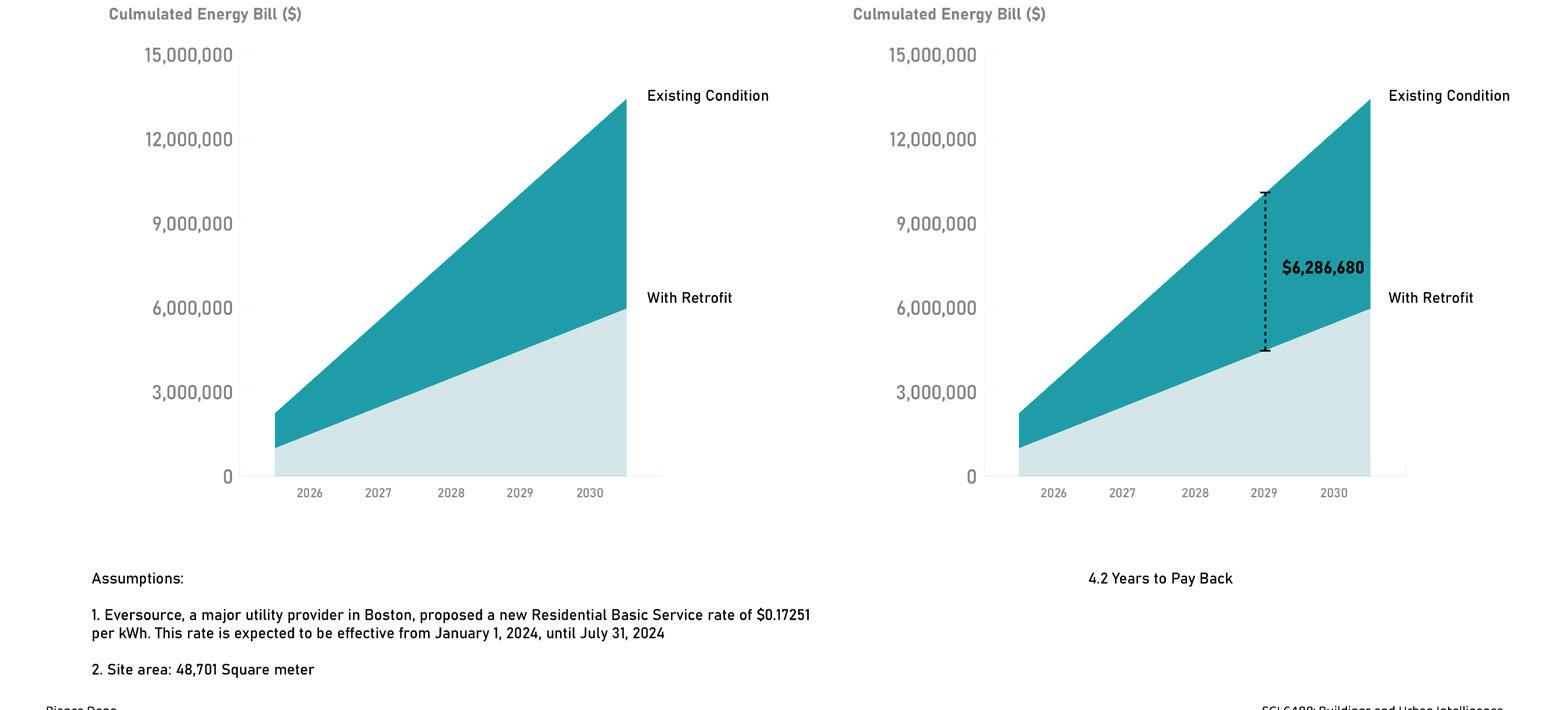
Top: Erected mainly between 1825 and 1899, the buildings in Bay Village display a variety of styles, including Federal, Greek Revival, and Victorian. Under current building regulations, any retrofitting of these buildings must maintain their exterior facade to preserve the area’s historical appearance.
Bottom: The total cost for retrofitting the entire neighborhood is estimated at around $6.29 million, with an overall payback period of 4.2 years through energy savings.
Following page: The results show a significant improvement in overall EUI value, decreasing from 270 kWh/m^2 to 127 kWh/m^2, a 52% reduction in Site EUI.
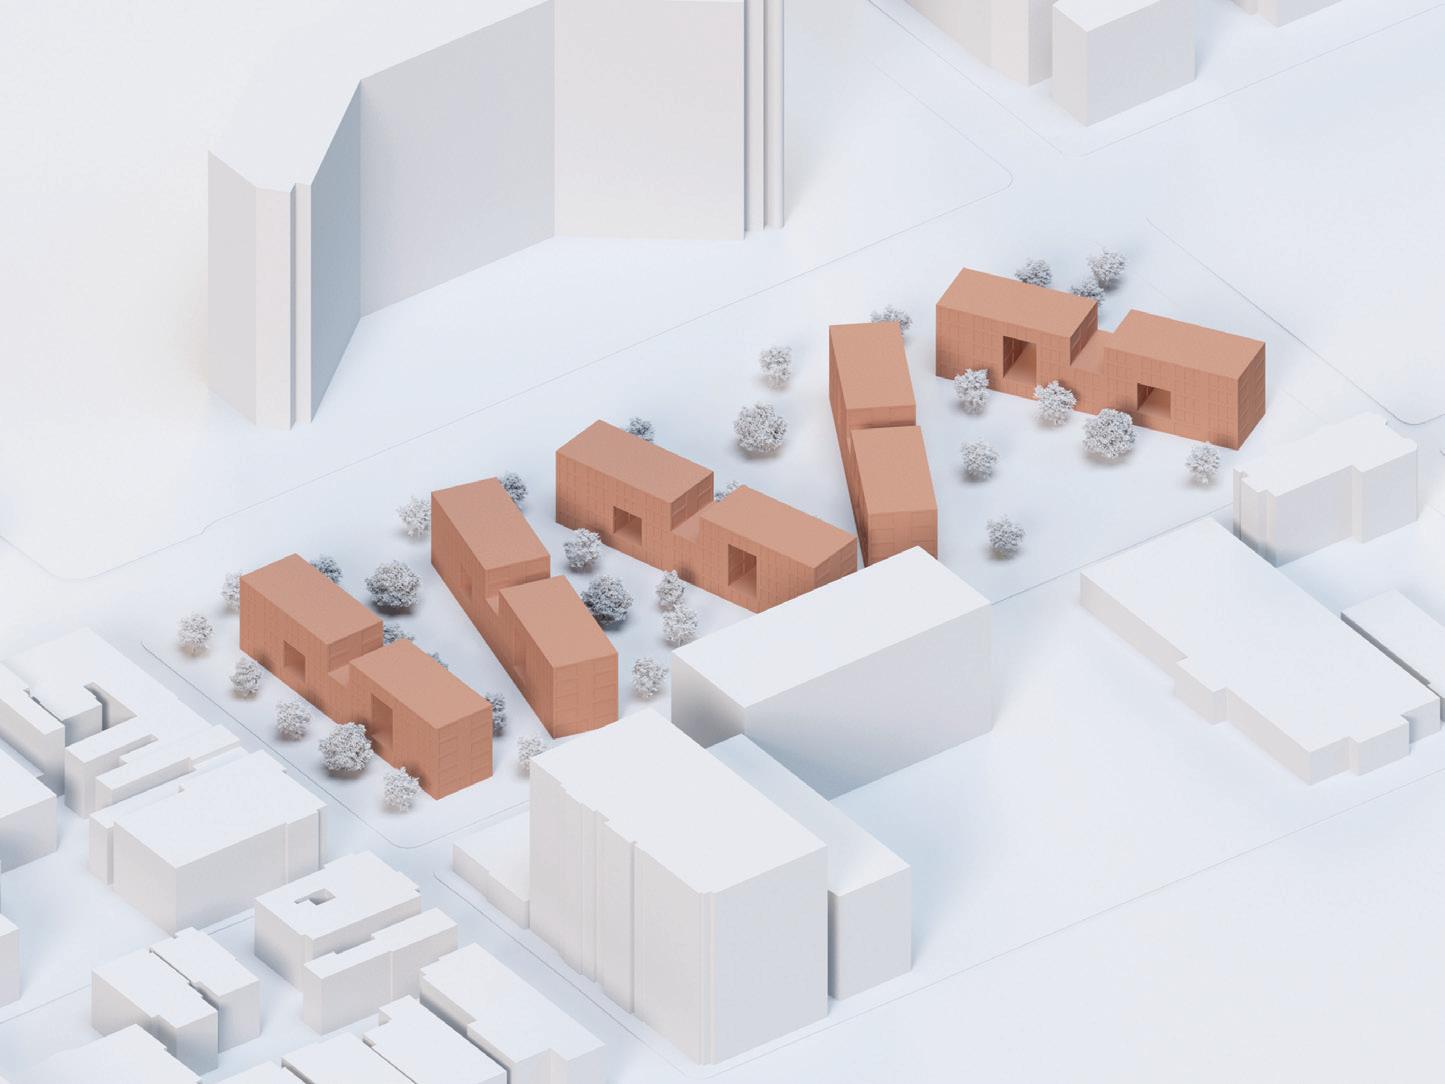
The project aimed to find the best location for affordable housing by simulating energy usage in each unit though climate-studio and energy-plus, providing low-income residents with cost-effective housing options. The project is located in University City, Philadelphia on 40th Street. It consists of five residential buildings with a total of 330 units. Straw and cork are used as insulation materials in these buildings for their sustainability, excellent insulation performance, and energy-saving benefits. The five buildings feature identical CLT structures, yet each possesses a distinct orientation and material composition. They all boast uniform wall thickness. Building A and B are equipped with straw insulation, while building C utilizes conventional insulation. On the other hand, building D and E incorporate cork insulation. For buildings with the same design and wall thickness, a slight east-west rotation has minimal impact on energy consumption. Furthermore, compared to north-south rotation, east-west rotation exhibits less significant changes in solar radiation reception. When it comes to material selection, Cork demonstrates better insulation performance. The D building is the least energy-consuming one in the whole building groups.
When considering Building D, I categorize energy usage into five tiers, with the first tier representing minimal consumption and the fifth tier indicating maximal usage, resulting in a disparity of approximately 16.5% between them. Based on the provided diagram, an increase in facades generally leads to greater heat loss or gain, which subsequently results in heightened energy consumption. The units in the first and second grade areas were ultimately selected as affordable housing sites, enabling low-income families to reduce their energy expenses by leveraging the building’s energy-efficient attributes.
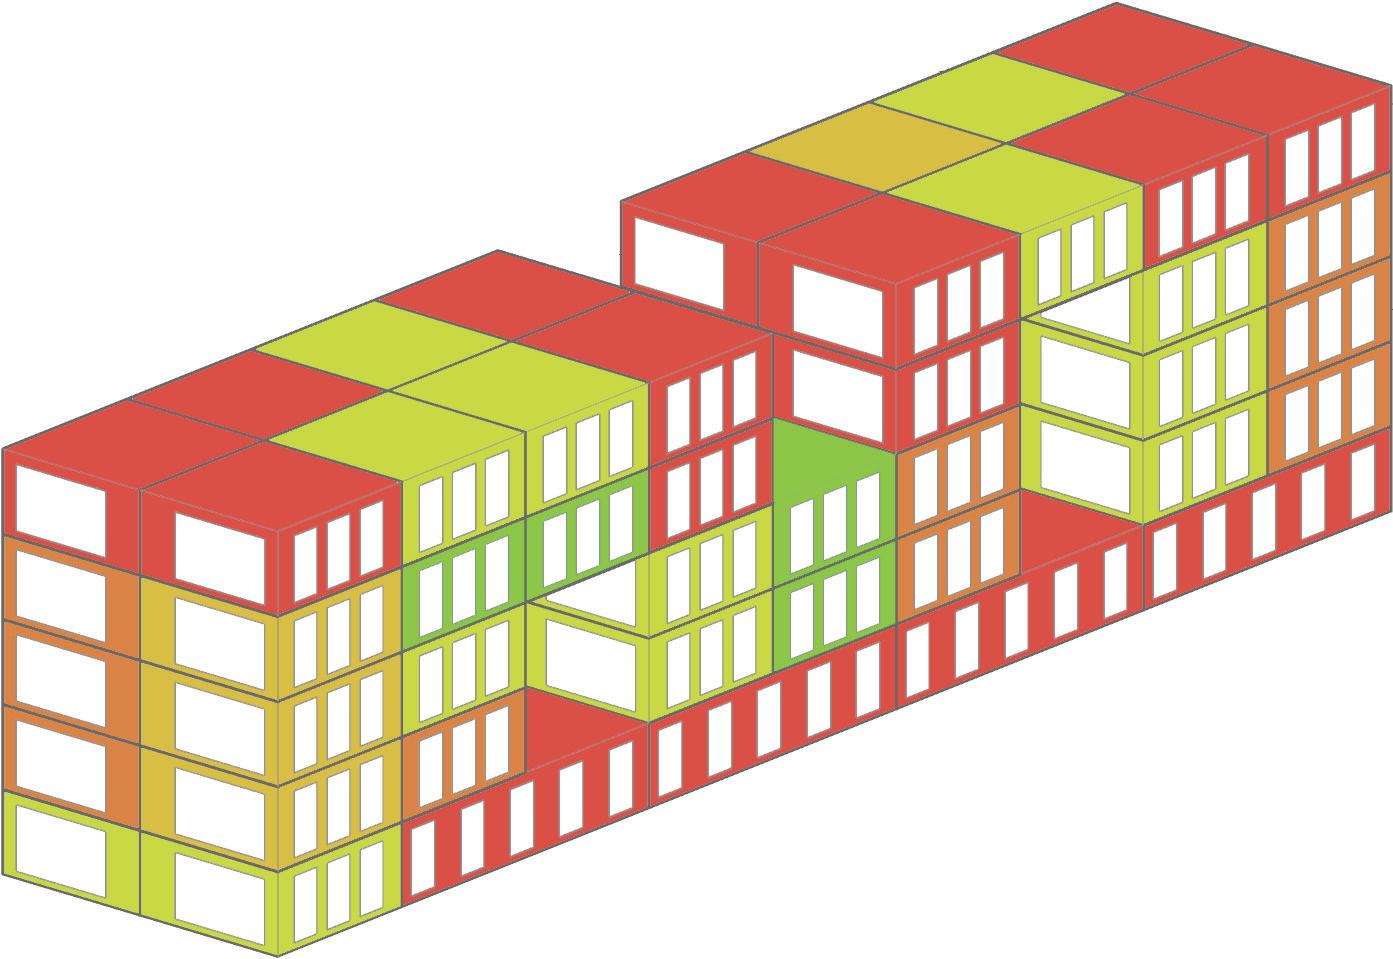

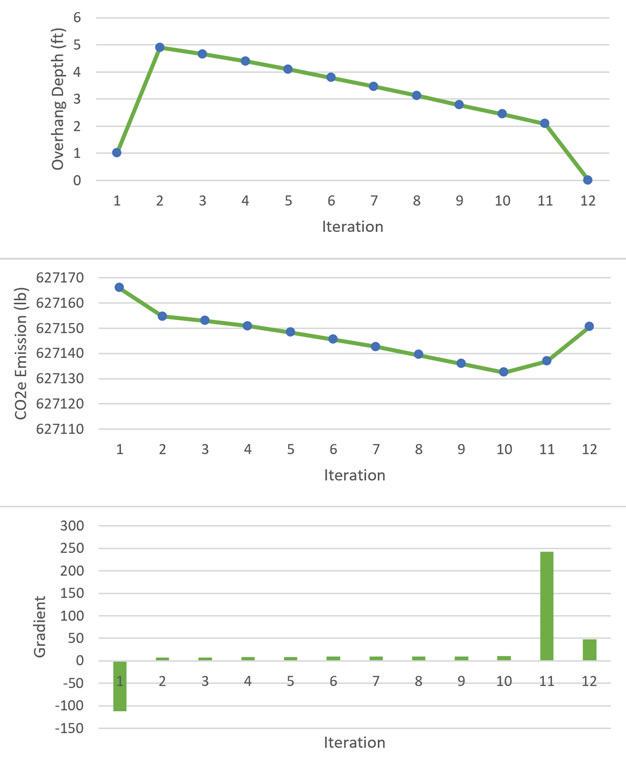
To further control the emission of greenhouse gases, the government of Illinois has been offering rebates for heat pump installations. This project considers the hypothetical scenario where all residential units in Chicago upgrade to heat pump for heating and cooling with existing electric or gas systems as backup. Because Chicago has a heating-dominant climate, and the COP of heat pumps can drop considerably in low temperature, we expect that increasing the SHGC of south facing windows would bring down the annual total carbon emission. Since increasing SHGC would also increase the emission during the cooling season, we consider installing exterior overhang shadings to all south facing windows, which would block the high-altitude sunlight during summer while still letting in the low-altitude sunlight during winter. With this goal in mind, we investigate the optimal overhang depth for south-facing windows of high SHGC in Chicago. In addition, we make use of the gradient descent algorithm, the standard optimization algorithm for machine learning, to optimize the overhang depth, and make use of the Finite Difference method to calculate the gradient. Compared to more conventional methods such as genetic algorithms, gradient descent for urban-scale optimization offers faster convergence speed and better understanding over the properties of the formal system.
Affordable housing is an important part of a city and an important factor influencing the healthy development of human society.Well-run affordable housing will provide basic human rights protection for low-income people, just like the barrel principle that determines whether a city can continue to move forward. In Boston, many affordable housing units were built too long ago to meet the current needs for sustainability and higher living standard. Affordable housing reconstruction is also underway in many areas. However compared with renovation, reconstruction may cost more resources and energy .How can planners and architects transform urban neighborhoods in a way that is: environmentally responsible, socially equitable,cost controllable?
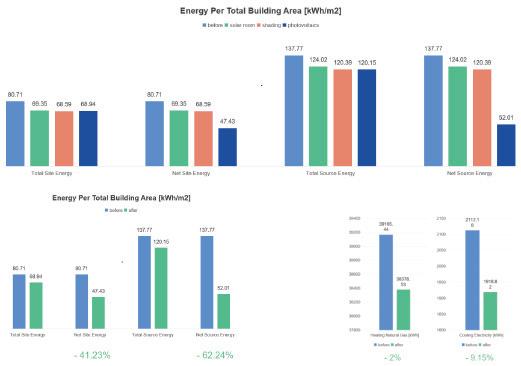
In this design, I tried to save energy to the greatest extent through minimal intervention. First, I added a sun room to each living unit to expand the space used by low-income people and improve the quality of life. At the same time, the addition of sunlight and the corresponding shading system also improve the thermal comfort environment of the original building. I ended up adding solar panels on rooftops and parking areas throughout the community to further balance energy consumption. My design saves resource and energy consumption from three dimensions.Construction stage: Reduced energy and resource consumption during demolition and construction.Use stage: improve the thermal performance of the building and save energy.Equipment stage: Adding solar power generation and shading system to further enhance the environmental value of the building.
step 1 :Add support structure
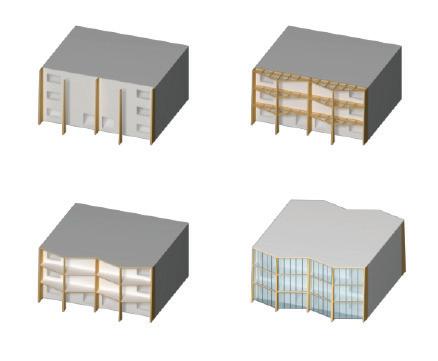
step 3 :Add maintenance materials
step 2:Add horizontal structure
step 4 :Add glass curtain wall
Urban-scaled Building Energy Modeling (UBEM) is an approach to building energy modeling on the neighborhood scale. Many researchers point out that UBEM can be utilized not only in academic research but also in practical urban design processes. Then, how can urban planners use UBEM practically?
Urban planners often collaborate with city government and developers in creating neighborhood plans. These days, neighborhood plans often include sustainability goals such as carbon neutrality. Therefore, if these three sectors have merit, UBEM can be utilized effectively in the collaboration process.
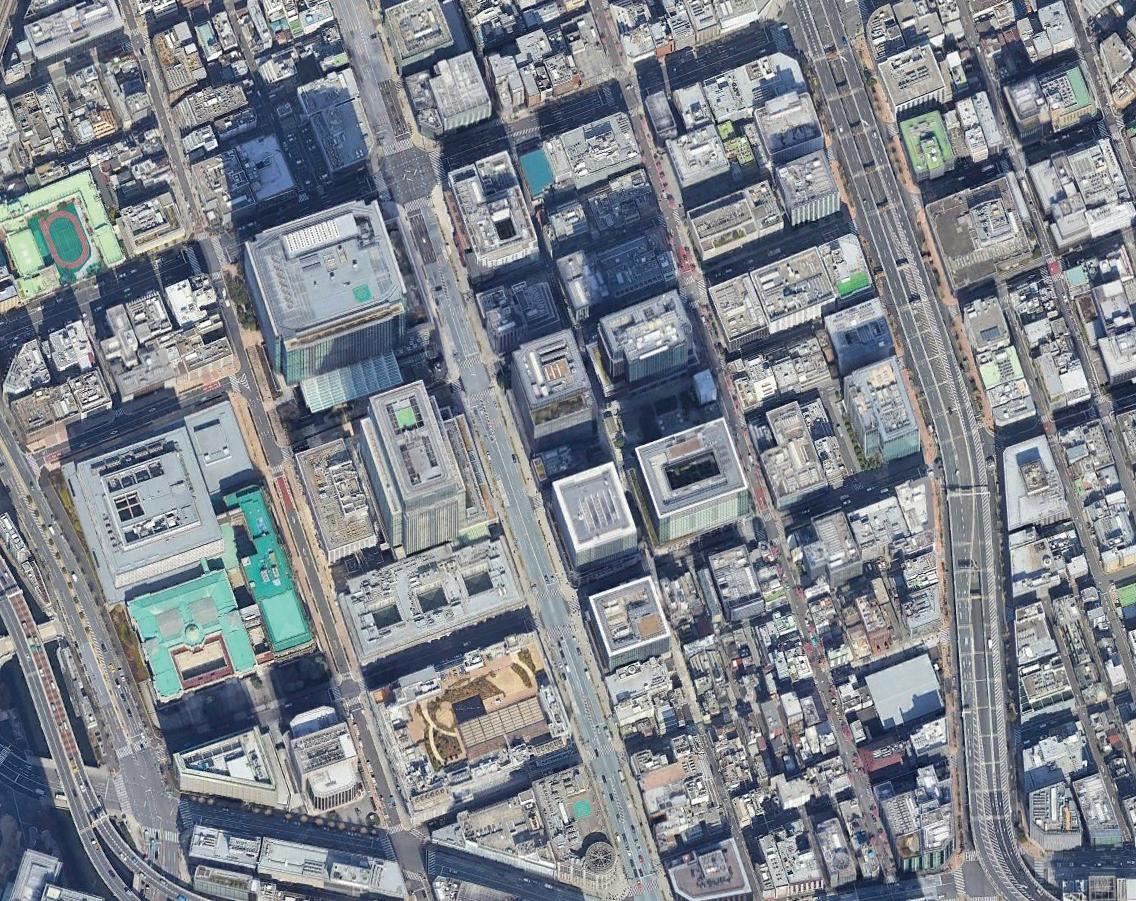
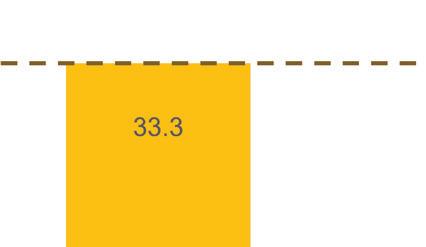
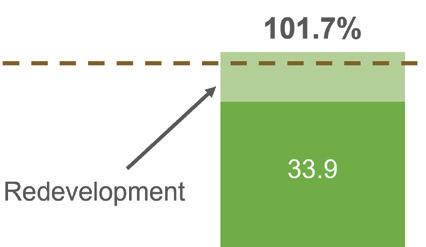
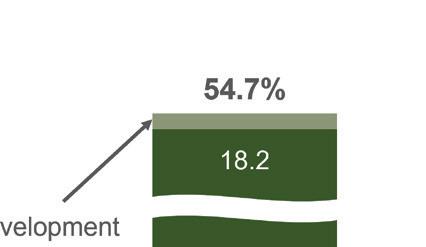
A mock-up simulation was conducted in this project for the Nihombashi area, Tokyo, mixed-use districts with an ongoing redevelopment. The amount of energy consumption in the area in 2030 was predicted based on two scenarios. In scenario B, more measures for sustainability would be conducted by following the city’s sustainability goal compared with scenario A. As a result, a 45% decrease in carbon emission was predicted in scenario B, while the effect of facility upgrading was canceled by the total floor area increase because of redevelopment in scenario A.
The result makes it clear that city government, developers, and planners all have merit in utilizing UBEM. City government can quantitatively assess and show the effects of its sustainable measures to the public. Developers can show positive impacts of their development larger by simulations including surrounding districts. Planners can make their presence larger by acquiring the skills for UBEM simulation.
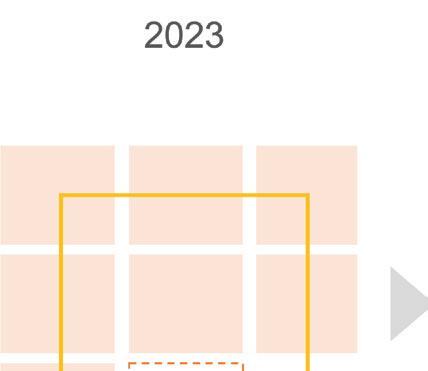


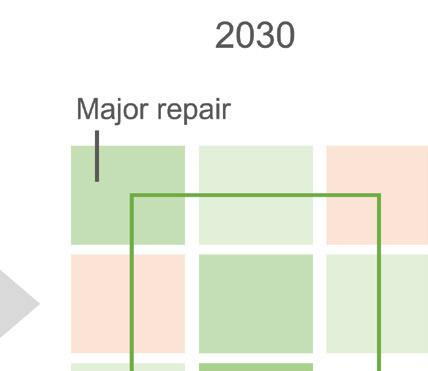
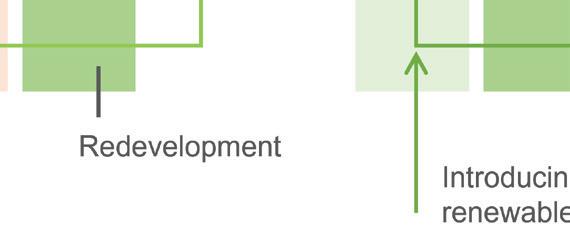

facili-
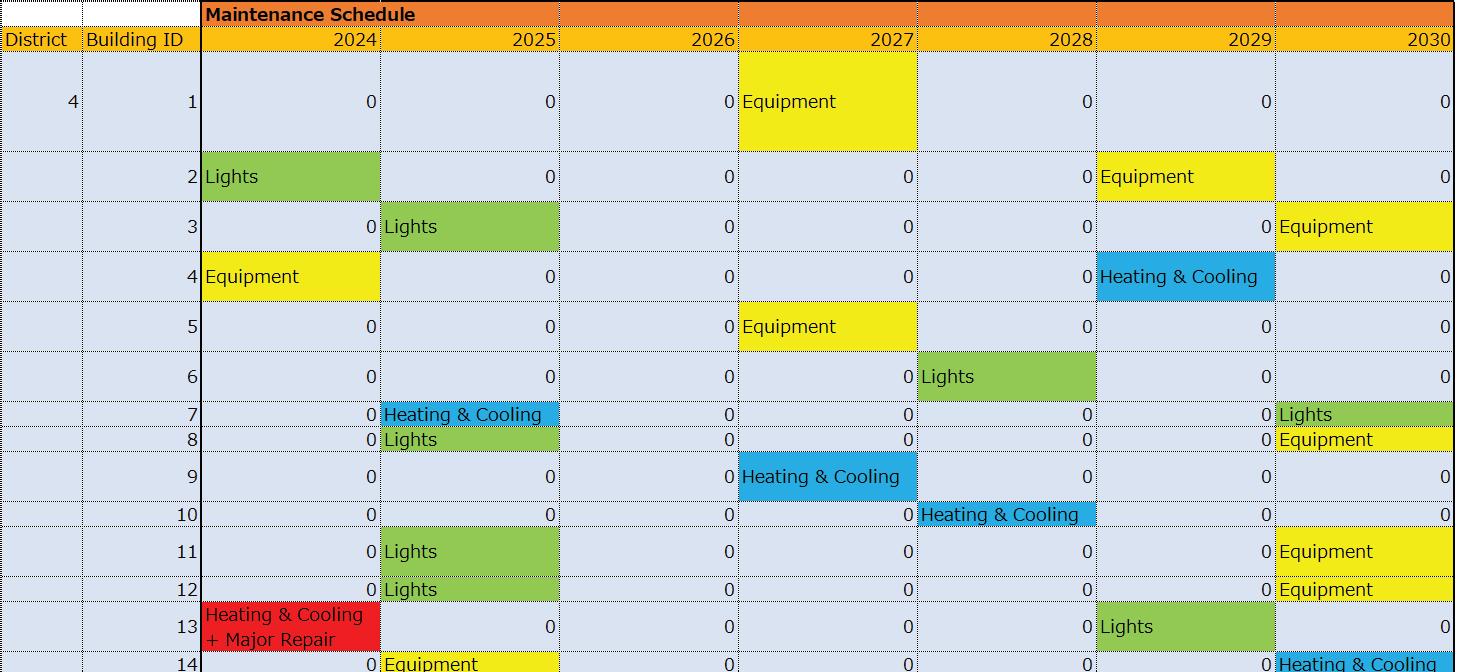
and some other kinds of sustainable measures would be conducted in each existing buildings respectively until 2030 in simulation scenarios.
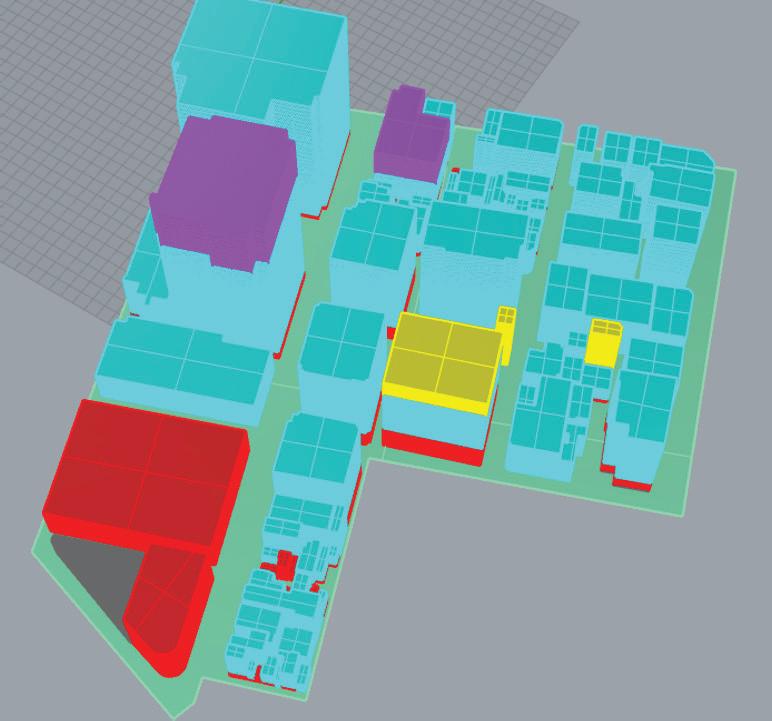
Following page: The results of
Energy Consumption (GWh)


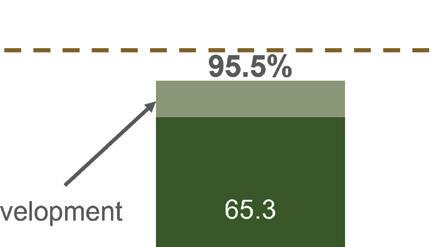


Energy Consumption (GWh), exclusing from DHC
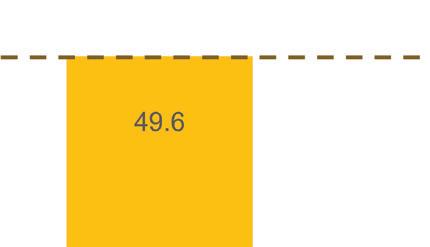

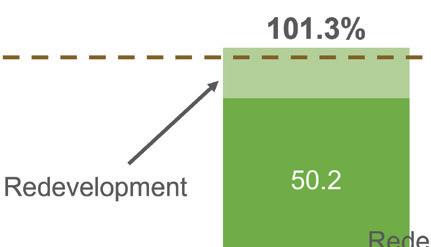

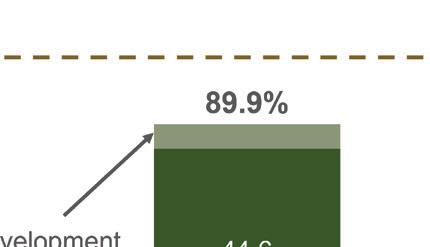


CO2 Emission (kt)




Mayuri Rajput
Mayuri is a fellow and lecturer at the Harvard Center for Green Buildings and Cities. Her research is focused on building performance evaluation in changing climate, grid interactive building and climate responsive architecture in cities. With an interdisciplinary background in architecture, energy and environment, her research aids urban policy decisions by means of building simulations ranging from the micro to meso-scale in the cities.
Buildings and Urban Intelligence Instructor
Mayuri Rajput
Report Design
Bianca Deng
Dean and Josep Lluís Sert Professor of Architecture
Sarah Whiting Chair of the Department of Architecture
Grace La
Copyright © 2023 President and Fellows of Harvard College. All rights reserved. No part of this book may be reproduced in any form without prior written permission from the Harvard University Graduate School of Design.
Text and images © 2023 by their authors.
The editors have attempted to acknowledge all sources of images used and apologize for any errors or omissions.
We would like to extend our heartfelt gratitude to our guest critic who contributed their valuable time and comprehensive feedback for our reviews. Additionally, we are grateful to the technology team at the GSD to help with classroom settings for lectures and final presentations.
Image Credits
Cover Page: Mayuri Rajput
Page 11-16: Ashutosh Lohana
Page 17-20: Bianca Deng
Page 21-22: Haoyun Yang
Page 23-24: Jialiang Xiang
Page 25-26: Mingjie Guo
Page 27-30: Tomoyuki Tasaki
Harvard University Graduate School of Design
48 Quincy Street Cambridge, MA 02138
gsd.harvard.edu
Course Report
Fall 2023
Harvard GSD Department of Architecture
Students
Ashutosh Lohana, Bianca Deng, Haoyun Yang, Jialiang
Xiang, Mingjie Guo, Tomoyuki Tasaki