Received 7 Sep. 2023, accepted 1 Dec. 2023, first online 7 Dec. 2023, published 17 Dec. 2024
Projected changes in incident solar radiation in Northern Hemisphere high-latitude areas
Seasonal variation in natural light is an essential characteristic of the climate in high latitude areas, and global warming is expected to lead to significant changes in solar radiation as well. Insolation will decrease substantially over high-latitude sea areas. On wide land areas, solar radiation is projected to increase in summer and autumn. The contrast between insolation in winter and summer will increase especially under the high emission scenario. These future changes may pose substantial challenges for adaptation in ecosystems and societies.
REIJA RUUHELA, KIMMO RUOSTEENOJA, KAISA LAKKALA
Finnish
Meteorological Institute
Solar radiation and the climate in high latitude areas. Seasonal variation in total incident solar radiation, and thus the availability of light, is a fundamental characteristic of the climate in high-latitude areas. Ecosystems and human beings have adapted to this seasonal cycle with long days in summer and polar nights in winter and are potentially vulnerable to changes induced by global warming. Up to date, rapid increases in temperature (Rantanen et al., 2022) and precipitation have received a lot of attention, but in addition, changes in solar radiation are essential for climate change adaptation studies. Here, we focus on describing those changes from a polar perspective of the Northern Hemisphere, north of the latitude 45°N. Changes in cloudiness, atmospheric water vapour content or aerosol load may lead to responses in incident solar radiation at the surface (Ruosteenoja et al., 2019). Surface properties such as snow or ice cover likewise impact insolation via reflections between the surface and cloud base. Previously, Ruosteenoja and Jylhä (2021) derived projections of multiple climate variables for Finland from CMIP6 global climate models. That study indicated that solar radiation is likely to decrease in winter months
and slightly increase in summer in Finland. These projected changes are consistent with the projected changes in precipitation patterns.
Polar perspective for the changes in solar radiation. In this study, we used simulations from 28 global climate models participating in Phase 6 of the Coupled Model Intercomparison Project (CMIP6). First, multi-model means of projected monthly mean changes in the incident solar radiation were calculated for the time period of 2070–2099. Secondly, the averages were divided by the mean value of the 28 models for the baseline period 1981–2010 to convert the changes into percentages. Three different greenhouse gas scenarios were explored. The high-emission SSP5–8.5 scenario is estimated to lead to a global warming of 4.4°C (uncertainty range 3.3–5.7°C), relative to pre-industrial conditions, by the end of the 21st century (IPCC, 2021, Table SPM.1). The corresponding global warming for the medium-level SSP2–4.5 scenario is 2.7°C (2.1–3.5°C) and for the very low-emission SSP1–2.6 scenario 1.8°C (1.3–2.4°C). It should be noted that the high-emission SSP5–8.5 scenario is in sharp contradiction with the goals of current climate policy, while SSP1–2.6 would require very drastic and urgent
reductions in greenhouse-gas emissions. Accordingly, the emphasis is here given to SSP2–4.5. More detailed technical information and the list of models utilized are given in Section 2 and Table 1 of Ruosteenoja and Jylhä (2021).
Decrease in solar radiation in the Arctic. Figures 1 and 2 show projected monthly-mean changes in the incident solar radiation from the period 1981–2010 to 2070–2099 for the entire high-latitude area and discrete positions. Large decreases in insolation are seen in those sea areas from where the ice cover retreats in the future, such as the Barents Sea, Hudson Bay and Okhotsk Sea in winter and spring, and the central Arctic Sea in summer and early autumn. On land areas, substantial decreases in insolation are projected for northern Eurasia and Canada, particularly in autumn. Conversely, on wide land areas both in Eurasia and North America, increases are projected for summer and early autumn. In particular, in central Europe, increases in solar radiation occur throughout the year. Figure 2 demonstrates how seasonal variation in solar radiation will change in selected high-latitude regions. Especially under the high-emission scenario, the contrast between winter and summer
FIG 1: Projected changes (in %) in 30-year monthly mean incident solar radiation in northern areas from the period 1981–2010 to 2070–2099 under the SSP2–4.5 scenario. The projection covers latitudes higher than 45°N. Polar-night areas in winter are shown as white.
FIG 2: Changes (in %) in monthly-mean incident solar radiation from 1981–2010 to 2070–2099 at six high-latitude positions: (a) Northern Finland, (b) Barents Sea, (c) Northern Siberia, (d) Northern Canada, (e) Hudson Bay and (f) Western Arctic Ocean. Multimodel-mean projections are shown for three greenhouse gas scenarios: SSP1–2.6, SSP2–4.5 and SSP5–8.5 (solid curves; see the legend in panel a). Dotted curves denote a 5 to 95 % uncertainty interval reflecting inter-model scatter for the SSP2–4.5 scenario. Note the different y-axis scale in the panels.
insolation will increase since the solar radiation decreases in winter and slightly increases in summer from the baseline values, apart from the very high-latitude area. However, at all the example points, there are substantial inter-model differences in the projected changes.
Potential factors behind the projected changes. There are several factors that can explain the above-described changes in the incident solar radiation. Since it was beyond the scope of this study to make data analyses for all the related climate variables, these are discussed here in a qualitative sense only. Owing to increasing temperatures, the water vapour content of the atmosphere
will increase everywhere, which acts to decrease incoming near-infrared solar radiation. The emissions of the precursors of aerosols are anticipated to decrease in the middle latitudes, most strongly under the SSP1–2.6 scenario (IPCC, 2021, Fig. SPM.4). Owing to long-range transport, this tends to reduce the aerosol load even over the Arctic Ocean, where local anthropogenic sources are negligible. However, the emission of natural aerosols, such as sea spray, may also change due to decreasing sea ice. Cloudiness is projected to increase in the Arctic area but decrease in the middle latitudes, especially in central Europe (IPCC, 2013, Fig. 12.17). This is in agreement with the central European summers
becoming dryer in the future, with decreasing precipitation and relative air humidity (Ruosteenoja and Jylhä, 2021, Figs. 11 and S7). In the high latitudes in particular, retreating ice and snow cover act to reduce the surface albedo and consequently the backscatter of shortwave radiation between the surface and cloud base. Evidently, this is an important factor explaining the seasonal course of the radiation response, e.g., the largest reductions taking place in winter in Hudson Bay but in late summer in the central Arctic Ocean (Figs. 1–2).
In this study we focused on the projected changes in incident solar radiation. However, for global climate change the total radiation bal-
ance, thus, also changes in outgoing longwave radiation are essential. In addition to greenhouse gas concentrations, local longwave radiation balance is affected by cloudiness and water vapour content.
Challenges for climate change adaptation. Disappearance of snow and ice cover reduces the surface shortwave albedo considerably. Therefore, even though incident solar radiation in the Arctic Ocean is projected to decrease, it is evident that heat absorbed in the ocean during the prolonged ice-free season increases. The extra heat stored in the water mass acts to delay the autumnal freeze-up and thus substantially increases temperatures in autumn and winter (Stroeve et al, 2014).
Projected changes in solar radiation in high latitudes may have impacts on many sectors of society, and the findings of this study can be used, e.g., in assessing future climate change induced risks. We did not study changes in the spectrum of solar radiation, but changes in the short-wavelength part, ultraviolet (UV) radiation, reaching the surface may have a significant effect on living organisms, as the UV radiation is well-known for its biological effectiveness in both aquatic and terrestrial ecosystems (EEAP, 2023). Ultraviolet radiation is highly correlated with changes in total incident so-
lar radiation, especially if changes are due to cloudiness, aerosols or surface reflection. In addition, changes in the short-wavelength portion of UV radiation depends on changes in atmospheric ozone.
Changes in solar radiation have direct impacts on human health. Decreasing solar radiation together with shortening snow and ice cover period in winter may lead to more severe symptoms related to seasonal affective disorders (Burenby et al., 2021). In areas of increasing solar radiation where no significant ozone increase is projected, the risks related to excessive UV exposure may increase, in particular, if people spend more time outdoors than nowadays. Changes in radiation also contribute to the thermal sensation that people experience. The climate change induced temperature increase might change dressing habits towards less protective clothes, e.g., longer time periods spent in shorts and T–shirts. The risk of getting skin cancer can then increase. Eye diseases like cataract may also become more common in prolonged UV exposure without adequate UV protection (Lucas et al., 2019).
Arctic ecosystems are very sensitive to changes in climate variables and their compound effects. For instance, rapidly increasing temperatures and decreasing snow and ice
cover may lead to unprecedented exposure of aquatic ecosystems to solar radiation incl. UV-radiation, also in seasons that in past climates used to be well protected from radiation under the sea ice. That may affect, for example, small aquatic organisms that lack a shell structure as well as fish eggs which are especially vulnerable to UV radiation. UV radiation also acts as a driver for chemical reactions in the atmosphere which affect air quality, e.g., altering the production and decomposition of O3 at ground level
We conclude that future changes in incident solar radiation in high latitude areas are substantial and should be taken into account more comprehensively in climate change impact studies and in the adaptation plans in these regions. In addition, UV radiation is known to degrade materials, which can be observed as fading, yellowing, and embrittlement (UNEP, 2023).
We conclude that future changes in incident solar radiation in high latitude areas are substantial and should be taken into account more comprehensively in climate change impact studies and in the adaptation plans in these regions.
Acknowledgements: We thank the Research Council of Finland for funding this work via the CHAMPS project (project no 329225).
Burenby, L., and Coauthors, 2021: Climate change and mental health. Finnish Institute for Health and Welfare (THL). Discussion paper 32/2021. Helsinki, Finland 2021. ISBN 978-952-343-765-4.
EEAP (Environmental Effects Assessment Panel), 2023: Environmental Effects of Stratospheric Ozone Depletion, UV Radiation, and Interactions with Climate Change, 2022 Assessment Report. Nairobi: Environmental Effects Assessment Panel, United Nations Environment Programme. https://ozone.unep.org/system/files/documents/EEAP-2022-Assessment-Report-May2023.pdf.
IPCC, 2013. Climate Change 2013: The physical science basis. Contribution of Working Group I to the Fifth Assessment Report of the Intergovernmental Panel on Climate Change. Cambridge University Press, Cambridge, U.K., 1535 pp. [Stocker, T.F., and Coauthors (eds.)].
IPCC, 2021. Climate Change 2021: The Physical Science Basis. Contribution of Working Group I to the Sixth Assessment Report of the Intergovernmental Panel on Climate Change. [Masson-Delmotte, V., and Coauthors (eds.)] Cambridge University Press.
Lucas R. M., and Coauthors, 2019: Human health in relation to exposure to solar ultraviolet radiation under changing stratospheric ozone and climate. Photochem Photobiol Sci., 18(3), 641–680, https://doi.org/10.1039/c8pp90060d
Rantanen, M., and Coauthors, 2022: The Arctic has warmed nearly four times faster than the globe since 1979. Commun Earth Environ 3, 168, https://doi.org/10.1038/s43247-022-00498-3
Ruosteenoja, K., and Coauthors, 2019: Future Changes in Incident Surface Solar Radiation and Contributing Factors in India in CMIP5 Climate Model Simulations. J. Appl. Meteor. Climatol., 58, 19–35, https://doi.org/10.1175/JAMC-D-18-0013.1.
Ruosteenoja, K., and K. Jylhä, 2021: Projected climate change in Finland during the 21st century calculated from CMIP6 model simulations. Geophysica, 56(1), 39–69, https://www.geophysica.fi/pdf/geophysica_2021_56_1_039_ruosteenoja.pdf
Stroeve, J. C., and Coauthors, 2014: Changes in Arctic melt season and implications for sea ice loss. Geophys. Res. Lett., 41(4), 1216–1225, https://doi.org/10.1002/2013GL058951
UNEP (United Nations Environment Programme), 2023: Questions and Answers about the Effects of Ozone Depletion, UV Radiation, and Climate on Humans and the Environment. Supplement of the 2022 Assessment Report of the UNEP Environmental Effects Assessment Panel, 25 pp.; UNEP: Nairobi, 2023. https://ozone.unep.org/system/files/documents/EEAP-2022-Assessment-Report-QA.pdf.
Received 21 Dec. 2022, accepted 22 Feb. 2024, first online 21 Mar. 2024, published 17 Dec. 2024
Are natural hazard-induced costs of power line failures inevitable?
Traditionally in Finland windstorms and snow loads have been the principal causes of failures in electricity distribution networks. Based on the detailed fault analysis of a power distribution we find that winter conditions do not seem to cause more cost than adverse weather in summer. Fault duration seems to be the critical factor in winter, whereas the number of faults per event is the prime factor in summer.
SEBASTIAAN VAN KOOTEN#, ILONA LÁNG-RITTER, ADRIAAN PERRELS
Finnish Meteorological Institute #) Left FMI after the writing of the first version of the manuscript - currently working at Sappi Europe
Resiliency challenges in an electricity network. A significant part of the Finnish medium-voltage and low-voltage electricity distribution network outside built-up areas consists of overhead lines, which are prone to failures due to various hazardous weather conditions, such as windstorms, heavy snow loads, and lightning. In most cases, the eventual fault is caused by falling trees (or large branches) (Campbell, 2012). In the background can play complex interactions, which can either moderate or aggravate the fault risk level (see next section). Climate change has been regarded as having the potential of increasing the number of failures in the power network, e.g. owing to retreat in ground frost and occasionally larger snow loads (Haakana et al. 2023, Perrels et al. 2022).
In the Nordic collaborative study on climate changed induced risks of natural hazards for linear infrastructure (NordicLink) FMI focuses on a study of the underlying factors of faults in power lines owing to adverse weather conditions, and also assesses the sensitivity of costs to hazard characteristics and to response approaches. FMI cooperates with the electricity network company Järvi-Suomen Energia (JSE; a subsidiary of Suur-Savon
Sähkö). We show a few main characteristics of the occurrence of power line failures, and subsequently discuss underlying factors for costs of power line disruptions.
Occurrence of failures. FMI obtained detailed powerline fault data, fault cost data, and network location data for the years 2015–2022 from JSE. These data were combined with weather observation data for the same area (South Savo), as well as with land-use and vegetation data from the same area. Figure 1 represents the distribution of power grid failures
over the months in the JSE network. The failures are divided by their cause, of which wind- (56 %) and snow-related causes (34 %) dominate the statistics. Lightning caused around 6 % and other weather events 4 % of all failures. The large number of failures in January relates to snow loads, often combined with strong winds. In the period 2015–2022 there were several significant snow load events in January. The peak in June is mainly caused by windstorms. Presumably, the absence of frozen soil and achievement of full foliage in June contributes to
FIG 1: The number of power grid failures by month in the JSE network (2015–2022). The colors represent the cause of the power grid failure classified by the repairing engineers of JSE.
the more dominant position of strong wind as a hazard factor. Effects of snow loads may culminate with delay into (partial) tree collapse, sometimes assisted by strong winds, hence cause attribution to snow load during the summer months (Fig. 1) is not an error. The monthly pattern of faults for the period 2015–2022 for the JSE service area differs from the national pattern (Haakana et al. 2023) with the latter having highest scores in the period November – January and elevated levels in period June – August. It is not directly clear what are the causes for the differences. The fairly short period (2015–2022) may also mean that it just happens to differ more over these particular years, but may not so much for a longer period.
In addition to the prime causes of strong winds and snow loads various other factors can significantly affect fault occurrence in overhead lines, such as the extent of frost in the ground (December – March), average tree height in the vicinity of the power lines, and cumulated damage prior to an extreme weather event. The implication is that a time series of weather-related power line fault characteristics in terms of fault duration and number of affected customers seem quite erratic. So, having some understanding of drivers of merely fault occurrence as such, may not be sufficient to understand the resulting cost patterns. An additional factor is the strategy of JSE and other Finnish power distribution companies to change a part of the overhead cables into underground cables. So far the growth in underground cabling by JSE since 2015 does not seem to show in the annual fault data (Fig. 2).
Cost patterns of failures. Figure 3 summarizes the annual cost owing to weather-related faults incurred by JSE from 2007 to 2021. For interruptions lasting longer than 12 hours clients are entitled to compensation, with the level of compensation depending on the duration class (12–24h; 24–72h; 72–120h; 120h or more) and annual
electricity consumption. In addition, an electricity company incurs cost of repair. By increasing the repair effort compensation cost can be reduced to some extent, if this leads to shorter disconnect times. The challenge is to plan this carefully, inter alia by using detailed short term weather forecasts and nowcasting. When comparing figures 2 and 3 it gets obvious that the correlation between annual number of faults and the costs of repair and compensation is not very strong.
Not only the total costs vary significantly from year to year, but also the share of compensation cost in the total cost varies considerably over time.
Next to cost of the electricity distribution company also the customers incur cost, which are partly neutralized by the compensation received from the distribution company. In contrast to the distribution company customers incur also non-monetary cost (i.e. welfare cost). The customers’ welfare costs of non-delivered electricity are notable (e.g. Nurmi et al. 2019), but are not directly comparable to the monetary cost presented here. The NordicLink project does distinguish between these cost notions, but its discussion goes beyond the scope of this article.
The assessment of the disruption
FIG 2: Annual volume of weather induced faults by cause 2015–2022 (source: JSE fault statistics; legend as in figure 1).
FIG 3: Annual cost of power line disruptions for regional electricity company (JSE) Source: company’s fault database.
risks in the NordicLink project follows a two-tier approach. First, we analyse the relation between the number and duration of faults by means of meteorological, environmental, and land use data. Subsequently, we analyse the relation between the duration and number of faults per event and the resulting costs, distinguished by repair costs and compensations to customers. In this respect it is important to understand how the sum of the durations of faults (disconnections) by weather event develops in relation to the number of faults per weather event, while distinguishing by cause (strong wind or snow load) and by season (winter or summer). Figure 4 presents the relationship between these variables (both in logarithmic form; for windstorms). Over the period 2015–2022 the total fault duration per windstorm seems to be almost equally sensitive to the number of faults in winter and summer. The graph for snow loads (not shown) is quite similar. Interestingly, the largest spread in durations is found for medium to smaller events (1.5 corresponds to 32 faults in one event). During holiday periods staff availability may be limited and hence durations may sometimes turn out to be higher than expected. The graph also suggests that for very se-
FIG 4: Scatterplot of number of faults per case (logN) by duration sum per case (logDS) for summer (orange) and winter (blue) for wind storms 2015–2022; censored for less than 5 faults per event (log(5)≈0.7); summer = May – October, winter = November – April; source: company’s fault database and own analysis.
rious events (> 100 faults) the pace of growth of duration may increase, Yet, the number of observations is too low to confirm that.
The analyses are not yet completed, but the findings so far indicate that it is hard to reduce the costs of weather induced faults substantially, unless one is prepared to invest massively in prevention. It remains to be seen whether that would pay off at macro-economic level, though
it might be justifiable on the base of welfare cost. Nonetheless, moderate improvements in operational preparedness and repair planning could produce some savings.
Acknowledgements. The article is based on the NordicLink project funded by Nordforsk under grant agreement 98335. The authors thank the anonymous reviewers for their helpful comments on the draft version.
Campbell, R. J., 2012: Weather-Related Power Outages and Electric System Resiliency. Congressional Research Service (CRS), Publication Date: August 1, 2012, Last accessed 8 September 2022, url: https://sgp.fas.org/crs/misc/R42696.pdf Haakana, J., Haapaniemi, J., and Lassila, J., 2023: Energy storage as part of electricity distribution asset management. 2023 19th International Conference on the European Energy Market (EEM), Lappeenranta, Finland, 2023, pp. 1-6, http://dx.doi.org/10.1109/EEM58374.2023.10161901 Nurmi, V., K. Pilli-Sihvola, H. Gregow, A. Perrels, 2019: Over-adaptation to Climate Change? The case of the 2013 Finnish Electricity Market Act, Economics of Disasters and Climate Change, 3(2), 161–190, https://doi.org/10.1007/s41885-018-0038-1 Perrels, A. et al., 2022: Kustannusarviointi ilmastonmuutokseen liittyvästä toimimattomuudesta (KUITTI), Valtioneuvoston selvitys- ja tutkimustoiminnan julkaisusarja 2022:37, 159 pp, https://julkaisut.valtioneuvosto.fi/bitstream/handle/10024/164032/VNTEAS_2022_37.pdf?sequence=1&isAllowed=y
Received 20 Oct. 2023, accepted 29 Mar. 2024, first online 26 Apr. 2024, published 17 Dec. 2024
Evaluating multi-year prediction proficiency for decision support in Finland’s energy industry
The energy crisis, sparked by Russia’s Ukraine invasion, disrupts European energy supply, impacting prices. Finland’s reliance on Russian energy requires annual to multi-annual strategic planning. This research investigates meteorological forecast accuracy for the energy sector, revealing strong temperature prediction skills but limited skill in precipitation. These findings emphasize the importance of improving and enhancing decadal climate forecasts for developing potential climate services for Finland’s energy sector.
SURAJ D. POLADE AND HILPPA GREGOW
Finnish Meteorological Institute
Background. The world is grappling with an unprecedented global energy crisis stemming from Russia’s invasion of Ukraine. This incursion has led to widespread energy distribution disruptions and a swift price surge throughout Finland and Europe. The abruptness and magnitude of this crisis have caught both energy providers and the general public off guard, leaving them uncertain about the future consequences. The spectre of energy shortages looms large, necessitating strategic planning to avert potentially catastrophic outcomes over a multi-year span. In light of these pressing concerns, Finland’s energy sector urgently needs reliable multi-year (decadal) forecasts for meteorological factors that impact energy consumption and renewable energy generation. This is of utmost importance, especially considering that approximately 10-20% of Finland’s energy is imported (information in 2022), and traditionally, one-third of its energy imports originate from Russia. While significant advancements have occurred in decadal prediction over the last decade, obtaining reliable information for crafting climate services tailored to sector-specific applications remains challenging. This challenge arises from the varying skill
of decadal predictions across regions and timescales. This study aims to assess the skill of decadal predictions and demonstrate a potential climate service product tailored for Finland’s energy sector.
Despite considerable efforts to assess global decadal predictions, challenges arise when applying them to regional contexts. Towler et al. (2018) and Solaraju-Murali et al. (2019) exemplify this in their respective studies, utilizing decadal forecasts for water and agricultural climate services. Operational decadal climate forecasts bridge short-term predictions and long-term projections, offering policy-relevant insights. The WMO Global Annual to Decadal Climate Update (GADCU) is pivotal for real-time climate predictions over the next five years (Vera et al. 2010). Evaluating the skill and reliability of climate information is crucial for providing reliable climate services. Decadal forecasts, with hindcast (retrospective) accessibility, present an advantage for assessing forecasting accuracy compared to traditional climate predictions. For this evaluation, we utilized six ensemble prediction systems, incorporating predictions from 72 ensemble members for the next five years from GADCU, along with their corresponding
hindcast experiments as contributors to Phase 6 of the Coupled Model Intercomparison Project (CMIP6) within the Decadal Climate Prediction Project (DCPP, Table 1, supplementary material).
The decadal predictions provide forecasts for the next 5-10 years, initiated each year. In this analysis, we evaluate the forecast skill for 1-5 years ahead, assessing deterministic and probabilistic forecasts for key meteorological variables (temperature and precipitation) in the extended cold season (November - March) and summer (May-August) against the E-OBS observation dataset. The deterministic forecast is produced by averaging ensemble means from each forecast system. In contrast, the probabilistic forecast is formed by averaging probability density functions of all forecast models for each tercile, with equal weights assigned. We use three important metrics: the anomaly correlation coefficient (ACC), root-meansquare error skill score (RMSSS), and ranked probability skill score (RPSS) (supplementary material). In order for the near-term decadal predictions to be of value, we calibrated the decadal forecast using the variance inflation method. Our analysis focuses on these variables because of their substantial
influence on both renewable energy generation and consumption. Further details regarding the methodology are outlined in the online supplementary material
Forecast quality assessment. Unadjusted temperature predictions for the extended cold season exhibit positive ACC values across all of Finland, with higher skill in Lapland, eastern, and southern regions (Fig. 1a). RMSSS and RPSS (Fig. 1b, 1c) follow the same trend, covering the entire country. RPSS generally outperforms RMSSS. It implies that the uncalibrated probability forecast is more skillful than the deterministic forecast. These positive scores across all three metrics show that the decadal forecast outperforms climatology for both deterministic and probabilistic temperature predictions in the extended cold season. After calibration (Fig. 1e), RMSSS improves, especially in regions with lower unadjusted skills, but ACC and RPSS remain similar. For summer temperature predictions, despite positive ACC values, skill is lower than in winter, with better performance in Lapland, eastern, and western Finland (Fig. 1g). RMSSS and RPSS (Fig. 1h, 1i) show less skill than climatology, with negative scores in central Finland. Calibration notably enhances RMSSS (Fig. 1k) and moderately improves RPSS (Fig. 1l), while ACC remains largely unchanged.
Precipitation predictions for the extended winter season have lower skill than temperature predictions, with higher skill in central Finland and no skill in Lapland and parts of southern Finland. RMSSS and RPSS (Fig. 2a, 2b) reflect this pattern. Calibration significantly improves RMSSS and RPSS in regions with low skill, while ACC remains unchanged. During the summer season, deterministic precipitation predictions have low skill, with some improvement in probabilistic forecasts after calibration, though a significant portion of central Finland still shows lower skill compared to climatology.
FIG 1: An assessment of temperature prediction accuracy using the ACC, RMSSS and RPSS metrics. Panels a-f are for the extended winter and g-l for summer. Uncalibrated forecasts are evaluated in a-c and g-i, and calibrated forecasts in d-f and j-l.
Application of decadal prediction. Figure S1 (online supplementary material) showcases an illustrative climate service product tailored for the energy sector. This product is centred around tercile forecasts spanning from 1971 to 2027, encompassing
both hindcast data and predictions from GADCU. Our forecasts for 2023 and the forthcoming 1-5 year period, which apply to both seasons, suggest a greater probability of being in the upper tercile. Additionally, deterministic predictions also exhibit values
higher than those of the reference period. For further details, please refer to the online supplementary material.
Summary. The predictions perform well in forecasting temperatures, especially during the extended winter season. However, their ability to predict precipitation, particularly in summer, is limited. Calibrated forecasts enhance skill for both variables and seasons, but improving the accuracy of summer precipitation remains a challenge. In summary, this paper represents an initial exploration of predicting meteorological variables that impact the energy sector over 1-5 years. The insights from this study offer valuable guidance for the energy sector on a multi-annual scale. A logical next step is to explore the possibility of improving summer precipitation predictions by incorporating large-scale modes of variability as statistical predictors. Furthermore, including decadal wind predictions is valuable, as approximately 14% of the total energy generated in Finland comes from wind power (information in 2022).
Acknowledgements. We express our gratitude to the WMO Lead Centre for Annual-to-Decadal Climate Prediction for generously supplying the decadal prediction data. We appreciate all the modelling groups’ contributions to the simulations accessible via the Earth System Grid Federation system (ESGF). Furthermore, we acknowledge ECMWF for their provision of the ERA5 reanalysis data, accessible through the Copernicus Climate Change Service’s Climate Data Store. This research received support from the ACCC flagship project (grant no. 337552).
Open the supplement
Vera, C., and Coauthors, 2010: Needs assessment for climate information on decadal timescales and longer. Proc. Environ. Sci., 1, 275–286, https:// doi.org/10.1016/j.proenv.2010.09.017
Towler, E., PaiMazumder, D. and Done J., 2018: Toward the application of decadal climate predictions. J. Appl. Meteor. Climatol., 57, 555–568, https://doi.org/10.1175/JAMC-D-17-0113.1 Solaraju-Murali, B., Caron, L. P. Gonzalez-Reviriego, N. and Doblas-Reyes, F. J., 2019: Multi-year prediction of European summer drought conditions for the agricultural sector. Environ. Res. Lett., 14, 124014, https://doi.org/10.1088/1748-9326/ab5043
FIG 2: Evaluation of Precipitation Prediction Accuracy (Similar to Fig. 1).
Received 25 Dec. 2023, accepted 19 Aug. 2024, first online 17 Oct. 2024, published 17 Dec. 2024
Future scenarios for heating and cooling degree days in Finland
The ongoing climate change will lead to decreases in heating energy demand during the cold season but, on the other hand, to an increasing demand for cooling energy in summer. Projected changes vary depending on the climate change scenario but also regionally in Finland.
PENTTI PIRINEN, REIJA RUUHELA, PAULI JOKINEN, KIRSTI JYLHÄ
Finnish Meteorological Institute
Introduction. In Finland, the annual mean temperature is projected to increase nearly 6 °C in the high-emission scenario (SSP5-8.5) and nearly 4 °C in the moderate emission scenario (SS2-4.5) by the end of the century based on 28 CMIP6 global climate models (Ruosteenoja and Jylhä, 2021). The temperature will increase more in winter months than in summer. Geographically the temperature will increase in northern Finland more than in southern Finland in winter. Because of the warming, both heating and cooling energy demand will be impacted. A previous spatial assessment on impacts of climate change on heating degree days (HDD) and cooling degree days (CDD) in Finland was conducted based on CMIP3 model runs (Pirinen et al. 2014). Here we update the assessment based on CMIP6 climate change scenarios.
Methods. In this study we used daily mean temperature (Tday) data from five CMIP6 models that constitute a representative sub-set of the 28 models used in Ruosteenoja and Jylhä (2021). The models produce virtually the same multi-model mean values for annual and seasonal mean temperature change as the whole ensemble of 28 models. Inter-model scatter in projected long-term mean
warming agrees as well (Ruosteenoja, 2022, personal communication). Moreover, there is a good inter-ensemble accordance in the simulated changes of the temporal fluctuations of the daily mean temperatures both in winter and summer. The selected models are as follows: MPI-ESM1-2-HR (parallel run #1), CMCC-CM2-SR5 (#1), GFDL-ESM4 (#1), CNRM-CM6-1 (#3) and CanESM5 (#4). The SSP2-4.5 and SSP5-8.5 greenhouse gas scenarios were employed to represent moderate and large projected changes in climate. Tday data of the selected models were first bias-adjusted using the E-OBS gridded dataset (Haylock et al. 2008), as documented by Ruosteenoja and Jylhä (2023). This data in a grid of 0.25 degrees was further bilinearly regridded onto a 10km*10km grid for a geographical area of Finland (R Raster-package).
For each grid point, heating degree days (HDD) and cooling degree days (CDD) were calculated from the daily mean temperature data using 17 °C as a base temperature (effective indoor temperature) for HDD and 18 °C for CDD.
(1) HDD = 17 – Tday, if Tday < Tthres, where Tthres is a threshold value defining need for heating. In autumn the heating period in Finland is tradi-
tionally considered to begin when daily mean temperature decreases below 12 °C. In spring the threshold for end of the heating period is 10 °C (Vajda et al, 2004; Jylhä et al, 2015).
(2) CDD = Tday – 18, if Tday > Tthres, where Tthres = 18 °C is a threshold value defining need for cooling. CDD was calculated for the warm season from May to September.
Annual values were summed up from the daily HDD and CDD values, and the values for the various 30-year periods were averages of these annual values. The HDD and CDD for present climate normal period (1991-2020) are calculated from FMI gridded data (Aalto et al. 2016) that is derived from the observations at FMI weather stations.
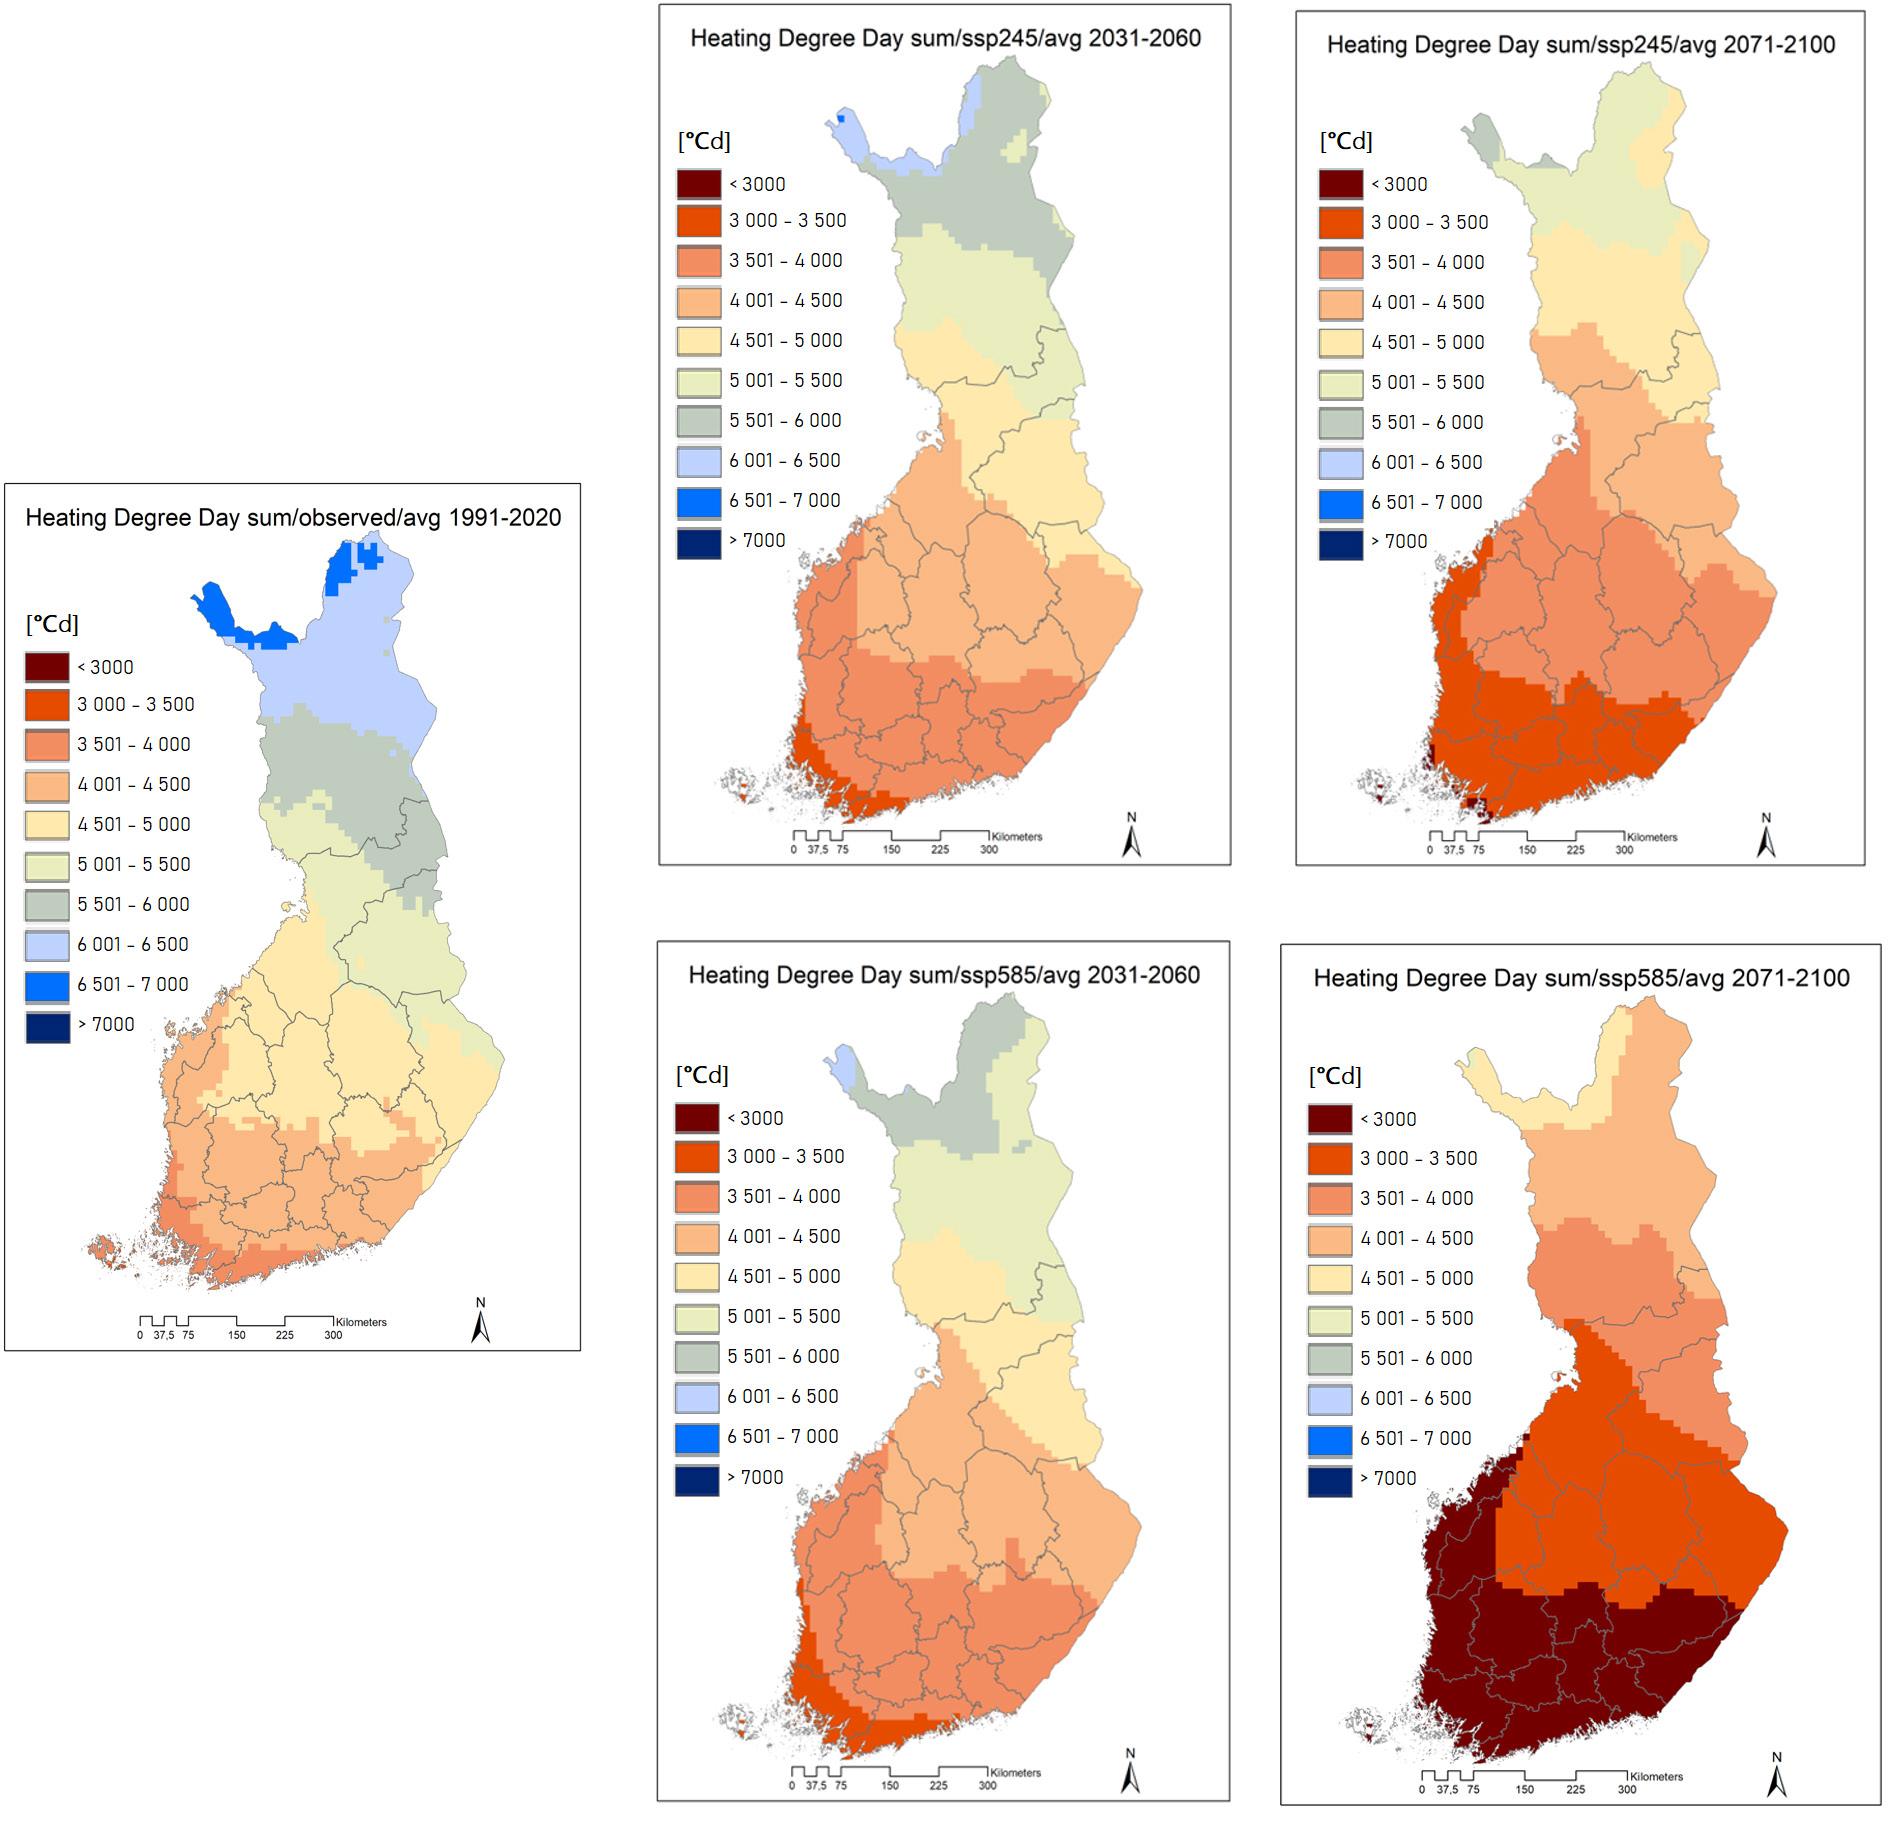
Results. The temporal evolvement of HDD in the two scenarios are presented in Figure 1. In the current climate the HDD varies from less than 4000 °Cd in southwestern Finland to about 6500 °Cd in northern Lapland. By the middle of the century, the heating demand will decrease in both scenarios by about the same amount, about 500 °Cd, and the HDD will vary from 3500 °Cd in southwestern Finland to 6000 °Cd in northern Lapland. The two scenarios differ substantially towards the end of the century. In
FIG 1: Projections for Heating Degree Days (HDD) in three 30-year-long climate normal periods from current (19912020, left) to mid-century (2031-2060) and to the end of the century (2071-2100) in two climate scenarios: SSP2-4.5 (upper row) and SSP5-8.5 (lower row).
the moderate emission scenario, the HDD will decrease less than in the high emission scenario and will vary from 3000 °Cd in the southwestern to 5500 °Cd in the northwestern part of the country in the end of the century. In the high emission scenario, the HDD will be less than 3000 °Cd in southern Finland and about 5000 °Cd in Northern Lapland.
Similarly, the temporal evolvement of CDD in the two scenarios is presented in Figure 2. In Finland, the cooling
energy demand in general is much smaller than the heating demand. In the current climate the CDD during the summer is less than 100 °Cd in the whole country. Gradually the cooling demand is expected to increase and by the middle of the century it is projected to vary on average between 25 °Cd in northern Finland and 175 °Cd in southern Finland. By the end of the century in the high emission scenario CDD will be nearly 400 °Cd in southern Finland but still less than 200 °Cd
on average in the moderate emission scenario. Worth noting that this analysis does not properly capture the urban heat island effect and therefore the impact of urban heat island on heating or cooling demand.
Conclusions. Our results show substantial changes in HDD and CDD in Finland during this century both in moderate and high emission scenarios, indicating a decreasing energy demand during cold months and increasing energy demand in summer.
FIG 2: Projections for Cooling Degree Days (CDD) in three 30-year-long climate normal periods from current (19912020, left) to mid-century (2031-2060) and to the end of the century (2071-2100) in two climate scenarios: SSP2-4.5 (upper row) and SSP5-8.5 (lower row).
However, cooling energy demand will remain small compared to heating energy demand even at the end of the century. These outcomes should be considered in climate change mitigation and adaptation measures to support sustainable urban planning and building.
Data. HDD and CDD data are available by request from the FMI climate service, ilmastopalvelu@fmi.fi or climateservice@fmi.fi.
Acknowledgements. The study contributes to the FINSCAPES (No. 342561) and LEGITIMACY (No. 335562) projects
funded by the Research Council of Finland, and the Smartland (327803) project funded by the Strategic Council of Finland. We also want to thank Dr Kimmo Ruosteenoja for his assistance in selecting the climate change model runs for this study.
Aalto, J., and Coauthors, 2016: New gridded daily climatology of Finland: Permutation-based uncertainty estimates and temporal trends in climate. J. Geophys. Res. Atmos., 121, 3807–3823, https://doi.org/10.1002/2015JD024651.
Haylock, M. R., and Coauthors, 2008: A European daily high-resolution gridded data set of surface temperature and precipitation for 1950–2006. Journal of Geophysical Research, 113, D20119, https://doi.org/10.1029/2008JD010201
Pirinen, P., and Coauthors, 2014: Ilmastonmuutos ja lämmitystarveluku paikkatietoarvioina Suomessa. Ilmatieteen laitos, Raportteja 2014:3. [Climate change and heating degree days in Finland – spatial assessment] http://hdl.handle.net/10138/135722
Jylhä, K., and Coauthors, 2015: Hourly test reference weather data in the changing climate of Finland for building energy simulations, Data in Brief, 4, 162-169, https://doi.org/10.1016/j.dib.2015.04.026
Ruosteenoja, K., and K. Jylhä, 2021: Projected climate change in Finland during the 21st century calculated from CMIP6 model simulations. Geophysica 56, 39–69,