Classification Project - Hotel Booking Cancellation Prediction
Welcome to the project on classification. We will use the INN Hotels dataset for this project.
Context
This is an academic practice project to utilize decision trees and random forests to (1) determine the potential for hotel cancelations, as well as (2) determine and weigh the significant atributes for cancelations. This latter of the two objectives is quite possibily more imporotant for strategy development in booking practices. Although building a model that provides probabilty of cancelation is important, actual business decisions and improvements come from understanding the factors involved in customer activities. It is important to point out that these factors are - in fact - corollary and causal in nature.
A significant number of hotel bookings are called off due to cancellations or no-shows.
The typical reasons for cancellations include changes of plans, scheduling conflicts, etc. This is often made easier by the option to do so free of charge or preferably at a low cost which is beneficial to hotel guests but it is a less desirable and possibly revenuediminishing factor for hotels to deal with. Such losses are particularly high on last-minute cancellations.
The new technologies involving online booking channels have dramatically changed customers' booking possibilities and behavior. This adds a further dimension to the challenge of how hotels handle cancellations, which are no longer limited to traditional booking and guest characteristics.
The cancellation of bookings potentially impacts a hotel on various fronts:
1 Loss of resources (revenue) when the hotel cannot resell the room.
2. Additional costs of distribution channels by increasing commissions or paying for publicity to help sell these rooms.
3. Lowering prices at last minute, so the hotel can resell a room, resulting in reducing the profit margin.
4 Human resources to make arrangements for the guests.
10/18/22, 5: 58 PMLearner_Notebook_Practical_Data_Science_Practise_Project Page 1 of 40file:///Users/jeffreydavis/Desktop/Applied%20Data%20Science/Practic…Projects/Practical%20Data%20Science/Hotel_cancel_RandomForest.html
Objective
The increasing number of cancellations calls for a Machine Learning based solution that can help in predicting which booking is likely to be canceled. INN Hotels Group has a chain of hotels in Portugal, they are facing problems with the high number of booking cancellations and have reached out to your firm for data-driven solutions. You, as a data scientist, have to analyze the data provided to find which factors have a high influence on booking cancellations, build a predictive model that can predict which booking is going to be canceled in advance, and help in formulating profitable policies for cancellations and refunds.
Data Description
The data contains the different attributes of customers' booking details. The detailed data dictionary is given below.
Data Dictionary
Booking_ID: The unique identifier of each booking no_of_adults: The number of adults no_of_children: The number of children no_of_weekend_nights: The number of weekend nights (Saturday and Sunday) the guest stayed or booked to stay at the hotel no_of_week_nights: The number of weeknights (Monday to Friday) the guest stayed or booked to stay at the hotel type_of_meal_plan: The type of meal plan booked by the customer: Not Selected – No meal plan selected
Meal Plan 1 – Breakfast
Meal Plan 2 – Half board (breakfast and one other meal) Meal Plan 3 – Full board (breakfast, lunch, and dinner) required_car_parking_space: Does the customer require a car parking space? (0No, 1- Yes)
10/18/22, 5: 58 PMLearner_Notebook_Practical_Data_Science_Practise_Project Page 2 of 40file:///Users/jeffreydavis/Desktop/Applied%20Data%20Science/Practic…Projects/Practical%20Data%20Science/Hotel_cancel_RandomForest.html
room_type_reserved: The type of room reserved by the customer. The values are ciphered (encoded) by INN Hotels.
lead_time: The number of days between the date of booking and the arrival date arrival_year: The year of arrival date
arrival_month: The month of arrival date
arrival_date: The date of the month market_segment_type: Market segment designation.
repeated_guest: Is the customer a repeated guest? (0 - No, 1- Yes)
no_of_previous_cancellations: The number of previous bookings that were canceled by the customer before the current booking
no_of_previous_bookings_not_canceled: The number of previous bookings not canceled by the customer before the current booking
avg_price_per_room: The average price per day for the reservation; prices of the rooms are dynamic. (in euros)
no_of_special_requests: The total number of special requests made by the customer (e.g. high floor, view from the room, etc.) booking_status: Flag indicating if the booking was canceled or not. The class 0 represents the Not_Canceled whereas class 1 represents the Canceled label.
10/18/22, 5: 58 PMLearner_Notebook_Practical_Data_Science_Practise_Project Page 3 of 40file:///Users/jeffreydavis/Desktop/Applied%20Data%20Science/Practi…Projects/Practical%20Data%20Science/Hotel_cancel_RandomForest.html
Importing the necessary libraries and overview of the dataset
In [1]: # Removing warnings to keep code clean: import warnings warnings.filterwarnings("ignore")
# Libraries for data manipulation and visualization import pandas as pd
import numpy as np import matplotlib.pyplot as plt
import seaborn as sns from sklearn.model_selection import train_test_split
# Algorithms to use from sklearn.tree import DecisionTreeClassifier from sklearn import tree from sklearn.ensemble import RandomForestClassifier
# Metrics to evaluate the model from sklearn.metrics import confusion_matrix, classification_report,f1_score from sklearn import metrics
# For hyperparameter tuning from sklearn.model_selection import GridSearchCV
Loading the data
In [2]: hotel = pd.read_csv("INNHotelsGroup.csv")
In [3]: # Copying data to another variable to avoid any changes to original data data = hotel.copy()
View the first and the last 5 rows of the dataset
In [4]: # View head of the data data.head()
10/18/22, 5: 58 PMLearner_Notebook_Practical_Data_Science_Practise_Project Page 4 of 40file:///Users/jeffreydavis/Desktop/Applied%20Data%20Science/Practi…Projects/Practical%20Data%20Science/Hotel_cancel_RandomForest.html
Booking_ID no_of_adults
[5]: #
tail of the data data
tail()
Booking_ID no_of_adults no_of_children
Checking the info of the data
10/18/22, 5: 58 PMLearner_Notebook_Practical_Data_Science_Practise_Project Page 5 of 40file:///Users/jeffreydavis/Desktop/Applied%20Data%20Science/Practi…Projects/Practical%20Data%20Science/Hotel_cancel_RandomForest.html
no_of_children no_of_weekend_nights no_of_week_nights type_of_meal_plan 0 INN00001 2 0 1 2 1 INN00002 2 0 2 3 2 INN00003 1 0 2 1 3 INN00004 2 0 0 2 4 INN00005 2 0 1 1
no_of_weekend_nights no_of_week_nights 36270 INN36271 3 0 2 6 36271 INN36272 2 0 1 3 36272 INN36273 2 0 2 6 36273 INN36274 2 0 0 3 36274 INN36275 2 0 1 2 Out[4]: In
View
.
Out[5]: In [6]: data.info()
<class 'pandas.core.frame.DataFrame'>
RangeIndex: 36275 entries, 0 to 36274
Data columns (total 19 columns):
Column Non-Null Count Dtype
Booking_ID 36275 non-null object
no_of_adults 36275 non-null int64
no_of_children 36275 non-null int64
no_of_weekend_nights 36275 non-null int64
no_of_week_nights 36275 non-null int64
type_of_meal_plan 36275 non-null object
required_car_parking_space 36275 non-null int64
room_type_reserved 36275 non-null object
lead_time 36275 non-null int64
arrival_year 36275 non-null int64
arrival_month 36275 non-null int64
arrival_date 36275 non-null int64
market_segment_type 36275 non-null object
repeated_guest 36275 non-null int64
no_of_previous_cancellations 36275 non-null int64
no_of_previous_bookings_not_canceled 36275 non-null int64
avg_price_per_room 36275 non-null float64
no_of_special_requests 36275 non-null int64
booking_status 36275 non-null object dtypes: float64(1), int64(13), object(5) memory usage: 5.3+ MB
The dataset has 36,275 seperate interaction accross 19 fetures
Booking_ID , type_of_meal_plan , room_type_reserved , market_segment_type , and booking_status are of object type, meaning they are catagorical or individual identifiers. The rest of the columns are numeric in nature, which can also be catagorical, time indicators, or actual values. There are no null values in the dataset.
Booking_ID column is an identifier. We will verify that this is unique.
It is clearly an individual identifier, which serves no purpose for this exercise, therefore we will remove it.
10/18/22, 5: 58 PMLearner_Notebook_Practical_Data_Science_Practise_Project Page 6 of 40file:///Users/jeffreydavis/Desktop/Applied%20Data%20Science/Practi…Projects/Practical%20Data%20Science/Hotel_cancel_RandomForest.html
#
--- ------ -------------- ----0
1
2
3
4
5
6
7
8
9
10
11
12
13
14
15
16
17
18
36275 Observations:
In [7]: data.Booking_ID.nunique() Out[7]:
Dropping
Booking_ID column
Exploratory Data Analysis and Data Preprocessing
Summary Statistics for numerical columns
10/18/22, 5: 58 PMLearner_Notebook_Practical_Data_Science_Practise_Project Page 7 of 40file:///Users/jeffreydavis/Desktop/Applied%20Data%20Science/Practic…Projects/Practical%20Data%20Science/Hotel_cancel_RandomForest.html
the
no_of_adults no_of_children no_of_weekend_nights no_of_week_nights type_of_meal_plan 0 2 0 1 2 Meal Plan 1 1 2 0 2 3 Not Selected 2 1 0 2 1 Meal Plan 1 3 2 0 0 2 Meal Plan 1 4 2 0 1 1 Not Selected In [8]: data = data.drop(columns = 'Booking_ID') In [9]: data.head() Out[9]: In [10]: # Selecting numerical features num_cols = data.select_dtypes('number').columns # Identifying summary stats (Transposed) data[num_cols].describe().T
count mean std min 25%
no_of_adults 36275.0 1.844962 0.518715 0.0 2.0 no_of_children 36275.0 0.105279 0.402648 0.0 0.0 no_of_weekend_nights 36275.0 0.810724 0.870644 0.0 0.0 no_of_week_nights 36275.0 2.204300 1.410905 0.0 1.0 required_car_parking_space 36275.0 0.030986 0.173281 0.0 0.0
lead_time 36275.0 85.232557 85.930817 0.0 17.0 57.00
arrival_year 36275.0 2017.820427 0.383836 2017.0 2018.0 2018.00
arrival_month 36275.0 7.423653 3.069894 1.0 5.0 arrival_date 36275.0 15.596995 8.740447 1.0 8.0 16.00 repeated_guest 36275.0 0.025637 0.158053 0.0 0.0
no_of_previous_cancellations 36275.0 0.023349 0.368331 0.0 0.0
no_of_previous_bookings_not_canceled 36275.0 0.153411 1.754171 0.0 0.0 avg_price_per_room 36275.0 103.423539 35.089424 0.0 80.3 99.45 no_of_special_requests 36275.0 0.619655 0.786236 0.0 0.0
Observations:
It looks like less than 25% actually booked childen for their stay (in this data set). This could cause issues in generalizing this model against places that have a large number of children booked (e.g. Orlando, Disney, etc).
These booking took place between 2017 & 2018
The majority of bookings were 57 days out, again this may cause inacuracies in generalizing results based on specific locations, such as resorts, where bookings are normally made months in advance.
The median price per room is low (less than 1/5 the max), this could be an important feature as the tree develops. Also note that average price/room is $0.00. This is an indicator of comps, for one reason or the other.
10/18/22, 5: 58 PMLearner_Notebook_Practical_Data_Science_Practise_Project Page 8 of 40file:///Users/jeffreydavis/Desktop/Applied%20Data%20Science/Practi…Projects/Practical%20Data%20Science/Hotel_cancel_RandomForest.html
Out[10]: In [11]: # Checking the rows where the avg_price_per_room is $0.00 print(data.head()) data[data["avg_price_per_room"] == 0]
10/18/22, 5: 58 PMLearner_Notebook_Practical_Data_Science_Practise_Project Page 9 of 40file:///Users/jeffreydavis/Desktop/Applied%20Data%20Science/Practi…Projects/Practical%20Data%20Science/Hotel_cancel_RandomForest.html no_of_adults no_of_children no_of_weekend_nights no_of_week_nights \ 0 2 0 1 2 1 2 0 2 3 2 1 0 2 1 3 2 0 0 2 4 2 0 1 1 type_of_meal_plan required_car_parking_space room_type_reserved lead_tim e \ 0 Meal Plan 1 0 Room_Type 1 22 4 1 Not Selected 0 Room_Type 1 5 2 Meal Plan 1 0 Room_Type 1 1 3 Meal Plan 1 0 Room_Type 1 21 1 4 Not Selected 0 Room_Type 1 4 8 arrival_year arrival_month arrival_date market_segment_type \ 0 2017 10 2 Offline 1 2018 11 6 Online 2 2018 2 28 Online 3 2018 5 20 Online 4 2018 4 11 Online repeated_guest no_of_previous_cancellations \ 0 0 0 1 0 0 2 0 0 3 0 0 4 0 0 no_of_previous_bookings_not_canceled avg_price_per_room \ 0 0 65.00 1 0 106.68 2 0 60.00 3 0 100.00 4 0 94.50 no_of_special_requests booking_status 0 0 Not_Canceled 1 1 Not_Canceled 2 0 Canceled 3 0 Canceled 4 0 Canceled
columns
the market segment column, it looks like many values are complementary.
[12]: # matching $0.00 P/R against the "market segment type" data
loc[data["avg_price_per_room"]
market_segment_type, dtype:
"market_segment_type"]
are nearly 2X the number of "Complementary" rooms as compared to online
"Online" clasification is not a known feature at this time. We cannot determine why this is not listed as complimentary based on the data. Depending on where this
falls in the imporatnce, clarity from the booking service may be required.
Checking the distribution and outliers for numerical columns in the data
10/18/22, 5: 58 PMLearner_Notebook_Practical_Data_Science_Practise_Project Page 10 of 40file:///Users/jeffreydavis/Desktop/Applied%20Data%20Science/Practi…Projects/Practical%20Data%20Science/Hotel_cancel_RandomForest.html In
Complementary 354 Online 191 Name:
int64 Observations: There
booking The
feature
no_of_adults no_of_children no_of_weekend_nights no_of_week_nights type_of_meal_plan 63 1 0 0 1 Meal Plan 145 1 0 0 2 Meal Plan 209 1 0 0 0 Meal Plan 266 1 0 0 2 Meal Plan 267 1 0 2 1 Meal Plan ... ... ... ... ... 35983 1 0 0 1 Meal Plan 36080 1 0 1 1 Meal Plan 36114 1 0 0 1 Meal Plan 36217 2 0 2 1 Meal Plan 36250 1 0 0 2 Meal Plan 2 545 rows × 18
Out[11]: In
.
== 0,
.value_counts Out[12]:
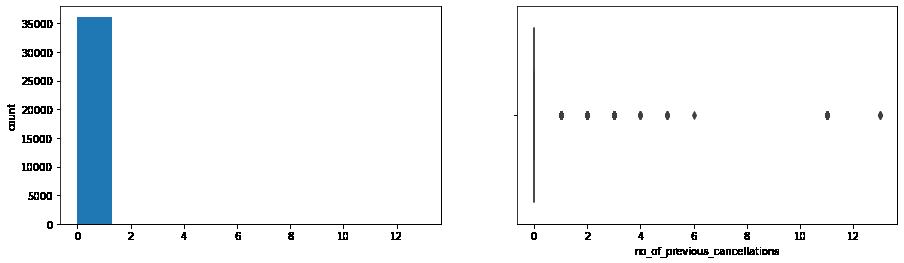
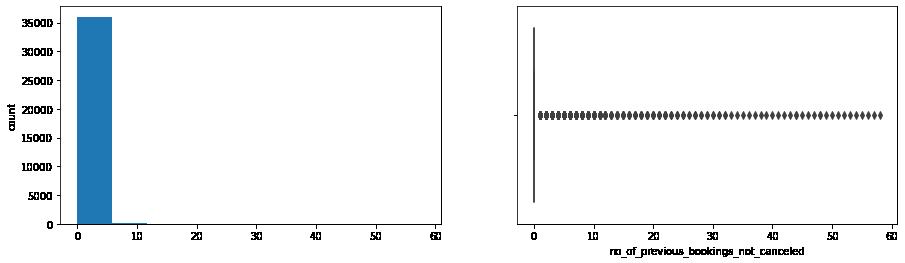
In [13]: for col in ['lead_time', 'no_of_previous_cancellations', 'no_of_previous_bookings_not_canceled' print(col) print('Skew :', round(data[col].skew(), 2)) plt.figure(figsize = (15, 4)) plt.subplot(1,2,1) data[col].hist(bins = 10, grid = False) plt.ylabel('count') plt.subplot(1, 2, 2) sns.boxplot(x = data[col]) plt.show()
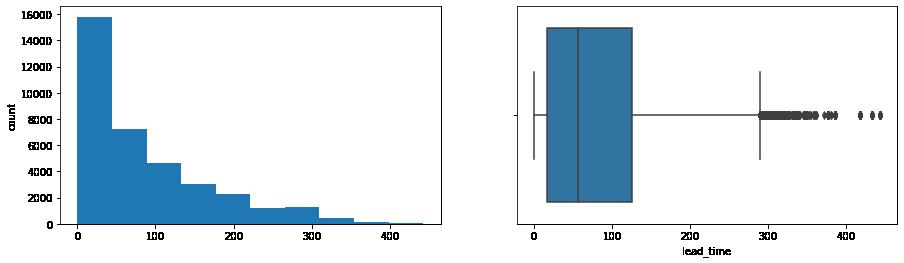
lead_time
Skew : 1.29
no_of_previous_cancellations
Skew : 25.2
no_of_previous_bookings_not_canceled
Skew : 19.25
10/18/22, 5: 58 PMLearner_Notebook_Practical_Data_Science_Practise_Project Page 11 of 40file:///Users/jeffreydavis/Desktop/Applied%20Data%20Science/Practi…Projects/Practical%20Data%20Science/Hotel_cancel_RandomForest.html
avg_price_per_room Skew : 0.67
Observations: Our observations here are similar to the observations we made when viewing the summary statistics: There are large skews in much of the data. Specifically:
Lead Time the bulk is between 0 and 120 days. Previous cancelations only unique instences happening beyond one cancelation. Number of Bookings not Canceled this heavy skew could tell us that the data contains a limited number of repeat customers. Price / Room (again) heavily skewed between 110.
80and
In [14]: # Calculating the 25th quantile Q1 = data["avg_price_per_room"].quantile(0.25)
# Calculating the 75th quantile Q3 = data["avg_price_per_room"].quantile(0.75)
# Calculating IQR IQR = Q3 - Q1 print ('IQR is: ', IQR)
# Calculating value of upper whisker for outliers

Upper_Whisker = Q3 + 1.5 * IQR print ('Upper Whisker is: ', Upper_Whisker)
IQR is: 39.7 Upper Whisker is: 179.55
10/18/22, 5: 58 PMLearner_Notebook_Practical_Data_Science_Practise_Project Page 12 of 40file:///Users/jeffreydavis/Desktop/Applied%20Data%20Science/Practi…Projects/Practical%20Data%20Science/Hotel_cancel_RandomForest.html
In [15]: # Assigning the value of upper whisker to outliers to normalize results. This ensures ##Learning to be effected by unique outliers. data.loc[data["avg_price_per_room"] >= 500, "avg_price_per_room"] = Upper_Whisker
In [16]: #check the percentage of each category for veriables
cat_cols = ['no_of_adults', 'no_of_children', 'no_of_week_nights', 'no_of_weekend_nights' 'type_of_meal_plan', 'room_type_reserved', 'arrival_month', 'market_segment_type' 'booking_status']
for col in cat_cols: print ('**',col,'**,\n') print(data[col].value_counts(normalize = True)) print ('total:', data[col].value_counts(normalize = True).sum()) print ('__' *30, '\n')
** no_of_adults **, 2 0.719724 1 0.212130 3 0.063873 0 0.003832 4 0.000441
Name: no_of_adults, dtype: float64 total: 1.0
** no_of_children **, 0 0.925624 1 0.044604 2 0.029166 3 0.000524 9 0.000055 10 0.000028
Name: no_of_children, dtype: float64 total: 1.0
** no_of_week_nights **, 2 0.315479 1 0.261558 3 0.216099 4 0.082426 0 0.065803
0.044493 6 0.005210
0.003115 10 0.001709 8 0.001709
10/18/22, 5: 58 PMLearner_Notebook_Practical_Data_Science_Practise_Project Page 13 of 40file:///Users/jeffreydavis/Desktop/Applied%20Data%20Science/Practi…Projects/Practical%20Data%20Science/Hotel_cancel_RandomForest.html
____________________________________________________________
____________________________________________________________
5
7
0.000937
0.000469
0.000276
0.000248
0.000193
0.000138
0.000083
0.000055
Name: no_of_week_nights, dtype: float64 total: 1.0000000000000002
** no_of_weekend_nights **, 0 0.465114
0.275534 2 0.250062
0.004218
0.003556
0.000937
0.000551
0.000028
Name: no_of_weekend_nights, dtype: float64 total: 0.9999999999999999
** required_car_parking_space **, 0 0.969014 1 0.030986
Name: required_car_parking_space, dtype: float64 total: 1.0
** type_of_meal_plan **,
Meal Plan 1 0.767333 Not Selected 0.141420 Meal Plan 2 0.091110 Meal Plan 3 0.000138
Name: type_of_meal_plan, dtype: float64 total: 1.0
** room_type_reserved **,
Room_Type 1 0.775465
Room_Type 4 0.166975
Room_Type 6 0.026630
Room_Type 2 0.019076
Room_Type 5 0.007305
Room_Type 7 0.004356
Room_Type 3 0.000193
10/18/22, 5: 58 PMLearner_Notebook_Practical_Data_Science_Practise_Project Page 14 of 40file:///Users/jeffreydavis/Desktop/Applied%20Data%20Science/Practi…Projects/Practical%20Data%20Science/Hotel_cancel_RandomForest.html 9
11
15
12
14
13
17
16
____________________________________________________________
1
3
4
5
6
7
____________________________________________________________
____________________________________________________________
____________________________________________________________
Name: room_type_reserved, dtype: float64 total: 1.0
** arrival_month **,
0.146575
0.127112
0.105114
0.088298
0.083280
0.082150
0.080496
0.075424
0.071620 3 0.065003 2 0.046975 1 0.027953
Name: arrival_month, dtype: float64 total: 1.0000000000000002
** market_segment_type **, Online 0.639945 Offline 0.290227 Corporate 0.055603 Complementary 0.010779 Aviation 0.003446
Name: market_segment_type, dtype: float64 total: 0.9999999999999999
** no_of_special_requests **, 0 0.545196 1 0.313522 2 0.120303
0.018608 4 0.002150 5 0.000221
Name: no_of_special_requests, dtype: float64 total: 1.0
** booking_status **,
Not_Canceled 0.672364
Canceled 0.327636
Name: booking_status, dtype: float64 total: 1.0
10/18/22, 5: 58 PMLearner_Notebook_Practical_Data_Science_Practise_Project Page 15 of 40file:///Users/jeffreydavis/Desktop/Applied%20Data%20Science/Practi…Projects/Practical%20Data%20Science/Hotel_cancel_RandomForest.html
____________________________________________________________
10
9
8
6
12
11
7
4
5
____________________________________________________________
____________________________________________________________
3
____________________________________________________________
____________________________________________________________
[53]:
Observations:
Week nights and weekends are off slightly. somewhere a weekend got counted as a weeknight. This should not effect the results; however, it is an indicator that data gathering practices changed or were incorrectly followed.
Beyond just analizing data, we can see a lot from this breakdown: Meal plan 3 is rarely ordered 96% do not require parking Majority of bookings do not invlove children.
Replacing values 9 and 10 for the number of children with 3 and encoding the target variable
values
and 10 with 3 for the column no_of_children
10],
type_of_meal_plan
Plan
Selected
Plan
Plan
10/18/22, 5: 58 PMLearner_Notebook_Practical_Data_Science_Practise_Project Page 16 of 40file:///Users/jeffreydavis/Desktop/Applied%20Data%20Science/Practi…Projects/Practical%20Data%20Science/Hotel_cancel_RandomForest.html
no_of_adults no_of_children no_of_weekend_nights no_of_week_nights
0 2 0 1 2 Meal
1 1 2 0 2 3 Not
2 1 0 2 1 Meal
1 3 2 0 0 2 Meal
1 4 2 0 1 1 Not Selected no_of_adults no_of_children no_of_weekend_nights no_of_week_nights type_of_meal_plan 0 2 0 1 2 Meal Plan 1 1 2 0 2 3 Not Selected 2 1 0 2 1 Meal Plan 1 3 2 0 0 2 Meal Plan 1 4 2 0 1 1 Not Selected In
# Replacing
9
data["no_of_children"] = data["no_of_children"].replace([9,
3) data.head() Out[53]: In [54]: data["booking_status"] = data["booking_status"].apply(lambda x: 1 if x == "Canceled" data.head() Out[54]:
Explore with bivariate analysis.
Checking the relationship of market segment type with the average price per room.
In [55]: plt.figure(figsize = (10, 6)) sns.boxplot(data = data, x = "market_segment_type", y = "avg_price_per_room" plt.show()
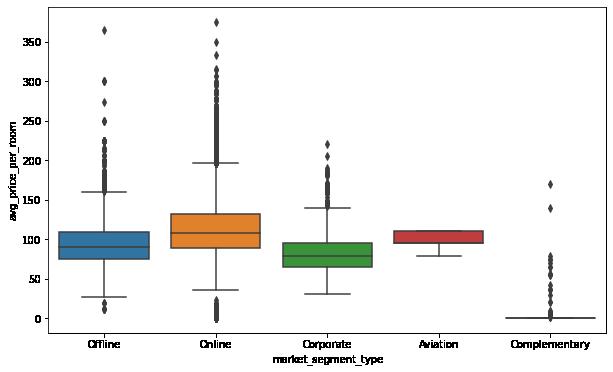
Observations:
Rooms booked online have the highest variations in prices. The distribution for offline and corporate room prices are almost similar except for some outliers.
Complementary market segment gets the rooms at very low prices, which makes sense.
Booking status varies across different market segments. Also, how lead time impacts booking status.
10/18/22, 5: 58 PMLearner_Notebook_Practical_Data_Science_Practise_Project Page 17 of 40file:///Users/jeffreydavis/Desktop/Applied%20Data%20Science/Practi…Projects/Practical%20Data%20Science/Hotel_cancel_RandomForest.html
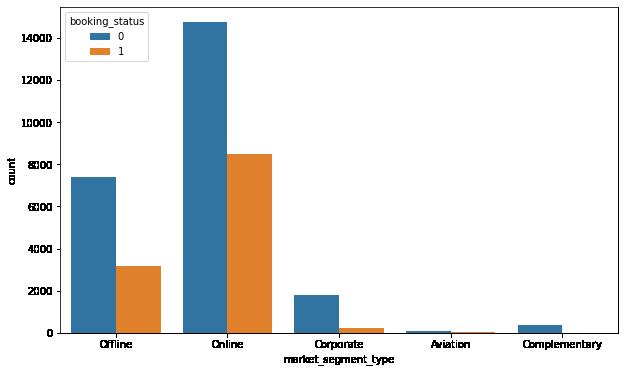
In [58]: plt.figure(figsize = (10, 6))
sns.countplot(x = 'market_segment_type', hue = 'booking_status', data = data plt.show()
Observations:
Online bookings have the highest number of cancellations. Bookings made offline are less prone to cancellations. Corporate and complementary segment also show very low number of cancellations.
In [59]: plt.figure(figsize = (10, 6)) sns.boxplot(data = data, x = "booking_status", y = "lead_time") plt.show()
10/18/22, 5: 58 PMLearner_Notebook_Practical_Data_Science_Practise_Project Page 18 of 40file:///Users/jeffreydavis/Desktop/Applied%20Data%20Science/Practi…Projects/Practical%20Data%20Science/Hotel_cancel_RandomForest.html
Observations:
There's a big difference in the median value of lead time for bookings that were canceled and bookings that were not canceled.
The higher the lead time, the higher are the chances of a booking being canceled. This makes sense as there is more time for variables in individual lives to change the need for taking a trip.
Arrival month impact the booking status.
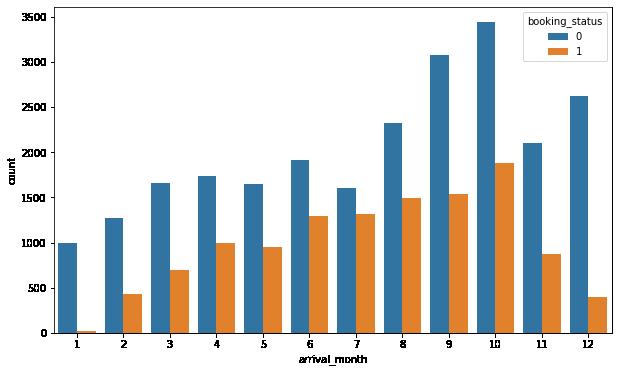
In [61]: plt.figure(figsize = (10, 6)) sns.countplot(x = 'arrival_month', hue = 'booking_status', data = data) plt.show()

10/18/22, 5: 58 PMLearner_Notebook_Practical_Data_Science_Practise_Project Page 19 of 40file:///Users/jeffreydavis/Desktop/Applied%20Data%20Science/Practi…Projects/Practical%20Data%20Science/Hotel_cancel_RandomForest.html
Observations:
We observed earlier that the month of October has the highest number of bookings but the above plot shows that October has the highest number of cancellations as well.
Bookings made for December and January are least prone to cancellations.
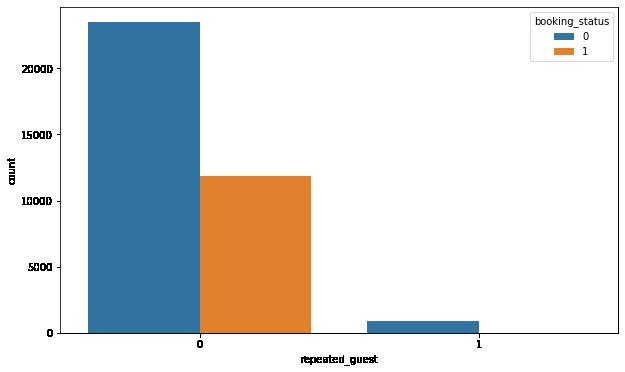
Repeating guests are the guests who stay in the hotel often and are important to brand equity. Let's see what percentage of repeating guests cancel? In [62]: plt.figure(figsize = (10, 6)) sns.countplot(x = 'repeated_guest', hue = 'booking_status', data = data) plt.show()
10/18/22, 5: 58 PMLearner_Notebook_Practical_Data_Science_Practise_Project Page 20 of 40file:///Users/jeffreydavis/Desktop/Applied%20Data%20Science/Practi…rojects/Practical%20Data%20Science/Hotel_cancel_RandomForest.html
Observations:
There are very few repeat customers but the cancellation among them is very less
This is a good indication as repeat customers are important for the hospitality industry as they can help in spreading the word of mouth. We have explored different combinations of variables. Now, let's see the pairwise correlations between all the variables.
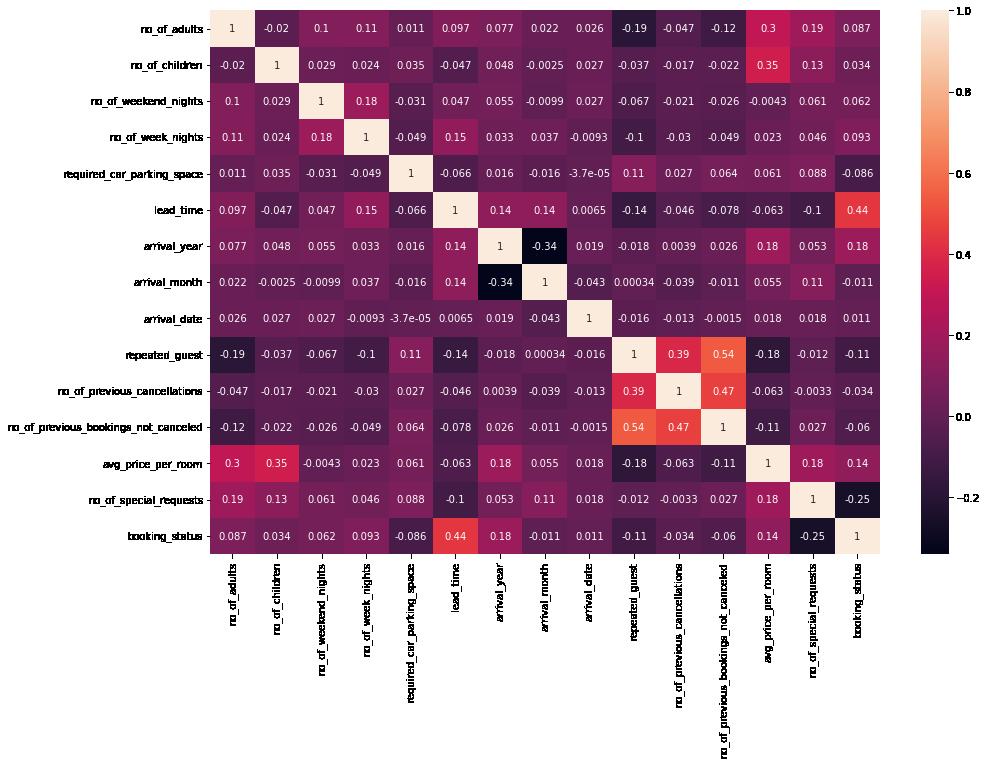
In [63]: plt.figure(figsize = (15,10)) sns.heatmap(data.corr(), annot = True) plt.show()
10/18/22, 5: 58 PMLearner_Notebook_Practical_Data_Science_Practise_Project Page 21 of 40file:///Users/jeffreydavis/Desktop/Applied%20Data%20Science/Practi…Projects/Practical%20Data%20Science/Hotel_cancel_RandomForest.html
Observations:
Lead time seems to be the only direct correlary for booking status. There are of course obvious correlations between price / room and number of children, as well as prior customers and cancelations.
Preparing the data for modeling
Models cannot take non-numeric inputs. So, we will first create dummy variables for all the categorical variables.
will then split the data into train and test sets.
10/18/22, 5: 58 PMLearner_Notebook_Practical_Data_Science_Practise_Project Page 22 of 40file:///Users/jeffreydavis/Desktop/Applied%20Data%20Science/Practi…rojects/Practical%20Data%20Science/Hotel_cancel_RandomForest.html
We
In [64]: #Dropping the dependant varriable X = data.drop(columns = 'booking_status') Y = data['booking_status']
In [65]: # Creating dummy variables, drop_first = True is used to avoid redundant variables X = pd.get_dummies(X, drop_first = True)
In [66]: # Splitting the data into train and test sets X_train, X_test, y_train, y_test = train_test_split(X, Y, test_size = 0.30,
Building Classification Models
Before training the model, let's choose the appropriate model evaluation criterion as per the problem at hand.
Model evaluation criterion
Model can make wrong predictions as:
1. Predicting a customer will not cancel their booking but in reality, the customer cancels their booking.
2. Predicting a customer will cancel their booking but in reality, the customer does not cancel their booking.
Which case is more important?
Both the cases are important as:
If we predict that a booking will not be canceled and the booking gets canceled, then the hotel will lose resources and will have to bear additional costs of unsold rooms. The hotel might also have to bear an additional cost of advertising the room again on different distribution channels.
If we predict that a booking will get canceled and the booking doesn't get canceled, then the hotel might not be able to provide satisfactory services to the customer by assuming that this booking will be canceled. This might damage the brand equity.
How to reduce the losses?
Hotel would want F1 Score to be maximized, greater the F1 score, higher are the chances of minimizing False Negatives and False Positives.
Also, let's create a function to calculate and print the classification report and confusion matrix so that we don't have to rewrite the same code repeatedly for each model.
10/18/22, 5: 58 PMLearner_Notebook_Practical_Data_Science_Practise_Project Page 23 of 40file:///Users/jeffreydavis/Desktop/Applied%20Data%20Science/Practi…rojects/Practical%20Data%20Science/Hotel_cancel_RandomForest.html
In [68]: # Function to print classification report and get confusion matrix in a proper format
def metrics_score(actual, predicted): print(classification_report(actual, predicted)) cm = confusion_matrix(actual, predicted) plt.figure(figsize = (8, 5)) sns.heatmap(cm, annot = True, fmt = '.2f', xticklabels = ['Not Canceled' plt.ylabel('Actual') plt.xlabel('Predicted') plt.show()
Decision Tree
In [69]: # Fitting the decision tree classifier on the training data d_tree = DecisionTreeClassifier(random_state = 42) d_tree.fit(X_train, y_train) Out[69]:
DecisionTreeClassifier
DecisionTreeClassifier(random_state=42)
In [70]: # Checking performance on the training data y_pred_train1 = d_tree.predict(X_train) metrics_score(y_train, y_pred_train1)
Let's check the performance on the training data precision recall f1-score support 0 0.99 1.00 1.00 17029 1 1.00 0.99 0.99 8363 accuracy 0.99 25392 macro avg 0.99 0.99 0.99 25392 weighted avg 0.99 0.99 0.99 25392
10/18/22, 5: 58 PMLearner_Notebook_Practical_Data_Science_Practise_Project Page 24 of 40file:///Users/jeffreydavis/Desktop/Applied%20Data%20Science/Practi…rojects/Practical%20Data%20Science/Hotel_cancel_RandomForest.html
▾
Reading confusion matrix (clockwise):
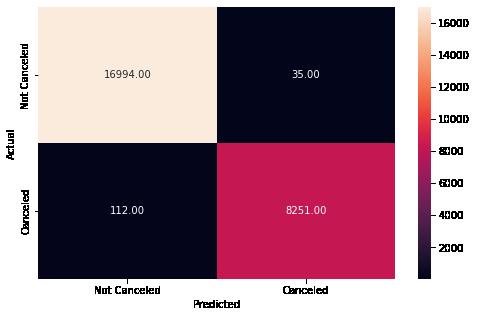
True Positive: Predicting the customer will not cancel the booking and the customer does not cancel the booking.
False Negative: Predicting the customer will cancel the booking but the customer does not cancel the booking.
True Negative: Predicting the customer will cancel the booking and the customer cancels the booking.
False Positive: Predicting the customer will not cancel the booking but the customer cancels the booking.
Observations: The model was able excellent results:
The model predicted a false negative only 0.4% of the instances It predicted a false positive only 0.7% of the instances This provides an accuracy score of 99% overall.
Review performance on test data to see if the model is overfitting. In [71]: # Checking performance on the testing data
= d_tree.predict(X_test)
y_pred_test1)
10/18/22, 5: 58 PMLearner_Notebook_Practical_Data_Science_Practise_Project Page 25 of 40file:///Users/jeffreydavis/Desktop/Applied%20Data%20Science/Practi…rojects/Practical%20Data%20Science/Hotel_cancel_RandomForest.html
y_pred_test1
metrics_score(y_test,
Observations:
Here we can see that the accuracy on the test data is as down to 87%, which shows some signs of overfitting and the need to tune hyper parameters.

Hyperparameter tuning using GridSearchCV to find the optimal max_depth to reduce overfitting of the model. We can tune some other hyperparameters as well.
Decision Tree - Hyperparameter Tuning
We will use the class_weight hyperparameter with the value equal to {0: 0.3, 1: 0.7} which is approximately the opposite of the imbalance in the original data.
This would tell the model that 1 is the important class here.
10/18/22, 5: 58 PMLearner_Notebook_Practical_Data_Science_Practise_Project Page 26 of 40file:///Users/jeffreydavis/Desktop/Applied%20Data%20Science/Practi…rojects/Practical%20Data%20Science/Hotel_cancel_RandomForest.html precision recall f1-score support 0 0.91 0.90 0.91 7361 1 0.80 0.81 0.81 3522 accuracy 0.87 10883 macro avg 0.85 0.86 0.86 10883 weighted avg 0.87 0.87 0.87 10883
In [72]: # Choose the type of classifier d_tree_tuned = DecisionTreeClassifier(random_state = 42, class_weight = {0:
# Grid of parameters to choose from parameters = {'max_depth': np.arange(2, 10), 'criterion': ['gini', 'entropy'], 'min_samples_leaf': [5, 10, 20, 25] }
# Type of scoring used to compare parameter combinations - f1 score for class 1 scorer = metrics.make_scorer(f1_score, pos_label = 1)
# Run the grid search grid_obj = GridSearchCV(d_tree_tuned, parameters, scoring = scorer, cv = 5) grid_obj = grid_obj.fit(X_train, y_train)
# Set the classifier to the best combination of parameters d_tree_tuned = grid_obj.best_estimator_
# Fit the best algorithm to the data d_tree_tuned.fit(X_train, y_train)
Out[72]:
DecisionTreeClassifier
DecisionTreeClassifier(class_weight={0: 0.3, 1: 0.7}, max_depth=9, min_samples_leaf=5, random_state=42)
We have tuned the model and fit the tuned model on the training data. Now, let's check the model performance on the training and testing data.
In [73]: # Checking performance on the training data y_pred_train2 = d_tree_tuned.predict(X_train) metrics_score(y_train, y_pred_train2)
precision recall f1-score support 0 0.93 0.85 0.89 17029 1 0.74 0.87 0.80 8363 accuracy 0.86 25392 macro avg 0.84 0.86 0.85 25392 weighted avg 0.87 0.86 0.86 25392
10/18/22, 5: 58 PMLearner_Notebook_Practical_Data_Science_Practise_Project Page 27 of 40file:///Users/jeffreydavis/Desktop/Applied%20Data%20Science/Practi…rojects/Practical%20Data%20Science/Hotel_cancel_RandomForest.html
▾
Observations: Here there is a drop in accuracy for the training data.
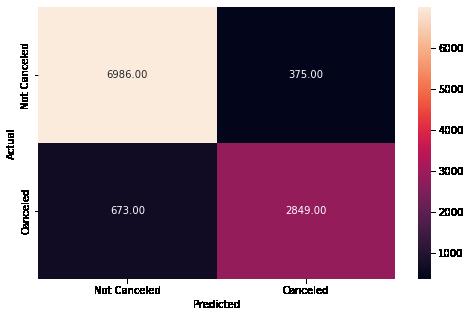
In [75]: # Checking performance on the testing data y_pred_test2 = d_tree_tuned.predict(X_test) metrics_score(y_test, y_pred_test2)

Checking the model performance on the test data precision recall f1-score support
macro
10/18/22, 5: 58 PMLearner_Notebook_Practical_Data_Science_Practise_Project Page 28 of 40file:///Users/jeffreydavis/Desktop/Applied%20Data%20Science/Practi…rojects/Practical%20Data%20Science/Hotel_cancel_RandomForest.html
0 0.92 0.85 0.88 7361 1 0.72 0.84 0.78 3522 accuracy 0.84 10883
avg 0.82 0.84 0.83 10883 weighted avg 0.85 0.84 0.85 10883
Observations:
a
in
for the
Visualizing the tuned decision tree and observe the decision rules:

and interpret the
and visualize it
with
the
10/18/22, 5: 58 PMLearner_Notebook_Practical_Data_Science_Practise_Project Page 29 of 40file:///Users/jeffreydavis/Desktop/Applied%20Data%20Science/Practi…rojects/Practical%20Data%20Science/Hotel_cancel_RandomForest.html
Here we can see
slight drop
perfomrance
decision tree.
It is hard to visualize
tree
depth = 9, We can reduce
depth to 3
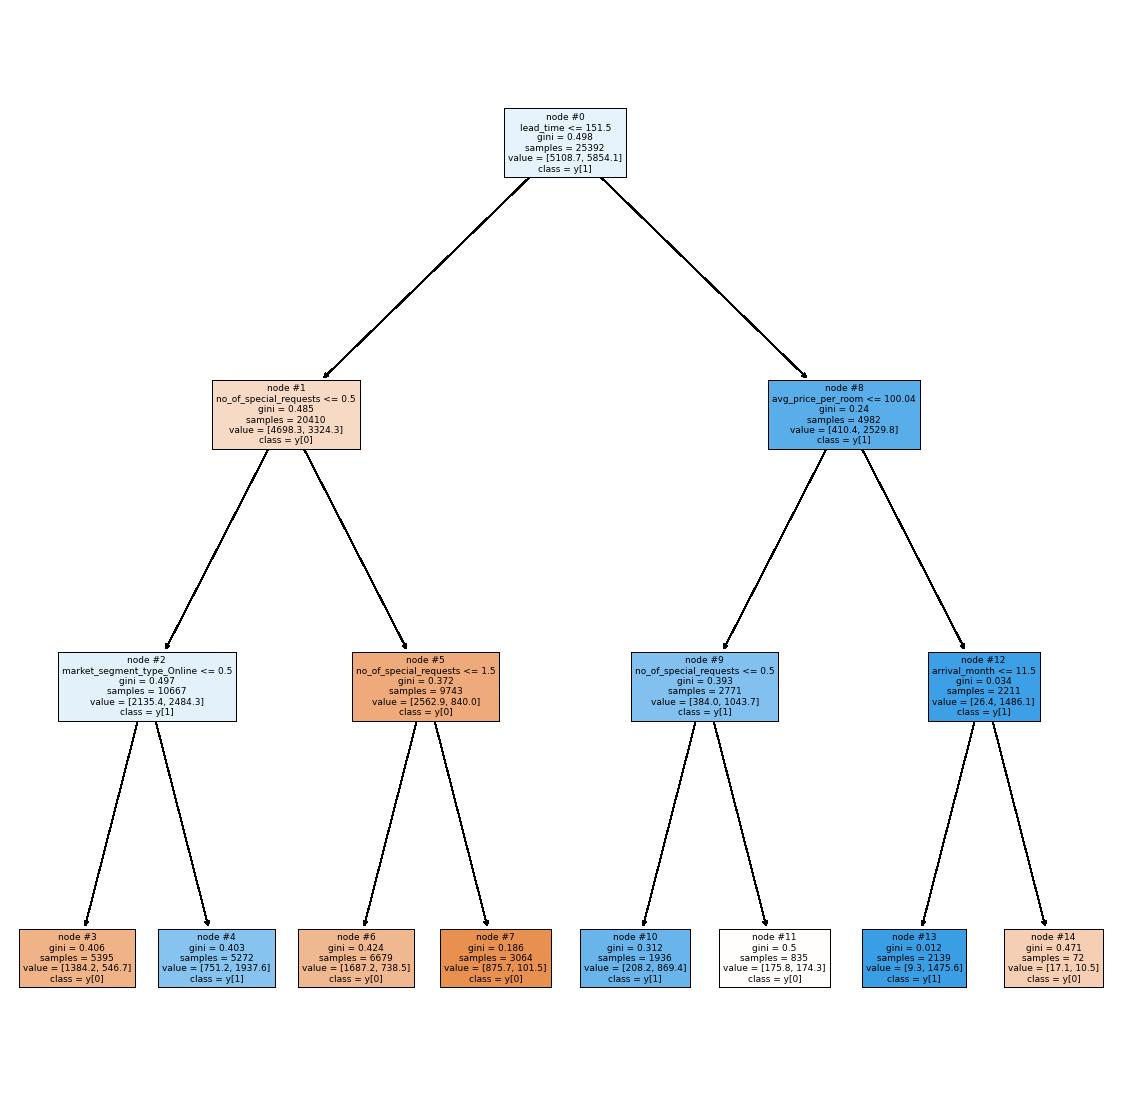
In [76]: tree_model = DecisionTreeClassifier(class_weight = {0: 0.3, 1: 0.7}, max_depth min_samples_leaf = 5, random_state = 42) # Fit the best algorithm to the data tree_model.fit(X_train, y_train) Out[76]: In [77]: features = list(X.columns) plt.figure(figsize = (20, 20)) tree.plot_tree(tree_model, feature_names = features, filled = True, fontsize plt.show() ▾ DecisionTreeClassifier DecisionTreeClassifier(class_weight={0: 0.3, 1: 0.7}, max_depth=3, min_samples_leaf=5, random_state=42)
Observations:
can see that the
second
did decide on "lead_time" as the most valuable atribute.
to
the most
"avg_price_per_room"
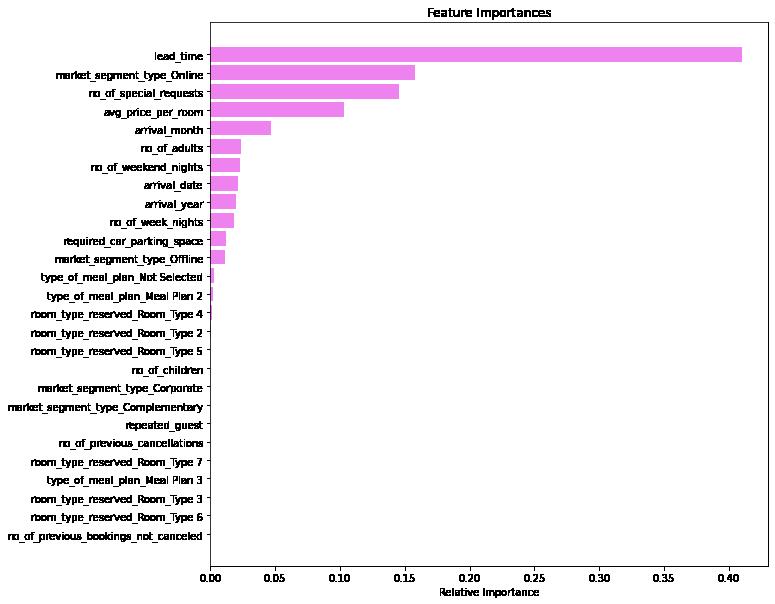
Feature importance of the tuned decision tree model
Importance of
in
10/18/22, 5: 58 PMLearner_Notebook_Practical_Data_Science_Practise_Project Page 30 of 40file:///Users/jeffreydavis/Desktop/Applied%20Data%20Science/Practi…rojects/Practical%20Data%20Science/Hotel_cancel_RandomForest.html
We
model
the
branch are 2 atributes pulled
reduce
entropy ("no_of_special_requests" &
In [78]: #
features
the tree building print (pd.DataFrame(d_tree_tuned.feature_importances_, columns = ["Imp"], index
Imp
lead_time 0.409885 market_segment_type_Online 0.158010 no_of_special_requests 0.145321 avg_price_per_room 0.102900 arrival_month 0.047268 no_of_adults 0.023393 no_of_weekend_nights 0.022874 arrival_date 0.021372 arrival_year 0.020283 no_of_week_nights 0.018494 required_car_parking_space 0.011915 market_segment_type_Offline 0.011526 type_of_meal_plan_Not Selected 0.003107 type_of_meal_plan_Meal Plan 2 0.001838 room_type_reserved_Room_Type 4 0.001034 room_type_reserved_Room_Type 2 0.000577 room_type_reserved_Room_Type 5 0.000203 no_of_previous_cancellations 0.000000 room_type_reserved_Room_Type 7 0.000000 market_segment_type_Corporate 0.000000 market_segment_type_Complementary 0.000000 room_type_reserved_Room_Type 3 0.000000 room_type_reserved_Room_Type 6 0.000000 no_of_previous_bookings_not_canceled 0.000000 no_of_children 0.000000 repeated_guest 0.000000 type_of_meal_plan_Meal Plan 3 0.000000
In [79]: # Plotting the feature importance importances = d_tree_tuned.feature_importances_ indices = np.argsort(importances) plt.figure(figsize = (10, 10)) plt.title('Feature Importances') plt.barh(range(len(indices)), importances[indices], color = 'violet', align plt.yticks(range(len(indices)), [features[i] for i in indices]) plt.xlabel('Relative Importance') plt.show()
10/18/22, 5: 58 PMLearner_Notebook_Practical_Data_Science_Practise_Project Page 31 of 40file:///Users/jeffreydavis/Desktop/Applied%20Data%20Science/Practi…Projects/Practical%20Data%20Science/Hotel_cancel_RandomForest.html
Random Forest Classifier
In [80]: # Fitting the random forest tree classifier on the training data rf_estimator = RandomForestClassifier(random_state = 42, criterion = 'entropy' rf_estimator.fit(X_train, y_train)
Out[80]:
[81]: # Checking performance on the training data
rf_estimator.predict(X_train)
y_pred_train3)
random_state=42)
10/18/22, 5: 58 PMLearner_Notebook_Practical_Data_Science_Practise_Project Page 32 of 40file:///Users/jeffreydavis/Desktop/Applied%20Data%20Science/Practi…rojects/Practical%20Data%20Science/Hotel_cancel_RandomForest.html
In
y_pred_train3 =
metrics_score(y_train,
▾ RandomForestClassifier RandomForestClassifier(criterion='entropy',
Observations:
determine overfitting

10/18/22, 5: 58 PMLearner_Notebook_Practical_Data_Science_Practise_Project Page 33 of 40file:///Users/jeffreydavis/Desktop/Applied%20Data%20Science/Practi…rojects/Practical%20Data%20Science/Hotel_cancel_RandomForest.html precision recall f1-score support 0 0.99 1.00 1.00 17029 1 0.99 0.99 0.99 8363 accuracy 0.99 25392 macro avg 0.99 0.99 0.99 25392 weighted avg 0.99 0.99 0.99 25392
Here we see our random forest generator provided highly accurate results Check the performance on test data to
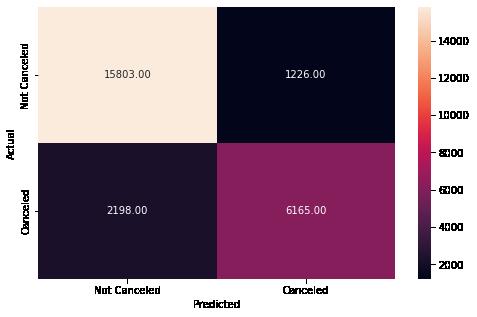
precision recall f1-score support 0 0.91 0.95 0.93 7361 1 0.88 0.81 0.84 3522 accuracy 0.90 10883 macro avg 0.90 0.88 0.89 10883 weighted avg 0.90 0.90 0.90 10883 In [82]: # Checking performance on the testing data y_pred_test3 = rf_estimator.predict(X_test) metrics_score(y_test, y_pred_test3)
Tuning the random forest classifier
Let's try tuning some of the important hyperparameters of the Random Forest Classifier.
We will not tune the criterion hyperparameter as we know from hyperparameter tuning for decision trees that entropy is a better splitting criterion for this data.
In [83]: # Choose the type of classifier rf_estimator_tuned = RandomForestClassifier(criterion = "entropy", random_state
# Grid of parameters to choose from parameters = {"n_estimators": [100, 110, 120], "max_depth": [5, 6, 7], "max_features": [0.8, 0.9, 1] }
In [84]: # Type of scoring used to compare parameter combinations - f1 score for class 1 scorer = metrics.make_scorer(f1_score, pos_label = 1)
In [85]: # Run the grid search grid_obj = GridSearchCV(rf_estimator_tuned, parameters, scoring = scorer, cv grid_obj = grid_obj.fit(X_train, y_train)
10/18/22, 5: 58 PMLearner_Notebook_Practical_Data_Science_Practise_Project Page 34 of 40file:///Users/jeffreydavis/Desktop/Applied%20Data%20Science/Practi…rojects/Practical%20Data%20Science/Hotel_cancel_RandomForest.html
In [86]: # Set the classifier to the best combination of parameters rf_estimator_tuned = grid_obj.best_estimator_
# Fitting the best algorithm to the training data rf_estimator_tuned.fit(X_train, y_train)
Out[86]:
RandomForestClassifier
RandomForestClassifier(criterion='entropy', max_depth=7, max_featur es=0.9, n_estimators=110, random_state=42)
In [87]: # Checking performance on the training data y_pred_train4 = rf_estimator_tuned.predict(X_train)
metrics_score(y_train, y_pred_train4)
precision recall f1-score support 0 0.88 0.93 0.90 17029 1 0.83 0.74 0.78 8363 accuracy 0.87 25392 macro avg 0.86 0.83 0.84 25392 weighted avg 0.86 0.87 0.86 25392
10/18/22, 5: 58 PMLearner_Notebook_Practical_Data_Science_Practise_Project Page 35 of 40file:///Users/jeffreydavis/Desktop/Applied%20Data%20Science/Practi…rojects/Practical%20Data%20Science/Hotel_cancel_RandomForest.html
▾
Observations:
Results on hyperparameter tuning were ineffective. From f1 accuracy of 90% in Test 3 to a drop to 87% in Training 4
In [88]: # Choose the type of classifier rf_estimator_tuned = RandomForestClassifier(criterion = "entropy", random_state
# Grid of parameters to choose from parameters = {"n_estimators": [110, 120], "max_depth": [6, 7], "min_samples_leaf": [20, 25], "max_features": [0.8, 0.9], "max_samples": [0.9, 1], "class_weight": ["balanced",{0: 0.3, 1: 0.7}] }
# Type of scoring used to compare parameter combinations - f1 score for class 1 scorer = metrics.make_scorer(f1_score, pos_label = 1)
# Run the grid search on the training data using scorer=scorer and cv=5 grid_obj = GridSearchCV(rf_estimator_tuned, parameters, scoring = scorer, cv grid_obj = grid_obj.fit(X_train, y_train)
# Save the best estimator to variable rf_estimator_tuned rf_estimator_tuned = grid_obj.best_estimator_
#Fit the best estimator to the training data rf_estimator_tuned.fit(X_train, y_train)
Out[88]:
RandomForestClassifier
RandomForestClassifier(class_weight={0: 0.3, 1: 0.7}, criterion='en tropy', max_depth=7, max_features=0.8, max_samples=0 .9, min_samples_leaf=20, n_estimators=110, rando m_state=42)
Let's check the performance of the tuned model
In [89]: # Checking performance on the training data y_pred_train5 = rf_estimator_tuned.predict(X_train)
metrics_score(y_train, y_pred_train5)
10/18/22, 5: 58 PMLearner_Notebook_Practical_Data_Science_Practise_Project Page 36 of 40file:///Users/jeffreydavis/Desktop/Applied%20Data%20Science/Practi…rojects/Practical%20Data%20Science/Hotel_cancel_RandomForest.html
▾
Observations:
on
data
10/18/22, 5: 58 PMLearner_Notebook_Practical_Data_Science_Practise_Project Page 37 of 40file:///Users/jeffreydavis/Desktop/Applied%20Data%20Science/Practi…rojects/Practical%20Data%20Science/Hotel_cancel_RandomForest.html precision recall f1-score support 0 0.90 0.89 0.89 17029 1 0.77 0.79 0.78 8363 accuracy 0.86 25392 macro avg 0.84 0.84 0.84 25392 weighted avg 0.86 0.86 0.86 25392
86% in Test 4 is still lower than the 90% in test 3. Let's check the model performance
the test
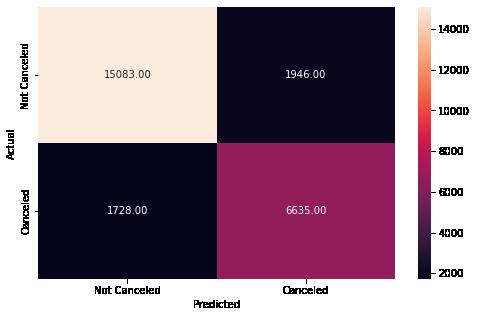
precision recall f1-score support 0 0.90 0.88 0.89 7361 1 0.77 0.79 0.78 3522 accuracy 0.85 10883 macro avg 0.83 0.84 0.83 10883 weighted avg 0.85 0.85 0.85 10883 In [53]: # Checking performance on the test data y_pred_test5 = rf_estimator_tuned.predict(X_test) metrics_score(y_test, y_pred_test5)
Observations:
Results continue in testing Hyperparameters in model 3 are the best tuned.

Review of feature importants within the model.
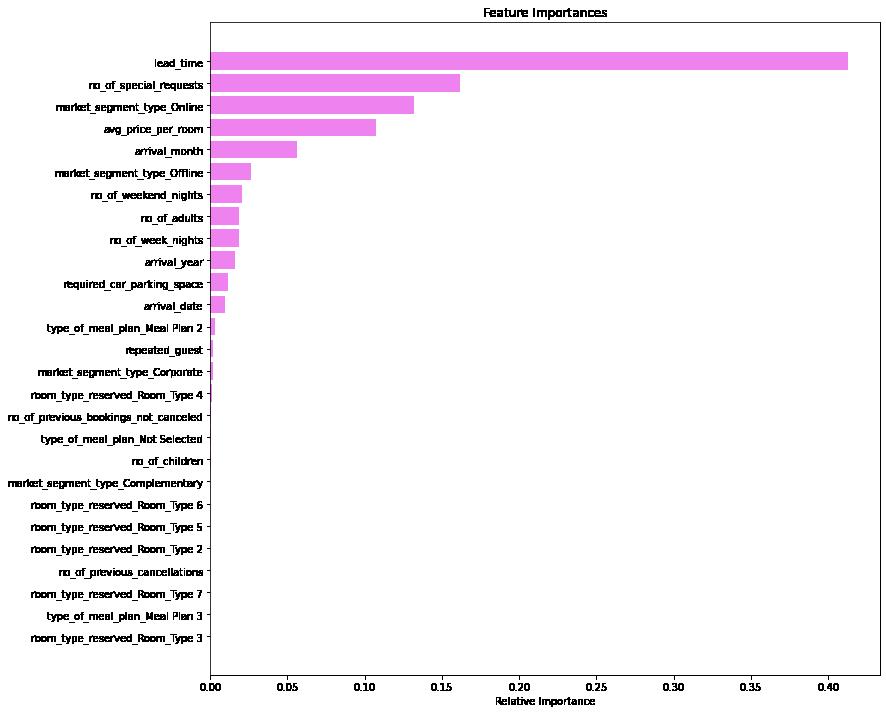
In [90]: importances = rf_estimator_tuned.feature_importances_ indices = np.argsort(importances) feature_names = list(X.columns) plt.figure(figsize = (12, 12)) plt.title('Feature Importances') plt.barh(range(len(indices)), importances[indices], color = 'violet', align plt.yticks(range(len(indices)), [feature_names[i] for i in indices]) plt.xlabel('Relative Importance') plt.show()
10/18/22, 5: 58 PMLearner_Notebook_Practical_Data_Science_Practise_Project Page 38 of 40file:///Users/jeffreydavis/Desktop/Applied%20Data%20Science/Practi…rojects/Practical%20Data%20Science/Hotel_cancel_RandomForest.html
Observations:
In spite of the the improved accuracy of the ensemble (random forest) model, the feature set remains the same as with the origional decision tree.
10/18/22, 5: 58 PMLearner_Notebook_Practical_Data_Science_Practise_Project Page 39 of 40file:///Users/jeffreydavis/Desktop/Applied%20Data%20Science/Practi…rojects/Practical%20Data%20Science/Hotel_cancel_RandomForest.html
Conclusion and Recommendations
We can see from the models above that the consitant factor in determining a cancelation is the distance from the actual reservation. When this is weighed with the next three largest factors: special requests, online reservations, and price per room it provides a very accurate prediction of individual cancelations. There are several actions that could be taken to remove these challenges.
Reducing the number of days in which one can make a reservation. By the modeling we see that the median advance booking for cancelations is 120 days prior. Perhaps reducing reservations to three months prior would reduce this factor.
With respect to the second factor, developing an understanding of the underling causes for the special requests, may create customer affinity. This can be done through simple questionairs, pre-booking apps, or more personalized online services.
The ease of booking online, may be a reason behind its relation to cancelations. Reducing lead time may help this issue; however, online booking provides such a large percentage of overall bookings caution should be taken with any attempt to haper this service. In fact, online booking offers opportunity to collect data on customers that is not possible through offline channels. A data collection and customer affinity plan utilizing various machine learning methods should be developed and implimented.
10/18/22, 5: 58 PMLearner_Notebook_Practical_Data_Science_Practise_Project Page 40 of 40file:///Users/jeffreydavis/Desktop/Applied%20Data%20Science/Practi…rojects/Practical%20Data%20Science/Hotel_cancel_RandomForest.html
In [ ]:
