
SPECIAL TOPIC
SPECIAL TOPIC
EAGE NEWS Association forms industry partnerships
TECHNICAL ARTICLE Stochastic agent-based modelling of hydrocarbon migration
CHAIR EDITORIAL BOARD
Clément Kostov (cvkostov@icloud.com)
EDITOR
Damian Arnold (arnolddamian@googlemail.com)
MEMBERS, EDITORIAL BOARD
• Lodve Berre, Norwegian University of Science and Technology (lodve.berre@ntnu.no)
Philippe Caprioli, SLB (caprioli0@slb.com) Satinder Chopra, SamiGeo (satinder.chopra@samigeo.com)
• Anthony Day, NORSAR (anthony.day@norsar.no)
• Peter Dromgoole, Retired Geophysicist (peterdromgoole@gmail.com)
• Kara English, University College Dublin (kara.english@ucd.ie)
• Stephen Hallinan, Viridien (Stephen.Hallinan@viridiengroup.com)
• Hamidreza Hamdi, University of Calgary (hhamdi@ucalgary.ca)
Fabio Marco Miotti, Baker Hughes (fabiomarco.miotti@bakerhughes.com)
Susanne Rentsch-Smith, Shearwater (srentsch@shearwatergeo.com)
• Martin Riviere, Retired Geophysicist (martinriviere@btinternet.com)
• Angelika-Maria Wulff, Consultant (gp.awulff@gmail.com)
EAGE EDITOR EMERITUS Andrew McBarnet (andrew@andrewmcbarnet.com)
PUBLICATIONS MANAGER
Hang Pham (publications@eage.org)
MEDIA PRODUCTION
Saskia Nota (firstbreakproduction@eage.org) Ivana Geurts (firstbreakproduction@eage.org)
ADVERTISING INQUIRIES corporaterelations@eage.org
EAGE EUROPE OFFICE
Kosterijland 48 3981 AJ Bunnik
The Netherlands
• +31 88 995 5055
• eage@eage.org
• www.eage.org
EAGE MIDDLE EAST OFFICE
EAGE Middle East FZ-LLC
Dubai Knowledge Village PO Box 501711
Dubai, United Arab Emirates
• +971 4 369 3897
• middle_east@eage.org www.eage.org
EAGE ASIA PACIFIC OFFICE
EAGE Asia Pacific Sdn. Bhd.
UOA Centre Office Suite 19-15-3A No. 19, Jalan Pinang
50450 Kuala Lumpur
Malaysia +60 3 272 201 40
• asiapacific@eage.org
• www.eage.org
EAGE LATIN AMERICA OFFICE
EAGE Americas SAS Av Cra 19 #114-65 - Office 205 Bogotá, Colombia
• +57 310 8610709
• americas@eage.org
• www.eage.org
EAGE MEMBERS’ CHANGE OF ADDRESS
Update via your MyEAGE account, or contact the EAGE Membership Dept at membership@eage.org
FIRST BREAK ON THE WEB www.firstbreak.org
ISSN 0263-5046 (print) / ISSN 1365-2397 (online)
29 Stochastic agent-based modelling of hydrocarbon migration in stratigraphically complex basins
Roderick Perez Altamar
35 Sensitivity for monitoring array of Distributed Acoustic Sensors (DAS) in a vertical borehole
Zuzana Jechumtálová, Denis Anikiev and Leo Eisner
39 Colorado School of Mines’ Reservoir Characterization project celebrates 40 years with important lessons to share on carbon capture
Tom Davis
43 Fast-tracking carbon storage insights utilising holistic screening criteria for saline aquifers
Ashley Uren, Joseph Jennings and Graeme Nicoll
51 Underground gas storage and passive seismic
Stephen A. Sonnenberg
57 Utility of the Geological Carbon Sequestration (GCS) business: Potential perils and scenarios till 2150 and beyond
Ruud Weijermars
66 Calendar
Andreas Aspmo Pfaffhuber Chair
Florina Tuluca Vice-Chair
Esther Bloem Immediate Past Chair
Micki Allen Contact Officer EEGS/North America
Hongzhu Cai Liaison China
Deyan Draganov Technical Programme Officer
Eduardo Rodrigues Liaison First Break
Hamdan Ali Hamdan Liaison Middle East
Vladimir Ignatev Liaison CIS / North America
Musa Manzi Liaison Africa
Myrto Papadopoulou Young Professional Liaison
Catherine Truffert Industry Liaison
Mark Vardy Editor-in-Chief Near Surface Geophysics
Yohaney Gomez Galarza Chair
Johannes Wendebourg Vice-Chair
Lucy Slater Immediate Past Chair
Wiebke Athmer Member
Alireza Malehmir Editor-in-Chief Geophysical Prospecting
Adeline Parent Member
Jonathan Redfern Editor-in-Chief Petroleum Geoscience
Xavier Troussaut EAGE Observer at SPE-OGRC
Robert Tugume Member
Timothy Tylor-Jones Committee Member
Anke Wendt Member
Martin Widmaier Technical Programme Officer
Carla Martín-Clavé Chair
Giovanni Sosio Vice-Chair
SUBSCRIPTIONS
First Break is published monthly. It is free to EAGE members. The membership fee of EAGE is € 85.00 a year including First Break, EarthDoc (EAGE’s geoscience database), Learning Geoscience (EAGE’s Education website) and online access to a scientific journal.
Companies can subscribe to First Break via an institutional subscription. Every subscription includes a monthly hard copy and online access to the full First Break archive for the requested number of online users.
Orders for current subscriptions and back issues should be sent to First Break B.V., Journal Subscriptions, Kosterijland 48, 3981 AJ Bunnik, The Netherlands. Tel: +31 (0)88 9955055, E-mail: subscriptions@eage.org, www.firstbreak.org.
First Break is published by First Break B.V., The Netherlands. However, responsibility for the opinions given and the statements made rests with the authors.
COPYRIGHT & PHOTOCOPYING © 2025 EAGE
All rights reserved. First Break or any part thereof may not be reproduced, stored in a retrieval system, or transcribed in any form or by any means, electronically or mechanically, including photocopying and recording, without the prior written permission of the publisher.
The publisher’s policy is to use acid-free permanent paper (TCF), to the draft standard ISO/DIS/9706, made from sustainable forests using chlorine-free pulp (Nordic-Swan standard).
EAGE has been forming a number of strategic partnerships with leading industry organisations to help address the visibility needs of geoscience and engineering in the energy sector. The initiative aims to reinforce the Association’s commitment to supporting value-driven solutions, fostering innovation and collaboration, and driving progress across the sector.
bp
EAGE has entered into a four-year strategic partnership with bp to support the drive for energy transformation through cutting-edge technology and innovation. Leveraging its global network and expertise, EAGE enables industry collaboration and knowledge exchange to accelerate progress in this space.
As part of this partnership, bp will play an integral role in shaping discussions at three of EAGE’s flagship events – EAGE
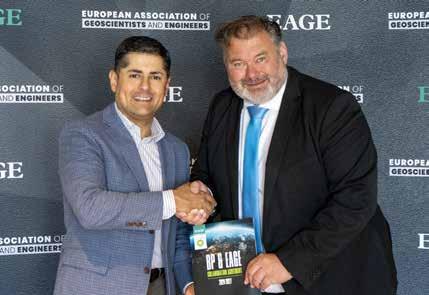
Digital 2025 in Edinburgh, EAGE Annual 2026 in Aberdeen, and EAGE GET 2027 also in the UK – driving conversations that advance the energy transition and technological innovation.
EAGE is strengthening its collaboration with SpotLight, a French seismic monitoring company, to advance carbon capture and storage (CCS) geophysics. This partnership aligns with the Association’s broader efforts to enhance CCS technologies and industry cooperation in tackling global energy challenges.
Through this collaboration, SpotLight will participate in EAGE’s CCS-focused events, sharing expertise on seismic monitoring for CCS. By working with organisations at the forefront of CCS research and development, EAGE contin-
EAGE is committed to fostering industry visibility and meaningful collaborations. These partnerships highlight its role in bringing together key industry players to drive innovation and engagement. Organisations looking to strengthen their presence in a specific area are encouraged to connect with EAGE to explore ways to contribute to and shape industry discussions.
ues to facilitate knowledge exchange and support innovation in the transition to a more sustainable energy future.
In a move to strengthen geoscience in Africa’s energy sector, EAGE is partnering with AOW Energy, a leading platform for energy companies on the continent. AOW Energy, this year in Ghana, brings together a specialist community to discuss emerging exploration opportunities, address technical challenges, and exchange expertise in energy development and resource management across Africa. Through this partnership, EAGE and AOW Energy reinforce their joint mission to drive technical excellence and industry
collaboration across disciplines. By working together, the organisations seek to elevate Africa’s role in global energy advancements, providing new opportunities for professionals and businesses in the region.
A major milestone for EAGE is its leadership role in the inaugural World CCUS Conference, set to take place in Bergen, Norway in September 2025. EAGE has been entrusted by the conference Board to lead the organisation and promotion of this landmark event. With extensive experience in professional networking and event planning, EAGE is poised to deliver a world-class conference that will help to shape the future of CCUS
technology and its role in accelerating a low-carbon future.
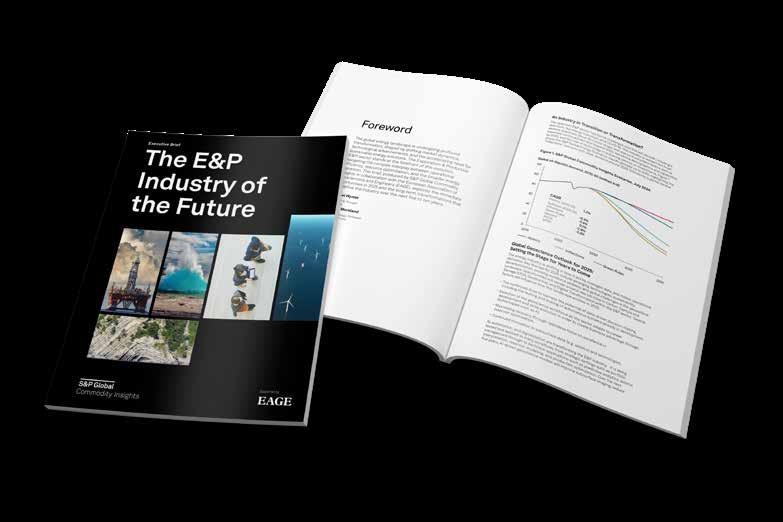
As a knowledge partner for the EAGE Annual in Toulouse (2-5 June 2025), S&P Global Commodity Insights has published an executive brief and will release a full extended report in June, providing valuable insights and expertise on the future of geoscience, technology, and energy.
In collaboration with EAGE, S&P Global’s Executive Brief analyses key trends shaping the E&P industry, offering perspectives on innovation, workforce evolution, and sustainability. The Full Extended Report will be available in June for event attendees and accessible online through EAGE and S&P Global’s digital platforms.
According to the executive brief, energy and petroleum (E&P) industry is on the brink of a significant transformation, driven by technological advancements and evolving workforce demographics. As organisations prepare for the future, understanding these changes is crucial for maximising knowledge retention and ensuring sustainable practices.
Technological innovations are reshaping the E&P landscape, offering new tools that enhance data-driven decision-making and improve operational efficiency. The integration of artificial intelligence and automation is becoming increasingly vital, allowing companies to streamline processes and optimise resource allocation. Embracing these advancements fosters innovation and positions organisations to tackle the challenges of exploration and resource discovery.
Workforce demographics are also evolving, with a new generation of professionals entering the industry. This shift necessitates a focus on skills evolution and knowl edge transfer to ensure that critical expertise is retained within organ isations. Building larger, localised teams can facilitate education and meet local content requirements further enhancing the industry’s adaptability. Additionally, fostering an inclusive culture that attracts diverse talent will be essential for driving creativity and innovation.
Sustainability and decarbonisation strategies are becoming paramount as the global energy landscape shifts towards greener practices. Organisations must prioritise these initiatives to align with societal expectations and regulatory demands. By embedding sustainability into their core operations, companies can reduce their environmental impact and enhance their competitive advantage. The commitment to sustainable development will also resonate with consumers, who increasingly favour
be defined by its ability to adapt to technological advancements, embrace workforce changes, and prioritise sustainability. By focusing on these key areas, organisations can navigate the complexities of the evolving landscape and position themselves for long-term success. Join us at the EAGE Annual in Toulouse to explore these themes and engage in discussions on the future of geoscience, technology, and energy.
DUG Elastic MP-FWI Imaging solves for three-component reflectivity, Vp, Vs, P-impedance, S-impedance and density. It delivers not only another step change in imaging quality, but also elastic rock properties for quantitative interpretation and pre-stack amplitude analysis — directly from field-data input. It’s worth reading that last sentence again!
info@dug.com | dug.com/fwi
Dr Gang Wang, assistant professor at the Institute of GeoEnergy Engineering and underground hydrogen storage theme lead at iNetZ+, Heriot-Watt University, discusses his upcoming short course on Reservoir engineering for hydrogen storage in subsurface porous media at the EAGE Annual 2025 on Sunday 1 June.
What inspired you to develop this course?
The rapid scale-up of the hydrogen value chain is crucial for advancing the energy transition. This demands not only substantial investment but also specialised technical expertise. Reservoir engineering is, and will continue to be, a vital discipline for utilising geological resources, which
may hold the key to enabling the hydrogen economy at scale. That is why I developed this course, grounded in my research, to equip professionals with critical insights into subsurface hydrogen solutions and their essential role in driving the energy transition forward.
A major challenge in the hydrogen value chain is scalable storage. Due to its extremely low density, hydrogen requires significant storage capacity for large-scale deployment. Storing hydrogen in subsurface porous media offers a unique advantage, enabling cost-effective, long-duration energy storage at scale. This is crucial for integrating and maximising the potential of intermittent renewable energy sources, making hydrogen a more viable and flexible component of the future energy mix.
What would be an example of the complexity of hydrogen storage?
A key lesson from real-world case studies is the crucial role of cushion gas design in hydrogen storage. Cushion gas maintains reservoir pressure and prevents early water breakthrough, but its mixing with hydrogen can reduce purity and recovery.
One of my field examples highlights how local high-permeability zones in the middle
PROCESSING OF MULTIPLES: CONCEPTS, APPLICATIONS, TRENDS, BY CLÉMENT KOSTOV
6 JUN STATE OF THE ART IN FULL WAVEFORM INVERSION (FWI), BY IAN JONES
of the formation create preferential flow paths during hydrogen injection, leading to non-piston flow behaviour. During the shutin period, this non-uniformly distributed hydrogen migrates upward due to gravity, causing further mixing with cushion gas and reducing purity. An effective cushion gas design helps maintain hydrogen purity by confining flow and accumulating high-purity hydrogen near the wellbore, optimised through tailored injection strategies. More details will be covered in the course.
What professional skills are involved?
The fundamental principles underlying subsurface applications, such as hydrocarbon recovery, CCS, and now hydrogen storage, are largely transferable. A strong technical foundation in subsurface science and engineering is necessary. That said, it is crucial to recognise the unique challenges associated with hydrogen. Unlike CCS, hydrogen storage must ensure temporary, safe containment while allowing for its full or near-full withdrawal in a pure, uncontaminated state. This necessitates a good understanding of multiphase and multi-component flow behaviour, reservoir geology, geomechanics, and the biogeochemical interactions involved.
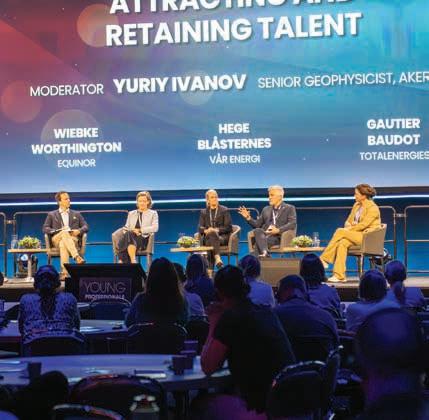
For the last few years we have been building the Strategic Programme at the Annual. In Toulouse this year we are having ten high-level sessions over the four days of the main event under the theme ‘Navigating change: Geosciences shaping a sustainable transition’.
The idea is to reflect on some of the wider issues such as oil and gas E&P in the energy transition era, the most promising transition solutions from renewables to CCS, the pace of change, the impact on the geoscience and engineering community and its workforce, and meeting public expectations for climate change mitigation. Global leaders such as TotalEnergies, bp, Chevron, Shell, Aramco, and Microsoft will be providing voices for this conversation, sharing their perspective on the status of the energy transition and where we go from here.
Here’s what awaits you:
Leadership Interview
A one-on-one conversation featuring TotalEnergies’ SVP of exploration, Kevin McLachlan, in discussion with Andrew McBarnet, EAGE emeritus editor.
Navigating change: Geosciences shaping a sustainable future
With the energy market shifting toward renewables, geoscientists remain vital in resource management and sustainable development. The session will explore how geoscience expertise will shape the future, addressing economics, technology, geopolitics, and societal attitudes over the next decade.
Role of technologies to accelerate project turn around
Despite declining investment in oil and gas technology, the demand for innovation is growing. AI and digital tools are driving efficiency, reducing costs, and accelerating exploration. The panel will highlight emerging technologies, R&D investment strategies, and breakthroughs needed to meet rising energy demand.
Responsible exploration — faster, cleaner, cheaper
The energy transition is reshaping exploration strategies. Companies are prioritising
cost-effective, low-emission field development to accelerate time-to-market. The session will discuss new approaches, seismic industry collaboration, and strategies for faster and more sustainable exploration.
Are geosciences equipped for the energy transition?
Geosciences are critical to decarbonisation efforts but risk falling behind as renewables scale up. This discussion will examine how geoscientists can remain relevant, attract new talent, and enhance their role in shaping future energy systems.
Reshaped service industry and impact on market (Senior Executive Managers’ Breakfast)
Industry consolidation and the energy transition are forcing service companies to diversify. Leaders will discuss how these changes impact the market and explore new business models, supply chain strategies, and innovations to ensure a resilient energy technology ecosystem.
technology investments
Balancing risk and reward in technology investments is increasingly challenging. The session will explore R&D funding strat egies, the role of emerging technologies, and how companies can justify high-value investments in a competitive market.
The future of energy — where are we heading?
Even if oil demand peaks by 2030, as predicted by some, hydrocarbons will remain part of the energy mix. The panel will discuss the speed of transition, challenges in developing economies, and how companies are adapting to balance energy security with low-carbon solutions.
Energy innovation through diverse perspectives
Diversity fosters innovation. By embracing different backgrounds, expertise, and perspectives, the energy industry can develop more adaptable and inclusive solutions. The discussion will explore how diversity enhances problem-solving, drives creativity, and strengthens business resilience.
Geoscience skills shortage — a threat to the energy transition?
Geoscience professionals are essential for subsurface exploration, yet workforce shortages threaten long-term energy transition goals. The session will examine how to attract young talent, invest in education, and reshape the industry’s image to ensure future expertise.
The impact of AI on future ways of working
AI is revolutionising decision-making, automation, and operational efficiency in the energy sector. Beyond technology, it is also transforming business models, leadership approaches, and workforce adaptability. This session will explore how companies can leverage AI to stay agile in a rapidly changing industry.
Stay updated with the latest speaker announcements and agenda details at www.eageannual.org. Take advantage of discounted registration fees available until 15 May 2025. We look forward to welcoming you this June.
Our Annual Conference serves many purposes, one of which is to provide a platform for students to connect, learn, and launch their careers.
Sebastian Lozada from Universidad Nacional, Bogotá attended EAGE Annual 2024 in Oslo. This is what he said: ‘These events are a great opportunity to expand your network and learn about industry developments. It’s also an incredible experience where you not only gain knowledge but also meet fascinating people and create unforgettable memories.’
Lozada’s team from the Universidad Nacional, Bogotá won a prize through the GeoQuiz that gave them entrance to the Annual in Oslo in 2024. ‘The organisers were always supportive, making the experience much easier and more enjoyable,’ he says. ‘The experience was amazing, and I enjoyed every part of the event. But if I had to choose my favourite part, it would
be the field trip. It was a unique opportunity to learn about the geology of the area and interact with students from different countries and academic levels, making the experience even more enriching and fun.’
At the 2025 Annual, the final of the GeoQuiz will again be a highlight of the Student Programme. It will also be the occasion to see the finalists of the Laurie Dake Challenge present their solutions on CO2 capture in basalts, with winners announced during the Opening Session. The student field trip will offer a geological walk through Toulouse, exploring the city’s geo-heritage and urban development. Students can also join the Exhibition Tour & Education Hunt, meet exhibiting companies, and learn about career opportunities.
Meeting people is at the heart of the event, with the Networking Café providing a space to connect with industry representatives and fellow students. Meanwhile the
Student Chapters meeting is an opportunity to exchange experiences and best practices with peers worldwide.
For those looking to jump-start their careers, the Career Advice Centre offers trial interviews with industry experts and professional portrait photography to enhance CVs.
So, if you are a student and you don’t want to miss out, we recommend you register now at www.eageannual.org.
The EAGE Local Chapter Czech Republic recently concluded its 12th competition for the best Master and Bachelor thesis in geophysics. 2024 was another competitive year for the seven Bachelors and three Masters competing for prizes in the name of Prof Vlastislav Červený, a revered seismologist who died in 2022.
Supported by INSET (as main sponsor), the Faculty of Mathematics and Physics of Charles University, G IMPULS Praha, Seismik and EAGE, the goal of the competition is to encourage young scientists from Central Europe to study and apply geophysics. Selection criteria include innovativeness, presentation of the results, and applicability to the industry.
In the Masters thesis category, MSc Franziska Heck (University of Hamburg) was chosen as the winner with the thesis ‘Using total electron content data for earthquake prediction’. The judging commission appreciated the detailed review of published methodologies, the exhaustive approach to their re-evaluation and critical thinking, combined with excellent quality of the thesis.
In the Bachelor thesis category, BSc Petr Fedorchuk (Charles University) won with the thesis ‘Seismic refraction tomography and surface waves dispersion analysis for near surface characterisation’. He was commended for the thorough theoretical analysis combined with practical data processing and critical interpretation of processed results in this well written thesis.
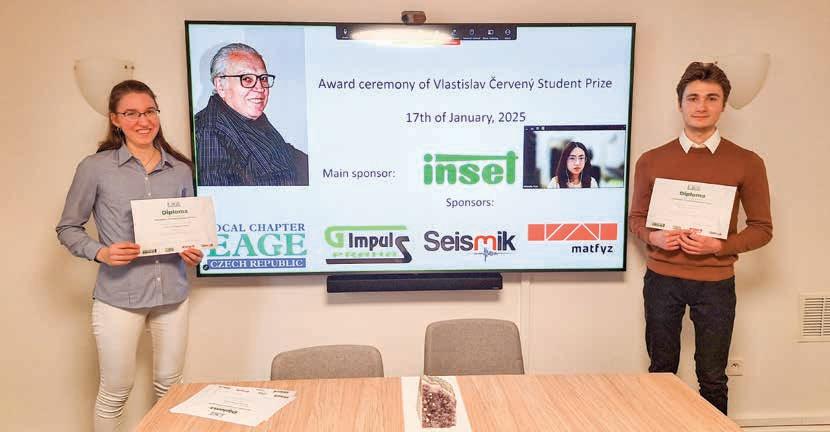
Additionally, the commission awarded an honorary mention to BSc Michelle Putri (Ludwig-Maximilians-Universität München) for her thesis ‘Palaeomagnetism of Cainozoic Volcanic Samples from Gorontalo (Sulawesi, Indonesia)’ citing her thorough fieldwork combined with the application of geophysics.
The winners received a cash prize and access to an EAGE online course of their choice to continue advancing their knowledge and skills. Details of the 2025 competition will be announced soon.
Every month we highlight some of the key upcoming conferences, workshops, etc. in the EAGE’s calendar of events. We cover separately our four flagship events – the EAGE Annual, Digitalization, Near Surface Geoscience (NSG), and Global Energy Transition (GET).
4th Carbon Capture & Storage Conference
Asia Pacific
30 June - 2 July 2025 – Kuala Lumpur, Malaysia
The three-day conference offers a crucial platform to explore the role of CCS technologies in mitigating climate change. Experience in-depth discussions on project implementation, technological advancements, policy frameworks, among many others. Connect with leading experts, industry pioneers, and policymakers from across the Asia Pacific region and beyond. Kuala Lumpur, a dynamic hub of energy innovation, provides the perfect backdrop for this essential event. Be part of the conversation driving the deployment of CCS.
Discounted registration fees available until 20 May 2025.
Sixth EAGE Borehole Geology Workshop
22-24 September 2025 – Montpellier, France
Under the theme Advancing borehole geology: Integrating multi-disciplinary approaches, we will once again bring together the geoscience community to exchange knowledge, share best practices, and explore the evolving frontiers of geoscience and technology in borehole geology. Building on the original scope of this workshop series, the focus will be on bridging the gap between 1D borehole data and 3D Earth digital models. This will include discussions on the latest technological advancements, innovative applications, and the expanding role of borehole geology across key industries such as energy, mining, and environmental sciences.
Abstract submission deadline: 7 April 2025.
7th EAGE International Conference on Fault and Top Seals 14-18 September 2025 – Bucharest, Romania
Prime topic will be faults and top seals and their roles in the energy transition, and how to foster collaboration essential for disseminating and advancing our knowledge and reducing uncertainties in future applications. Cross-industry collaboration is a game-changer, according to conference chair Sarah Weihmann (RWTH Aachen). Latest advances using diverse approaches, such as outcrop analogues, laboratory analysis, framework and reservoir modelling, and simulations will be presented. The conference also features a field trip in the Carpathians foothills, a classical study area for deciphering salt tectonics.
Abstract submission deadline: 30 April 2025.
First EAGE Workshop on Geophysical Techniques for Monitoring CO2 Storage
21-22 October 2025 – Toronto, Canada
The focus is on the application of geophysical methods in CO2 storage, including low-cost monitoring solutions, fibre optics, and debate between active versus passive monitoring. Topics include comparison of onshore and offshore storage sites, exploring different risk profiles, regulatory governance, and site-specific monitoring challenges as well as addressing how early stages of CO2 storage development influence monitoring strategies. By comparing large-scale projects to smaller BECCS (Bioenergy with Carbon Capture and Storage) initiatives, attendees will gain insights into the technical and regulatory considerations of various storage environments.
Abstract submission deadline: 15 June 2025.
As part of the EAGE Near Surface Geoscience Conference & Exhibition (NSG) annual event, this year in Naples on 7-11 September, we are introducing the 1st Conference on Geohazards Assessment and Risk Mitigation.
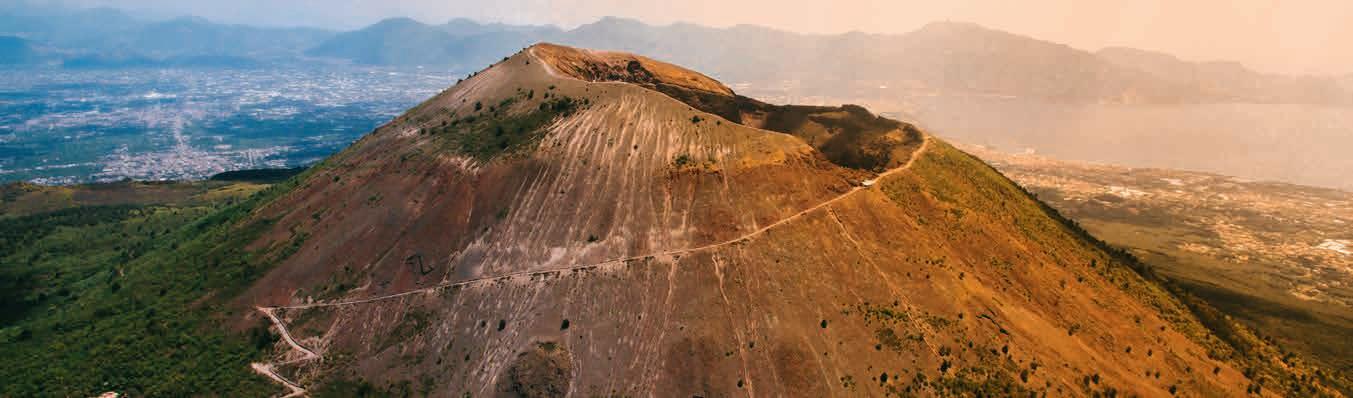
This new conference aims to serve as a critical platform for discussion of the increasing impact of geohazards, including earthquakes, volcanic eruptions, landslides, rock and debris falls, floods, coastal erosion, and others. These risks have become more frequent and severe due to climate change and rapid urbanisation. The choice of Italy, particularly the region around Naples, as the location for this inaugural event is highly appropriate. The region has a unique geological structure and a long history of vulnerability to natural hazard events, including eruptions from Mount Vesuvius and regional earthquakes.
The conference will cover a broad range of topics in geohazards assessment and risk mitigation including those faced in marine and offshore industries in the era of energy transition. Discussions will explore the application of AI and machine
learning in geohazards research and innovative methods for data acquisition and geohazards studies. Experts will examine integrated monitoring and characterisation of hazardous sites, the effects of climate and environmental changes on geohazards, and multi-disciplinary approaches for geohazard assessment and risk mitigation strategies including inland, coastal, and offshore sites. Forecasting and early warning systems will be a key area of focus as will integrated techniques for advancements in instrumentation and remote sensing for geohazards studies, and the broader impact of geohazards to ensure project feasibility and success, minimising risk on the environment and society.
Putting the spotlight on geohazards is urgent given that in recent decades, more than 4 billion people have been affected
by disasters caused by geohazards. The economic and human costs of these events are immense, making it clear that proactive preparation is far more effective and cost-efficient than reactive recovery. Most importantly, strategic planning and risk mitigation can save countless lives.
EAGE’s recently formed Technical Community on Geohazards will support the conference, offering expert insights and fostering collaborative discussions on mitigating these pressing risks. Joining this community is essential for professionals looking to stay at the forefront of geohazards research and risk mitigation strategies. More information on the Community can be found on the EAGE website.
For more details on the 1st Conference on Geohazards Assessment and Risk Mitigation in Naples, see www.eagensg.org.
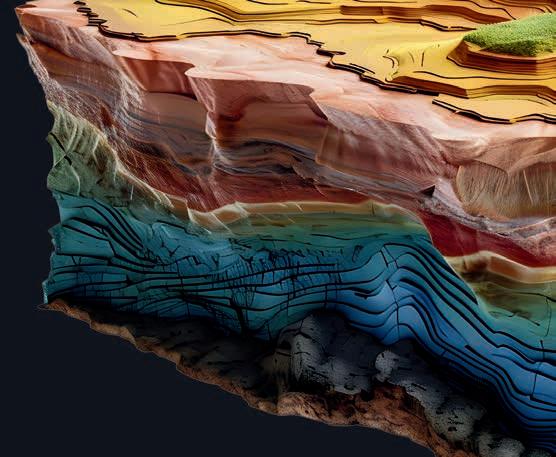
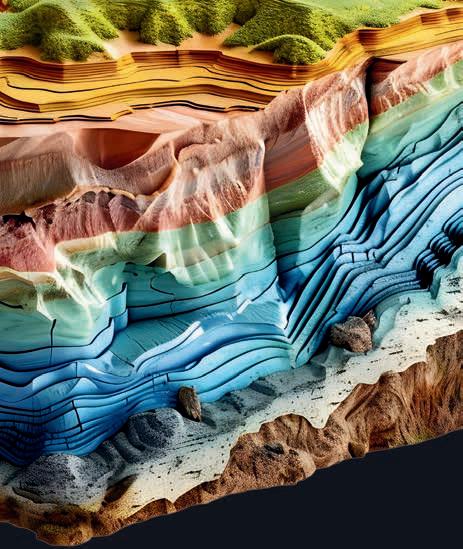
Iain Stewart, professor of geoscience communication, University of Plymouth (UK), introduces a new EAGE initiative.
Two decades ago, a Caltech professor of geophysics, David Stevenson, presented what he called a ‘modest proposal’: a mission for a small communication probe to descend to the planet’s core. His provocation was partly tongue-in-cheek; he knew it was technically impossible. But it conveyed a more serious point. Above us, our space probes had ventured many billions of kilometres into a realm that was mostly empty, mostly unknown, and about 1057 times larger by volume than our planet. Below us, our Earth probes – drill holes – had penetrated only some 10 km into the planet’s skin, yet that realm was crammed with interesting stuff (and also still mostly unknown, despite its much
what is just beneath their feet. Modern geological science has built up a pretty detailed picture of what lies below, but the obscurity and complexity of that scientific endeavour ensures that most people remain completely oblivious to our modern understanding of the planet they live on. The language that we use to describe that geological underworld is codified and arcane, the ways that we represent it is generally abstract and opaque, and the relevance that it has for ordinary people’s lives is too often remote and peripheral.
Essentially, the public (mis)understanding of the geological subsurface is a communication problem. To most people, the geological subsurface is not only an
greater proximity to us).
The geological subsurface ought to be the new frontier for human exploration. In contrast to the vast barren emptiness of the heavens above, the geological subsurface holds the raw ingredients for much of the modern world: the metal and mineral resources to build our cities and their infrastructure, the energy sources to power that development, and the natural storage spaces to take our waste.
And yet, 20 years on, thanks to the enduring popular lure of the cosmos, both public and policy makers still seem to know more (and care more) about the far reaches of the universe than about
unfamiliar environment, it is an alien world – conditions beyond the comprehension of the everyday experience and consciousness. The so-called ‘land below ground’ lies out of public sight, and therefore, out of mind. Conveying that world – conceptually and visually – requires a substantial intellectual and practical effort. It involves re-setting the conventional narratives that we tell about the subsurface, re-storifying the scientific and technological challenges that geoscientists face, and re-imagining the societal impacts and benefits that our subterranean knowledge might offer. The science of the subsurface offers new human narratives – groundwater provision
in Africa or the sustainability of ‘the critical zone’ that underpins our food security and biodiversity. The long-term viability of our advanced way of living will not be possible without the wise exploitation and stewardship of that ‘hidden commons’ below.
In short, modern geoscience needs better ‘Earth stories’ and geoscientists – the narrators of the planet’s ancient past – need to become better storytellers to translate dry, abstract technical information into compelling narratives that resonate with non-geoscience audiences and help them navigate future energy trajectories.
EAGE’s new community on Geoscience Communication and Public Engagement aims to bridge this gap. This initiative brings together geoscientists, educators, and communication experts to transform how we engage the world with the science beneath our feet. By fostering collaboration, sharing innovative storytelling techniques, and rethinking the way we present geoscience, we can make the geological subsurface as fascinating and relevant as the cosmos.
If you too are passionate about improving public understanding of Earth’s hidden depths, join us in shaping new, powerful visions that inform, inspire, and drive meaningful conversations about our planet’s future.
You can join the community by updating your EAGE affiliations and via LinkedIn by scanning the QR code.
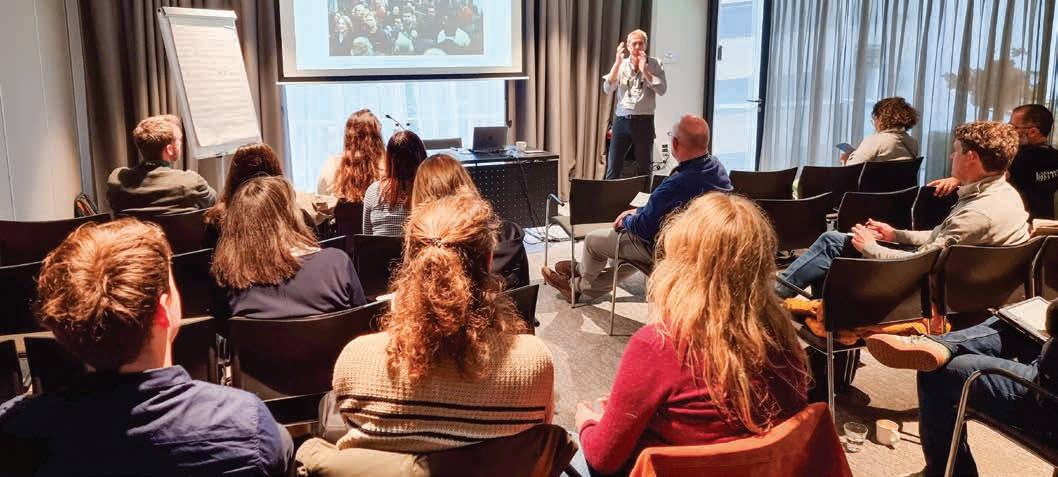
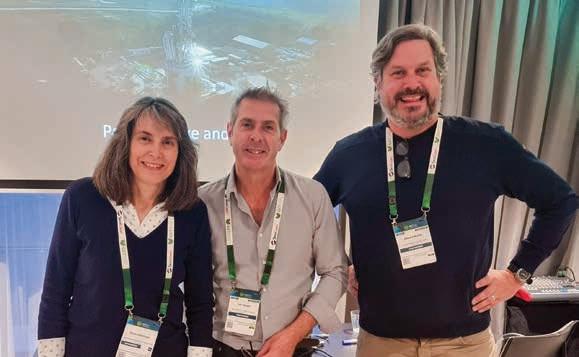
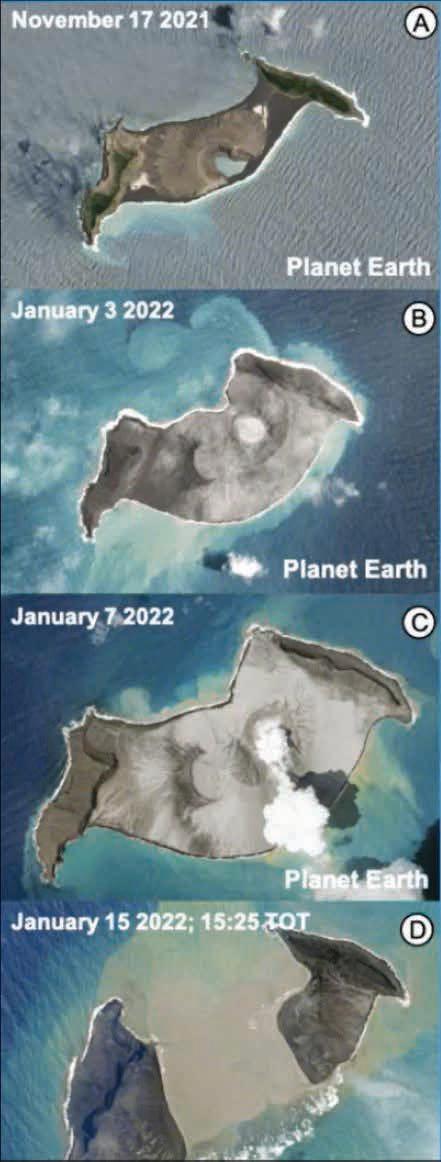
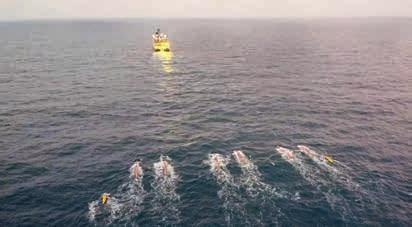
For its first lecture of the year, Local Chapter London invited Dr Isobel Yeo and Dr Mike Clare, marine researchers at the National Oceanography Centre, UK, to present their study of the monstrous eruption of a mostly submerged Hunga volcano in the South Pacific Ocean offshore Tonga, an event which left its mark on our planet.
The extraordinarily powerful eruption triggered a tsunami that jumped across continents, a pressure wave that travelled several times around the world and created an eruption plume that shot through the atmosphere. The researchers showed how offshore surveys performed just months after the major eruption offered a full picture of the scale and profound impacts of the eruption on the seafloor.
As the eruption column collapsed, powerful flows of volcanic material plunged into the ocean, scouring deep gullies, and causing extensive damage to critical seafloor cables; cutting communication links to an entire country
at a critical time for disaster response. The timing and locations of cable breaks revealed that these unusually powerful flows travelled at high speeds (up to 122 km/hour) and over long distances (>100 km).
Hazards such as submarine landslides have continued to occur years after the initial event as a result of thick piles of sediment on the steep volcano flanks becoming destabilised by earthquakes.
Drs Yeo and Clare discussed how these findings can help understand hazards at other submerged volcanoes worldwide, how monitoring can help to address outstanding hazard blindspots, and how to enhance the resilience of critical seafloor infrastructure that keeps the internet and global communications running.
The recording of this lecture is available on the EAGE YouTube channel. To recognise the importance of research work and latest developments on future hazard mitigation strategies, a focus on geohazard assessment and risk mitigation has been added to the EAGE Near Surface Geoscience conference taking place in Naples this year where global experts including from the London community will converge. LC London renews the invitation to join the conversation in September by submitting an abstract by 1 May.
The mysterious, globally observed and unprecedented nine-day long seismic signal that captured scientists’ attention in September 2023 was the subject of the most recent talk at LCAberdeen. David Cornwell (Aberdeen University) described how it took the collaboration of over 70 scientists around the world combining a wealth of geophysi-
cal and geospatial data clues to find the reason for this event.
The explanation turned out to be the staggering 25 million m³ of rock and ice that collapsed into the remote Dickson Fjord in Greenland. This triggered a massive 200 m high mega-tsunami that continued sloshing back and forth in the narrow fjord for nine days,
a phenomenon known as a seiche. The findings revealed that the movement of such a vast mass of water generated vibrations powerful enough to travel through the Earth, sending seismic waves detectable across the globe. Never before have scientists recorded such an unusual mechanism causing a global seismic signal.
Dr Petr Tábořík, an internationally recognised expert in electrical resistivity tomography (ERT) in morphological studies, was this year’s first guest speaker for EAGE Local Chapter Czech Republic.
Currently a researcher at the Institute of Rock Structure and Mechanics of the Czech Academy of Sciences, Dr Tábořík discussed ‘Geophysical
investigation of active faults in the San Andreas Fault Zone (Southern California) and active landslides in the Cascadia Subduction Zone (Oregon)’. The presentation was based on research during a Fulbright scholarship in the USA in 2024 and provided valuable insights into his collaborative work with research groups in San Diego.
The core of Dr Tábořík’s talk focused on ERT measurements conducted at various sites within the San Andreas Fault Zone in Southern California, one of the most significant and closely monitored fault systems in the world, comparing his findings with data from other teams using seismic surveys and dilatometers. The strong potential
of ERT in identifying surface manifestations of deep tectonic structures, particularly seismic faults was highlighted.
Dr Tábořík then described geophysical studies of active landslides in the Cascadia Subduction Zone in Oregon. His research demonstrated the critical role of ERT in geological surveys of these landslides, some of which pose risks to existing road infrastructure. The resulting cross-sections revealed the complex structure of the landslides, underscoring the importance of ERT in analysing their dynamics and behaviour.
LC Czech Republic looks forward to an engaging series of discussions during the year and invite all interested members to join.
Shi Yuan Toh explains how being a committee member of the Young Professionals Special Interest Community can serve your career goals.
I first joined EAGE as an undergraduate, not realising how much it would shape my path forward. Looking back, those early days of membership gave me exactly what I needed as a budding geoscientist – a window into the real world of the profession and connections with people who shared my fascination with the field.
The real value came from the people I met at conferences and workshops. Seeing established professionals present their work and chat with students like me showed me what was possible in this field. It pushed me to think bigger about my own future. The organisation wasn’t just a line on my resumé; it became a bridge between classroom theories and real-world applications, helping me understand where my studies could actually take me.
Now, as a young professional on the EAGE committee, I’ve had the chance to give back. Last year’s EAGE GET event stands out in my mind. I volunteered alongside other young professionals, Carrie Holloway and Tie Xing, to help run the programme. There’s something energising about working with peers who are just as passionate about advancing geoscience education as you are. Whether we were handling logistics, chatting with
attendees, or moderating sessions, the whole experience reminded me why I love this field.
That volunteer experience taught me more than I expected. Beyond just improving my soft skills, it opened my eyes to how different people approach challenges in our industry. I got to learn from professionals at all career stages, each bringing their unique perspective to the table. It was fascinating to see how education and training methods evolve to keep pace with industry developments.
EAGE has been there through every stage of my journey so far, from confused undergraduate to budding researcher. The resources and community support have been invaluable in shaping both my professional goals and research direction. I’m excited to see where this community takes me next, and to keep contributing however I can along the way.
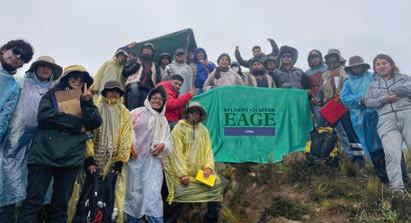
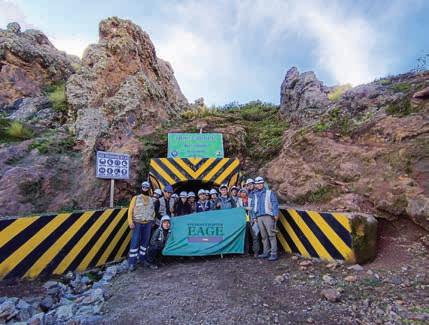
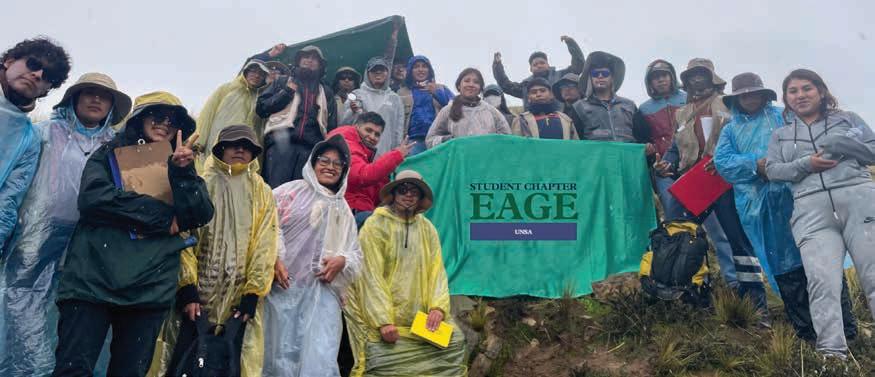
EAGE UNSA Student Chapter (Peru) recently conducted a structural geology workshop in the Puno region, famous for Lake Titicaca, said to be the highest navigable lake in the world. The workshop combining virtual theoretical sessions with field trips to three geologically significant locations: Azoguini Hill, the Pomperia Mine, and the geotouristic site of Aramu Muru. This five-day event aimed to strengthen participants’ technical skills in analysing geological structures, field mapping, and processing structural data using cutting-edge tools and methodologies.
At Azoguini Hill, a site known for its structural complexity and potential for studying faults and deformations, students were introduced to the Brunton compass, learning to measure parameters such as strike, dip, pitch/ rake, plunge, and trend. Such measurements are crucial for interpreting the orientation of rock layers and geological structures.
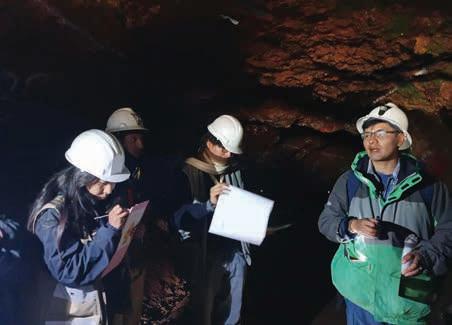
The second day focused on exploring the Pomperia Mine, a deposit known for its barite and hematite mineralisation. Here students were invited to identify the host and roof rocks and measured their inclination using the compass. Anaconda mapping techniques, commonly used in porphyry deposits, were applied, and evidence of low-sulfidation epithermal systems, such as banded jasper, chalcedony, and silica, was identified.
The final field day focused on fold analysis and a visit to the geotouristic site of Aramu Muru. In the rock for-
mations, hinges and inflection points in folded structures were identified using stereonets and maps to plot these features. The exercise helped participants understand the geometry and kinematics of folds, as well as their relationship to regional tectonic stresses.
At Aramu Muru, located in the Lower Puno Formation, a major fault caused a change in the orientation of the rock layers. Students were able to analyse the phenomenon in detail, and so understand how tectonic events can alter the original rock structure.
Through events like this, the EAGE UNSA Student Chapter reinforces its mission to support students in their professional development and its vision of being a benchmark for academic excellence in the geosciences field.
For more information about future events, you can contact the EAGE UNSA Student Chapter at eage.studentchapter.unsa@gmail.com.
The EAGE Student Fund supports student activities that help students bridge the gap between university and professional environments. This is only possible with the support from the EAGE community. If you want to support the next generation of geoscientists and engineers, go to donate.eagestudentfund.org or simply scan the QR code. Many thanks for your donation in advance!
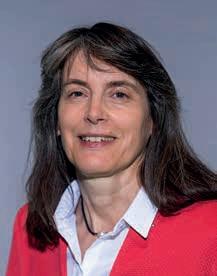
Raffaella Ocone began life in a small hilltop Italian town. She has been professor of chemical engineering at Heriot-Watt University since 1999, the first female professor of chemical engineering in Scotland and second in the UK. She serves as co-lead of the hydrogen theme within the iNetZ+ Global Research Institute (GRI). Recipient of numerous academic and achievement awards including in her native Italy, she becomes 84th president of the Institution of Chemical Engineers (IChemE) in June.
I grew up in a small rural town in southern Italy. From an early age, I loved school, with mathematics quickly becoming my favourite subject. My greatest aspiration was simply to read but I was practical enough to realise this alone would not pay the bills. I then thought to become a shepherd: my sheep could graze peacefully while I immersed myself in my books. Although my parents never attended university, they strongly believed in the value of education. I hope I inherited my mother’s curiosity and imagination, qualities essential for an academic career. My father had the engineer’s skills and attitude, always able to find a practical solution. I realise that he was my very first role model.
Why chemical engineering?
In high school, I discovered chemistry. It felt like an extension of maths, with chemical reactions governed by logical rules. Growing up in a small town, I was the first woman to study engineering. Despite consistently being at the top of my class, my decision was met with scepticism. But the more people doubted my ability to succeed, the more determined I became to prove them wrong.
Academia came by chance. When I enrolled in chemical engineering at the Università di Napoli there were only five of us women. This soon dissolved into three. I often felt insecure, especially com-
ing from a small town. A world-renowned professor in the department was to supervise my final thesis. His first words to me were: ‘Miss, are you sure you want to work with me? The project I can offer is very difficult, are you certain you can handle it?’ I was furious. But I refused to be intimidated, went back and told him I would accept the challenge. It was the best decision of my career, my undergraduate research was published, and thanks to his advice I ended up at Princeton.
Princeton was an immense challenge. I was the only Italian in the chemical engineering programme, my class was evenly split between American and Greek students. The experience taught me invaluable lessons: that perseverance could take me anywhere and that academia was where I truly belonged.
I guess my work in chemical reaction engineering of multi-component mixtures, research begun while working with my former undergraduate supervisor. We studied complex reaction systems, including thermal and catalytic cracking of oil cuts and hydrodesulfurisation processes. The work proved to be of crucial interest to the petrochemical industry and was later adopted by oil companies in the US, extending to refinery process management providing a more rigorous and systematic approach to handling complex reaction systems.
For a long time, I believed that discrimination against women in academia did not exist. In hindsight, I realise that I was in denial. We are still not where we should be, especially when it comes to promotions and leadership roles. However, I also firmly believe that focusing solely on gender is a mistake. Diversity takes many forms. In one way or another, we are all diverse, and without diversity, there can be no real progress.
Twenty years ago, I was invited to join a Royal Academy of Engineering committee focused on the teaching of ethics in engineering, a great opportunity to show to my philosopher brother that engineers can do ethics, whilst philosophers cannot do engineering! Anticipating the use and potential misuse of emerging technologies is not always straightforward, which is why ethics should be embedded in engineering education.
Reading is my preferred pastime (I do not own a television), with mystery and crime stories my favourites. Solving a mystery like maths, requires starting with data, following logical steps through deductive reasoning, and ultimately (hopefully) arriving at the correct solution. Beyond reading, I also love hiking and classical music (but limited success playing piano).
BY ANDREW M c BARNET
Samuel Goldwyn, a legendary Hollywood movie mogul, once quipped. ‘We want a story that starts out with an earthquake and works its way up to a climax’. Hopefully that’s not what we are witnessing with the current eruption of change in the energy landscape.
In the last few months government and industry leadership around the world have been noticeably adopting a more explicit pushback back on the net zero 2050 schedule and the means for getting there and a more vocal appreciation of the continuing need for oil and gas. It all adds up to a big shakedown of previous assumptions about where global energy supply and demand is heading, complicated by the disruptive influence of US energy strategy going forward.
Tempting as it is, not all the blame can be heaped on the newly elected US President Trump. In fact his early energy-related executive orders (EOs), disruptive as they may be, were telegraphed during his election campaign encompassed by ‘Drill, baby, drill’ the populist slogan first mouthed by the now forgotten failed vice-presidential candidate Sara Palin.
sentiment revoking all pre-existing mandates directing agencies to advance environmental justice (EJ) and require agencies to terminate all offices dedicated to EJ or ‘equity’.
Specifically with regard to US hydrocarbons production, the EOs are mostly shock and awe to please some sectors of the US electorate. In reality the impact may not be that significant, although encouraging to the oil business to know that the government is on its side. Despite the grumbling about over-regulation, the Biden Administration authorised a historic number of leases for oil drilling in the US in 2023. US oil and natural gas production also reached record highs in 2022 making it the world’s largest producer of crude oil with the highest level of refining capacity, producing a world record-breaking average 12.9 million barrels per day in 2023. It has also been the largest exporter of LNG, with an average export volume of 11.9 billion cubic feet per day in 2023.
‘Little to warrant emergency measures’
So it was expected that the US would immediately withdraw from the 2015 UN Paris climate accord (although even Darren Woods, CEO, ExxonMobil, protested this). To add salt to the wound, it has quit the Just Energy Transition Partnership (JETP) and cut its contribution to the $45 billion international initiative launched at the Glasgow COP26 climate summit to support several developing countries in their shift away from coal to clean energy.
Other headline EO directives included various deregulation measures to ‘unleash America’s affordable and reliable energy and natural resources’, lifting restrictions on LNG exports, promoting energy development in Alaska, pausing of offshore wind development and reversing the electric vehicle promotion mandate of the Biden administration (surprising given the president’s embrace of Elon Musk, CEO of Tesla, and his federal bureacracy chainsaw man). Two further EOs couldn’t resist some anti-woke
As analysts have pointed out, there seems little to warrant emergency measures. The US could in fact contribute to a potentially looming global oil glut exerting down pressure on the price of oil. That could bring relief at the gas pumps for US consumers in accordance with Trump’s wishes. However it reduces the incentive for any serious investment by oil companies in the near future, notwithstanding the newly created National Energy Dominance Council tasked with clearing the way for more US oil and gas production.
The US Energy Information Administration suggested in March that ‘oil inventories will build and place downward pressure on crude oil prices in late-2025 and through 2026 when we expect OPEC+ to unwind production cuts and non-OPEC oil production grows. It said: ‘As a result, we forecast the Brent crude oil price will fall to an average of $68/b in 2026’. No reference was made to the potential economic mayhem or otherwise likely from the Trump Administration’s tariff war antics against Canada, Mexico, China and the EU. For that you have to go to OPEC+.
OPEC+ confirmed in March its commitment to gradually unwinding its 2.2 million b/d voluntary cuts through to December
next year but emphasised the pre-cautionary nature of this strategy in line with maintaining a stable market. It is sticking to its demand growth projection of 1.4 million barrels per day for 2025 and 2026, and said it expects the global economy to grow by 3.1% this year and 3.2% next year with strong demand from the air travel and automotive industries. Uncertainty arising from the Trump administration’s tariff plans will ‘contribute to volatility’. OPEC+ said it expects the world economy to adjust. ‘It remains to be seen how and to what extent potential tariffs and other policy measures will play out. So far, they are not anticipated to materially impact current underlying growth assumptions, but the outcome of potentially further rising uncertainties and the scope and significance of potential tariffs and other policy measures will need close monitoring.’
Averaging the many forecasts available, the assessment seems to be that, without a major trade war, stockmarket crash, etc leading to recession, the oil price will hover precariously around the $70 a barrel mark for the next year or two with, if anything, a tendency to go lower, but no indication that the world is losing its appetite for oil.
This is not a good omen for rapid steps towards energy transition when taken in assocation with a generally cautious view of growth potential in the world economy following a limited rebound from the pandemic. For example, many OPEC+ members rely heavily on oil revenues to maintain their economies at a sustainable level, making substantial green investment a luxury they cannot afford. The situation is much worse for developing countries without an oil buffer. As Ruud Weijermars implies (Special Topic article in this issue), in the current economic climate with competing demands on their budgets, European countries may also baulk at the cost-effectiveness of a major decarbonisation investment such as carbon capture and storage and lack the political will required to achieve it.
31% that felt this way in 2024. Similarly, only 32% expect it by 2050. On average, oil and gas executives anticipate peak oil around 2038, a clear signal that sector leaders expect legacy assets to play a crucial role in meeting energy demand for the foreseeable future’.
Bain & Co says: ‘The era of enthusiasm for environmental, social, and corporate governance–driven investment is giving way to a harder-nosed focus on ROI. Tighter budgets, constrained balance sheets, and rapidly rising capital costs are forcing companies to make tough calls about where to place their bets.’
A similar story comes from a report from Fitch Group’s BMI unit (quoted by Rigzone). It cites some major companies which had set ambitious goals for renewable energy investment and achieving net zero goals, and are now revising their commitments. ‘Equinor halved its low carbon investment from $10 billion to $5 billion. bp has abandoned its 2030 oil output reduction target and is divesting its US onshore wind business. Shell has weakened its carbon reduction targets and is investing in Bonga North deep-water oil and gas project in Nigeria.’
‘Euro Majors’ cutbacks broadly mirror the global trend’
The Euro Majors’ cutbacks in low-carbon investment broadly mirror the global trend, according to a recent Wood Mackenzie commentary. After diverging for years, US and Euro Majors’ spend on low carbon is now converging at around 10-15% of total investment.
There are voices just as potent as President Trump’s that seek to normalise the oil industry’s outlook. At this months’s CERA Week international meeting in Houston, Saudi Aramco CEO Amin Nasser called for a ‘reset’ to acknowledge that demand for oil and gas is not going to be replaced soon. He called the ambitious timetables put out by consumer and environment groups a ‘fantasy’, and that there was more chance of Elvis (Presley) speaking after him at the meeting than current energy transition plans succeeding.
With pressure on margins, major oil companies have been reassessing their priorities, and particularly the value of investing in decarbonisation markets. They are clearly choosing to focus on their core business for two main reasons. Firstly, the pace of transition has been slower than anticipated, meaning the timing of the decline in demand for oil and gas is constantly being deferred. Secondly, green initiatives do not make sufficient return on investment to satisfy stakeholders. How much impact this will have on energy transition is unclear since the oil industry is not the only player in the game, but its investment dollars are obviously very significant.
Reports from two industry analysts seem to sum up the prevailing view. Bain & Company’s 2025 Energy & Natural Resources Executive Survey of 700 executives in oil and gas, utilities, chemical, mining and agribusiness found nearly half (44%) of energy and natural resources executives now expect the world to reach net-zero emissions by 2070 or later, a steep jump from the
The big picture, according to Wood Mackenzie is that investment in power and renewables, upstream oil and gas and critical metals for the transition are continuing to rise to a record $1.5 trillion, a 6% increase. Low carbon’s share of the total jumped from 32% in 2015 to 50% in 2021 but has stalled since and won’t increase on its forecasts until the end of the decade, thereby not anywhere meeting the Paris Agreement goals.
Thanks to the scale of the NOCs’ cash generation, overarching national targets to decarbonise and aspirations to diversify their economies away from oil and gas, Wood Mackenzie suggests NOCs will carry the low-carbon torch for the oil industry in the next stage of the energy transition. Between them Saudi Aramco, ADNOC, Petrobras, Petronas, PetroChina, CNOOC and ONGC are said to be planning to invest more than $20 billion a year through 2030 ‘albeit for many of these industry giants, it’s a much smaller proportion of free cash flow’.
In these times we must expect the unexpected.
Views expressed in Crosstalk are solely those of the author, who can be contacted at andrew@andrewmcbarnet.com.
Viridien has reported healthy fourth quarter results in a vindication of the asset light model that the company has put in place over the last few years.
As seismic companies with asset-heavy models continue to struggle because of the strict spending discipline imposed by the oil majors in 2024, Viridien reported a fourth quarter net profit of $29 million on revenues of $427 million compared to a net loss of $25 million on revenues of £265 million in Q4 2023. Operating profit was $49 million compared to an operating loss of $11 million in Q4 2023.
By contrast the asset-heavy Shearwater GeoServices has reported a net loss of $39 million on greatly reduced fourth quarter revenues of $104 million. TGS, meanwhile, which last year acquired PGS and its fleet of seismic vessels, has reported much improved fourth quarter net income of £38 million on revenues of $493 million. All companies reported a healthier pipeline of projects for 2025 in their results statements.
At Viridien, Digitial, Data and Energy Transition Q4 revenue was £238 million, up 10%. Orders are up for 89% year on year. ‘New Businesses in GEO confirm the positive market dynamics in carbon sequestration with several projects in Norway, US Gulf and in Asia Pacific, as well as in Minerals & Mining with the award of programs in Australia and Oman,’ said the company’s results statement.
Earth data revenue of $131 million was up 27% year on year. Prefunding grew by 6% to £205 million. After sales grew by 25% to $178 million. Capex was $252 million, including the large Laconia Ocean Bottom Nodes (OBN) project in the US Gulf, and the North Viking Graben streamer survey in Norway.
Sensing and Monitoring Revenue of $100 million was down by 16% year on year. New businesses in SMO experienced ‘strong momentum, with deliveries for the geothermal market and infrastructure monitoring.
Sophie Zurquiyah, chief executive officer of Viridien, said: ‘In 2024, we met our revenue and exceeded our profitability and cash generation targets driven by strong commercial success at Geoscience, a dynamic performance at Earth Data in both our key basins and prospective regions and the continued focus on operational efficiency at Sensing & Monitoring.
For the full year of 2024 Digital, Data & Environment revenue was $787 million (+17%). Revenue growth for Sensing & Monitoring was $330 million. Revenue growth for New Businesses was 33%, exceeding Viridien’s 30% target.
Net Cash flow was $56 million, including $(75) million contractual fees from vessel commitments. Viridien confirmed its 2025 target of $100 million of net cash generation, putting the company in a good position for balance sheet deleveraging this year, according to Zurquiyah.
Looking to 2025, Viridien said the E&P Capex environment is expected to be stable year on year. Offshore exploration is gaining momentum in key regions such as the US Gulf, Brazil, Norway as well as frontiers areas such as the Equatorial Margin and the East Mediterranean Sea. Middle East growth is expected with investments in advanced imaging and digital solutions. Demand is expected to be strong for high-end geophysical technologies, such as OBN and Full Waveform Inversion (FWI).
There is expected to be continued market growth in carbon sequestration and storage with new imaging contracts from oil and gas operators. There will be increased interest from the minerals and mining sector for subsurface characterisation. The infrastructure monitoring market will continue to increase by double digits.
‘Thanks to 2024 financial performance and the favourable debt market, our bond refinancing could be realised in 2025,’ said Viridien.
Shearwater Geoservices and TotalEnergies have signed a three-year agreement for worldwide marine seismic streamer acquisition services.
The capacity reservation agreement (CRA) guarantees a minimum of 18 vessel months of activity for Shearwater’s highend seismic fleet.
‘The CRA reflects the longstanding relationship between TotalEnergies and Shearwater straddling geophysical data collection and analysis, supporting exploration effort, production monitoring and carbon capture and storage activities,’ said Irene Waage Basili, CEO of Shearwater. ‘This capacity agreement is
the first of its kind with a major E&P company. This strategic CRA will in addition to providing valuable visibility for both parties and utilisation for Shearwater, also offering a great platform for potential further collaboration across other services in our portfolio. Our aligned interests and a focus on new frontier areas makes us a very complementary fit.’
Shearwater is already carrying out an ocean bottom node (OBN) survey for TotalEnergies over Block 32 in the Louro and Mostarda fields. It is also currently working on a contract for TotalEnergies offshore Angola.
TGS has completed reprocessing of the Block 16 GeoStreamer MC3D seismic dataset in Angola’s Lower Congo Basin, in partnership with Agência Nacional de Petróleo, Gás en Biocombustiveis (ANPG).
‘Exploration in the deepwater Lower Congo Basin has experienced a resurgence in recent years, with numerous significant discoveries being made and rapidly brought on stream,’ said TGS. ‘This 3684 km2 rejuvenation project utilises modern depth processing workflows to deliver enhanced imaging beyond the original data, enabling detailed evaluation of deeper target plays in both post-salt and pre-salt sections.’
Angola’s Block 16 has remained largely underexplored since the early 2010s, with the most recent exploration well drilled in 2013, added TGS. ‘Until recently, publicly known oil and gas discoveries within Block 16, as imaged by this dataset, were limited to the Bengo (1994) and Longa (1995)
Upper Miocene finds in the northern section. However, a recent re-evaluation of wells in the Lower Congo Basin has identified oil recovery from Upper Miocene reservoirs in the southern part of the survey area.’
STRYDE has won a contract to supply 42,000 autonomous nodes to Smart Seismic Solutions (S3).
The nodes will be deployed on a 3D high-density seismic survey for the CarbonCuts carbon dioxide (CO2) storage project onshore in Denmark.
The CarbonCuts project is a high-profile initiative aimed at identifying optimal onshore subsurface storage solutions for CO2 sequestration, said STRYDE.
The seismic survey will be crucial in advancing Denmark’s ambitious goal of achieving net-zero emissions by 2045, utilising advanced seismic technology to map geological formations.
‘CO2 storage on land is significantly more affordable than offshore options and increasingly accessible for a wider range of emitters,’ said STRYDE. ’The survey will advance Denmark’s goal of achieving net-zero by 2045.’
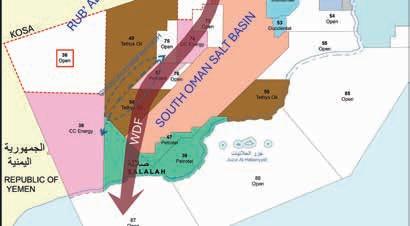
The Sultanate of Oman has launched a 2025 licensing round with three onshore blocks are on offer.
Blocks 36 and 66 border Saudi Arabia along a zone where the geology is transitioning between ‘typical’ South Oman Salt Basin (SOSB) and the Rub’ Al-Khali Basin This is in the vicinity of the compressional ‘Western Deformation Front’ (WDF), which was recently tested in Tethys Oil’s Kunooz-1 well.
‘Whilst we retain a deep interest into the Cambrian collisional tctonics within the WDF, these blocks will primarily focus on the younger Safiq Group Play (within the Haima Supergroup) and will revolve around the proven Silurian Sahmah Formation hot shale source rock (and seal)’, said Oman’s Ministry of Energy and Minerals.
‘The underlying Hasirah Fm sands represent a proven reservoir target, and younger sands within the Gharif and Al Khlata Formations also have potential, at least in Block 66. The primary challenges will lie in defining subtle trap configurations, especially for pinch-outs, together with the mapping of effective top seals. In addition, the top-seal capacity of the Sahmah shales will need to be circumvented if the Permian is to come into play, said the ministry. Both Circle Oil (Block 49) and Maersk (Block 48) have historically pursued these plays on the same trend. ‘Circle exited in 2015 after encountering drilling issues on its Shisr-1 well, so it is reasonable to assume that it didn’t disprove the play.
‘The deeper plays in the Huqf Supergroup (as targeted in Kunooz-1) are secondary and can be considered to have
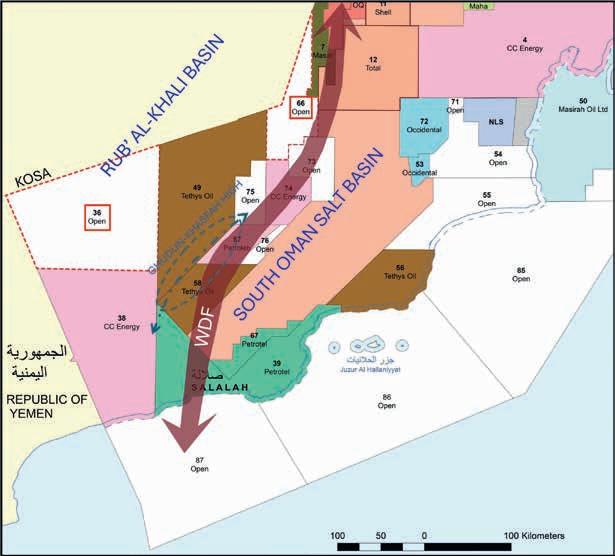
a higher risk profile,’ said the ministry. ‘That said, work by Phillips Petroleum, when operating Blocks 36 and 38, cited gravity modelling to speculate the existence of a salt sequence to the west of the Ghudun-Khasfah High, which would be the time equivalent of the Ara Group in the SOSB. Although their published 2D seismic data were poor, this observation is consistent with our data-driven model for the evolution of the WDF, together with the more recent drilling results of PDO, PTTEP and Tethys Oil in the region.’
Searcher Seismic has launched GeoBot, an AI-powered assistant providing precise, on-demand answers to complex geological questions, enabling faster decisions.
Included with Searcher’s GeoClerk subscrip tion and built on advanced Retrieval-Augmented Generation (RAG) technology, GeoBot leverag es GeoClerk’s database and securely accesses an organisation’s private datasets to deliver tailored insights.
‘From exploration summaries and production data to deposit statistics, GeoBot transforms raw data into actionable insights in seconds, supporting everything from exploration strategy refinement to critical decision validation and serving as your knowledgeable, trusted assistant,’ said Searcher.
‘GeoBot’s LLM-agnostic architec ture ensures it can integrate with the best
AI models, giving organisations flexibility to evolve with cutting-edge technology. Importantly, GeoBot only works with AI providers that do not use or train on business data so your answers remain yours.’
Geobot ensures that every fact, insight, and answer provided is backed by verifiable sources, added Searcher. It retrieves relevant data from trusted geological reports, academic papers, and industry sources, embedding citations (and direct links to the original sources) directly within responses.
Tim Hall-Johnson, GeoClerk’s head of product and technology, said: ‘With its advanced AI capabilities, powered by one of the most extensive geoscience databases in the world, GeoBot enables geologists to obtain actionable insights faster than ever before.’
The European Carbon Capture and Storage Association (CCSA) has urged the UK’s government to move faster in delivering carbon capture projects.
The report outlines three further key recommendations. Learning from Track-1, the next phase of CCUS funding must improve the risk-sharing between parties and optimise the full value chain; from supply chain, CO2 capture project, transporting the CO2 to permanent CO2 storage, without any delay to the allocation process. The government must also commit to regular future allocation rounds, as it has in offshore wind, to signal the scale and timing of future opportunities to investors, industry and the supply chain, which will drive down costs.
To accelerate delivery of comprehensive carbon markets both in the UK and internationally, The UK must efficiently implement its planned expansion of the UK Emissions Trading Scheme (ETS), introduce a UK Carbon Border Adjustment Mechanism (CBAM), and develop cross-border CO2 transport and storage markets, said the report.
Public finance should be leveraged through GB Energy and National Wealth Fund: targeted public finance
mechanisms should be used to derisk first-of-a-kind projects, to attract further private investment in the mediumto-longer term.
If these recommendations are implemented, the CCUS industry is projected to create 50,000 skilled jobs, unlock £94 billion of cumulative GVA in the UK and CO2 storage exports could generate revenues of £30 billion per year by 2050.
Mark Sommerfeld, UK Director, said: ‘Getting spades in the ground for the first CCUS clusters will provide other projects with important lessons and work towards strengthening the value chain. This is critical as we work to achieve economies of scale that will foster innovation and promote collaboration in contracting and supply chains. In doing so, we will be able to realise efficiencies and strengthen investor confidence in the industry, ultimately lowering the cost of delivering and operating CCUS across the UK’s industrial heartlands.
Most importantly, the government must sustain momentum by providing long-term certainty and commit funding to the already-selected CCUS projects and the broader pipeline. Acting now will reduce costs in the future.’
TGS has won a 4D streamer contract acquisition project in the Barents Sea covering the Goliat 4D field operated by Vår Energi. The Goliat 4D project is scheduled to start in July with a total duration of approximately 20 days.
Meanwhile, TGS has a new multi-client 3D streamer acquisition and processing project, also in the Goliat area of the Norwegian Barents Sea. The GeoStreamer survey will span up to 1600 km 2 over recent discoveries such as Countach, Elgol and Lupa, and expanding on TGS’ data coverage in the Goliat area of the prolific Hammerfest Basin. The Hammerfest Basin 3D project is scheduled to start in early August.
Kristian Johansen, CEO of TGS, said: ‘The Goliat area is one of the hotspots in the Norwegian Barents Sea with significant drilling success and exciting new discoveries. We are very pleased to secure funding for more multi-client 3D acquisition in this part of the Norwegian Continental Shelf for the 2025 summer season.’
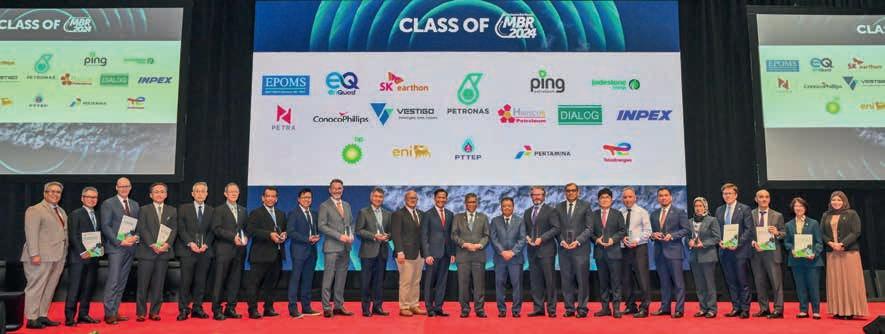
The Malaysia Bid Round 2024 (MBR 2024) has concluded with the signing of two Production Sharing Contracts located off the coast of Sabah. The PSCs were awarded to a consortium of Inpex, Petronas Carigali, and SMJ Energy.
This milestone brings the total to 14 new PSCs signed under MBR 2024,
involving 12 different operators. These contracts encompass 11 discovered resource opportunities and three exploration blocks.
Petronas has also signed technical evaluation agreements for the Langkasuka Basin in the Straits of Malacca and the Layang-Layang Basin off the coast
of Sabah. ‘The agreements, made with seven leading oil and gas companies – bp, Eni, Inpex, Petronas Carigali, Pertamina, PTTEP and TotalEnergies – underscore Petronas’ commitment to unlocking frontier basins and driving exploration at these promising regions,’ said Petronas.
MBR 2025 is offering five exploration blocks in the Malay and Penyu Basins offshore Peninsular Malaysia, and the Sandakan Basin, off the coast of Sabah, ‘each presenting diverse geological plays with significant resource potential’. Additionally, three discovered resource opportunities (DRO) clusters are available in shallow waters near existing infrastructure and potential gas markets, enabling rapid monetisation.
The MBR 2025 virtual data room is open. visit http://www.petronasmbr.com
Shearwater GeoServices has reported a net loss of $39 million on revenues of $104 million for the fourth quarter of 2024 compared to a net loss of $31 million on revenues of $179 million in Q4 2023.
The company reported an operating loss of $24 million compared to an operating loss of $18 million in Q4 2024.
Marine seismic acquisition decreased due to project delays earlier in the year. An uptick in the number of tenders and awards during the second half of the year did not impact actual acquisition activity,’ said the company. However, Shearwater was awarded three OBN and six streamer-contracts in Q4, the equivalent of approximately 26 vessel months. Year-end contract backlog was $337 million compared with $239 million at the end of the third quarter of 2024 and $585 million at the end of the third quarter of 2023.
Shearwater operated an average of 9.9 active vessels in the quarter, compared to 11.1 active vessels in the third quarter of 2024 and 9.2 in the fourth quarter of 2023. The decline from the previous quarter reflected the project delays and lower activity in key regions such as India and Brazil. Utilisation of the active fleet was 50% compared to 61% in the previous quarter and 68% in the fourth quarter of 2023.
The multi-client revenue of $14 million in the quarter relates to the first Pelotas season in Brazil and Namibia late sales. At year-end, Shearwater had more than $30 million of additional unrecognised multi-client revenue related to already acquired, but not yet delivered data. Total operating expenses were $127.4 million compared to $197.2 million in the same period of 2023.
Full-year operating revenue was $619.8 million, down from $922 million in 2023, due to lower activity with 63% utilisation of the active fleet compared to 78% a year earlier. Marine acquisition
represented 92% of revenue, Software, Processing and Imaging 4% and the multi-client segment 3%. Net loss for the year was $53.4 million compared to a net profit of $47.8 million in 2023. Net cash flow from operating activities for the full-year amounted to $92.5 million compared to $309.6 million in 2023.
The SW Tasman/Pearl node platform has mobilised to perform consecutive West Africa contracts. At completion of current contract pipeline, the SW Tasman/Pearl kit will have had about 18 months of consecutive operations since January 2024. Meanwhile, Shearwater is also ‘further strengthening our multi-client position’ by preparing for the second Pelotas Basin multi-client 3D acquisition season in Brazil.
Irene Basili, CEO of Shearwater, said: ‘Marine seismic acquisition activity was muted towards year-end extending the weaker-than-expected 2024 market. This was also reflected in the fourth quarter financial performance. Still, the pace of contract awards was encouraging.
Several contracts delayed in 2024 are moving ahead, adding to the underlying market demand. While these signs are positive, our outlook remains influenced by our client’s continued cautiousness and capital discipline. Therefore, we cannot assume that the yearover-year increase in activity at the start of 2025 will continue. That said, we are well positioned to benefit from a tighter market as an industry consolidator with available swing capacity and technology leadership.’
Shearwater expects to report an active fleet for the first quarter of 2025 in line with the fourth quarter of 2024, but with significantly improved utilisation with more vessels allocated towards contract work following recent awards.
bp has set out how it intends to increase oil and gas investment and reduce investment in renewables after disappointing fourth quarter 2024 results.
Upstream investment will increase to around $10 billion a year to grow production to 2.3-2.5mmboed by 2030 and generating an extra $2 billion in cash flow.
There will be more ‘selective investment’ in energy transition projects, such as biogas, biofuels and EV charging. ‘Capital-light partnerships’ will be set up in the hydrogen/CCS sectors. Overall, investment in transition businesses of $1.5–2bn p.a will be more than $5bn a year lower than previous guidance.
bp will target structural cost reductions of $4-5 billion by the end of 2027 to reduce annual capex to $13-15 billion. It will also make some $20 billion of divestments by 2027.
‘bp will grow its upstream oil and gas business, focus its downstream business, and invest with increasing discipline into the transition. It builds on bp’s distinct strengths and competitive advantages as an integrated energy company – with a world-class portfolio with top tier oil and gas businesses in attractive basins and leading integrated positions and brands across value chains, all underpinned by trading, technology, and partnerships.
Chief executive Murray Auchincloss said: ‘We are reducing and reallocating capital expenditure to our highest-returning businesses to drive growth, and relentlessly pursuing performance improvements and cost efficiency. We will grow upstream investment and production to allow us to produce high margin energy for years to come. We will focus our downstream business on markets where we have leading integrated positions. And we will be very selective in our investment in the transition, including through innovative capital-light platforms.’
In 2024, BP’s net income fell to $8.9bn, down from $13.8bn in 2023.
TDI-Brooks has won a contract with Compass Survey Limited to shoot a series of 2D Ultra High-Resolution (2DUHR) seismic site surveys and pipeline route assessments for SPDC offshore Nigeria.
The company will acquire conventional geophysical data and high-resolution seismic imaging to assess potential hazards, ensuring safe well site clearances and optimal pipeline route planning.
TDI-Brooks has deployed its survey vessel, R/V Proteus, to Nigerian waters. The primary objective of the project is to identify potential drilling hazards and risks along the proposed pipeline route, ensuring safe and efficient offshore development while minimising environmental and operational risks.
R/V Proteus is expected to continue working in Nigeria through most of 1Q/3Q on various analogue and 2D HR survey projects.
TDI-Brooks is presently operating three vessels in west and southwest Africa, engaged in various projects for IOCs. Their 75-m DP-II vessel, R/V Nautilus, is currently involved in a deepwater geotechnical project off the coast of Namibia, which includes 20-m JPCs and 40-m Core Penetration Testing (CPT) Stingers. It will then undertake a shallow-water deep push project with a Manta-200 CPT system. These projects are expected to conclude by early March.
The R/V Gyre is engaged in a range of environmental and geotechnical projects in northwest Africa during the first and second quarters. In 2024 the Gyre underwent a shipyard period in Las Palmas, during which its Kongsberg’s Multibeam Echosounder (MBES) was upgraded from an EM-302 to an EM-304 MKII. The new EM-304 MKII is capable of high-resolution seabed mapping from 10 m to more than 5000 m. The vessel then completed a seep-hunting project in Suriname prior to transiting to Las Palmas.
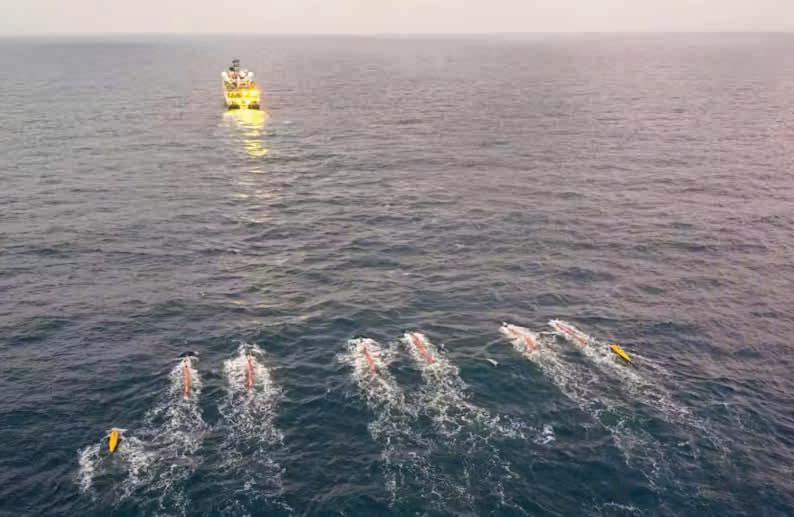
Shearwater Geoservices has won a contract from ExxonMobil to deliver a large deepwater 4D OBN reservoir surveillance program.
The company will commence a sixmonth survey in the first half of 2025. The field unit will be comprised of a Shearwater seismic vessel as source vessel, and a dual ROV vessel for node deployment.
‘Shearwater is pleased to be selected for this significant 4D OBN contract in one of the world’s fastest-growing
offshore oil and gas regions following our recent successful completion of 4D towed-streamer operations for ExxonMobil in Canada,’ said Irene Waage Basili, CEO of Shearwater. ‘We see a steady increase in deepwater 4D OBN monitoring activity internationally, and Shearwater is well positioned for this growth with our leading seismic fleet, state-of-the-art technology offering and extensive experience.’
The company is also busy shooting seismic offshore Brazil in Q1.
Chevron is planning to use natural gas to power AI data centres.
Working with GE Vernova and Engine No 1, Chevron will deliver up to 4 GW — enough to power as many as 3.5 million US homes for one year.
‘AI data centres require massive amounts of energy to function. For
instance: they consume as much as 50 times more power per square foot than a typical office building,’ said Chevron.
A single query on ChatGPT can consume up to 10 times more energy than a Google search.
And many data centres rely on the electrical grid for power, leaving them, as well as industries and individuals, vulnerable to energy outages and capacity limitations.
Chevron, GE Vernova and Engine No. 1 are planning to build ‘behind-themeter’ power plants — which provide energy independence — located near data centres. Behind-the-meter energy generation and storage systems are located on the customer side of the electricity meter, meaning they supply power directly to a building without accessing the utility grid.
In the near future: GE will aim to deliver seven high-efficiency gas-powered turbines to Chevron.
These turbines are expected to first deliver power in 2027.
TGS has reported a fourth quarter net income of £38 million on revenues of $493 million, compared to a net loss of $9 million on revenues of $206 million in Q4 201024.
Operating profit of $90 million compared to $10 million in Q4 2023. Mulit-client sales of $261 compared to $118 million in Q4 2023; contract revenues of $230 million compared to $88 million in Q4 2023.
CEO of TGS Kristian Johansen pointed to high OBN activity and strong levels of contract work. With a total produced order backlog of $749 million, the company has completed a full refinancing of the legacy debt from last year’s acquisition of PGS, reduced interest rate of the Senior Secured Notes from 13.5% to 8.5%
and realised synergies of approximately $35 million.
Full-year organic multi-client investments for 2024 were $425 million –2025 is expected to be approximately $425 to 475 million with ‘robust prefunding’.
‘Our multi-client business performed well, achieving a sales-to-investment ratio of 2.2x for the year. The OBN segment continued its strong momentum, and our NES activities experienced significant growth. With several contract awards in the latter part of the year, we successfully built a robust vessel backlog going into 2025. We refinanced the balance sheet at attractive terms in Q4, providing us with a solid capital structure,’ said Kristian Johansen, CEO of TGS.
Sercel has launched its 528 land seismic acquisition system offering ‘significant operational advances, such as its very light weight for field operations and significantly reduced power consumption’.
Tanzania is preparing to auction 26 blocks for oil and gas exploration, 23 in the deep offshore of the Indian Ocean and three in Lake Tanganyika. The Petroleum Upstream Regulatory Authority (PURA) said that a significant amount of natural gas is expected to be discovered in the deep offshore. Lake Tanganyika, in the East African Rift System (EARS), where neighbouring countries (Kenya and Uganda) discovered oil in basins located in similar geological setting.
Hunting Plc, the precision engineering group, has acquired the Organic Oil Recovery (OOR) for $17.5 million. Hunting has acquired the entire portfolio of intellectual property, comprising more than 25 discreet patents, the distribution rights for the technology, and the laboratory located in California, US. Field trials of the OOR technology are underway with numerous blue-chip exploration and production companies across North America, Europe, the Middle East, and Asia Pacific.
Eni and Petronas are negotiating a joint venture holding company to oversee selected upstream assets in Indonesia and Malaysia. The joint venture will aim to create ‘significant opportunities’ for growth, both in Malaysia and Indonesia, and is expected to generate substantial synergies towards becoming a major LNG player in the region, while delivering in the medium term 500 kboepd production. The joint venture will combine approximately 3 billion barrels of oil equivalent (boe) of reserves with an additional 10 billion boe of potential exploration upside.
bp has reached agreement with the Republic of Iraq to invest in several giant oil fields in Kirkuk providing for the rehabilitation and redevelopment of the fields, spanning oil, gas, power and water with potential for investment in exploration.
The UK government has launched a consultation on plans to put the North Sea at the heart of Britain’s clean energy future.
The plan positions the North Sea as a world leader in offshore industries, such as hydrogen, carbon capture and wind and also offers the oil and gas industry long-term certainty on the fiscal landscape by ending the Energy Profits Levy and consulting on a new regime to boost investment.
The consultation gives certainty to industry by committing to maintain existing fields for their lifetime and pledges to work with business and communities on a managed transition, while implementing the commitment not to issue new licences to explore new fields.
The Energy Profits Levy will end in 2030 and the UK is consulting on what a new regime could look like,
advantage of the tremendous opportunities of the years ahead.’
It is estimated that the offshore renewables workforce, including offshore wind, CCUS and hydrogen, could increase to between 70,000 and 138,000 in 2030. Meanwhile, an up-and-running carbon capture industry alone is expected to add around £5 billion per year of gross value to the UK economy by 2050.
The UK government said that Britain is already investing £21.7 billion over the next 25 years for carbon capture and storage and hydrogen projects. This comes alongside the launch of Great British Energy, headquartered in Aberdeen, and the creation of a National Wealth Fund, both of which will unlock ‘significant investment’ in clean power projects across the UK.
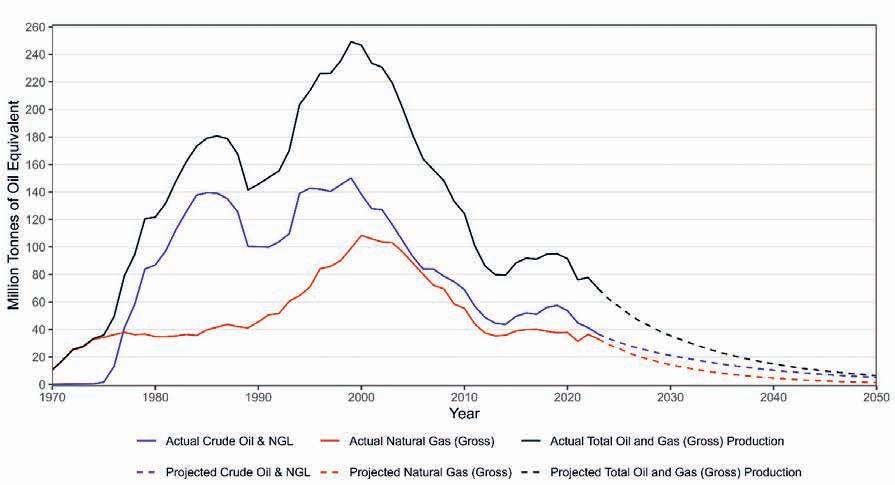
Vast majority of future production is expected to come from producing fields or fields already being developed on existing licences. Future production is expected to be around two thirds oil and one third gas.(North Sea Transition Authority (NSTA) (October 2024), ‘Production and Expenditure Projections’, https://www.nstauthority.co.uk/data-and-insights/insights-and-analysis/production-and-expenditure-projections/.
to respond to any future shocks in oil and gas prices. ‘The government will work closely with the sector and other stakeholders to develop an approach that protects jobs in existing and future industries and delivers a fair return for the nation, during times of unusually high prices.’
UK energy secretary Ed Miliband said: ‘This consultation is about a dialogue with North Sea communities –businesses, trade unions, workers, environmental groups and communities – to develop a plan that enables us to take
The government has also consulted on revised environmental guidance for offshore oil and gas projects and will respond to give certainty to the industry and enable developers to resume applying for consents for already-licensed projects. This follows a Supreme Court ruling last year that requires regulators to consider the impact of burning oil and gas – known as scope 3 emissions – in the Environmental Impact Assessment for new projects.
Tania Kumar, net zero director, CBI said: ‘The UK’s net zero economy is
growing faster than the rest of the economy – the future is green growth and managing the transition away from fossil fuels to a clean energy future for the North Sea is vital to achieving it.’
David Whitehouse, chief executive, Offshore Energies UK (OEUK) said: ‘Today’s consultations, on both the critical role of the North Sea in the energy transition and how the taxation regime will respond to unusually high oil and gas prices, will begin to give certainty to investors and create a stable investment environment for years to come.’
The Department for Energy Security and Net Zero’s consultation on Building the North Sea’s Energy Future will run for 8 weeks from 5 March to 30 April.
The government is consulting on how to deliver its commitment to end new licences to explore new fields, including all new seaward exploration and production licences to search for and extract new oil and gas resources in the UK. Licence extensions and transfers would not be affected.
Figures from the Department for Energy Security and Net Zero’s Digest of UK Energy Statistics show a 72% reduction in UK oil and gas production occurring between 1999 and 2023. The North Sea Transition Authority also predicts an 89% drop in UK oil and gas production by 2050.
The UK government has confirmed Aberdeen, Cheshire, Lincolnshire and Pembrokeshire as key growth regions for clean energy and launched pilots to help workers in these areas access jobs in new clean energy industries.
Oil and gas workers will get help to move into these sectors, thanks to a recently launched energy ‘skills passport’ – led by Renewable UK and Offshore Energies UK, and backed by UK and Scottish Governments.
Research shows that 90% of oil and gas workers have transferable skills for offshore renewable jobs. The UK government said in a statement that it is exploring what further support is needed to help workers take full advantage of the UK’s clean energy transition, as part of its consultation on the future of the North Sea.
Norwegian oil and gas operator DNO is acquiring 100% of the shares of Sval Energi Group from HitecVision for a cash consideration of $450 million based on an enterprise value of $1.6 billion.
The acquisition will be financed from existing liquidity including available credit facilities.
‘This is a rare opportunity to acquire a portfolio of high-quality oil and gas assets on the Norwegian Continental Shelf,’ said DNO’s executive chairman Bijan Mossavar-Rahmani. ‘Given low unit production costs and limited nearterm investment requirements, the Sval Energi portfolio is highly cash generative and will help underpin development of the numerous discoveries we have made in Norway recently.’
The deal will boost DNO’s global net production by two thirds to around 140,000 barrels of oil equivalent per day (boepd) on a 2024 pro forma basis and proven and probable (2P) reserves by 50% to 423 million barrels of oil equivalent (boe). It will increase DNO’s North Sea 2P reserves from 48 million boe to 189 million boe post-closing and 2C resources from 144 million boe to 246 million boe. It will quadruple North Sea production to around 80,000 boepd.
The North Sea will become the biggest contributor to DNO’s net production with
some 60% of the total (with the balance coming predominantly from two operated fields in the Kurdistan region of Iraq).
It will provide tax synergies, G&A savings and lower DNO’s borrowing costs.
It will strengthen DNO’s presence in core areas on the Norwegian Continental Shelf where since 2020 the company has made 14 discoveries including Bergknapp/Åre, Bergknapp, Carmen, Cuvette, Heisenberg, Kveikje, Mistral, Norma, Ofelia, Othello, Overly, Ringand, Røver Nord and Røver Sør, adding contingent resources (2C) of around 100 million boe. Sval Energi’s extensive portfolio will provide potential development synergies with DNO’s discoveries.
The deal will add non-operated interest in 16 producing fields offshore Norway, with net production of 64,100 boepd in 2024.
It will also add 141 million boe in net 2P reserves and 102 million boe of net 2C resources, including Nova, Martin Linge, Kvitebjørn, Eldfisk, Maria, Symra and Ekofisk fields. The portfolio, split about equally between liquids and gas, will add cash flow from operations of $565 million (in 2024) with low production cost ($14 per boe) and limited near-term investments, said DNO.
Organic growth is expected in producing assets, fields under development (Maria Revitalisation, Symra, Dvalin North) and discoveries (Cerisa, Ringhorne North, Beta), as well as redevelopment opportunities (Albuskjell, West Ekofisk).
A team of 93 employees to be integrated into DNO.
The acquisition will be financed with existing cash and other debt financing facilities available to DNO. At year-end 2024, the company held $900 million in cash and a further $100 million liquidity under its reserve-based lending (RBL) facility. Additional funding sources include new bond and RBL debt as well as offtake-based financing.
The transaction is expected to take place on 1 January 2025, with expected completion mid-year 2025, subject to regulatory approvals.
JERA and bp have announced the leadership team of their planned 50-50 offshore wind joint venture, JERA Nex bp. The global offshore wind developer, owner and operator will be led by CEO Nathalie Oosterlinck, currently serving as CEO of JERA Nex.
Storegga has submitted a planning application to develop a green hydrogen facility in Scotland aimed at decarbonising local distilleries. The development at Ballindalloch, Marypark, will help to reduce carbon emissions within the distilling industry, which accounts for just over three quarters of Scotland’s food and drink exports.
Baker Hughes and Frontier Infrastructure have announced a strategic partnership to accelerate the deployment of largescale carbon capture and storage (CCS) and power solutions in the US. Baker Hughes will provide technologies and resources in support of the development of large-scale CCS, power generation, and data centre projects. Frontier is leading the development of the Sweetwater Carbon Storage Hub, one of the largest open-source carbon sequestration assets in the country.
Wood has launched a centre for technical, strategic and economic energy transition solutions in Abu Dhabi. The energy transition hub will offer consultancy in renewable energy, hydrogen, carbon capture and storage and renewable power generation and decarbonisation. Wood will also help clients to integrate transition solutions including flare and emission reduction and asset emissions reviews.
Serbia’s second renewables auction will lead to a total of ten wind and solar power plants generating a total of 645 MW. Of 41 project proposals, seven projects were submitted for wind farms and 34 for solar power plants.
TotalEnergies has signed an agreement with the German developer RWE to supply 30,000 tons a year of green hydrogen to the German Leuna refinery for 15 years, beginning in 2030.
TGS has teamed up with geoscience interpretation and field development software provider SeisWare to provide seamless access to TGS’ well and geological data.
Through this partnership, TGS is enabling seamless integration of its extensive well data, including well headers, formation tops, logs, and production and completion data, within SeisWare’s platform via TGS Application Programming Interfaces (APIs). This integration allows SeisWare users to efficiently incorporate TGS well data alongside their seismic data, geospatial layers, and existing well datasets. By centralising all relevant geological and geophysical data within a single platform, SeisWare enhances workflows, improves decision-making, and supports more accurate and confident exploration and development strategies. The integration is targeted for availability in Q3 2025.
The Nigerian National Petroleum Company (NNPC) and FIRST joint venture have confirmed a ‘significant hydrocarbon discovery’ in the Songhai field, located in OML 85 in the shallow offshore region of Bayelsa. The well was drilled to a total depth of 8883 ft measured depth (MD) in 30 m of water. The well encountered hydrocarbons across eight reservoirs, logging more than 1000 ft of hydrocarbon-bearing sands, most of which exhibit excellent reservoir properties. Preliminary analysis indicates substantial oil and gas volumes.
Panaro Energy has discovered oil at the Bourdon prospect, located on the Dussafu Marin Permit offshore Gabon in which Panoro holds a 17.5% interest. The well was drilled to a total depth of 4135 m. Evaluation of logging and pressure data confirms that approximately 34 m of net oil pay in an overall column of 45 m has been encountered in the prolific Gamba reservoir formation. This is the largest hydrocarbon column discovered to date at Dussafu. The discovery is located approx. 15 km west of the BW Adolo FPSO and 7.5 km southeast of the MaBoMo production facility.
bp has completed drilling operations at the El Fayoum-5 gas discovery well in the North Alexandria Offshore Concession, marking the final well in its four-slot drilling campaign in the West Nile Delta.
SeisWare’s platform is designed for geologists, geophysicists, and energy industry professionals, offering tools for seismic interpretation, visualisation, attribute analysis, geological mapping, 3D well design, asset appraisal, and scenario testing.
Carl Neuhaus, vice-president of Onshore Multi-Client at TGS, said: ‘This partnership with SeisWare represents a step forward in enabling our clients to integrate and analyse critical geoscience data more effectively. By bringing together TGS’ extensive well and geological data with SeisWare’s interpretation platform, we are empowering energy professionals to make more informed, data-driven decisions that enhance exploration and development outcomes.’
TGS and SeisWare envision a long-term partnership, with ‘many more capabilities planned’.
The well encountered four prospective Messinian gas reservoirs, with a total sand thickness of 50 m at a measured depth of approximately 2900 m. The discovery will be tied back to bp’s operated West Nile Delta (WND) Gas Development.
CNOOC Ltd has made a ‘major breakthrough’ in the exploration of Paleozoic buried hills in the Beibu Gulf Basin. The Weizhou 10-5 oil and gas field is located in the Beibu Gulf of the South China Sea, with an average water depth of about 37 m. Exploration well WZ10-51Sa encountered an oil and gas pay zone of 283 m, with a total drilled depth of approx. 4840 m. The test results indicate that the well produces approximately 13.2 million cubic feet of natural gas and about 800 barrels of crude oil per day.
Equinor and partners Okea and Pandion Energy have discovered gas and condensate in the Halten area, southern Norwegian Sea. The discovery is currently estimated to be between 3 and 7 million Sm3 of recoverable oil equivalents (oe). This corresponds to between 19 and 44 million barrels of recoverable oe
Medco Energi has successfully made a hydrocarbon discovery at the West Kalabau-1 exploration well, located in the Rimau Block, South Sumatra, Indonesia. The West Kalabau-1 well was drilled to a total depth of approx. 3220 ft, targeting the Baturaja Formation, a proven reser-
voir in the region. Formation evaluation confirmed the presence of hydrocarbons, providing a strong basis for further development planning.
Vår Energi (65%) and Equinor (35%) have discovered oil near the Goliat field in the Barents Sea. The preliminary estimated gross recoverable resources are between 15 to 43 million barrels of oil equivalent (mmboe). The Zagato discovery, is 8 km northeast of the Goliat FPSO. The Goliat ridge consists of a series of adjacent fault-bonded prospects next to the Goliat field. A 3D and a 4D seismic survey will be acquired during summer 2025 accompanied by the drilling of two further exploration/appraisal wells commencing around the end of the third quarter this year.
Custos Energy has been drilling in Blocks 2813A and 2814B in Namibia’s Orange Basin. Mopane-3X, located 18 km from the first Mopane-1X well, targeted two stacked prospects, AVO-10 and AVO-13, as well as a deeper sand, in the southeast region of the Mopane complex at an approximate water depth of 1200 m. Preliminary data confirmed significant columns of light oil and gas-condensate in high-quality sandstones across AVO-10. Further, the presence of light oil columns have been confirmed in AVO-13 and the deeper sand, again in high-quality sandstones.
Roderick Perez Altamar1*
Abstract
A stochastic agent-based modelling (ABM) framework has been developed to simulate hydrocarbon migration and accumulation in stratigraphically complex geological environments, advancing traditional deterministic approaches by integrating probabilistic elements to capture natural geological variability. By representing hydrocarbons as agents navigating a two-dimensional grid of facies-defined pathways, the model uses Move Probability Matrices (MPMs) and Markov Chain-driven facies transitions to simulate migration behaviour influenced by permeability contrasts across sandstone, silt, and shale facies. Environmental factors, such as sea level changes, drive facies transitions over time, creating a dynamic system that reflects the impact of depositional variability on fluid migration pathways.
The model employs iterative simulations to capture the probabilistic ‘Most Probable Path’ of hydrocarbon agents, revealing zones with a higher likelihood of accumulation. Multiple stochastic runs are aggregated into heatmaps, visualising regions where geological structures and stochastic variability intersect to provide insights into hydrocarbon distribution patterns. Results indicate that while deterministic models outline structured migration routes, the stochastic approach allows for the identification of additional potential accumulation zones by accounting for subtle geological variations and environmental fluctuations that influence fluid movement.
This stochastic ABM framework improves predictive accuracy in hydrocarbon exploration, supporting more informed decisions in resource management and well placement. Beyond hydrocarbon migration, the model offers a flexible framework applicable to other geoscientific challenges, such as groundwater modelling and carbon sequestration, where geological heterogeneity significantly impacts fluid dynamics.
Hydrocarbon migration and accumulation involve complex processes shaped by geological formations, depositional patterns, and environmental factors. Accurately simulating these processes is essential for resource exploration and management. Prior work by Perez (2024a) established a deterministic framework for hydrocarbon migration modelling, employing agentbased modelling (ABM) to replicate fluid movement along facies pathways. This framework defined hydrocarbon agents moving across a geological grid, influenced by permeability and structural constraints intrinsic to facies types like sandstone, silt, and shale.
To address the limitations of purely deterministic models, the current study extends this ABM framework by integrating stochastic Markov Chain processes, inspired by recent advances in basin modelling (Perez, 2024b), which highlighted the importance of capturing facies deposition variability in response to environmental factors, such as sea level changes. Markov Chains introduce probabilistic facies transitions within the ABM, allowing for facies shifts driven by environmental fluctuations, thus better capturing the geological variability often overlooked by deterministic models.
1 OMV
The Markov Chain model used in Perez (2024b) illustrated the effects of facies transitions prompted by sea level changes on depositional sequences over geological time. It generated facies configurations representing both shallow and deep marine environments, accounting for cyclic lithofacies patterns and stratigraphic complexity. This study builds on these foundations, applying Markov Chain-driven facies transitions within the ABM framework to simulate hydrocarbon migration in stratigraphically complex environments where facies transitions influence fluid pathways and accumulation patterns.
This study advances the stochastic elements of Agent-Based Modelling (ABM) to simulate hydrocarbon migration in complex, lithologically varied formations. Agent-Based Modelling (ABM) is a computational approach that simulates complex systems by representing individual entities here, hydrocarbon molecules as autonomous agents that interact with their environment. Previous work (Perez, 2024a) established a deterministic framework for ABM-based hydrocarbon migration simulations, focusing on predefined movement pathways within lithological facies. This study expands on that framework by integrating
* Corresponding author, E-mail: roderick.perezaltamar@omv.com, roderickperezaltamar@gmail.com DOI: 10.3997/1365-2397.fb2025025
Figure 1 (a) Geological facies model with hydrocarbon distribution. Sandstone (yellow), silt (dark yellow), and shale (gray) layers define permeability variations. Hydrocarbon agents migrate through these facies, following permeability-controlled pathways. (b) Isolated oil agent distribution within structural traps (i, ii, iii, and iv), where oil accumulates preferentially in lower permeability zones. (c) Isolated gas agent distribution, showing gas overlaying oil within structural traps due to buoyancy effects. Oil agents are represented by green dots, while gas agents are represented by red dots. Additionally, cyan and magenta arrows indicate hydrocarbon migration pathways derived from stochastic simulations, highlighting variability in migration routes.
stochastic movement dynamics to better capture geological variability and enhance predictive accuracy in subsurface migration modelling.
The model operates within a two-dimensional geological grid that represents a cross-section of the subsurface. Each cell in the grid corresponds to a distinct facies type, including sandstone, silt, and shale, which exhibit unique permeability characteristics. Move Probability Matrices (MPMs), as introduced in prior research (Perez, 2024b), define the likelihood of hydrocarbon agents moving in specific directions based on the permeability properties of each facies. Sandstone, being highly permeable, encourages vertical migration, whereas shale, characterised by low permeability, restricts movement. In this study, MPMs are further refined to incorporate stochastic perturbations, introducing controlled randomness into agent movement. Specifically, agents deviate from their preferred path 5% of the time, as described by Steffens et al. (2022), who previously employed a 10% deviation factor. This adjustment maintains a balance between probabilistic movement and geological realism, ensuring that hydrocarbon dispersion accounts for micro-scale heterogeneities without compromising dominant migration trends.
In addition to MPMs, Markov Matrices are employed to model temporal facies transitions, simulating environmental changes such as sea level fluctuations that alter depositional patterns. While MPMs govern agent movement within the grid, Markov Matrices regulate the probability of facies transformations over time. This dual-matrix approach ensures that agent migration occurs within a geologically plausible framework, where facies distributions evolve in response to depositional and structural influences. The Markov Matrices used in this study maintain consistency with those from the prior deterministic framework (Perez, 2024b) but introduce probabilistic variation to reflect natural uncertainty in geological transitions.
Hydrocarbon agents, representing oil and gas molecules, are initialised at the lower boundary of the geological grid, simulating their accumulation within the source rock before migration begins. Each agent follows movement rules dictated by the permeability constraints of the surrounding facies, ensuring that migration pathways emerge as a function of both geological
structure and stochastic perturbations. Structural boundaries, such as grid edges, trigger agent removal, representing hydrocarbons escaping the modelled domain or surfacing. To account for differences in viscosity and buoyancy, oil agents experience a probabilistic delay mechanism, mimicking slower migration relative to gas agents. This delay threshold ensures that the distinct properties of oil and gas are reflected in their respective migration behaviors.
As agents migrate, they continuously evaluate their local surroundings to determine movement trajectories, with each time step representing an iterative reassessment period. The simulation progresses until hydrocarbon agents reach structurally favourable zones, such as traps or reservoirs, where they accumulate in accordance with geological constraints. To optimise computational efficiency, a stabilisation criterion is implemented, terminating the simulation once agent movement stabilises over consecutive time steps. This ensures that hydrocarbon migration dynamics are captured without redundant calculations, reducing computational overhead while maintaining model accuracy.
To visualise migration outcomes, the final spatial distribution of hydrocarbon agents is recorded and analysed using heatmaps. These heatmaps illustrate high-probability accumulation zones, providing insights into the interplay between facies characteristics, structural constraints, and stochastic migration influences. Compared to previous deterministic simulations (Perez, 2024a), this approach yields a more comprehensive representation of hydrocarbon migration, accommodating geological uncertainty while preserving key directional trends. By integrating stochasticity within a structured probabilistic framework, this study enhances the robustness of ABM-based hydrocarbon migration modelling, contributing to a deeper understanding of subsurface petroleum systems.
Figure 1 presents the results of a deterministic simulation run, illustrating the geological facies model and the migration behaviour of hydrocarbon agents within an anticline structure. In Figure 1a, yellow shades indicate high-permeability sandstone facies, dark yellow represents silt, and grey denotes
shale facies, which act as impermeable barriers. Hydrocarbon agents are marked in green for oil and red for gas, migrating through stratified layers according to the geological setup. The red lines trace the migration paths of gas agents throughout the simulation.
The Figure highlights four distinct structural traps within the anticline (i, ii, iii, and iv), where hydrocarbons accumulate due to geological facies constraints. Gas agents (red) generally overlay oil agents (green), forming gas caps above the oil in these traps, which is consistent with natural subsurface distributions. Buoyancy differences cause the less dense gas to rise, occupying the upper portions of the traps, while oil settles in the lower zones.
Figure 1b isolates the oil agent distribution, emphasising structural traps where significant oil accumulation occurs. This migration pattern highlights the oil agents’ preference for vertical movement through sandstone facies, which serve as primary migration pathways due to their high permeability. Conversely, silt and shale facies, characterised by lower permeability, restrict movement and encourage the concentration of oil agents within structural traps.
Figure 1c depicts the gas agent distribution, illustrating its strong vertical migration tendency, which results in gas agents accumulating in the upper portions of structural traps. The observed distribution within sandstone and other high-permeability zones confirms the model’s ability to replicate natural hydrocarbon migration dynamics accurately. The 5% stochastic variation rate introduces occasional non-directional movements, accounting for minor unmodelled geological variations. This controlled randomness enhances the model’s robustness, capturing potential dispersion due to microscale geological heterogeneities and providing a more comprehensive view of hydrocarbon migration.
Figure 2 displays the results after running the simulation stochastically for ten iterations, with each overlay representing the agents’ paths across multiple runs. Green lines denote oil agent paths, while red lines signify gas agent paths. Thicker lines indicate the most probable paths (cyan arrow), while thinner lines represent less frequently travelled pathways (magenta arrow). The increased line thickness in certain areas highlights consistent migration paths through sandstone facies, reinforcing the presence of preferred migration routes in high-permeability zones. The overlay effect allows the identification of the ‘most probable
path’ for hydrocarbon agents, reflecting consistent accumulation zones across multiple simulation iterations.
Figure 3 presents predictive heatmaps for hydrocarbon accumulation zones, derived from aggregating multiple simulations with varying facies configurations. These heatmaps depict the density of hydrocarbon agent locations, with oil density shown on the left and gas density on the right. The deterministic simulations establish constrained migration pathways based solely on facies permeability, creating structured and predictable hydrocarbon migration routes within permeable zones.
The heatmaps visualise probable accumulation regions, where denser zones correspond to areas of consistent hydrocarbon presence across multiple simulations, highlighting regions of higher migration and accumulation likelihood. Oil agents, indicated by green density contours, accumulate in lower structural traps, aligning with geological expectations, as oil tends to occupy lower portions of reservoirs. Meanwhile, gas agents, represented by red density contours, predominantly accumulate in the upper parts of the traps due to buoyancy effects, forming gas caps above the oil-rich zones.
The application of a stochastic modelling approach in this study provides a sophisticated framework for simulating subsurface hydrocarbon migration. While deterministic Agent-Based Modelling (ABM) effectively aligns with geological facies structures-guiding hydrocarbon migration through permeable facies like sandstone while treating shale as a migration barrier — it has limitations in representing the natural variability of geological systems. By incorporating stochastic elements, this study surpasses deterministic models, capturing the complexity of subsurface environments and enhancing predictive accuracy in migration modelling.
The stochastic component, implemented through Markov Chain-based facies transitions, introduces depositional variability, allowing for probabilistic shifts in facies driven by environmental factors such as sea level changes. This added layer of randomness addresses the stratigraphic complexity and heterogeneity of sedimentary basins, illustrating how subtle environmental influences and unmodelled microscale features can affect fluid pathways and accumulation patterns. The results demonstrate that while deterministic pathways establish plausible migration routes, it
Figure 2 Geological facies model overlaid with oil (a) and gas (b) agent paths after 10 stochastic simulations. Thicker lines indicate more probable migration paths through high-permeability sandstone zones (cyan arrow), while thinner lines represent less frequently traveled pathways (magenta arrow).
Figure 3 Predictive heatmaps of hydrocarbon accumulation zones derived from multiple stochastic simulation runs. (a) Oil density map highlighting areas with a high probability of oil accumulation, while (b) gas density map vizualises probable gas accumulation zones. Thicker density contours indicate regions with consistent hydrocarbon presence across multiple runs, reflecting structural trapping and permeability influences.
is the interaction with stochastic variability that more accurately delineates potential traps and reservoirs.
Figures 2 and 3 highlight the advantages of this stochastic approach. The probabilistic heatmaps, which aggregate results across multiple simulation runs, reveal high-probability zones for hydrocarbon accumulation that deterministic models alone might overlook. These heatmaps underscore consistent agent pathways and accumulation areas, illustrating how geological structure, combined with controlled stochastic variability, identifies likely hydrocarbon-rich zones in stratigraphically complex environments.
By running multiple stochastic simulations, the model generates density maps that visualise probable hydrocarbon presence across facies configurations. The initial deterministic simulations establish constrained migration routes based strictly on facies characteristics, producing structured, predictable pathways within permeable zones. However, the subsequent stochastic runs introduce geological uncertainties, reflecting the natural variability that enhances the model’s robustness and predictive power.
These visualisations reinforce the model’s ability to replicate natural subsurface distributions, capturing essential geological behaviours of hydrocarbon migration and trapping. By layering stochastic variability over geological structure, this approach provides a comprehensive view of potential hydrocarbon accumulation zones, supporting more informed decisions for well placement and reducing exploration risks. This stochastic methodology not only improves hydrocarbon exploration but also serves as a versatile framework for resource management in stratigraphically complex basins. The insights gained from this approach extend to other subsurface applications, such as groundwater modelling, carbon sequestration, and soil analysis, where geological variability plays a critical role.
This study advances hydrocarbon migration modelling by integrating a stochastic agent-based framework with probabilistic
facies transitions through Markov Chain processes. By incorporating geological variability and environmental influences, such as sea level fluctuations, this approach enhances predictive accuracy in stratigraphically complex settings. Unlike deterministic models, which establish structured migration routes, the stochastic methodology captures natural uncertainties, allowing for a more realistic representation of hydrocarbon movement and accumulation.
The combination of Move Probability Matrices and Markov Chains introduces controlled randomness, enabling the model to reflect both large-scale facies constraints and microscale geological variations. The resulting heatmaps provide a data-driven assessment of potential hydrocarbon accumulation zones, supporting more informed exploration and reservoir management decisions.
Beyond hydrocarbon migration, this methodology offers broader applications in subsurface modelling, including groundwater flow, carbon sequestration, and soil analysis. By embracing the inherent complexity of geological systems, this framework represents a significant advancement in resource exploration and geoscientific research, offering a robust tool for understanding subsurface fluid dynamics and optimising extraction strategies.
Perez, R. [2024a]. Advanced Agent-Based Modelling of Subsurface Migration and Accumulation Dynamics of Hydrocarbons. First Break, 42(9), 35-42. https://doi.org/10.3997/1365-2397.fb2024073.
Perez, R. [2024b]. Advances in basin modeling using Markov chain: Facies deposition in response to sea level variations and random sequence of geologic processes. The Leading Edge, 43(11), 765-773. https://doi.org/10.1190/tle43110765.1.
Steffens, B., Corlay, Q., Suurmeyer, N., Noglows, J., Arnold, D., and Demyanov, V. [2022]. Can agents model hydrocarbon migration for petroleum system analysis? A fast screening tool to de-risk hydrocarbon prospects. Energies, 15(3), 902. https://doi.org/10.3390/ en15030902.
Large-scale exploration of shale oil and gas, in America in particular, has driven innovation in passive seismic characterisation of unconventional reservoirs over the years. Such techniques are proving to be extremely useful in assessing the suitability of former oil and gas fields for underground storage of carbon dioxide. A range of techniques for assessing CO2 storage reservoirs are under development, including geomechanical modelling as well as mechanical modelling in combination with seismic analysis. Important work is also being done on injection rates in preparation for adaptation of carbon storage to meet the planet’s emission reduction goals.
Leo Eisner et al develop methodology to simulate performance of the DAS monitoring from a borehole and surface arrays. The simulations of a vertical monitoring array reveal important patterns in DAS monitoring sensitivity which need to be considered when using DAS array.
Tom Davis reflects on how monitoring of CO2 in reservoirs over the course of RCP project has led to valuable insights.
Joseph Jennings et al develop previous subsurface predictions by considering a series of additional factors that can help make more informed decisions on where best to continue a CCS project.
Stephen A. Sonnenberg provides an overview of passive seismic monitoring of underground gas injection sites, including CO2 sequestration.
Ruud Weijermars highlights greenhouse gas emission-curbing scenarios, the global inequity in efforts to mitigate emissions, and the vulnerability of the European emission trading system (ETS). If the ETS market fails, price-guarantees for GCS projects by governments mean tax payers will bear the brunt.
First Break Special Topics are covered by a mix of original articles dealing with case studies and the latest technology. Contributions to a Special Topic in First Break can be sent directly to the editorial office (firstbreak@eage.org). Submissions will be considered for publication by the editor.
It is also possible to submit a Technical Article to First Break. Technical Articles are subject to a peer review process and should be submitted via EAGE’s ScholarOne website: http://mc.manuscriptcentral.com/fb
You can find the First Break author guidelines online at www.firstbreak.org/guidelines.
January Land Seismic
February Digitalization / Machine Learning
March Reservoir Monitoring
April Underground Storage and Passive Seismic
May Global Exploration
June Navigating Change: Geosciences Shaping a Sustainable Transition
July Modelling / Interpretation
August Near Surface Geo & Mining
September Reservoir Engineering & Geoscience
October Energy Transition
November Marine Acquisition
December Data Management and Processing
More Special Topics may be added during the course of the year.
Zuzana Jechumtálová1, Denis Anikiev 2 and Leo Eisner1* develop methodology to simulate performance of DAS monitoring from a borehole and surface arrays. The simulations of a vertical monitoring array reveal important patterns in DAS monitoring sensitivity which need to be considered when using DAS array.
Introduction
We have developed an open-source comprehensive Python framework, named PyNetDesign (Anikiev, 2025), for testing and designing microseismic monitoring networks, including Distributed Acoustic Sensors (DAS) and studied sensitivity of seismicity for a simple downhole monitoring scenario. The sensitivity is quantified by determining the magnitude of detectable seismic events for a specific microseismic monitoring network, i.e. estimating the minimum moment magnitude detectable using the given network or receivers. We illustrate a straightforward scenario using homogeneous velocity models with various monitoring network geometries and noise levels to evaluate the specific features of monitoring with DAS. Magnitude sensitivity is represented in the form of horizontal or vertical slices through a 3D grid.
The core algorithms in PyNetDesign are implemented using NumPy vectorisation. In the input/output part PyNetDesign relies on Pandas library. Visualisation is based on Matplotlib and Plotly.
Assessing the performance of a seismic monitoring network is needed to ensure meeting of regulatory requirements as well as understanding and interpretation of observed seismicity. Traditionally, monitoring networks utilise point seismic receivers, such as geophones or accelerometers. Such networks consist of discrete sensors placed at specific locations to measure ground motion. In contrast, DAS employs fibre-optic cables to detect seismic signals continuously along the optic cable, offering a much denser spatial sampling while being sensitive only to ground motion along the cable. The main difference between the DAS and point sensor networks is in special sampling and sensitivity: geophones provide high sensitivity at discrete points in all three spatial components of ground motion, while DAS enables spatially continuous monitoring over extensive areas. Our newly developed software permits the evaluation of performance of the classical point sensors with the novel (DAS) method. In this study we show basic performance of DAS monitoring from a vertical borehole – the most common deployment. We also simulate the DAS cable monitoring with a single three-component (3C) geophone on the surface and evaluate added value of point sensors.
1 Seismik s.r.o. | 2 GFZ Helmholtz Centre for Geosciences
* Corresponding author, E-mail: leo@seismik.cz DOI: 10.3997/1365-2397.fb2025026
DAS is a technology that uses fibre-optic cables to detect and measure acoustic signals over long distances but limited only to the motion along the cable, with the optical fibre itself serving as the sensing element. The gauge length in DAS refers to the segment of the fibre over which strain measurements are averaged, determining the spatial resolution of the sensing system. Shorter gauge lengths yield finer detail but potentially lower signal strength.
The magnitude sensitivity module is designed to estimate the magnitudes of microseismic events that can be theoretically detected by the network of receivers. This sensitivity (or detectability) varies in space and hence it is presented in the form of horizontal or vertical slices in the 3D space. The modelling uses attenuation of the dominant signal (based on the quality factor of the medium Q), and signal-to-noise ratio (SNR) necessary for seismic event detection. Results depend on the user specified velocity and attenuation model, estimated or measured noise levels, and detection method. The sensitivity is shown as maps of moment magnitude of an event, according to Kanamori [1977], evaluated from the scalar value of the seismic moment:
where M0 is the seismic moment in N-m.
The software computes minimal moment magnitude of an event, which will theoretically produce amplitudes on receivers necessary for the event detection. Amplitude levels for the event detection are dependent on local noise levels and signal-to-noise ratio necessary for particular detection method.
In homogeneous medium the seismic moment M0 reads as
where ρ if the density, v is the body wave velocity (P- or S-wave) and r is the distance from the source to the receiver. The term R is the provided radiation pattern factor and the source spectra Ω0 given the frequency f and displacement amplitude A is approximated as
where we use a zero-frequency limit approximation [Aki and Richards, 2002]. The variable f represents the peak frequency of the signal.
The term t* is the integral along the ray path of the inverse value of attenuation factor Q multiplied by the inverse of the wave velocity v:
which in a homogenous medium reads as
Sensitivity of the monitoring networks with unknown orientation of the source mechanisms is usually calculated with the average values of the radiation pattern, R = 0.52 for P-waves and R = 0.63 for S-waves [Hallo and Eisner, 2013] but exact source mechanism can be used if the source parameters can be estimated.
levels and detection
We compute strain over a set gauge length and along the cable direction, as well as the particle velocity of signal at point receivers. These values are compared with noise levels, which can be either estimated or directly measured. If the signal strength exceeds the noise level by a user specified threshold on a designated number of channels/receivers, we assume the signal is detected on such channel/receiver.
Additionally, it is possible to combine multiple geometry files for geophones and/or DAS cables in various configurations.
Vertical monitoring borehole with a single point receiver, constant noise level
In the first example, we calculate the magnitude sensitivity for a single 3C point receiver located at the top of a vertical borehole with a DAS cable. The noise level at the surface station is assumed to be 5 x 10⁻⁹ m/s representing a very quiet site. The DAS fibre channels are between 10 m and 3 km, with an assumed
gauge length of 10 m. The noise levels are uniform across all depths at a strain of 5 x 10-11. We set the P-wave velocity at 4300 m/s, with a Vp/Vs ratio of 1.73. The quality factors are Qp = 100 and Qs = 50 are representing sedimentary basin type of attenuation, and the density is 2300 kg/m3. We require detection on at least three channels with signal-to-noise ratio of at least 2.
The magnitude sensitivity is expected to be symmetrical, as illustrated in Figure 1. Note that the sensitivity is not influenced by the point receiver at the surface, and the sensitivity is dominated by the DAS monitoring, not a surprising result given the assumed low level of noise and higher number of channels closer to the monitored area. An interesting feature of the monitoring sensitivity is the zero sensitivity below the monitoring borehole. This lack of sensitivity below the borehole results from the inability to detect S-wave in this region. The S-waves are perpendicular to the direct rays to all channels on the DAS monitoring cable and therefore they are not detectable. As the location of microseismic events from a single vertical monitoring borehole requires both P- and S-wave, we assume such events would not be detectable. However, in reality, these events would be detectable, but only P-waves.
Another surprising decrease in sensitivity is observed at the middle depth of the monitoring array, i.e. approximately around 1500 m depth. This decrease in sensitivity is caused by reduced sensitivity to P-waves which are polarised along the rays approximately perpendicular to the monitoring array. This relative decrease of sensitivity is increasing with distance from the well as the rays from more distant events are more perpendicular to the rays. Similar to the previous area of low sensitivity, the event would be actually detectable by S-waves but would not be locatable due to the low sensitivity to P-waves.
It is important to highlight that these effects of low sensitivity have not been previously reported because we usually model 3C borehole sensors. Hence these areas are reflecting specific aspects of monitoring with DAS arrays only.
with a single point receiver, decreasing noise level
In this example, we compute the magnitude sensitivity for the exactly the same monitoring array as described in the previous example,
Figure 1 Magnitude sensitivity for combined geometry with single station at the top of borehole with DAS cable with constant level of noise, vertical crosssection.
but with modified noise levels on the DAS cable. The noise level at the surface station remains at 5 x 10⁻⁹ m/s. However, the DAS fibre is assumed to observe the noise levels decreasing with depth. Specifically, the noise level of 5 x 10⁻⁷ at a depth of 10 m is assumed to be monotonously decreasing to 8.87 x 10⁻¹² at a depth of 3 km.
Figure 2 illustrates the increasing sensitivity of the array to lower magnitudes, as expected for a less noisy monitoring array. It is important to note that this scenario represents a more realistic nature of downhole monitoring where noise decays with depth. Typically, for near-surface monitoring, the noise decreases even more rapidly than a simple linear decrease simulated in our study.
Note that the area of low sensitivity is now shifted from the central depth to the bottom of the monitoring array, while the low sensitivity below the array remains nearly unchanged compared to the previous example. The shift to the reduced sensitivity from the centre to the bottom of the array is due to the fact that the most sensitive monitoring channels are located at the bottom of the array in this scenario, and hence these receivers determine the overall sensitivity of the monitoring array.
We have developed a novel methodology to assess the sensitivity of combined monitoring arrays that incorporate Distrib-
2 Magnitude sensitivity for combined geometry with single station at the top of borehole with DAS cable with noise decreasing with depth, vertical crosssection.
uted Acoustic Sensing (DAS) cables and point receivers. This advanced methodology allows us to evaluate the performance of a single vertical monitoring array showing areas of low sensitivity below the monitoring borehole and at the depth corresponding to the lowest noise channels of the DAS cable. These aspects of the monitoring with DAS cables were not previously documented or discussed in the literature and represent specific challenges to microseismic monitoring design and performance.
References
Aki, K. and Richards, P.G. [2002]. Quantitative Seismology. University Science Books, ISBN 9780935702965.
Anikiev, D. [2025]. PyNetDesign: a Python framework for microseismic monitoring network design (v1.0.0). Zenodo, DOI: 10.5281/zenodo.14945917
Halló, M. and Eisner, L. [2013]. Influence of the double-couple source model on the sensitivity of microseismic monitoring networks. 75th EAGE Annual Conference and Exhibition, Extended Abstracts, DOI: 10.3997/2214-4609.20131023.
Kanamori, H. [1977]. The energy release in great earthquakes. Journal of Geophysical Research, 82(20), 2981–2987, DOI: 10.1029/ jb082i020p02981.
To serve the interests of our members and the wider multidisciplinary geoscience and engineering community, EAGE publishes a range of books and scientific journals in-house. Our extensive,
Tom Davis1* reflects on how monitoring of CO2 in reservoirs over the course of RCP project has led to valuable insights.
Introduction
The Reservoir Characterization Project (RCP) of the Colorado School of Mines turned 40 this year. It is one of the longest-lived industry-academia consortia, thanks to all those involved in RCP. The Society of Exploration Geophysicists (SEG) gave RCP special recognition at the Denver Meeting in 2014 with the presentation of the SEG Distinguished Achievement Award. The 40 years of RCP is a story of accomplishment through the integration of people and disciplines.
It all started in the early 1980s when Amoco Production Company drilled a well into the Niobrara Formation in the Denver Basin 20 miles northeast of Cheyenne, Wyoming, in an area known as Silo Field. The Amoco Goertz B-1 well flowed 17,000 barrels a day and was the best well in the Denver Basin. Other wells were drilled offsetting this remarkable well, yet some of them showed communication with the original well. Given the extremely low permeability of the Niobrara Formation, the conclusion was that the formation must be fractured. The question then became, ‘Could seismic help us characterise this fractured reservoir?’
In 1983, Stuart Crampin of the British Geological Survey published a paper illustrating the diagnostic use of shear waves, horizontally polarised waves that emanated from deep earthquakes in the crust below the British Isles. Crampin used measurements of shear wave splitting to characterise the deep structure of the subsurface. Could this new seismic technology be used to characterise the fractured Niobrara in the vicinity of the Amoco discovery? I met with industry representatives in November 1984 to gauge their interest in funding a consortium to explore what could be learnt from applying this new shear wave technology to help characterise the Niobrara fractured reservoir.
Claude Vuillermoz, CGG’s centre manager in Denver, indicated that he would encourage CGG (now Viridien) to conduct seismic operations to test the merits of applying shear wave technology to the study if sufficient funding could be obtained to offset the cost of conducting the seismic operation.
I approached George Ansell, president of the Colorado School of Mines (CSM), regarding the formation of an industry consortium. His comment was ‘We support your vision, but don’t
1 Colorado School of Mines
* Corresponding author, E-mail: tdavis@mines.edu
DOI: 10.3997/1365-2397.fb2025027
screw it up’. Armed with this backhanded endorsement, I formed a consortium entitled ‘The Reservoir Characterization Project’ or simply RCP to leverage emerging technologies and a focus on practical, tangible and economic results. RCP became the first industry/academic consortium at CSM.
Around 12 companies joined the newly formed Reservoir Characterization Project for the first field project. A 5-mile 2D, 9-C seismic line was acquired in 1985 through the heart of Silo Field. A vertical seismic profile (VSP) was acquired in a well near the seismic line to tie the seismic line to the subsurface. The successful results proved the concept of using shear waves to characterise the fractured Niobrara reservoir at Silo Field. These results were first shown at the SEG annual meeting in 1987 at a special session on Seismic Anisotropy and were featured in The Leading Edge in June of that year.
Armed with the success of 2D, 9-C recording at Silo Field, RCP’s Phase II was proposed to conduct the first-ever 3D, 9-C seismic survey over the Silo Field. That survey was conducted by CGG for the RCP in January of 1987. It was a tremendous success in that it showed the power of azimuthal shear wave anisotropy to quantify areas of high fracture density in the Niobrara, The results ultimately led to the drilling of the first horizontal well in the Rockies in 1990. That well was the best well in the field and triggered the Niobrara shale development boom.
One feature that made RCP unique was the request for industry to propose projects for each research phase. The projects generally took on a lifespan of two years and involved the acquisition of multi-component seismic data. Generally, four to five projects would be proposed by industry and then a singular project for the research was chosen by popular vote of the consortium members. The next RCP project involved a ‘sheep-herder’ anticline on the Casper Arch. The field was a heavy oil field that was beginning to be steam flooded and the goal was to see if seismic reservoir
characterisation could assist in the development of the reservoir. The reservoir was the Tensleep Sandstone of Pennsylvanian age. It was approximately 400 ft thick and largely categorised as an eolian or wind-blown sandstone. The Tensleep is exposed at the surface at Casper Reservoir just south of the field. Detailed field work was conducted to study the potential for flow units in the formation. Overall, the concept of placing steam injectors down-structure near the oil-water contact seemed like a logical design for the flood. What was not anticipated was what the seismic revealed in imaging this reservoir. Not a single fault or fracture zone was shown on the basis of structural mapping from well control in the field. More than 40 wells had been drilled on this structure prior to the steam flood. The seismic showed wrench faults that compartmentalised the reservoir. These faults and fracture zones controlled the steam flood. Steam moved along the fault and fracture zones and bypassed the heavy oil in the matrix blocks of the reservoir. A complete transformation of the injection patterns had to occur to make the flood economic.
Meridian Oil Company brought us Cedar Hill Field. Cedar Hill is located south of Durango, Colorado across the New Mexico line. It is named after the cedar trees that grow on a hillside in the area. Archeological surveying conducted before our 3D, 9-C seismic survey identified a number of ancient sites. This general area is famous for the ‘ancient ones’ or Anasazi who inhabited the area of Southern Colorado and Northern New Mexico. What brought us to Cedar Hill was the discovery of coalbed methane. Vertical wells were drilled into the Fruitland Coal and the water pumped off allowing the methane to be produced out of the wells. The Fruitland Coal was naturally fractured into cleats shortly after its formation and burial. RCP’s work showed that natural fractures due to faulting in the area amplified the pre-existing natural fractures originally formed. Controlled blow-outs or cavity completions enhance the well production and were most effective where tectonic enhancement of the fracture systems occurred. The strike-slip faults in the area also created sealing faults and reservoir compartmentalisation. Finding areas of greater fracture density that were overpressured led to finding higher productive wells. Azimuthal AVO (amplitude versus offset) analysis of P-wave seismic data went on to be the technology that opened up this play. Our studies led the way for this technology breakthrough and its application.
Joffre Field, Alberta
Canadian Hunter brought the Joffre Field to RCP in 1993 as the next project. The field is located just north of Red Deer, Alberta. The field was developed using 5-spot water flooding where the water injector is located in the middle of the pattern. The reservoir is the Devonian Nisku dolomite which is a packstone/ grainstone facies that grades up-dip into an anhydrite plugged sabkha. Underlying the Nisku are pinnacle reefs in the Leduc Formation. RCP undertook the first 3D, 9-C seismic survey in Joffre Field. The 6 mile2 survey was conducted on farmland before the planting season began. The results were astonishing. The Leduc pinnacle reef was imaged by the shear data whereas the p-wave data did not show the reef except indirectly due to the
differential compaction structure it created. The Nisku reservoir was delineated using predominately the amplitudes of the shear wave data because of the thinness of the reservoir. The amplitudes of the shear wave data were shown best on the fast shear wave volume as controlled by lithology and porosity. The vuggy nature of the reservoir was revealed in contrast to the areas of anhydrite plugging. The slow shear wave volume indicated the existence of fracture zones in the reservoir. On the basis of our work, NAL Resources, a sponsor outbid Canadian Hunter and bought the field from Imperial Oil. NAL went on to drill horizontal wells in the field. They positioned the wells parallel to the northeast trending fracture zones as prior waterflooding from vertical wells had not taken into account fractured zones in the Nisku reservoir. Other areas not previously developed up-dip were also encountered where the anhydrite plugging was not as pervasive as previously thought on the basis of well control alone.
Sorrento Field in Southeast Colorado was brought to RCP by Union Pacific Resources (UPR). The Pennsylvanian Morrow Sandstone is a very elusive reservoir as P-wave seismic data has led to a lower success rate in drilling than just by wildcat drilling. The reason for this alarming figure is that the acoustic impedance of the sandstone and the surrounding shale is identical. These reservoirs are invisible to P-wave seismic alone. Rock Physics studies of the Morrow showed that the shear impedance of the sandstones and the shales was dramatically different, so a 6 mile2 3D, 9-C survey was conducted at Sorrento Field. Shear waves imaged the point bar deposits in the fluvial valley fill system. In addition, Vp/Vs measurements highlighted the presence of a gas cap in the reservoir. After our work UPR drilled successful horizontal wells in the field.
Vacuum Field on the Northwest Shelf of the Permian Basin near Hobbs, New Mexico was the site of our first 4D, 9-C study in 1995. Texaco proposed the project to RCP to determine if carbon dioxide (CO2) flooding in the Permian San Andres dolomite reservoir could be monitored with seismic data. Two phases of study were undertaken. The first phase involved monitoring a single well huff and puff injection of 50 million scf of CO2 over a two- month time-period. A baseline 9-C survey was shot centered on the CVU-97 well. Two months later and after the CO2 injection was complete, a second seismic survey was conducted. Nothing was seen on the P-wave data, but the shear wave data showed the CO2 and its movement up-dip where it banked against a sealing fault. A second phase was conducted involving the monitoring of a six-well injection pilot in which 6 BCF of CO2 was injected over a period of a year. A baseline survey was shot prior to the start of injection and a monitor survey was shot a year later. Shear wave data showed where the CO2 banked against an updip sealing fault and also where the CO2 had the potential to escape on the east side of the pilot area. This was the first time that monitoring had been done with shear wave azimuthal anisotropy and showed that even stiff, low porosity, carbonate reservoirs could be monitored with shear wave technology. The field has been flooded since 1997 due in large part to our work. Two other benefits occurred from this
project. The first horizontal well was drilled on the downside of the sealing fault resulting in the best well in the field and the best well in the state of New Mexico in 1998. In addition, monitoring showed the presence of CO2 causing moveable oil to form within the residual oil zone. The ROZ is a major resource that was bypassed by waterflooding but contributed significantly to the reserves of the field through CO2 flooding.
Like Vacuum Field, Weyburn Field in Saskatchewan is a giant field whose reservoir is a fractured carbonate. Unlike Vacuum the reservoir is 1/8th of the thickness, averaging 80 ft. Depth is similar at 4500 ft. The frequency range of seismic data that can be acquired at Weyburn especially during the wintertime is twice that of the Permian Basin. Frequencies up to 150 hertz on the P-wave data were acquired whereas 80 hertz was the upper limit for the S-wave data.
Three 4D-9C seismic surveys were conducted in a 9 km2 area of Weyburn Field during the start up of the CO2 flood. Exciting new shear wave vibrators were employed thanks to Industrial Vehicles International (IVI) and to Input/Output. The advantage of these vibrators is that all three ground motions (one vertical and two orthogonal horizontals) can be imparted at one vibrating point without moving the vehicle.
Weyburn is the largest horizontal well injection project in the world and has been operating since 2000. Initially, the project was expected to last 30 years to process the field and result in an incremental recovery of 8%. With multi-component seismic monitoring and dynamic reservoir characterisation, as currently employed by Encana/Cenovus and now WhiteCap CO2, flooding will extend the life of the field by 60 years and result in 20% incremental recovery (400 million barrels).
RCP’s Weyburn Project showed inconsistent sweep efficiency in the Midale Carbonate reservoir. This inconsistency was largely due to natural fractures in the reservoir. These fractures were initially thought by the operator Pan Canadian/Encana/Cenovus and now White Cap to be northeast oriented. The horizontal wells were all drilled on a northeast-southwest twin-leg pattern of a kilometre length and 300 m between the well legs. Our 4-pattern monitoring study conducted in 2000, 2001 and 2002 showed that one pattern had breakthrough in four months whereas the simulation study predicted two years. Another pattern had reduced injection by ‘sludge’ forming in the injection well. Another pattern showed downward movement of the CO2 into the underlying Frobisher Formation and the fourth pattern showed little or no injectivity and was shut in after a year of attempted injection. Huge areas of the reservoir were being bypassed by the flooding patterns. Subsequently horizontal injection wells were drilled in an orthogonal direction in these bypass areas and some vertical wells were also converted to CO2 injectors. The whole roll-out of the field development program was slowed down until adequate reservoir characterisation studies could be undertaken.
Colorado
By 2003, methane gas prices were spiking at 12 to 14 dollars per mcf. The hunt for tight gas was on and Williams Production Company welcomed RCP to Rifle, Colorado to see if we could
unlock the secrets of tight gas in the Mesaverde Formation. We shot three 3D, 9-C seismic surveys on ranch land just west of Rifle and on the north side of Interstate 70. Surveys were shot in 2003, 2004 and 2006 as development drilling occurred in the area. Vertical wells were generally drilled into the Cameo coal below the Mesaverde and then hydraulically fractured in set stages over the length of the Mesaverde. The goal of our work was to see if we could identify the best areas for drilling and to help target the hydraulic fracturing of these wells. The outcome was very successful as areas of enhanced tectonic fracturing due to strike slip faulting were identified and communication zones between the Cameo Coal, and the underlying Mancos Formation were characterised as pathways for the gas to migrate upward into the Mesaverde. Identifying where the gas was coming from was a major step forward in this play. The time-lapse shear wave data enabled that discovery.
From the Rockies to this next project in Louisiana, the contrast could not have been more stark, from a reservoir where permeability is measured in micro-darcies to that which is measured in darcies. The reservoir at Delhi Field in northeastern Louisiana is the Paluxy and Tuscaloosa Sandstones. These sandstones are sealed updip by an angular unconformity. Denbury Resources from Plano, Texas brought us Delhi as they wanted to see what multi-component seismic monitoring could tell us about how to flood the field with CO2. The CO2 is sourced from Jackson Dome, a buried volcano under Jackson, Mississippi. A pipeline was built from Jackson to Delhi and involved piping the CO2 under the Mississippi River at a cost of $300 million. Two time-lapse 3D, 3-C surveys were conducted at Delhi. The first survey was at the beginning of the flood, the second a year and one-half later. Operating in swamp conditions was unbelievably challenging. These surveys could not have been conducted without the new FireFly nodal seismic system provided by INOVA Geophysical. The permeability structure of the underlying Paluxy Formation involved a north-south directional component related to the ancestral delta system it was formed out of. The converted shear wave data showed this north-south trend vividly whereas the P-wave data showed primarily where the CO2 banked against the sealing unconformity near the updip injection wells. The second survey showed where the CO2 migrated southward into the waterleg in the reservoir. Subsequently Denbury drilled downdip water injection wells to build up pressure in the water-leg to keep the CO2 from going out of zone. The increased pressure in the Paluxy eventually caused gravity overriding and pooling of the CO2 in the overlying Tuscaloosa. This pressure build-up in the Tuscaloosa was worrisome as the depth of the reservoir was only 3000 feet and pressures got to the point of exceeding the fracture gradient. Subsequently well injection pressures were dialled back.
Postle Field is located in the Panhandle of Oklahoma. Guymon, Oklahoma, a farming community, was the base for RCP’s operations in what formerly was recognised as ‘Outlaw country’. Unsavoury people who couldn’t get along with the law in the late 1800s migrated there. Subsequently in the 1930s during the
dust bowl everyone wanted to leave. Oil was found in the 1950s and prosperity came to the region. By 2010 the giant Postle Field north of the city of Guymon was beginning CO2 flooding and the same person who brought Vacuum Field to RCP, Scott Wehner, in the mid-Nineties brought the Hovey Morrow Unit of Postle Field to monitor. By that time it was commonly believed that P-wave seismic data in the Morrow didn’t work. But what about 4D or time-lapse? Could the shear wave data show the channels in the Morrow as it did in southeast Colorado at Sorrento Field? The answer to both questions turned out to be a resounding ‘yes’. Firstly, we were able to map the channels in the Morrow that dominantly ran north-south in an incised valley. The channel belts were relatively thin and even on a well spacing of 40 acres these channels could be missed. Flooding on a five-spot program with the injection well in the middle could be prone to bypassing parts of the reservoir. That was shown vividly by the time-lapse seismic data where the CO2 migrated along a channel belt largely between producers. Pattern reconfiguration and balancing was undertaken to further optimise the flood on the basis of our data and wells were drilled into areas where we determined the Morrow Sandstone was present.
By 2013 RCP finally moved home to the Denver Basin. Anadarko Petroleum Company was beginning to drill horizontal wells into the Niobrara Formation in the deep part of the Denver Basin. They were conducting a spacing test to determine if they could optimise recovery from the Niobrara. Wells were drilled in a section to test different spacing. Once the wells were drilled and hydraulically fractured they weren’t flowed back until RCP’s baseline 3D, 9-C survey was completed. The monitoring survey was scheduled shortly after the wells were put on production. However, nature’s own version of a waterflood changed the schedule. Over 13 inches of rain fell in a week-long period, in an area where average annual rainfall is 15 inches. The flooding set back the project by four months. Nevertheless, we conducted the monitoring survey and found substantial value in the results. Mapping the natural fractures in the Niobrara from the shear wave data proved critical in observing how these fractures change over time. Needless to say the best wells occur in the highly natural fractured areas near faults and fault intersections. Hydraulically fracturing these areas requires less bang for the buck. In fact diversion methodologies win the day. Hydraulic fracture optimisation can save a substantial amount of money. Operators are now moving to gas injection for pressurisation and even refracturing.
We established from our shear wave monitoring that only 30% of the Niobrara in the one section (one square mile) area from eight horizontal wells was only accessing 30% of the reservoir.
After the success at Wattenberg Field, operators in the Denver Basin brought two other fields forward to see how the recovery factor of the Niobrara could be increased. Many companies were starting to use fibre-optic cables in their horizontal wells to see how hydraulic fracturing could be optimised. Local stress conditions in the basin vary dramatically and taking advantage of this knowledge is beneficial. Understanding the role that faults and natural fractures play in the Niobrara is key to successful reservoir development.
RCP lives on but the old guard changes. I retired in 2016 but stayed on to oversee completion of a dozen students from 2016 to 2018. Dr Ali Tura became RCP Director in 2017, and Dr Ge Jin joined him as co-director shortly thereafter.
During the 40 year tenure of RCP several ‘one off’ projects were also undertaken that took place in Sinclair Field, Manitoba, Pouce Coupe, Alberta, Cold Lake area, Alberta, Zakum, Field, offshore Abu Dhabi, Kuwait and the Neuquen Basin of Argentina to name a few.
RCP was formed because the average recovery factor of our conventional reservoirs is 25% for oil reservoirs and 50% for gas. The recovery factor of unconventional reservoirs is 8%. We need to do a better job of increasing the recovery factor and one way of doing it is better reservoir characterisation as exhibited in all the RCP studies undertaken. Carbon dioxide is the ultimate enhanced oil recovery agent as demonstrated by RCP.
I would like to acknowledge the students who worked with the different phases of RCP. The most important value of RCP to the industry is preparing students in a multi-disciplinary environment so they are well prepared for their careers. Industry sponsorship of RCP was tremendous. More than 300 companies supported RCP during its 40-year legacy to the tune of well over $100 million. Finally, I would like to thank my colleague Bob Benson for his role as co-director, Sue Jackson for her role as program manager and cat-herder, our advisory board and the administration and faculty of Colorado School of Mines for their staunch support of this endeavour. Thankfully, we didn’t screw up.
Ashley Uren1, Joseph Jennings1* and Graeme Nicoll1 develop previous subsurface predictions by considering a series of additional factors that can help to make more informed decisions on where best to continue a CCS project.
Reduction of CO2 emissions to reach net zero targets is achievable with a range of methods that includes geological storage in the subsurface. This is a crucial option to reduce the emissions of harder to abate industries, with saline aquifer storage considered to be one of the largest contributors towards that goal (IEA, 2020). At a basic level, a saline aquifer requires an effective storage reservoir that is overlain by a containing seal. However, to determine the storage options during an initial screen, assessment of specific subsurface and top-side economic and feasibility criteria is also needed. During screening some of these criteria can be characterised by common chance maps (CCMs), as previously discussed by Smith et al. (2023). This process can be expedited using datasets from the Neftex® solution within our on-demand screening application, FairwayFinder, to produce CO2 storage fairway CCMs (Figure 1).
In this article we look to develop previous subsurface predictions by considering a series of additional factors that can help to make more informed decisions on where might be best to continue a CCS project, with reference to subsurface learnings from historical CCS operations (Figure 2).
Over the last 30 years there have been a growing number of demonstration and commercial carbon storage projects involving both saline aquifers and depleted petroleum fields. The majority of these have achieved or are achieving the predicted injection volumes and secure storage of CO2 in the
subsurface (Figure 3A). A select number of high-profile projects have however, been cancelled or altered due to operational challenges when encountering significant issues in the subsurface (Figure 3A) or have highlighted subsurface challenges that need to be further assessed as part of any future operation (Figure 3B).
Whether a seal will effectively hold back CO2 in the subsurface is a critical part of any CCS project assessment. Therefore, understanding the following seal criteria is necessary:
• Thickness and lateral continuity
• Lithology (its variability, capillary pressure threshold, and geochemical stability)
• Structural complexity (fault and fracture presence, their pressure capacity and bed dip)
• Seal mechanical stability
• Legacy wells
• Secondary seals in the overburden
Some criteria in this list are reasonable to define at the screening stage like the thickness and lateral variability of an interval, along with the lithology. In-house gross depositional environment (GDE) maps, coupled with well and seismic data that underpin that mapping, provide much of the information that can constrain these, which are the main inputs into our in-house screening application (Figure 1). Other factors, however, require more specific data that is discussed below.
1 Halliburton
* Corresponding author, E-mail: Joseph.Jennings@halliburton.com
DOI: 10.3997/1365-2397.fb2025028
Figure 1 Use of Neftex® datasets and models that are amalgamated and processed in FairwayFinder, an on-demand screening application, to generate CCMs for the critical factors in saline aquifer carbon storage (from Smith et al. 2023).
The capillary pressure threshold of a seal provides a way to indicate the storable CO2 column height before pore leakage can occur (Daniels and Kaldi, 2008). Mercury injection capillary pressure (MICP) tests are the most common method to constrain this. However, these are not always available, hence the need for a predictive scheme. There are reasonable correlations between permeability, grainsize and pore throat size with capillary pressure threshold (e.g. Sneider et al. 1997; Espinoza and Santamarina, 2017), but these data are also not typically available at the screening stage. Data that is generally available is depth and lithology, with some localised schemes highlighting use of that data (e.g. Dawson et al. 2004). The global applicability of these schemes is unclear. Instead, an in-house global database of MICP data is standardised for lithology, depth from sediment surface, interfacial tension and contact angle conversion model, with the results in Figure 4. This can be used to predict the CO2 plume or storage column height across a fairway before capillary flow begins to occur, if seal lithology and depth is known, e.g. Figure 2C and Uren et al. (2024).
Fault reactivation risk indication
Structural complexity, whether that is faults, fractures, or even bedding dip all influence how appropriate a seal is for carbon
storage, with leakage and partial seismicity potential being the main risks. Operational CCS projects have only to date observed 1-2 magnitude earthquakes (Figure 3), although a link has been made between when CCS reaches larger scales to wastewater injection after hydraulic fracturing, with the latter linked to 3-4 and even 5 magnitude earthquakes (e.g. Zoback and Hennings, 2024). To provide an indication of the risk relating to fault reactivation and resulting seismicity at the screening stage, world stress map data (Figure 5A-B; Heidbach et al. 2016; 2018) can be combined with in-house regional fault data (Figure 5C) and a calculated stress magnitude, to determine pressure to slip using workflows from Zoback, (2007) (Figure 5D). The results can indicate locations where the risks are a lot higher than others and so should possibly be screened out (e.g. Figure 2F). A relative risk indication scale is used due to the uncertainties inherent in assessments made with regional-scale datasets (Figure 4D).
Seal mechanical stability
Another necessary consideration is to avoid fracture of the seal, especially in pressure-limited scenarios as illustrated by the In Salah project (Algeria) and others (White et al. 2014). The fracture gradient is highly influenced by the seal’s mechanical
Figure 2 An illustration of the typical constraints and impacts that could be used during a CCS screening project with use of a 2D subsurface section. A) Example 2D subsurface section; B) Standard CCS screen with the supercritical CO2 storage upper cut off, a lower cut off and reservoirs indicated; C) A CCS screen extended to indicate reasonable amounts of CO2 storable beneath a seal; D) Further extended to also consider impact of reservoir heterogeneity; E) Extended to consider the likely pressure system constraints; F) Final consideration also includes faults. Compare and contrast extent of the likely system in B vs F.
properties like the ductility/brittleness and pressure constraints, with the former dependent on compaction, mineralogy variations and type of fluid in pores or fractures. Combined well tests and seismic assessments are the desired approach (e.g. Fawad et al. 2021). However, at the screening stage specific well logs can be utilised to constrain the fracture gradient to derive expected values for an interval. An in-house database of seal properties and well logs can be utilised in an initial assessment.
Legacy wells
Legacy wells provide a potential pathway for CO2 to migrate through a seal, as demonstrated during historical CO2 enhanced oil recovery operations (Vikara et al. 2019), and more recently saline aquifer storage operations in Illinois, USA (Snider, 2024).
A detailed assessment of the completion and plugging of a well is needed to properly consider this (e.g. Arbad et al. 2022). However, this process is extremely time consuming, hence a need to have indicators at the screening stage to highlight a potential risk. These indicators include presence, density and age of wells, plus the stratigraphic interval that the well has penetrated. It is possible to identify the stratigraphy that a well has penetrated by using information from an inhouse global well database and/or through use of in-house depth surfaces.
Reservoir effectiveness
The reservoir represents the subsurface interval that CO2 will be injected into and stored within, with the below factors important for assessing and enhancing its characteristics:
• Gross and effective net thickness
• Porosity-permeability
• Pressure system
• Reservoir heterogeneity
• Lithology geochemical stability
• Salinity
• Connection to freshwater aquifer or the sea floor
The basic information that tends to be available at the screening stage is the thickness and porosity-permeability. Thickness can be derived from inhouse well interpretations and depth surfaces. Porosity-permeability can be from multiple sources like core
Figure 3 A), Summary of whether CCS projects over the last few decades have achieved the safe storage of CO2 with no major issues or encountered major issues that led to cancellation/suspension. Impacted projects and cause are indicated. B), A frequency of subsurface challenges all projects faced when injecting CO2 into the subsurface. Both diagrams do not include any economic or above ground-related issues. Data is based on a Neftex® Prediction’s compilation of carbon storage projects, and fairway to site options.
plug, formation tests, and wireline log assessments (Figure 8). Other factors are discussed in more detail below.
A fundamental factor that could ultimately impact the success of a utilised reservoir is the susceptibility of it to building up pressure during CO2 injection, with many projects having observed this to be a critical challenge. Factors that influence this can include the extent of the reservoir (e.g. Figure 2E), reservoir heterogeneity, the reservoir fracture gradient, and sealing nature and pressure limits of faults and fractures. In-house regional maps of gross depositional environment (e.g. Figure 1) can provide an initial constraint on the potential extent of the reservoir, and structural datasets can be used as an initial indication of fault compartments and reactivation risk (Figure 5).
If the reservoir is thought to be a near closed system, i.e. where pressure can’t reasonably dissipate from the injection site, or is needed as the alternative endmember to an open pressure system estimate, then the storage efficiency factor used must be calculated. To determine that, the volume generated with increased pressure, and the pressure maximum for the system need to be calculated, with the latter typically based on the fracture gradient of the reservoir rock under subsurface pressure conditions. The fracture gradient can be predicted using various methods (reviewed in Zhang and Yin, 2017), though directly determining the fracture gradient from leak off pressure test data is the desired approach (Ringrose et al. 2023). This data is not always available and so an option is to use characteristic analogue trends from either a regional or global dataset (Figure 6; Thompson et al. 2022).
The way that net thickness is distributed within a reservoir, i.e. thin vs. thicker and lateral connected packages will impact how appropriate storing significant quantities of CO2 will be with limited wells. These variations are known to have negative consequences for CCS projects, whether that is not finding effective reservoir, or contributing to more rapid pressure build up (e.g. Hansen et al. 2013; Garnett et al. 2014). On the other hand, some vertical reservoir heterogeneity is useful to increase
Figure 4 A) Result from amalgamating MICP measurements from across the globe to generate a model of clastic seal lithology vs. depth vs. capillary threshold pressure, with data derived from Neftex ® databases. The R2 is indicated for each of the trendlines and where possible the resulting data is connected to quantitative XRD results. B) A summary of the results from A with some additional trends added to include the variability in the data results. Linear trend lines are used because of data availability not being sufficient to generate more detail (after Uren et al. 2024).
Figure 5 A) Stress regime data as indicated by the world stress map, with an associated grid where it is coincident with data in B) Maximum horizontal stress azimuth from the world stress map (Heidbach et al. 2016; 2018). C) A map of Neftex ® global fault database. D) A map of the relative risk indication of potential for fault reactivation calculated for each fault segment.
the storage efficiency (e.g. Furre et al. 2017) and so a balance must be achieved.
At the initial screening stage before detailed seismic interpretation, available well data can be used to provide an indication of the vertical heterogeneity. Several statistical log-based methods exist, such as Lorenz or Dykstra-Parsons Coefficients (reviewed in Fitch et al. 2015). Here we highlight Delta variance (Davies et al. 2023), a method that can quantify heterogeneity at the fine- and meso-scales. This method assesses the gradient of the variance of log data, with an example of it enacted in Figure 7B. Bed package thickness variability is another option (Uren et al.
2024) that is focused on the meso-scale bed package thickness variability in a reservoir. By considering thinner bed packages as representing an increased reservoir heterogeneity, exclusion of beds below a specified threshold can indicate heterogeneity by considering the difference between the original and updated net sand assessment (Figure 7C-D, Figure 2D).
Lateral reservoir heterogeneity can be constrained during screening in a different manner, by considering an intervals environment of deposition. Depositional environment impacts the likelihood that reservoir bed packages are connected and communicate over reasonable distances. A couple of examples
with expected better communication would be wave-dominated delta fronts or braided fluvial systems compared to potential poor intervals that would be fluvial-dominated delta tops or turbidite channel complexes (e.g. Tyler and Finley, 1991; Noad et al. 2024). In-house paleoclimate models could be utilised to predict where these variations within depositional environments may occur.
Reservoir geochemical stability
Geochemical stability of the reservoir is a consideration due to the dissolution and precipitation of minerals from acidification of pore water that CO2 and other molecules will generate in the subsurface (examples: Baines and Worden 2004; Cseresznyés et al. 2021). It has been shown that during the initial phase of injection calcite will dissolve, plus silicates such as K-feldspar and chlorite over time. New precipitation of minerals will begin over various timeframes depending on the dissolved mineral composition and CO2, with calcite, dawsonite and ankerite being
common. For this reason, reservoirs that are more homogenous can be considered as a safer option. However, porosity and permeability, and thus injectivity, increase with mineral dissolution, at least initially. This was surmised to have been the cause of the ‘10-fold’ increase in injection rates during the Shenhua Ordos CCS pilot in China (Yang et al. 2017). Therefore, there may be some benefit to mineral heterogeneity, as long as significant dissolution doesn’t impact reservoir stability, and if medium-longer term mineral precipitation can be reasonably constrained. To make an initial assessment of a reservoir’s mineral composition, in-house databases can help to inform the characteristics to expect (Figure 8).
Reservoir salinity
Salinity of the formation water is another factor that needs a balance. During CO2 injection salt precipitation has adversely impacted injection rates into saline aquifers, and higher salinity
A) Leak off pressure derived from leak off tests (LOT), and fracture closure pressure from extended leak off tests (XLOT) as it exists in Neftex ® databases, with typical trends for the hydrostatic and lithostatic gradient overlain. Also illustrated is a mid-range along with high and low trends through this data to determine the fracture gradient, as well as where data becomes too sparse and a typical 75% trend can be utilised instead. B) An example from the US Gulf of Mexico region with the impact using the updated storage efficiency factor has on the storage resource distribution.
Examples of methods to assess the variations in vertical reservoir heterogeneity across a reservoir. A) Original net sand estimate for the Jurassic Åre Formation within the Norwegian Sea, with wells indicated by the black dots. B) Delta variance use in indicating areas of the reservoir with greater fine-to-meso-scale heterogeneity. C) Removing certain bed package thicknesses from the initial net sand assessment use for indicating the heterogeneity, through both the update to the net sand map and a difference map generated from that in comparison to A.
Figure 8 An example from Neftex® PoreExplorer dashboard which allows filtering based on the composition of reservoir intervals, which is important in determining the potential geochemical stability of the reservoir. This data is also connected to measured porosity-permeability across the globe.
water causes a rock to become more water-wet — that reduces residual trapping and lowers the amounts of CO2 that can be dissolved (e.g. Steel et al. 2016; Chaturvedi et al. 2021). Therefore, low salinity is preferable for CO2 storage on the proviso that potable water sources are not impacted.
Older schemes indicate that salinity should be >30,000 mg/l and preferably >100,000 mg/l (e.g. Chadwick et al. 2008) to avoid any chance of CO2 injection into usable potable water. Most hydrogeology schemes, however, have saline water as >10,000 mg/l, with freshwater that is not brackish considered to be between <600 to <2000 mg/l (USGS, 2018; Bloomfield et al. 2020).
Therefore, a potential revision to this consideration might be that although injection into potable water is prohibited, lower salinity will be more advantageous. This will typically be in shallower parts of a reservoir due to strong salinity-depth trends (e.g. Bloomfield et al. 2020), though at shallow depths a consideration of whether there is direct connection between a site and a freshwater reservoir will be required. An in-house water geochemistry database can also help to make these types of assessments at the initial screening stages, with a database compiled and standardised for certain areas of the globe.
Conclusion
Screening for CCS options in saline aquifers is a multi-faceted task, with assessment of the reservoir and seal being the main subsurface features to consider during the initial screen. Seals must have the ability to contain CO2 in the subsurface for a significant timeframe, with thickness, lithology i.e. its capillary pressure threshold and mechanical stability, and its structural complexity and implications being the main factors to consider.
For the reservoir, injectivity and capacity must be sufficient, among the pore volume factors that influence success is the impact of reservoir heterogeneity and other factors on the likely pressure system. Geochemical stability of the rock and fluid is also worth considering.
Understand these factors early on will contribute to more informed subsurface decision making when looking to progress projects to the next phase. Neftex® models, technologies and databases can contribute to this, whether through generating CCMs of the fairway, identifying applicable analogue models or providing collated and standardised datasets from one easy-toaccess resource. This ultimately leads to a more efficient roadmap to better understanding subsurface uncertainty, allowing users to identify risks and potential operational challenges in their saline aquifer operations.
References
Arbad, N., Watson, M. and Heinze, L. [2022]. Risk Matrix for Legacy Wells within the Area of Review (AoR) of Carbon Capture & Storage (CCS) Projects. International Journal of Greenhouse Gas Control, 121, 103801.
Baines, S.J. and Worden, R.H. (eds.) [2004]. Geological storage of carbon dioxide. Geological Society of London, Special Publication 233, 264 pp.
Bloomfield, J.P., Lewis, M.A., Newell, A.J., Loveless, S.E. and Stuart, M.E. [2020]. Characterising variations in the salinity of deep groundwater systems: A case study from Great Britain (GB). Journal of Hydrology: Regional Studies, 28, 100684.
Chadwick, R.A., Arts, R., Bernstone, C., May, F., Thibeau, S. and Zweigel, P. [2008]. Best practice for the storage of CO2 in saline aquifers, British Geological Survey Occasional Publication, 14, 267.
Chaturvedi, K.R., Ravilla, D., Kaleem, W., Jadhawar, P. and Sharma, T. [2021]. Impact of Low Salinity Water Injection on CO2 Storage and Oil Recovery for Improved CO2 Utilization. Chemical Engineering Science, 229, 116127.
Cseresznyés, D., Czuppon, G., Király, C., Demény, A., Györe, D., Forray, V., Kovács, I., Szabó. C. and Falus, G. [2021]. Origin of dawsonite-forming fluids in the Mihályi-Répcelak field (Pannonian Basin) using stable H, C and O isotope compositions: Implication for mineral storage of carbon-dioxide. Chemical Geology, 584, 120536.
Daniels, R.F. and Kaldi, J.G. [2008]. Evaluating seal capacity of caprocks and intraformational barriers for the geosequestration of CO2. PESA Eastern Australian Basins Symposium III, Extended Abstract
Davies, A., Cowliff, L. and Simmons, M.D. [2023]. A method for fine-scale vertical heterogeneity quantification from well data and its application to siliciclastic reservoirs of the UKCS. Marine and Petroleum Geology, 149, 106077.
Dawson, W.C., Almon, W.R., and Johansen, S.J. [2004]. Seal and Reservoir Characterization of Upper Slope Fan Lithofacies: Example of High-Frequency Variability. American Association of Petroleum Geologists (AAPG) Annual Meeting, Extended Abstract
Espinoza, D.N. and Santamarina, J.C. [2017]. CO2 breakthrough—Caprock sealing efficiency and integrity for carbon geological storage. International Journal of Greenhouse Gas Control, 66, 218-229
Fitch, P.J.R., Lovell, M.A., Davies, S.J., Pritchard, T. and Harvey, P.K. [2015]. An integrated and quantitative approach to petrophysical heterogeneity. Marine and Petroleum Geology, 63, 82–96.
Furre, A.K., Eiken, O., Alnes, H., Vevatne, J.N. and Kiær, A.F. [2017]. 20 Years of Monitoring CO2- injection at Sleipner. Energy Procedia, 114, 3916-3926.
Garnett, A.J., Greig, C.R. and Oettinger, M. [2014]. ZeroGen IGCC with CCS: A case study. The University of Queensland, 483 pp.
Hansen, O., Gilding, D., Nazarian, B., Osdal, B., Ringrose, P., Kristoffersen, J.B., Eiken, O. and Hansen, H. [2013]. Snohvit: The history of injecting and storing 1 Mt CO2 in the Fluvial Tubaen Fm. Energy Procedia, 37, 3565-3573.
Heidbach, O., Rajabi, M., Reiter, K., Ziegler M. and WSM Team [2016]. World Stress Map Database Release 2016. GFZ German Research Centre for Geosciences, Helmholtz Centre Potsdam. Digital Dataset. https:// www.world-stress-map.org/download, accessed September 2024.
Heidbach, O., Rajabi, M., Cui, X., Fuchs, K., Müller, B., Reinecker, J., Reiter, K., Tingay, M., Wenzel, F., Xie, F., Ziegler, M.O., Zoback, M.-L. and Zoback, M.D. [2018]. The World Stress Map database release 2016: Crustal stress pattern across scales. Tectonophysics, 744, 484-498.
IEAGHG. [2011]. Caprock systems for CO2 geological storage. Report2011/01, May 2011, 123 pp.
IEA. [2020]. Energy Technology Perspectives 2020: Special report on carbon capture, utilisation and storage. https://iea.blob.core.windows.net/ assets/181b48b4-323f-454d-96fb-0bb1889d96a9/CCUS_in_clean_ energy_transitions.pdf, accessed November 2024.
Noad, J. [2024]. The sedimentology of high perm streaks and reservoir heterogeneity: Implications for CCS. The Magazine of Canadian Energy Geoscientists, 51(5), 20-29.
Ringrose, P. [2023]. Storage of carbon dioxide in saline aquifers: Building confidence by forecasting and monitoring. Society of Exploration Geophysicists, 2023 Distinguished instructor series no. 26, 139 pp.
Smith, J., Uren, A., Jennings, J., Butt, T. and Lang, C. [2023]. Adapting Hydrocarbon Workflows to Enable Efficient and Rapid Screening for CO2 Storage Potential. First Break , 41(10), 53-58. Snider, A. [2024]. https://www.eenews.net/articles/adm-finds-24other-wells-near-its-leaky-illinois-carbon-sequestration-site/, accessed November 2024.
Sneider, R.M., Sneider, J.S., Bolger G.W. and Neasham, J.W. [1997]. Comparison of Seal Capacity Determinations: Conventional Cores vs. Cuttings. In R.C. Surdam (Eds.). Seals, traps, and the petroleum system . AAPG Memoir no. 67, p. 1-12.
Steel, L., Liu, Q., Mackay, E. and Maroto-Valer, M.M. [2016]. CO2 solubility measurements in brine under reservoir conditions: A comparison of experimental and geochemical modeling methods. Greenhouse Gases: Science and Technology , 6(2), 197-217.
Thibeau, S., Bachu, S., Birkholzer, J., Holloway, S., Neele, F. and Zhou, Q. [2014]. Using Pressure and Volumetric Approaches to Estimate CO2 Storage Capacity in Deep Saline Aquifers. Energy Procedia , 63, 5294-5304.
Thompson, N., Andrews, J.S., Reitan, H. and Teixeira Rodrigues, N.E. [2022]. Data mining of in-situ stress database towards development of regional and global stress trends and pore pressure relationships. SPE Norway Subsurface Conference, Extended Abstract
Tyler, N. and Finley, R.J. [1991]. Architectural controls on the recovery of hydrocarbons from sandstone reservoirs, 1-5 in Miall, A.D. and Tyler, N., (eds.), The three-dimensional facies architecture of terrigenous clastic sediments and its implications for hydrocarbon discovery and recovery. Society for Sedimentary Geology, Concepts in Sedimentology and Paleontology , 3
Uren, A., Jennings, J., Nagardeolekar, S. and Evans-Smith, S. [2024]. Methods to further constrain static carbon storage resource estimates during regional-scale screening of saline formations. 85th EAGE Annual Conference & Exhibition, Extended Abstract USGS. [2018]. https://www.usgs.gov/special-topics/water-scienceschool/science/saline-water-and-salinity, accessed November 2018.
Vikara, D., Wendt, A., Marquis, M., Grant, T., Rassipour, R., Eppink, J., Heidrick, T.L., Alvarado, R., Guinan, A., Shih, C.Y. and Lin, S.M. [2019]. CO2 Leakage During EOR Operations – Analog Studies to Geologic Storage of CO2. United States, DOE/NETL2017/1865 , 157 pp.
White, J.A., Chiaramonte, L., Ezzedine, S., Foxall, W., Hao, Y., Ramirez, A. and McNab, W. [2014]. Geomechanical behavior of the reservoir and caprock system at the In Salah CO2 storage project. Proc. Natl. Acad. Sci. U.S.A , 111(24), 8747-8752.
Yang, G., Li, Y., Atrens, A., Yu, Y., Wang, Y. [2017]. Numerical Investigation into the Impact of CO2-Water-Rock Interactions on CO2 Injectivity at the Shenhua CCS Demonstration Project, China., Geofluids , 4278621.
Zhang, J. and Yin, S.X. [2017]. Fracture gradient prediction: an overview and an improved method. Pet. Sci. , 14, 720-730.
Zoback, M.D. [2007]. Reservoir Geomechanics.
Zoback, M.D. and Hennings, P.H. [2024]. The Geomechanical Challenges of Massive Scale CO2 Sequestration, 85th EAGE Annual Conference & Exhibition, Extended Abstract
OCTOBER 2025
AND
Simultaneous interpreting will be available at the event!
SEABED SEISMIC:
Submit your abstract today for the Third EAGE Seabed Seismic Today Workshop and take the opportunity to showcase your innovative research and groundbreaking findings. Join leading experts in the field of seabed seismic technology to exchange knowledge, spark discussions, and contribute to advancing the future of seismic exploration! 24-26 NOVEMBER 2025 • MANAMA, BAHRAIN
Abstract submission deadline: 30 April 2025
WWW.EAGE. ORG Submit your Abstract!
Stephen A. Sonnenberg1* provides an overview of passive seismic monitoring of underground gas injection sites, including CO2 sequestration.
Underground storage of natural gas, hydrogen, or compressed air is an effective means to meet fluctuating energy demand scenarios. Gases can be withdrawn to meet seasonal or daily energy requirements. Gases can be injected into storage during slack demand periods (e.g., summer demand). Gases such as carbon dioxide are also stored or sequestered underground. Induced seismicity has been documented as a result of the development of mineral, geothermal and hydrocarbon resources, wastewater injection, water filling large surface reservoirs, and underground nuclear explosions (Adushkin et al., 2000). Man-made changes to the state of stress in the subsurface may trigger earthquakes (e.g., gas or fluid injection, gas or fluid withdrawal). Gas extraction and gas injection (water, steam, CO2, fracturing fluid, etc.) modify local effective stresses. If the stress change is large enough earthquakes may occur. Stress change can fracture the rock mass, or cause rocks to slip along existing zones of weakness. Compaction, fracturing, and fault displacement have occurred associated with oil and gas field production and development. Induced seismicity because of gas or fluid injection is well documented by many publications (e.g., Evans, 1966; Raleigh et al., 1976). Induced earthquakes are typically small (magnitude < 3) and possess substantially less energy than major tectonic
earthquakes. Magnitude quantifies the size of a seismic event. Most induced seismicity events have occurred on previously unknown buried faults (GWPC, 2015).
Natural gas is a colourless, odourless, hydrocarbon gas. Uses of natural gas include: electrical power generation, industrial (heat, power or chemical feedstock by manufacturers, mining, agricultural, fishing, forestry), residential (heating, air conditioning, cooking, and other household uses), commercial (hotels, restaurants, etc.), transportation (vehicle fuel, pipeline fuel), making hydrogen, etc. The industrial (33%), electric power (31%), and residential (21%) sectors use most of the natural gas. Most natural gas is consumed as a fuel source to heat businesses and homes. Demand for natural gas peaks during the winter months.
Gas storage is used principally to meet load variations (EIA, 2015). Gas is injected into subsurface storage during periods of low demand (e.g., summer, warm weather and generally lower gas demand) and withdrawn during periods of peak demand (e.g., residential heating in the winter).
Other purposes for gas storage include: balancing pipeline pressures; maintaining a gas balance for contracts; leveling gas supply during periods of fluctuating demand; for market/price
1 Colorado School of Mines
* Corresponding author, E-mail: ssonnenb@mines.edu
DOI: 10.3997/1365-2397.fb2025029
Figure 1 Types of underground gas storage. Underground gas storage potential sites are depleted oil and gas fields, saline water reservoirs, salt domes, and abandoned mines.
speculation purposes (anticipation of higher price periods); for energy back up associated with malfunction of distribution systems or demand associated with weather events (e.g., ice storms, hurricanes); assuring reliability of supply to the consumer at low costs; reducing market volatility; meeting changing natural gas demands.
Natural gas is generally stored underground in several types of facilities: depleted oil and gas fields; aquifer storage fields; salt caverns created by solution mining; abandoned coal mines (e.g., Leyden coal mine); abandoned hard-rock mines (Figure 1). Figure 2 shows US underground natural gas storage facilities. The vast majority of US gas storage facilities are in depleted oil and gas fields.
Depleted oil and gas fields have known seals, reservoir size, and reservoir properties. The reservoirs are naturally occurring, and they consist of porous and permeable underground formations (~1,000 to 8,000 ft depth). The reservoirs are sealed by impermeable rock or water barriers and have a single natural pressure. Working gas is generally 50% of the total reservoir capacity. Gas injections and withdrawal are seasonal; withdrawn in the winter season and injected in summer.
Aquifer storage fields are water-bearing reservoirs. The water salinity may be fresh or saturated brines. Cushion or base requirements range from 50 to 80%. Gas is withdrawn in the winter and injected in the summer. Most aquifer storage facilities are in the Midwest region of the US.
Salt cavern storage uses caverns that have been solution mined (salt domes or salt formations). Salt caverns generally have 20 to 30% cushion gas. The remaining capacity is for working gas. Working gas can be recycled several times a year. Salt caverns have high deliverability and injection capabilities. They are used for short-peak day deliverability purposes. Most salt domes and salt cavern storage facilities are in the Gulf Coast region of the US.
In gas storage, working gas (methane) is injected and produced seasonally. Base gas used in gas storage is used for pressure support and preventing water encroachment from the associated aquifer.
Figure 2 US underground natural gas storage facilities, by type (From EIA, 2024). Majority of gas storage fields are in depleted oil and gas fields.
Terms and definitions used in the gas storage business include: total gas capacity, total gas in storage, base gas or cushion gas, working gas, physically unrecoverable gas, cycling rate, deliverability rates, injection capacity or rate (Wikipedia, 2025). Total gas storage capacity is the maximum volume that can be stored at a facility. Total gas in storage is the volume stored at a facility at a given time. Base or cushion gas is a volume that is considered to be permanent inventory at a facility. Base gas prevents water encroachment and helps maintain reservoir pressure. A diagram illustrating some of these terms
Figure 3 Gas storage field illustrating working gas and base gas. Base gas is intended to be permanently stored and helps maintain reservoir pressure and helps to prevent water encroachment. Working gas is the volume of gas available to be withdrawn depending on market demands. Microseimic monitoring of gas storage facilities can aid in determining if injection pressures are too high and potentially causing fractures or reactivating fractures or causing microseismic events.
is shown in Figure 3. Working gas capacity is total gas stored minus the base gas. Working gas is the volume available to the marketplace at a given time. Deliverability is the volume of gas that can be delivered from a storage facility on a daily basis. Injection gas is the amount of gas that can be injected into a facility on a daily basis.
CO2 emissions occur from many activities but primarily in the utility and transportation sectors. CO2 is a greenhouse gas and lowering the carbon intensity of world economies and industries is important for future generations and climate change. CO2 can be stored or sequestered using geologic and mineralisation options (Young et al., 2007). The highest CO2 sequestration capacity lies within depleted and marginal oil and gas fields, deep saline aquifers, deep unmineable coal seams, and natural gas and natural CO2 fields. Although largely viewed as a problematic greenhouse gas, CO2 is a valuable commodity with many uses. CO2 is used as a refrigerant, for preservation of fruits, in preparation of fizzy or carbonated drinks, in fire extinguishers and welding, in baking of bread, many industrial applications (production of chemicals and feedstock), electronic applications, greenhouses for plants. CO2 used in the petroleum industry for enhanced oil recovery (EOR) also stores approximately 50% of the injected gas (gas goes into solution). The mineralisation option involves reactions of CO2 with silicate minerals or brine to form stable carbonates.
Injection into the subsurface to store and sequester is done with supercritical CO2. Supercritical CO2 is preferred because it is denser and takes up less space. Supercritical CO2 is in a fluid state where it is above critical pressure and critical temperature. This fluid state acts like a gas but has the density of a fluid. CO2 becomes a critical fluid at approximately 1000 psi and 90 oF. To maintain CO2 in its supercritical state generally requires depths of approximately 3000 ft or greater.
Site characterisation for CO2 injection involves analysing the potential reservoir for porosity, permeability, compartmentalisation, heterogeneity, salinity, depth, presence or absence of nearby faults, and pressure.
Injection rates of CO2 in the subsurface should be low enough to stay below the fracture gradient of the reservoir and adjacent seals.
Passive seismic monitoring is an effective tool for monitoring the subsurface for seismic events. Injection of fluids or gases into the subsurface has the potential to create seismic events. Monitoring gas storage facilities has many beneficial uses. Permanent microseismic arrays can provide monitoring over a long period of time. Microseismic monitoring of underground gas storage sites can provide information on underground placement of natural gas or CO2. Microseismic can also monitor any potential activated fault systems. Mitigation of large earthquakes and/or fault activation can be achieved by using proper injection pressures and rates.
Underground gas storage fields have been studied via microseismic monitoring (e.g., Deflandre and Huguet, 2002). Microseisms were recorded on two fields in France during injection and withdrawal. The authors conclude that passive seismic monitoring can help to characterise the mechanical behaviour of gas storage reservoirs.
Figure 6 The figure represents a hypothetical single horizontal well in black with eight fracture stimulation stages. The solid red line demonstrates effective fracture length (propped and contributes to production), the blue boxes drawn around those lengths represent effective drainage areas, the dashed red line represents potential fractures filled with proppant or hydraulic lengths, the ellipse represents potential induced stress areas, microseisms shown by coloured dots. Appropriate well spacing is a function of drainage areas. Microseismic events occur in induced stress areas.
Passive seismic is a common tool used in hydraulic fracturing monitoring (Figure 4). Information gathered from passive seismic include fracture orientation, fracture height, fracture zone width, and fracture length (Figure 5). Together these data can be used to estimate stimulated reservoir volume, drainage areas, and well spacing (Figure 6). Passive seismic data is carefully analysed for stress field orientation information, drainage area estimates, well spacing, and reserve calculations.
Deformation of reservoir rocks during production (i.e., compaction) can create production issues. For example, dramatic subsidence has been observed associated with oil production at Ekofisk platforms in the North Sea, Wilmington oil field (~30 ft; Long Beach, California); Goose Creek oil field in south Texas (faulting, subsidence and earthquakes) (Adushkin et al., 2000; Petrowiki, 2025).
Passive seismic for reservoir monitoring has the following uses and benefits (Gei et al., 2010):
• Location of microseismic events and clustering
- Mapping fault and fracture systems
- Analysing cap rock integrity to issue leakage does not occur
• Studying focal mechanisms of earthquakes which describe deformation in the source region that generates seismic waves
• Performing anisotropy analysis (P and S waves)
• Performing fracture characterisation
- Fracture orientation
- Fracture density and aspect ratio
Induced seismicity
Induced seismicity refers to earthquakes and tremors associated with human activity. Induced seismicity is associated with wastewater injection, injection of carbon dioxide for carbon capture and storage, geothermal wells cycling water, fluid extraction from oil and gas or water wells, artificial lakes, mining (rock bursts in hard rock mining, bumps in underground coal mining), and
Limit of microseismic / Biggest at Ekofisk
Habenero Geothermal / Largest Event 2
3
Felt earthquake
Figure 7 Comparison of the magnitude of different microseismic events and felt earthquake (after Euzen, 2011).
hydraulic fracturing. Most induced seismicity is low magnitude (M<3) (Figure 7). The injection or production of fluids induces changes in stress and strain on reservoir rocks, fluid pressures, and the occurrence of small to large earthquake events. Large and small earthquake events represent sudden shear failure along planes of weakness. Deformation of the reservoir (compaction) can occur during fluid extraction. Deformation during injection can lead to small uplift in rock units overlying the reservoir body. The most-likely physical mechanism for triggering injection-induced seismicity is an increased pore pressure on critically stressed faults or high enough increased pore pressure to create new fractures. Fluid injections into or withdrawal from subsurface rocks that alters pore fluid pressure also alters stress and strain conditions (Figure 8). Most cases of induced seismicity have occurred with pre-existing (natural) faults and fractures. Pore pressure increases effectively unclamps the faults and allows slip to occur. Most of the critically stressed faults are in the basement. Scientific evidence suggests that hydraulic fracture stimulation has a far lower potential to induce earthquakes than underground wastewater disposal (GWPC, 2015). Hydraulic
Figure 8 Diagram illustrating gas storage (natural gas, hydrogen, or carbon dioxide), reservoir stress, strain and deformation, and possible areas of microseismicity. (modified from JPT, 2022).
fracture stimulation is often blamed for large earthquakes. Large earthquakes in petroleum-producing regions have been associated with wastewater injection wells. The vast majority of disposal wells do not pose a significant hazard for induced seismicity if properly engineered and designed.
Underground gas storage, enhanced geothermal schemes, hydraulic fracture stimulation all generate small earthquakes. Monitoring and evaluating these events are important. The events are generally within the microseismic range (M<3) which is below the range of national networks and below the ‘felt’ level (M3 and above). The magnitude of these microseismic events is too small to be felt at the surface. For example, Barnett Shale microseismic events are seven orders of magnitude smaller than other earthquakes that can be felt at the surface.
Summary
Passive seismic monitoring of underground gas injection sites has many benefits. They include maintaining the integrity of the injection site, preventing fluid or gas losses along induced or natural fracture/fault systems, minimising potential large seismic events, minimising reservoir deformation, and increasing public confidence in storage operations.
References
Adushkin, V.V., Rodionov, V.N., Turntaev, S. and Yudin, A.E. [2000]. Seismicity in the Oil Field. Oilfield Review, 12(2), 2-17. Carpenter, C. [2022]. Subsurface characterization, monitoring play role in development of gas-storage facilities. Journal of Petroleum Technology, 74(4), 55-57.
Deflandre, J.-P. and Huguet, F. [2002]. Microseismic monitoring on gas storage reservoirs: a ten-year experience: World Petroleum Congress, paper WPC-32356, p. 441-455.
EIA. [2015]. The basics of underground natural gas storage. Retrieved from https://www.eia.gov/naturalgas/storage/basics/.
EIA. [2024]. Underground natural gas working storage capacity. Retrieved from https://www.eia.gov/naturalgas/storagecapacity/ Euzen, T. [2011]. Shale gas: an overview. Research Gate Technical Report. DOI: 10.13140/RG.2.1.2236.6242, 75 p.
Evans, D. [1966]. The Denver area earthquakes and the Rocky Mountain Arsenal well. The Mountain Geologist, 3, p. 23-36.
Gei, D., Eisner, L. and Suhadolc, P. [2010]. Passive seismic analysis for reservoir monitoring. Retrieved from https://www.slideserve.com/ liam/passive-seismic-analysis-for-reservoir-monitoring
Ground Water Protection Council (GWPC) and Interstate Oil and Gas Compact Commission. [2015]. Potential injection-induced seismicity associated with oil and gas development: A primer on Technical and Regulatory Considerations Informing Risk Management and Mitigation. 141 pages.
Petrowiki. [2025] Passive seismic monitoring. Retrieved from https:// onepetro.org/spe/general-information/1895/Passive-seismic-monitoring
Raleigh, C.B., Healy, J.H. and Bredehoeft, J.D. [1976]. An experiment in earthquake control at Rangely, Colorado. Science, 191, p. 1230-1237.
Wikipedia. [2025]. Natural gas storage. Retrieved from https://en.wikipedia.org/wiki/Natural_gas_storage
Young, G.B.C., Lintz, V.A., Widmann, B.L., Bird, D.A. and Cappa, J.A. [2007]. CO2 Sequestration Potential of Colorado. Colorado Geological Survey Resource Series, 45, 506 p.
Sometimes the most challenging part of a journey lies at the very beginning. EAGE student members can rely on a vast array of resources, opportunities and connections to shape their future.
SHI YUAN TOH
EAGE Young Professionals Committee Member
Being part of the EAGE Student Community was an incredibly enriching journey. Attending events like the Annual and the GET Conference provided invaluable opportunities to connect, learn and explore opportunities. The transition into the EAGE Young Professionals felt like a natural step forward, allowing me to continue growing while giving back to the community that shaped my early career.
UNLOCK BENEFITS FOR YOUR CAREER STUDENTS CAN APPLY FOR THEIR FIRST YEAR OF MEMBERSHIP FOR FREE (RE)ACTIVATE YOUR MEMBERSHIP TODAY! GLOBAL
Ruud Weijermars1* highlights greenhouse gas emission-curbing scenarios, the global inequity in efforts to mitigate emissions, and the vulnerability of the European emission trading system (ETS). If the ETS market fails, price-guarantees for GCS projects by governments mean tax payers will bear the brunt.
Abstract
This study highlights long-term greenhouse gas emission-curbing scenarios, pushing the time-frame from 2050 to 2150 and beyond (2200). The model is based on a new scenario-modelling approach, combining history-matching of past emission data (1850-2022) with forward-modelling algorithms (2023-2200). Considered are the effect of curbing measures reducing anthropogenic annual growth by n x ζ (n=number of years since the starting curb measure; ζ=curbing rate, with 0.0025, 0.005, 0.0075, 0.01, 0.025, and 0.05 per year). The global inequity in efforts to mitigate emissions is highlighted. The numerous Geological Carbon Sequestration (GCS)-projects currently executed in the North Sea, targeting depleted offshore gas fields (Porthos, Aramis, Orion), a depleted oil field (Greensand), and saline aquifers (Endurance, Northern Lights, Acorn) are vulnerable to volatility in the European carbon-credit market (ETS). If the ETS market fails, price-guarantees for GCS-projects by governments mean tax-payers will bear the brunt.
Nearly everyone has an opinion about the impact of global-warming, for which the fossil-fuel industry is routinely blamed. The energy extraction industry indeed emits around 15% (5.1 Gt/y) of total energy-related greenhouse gases (IEA, 2023). In addition
to the fossil-fuel industry, the main culprit of anthropogenic emissions is society at large (Figure 1), which combusts the fossil fuel in transportation vehicles, heating devices and industrial processes. We are all individually complicit in causing global warming – we consume foods produced and transported with fossil fuels, travel to work using transportation systems powered by (directly or indirectly) hydrocarbons and coal. The burning of coal, natural gas, and oil for electricity, transportation and heat generation accounts for 49% of global greenhouse-gas emissions. Details on the contributing sources can be found in the Sixth Assessment Report of the Intergovernmental Panel on Climate Change (IPCC, 2022).
Efforts to shift from fossil fuel to renewable energy sources have not been able to prevent an explosive 263% growth of oil and gas consumption over the past 50 years (1971-2021) (Weijermars, 2024a). Of course, developing renewables is much needed – without the progress made, fossil fuel consumption would have escalated even faster, beyond 300% as compared to 1970.
A prior FB paper (Weijermars, 2024b, and primary sources cited therein), succinctly showed how the current trajectory of annual emission-growth puts us on the trend for a 2 m rise in mean sea-level by the end of this century (Sweet et al., 2022). By then, the atmospheric CO2-concentration will have more than doubled to 850 ppm, as compared to today’s 420 ppm, which by
1 King Fahd University of Petroleum and Minerals (KFUPM)
* Corresponding author, E-mail: ruud.weijermars@kfupm.edu.sa
DOI: 10.3997/1365-2397.fb2025030
Figure 1 The key greenhouse gases emitted by human activities are carbon dioxide (CO2), methane (CH4), nitrous-oxide (N2O), and fluorinated gases (F-gases); shown are annual emissions (not cumulative); data from IPCC (2022).
itself is already nearly double the concentration of pre-industrial times (NOAA, 2022).
Meanwhile, the discourse about the climate crisis is rife with opinions and emotions (Brosch, 2021), less so factual analysis which is commonly made subservient to reinforce a particular opinion. Like: ‘We do not need to prove that investment in GCS-projects makes sense, we just must make a start and it is heroic to do so. Anyone saying the opposite should be censored and is considered our enemy.’ At the core of the discussion is a product, carbon dioxide, recently emerging as a publicly traded commodity in various regional carbon-credit trading markets (WorldBank, 2023), including derivates (such as futures options).
Carbon dioxide remains a controversial substance, but economists simply assign to it a utility, with a perceived value in the consumer market (Lizana, 2024). While commodities like soya beans can be eaten, and fuel like natural gas can be burnt to cook those beans, carbon dioxide cannot be consumed and has no direct utility for an individual end-user. Instead, atmospheric carbon dioxide, when occurring in enhanced concentrations, is considered a harmful substance by many, the removal of which we should pay for similar to what occurs in municipal garbage and sewage-collection efforts. Refuse removal is collectively funded by public money, which we contribute to by paying our taxes.
Tax-collection for garbage and sewage removal and processing in municipalities generally meets little opposition. This is not the case when we must individually contribute to pay for scrubbing CO2 from the polluted global atmosphere. Apparently, the utility of carbon removal is not universally appreciated. Finding support for mitigation of pollutants soiling the ‘Commons’ has been a long-standing problem (Hardin, 1968; Weijermars, 2011). This becomes particularly clear when comparing what carbon removal projects Europeans are already committed to – and pay for – and what unchecked greenhouse gas emission (methane venting) meanwhile continues to occur unabated in the US Permian Basin alone.
There are a number of large GCS projects underway in northwestern Europe, sponsored by nations bordering on the North Sea with legacy oil and gas fields offshore (Figure 2a). These GCS projects are all incentivised by government policies in their respective countries, and are operated either by public-private-partnership consortia or joint ventures of oil and gas companies, benefiting from
policy incentives geared towards GHG-emissions curbing. Table 1 lists the four projects with final investment decisions (FID) in place, and their stated storage capacity, preliminary project cost and so on. GCS projects still under study in the North Sea include Orion, Acorn, Goldeneye and Aramis. Space offered here is too limited to discuss all projects in detail, so only one of the projects with FID (Table 1) is briefly highlighted: the Porthos GCS project, a Dutch joint venture of EBN, Gasunie and the Port of Rotterdam Authority.
Expected to be operational in 2026, Porthos will transport CO2 currently vented by industry (mostly refineries) in the Port of Rotterdam to empty gas fields about 20 km offshore (Figure 2b). There, the CO2 will be permanently stored at 3 to 4 km beneath the North Sea floor (Wildenborg et al., 2022). With commitments to Porthos, the Port of Rotterdam will emit about 10% less CO2: Air Liquide, Air Products, ExxonMobil and Shell will capture CO2 from their plants and supply it to Porthos. The joint-venture is working with TAQA Energy, the current operator of the P18 cluster of gas fields, which became fully depleted by the end of 2024. Specialised contractors and suppliers will redevelop P18 and nearby P15 production infrastructure into an injection facility; the participating vendors include Denys NV, Allseas, LMR Drilling GmbH, Mannesmann Grossrohr GmbH, Corinth Pipeworks, Equans, Ensco Offshore, Van der Ven and Bonatti.
The EU has recognised Porthos as a project of common interest, because of the need for meeting climate goals, and allocated €102 million ($111 million) funding. However, by the time the final investment decision was made for the €1.37 billion Porthos GCS project (19 Oct 2023), the estimated cost had nearly tripled since the early estimates of €500 million ($544 million), when the project was revamped, five years ago, from earlier studies (Weijermars et al., 2025). The funding of the project hinges entirely on price-guarantees from the Dutch government. Such government sponsorship is fairly typical for all the GCS projects currently under development (Table 1). This also poses a serious risk that additional public funds will be repeatedly needed in the future to plug gaping holes in escalating project costs. Meanwhile, the effects of the costly sequestration efforts in the North Sea are annulled by the careless venting of greenhouse gases in the US (and elsewhere). Governments have given price-guarantees, which once seemed supported by an upward price-trend of EU ETS carbon credits. However, there are reasons to assume that this upward trend has now ceased and possibly may never rebound (as explained later in this paper).
The Permian Basin in West Texas, currently one of the most active staging grounds of US shale oil production, has tens of thousands of active wells extracting oil, natural gas liquids (NGL), and some associated natural gas. The main business focus is on the oil and NGL, leading to a high proportion of natural gas still being either flared or vented. Also, some gas pipelines are leaky; this has been known for years (Peischl et al., 2018), but the degree of methane release into the atmosphere became indisputable when satellite missions could objectively measure the emission levels (Zhang et al., 2020), with improved resolution after the launch of MethaneSat (EDF, 2024). The latter satellite mission was initiated by the Environmental Defense Fund (EDF), a US-based non-governmental organisation, jointly funded and operated by EDF and the New Zealand Space Agency. MethaneSat marks New Zealand’s first space science mission. Notably, the Bezos Earth Fund (founded by Amazon’s Jeff Bezos) gave a $100 million grant to EDF to help finance the mission.
MethaneSat’s monitoring from space revealed that the Permian Basin alone is the largest emitter of methane: 0.53 CH4Mt/y (Figure 3a,b). Methane has an 84-fold greater global warming impact potential than carbon dioxide (on a 20-year timescale; Etminan et al., 2016), which means the emission of methane greenhouse gas in the Permian Basin is equivalent to ~ 44.52 CO2Mt/y. The total emission reduction aimed for in North Sea GCS projects currently underway is 9 CO2Mt/y, at a combined cost of ~ €7 billion. The combined effect of North Sea GCS on atmospheric greenhouse gas removal is wholly annulled by the Permian Basin’s methane emissions. One must rightfully ask: If EU tax-payers become fully aware of the uneven-handed approaches at either side of the Atlantic, will they remain prepared to foot the bill for costly GCS projects?
With the manifest global differences in priorities to curb greenhouse gas emissions, one may wonder: Should we just drop ball and cease any effort to curb emissions? This would mean we all should agree on declaring the utility of carbon removal efforts is zero, i.e. carbon credits have zero value. Let us first examine what may happen if we do not curb greenhouse-gas emissions, by focusing on the well-documented anthropogenic release of carbon-dioxide gases in the atmosphere.
Figure 2 (a) Principal GCS projects under development in the North Sea. Dots show principal project locations. Rainbow colours are water depth contours, warm colour for shallow and blue for deep. Gas fields are included as tiny red specks, green for oil fields (barely visible at the small scale of reproduction). Courtesy: TGS. (b) Porthos GCS project layout, which plans to store about 2.5 Mt CO2 per year (for 15 years), to a total of about 37 Mton in the P18 fields, making use of the existing P15 platform hub. Courtesy: EBN.
Figure 4a shows the accumulated anthropogenic excess CO2 emissions as has been historically measured, using increasingly sophisticated methods over the period since the industrial revolution till today (NOAA, 2022). To understand how the historic trend will further escalate into the future, a fourth-order polynomial was fitted to the data in Figure 4a, which next allowed forward projection of the current emission-escalation trend (see Appendix A for details).
The blue curve in Figure 4b is the same as in Figure 4a, but note that the vertical scale has been expanded 10-fold. The red curve is the forward projection of the current escalation trend – the ‘Doing-Nothing’ curve. The cumulative emission, which was at 1800 Gt in 2024, will have 10-folded to 18,000 Gt by year 2163.
Figure 4 (a) Cumulative excess emissions of CO2 from anthropogenic sources as measured. (b) Forward expansion (red curve) of the blue trend curve in (a), based on the polynomial curve given in Equation (A1); for details see Appendix A.
This 10-fold increase of the CO2-excess in the atmosphere (Figure 4b) corresponds to an atmospheric CO2 concentration of about 2000 ppm (using methodology of Trenberth and Smith, 2005). One should remember that gaseous carbon dioxide in increased atmospheric concentrations is a potential asphyxiant. The American Conference of Governmental Industrial Hygienists (ACGIH) considers a value of 40,000 ppm immediately dangerous to life and health; it also states exposure to 30,000 ppm should not exceed a 10-minute period (USDA, 2020). When exposed to these elevated CO2 concentrations, humans react by rapid breathing, confusion, increased cardiac output, elevated blood pressure and increased arrhythmias. When the concentration reaches 5000 ppm, ACGIH recommends an 8-hour maximum time of exposure. Symptoms of mild CO2 exposure may be limited to headaches and drowsiness.
So, will humans be able to live and thrive in 2000 ppm? Early evidence indicates potential health risks may occur due to prolonged exposure to CO2 concentrations of around 1000 ppm, which frequently occurs in indoor environments with increased room occupancy and poor ventilation (Jacobson et al., 2019; Keeling et al., 2021). A 1000-ppm CO2-concentration in the atmosphere outdoors is likely reached early in the next century; and 2000 ppm will be reached by year 2163 (Figure 4b). Meanwhile, there is still time left to try geo-engineer our way out of such looming asphyxiant scenarios.
Based on the imminent risk of impact on human health, as well as the cost of flooding damage to coastal regions and loss of crop lands due to CO2-emission excess (OECD, 2007), one could aim at measures to curb anthropogenic CO2 emissions. Figure 5 shows possible emission-curbing curves, first modelled here with a longer lead-time than in the typical 2050 threshold used in IEA Net Zero and similar scenarios (IEA, 2021). A time window until year 2200 is considered, using the method explained in Appendix A. For example, using this scenario model, if no further growth of emissions should occur by 2050, we need to start curbing the annual excess emissions from now onward at a first-year rate of 5%, and then increase the emission curbing in each subsequent year by 0.05n (with n denoting the
number of years lapsed since the start of the curbing measures). This 5%/y-curbing scenario closely corresponds to the IEAs Net Zero blueprint (IEA, 2021), which assumes the annual excess emissions of 36 Gt CO2 from 2020 onwards should be gradually annulled and reach zero by 2050. However, this drastic emission-reduction scenario can no longer be considered tenable: in practice, no measures have been successful in achieving even the slightest decline in the current upward trend of anthropogenic excess emissions (Weijermars, 2024a).
But nimbler curbing rates may perhaps still help avert unbridled escalation of emissions, which is why alternative curbing rates are included in Figure 5. At present, with current CO2-sequestration projects, we are closing in on a curbing-rate curve of 0.25%/y (Weijermars, 2024a), which will hardly have any impact according to the model of Figure 5. The simple
Figure 5 Forward scenarios for cumulative excess emissions of CO2 from anthropogenic sources. Blue curve till 2022 (as measured) and forward expansion beyond 2150 (red curve) according to ‘business-as-usual’ or ‘doing nothing’ to curb emissions. Also shown are the emission-curbing curves according to the curbing model of Appendix A, with various curbing factors z=0.0025, 0.005, 0.0075, 0.01, 0.025, and 0.05 per year. The latter 5%/y curbing rate closely corresponds to the IEA Net Zero Scenario (IEA, 2021).
message is this: for emission reduction to have a meaningful impact, more aggressive rates of curbing the carbon excess (by carbon removal and emission evasion) are needed. A 2.5%/y scenario seems the minimum needed, and that would require a 10-fold upscaling of the current rate (0.25%/y) of carbon removal efforts, in the first year alone, and then rapid upscaling to 20-fold, 30-fold, and so on, in the subsequent years. No such fast pace of curbing measures seems practically feasible with the long leadtimes required in practice for even-handed appraisals of GCS field development plans (see for example the typical workflow explanation in Weijermars, 2024a).
Carbon removal pricing is governed by local carbon credit markets, which trade ‘carbon credits’. The incentive to put a price on GHG emissions comes entirely from governmental pricing and taxation policies. Compared to upstream commodities (oil, gas, NGL, NLG), the price-making mechanisms for carbon removal occur in relatively insular regional markets, with high volatility in pricing. Also, the lack of connections between the regional markets leads to huge regional price variations (Word Bank, 2023).
In the EU, these carbon units are traded as EUA, being an allowance or entitlement to emit 1 metric ton (tonne) of carbon dioxide equivalent gas (tCO2e). Day-trading of EUAs now occurs in what started out in 2005 as the world’s first international emissions trading system. EUA possession means the owner has paid for this allowance to emit. Alternatively, the industry may instead put the money into GCS projects and defer the emission, thus avoiding the taxation on the emission. Carbon-credit markets trade ‘carbon credits’, which assign a value to implemented emission-reduction activities and/or removal from the atmosphere. Such emission reductions and removals are achieved through, for example:
• Capturing methane from landfills
• Sequestering carbon through forestation
• Directly capturing carbon from the air and storing it
• Geological carbon sequestration
Figure 6 shows the price history of EUAs, with disjunct overlaps between the different phases of market-mechanism adjustments responsible for mismatches between historic prices across the various phases of ETS trading-mechanism development. According to some, the EU-ETS shows strong symptoms of ‘design-by-committee-syndrome’, being so complex and disjointed that unexpected problems pop up regularly; quotas have been stolen, and the system has been used for VAT fraud (Saksvikrønning, 2021).
Depleted gas fields and saline aquifers have been considered as GCS targets by numerous parties (Ali et al., 2022), and efforts intensified at the turn of the Millennium, when the UK’s offshore oil and gas production entered into decline. Companies may defer some abandonment cost (such as permanent well-plugging, platform removal, and pipeline lifting), when infrastructure refurbishment for GCS projects would be possible. Generally, the cost of refurbishment for use in injection projects seems to be vastly underestimated, existing wells and pipelines need very costly workover and completions. For example, the Porthos GCS project, in spite of having been studied at the desktop for decades (Wildenborg et al., 2022), faces escalating cost which is attributable to a generic lack of industry’s operational experience with large-scale GCS-injection projects (Weijermars et al., 2025).
Arguably, the large-scale injection of carbon-dioxide is currently not at any advanced technical readiness level, numerous technical setbacks have occurred in prior pilot projects (Hauber, 2023) and continue to occur in presently executed projects (Afagwu and Weijermars, 2024). The typical operational problems encountered are (Weijermars 2024a,c): (1) premature pressure escalation causing imminent risk of cap rock failure, due to which injection rates and estimated ultimate storage are lower than originally planned; (2) water-blockage at the bottom of injection wells by condensation, even when using fractionated CO2-fluid streams, due to the temperature and pressure prevailing at reservoir level; (3) sand production in the injection wells due to flawed gravel-pack design, requiring workovers for zonal separation screens to prevent backflow and formation sand loss due to differential pressure circulation.
With such technical setbacks, the cost of GCS projects will escalate. When executed in public-private-partnerships, the cost escalation will need increased price guarantees for projects to keep active. For example, independent auditing of the Porthos-project led the auditing body to conclude that only the government bears the risks of carbon storage under the sea, but it does not share proportionally in the benefits (Figure 7). Overall, even when ultimately executed in a technically sound fashion, large-scale GCS projects remain excessively costly undertakings. Consequently, when carbon-pricing markets would start to falter due to lack of EU-scale government support, incentives for further GCS project development will evaporate. Ongoing projects will need a bailout to continue operations, lest bankruptcy is the only alternative left in combination with litigation. Unfortunately, bankruptcy offers no way out of liens underwritten by public partners in such ventures, which means tax payers will ultimately bear the brunt.
Figure 6 Price development of EU-ETS EUA between 2005 and 2022 shows exceptional volatility (after Saksvikrønning, 2021).
This critical review examined the unusual economic risk exposure governments face when funding Greenhouse Gas Capture and Storage (GCS) projects, analysing their utility trade-offs, volatility, and broader implications. While GCS projects are often promoted as climate solutions, their contribution to emissions reduction is largely negligible compared to what volumes would need to be removed from the annual anthropogenic emissions into the atmosphere to mitigate further escalation of the climate crisis (Figure 5). While intended to mitigate global warming linked to greenhouse gas emissions, the proportion of emissions captured in GCS projects remains minuscule compared to the rapid growth of emissions worldwide. The effectiveness of GCS projects in combating the climate crisis therefore must be considered largely symbolic. Moreover, these projects often provide storage solutions for fossil fuel refineries and other heavy-emitting industries, which raises concerns about ‘greenwashing’ — in the sense that public funds are used to pay for cleaning up the environmental harm caused by these sectors which also enables them to continue operating outdated refinery facilities.
The economic risks associated with GCS-projects are substantial, and together with their dependence on public funding brings risk of default to the public interest sphere, which means high sensitivity to political machinations exists. GCS projects often involve exorbitant costs to taxpayers while delivering only marginal environmental benefits. This raises questions about financial prudence and their long-term sustainability. Industry-sponsored energy lobbies often play a significant role in advocating for the current GCS initiatives, influencing government decisions.
The high costs and uncertain outcomes of GCS projects make their opportunity cost particularly significant. When governments choose to support GCS, they may sacrifice financial resources that could instead have been used for faster, more impactful, and cost-effective solutions to combat climate change. Foregone opportunity costs in climate solutions includes support for:
• Funds spent on GCS projects could have been used to scale up renewable energy infrastructure such as solar, wind, or geothermal power, which directly reduce emissions and have a proven track record of effectiveness.
Figure 7 Risk exposure assessment by the Dutch government auditor (Rekenkamer, 2024) concluded that the government bears the never-ending risks of carbon storage under the sea but it does not share proportionally in the benefits.
• Investments in renewable technologies can generate long-term economic benefits, create jobs, and reduce dependence on fossil fuels.
• Public money could support energy efficiency initiatives, such as upgrading building insulation or deploying energy-efficient appliances and industrial processes. These strategies often deliver immediate emissions reductions at lower costs.
• Resources diverted to GCS projects could strengthen climate adaptation measures, such as infrastructure improvements to withstand extreme weather events or programs to support vulnerable communities.
• Funding could instead advance research into emerging technologies like advanced battery storage, green hydrogen, or carbon-negative solutions such as reforestation or biochar.
The technocrat view that it will be possible to optimise the global energy system by informed decision-making based on energy-system modelling to provide guidance for future energy choices (Weijermars et al., 2012), was a view still considered realistic when the present author launched Energy Strategy Reviews – as the founding editor-in-chief. But now more than a decade since, the journal’s objective seems mere utopia: policy-makers cannot handle or grasp complex energy-system models. Instead, energy policy decisions are often highjacked by special-interest groups, rather than being based on technical optimisation rationale. Given the situation of special-interest groups ‘calling the shots’ rather than data-driven energy-system model optimisation, one might again say: ‘Okay, let’s drop ball and quit the game’. However, this, by no means, seems valiant. The principal task of science and engineering is to continually improve our models, and contribute to the public discourse based on model insights.
The simple scenario model of Appendix A may help to rapidly produce emission-curbing scenarios, avoiding the undue complexity of holistic energy-system models (e.g., Capros et al., 2029; NEMS, 2024). The models in the current paper show the greenhouse gas curbing rate proposed by the IEA to achieve Net Zero by 2050, uses an unrealistic timescale. Instead, long-
term curbing-targets, modelled here until year 2200, can still be pursued with potentially successful outcomes. As time goes by, tangible efforts by GCS projects in the North Sea Basin seem futile as long as no genuine efforts are made to curb greenhouse gas emissions in other regions of the world.
Historically, the EU has provided strong support for science-driven energy policies. One of the outcomes has been the development of the EU-ETS carbon-credits trading platform. However, shifts in policy could lead to devaluation of carbon credits, culminating in a collapse of the ETS credit price, if not the entire trading system – when its fundamental utility is questioned, or annulled by less favourable government policies. If that were to occur, the costly CGS projects currently underway will become going concerns. The taxpayer will need to fund the carbon credit price that was contractually guaranteed, such as is the case in the Porthos Project.
This article started out to critically review the utility of leading geological carbon sequestration (GCS) efforts against the backdrop of escalating emissions and the globally shifting political landscape regarding climate-change mitigation-measures. Currently, GCS projects are only de-risked when government policies ensure carbon pricing risk for the participating companies is nullified. All past GCS projects and those currently under development have been rendered potentially economic not by free market policies, but by governments implementing carbon taxation policies and/ or direct carbon price guarantees. Storage capacity offered by individual GCS ventures only became economic by carbon-price guarantees from governments. These ventures will not bear the brunt when carbon prices collapse; instead treasuries will need to plug a financial hole, leading to a deficit that ultimately needs to be covered by the taxpayer. The moment the political will to publicly support carbon pricing mechanisms wanes, projects under development will appear as excessively costly ventures. A new scenario forecasting model for emission-curbing impact was presented to guide the discussion with numbers and a perspective for possible solutions.
While the need to avert long-term effects of unbridled greenhouse gas emission is scientifically proven beyond reasonable doubt, GCS projects are costly to execute. Additionally, considerable political risk exists that EU-ETS markets may
weaken or even fail when shifts in the climate debate undermine the political will to act on the climate crisis. Short-term objectives of opportunistic policy-makers may turn the debate away from solutions, which is why the need for cheap and ingenious carbon-removal technology becomes more urgent as time goes on. However, no carbon-removal panacea has been discovered yet. Many false assertions are made, based on manipulative or naive concepts, bordering on – or transgressing into – fraud (see examples quoted in Weijermars, 2024c). ‘Keep calm and carry on,’ as the British say when facing seemingly invincible adverse conditions ahead; ‘And now it’s time for tea…’
The author acknowledges the generous support provided by the College of Petroleum Engineering & Geosciences (CPG) at King Fahd University of Petroleum and Minerals (KFUPM).
Disclaimer The assertions made in this paper are based on research and expertise of the author and EAGE and KFUPM are not liable for the findings and opinions expressed.
Declaration of Independence This research paper was written without any connection to special-interest groups. Such groups typically try to bypass intellectual discourse and force shortcuts in reasoned decision making, jeopardising the convention that science and engineering research are supposed to be conducted by objective logical reasoning. Instead, special-interest groups arm themselves by largely agreeing on what is important to them (their special interest), and promote their interest at all cost. And reverse: declared enemy viewpoints will be discredited by any means, use of hyperbole and accusative debate techniques are not shunned. The discourse may become particularly contentious when there is disagreement about certain issues. In such cases, the risk is that opinions, rather than objective facts, are traded.
The historic trend (1850-2022) of the cumulative increase in the atmospheric CO2 emissions, , from anthropogenic sources (Figure 4a) was tightly matched by a polynomial reference-curve:
with expressed in billion metric tons. For example, for t=0, which starts at the beginning of year 1850, the cumulative anthropogenic excess CO2 emissions amounted only to 18.781 GtCO2, according to the polynomial fit to the basic data. Next, the historic escalation of CO2 emissions captured in Equation (A1), was assumed to be a reliable reference for business as usual, also reflecting our past inability to meaningfully curb emission levels.
Subsequently, the cumulative reference-curve of Figure 4a was forward extended, using Equation (A1), until the end of the next century. The incremental growth thus obtained provides a reference curve (Figure 4b) for the expected future growth of annual excess emissions from anthropogenic sources until the end of the next century.
Having a long-term reference curve for the expected cumulative CO2-emission growth is useful, because now we can offset possible emission mitigation measures, scaled at a desired future reduction, relative to the ‘business-as-usual’ or ‘doing-nothing’ scenario.
The expected incremental annual growth (or decline), , in excess (or deficit) emissions was computed from the cumulative values and in subsequent years, using:
Hardin, G. [1968]. The tragedy of commons. Science, 162(3859), 12431248. https://doi.org/10.1126/science.162.3859.1243.
Hauber, G. [2023]. Norway’s Sleipner and Snøhvit CCS: Industry models or cautionary tales. Institute for Energy Economics and Financial Analysis. https://ieefa.org/resources/norways-sleipner-and-snohvit-ccsindustry-models-or-cautionary-tales.
IEA. [2021]. Net Zero by 2050 A Roadmap for the Global Energy Sector Net Zero by 2050. Interactive iea.li/nzeroadmap.
IEA. [2023]. Emissions from Oil and Gas Operations in Net Zero Transitions: A World Energy Outlook Special Report on the Oil and Gas Industry and COP28. OECD Publishing, Paris. https://doi.org/10.1787/317cbf59-en.
IPCC. [2022]. Emissions Trends and Drivers. In IPCC, 2022: Climate Change 2022: Mitigation of Climate Change. Contribution of Working Group III to the Sixth Assessment Report of the Intergovernmental Panel on Climate Change. Cambridge University Press, Cambridge, UK and New York, NY, USA. https://doi.org/10.1017/9781009157926.004.
Jacobson, T.A., Kler, J.S., Hernke, M.T., Braun, R.K., Meyer, K.C. and Funk, W.E. [2019]. Direct human health risks of increased atmospheric carbon dioxide. Nat Sustain, 2, 691–701. https://doi.org/10.1038/s41893-019-0323-1.
Curbing scenarios can be plotted, using the polynominal reference of Equation (A1) and the incremental growth rate of Equation (A2) as follows:
The parameters featuring in Equation (A3) are explained in Table A1. The various curbed emission curves of Figure 5 were plotted using Equation (A3) with the inputs given in Table A1.
References
Afagwu, C. and Weijermars, R. [2024]. Sensitivity Analysis of CO2-Migration Paths in Geological Carbon-Dioxide Sequestration: Case Study of the Gorgon GCS Project. http://dx.doi.org/10.2139/ssrn.4985775.
Ali, M., Jha, N.K., Pal, N., Keshavarz, A., Hoteit, H. and Sarmadivaleh, M. [2022]. Recent advances in carbon dioxide geological storage, experimental procedures, influencing parameters, and future outlook. Earth-Science Reviews, 225, 103895, https://doi.org/10.1016/j.earscirev.2021.103895.
Brosch, T. [2021]. Affect and emotions as drivers of climate change perception and action: a review. Current Opinion in Behavioral Sciences, 42, 15-21. https://doi.org/10.1016/j.cobeha.2021.02.001.
Capros, P., Zazias, G., Evangelopoulou, S., Kannavou, M., Fotiou, T., Siskos, P., De Vita, A. and Sakellaris, K. [2019]. Energy-system modelling of the EU strategy towards climate-neutrality. Energy Policy, 134, 110960. https://doi.org/10.1016/j.enpol.2019.110960
EDF. [2024]. Permian project is measuring and reporting oil and gas methane emissions like never before. https://www.edf.org/energy/wereanalyzing-methane-emissions-worlds-largest-oil-patch.
Etminan, M., Myhre, G., Highwood, E.J. and Shine, K.P. [2016]. Radiative forcing of carbon dioxide, methane, and nitrous oxide: A significant revision of the methane radiative forcing. Geophys. Res. Lett., 43(24), 12614-12623. https://doi.org/10.1002/2016GL071930.
Keeling, F.H., Powell, F.L., Shaffer, G., Robbins, P.A. and Simonson, T.S. [2021]. Impacts of Changes in Atmospheric O2 on Human Physiology. Is There a Basis for Concern? Front. Physiol., Sec. Environmental, Aviation and Space Physiology, 12. https://doi.org/10.3389/fphys.2021.571137. Lizana, J.J. [2024]. Analysis of the Theory of Marginal Utility and Marxism according to Bukharin. http://dx.doi.org/10.2139/ssrn.5008407.
NEMS. [2024]. National Energy Modeling System (NEMS) modules. https:// www.eia.gov/outlooks/aeo/nems/documentation/.
NOAA. [2022]. History of atmospheric carbon dioxide from 800,000 years ago until the end of the most recent GLOBALVIEW+ CO2 collection. https://gml.noaa.gov/ccgg/trends/history.html.
OECD. [2007]. Ranking of the World’s cities most exposed to coastal flooding today and in the future. OECD Environment Working Paper No. 1 (ENV/WKP(2007)1). https://climate-adapt.eea.europa.eu/en/metadata/ publications/ranking-of-the-worlds-cities-to-coastal-flooding/11240357.
Peischl, J.S.J., Eilerman, J.A., Neuman, K.C., Aikin, J., de Gouw, J.B., Gilman, S.C., Herndon, R., Nadkarni, M., Trainer, C., Warneke, T. and Ryerson, B. [2018]. Quantifying methane and ethane emissions to the atmosphere from Central and Western U.S. oil and natural gas production regions. J. Geophys. Res. Atmos., 123(14), 7725–7740. https://doi. org/10.1029/2018JD028622.
Rekenkamer [2024]. NL Court of Audit. https://english.rekenkamer.nl/latest/ news/2024/03/28/if-co2-prices-go-up-industry-benefits-most-fromporthoss-carbon-storage-under-the-north-sea.
Saksvikrønning, H. [2021]. The Flexible Cap – EU’s ‘ETS Carbon Tax’. https://doi.org/10.13140/RG.2.2.17085.38888.
Sweet, W.V. et al. [2022]. Global and Regional Sea Level Rise Scenarios for the United States: Updated Mean Projections and Extreme Water Level Probabilities Along U.S. Coastlines. NOAA, Silver Spring, MD, 111 pp. https://oceanservice.noaa.gov/hazards/sealevelrise/noaa-nos-techrpt01global-regional-SLR-scenarios-US.pdf.
Trenberth, K.E. and Smith, L. [2005]. The mass of the atmosphere: A constraint on global analyses. J. Clim., 18, 864-875. https://doi.org/10.1175/ JCLI-3299.1.
USDA. [2020]. Carbon Dioxide Health Hazard Information Sheet. https://www.fsis.usda.gov/sites/default/files/media_file/2020-08/ Carbon-Dioxide.pdf.
Weijermars, R. [2011]. Can we close Earth’s sustainability gap? Renewable and Sustainable Energy Reviews , 15, 4667-4672. https://doi.org/10.1016/j.rser.2011.07.085.
Weijermars, R. [2024a]. Concurrent Challenges in Practical Operations and Modeling of Geological Carbon-dioxide Sequestration: Review of the Gorgon Project and FluidFlower Benchmark Study. Energy Strategy Reviews, 56, 101586. https://doi.org/10.1016/j.esr.2024.101586.
Weijermars, R. [2024b]. Deferring flood damage in coastal lowlands: assessing surface uplift by geo-engineered CO2-sequestration with easy-to-use land-uplift model. First Break , 42(4), 63-70. https:// doi.org/10.3997/1365-2397.fb2024033.
Weijermars, R. [2024c]. CO2 Storage capacity classification and compliance. First Break, 42(11), 85-93. https://doi.org/10.3997/13652397.fb2024100.
Weijermars, R., Afagwu, C., Tian, Y. and Alves, I.N. [2025]. Estimation of Storage Capacity Coefficients: Porthos GCS Project Case Study. Geoenergy Science and Engineering, in review.
Weijermars, R., Taylor, P., Bahn, O., Das, S.R. and Wei, Y.-M. [2012]. Review of models and actors in energy mix optimization – can leader visions and decisions align with optimum model strategies for our future energy systems? Energy Strategy Reviews , 1(1), 5-18. https://doi.org/10.1016/j.esr.2011.10.001.
Wildenborg, T., Loeve, D. and Neele, F. [2022]. Large-scale CO2 transport and storage infrastructure development and cost estimation in the Netherlands offshore. International Journal of Greenhouse Gas Control , 118, 103649. https://doi.org/10.1016/j. ijggc.2022.103649.
World Bank. [2023]. State and Trends of Carbon Pricing 2023. Washington, DC: World Bank. https://doi.org/10.1596/978-1-46482006-9.
Zhang, Y. et al. [2020]. Quantifying methane emissions from the largest oil-producing basin in the United States from space. Science Advances , 6 (17). https://doi.org/10.1126/sciadv. aaz5120.
ADVERTISEMENT
April 2025
2-4 Apr 23 rd European IOR+ Symposium www.ior2025.org
9-11 Apr Naturgas Congress 2025 www.congresonaturgas.com
13-16 Apr Innovative Technology for Reservoir Optimization: Fifth EAGE Well Injectivity & Productivity in Carbonates (WIPIC) Workshop www.eage.org
14-17 Apr International Scientific Conference on Monitoring of Geological Processes and Environmental Conditions www.eage.org
29-30 Apr EAGE Workshop on Advanced Sesimic Solutions for Complex Reservoir Challenges www.eage.org
May 2025
5-7 May First EAGE Atlantic Geoscience Resource Exploration & Development Symposium www.eage.org
5-9 May RENAG 2025 www.ageocol.org/renag
7-8 May DGMK/ÖGEW Spring Conference 2025 - Subsurface Innovations and Insights www.dgmk.de/en/events/dgmk-oegew-spring-conference-2025
8-9 May First EAGE Workshop on Land Seismic Acquisition www.eage.org
12-14 May GeoConvention 2025 www.geoconvention.com
12 May 7 th NSGE Pre-Conference Workshops - Fiber Optic Sensing for Near-Surface Applications - Landslides, Debris Flow, and Slope Stability: What is Expected from Geophysics?
13-15 May 7 th Asia Pacific Meeting on Near Surface Geoscience & Engineering (NSGE) www.eage.org
15-17 May 60 th CEEC Event ceecsg.org/save-the-date-60th-ceec-event-15-17-may-2025
13-15 MAY 2025
Xi’an, China www.eage.org
Zagreb Croatia
19-22 May InterPore 2025 events.interpore.org/event/56
21-22 May First EAGE/SBGf Workshop on Marine Seismic Acquisition www.eage.org
June 2025
2-5 Jun 86th EAGE Annual Conference & Exhibition www.eageannual.org
22-24 Jun AAPG/EAGE Geothermal Energy in the Middle East: Unlocking a Vast Renewable Energy Resource Beneath our Feet www.eage.org
24-25 Jun Innovarpel 2025 www.arpel.org/en/events
30 Jun2 Jul 4th Carbon Capture & Storage Conference Asia Pacific www.eage.org
2025
3-4 Jul 5 th EAGE Workshop on Fiber Optic Sensing for Energy Applications www.eage.org
6-11 Jul Goldschmidt 2025 conf.goldschmidt.info/goldschmidt/2025/meetingapp.cgi
September 2025
1-4 Sep World CCUS Conference www.wccus.org
7-11 Sep Near Surface Geoscience Conference and Exhibition (NSG) 2025 - 31st European Meeting of Environmental and Engineering Geophysics - 6th Conference on Geophysics for Mineral Exploration and Mining - 4th Conference on Geophysics for Infrastructure Planning, Monitoring and BIM - 1st Conference on Geohazards Assessment and Risk Mitigation
- 1st Conference on UXO and Object Detection www.eagensg.org
7-11 Sep 32 nd International Meeting on Organic Geochemistry
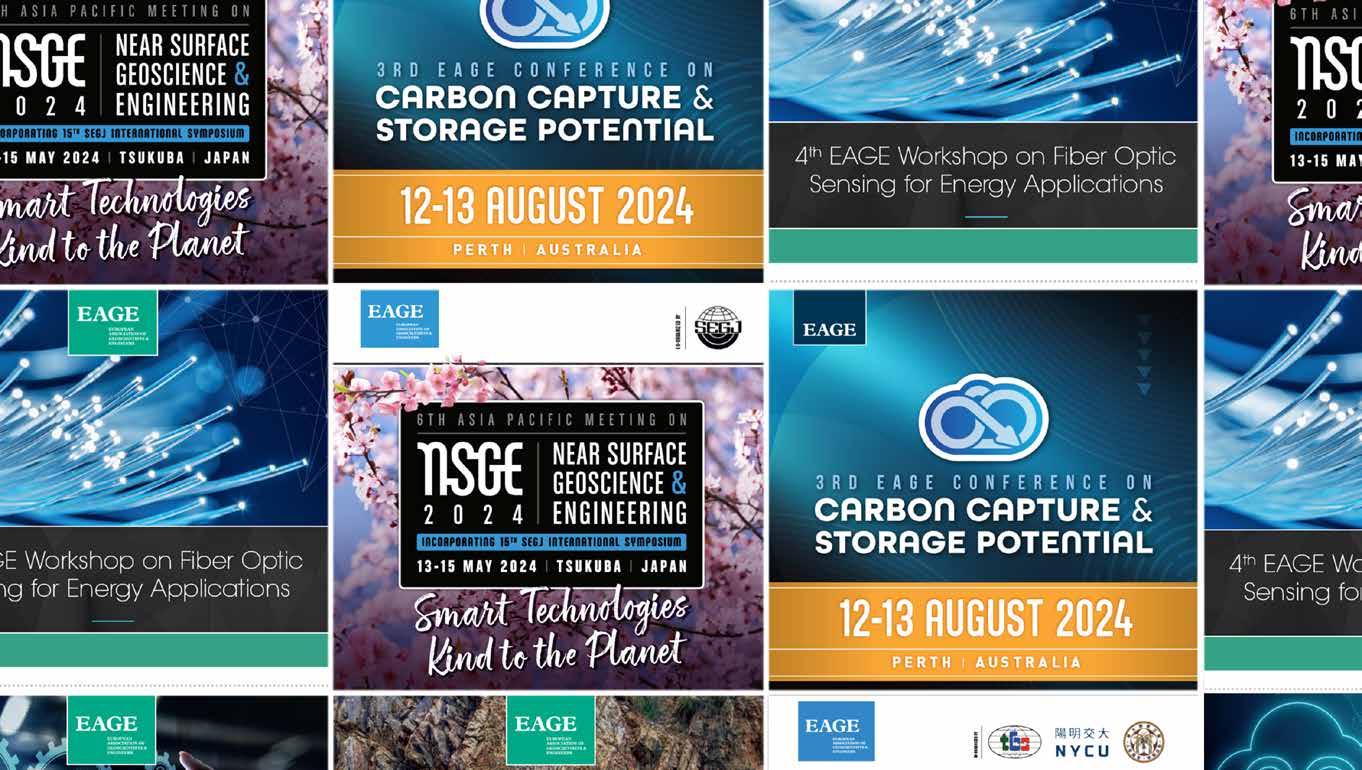
23-24 Sep EAGE Workshop on Geoscience in Development Enhancement www.eage.org
24-25 Sep EAGE Workshop on Machine Learning for Geoscience www.eage.org
29 Sep1 Oct
AAPG/ EAGE Mediterranean and North African Conference (MEDiNA) medinace.aapg.org
the Energy Shift - The Role of HPC in Sustainable Innovation: Ninth EAGE High Performance Computing Workshop www.eage.org
First EAGE/ AAPG/ SEG Carbon Capture Utilisation and Storage Workshop (CCUS) www.eage.org
27-31 Oct 6th EAGE Global Energy Transition Conference & Exhibition (GET 2025) - EAGE Carbon Capture and Storage Conference - EAGE Geothermal Energy Conference - EAGE Hydrogen and Energy Storage Conference
2-5 Nov EAGE/AAPG Workshop on Tectonostratigraphy of the Arabian Plate: Structural Evolution of the Arabian Basins www.eage.org
10-12 Nov Seventh EAGE Rock Physics Workshop www.eage.org
12-14 Nov First EAGE Workshop on Surface Logging www.eage.org
12-14 Nov Third EAGE Workshop on Geothermal Energy in Latin America www.eage.org
12-14 Nov EAGE/Aqua Foundation Third Indian Near Surface Geophysics Conference & Exhibition www.eage.org
18-20 Nov SBGf Conference Rio’25 www.rio25.sbgf.org.br
24-26 Nov Third EAGE Seabed Seismic Today Workshop www.eage.org
25-26 Nov 1st EAGE Workshop on Geoscience for Geothermal/Exploring East Indonesia www.eage.org
December 2025
1-3 Dec Fifth EAGE Eastern Mediterranean Workshop www.eage.org
Indonesia
SUBMIT YOUR
BY 30 APRIL 14-18 SEP. 2025
Opening Ceremony
Exhibition
Strategic Programme
Workshops
Technical Programme
Field Trips
DTA & ETA Programme
Community Programme
Short Courses
Hackathon
Icebreaker Reception
Conference Evening
REGISTER BEFORE 15 MAY AND SAVE UP TO 22%
REGISTER NOW AT EAGEANNUAL.ORG