


SPECIAL TOPIC

SPECIAL TOPIC
EAGE NEWS Association plans 75th anniversary
CROSSTALK The fight for Venezuala’s oil
TECHNICAL ARTICLE Reservoir resistivity modelling for CSEM


Opening Ceremony, Workshops, Field Trips, Short Courses, Technical and Strategic Programmes, Exhibition, Hackathon, Community and Student Programme, and Social Programme Exhibition,


REGISTER BY 15 MARCH TO SECURE
SCAN THE QR CODE TO REGISTER


FIRST BREAK ®
An EAGE Publication www.firstbreak.org
ISSN 0263-5046 (print) / ISSN 1365-2397 (online)
CHAIR EDITORIAL BOARD
Clément Kostov (cvkostov@icloud.com)
EDITOR Damian Arnold (arnolddamian@googlemail.com)
MEMBERS, EDITORIAL BOARD
• Philippe Caprioli, SLB (caprioli0@slb.com)
• Satinder Chopra, SamiGeo (satinder.chopra@samigeo.com)
• Anthony Day, NORSAR (anthony.day@norsar.no)
• Kara English, University College Dublin (kara.english@ucd.ie)
• Hamidreza Hamdi, University of Calgary (hhamdi@ucalgary.ca)
• Fabio Marco Miotti, Baker Hughes (fabiomarco.miotti@bakerhughes.com)
• Roderick Perez Altamar, OMV (roderick.perezaltamar@omv.com)
• Susanne Rentsch-Smith, Shearwater (srentsch@shearwatergeo.com)
• Martin Riviere, Retired Geophysicist (martinriviere@btinternet.com)
• Angelika-Maria Wulff, Consultant (gp.awulff@gmail.com)
EAGE EDITOR EMERITUS Andrew McBarnet (andrew@andrewmcbarnet.com)
PUBLICATIONS MANAGER Hang Pham (publications@eage.org)
MEDIA PRODUCTION
Saskia Nota (firstbreakproduction@eage.org)
Ivana Geurts (firstbreakproduction@eage.org)
ADVERTISING INQUIRIES corporaterelations@eage.org
EAGE EUROPE OFFICE
Kosterijland 48 3981 AJ Bunnik
The Netherlands
• +31 88 995 5055
• eage@eage.org
• www.eage.org
EAGE MIDDLE EAST OFFICE
EAGE Middle East FZ-LLC Dubai Knowledge Village PO Box 501711
Dubai, United Arab Emirates
• +971 4 369 3897
• middle_east@eage.org
• www.eage.org
EAGE ASIA PACIFIC OFFICE
EAGE Asia Pacific Sdn. Bhd. UOA Centre Office Suite 19-15-3A No. 19, Jalan Pinang 50450 Kuala Lumpur
Malaysia
• +60 3 272 201 40
• asiapacific@eage.org
• www.eage.org
EAGE LATIN AMERICA OFFICE
EAGE Americas SAS Av Cra 19 #114-65 - Office 205 Bogotá, Colombia
• +57 310 8610709
• americas@eage.org
• www.eage.org
EAGE MEMBERS’ CHANGE OF ADDRESS
Update via your MyEAGE account, or contact the EAGE Membership Dept at membership@eage.org
COPYRIGHT & PHOTOCOPYING © 2026 EAGE
All rights reserved. First Break or any part thereof may not be reproduced, stored in a retrieval system, or transcribed in any form or by any means, electronically or mechanically, including photocopying and recording, without the prior written permission of the publisher.
PAPER
The publisher’s policy is to use acid-free permanent paper (TCF), to the draft standard ISO/DIS/9706, made from sustainable forests using chlorine-free pulp (Nordic-Swan standard).
Predictive geoscience: Machine learning integrating Globe, gravity, magnetics, and remote sensing data
29 Reservoir resistivity modelling for CSEM interpretation and model building
Daniel Baltar Pardo
35 From Discrete Element Method (DEM) to 2D synthetic seismic modelling
Roderick Perez and Stuart Hardy
Special Topic: Digitalization / Machine Learning
43 Sinkhole detection through multi-component seismic monitoring
Tagir Galikeev, Tom Davis and Steve Roche
49 Predictive geoscience: Machine learning integrating Globe, gravity, magnetics, and remote sensing data
Samuel Cheyney, Ross Small, Catherine Hill and John Clark
55 Derisking structural interpretation and well planning with a multi-network AI fault workflow
Ciaran Collins and Abdulqadir Cader
63 From ‘text soup’ to a trusted AI foundation; semanticising OSDU data for a multi-attribute future
Dr Thibaud Freyd and Dr Raphael Peltzer
71 From metadata to embeddings: enabling agentic AI for subsurface intelligence
B. Lasscock, D. Arunabha, L. Chen, M. Gajula, K. Gonzalez, C. Liu, B. Michell, S. Namasivayam, V.S. Ravipati, A. Sansal, M. Sujitha, G. Suren and A. Valenciano
Feature: Minus CO2
79 Minus CO2 Challenge 2025 – Student teams tackle carbon storage and energy storage in Cambro-Ordovician saline aquifer systems in North America and worldwide
Sofia Damaris Alvarez Roa, Md Arhaan Ahmad, Guillaume Bayvet, Aymeric Besnard, Nikhil S. Deshmukh, Eliott Gallone, Juan Sebastián Gómez-Neita, Angélica González Preciado, Ángela Mishelle Ramos Pulido, Lopamudra Sharma, Juan Esteban Tamayo Sandoval, Julie Vieira and Abhinav Vishal
86 Calendar
cover: Abstract circuit board design with glowing lines and digital network concept. This month we explore the latest innovations in digitalization/machine learning.


Environment, Minerals & Infrastructure Circle
Andreas Aspmo Pfaffhuber Chair
Florina Tuluca Vice-Chair
Esther Bloem Immediate Past Chair
Micki Allen Liaison EEGS
Martin Brook Liaison Asia Pacific
Ruth Chigbo Liaison Young Professionals Community
Deyan Draganov Technical Programme Representative
Madeline Lee Liaison Women in Geoscience and Engineering Community
Gaud Pouliquen Liaison Industry and Critical Minerals Community
Eduardo Rodrigues Liaison First Break
Mark Vardy Editor-in-Chief Near Surface Geophysics
Oil & Gas Geoscience Circle
Johannes Wendebourg Chair
Timothy Tylor-Jones Vice-Chair
Yohaney Gomez Galarza Immediate Past Chair
Alireza Malehmir Editor-in-Chief Geophysical Prospecting
Adeline Parent Member
Jonathan Redfern Editor-in-Chief Petroleum Geoscience
Robert Tugume Member
Anke Wendt Member
Martin Widmaier Technical Programme Officer
Sustainable Energy Circle
Giovanni Sosio Chair
Benjamin Bellwald Vice-Chair
Carla Martín-Clavé Immediate Past Chair
Emer Caslin Liaison Technical Communities
Sebastian Geiger Editor-in-Chief Geoenergy
Maximilian Haas Publications Assistant
Dan Hemingway Technical Programme Representative
Carrie Holloway Liaison Young Professionals Community
Adeline Parent Liaison Education Committee
Longying Xiao Liaison Women in Geoscience and Engineering Community
Martin Widmaier Technical Programme Officer
SUBSCRIPTIONS
First Break is published monthly online. It is free to EAGE members. The membership fee of EAGE is € 90.00 a year including First Break, EarthDoc (EAGE’s geoscience database), Learning Geoscience (EAGE’s Education platform) and online access to a scientific journal.
Companies can subscribe to First Break via an institutional subscription. Every subscription includes online access to the full First Break archive for the requested number of online users.
Orders for current subscriptions and back issues should be sent to First Break B.V., Journal Subscriptions, Kosterijland 48, 3981 AJ Bunnik, The Netherlands. Tel: +31 (0)88 9955055, E-mail: corporaterelations@eage.org, www.firstbreak.org.
First Break is published by First Break B.V., The Netherlands. However, responsibility for the opinions given and the statements made rests with the authors.


EAGE is 75 years old this year, and we want you to help us celebrate the anniversary.
To mark this historic occasion, we are launching a special publication at the EAGE Annual in June. It will tell the story of how the Association has developed since 1951 reflecting the technological advances during this period, and where we may be heading in the future.
That story cannot be told without including some record of the experiences of members. We would like to invite members to write in with any special memories they have of the Association, maybe recounting how our geoscience community and its activities have helped
to support your professional career, or even an amusing anecdote.
Whatever the case, you should keep your text to one or two paragraphs, so we can include as many contributions as possible. And we would also invite you to send in any relevant photos as we intend this to be a highly illustrated coffee table style publication.
Our hope is that the publication can have a lasting shelf life as an accessible record of our Association and its contribution to the scientific community and society in general. We see industry and academia able to use the book for pro-

motional and recruitment purposes, while members can show family and friends what their profession involves.
The EAGE team is very excited to get this project underway, so we encourage everyone with a story to share to write in as soon as possible.
Please email our publications manager Hang Pham at hpm@eage.org with your memories and questions if you have any.
For those interested in the sponsorship and advertising opportunities available for this unique publication, contact corporaterelations@eage.org.
Convenors Mohammad Nooraiepour (University of Oslo) and Isabelle Kowalewski (IFPEN) report on the contribution of geochemistry to the EAGE Annual 2025 programme.


The EAGE-EAG Geochemistry Technical Committee marked a significant milestone at the 86th EAGE Annual Conference in Toulouse, France, presenting two major sessions that underscored geochemistry’s pivotal role in addressing climate change and enabling the energy transition. Folllowing participation at the conference, we want to highlight the events that were valuable for the Geochemistry Technical Community.
Workshop on science and climate action
Our workshop on ‘Geochemistry’s role in advancing climate change and energy transition research’ brought together leading researchers to tackle critical challenges on the path to carbon neutrality by 2050. The morning session showcased groundbreaking methodological advances, including adaptations of the Rock-Eval method for studying carbon dynamics and storage mechanisms, as well as innovative applications of clumped-isotope analysis to enhance our understanding of atmospheric gases such as methane, with direct implications for emission-reduction policies.
The afternoon CO2 removal session explored diverse technological frontiers: CO2 mineralisation through carbon capture and storage, subsurface gas storage optimisation, soil carbonation utilising clay-rich waste materials, and fracture dynamics in mafic formations. Presentations highlighted cutting-edge techniques, including water-alternating-gas injections in reactive reservoirs, bioengineered solutions, and advanced subsurface fluid analysis for storage site selection. The workshop concluded with a comprehensive comparative review
of CO2 balances across global storage solutions, presented by C. Turich from the IEA.
The committee introduced its inaugural Dedicated Session on ‘Reactive flow and transport in porous media’, a landmark addition to the Technical Programme that brought geochemistry and porous media sciences to the forefront. Convened by Mohammad Nooraiepour (University of Oslo), Mohammad Masoudi (SINTEF), and Sylvain Thibeau (TotalEnergies), the session addressed the fundamental mechanisms governing subsurface systems critical to climate mitigation and energy innovation.
The session’s structure reflected the dual nature of contemporary subsurface challenges. The morning programme concentrated on CO2-induced salt precipitation during injection into saline aquifers, a phenomenon with profound implications for injectivity, storage capacity and containment integrity. NORCE researchers offered insights on non-isothermal wellbore-reservoir coupling for reliable CO2 injectivity estimation, followed by a contribution by Ali Papi (Heriot-Watt University) presenting dissolved-water CO2 injection as a salt precipitation mitigation strategy. Karol Dąbrowski (AGH University of Krakow) demonstrated microfluidic experimental approaches to understanding salt precipitation dynamics, while Nooraiepour examined the geomechanical implications of CO2-induced salt formation in sandstone reservoirs.
The second half broadened to encompass thermal-hydrological-mechanical-chemical (THMC) processes across diverse subsurface storage applications. Stéphane Polteau (Institute for Energy Technology) revealed insights into fluid connectivity in continental-margin basalt sequences using strontium isotopes. Olga Dufour (TotalEnergies) presented dynamic simulations of fault reactivation in caprock from the Mont Terri experiment, and Benjamin Emmel (SINTEF) concluded with
hydrogen exposure experiments on Zechstein 2 samples, highlighting the expanding frontier of underground hydrogen storage.
What distinguished this dedicated session was its comprehensive integration across scales and disciplines, from porescale microfluidic observations to fieldscale reservoir simulations. The presentations spanned experimental, numerical, and theoretical approaches, fostering dialogue between academia and industry on challenges including reactive transport model scalability, uncertainty quantification in coupled processes, and the development of innovative characterisation techniques.
Geochemistry emerged not as an isolated discipline, but as an indispensable tool for solving subsurface engineering problems. Whether addressing salt precipitation that threatens CO2 storage efficiency, mineral scaling in geothermal systems or fault reactivation risks in caprocks, the session demonstrated that geochemical processes are the invisible forces shaping outcomes in our transition to low-carbon energy systems.
Building on this momentum, we invite the wider EAGE community to participate in our Dedicated Session ‘Geochemistry and low carbon minerals’, being planned for the 87th EAGE Annual Conference in Aberdeen, UK.
For researchers exploring cutting-edge science, practitioners seeking operational insights or early-career professionals entering this transformative field, the Geochemistry Technical Community offers a platform where fundamental discoveries meet urgent global challenges. Join us in advancing the science that will enable safe, efficient, and sustainable stewardship of Earth’s subsurface resources.
Connect with the EAGE-EAG Technical Community on Geochemistry
Conventional Workflow
TIME PROCESSING, DEPTH IMAGING AND AVA INVERSION
Vp/Vs
USING FIELD-DATA INPUT
SCATTER = LESS UNCERTAINTY!
Quantitative interpretation requires true amplitudes and high signal-to-noise ratio.
DUG Elastic MP-FWI Imaging eliminates the need for conventional time processing, depth imaging and AVA inversion workflows, along with their assumptions that ultimately affect AVA compliance. With DUG Elastic MP-FWI Imaging more certain predictions can be realised — all using field-data input. Brilliant!
info@dug.com | dug.com/fwi
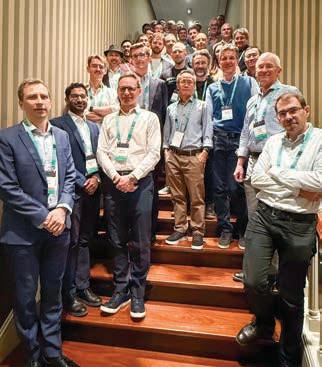
Now in its ninth edition, the HPC Workshop has once again proven to be a window into the world of advanced supercomputing and artificial intelligence technologies and their applications in various fields of geoscience. As in all eight previous editions, the ninth workshop, held in Barcelona on 6-8 October, attracted a vibrant mix of representatives from industry and academia.
High-performance computing remains a key enabler for energy research and applications, as Keith Gray (TotalEnergies) stated in the first keynote speech.
The intersection of HPC and AI was the focus of much discussion. As Dan Stanzione, director of the Texas Advanced Supercomputing Centre in Austin, noted during his keynote speech, massive investments in AI data centres are polarising the market, both in terms of technology and market availability. For example, while double precision has always been a requirement for many applications in conventional HPC, it is well known that AI models do not require this level of computational accuracy. As a result, we are starting to glimpse a future where native double-precision computing units will no longer be a part of the landscape. At the same time, geoscientists are beginning to see an opportunity in trying to use an abundance of very fast low-precision units, together with low-precision floating point numbers that require less memory and bandwidth, to speed up conventional algorithms. Many presentations and discussions have focused on this topic; the path forward is not yet entirely clear, but the signs of progress in this direction are clear and evident. Moreover, the impact of machine learning is not limited to computing architecture, since at the software and application level generative and agentic AI are now realities that the energy world must also deal with, and were the topic of a panel discussion moderated by Matteo Ravasi (Shearwater GeoServices), with the participation of Mik Isernia (Think Onward), Gareth O’Brien (Microsoft), Tariq Alkhalifah (KAUST), and Fabrice Dupros (AMD).
As always, performance and performance analysis matter, and were the
topic of the opening speech by Jesus Labarta from Barcelona Supercomputing Centre and several other presentations. Meanwhile, Eni presented its recently deployed new supercomputer, HPC6. Cloud computing was another hot topic, with John Brittan (TGS) delivering a keynote speech outlining how his company is ready to fully transition from on-prem to the cloud. Software engineering has played a very important role in enabling
this transition, as cost efficiency in the cloud is necessarily achieved by leveraging interruptible spot instances, which introduce an element of unpredictability into execution that can only be managed by increasing the complexity of the job orchestration engine. The key role of software engineering was echoed in many other presentations, with particular attention on abstraction in domain-specific languages or Python wrappers around high-performance legacy Fortran kernels.
As per tradition, this year’s participants also had the opportunity to visit a data centre thanks to the availability
and kind collaboration of the Barcelona Supercomputing Centre, which offered the possibility to see the MareNostrum 5 supercomputer (a 250 PFlops peak performance system, currently number 14 in the top 500) and its new quantum computer deployed in 2025.
The novelty of the ninth edition of the HPC workshop was the coincidence with the second edition of the data processing workshop, which also took place in Barcelona at the same venue. The programme included a joint session between the two workshops entitled ‘Leveraging the computing revolution in the AI era’. The joint session was opened by Edmondo Orlotti (Core42), who further focused on the challenges, but also opportunities, for HPC in the era of artificial intelligence. Among the opportunities, in a landscape of accelerators increasingly evolving towards the requirements of artificial intelligence, Edmondo mentioned the affordability of custom silicon as a possible alternative to accelerate HPC applications. Still on the opportunity side, Flaurent Pautre (Viridien) discussed the application of large language models to software engineering, and Matteo Ravasi talked about the impact of AI hardware on geophysical computational methods. Finally, Bertrand Duquet (TotalEnergies) showed several applications of HPC to seismic imaging, reminding the audience that seismic imaging remains the main user of HPC in the field of geosciences and geophysical data processing.
The ninth edition of the workshop provided a further opportunity for updates, the exchange of information and experiences, and stimulating discussions on the topic of high performance computing. A big thanks goes to the organisation and the technical committee. The next event is scheduled for 2027, with the tenth edition.
Report from the 2nd EAGE Data Processing Workshop held jointly with the 9 th EAGE High Performance Computing (HPC) Workshop on 6-8 October 2025 in Barcelona, Spain.
Building on the success of the 1st Data Processing Workshop held in Cairo in February 2024, the latest edition brought a broader scope, deeper technical content and a strong collaborative structure made possible by its co-location with the well-established EAGE HPC series.
Barcelona served as an ideal host city, allowing us to leverage the opportunity of visiting the world-leading Barcelona Supercomputing Centre (BSC) as a central highlight. The joint event marked a major milestone in EAGE’s ongoing efforts to integrate geoscience innovation, HPC evolution and frontier technologies such as AI and earth observation (EO).
The organising committees for both workshops designed the 2025 edition with the clear intention to expand the thematic reach of data processing beyond seismic into EO and cross-domain applications; enhance collaboration between the seismic processing and HPC communities; leverage Barcelona’s technological infrastructure, particularly the BSC, to offer practical, real-world insight into next-generation computing capabilities; and strengthen networking through joint sessions.
Keynote talks from Prof Kees Wapenaar (TU Delft), Song Hou (Viridien), Claudio Strobbia (Realtime Seismic) and Bertrand Duquet (TotalEnergies) anchored the programme with visionary perspectives on multi-domain data processing, innovative AI workflows, and the growing potential of seismic-HPC integration.
Three sessions, dedicated to Challenges and enhancements in velocity model building and leaning heavily on the power of FWI, provided a comprehensive overview of advances in FWI, velocity model building strategies and AI-supported imaging enhancement in detail. Subjects covered practical implementations of multi-parameter FWI, managing parameter trade-offs, cross-talk, and sensitivity issues, the role of frequency content in


elastic property recovery and data-driven methods for post-imaging refinement.
The closing discussion centred on whether velocity model building should lean more toward physics-based models, data-driven techniques or hybrid approaches. As always, comments rang true with regards to starting a velocity model especially when moving to elastic applications. It was agreed that all approaches hold value depending on geology, dataset characteristics and the end goal.
One of the most anticipated components was the guided tour of the BSC, home to some of Europe’s most powerful supercomputers. The visit highlighted the architecture and operation of top-tier HPC systems; management of massive geoscience workloads; emerging technologies in AI-accelerated computation; sustainability and energy-aware computing initiatives; and next-generation quantum computing.
The programme included the firstof-its-kind panel session exploring the growing role of satellite EO in geoscience moderated by Giovanni Sylos Labini of Planetek Italia. Topics covered included emerging satellite missions and evolving sensor technologies; cross-domain applications spanning resource exploration, monitoring, and environmental assessment;
integration of EO data with traditional geophysical workflows; and opportunities for cross-fertilisation between seismic and non-seismic data domains. The panel was widely praised for bringing fresh perspectives into the data processing community and for highlighting the practical value of EO in broad geoscientific practice.
Another novel element of the joint event was the Computing revolution session. Setting the scene was Edmondo Orlotti, chief strategy officer of Core42. This session brought together specialists from both workshops to explore HPC for scaling AI models, architecture-aware algorithm design, deployment challenges and the interoperability between seismic data pipelines and advanced hardware. AI-driven computational strategies and strong community synergy were evident.
The session on Advancements and future direction of AI/ML underscored the rapidly evolving digital strategy within geoscience disciplines. Song Hou led the charge with a keynote on Transforming geoscience workflow with generative AI, advocating for harnessing unstructured data to enhance processing and QC. Across the session, the community recognised both the potential and challenges of AI, particularly the demand for high-quality training data, computational load management, tight alignment with HPC architectures, and the mismatch between generic synthetic datasets and unique geological settings. Questions about computational overhead and data usage were also raised.
Bringing the workshop to a conclusion was the session on Processing applications for the Energy Transition. This session focused on seismic data processing for carbon capture and storage (CCS), geothermal systems and shallow-hazard mitigation allowing comparison of methodological robustness and the added value of cross-fertilisation across different conditions.
EAGE Digitalization Conference and Exhibition 2026 is gearing up for a packed conference. The strategic and plenary programme will address a broad range of organisational and leadership issues related to digital innovation in energy.
The programme features some distinguished keynote speakers. Paula Doyle, chief digital officer, Aker BP, will be speaking on ‘Agentic workflows – why and how?’; Allison Gilmore, product management director, S&P Global Energy, will be speaking on ‘AI for subsurface: Early impacts and broader potential’; and Josh Etkind, CEO, ThinkOnward, will be speaking on ‘Decisions, not demos: Human + AI operationalised at any scale. More keynote speakers are due to be added to the programme.
The conference agenda also features a wide range of panel discussions, including one titled: ‘Adoption at scale: Why digital transformation still fails – and how
to finally make it stick’. Panellists for this session will be Dr Milos Milosevic (senior director of strategy, Halliburton-Landmark), Gautier Baudot (director div exploration excellence transformation, TotalEnergies), Karen Czachorowski (digital technology lead, Aker BP), Jan Eivind Danielsen (Digital strategist & business transformer, Cognite), and Einar Landre (lead digital architect, Equinor).
Another highlight will be ‘Data readiness for AI subsurface workflows: Trust, quality and efficiency’. This roundtable discussion consists of five industry experts, Ingrid Sternhoff (ops digital ecosystem manager, Aker BP), Dr Julianna Toms (director computational science & engi-
neering, Halliburton-Landmark), Mathieu Terrisse (manager, data, digital, innovation exploration, TotalEnergies), Dani Alsaab (senior product manager, AspenTech) and Petter Dischington (project coordinator for data management strategy, SODIR).
These are a few examples of what awaits attendees in Stavanger, Norway at EAGE Digital 2026. You can gain firsthand key industry insights and explore topics such as AI innovation, navigating the hybrid reality, driving value with OSDU, AI operationalisation and much more.
Registration is open. Visit www.eagedigital.org for a detailed overview on more panel discussions, keynote speakers and roundtable discussions.
Convenors Jeanne Vidal (WING) and Thomas Mooij (PanTerra) report on the key highlights from the dedicated session ‘From Mines to megawatts: Geothermal heat, storage, and sustainable energy’ hosted by the EAGE Technical Community on Geothermal Energy at EAGE GET 2025.
The dedicated session explored how mine water geothermal systems are evolving from niche research topics into operational, large-scale components of regional energy strategies. Featured were four experts: Elke Mugova (Fraunhofer IEG and WIM Germany), Virginie Harcouët-Menou (VITO), David Townsend (TownRock Energy), and Falco van Driel (Mijnwater). Projects showcased during the session revealed a growing sector driven by both technological innovation and the pressing political need for decarbonised heating.
Mine water geothermal systems offer a unique convergence of strengths at a moment when Europe urgently needs clean alternatives for heating and cooling. The advantages are compelling.
Flooded mines provide extensive, naturally warm water bodies (temperatures typically 12 °C to 30 °C), ideal for coupling with heat pumps. Existing shafts and galleries reduce development costs, while the vast subsurface voids hold enough thermal capacity to support both heating and cooling production, and long-duration thermal energy storage on a seasonal scale.
Today, Europe counts more than 50 operational mine geothermal systems, around 60 in various stages of planning or study, and only a handful ever decommissioned. Many of the existing plants have operated for decades, demonstrating resilience, reliability and long-term economic viability. For regions affected by mine closures, this technology represents not only an energy solution but also a socio-economic renewal pathway.
When mining activities stop, groundwater progressively floods the excavated voids. Over time, the water temperature equilibrates with that of the surrounding rock through the natural geothermal gradient, creating large volumes of water with stable temperatures. These easily accessible reservoirs can then be harnessed for thermal energy production and storage. Heat and cold can be extracted through several configurations, e.g., open or closed loop systems.
Heat pumps elevate the temperature for district heating networks, while the cooled water is reinjected, allowing the system to function as a continuous geothermal cycle. When cooling is needed, the process reverses. For municipalities striving to reduce reliance on fossil fuels, these systems offer predictable performance and a level of scalability rare among renewable heating technologies.
Beyond heat production, mines can also act as seasonal thermal batteries. Through mine thermal energy storage (MTES), excess heat can be stored for later use, optimising renewable energy integration.
Across Europe, a diverse portfolio of research pilots and industrial-scale systems illustrates how rapidly mine water geothermal is advancing.
On the research side, the EU-funded project PUSH-IT seeks to bridge the mismatch between heat availability and demand through large-scale seasonal thermal storage. One of the demonstrators is located in Bochum (Germany), where researchers are developing a MTES system beneath a dense energy campus that hosts a data centre, a CHP unit, and cooling towers. After the drilling of the 120 m deep first well in 2024 and extensive geophysical and hydrogeological investigations, four additional boreholes will be installed between 2025 and 2026 to test circulation, storage efficiency and long-term performance. A detailed numerical model and an active engagement programme support this effort to become one of Europe’s first large-scale MTES demonstrators.
In Wallonia (Belgium), where extensive abandoned coalfields shape the regional landscape, feasibility studies funded by the Walloon government have recently been conducted to identify the most promising sites to host a mine water geothermal pilot project. Led by VITO in collaboration with the universities of Mons and Liège, the studies covered the three main coal basins, namely, the basins of Charleroi, couchant de Mons and Liège. The assessments included subsurface mapping of the mine workings and infrastructures, demand and production scenarios modelling as well as stakeholder engagement. The MontLégia Hospital and the LégiaPark district emerged as ideal prosumers for a fifth generation heating and cooling concept coupling mine water heat extraction with seasonal storage. A government decision is expected in 2026. If successful, this will become the first operational mine water geothermal installation in Wallonia, marking the beginning of a regional strategy for mine-based sustainable heating.
Further north, the Galleries to Calories (G2C) project, funded by Geothermica, explores how mine workings can support heat
storage and transfer in Scotland, Ireland and the USA. The initiative is evaluating the feasibility of an underground ‘geobattery’ near Edinburgh, capable of storing surplus heat from industrial activities and releasing it during peak demand, offering an example of hybrid geothermal-storage systems adapted to industrial settings.
The industrial sector is also gaining momentum. In the UK, more than a decade of subsurface mapping and pilot schemes has paved the way for the first large operational mine water geothermal district systems. Lanchester Wines operates two privately funded mine water heating schemes in Gateshead, NE England since 2018, delivering 3.6 MW of heating to neighbouring commercial warehouses. Nearby, the Gateshead Energy Company scheme, operational since 2023 with 6 MW of installed capacity, shows how municipal heat networks can rely on mine water to support large-scale district heating.


The Netherlands continues to be a pioneer through the long-standing Mijnwater Heerlen project, one of Europe’s most successful transformations of abandoned coal mines into a regional low-temperature energy infrastructure. What began in 2008 as a pilot district heating and cooling system has evolved into Mijnwater 2.0, a smart fifth generation thermal grid built around principles of energy exchange, decentralised demand-driven operation and large-scale seasonal storage within mine reservoirs. In Mijnwater’s approach, heat from data centres and industry is already used. Future possibilities are to integrate heat from other sources such as solar collectors and buffer systems. A wide range of other heat sources can be implemented as well, making systems like Mijnwater’s a strong option for using waste heat. Today, the system serves over 1000 homes and 250,000 m² of commercial space, with a plan to quadruple capacity by 2030.
Together, these initiatives illustrate a rapidly expanding European mine geothermal ecosystem, spanning from research to commercial deployment. They demonstrate that mine water geothermal is now a validated, scalable pathway to clean heating, energy storage and regional resilience.
Developing a mine geothermal system requires harmonising three distinct layers of complexity.
Subsurface integration: Successful development depends on detailed characterisation of mine geometry, flow pathways,
fracture networks, and the potential presence of methane or other gases. Hydrogeological modelling helps predict both performance and long-term stability.
Drilling and access: Reaching flooded galleries may require directional or horizontal drilling with deflection risks and unpredictable geological conditions. Real-time monitoring, adaptable drilling strategies and improved downhole imaging technologies are increasingly seen as essential tools for reducing uncertainty.
Surface infrastructure: The design must accommodate district heating integration, intermittent demand and spatial constraints, particularly in dense urban areas. Many projects demonstrate the advantages of placing components underground or within existing structures to save space and enhance visual acceptance.
In regions shaped by mining history, public perception is pivotal. Transparent communication about risks, monitoring strategies, and expected benefits is essential for trust-building.
Successful projects consistently emphasise early and sustained stakeholder involvement: national and local policies, environmental agencies, former mining authorities, private investors, and local residents all play a crucial role in decision-making. This collaborative governance model is increasingly recognised as a prerequisite rather than an optional step.
The relevance of mine geothermal extends far beyond Europe. Regions such as Appalachia in the United States, the coalfields of China, copper mines in South America, and mining districts in South Africa and Australia possess similar subsurface conditions. Knowledge transfer, especially around policy frameworks, drilling methods and community engagement could accelerate adoption worldwide.
Another emerging frontier lies in co-developing geothermal systems within active mines, enabling energy recovery or storage even before closure. This approach represents a new paradigm in
which mining and renewable energy production evolve together rather than sequentially.
Building an international network of researchers, municipalities, regulators, and citizen groups would strengthen innovation, reduce duplication of efforts and promote a just transition for mining regions globally.
Several lessons emerge clearly from the projects showcased. First, a solid hydrogeological understanding remains the cornerstone of any successful mine geothermal development. Precise knowledge of mine architecture, water flows and thermal regimes allows developers to optimise system design, anticipate operational behaviour and minimise risks. Second, continuous engagement with national and local policies, regulators, environmental agencies, and local communities is fundamental. These systems succeed not only because they are technically sound, but because they are socially anchored and institutionally supported.
An innovative mindset is equally important. Operating a mine water energy system involves navigating legacy infrastructure, adapting drilling strategies to complex underground conditions and integrating new technologies from downhole heat exchangers to smart district energy networks. Best practices, transparent communication and operational flexibility consistently prove decisive in delivering reliable systems.
This dedicated session reaffirmed that abandoned mines are more than geothermal reservoirs: they are exceptional assets for underground thermal energy storage. Their scale, accessibility and hydraulic connectivity make them ideal for storing surplus heat or cold and redistributing it across seasons or neighbourhoods. In some regions, mines can also serve as conduits for thermal transport, transforming the subsurface into an active component of district-scale energy management.
Connect with the EAGE
Geothermal Energy Community
• FLOW MECHANICS FOR GEOLOGICAL CO2 STORAGE – BY FLORIAN DOSTER
• RISK ASSESSMENT OF CO2 STORAGE BY UNDERSTANDING COUPLED THERMOHYDRO-CHEMICAL-MECHANICAL PROCESSES –BY ANDREAS BUSCH AND ERIC MACKAY
• CO2 STORAGE PROJECT DESIGN AND OPTIMIZATION (SALINE AQUIFERS) –BY PHILIP RINGROSE PARIS, FRANCE GEOLOGICAL CO2 STORAGE MASTERCLASS

Every month we highlight some of the key upcoming conferences, workshops, etc. in the EAGE’s calendar of events. We cover separately our four flagship events – the EAGE Annual, Digitalization, Near Surface Geoscience (NSG), and Global Energy Transition (GET).

First EAGE/ALNAFT Workshop – Unlocking hydrocarbon potential of the West Mediterranean offshore frontier basin of Algeria
11-13 May 2026 – Algiers, Algeria
This dedicated technical forum offers a unique platform to explore emerging geological models, frontier exploration challenges and innovative technologies relevant to Algeria’s offshore domain. Through in-depth technical sessions, case studies and interactive discussions, participants will gain practical insights and engage directly with peers and decision-makers. Be part of this important exchange of knowledge and experience and secure your place at a workshop shaping the future of offshore hydrocarbon exploration in the West Mediterranean.
Early Registration Deadline: 5 April 2026

Second EAGE/ALNAFT Workshop on Techniques of recovery of mature fields and tight reservoirs
11-13 May 2026 – Algiers, Algeria
The workshop will focus on recovery challenges facing mature fields and tight reservoirs, where decades of production now demand innovative tertiary-recovery solutions. Discussions will address proven and emerging techniques applicable to brownfields, tight Cambro-Ordovician sands and complex carbonate plays highlighting how technology and tailored workflows can unlock remaining reserves. Bringing together operators, service companies, researchers, and regulators, the workshop offers a collaborative platform to share experience, evaluate opportunities, and advance recovery strategies under the theme ‘Move forward by recovering differently’.
Early Registration Deadline: 5 April 2026


9th EAGE Conjugate Margins Conference & Exhibition
27-31 July 2026 – St. John’s, Newfoundland and Labrador, Canada
The Call for Abstracts is now open for this long-standing international forum bringing together industry, academia and government to advance the understanding of Atlantic conjugate margin systems. Nearly two decades after its inaugural meeting in 2008, the conference continues to showcase high-quality scientific and technical contributions. The 2026 edition will focus on Geodynamics and structural geology; Stratigraphy and depositional systems; Petroleum systems; Carbon sequestration; and New analytical methods. Special thanks to our Gold Sponsor DUG.
Abstract submission deadline: 22 March 2026

First EAGE/SBGf Workshop on Seismic Processing
23-24 September 2026 – Rio de Janeiro, Brazil
This workshop is dedicated to advancing the full spectrum of seismic data processing, from pre-processing and signal conditioning to high-end imaging, inversion, and emerging applications in carbon capture and storage. Contributions are invited on topics areas such as pre-processing, signal conditioning and demultiple; velocity model building and full-waveform inversion (FWI); imaging and model-driven inversion methods; OBN processing and hybrid (OBN + streamer) workflows; time-lapse (4D) seismic processing and monitoring; machine learning, automation and workflow efficiency; and seismic processing for CCS and emerging energy applications.
Abstract submission deadline: 18 May 2026

Nominations are open for the Marie Tharp Sustainable Energy YP Award introduced in 2024 to support and recognise students that focus on energy transition disciplines. Candidates must be MSc and PhD students under 35 years old and pursuing a curriculum related to geoscience and engineering to support energy transition.
Applications are encouraged with the deadline of 31 March for submissions. The nomination package must include
a nomination letter by the applicant detailing their motivation for applying, highlighting their achievements, ongoing projects and plans to contribute to the advancement of energy transition and the work that the EAGE community does.
A CV and at least one letter of support from a technically qualified person that knows the nominee and their work, should be included in the package.
The award winner will receive a grant to attend the EAGE GET Conference in Hannover, Germany in November 2026 offering an opportunity to gain exposure and experience to the latest sustainable energy initiatives and network with industry experts and peers.
About the award and the nomination process
EAGE invites all active EAGE Student Chapters to take part in the Online GeoQuiz 2026, a live virtual competition designed for students to engage in geoscience knowledge and teamwork.
The Online GeoQuiz will be held live and virtually during mid March, allowing Student Chapters from around the world to participate simultaneously in an interactive and dynamic format.
As a reward, the three Student Chapters with the highest scores will each receive three free registrations to attend the EAGE
Annual Conference & Exhibition 2026, which will take place in Aberdeen, United Kingdom. Here, the teams will participate in the EAGE Global GeoQuiz and compete against other student participants.
We encourage all active Student Chapters to participate and showcase their knowledge while competing with peers from the global EAGE student community. The deadline to register is 28 February.
For information about the GeoQuiz 2026 please contact students@eage.org.
Winners have been announced for the Vlastislav Červený Student Prize, which recognises outstanding Bachelor (Bc) and Masters (MSc) theses in theoretical and applied geophysics in Central Europe. Established by Seismik, and now organised by the EAGE Local Chapter Czech Republic, the prizes commemorate the scientific legacy of Prof Vlastislav Červený and aims to support the development of early-career geoscientists.
In the MSc category, Angelin Mariam Binny of the Ludwig-Maximilians-Universitat München (Department of Earth and Environmental Sciences) received the award for her thesis ‘Seismic response evaluation in six degrees of freedom: Insights from shake table experiment’, supervised by Dr Felix Bernauer. In
the Bc category, Jan Hohermuth of the Faculty of Science, ETH Zurich (Earth and Climate Sciences, Geology and Geophysics) received the award for the thesis ‘Measuring acceleration and rotation caused by tree sway using low-cost inertial motion sensors’, advised by Drs Cédric Schmelzbach and Alexis Shakas.
The winners (thanks to our main sponsor INSET and sponsors EAGE, Seismik, G Impuls Praha, and Charles University’s Faculty of Math and Physics and Faculty of Science) will receive €1000 and €500 (MSc and Bc, respectively), free EAGE student membership for 2026 and a voucher for an EAGE online learning course.
Honorary awards were accorded to Bohdan Rieznikov of Technical University of Ostrava (Faulty of el. Eng. and Computer Science) for the Bc thesis
‘Classification of seismic events using recurrent neural networks’ (advisor Dr Marek Pecha); Helena Simić of University of Vienna (Faculty of Earth Sciences, Geography and Astronomy) for the MSc thesis ‘Seismic attenuation from seismic ambient noise recordings: application to short-term nodal deployment’ (supervisor Dr Götz Bokelmann); and Felix Schweikl of the Ludwig-Maximilians-Universitat Munchen (Department of Statistics) for the MSc. thesis ‘Time series analysis for prediction of geomagnetic indices’ (supervisors Dr Fabian Scheipl, Dr Artem Smirnov and Dr Elena Kronberg) appreciating excellent statistical analysis of complex data and well written thesis.
Honorary award winners receive EAGE student membership for 2026 and an EAGE online learning course.


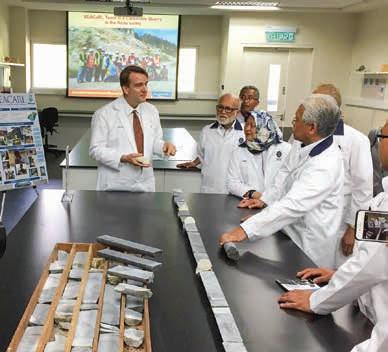
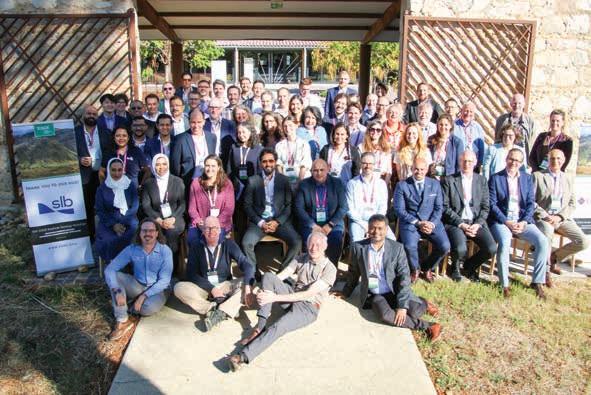
The French city of Montpellier hosted the 6th EAGE Borehole Geology workshop in the SLB Montpellier Technology Centre on 22-24 September 2025, attended by 80 participants from 20 countries representing different E&P companies (NOCs and IOCs), service companies, image interpretation consultants and universities.
A pre-event field trip organised around the city on 21 September focused on outcrops presenting complexities of structural geology making a majestic display. This focused the proceedings of the workshop with the theme of ‘Advancing borehole geology: Integrating multi-disciplinary approaches’.
Pascal Richard and Chris Wibberley led the field trip observing fractures and evidences of fluid circulation through them during basin evolution, while pointing to different fracture patterns from Permian wind-blown deposits to Mesozoic carbonates. This set the pace for the workshop (45 oral and 15 poster presentations) as the participants wanted to discuss these geological features on borehole scale, with image logs and core in addition to other wellbore data.
Chandramani Shrivastava and Mohammed Al Fahmi welcoming participants and outlined the overall agenda, encouraging interactive engagement over the three days of technical discussions. Sessions included classical applications in sedimentary and structural geology, reservoir architecture, quantifying reservoir attributes, well operations and technology, data analytics in borehole geology, sustainability in the energy mix bridging the gap between 1D borehole geology models and 3D digital earth models delving into cutting edge innovations, practical applications, and expanding the role of borehole geology across diverse industries including energy, mining and environmental sectors.
Keynote speakers shared their experience and talked about overcoming the existing challenges of the industry using digital innovations with domain technical excellence. Lawrence Bourke talked about 40 years of interpretation experience with lessons learned and forthcoming expectations, Pascal Richard continued with the field trip experience to discuss borehole images for fracture interpretation and modelling. Josselin Kherroubi outlined the journey of borehole image interpretation with advances and challenges on the way.


Presenters talked through the length and breadth of borehole geology, from complex manual geological interpretations to machine-learning based answers and new downhole tools. Operating companies talked about operational challenges and interpretation issues while service companies focused on technological advancements to address those challenges. Interpretation consultants provided insights with decades of experience through borehole geology problems while academia and environment sector presenters spoke about availability of data or lack of it for longterm projects. Discussions on long existing classical hydrocarbon exploration/development to emerging geothermal and radioactive waste disposal to carbon sequestration ensured there was not a single moment where a single participant felt out of place.
Three days of this super-engaging workshop ended with lots of promises around how the wide-scale adoption of borehole geology answers can help in the larger energy mix for humanity.


Convenors George Ghon (CapGemini) and Lukas Mosser (Aker BP) discuss AI developments stemming from the workshop ‘Foundation Models in the Geosciences’ at the EAGE Annual in Toulouse.
As AI applications progress from the breakthroughs in one domain such as text generation or image classification toward solutions that provide an integrated system of information processing across different modalities, new model paradigms are emerging that learn from different data types and incorporate multiple and varied representations of reality.
These advancements and the corresponding development of new model architectures shift the dialogue toward a better understanding of the complexities of the physical world and its phenomena. This has led to the coining of terms like world models or foundation models that represent or can analyse a whole domain, or the entire world.
A common understanding of foundation models is that they are trained on very large datasets that capture a representation of reality and its underlying relations. From a statistical perspective, this means learning a general distribution from data. This enables the prediction of new properties or insights beyond merely acting on a subset of representative examples. A foundation model should be able to generalise across a domain rather than just learning a specific set of examples that have been used for training purposes.
For text-based models, or LLMs, this goal has been achieved by training models on virtually all public documents that are available on the internet to generalise across language. Attempting to generalise across different modalities, architectures have been developed that can train on text, images, sound, and video, bridging those distinct layers into a more universal representation of reality. Modern foundation models can effectively combine vision and language tasks, learn from both images and text, and predict in both those domains. It is a powerful capability to shift from a singular representative mode to a model or system that can process multiple types of data that describe related phenomena in different ways. In subsurface applications, many datasets such as seismic volumes and associated property cubes can be represented and processed as images. They can be complemented by textual sources and integrated with specific information such as well logs and geospatial context.
Model architectures and training methods developed by AI labs for general purpose applications can be adapted to subsurface
workflows and open a new paradigm for integrated subsurface understanding and interpretation. Challenges do remain due to data sparsity of direct measurements and the high ambiguity that these signals represent in terms of subsurface properties and characteristics. Increasing availability of powerful compute, focus on data quality and higher efficiency in training algorithms, however, continue to push the field forward and allow for the development of more powerful models or integrated systems that can interpret the subsurface in new and better ways.
During the workshop ‘Foundation Models in the Geosciences’, hosted by the EAGE Technical Community on AI at the EAGE Annual in Toulouse, we gathered a range of speakers working in the field of developing subsurface foundation models in both academia and industry. One contributor Anders Waldeland is leading a consortium at Norsk Regnsentral (NR) to develop a seismic foundation model based on DISKOS, the Norwegian national repository for data on the Norwegian Continental Shelf (NCS). The team at NR, with contributions from Equinor and AkerBP, train the NCS model on all available full stack volumes in both time and depth, which represent around 48TB of data. The model utilises a vision transformer architecture employing a masked autoencoder for a self-supervised training regime. Current experiments are focusing on a comparison between 2D and 2.5D approaches, the latter including additional patch directions at 450 and 1350 angles, and benchmarking both methods on tasks like salt segmentation, sedimentary package identification, flat spot and injectite mapping. Comparing performance on non-NCS datasets indicate the model´s ability to generalise and point toward further research directions that could include angle stack data to predict AVO effects and well logs to infer lithologies from seismic.
A push toward multi-modality in subsurface interpretation was presented by Xinming Wu, who introduced the ‘Geo-Everything Model’, a foundation model applicable to various interpretation tasks such as 3D property modelling, structural interpretation and geobody identification. The model combines unsupervised pre-training on seismic as well as synthetic property volumes with a supervised post-training step for structure related tasks. This incorporates a mixture of labels and prompts for diverse interpre-
tation tasks in a conditional generative process that is enabled in a generative adversarial (GAN) framework. The conditioning of sparse interpretation labels on seismic imaging data allows for a realistic or guided estimation of subsurface properties in a zero-shot regime by providing a suitable prompt to the model as well log or geobody mask to predict the desired property in 3D.
Haibin Di from Slb presented a seismic foundation model built with a vision transformer style encoder that is pre-trained in a self-supervised manner on a large corpus of real and synthetic seismic data. The model is trained with multiple pretext tasks, including denoising, energy and phase prediction, and lateral/ vertical interpolation. This encourages the network to learn a rich latent representation of seismic texture and structure without relying on human labels.
On top of this shared representation, three usage modes are demonstrated. In a direct inference mode, operations in latent space and lightweight task heads enable 2D-3D interpolation, 4D anomaly detection and rapid geo-feature screening across surveys without additional training. In an instantaneous learning mode, simple models such as random forests and multilayer perceptrons are fitted in seconds on top of the latent features to propagate well markers and logs for facies classification and property inversion, achieving higher lateral consistency and reduced training cost compared with conventional CNN-based approaches. Finally, a light fine-tuning mode attaches a small segmentation network to the frozen
backbone to perform one- or few-shot seismic image segmentation, showing improved generalisation and faster convergence relative to training from scratch. Together, these results illustrate how a pretrained seismic foundation model can act as a versatile backbone for conditioning, interpretation and inversion workflows while substantially reducing manual labelling and compute requirements.
We see these approaches breaking the ground for new ways of working where an emerging generation of models can perform a variety of routine geoscience tasks and legacy workflows are increasingly replaced or augmented by more integrated model driven systems that can increasingly autonomously interpret seismic data, identify geobodies and propagate well log properties across volumes.
Seismic foundation models are emerging that begin to learn inherent wave-based property distributions such as phase and energy, gaining a more fundamental understanding of the data. Integration of pre-stack data into models could lead to breakthroughs in AVO analysis and an extension to 4D seismic as time series, potentially introducing predictive reservoir analysis. As AI in the subsurface industry is still waiting for a genuine ChatGPT moment, these emerging models and novel approaches are increasingly pushing toward it.
Catch up with the EAGE Technical Community on AI
Prof Zvi Koren and Dr Alan Vigner from AspenTech were guests at London Chapter’s recent meeting to deliver an insightful lecture on advanced subsurface velocity modelling techniques used in geophysical and geological interpretation.
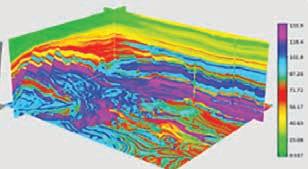
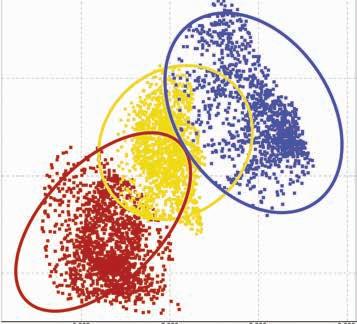
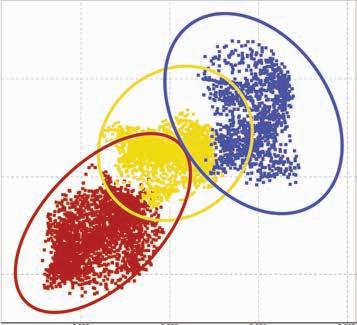
The core of their presentation centred on two complementary algorithms: time preserving tomography (TPT) and reverse time migration (RTM) demigration/remigration. TPT is regarded as an efficient, automated workflow that resolves time-depth conversion uncertainties and minimises a well’s miss-ties by adjusting velocity models while maintaining kinematic consistency with seismic data. The RTM technique, a post-stack process, allows for the quick generation of new seismic images based on TPT-derived velocity models, avoiding the need for a full pre-stack depth migration (PSDM).
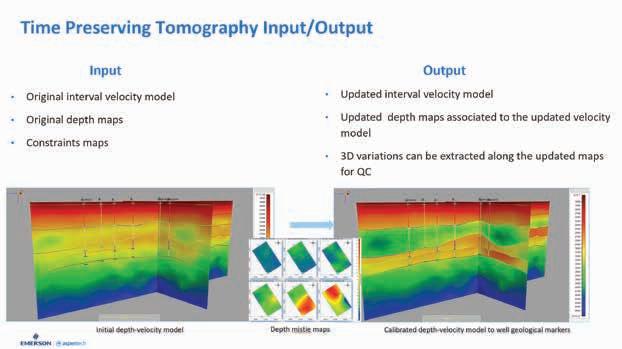
Time-Preserving Tomography (TPT) efficiently updates the subsurface velocity model while preserving the consistency of seismic travel times.
The presentation emphasised that these tools create a crucial bridge between processing and imaging teams and interpreters, allowing for rapid iterative updates, scenario testing and uncertainty analysis. This ensures the geological and geophysical data remain consistently synchronised throughout the project lifecycle. The lecture has been recorded and is available on the EAGE YouTube channel.
We want to welcome the newly formed EAGE Student Chapter from the Universidade Federal do Ceará in Brazil. Students from various academic levels - undergraduate, master’s, and doctoral - share a strong interest in expanding geoscientific knowledge, fostering innovation, and strengthening academic collaboration, while also contributing to the global EAGE community.
Chapter members are engaged in studies and research that range from geophysical methods applied to mineral and petroleum exploration to emerging applications related to the energy transition and geological risk mitigation. They are seeking to integrate computational modelling, data processing and geological interpretation to address sustainable development challenges as well as disseminate geoscience knowledge through activities in schools and student events.
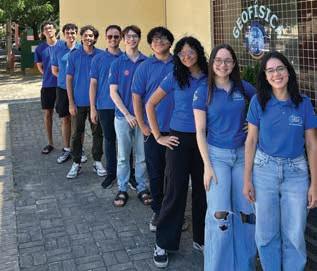
Supported by the Department of Geology, the Laboratory of Geophysics for Prospecting and Remote Sensing (LGPSR), the Innovation and Research Group in Energy and Mineral Resources (GIPEM), and collaborating faculty members, such as their chapter advisor, Professor Karen Leopoldino, they have access to well equipped laboratories, computational tools and academic mentorship that enable
solid technical training and meaningful practical experience.
This includes specialised facilities, professional software and a learning environment that encourages research, technical development and student leadership. This institutional support strengthens their initiatives and allows students to enhance their skills in geophysics research.
For 2026, the Chapter is planning a series of activities focused on technical development and student engagement, including guest lectures, academic meetings, study groups, and outreach actions. The activities aim to connect students with practical geophysical applications, expand professional networks and stimulate interest in scientific research. One of the goals will be to offer continuous training opportunities, facilitate access to EAGE resources, participate in events, academic challenges, and development programmes.
The latest issue of Preview (Volume 2025, Issue 239) published by the Australian Society of Exploration Geophysicists (ASEG) is now available on EarthDoc, offering readers a window into the world of geophysics, exploration and industry innovation.
Editor Lisa Worrall reflects on the past year in geoscience and the trends shaping the industry and also features the surprising results of the annual Stock Market Game offering a playful yet insightful take on economic and market forces.
The issue also delves into the booming mineral exploration sector in Australia. Students and early-career geoscientists will find the coverage on postgraduate developments particularly compelling, with discussion of enrolment trends, scholarships
and research initiatives reflecting both the pressures and possibilities in education today.
Technical and commentary sections explore environmental geophysics applications, mineral geophysics insights and cutting-edge data trends. The fourth instalment of the Geomagnetophilia series provides an in-depth look at the magnetic signatures of the newer volcanics in southwest Victoria.
Rounding out the issue, a book review guides readers through interpreting soil test results, offering practical insights for both fieldwork and laboratory analysis.
Explore the full issue and dive into these articles at EarthDoc.
The EAGE Student Fund supports student activities that help students bridge the gap between university and professional environments. This is only possible with the support from the EAGE community. If you want to support the next generation of geoscientists and engineers, go to donate.eagestudentfund.org or simply scan the QR code. Many thanks for your donation in advance!


Sanjay Rana can look back on a remarkable career having established the first commercial company in India to introduce engineering geophysics solutions to tackle the country’s infrastructure needs. A prolific writer, he is also a sought after keynote speaker promoting his discipline and its value.
I grew up in a very typical Indian middle-class household with an itinerant, upright civil servant father. We were never left wanting for anything, yet we didn’t have a problem of plenty either. Because of my father’s frequent transfers, I moved cities often, which turned out to be a gift in disguise. It exposed me early to different cultures, languages, people, and ways of thinking. Adapting became second nature. School years were a happy mix of academics and cricket − lots of cricket!
My university years at IIT Roorkee were intense, enriching, and honestly, really fun. Academically, I was a very focused student and graduated as a gold medallist and class topper but I certainly didn’t live only in the library. I was deeply involved in cricket, badminton, shooting, debating, and theatre. I often joke that I did everything possible to distract myself from studies, yet never really got distracted. A friend actually nudged me toward geoscience, and it clicked instantly I loved the outdoors and knew I wasn’t made for a conventional 9-to-5 desk life.
My first job was with UP Electronics, where I worked as a geophysicist handling commercial well logging, while also being asked to train others. That part came as a surprise. I found myself mentoring professionals twice my age. This was both daunting and deeply rewarding. It taught me early on that age matters far less than clarity and conviction.
My five years’ experience in the nuclear sector was intense, highly disciplined and deeply enriching. I was involved in uranium exploration projects, work that even today remains largely confidential − and I’m still literally under oath!
The decision to start my own company came from a mix of curiosity and frustration. I was closely following global trends in engineering, technology and academia, and was surprised by how little near surface and engineering geophysics were being applied in India, despite huge infrastructure needs. I took the leap largely on my own, but with strong encouragement from friends abroad working in geosciences. They assured me this model was not only viable but necessary, thereby bringing about one of India’s first dedicated private engineering geophysics companies.
The company evolved organically with the country’s needs. We began with groundwater exploration, but as India’s infrastructure expanded, it became clear that subsurface utility mapping and GPR applications were far more important. Today we are an authority on dam geophysics. Early international collaborations with friends abroad helped us to bring advanced equipment into India and execute our first projects. We started very small, with a lean team and lots of hands-on work. Over time, this grew into international operations, including offices and projects in Bahrain, Saudi Arabia and Singapore.
Some of the projects I am most proud of are those where geophysics directly contributed to saving lives. The Silkyara tunnel collapse stands out deeply. In such moments, technology stops being academic or commercial. It becomes human.
My vision is that engineering geophysics becomes a standard and integral part of every major infrastructure project, not an optional investigation carried out only after problems arise. A clear understanding of the subsurface should inform design decisions from the very beginning. With advances in sensors, AI and data integration, engineering geophysics will move beyond one-time surveys to continuous subsurface intelligence, supporting construction, operation and long-term health monitoring of assets like dams, tunnels, and bridges.
At home, I try to keep life simple and balanced. Mornings usually begin with yoga and some exercise − it helps set the tone for the day. I enjoy light to moderate reading, mostly to stay curious rather than being overwhelmed. In the evenings, I prefer meditation to slow things down and clear my head after a busy day. I’ve never really been a television person; silence and reflection work much better for me. These routines help me stay grounded and reasonably sane.

BY ANDREW M c BARNET


The word uninvestable, recently coined by ExxonMobil CEO Darren Woods in connection with the current dilapidated state of Venezuela’s oil industry, is not to be found in traditional English language dictionaries. However, its meaning is pretty clear. In a lighter moment Woods might like to consider the following lyric adapted from Unforgettable, the trademark song of the legendary Nat King Cole:
Uninvestable
That’s what you are
Uninvestable
Though near or far
Obviously, President Donald Trump would not be amused. He met with US oil company executives shortly after the capture and abduction of President Nicolás Maduro and his wife to interest them in his plan to take over the running of the Venezuelan oil industry indefinitely and control its exports. A vital part of this extraordinary intervention in another country’s government was Trump’s apparent assumption that American oil companies would willingly step in to revitalise the disastrous condition of Venezuela’s hydrocarbons extraction industry, once the envy of the world.


In a statement after the meeting with Trump, the ExxonMobil CEO issued a carefully crafted statement that ruled out immediate investment – uninvestable – but left the door ajar if certain conditions were met. That did not go down well with the president who said he was ‘inclined’ to leave ExxonMobil out of future US industry participation in Venezuela.
What Woods sidestepped was that Venezuela’s fortunes for the past century have depended on production of its oil resources, often perilously beholden to the US. Safe to say it has not gone well. The country is a disaster featuring a corrupt tyrannical government, crumbling infrastructure, widespread poverty, large-scale emigration, and of course a barely functioning oil industry, virtually the only source of income.
The country can certainly be categorised as an early victim of the ‘oil curse’. As such the oil companies who flocked to Venezuela in the 1920s and proceeded to build a stunningly successful production machine cannot be absolved from some complicity in today’s tragic mess.
‘By 1929 Venezuela was the world’s leading exporter’
Trump must have thought the deal was handing back to the US industry access to the country’s enormous potential oil wealth. Although some believe the numbers may be inflated, Venezuela’s 300 billion barrel reserves, located mainly in the Orinoco oil belt, are said to be the largest in the world. How recoverable and at what cost this almost exclusively heavy oil may be is another question. As a further enticement, the Trump Administration was pushing the contested claim that control of Venezuela’s production would enable recovery of oil that was ‘stolen’ from licensed US companies as part of the country’s nationalisation strategy formalised in the 1970s. It is true that companies (notably ExxonMobil and ConocoPhillips) are owed billions from sequestration of their assets and continue to pursue their claims in international courts.
The oil experience in Venezuela began in 1914. Caribbean Petroleum, a Shell subsidiary, drilled the successful Zumaque 1 well, establishing the Mene Grande field in the Maracaibo Basin as the country’s first oilfield to go into operation, its development slowed by the onset of the First World War. It was the infamous blowout in 1922 of another Shell well, Barroso 2 in Cabimas, Zulia state, that effectively acted as an advertisement for Venezuela’s petroleum potential, although a local ecological disaster. A column of oil jetted out of the well at 100,000 b/d for a week. The incident proved a potent signal for the start of the oil boom. By 1929 Venezuela was the world’s leading exporter and a decade later was only behind the US and Russia in its production. Three companies Gulf, Shell and Exxon controlled some 98% of the Venezuelan oil market.
This was an unexpected outcome for a country that only fully achieved its independence from Spain in 1830, thanks in part to the interventions of the legendary Simón Bolívar. For the rest of the century it languished as an impoverished agricultural economy
mainly exporting coffee and cocoa, and ruled by a succession of regional military caudillos.
The key figure in Venezuela’s early oil history was Juan Vicente Gómez, who in 1908 ousted Cipriano Castro as president in a coup d’etat and retained power until his death in 1935 either as president or the power behind the scenes. His governing style was dictatorial, ruthlessly suppressing opposition, but he understood the significance of oil as transformative for both the country and his personal wealth.
‘Perilous overdependence on oil unravelled’
The tone was set by the 1922 Hydrocarbons Law based on concessions. This required foreign companies to pay state royalties and taxes but allowed them a free hand to produce and export crude oil, much of it processed along the Gulf of Mexico coast, thereby setting up an early dependence on US facilities. Gomez is credited for using the oil revenues to build some basic infrastructure and pay off the debts accrued by his predecessor, but his policies did not do much to improve the lot of the majority, for example, having little time for education and trade unions.
Gomez’s departure brought to the surface an underlying popular resentment at the perceived lack of benefit from – and to a degree, participation in – the ongoing oil bonanza (by 1940 producing 27 million tonnes per year). Possibly emboldened by the 1938 nationalisation of the petroleum industry in Mexico and the creation of Pemex and a government at home edging towards a more democratic system, the ruling regime enacted more aggressive hydrocarbon regulations. Royalties rose from no more than 11 to 16 and twothirds per cent, and concessions were limited to a further period of 40 years. A profit-sharing deal – the so called fifty-fifty rule – was enshrined in legislation by President Rómulo Betancourt, ‘the father of Venezuelan democracy,’ in his first brief period as president (1945-48) before being ousted in a military coup. The arrangement remained in place until 1976, despite initial oil industry outrage.
In fact, the post-Second World War period was astonishingly profitable for Exxon at least, through its Creole Petroleum unit. According to one account, the company’s output in Venezuela soared from about 400,000 b/d in 1945, to 660,000 b/d in 1950, to almost 1.5 million b/d in 1974 with Creole providing for as much as 40% of Exxon’s global profit.
The first omen that the golden era could not last was when Venezuela proved an active founder of OPEC in 1960 at first with Iraq, Iran, Kuwait, and Saudi Arabia. The idea was for producing nations to limit the control on production and prices exerted by the oligopoly of major oil companies.
However, the fateful year was 1976. Following the 1973 oil crisis in which oil prices rocketed in producers’ favour, Venezuela under President Carlos Andrés Pérez, transferred control of the oil industry from foreign companies to the state, in the process creating Petróleos de Venezuela, S.A. (PDVSA). It was an orderly transition for which oil companies felt poorly compensated. A telling reflection on the motive for the nationalisation move can be found in a speech by Felix
P. Rossi-Guerrero, at some point Venezuelan minister counsellor for petroleum affairs, published in Vanderbilt Law Review (1976), in which he explains the ‘disbelief then anger’ at the betrayal by the US. Venezuela had cooperated in boosting its production to help the US in times of crisis, e.g., the Second World War, Korea, Suez, etc. But when President Dwight Eisenhower introduced a quota system on oil imports to protect domestic producers in 1959, he gave preferential treatment to Canada and Mexico.
Post nationalisation of its oil production, Venezuela’s oil sector sustained production of 3 million b/d, contributing around 25% of gross domestic product, more than half the country’s revenue, and between 80 and 90% of total exports, according to data from the World Bank and the US Energy Information Administration.
This perilous over-dependence on oil unravelled when the revolutionary Hugo Chávez swept to power in 1998 on the promise of ending corruption, increased spending on social programmes, and redistributing the country’s oil wealth. His radical agenda soon invoked national protest including a general strike involving 38,000 PDVSA employees, half of whom were fired at the end of the dispute, significantly harming the efficiency of future oil production. Overseas, the close relationship with Cuba and support for regimes in countries like Iran, Iraq and Libya won the regime no friends. Oil companies, including Exxon, left in 2007 under the duress of new oppressive regulations, leaving Chevron as the only foreign company responsible for around 10% of the country’s output.
As we all know, Chávez’s ruthless successor, President Nicolás Maduro, now in US custoday, did little to salvage Venezuela’s plight and leaves a country in limbo chastened by its reliance on oil. Among other issues, the country has been subject to periodic sanctions, and a UN report estimated in March 2019 that 94% of Venezuelans live in poverty and that one quarter of the population needs some form of humanitarian assistance.
Meantime, according to OPEC data, crude exports plunged from nearly two million barrels per day in 2015 to less than 500,000 in 2021, although a partial recovery has been observed since 2023: 655,000 barrels per day in 2024 and 921,000 barrels per day in November 2025.
A bleak analysis by Rystad Energy suggests recovery of the Venezuelan oil and gas sector would require investment of some $183 billion between now and 2040 to get the country back to crude production of 3 million barrels per day by 2040,
No wonder Exxon Mobil’s Woods is wary, especially when prospects in neigbouring Guyana are proving so rewarding, and assuming he doesn’t take too seriously Venezuela’s longstanding claims to some of this territory. He will probably want to stick with: Uninvestable
In every way
And forevermore
That’s how you’ll stay.
Views expressed in Crosstalk are solely those of the author, who can be contacted at andrew@andrewmcbarnet.com.


More than 20 significant seismic surveys and reprocessing projects will be carried out after Norway awarded 57 production licences to 19 companies in the APA 2025 licensing round.
In the North Sea DNO, Petoro, Aker BP and Source Energy will reprocess 3D seismic data on Licence 1086; DNO, Aker BP and Petoro will acquire new 3D seismic data on licence 1278; Equinor and DNO will reprocess 3D seismic data on licence 1280; Equinor and Aker BP will reprocess ocean bottom seismic data on licence 1282; Aker BP and DNO will reprocess 3D seismic data on licence 1286; Equinor, Petoro, Pandion Energy and Concedo will acquire modern 3D seismic data and EM data on licence 1288; Wellesley Petroleum and DNO will acquire 3D seismic data on licence 1290; Concedo, Equinor and OMV will acquire modern 3D seismic data on licence 1292; Equinor and OKEA will acquire 3D seismic data on licence 1293; Petrolia and Equinor will acquire modern 3D seismic data on licence 1294; Wellesley and Equinor will acquire 3D seismic data on licence 1295.
In the Norwegian Sea, Aker BP, Petoro and Equinor will acquire 3D seismic data on licence 1296; Equinor, Petoro and Inpex will reprocess 3D seismic data on licence 1297; Vår Energi, Petoro, Equinor and TotalEnergies will reprocess 3D seismic data on licence 1298; Equinor and Harbour Energy will
acquire 3D seismic data on licence 1299; OMW, Petoro and Equinor will acquire 3D seismic data on licence 1302; OKEA, Petoro, and Equinor will acquire 3D seismic data on licence 1305; Aker BP will acquire 2D OBN data on licence 1308; and Equinor and Japex will carry out a feasibility study for seismic reprocessing on licence 1310.
In the Barents Sea Equinor and Vår Energi will acquire 3D seismic on licence 1311; and Vår Energi and Equinor will acquire and reprocess 3D seismic data on licence 1312.
Of the 57 production licences offered, 31 are located in the North Sea, 21 in the Norwegian sea, and five in the Barents Sea. In total, 19 oil companies were offered parts in one or more of these licenses. 13 companies were offered one or more operatorships.
Equinor has won operatorships or shares in 35 production licences, 21 in the North Sea, 10 in the Norwegian Sea, and four in the Barents Sea. The company will operate 17 of the licences.
Jez Averty, Equinor’s senior vice president for subsurface, said: ‘Our geological knowledge is high, and we are constantly learning more through further exploration. Awards in lesser-known areas, such as we have received in the northeastern part of the North Sea and in the southwestern Møre Basin, provide new and exciting opportunities.’
The awards will aid Equinor’s effort to to develop 6-8 new subsea developments each year until 2035. ‘This is a significant increase from the current level. Access to new acreage is crucial for our ambition to maintain a high level of production and predictable energy deliveries to Europe from the NCS towards 2035,’ Averty added.
Vår Energi has won 14 production licences, six as operator. The company has been offered four licences in the North Sea, six licences in the Norwegian Sea and four licences in the Barents Sea.
Aker BP won ownership interests in 22 exploration licences, 12 as operator. The company has won licences in the North Sea, Norwegian Sea and Barents Sea. The associated work programmes include two exploration wells and extensive seismic data acquisition.
DNO has won 17 exploration licenses, four as operator. Of the 17 licences, 15 are in the North Sea and two in the Norwegian Sea.
OKEA has been offered interests in three production licences, one as operator. PL 1305 was awarded with OKEA as operator and is located on the Nordland Ridge north of the Draugen field and Mistral Discovery on the Halten Terrace in the Norwegian Sea. PL 1255 B and PL 1293 have been awarded to OKEA as partner and are located close to the Aurora Discovery in the Gjøa field in the North Sea.
Viridien has signed an agreement with Malta to invest in an integrated multi-client dataset for the country’s offshore area. By revitalising existing seismic and well data, the project will advance understanding of Malta’s offshore petroleum potential in the Central Mediterranean, said Viridien.
Viridien’s newly integrated dataset will provide a much clearer view of the petroleum systems and prospectivity of Malta’s offshore acreage, supporting future licensing activity and more informed investment decisions.
Dechun Lin, head of earth data, Viridien: ‘This agreement underscores our strategy of investing in high-impact, partnered projects that drive new exploration and future energy supply. Malta’s favourable geology and strategic location offer an exciting opportunity for E&P companies looking to capture emerging oil and gas potential in the Mediterranean.’
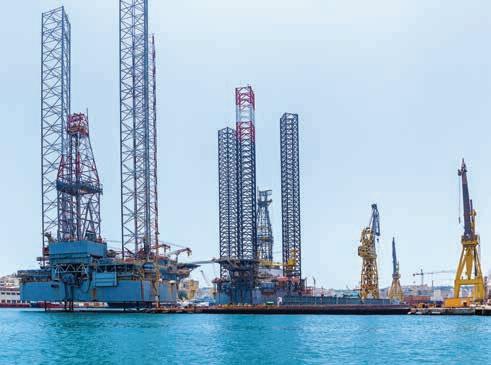

Equinor has reported that using artificial intelligence (AI) saved the company $130 million in 2025. Machine learning is revolutionising the company’s geoscience operations. ‘With AI, we can analyse seismic data
processes generate vast amounts of data, and we can use AI to produce knowledge from this data. This has already been transformative and profitable, even though we are still early in the AI revolution.’
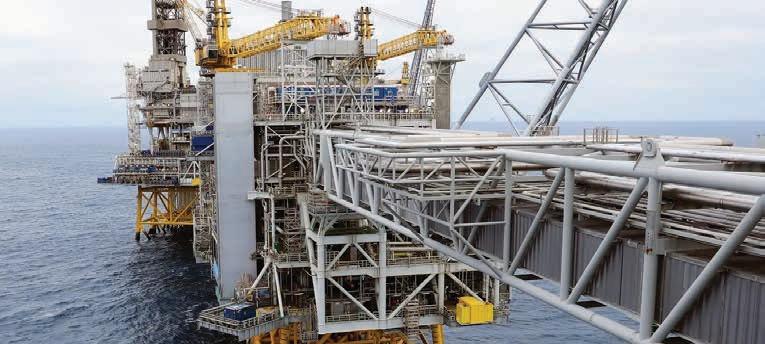
ten times faster, plan wells and field development in new and better ways and operate our facilities more efficiently,’ said Hege Skryseth, executive vice president for technology, digital, and innovation at Equinor. ‘Industrial
AI has also given Equinor a tenfold increase in interpretation capacity. ‘With AI more data can be interpreted, covering more square kilometres and enhancing the overall understanding of an area and of the Norwegian Continental Shelf,’
Skryseth added. In 2025, 2 million km2 were interpreted using the AI tool.
Equinor said it is using AI to maintain production on the Norwegian Continental Shelf at 2020 levels through to 2035, which means around 1.2 million barrels of oil equivalents per day.
‘We use AI to interpret more seismic data, plan and drill more wells,’ said Skryseth.
Overall, Equinor has identified more than 100 new use cases for AI. It is already being used to monitor equipment across all upstream operations. ‘It improves safety, provides more stable operations, and reduces the risk of sudden shutdowns that can lead to flaring and increased CO2 emissions,’ said the company. Such monitoring has saved $120 million since 2020.
AI-driven planning of wells and field development generates thousands of alternatives, allowing the experts to focus on the best proposals. In the Johan Sverdrup phase 3, AI found a solution that no one had considered, saving the partnership $12 million.
Since 2020 the company has estimated savings of $330 million using artificial intelligence in industrial processes.
TGS has launched two multi-client seismic projects offshore Indonesia and Malaysia as well as a mega survey off the coast of Mauritania and reprocessing projects in Liberia and Sierra Leone.
In South East Asia, the Natuna 2D-cubed and Sarawak 2D-cubed surveys provide a basin-scale dataset that spans more than 327,000 km² across the Greater Natuna and Sarawak basins.
Natuna 2D-cubed brings decades of seismic data together to create a comprehensive subsurface view of the Greater Natuna Basin. The project applies TGS’ structurally conformable interpolation technology, 2D-cubed, to transform nearly 150,000-line km of 2D seismic data and 2400 km² of 3D coverage into a regional-scale 3D volume covering over 160,000 km².
Sarawak 2D-cubed spans the entire offshore Sarawak Basin, delivering more than 167,000 km² of seismic coverage across multiple proven hydrocarbon provinces.
‘The Natuna 2D-cubed and Sarawak 2D-cubed datasets establish TGS’ largest multi-client 2D-cubed presence in Southeast Asia to date,’ said TGS. ‘This extensive coverage supports the broader vision of a continuous seismic corridor across this hydrocarbon prolific region, linking the Malay, Penyu, Natuna, Sarawak, and Sabah basins.’
Meanwhile, TGS has launched a large-scale multi-client 3D seismic project designed to support exploration across offshore Mauritania and the wider West African Atlantic Margin.
The Mauritania MegaSurvey comprises more than 100,000 contiguous km2 of seismic data to generate one seamless volume across the offshore of Mauritania, allowing regional interpretation of the full source to sink from nearshore to ultradeep.
Finally, TGS has started reprocessing the Liberia Sunfish 3D (Vision) seismic survey in the Harper Basin, offshore Liberia.
The survey covers approx. 6100 km2 and was originally acquired by TGS in 2013. It will deliver a full 3D Kirchhoff Pre-Stack Depth Migration from field
tapes, applying modern imaging workflows to enhance data quality and subsurface understanding. Final products are scheduled for release in the third quarter of 2026.
The reprocessed dataset is designed to deliver clearer imaging of Upper Cretaceous plays, with a strong focus on preserving the fidelity of AVO response throughout the data. This enables exploration teams to apply advanced reservoir characterisation workflows with greater confidence.
Upon completion, TGS will have reprocessed all available 2D and 3D seismic data offshore Liberia, comprising of more than 50,000 km of 2D seismic and more than 31,000 km2 of 3D seismic through advanced modern pre-stack depth migration workflows.
Also in West Africa, TGS has also completed the Sierra Leone Fusion 3D (Vision) multi-client reprocessing project.
The project consists of a full reprocessing from field tapes of a 7476 km2 area through a comprehensive Pre-Stack Depth Migration sequence, utilising advanced ML-based denoise and deghosting, adaptive demultiple and advanced depth imaging workflows, including DM-FWI to deliver clearer imaging of Upper Cretaceous plays.
The project merges multiple surveys, acquired by TGS between 2008 and 2014, preserving the fidelity of AVO throughout the data, allowing companies to perform advanced reservoir characterisation workflows and assess AVO-plays with increased confidence, said TGS.
‘Sierra Leone sits within a proven yet underexplored segment of the West African Atlantic Margin, where access to consistent, high-quality seismic data is critical for informed exploration decisions,’ said David Hajovsky, executive vice president, multi-client at TGS. ‘The Fusion 3D project strengthens the regional subsurface framework, enabling companies to place individual prospects into a broader geological context and evaluate opportunity with greater confidence as interest in the basin continues to build.’
TGS has announced that a supermajor has entered into a multi-year enterprise agreement for the licensing of TGS’ Imaging AnyWare seismic imaging software suite. Under the terms of the agreement, the supermajor will deploy the Imaging AnyWare software across its global exploration and production operations. This agreement also establishes collaborative R&D opportunities between the two companies.
The US Bureau of Land Management has leased 31 parcels totalling 20,399 acres in New Mexico and Oklahoma for $326,811,240 during a quarterly oil and gas lease sale. This sale brought in over $218,751 for a single acre, the highest ever earned during a BLM competitive oil and gas lease sale since at least the 1987 Leasing Reform Act. The sale is also the second highest for total bonus bids received at over $316 million and third highest for bid on a single parcel at over $70 million.
The Albanese government in Northern Australia has opened five areas areas for offshore gas exploration in the Otway Basin. Applications for exploration permits will close on 30 June 2026. The Albanese government has also published revised offshore guidelines for retention leases and work-bid programs, following an open consultation process.
Viridien is expected to report fourth quarter 2025 segment revenue of more than $1.15 billion, including more than $440 million in Geoscience (+10% year-onyear) and more than $400 million in earth data. Solid cash flow generation above $130 million is being allocated to debt repayment, which stood at around £750 million at year end.
The Philipiines has discovered a big natural gas field at the Malampaya East 1 (MAE-1) reservoir, the first in over a decade. The discovery is about 5 km east of the existing Malampaya field and is estimated to contain around 98 billion cubic feet of gas in place.
Shearwater Geoservices has launched a multi-client 3D seismic survey off-

shore Nigeria which is backed by significant industry funding and will be
executed in partnership with Harvex Geosolutions and the Nigerian Upstream Petroleum Regulatory Commission (NUPRC).
The two-month project, carried out by Shearwater’s vessel SW Duchess, will provide high-resolution subsurface data across the Western Niger Delta Basin, supporting exploration decisions and future licensing rounds in one of West Africa’s most prospective oil and gas regions.
Irene Waage Basili, CEO of Shearwater, said: ‘By investing in high-quality seismic data, where we can both cap-
ture rapid returns and create longer-term value, we are enabling smarter decisions and helping to shape the future of energy security in West Africa and beyond.’
Meanwhile, Shearwater has won a contract for a large 3D seismic survey offshore Trinidad and Tobago for ExxonMobil. The deepwater survey covering 6000 km2 of full-fold area, will start in the first quarter of 2026 and is expected to take around five months. Shearwater’s vessel Amazon Warrior will utilise its multi-component Isometrix streamer technology.
The UK North Sea Transition Authority (NSTA) has opened a carbon storage licensing round offering 14 locations in Scottish and English waters for exploration and appraisal.
The areas fall into two broad categories – depleted hydrocarbon fields selected by the NSTA and saline aquifer sites identified following a ‘Call for Nominations’.
Five areas will be in Scottish waters, with nine off the coast of England. Successful applicants for a carbon storage licence from the NSTA will require a seabed agreement from either Crown Estate Scotland or The Crown Estate in English waters, before a project can progress.
Gus Jaspert, managing director, marine at The Crown Estate, said: ‘We have worked with the NSTA to ensure the interests of other vital sectors including offshore wind, aggregates, cables and nature were considered.’
The UK’s first carbon storage licensing round in September 2023 awarded 21 carbon storage licences. The NSTA subsequently awarded the first storage permits to two projects – Endurance and HyNet – allowing them to proceed towards first injection.
The Endurance site, off the coast of Teesside, which could store up to 100 million tonnes of CO2, received a permit in December 2024, and Liverpool Bay-based HyNet, which could also store up to 100 mt CO2 over 25 years, received three permits in April 2025.
The projects, funded from the UK’s government’s commitment of up £21.7 billion, could contribute around £5 billion per year of gross value to the UK economy by 2050 and create 50,000 jobs long-term.
The licensing round will run until Tuesday 24 March 2026 after which applications will be reviewed with a view to awarding licences in early 2027.
DUG has deployed 82 NVIDIA H200 machines, integrating advanced AI and compute-hardware technologies into the company’s high-performance computing (HPC) ecosystem. The expansion adds 41 petaflops to DUG’s global supercomputing network and will support growing client demand and future innovation.
Each machine delivers an order-of-magnitude performance uplift relative to DUG’s fastest CPU-only hardware, further reducing the company’s turnaround times across both testing and production.
Each machine is configured with: 8 × NVIDIA H200 GPUs (141 GB each); Dual AMD EPYC Turin CPUs; 4 TB of system memory and 32 TB of local flash; and 100 Gbps networking.
‘This upgrade significantly increases our total compute power. This translates to even faster delivery of huge datasets and more computationally intensive workloads, from AI-inference applications, to advanced seismic processing and imaging workflows, including our revolutionary DUG Elastic MP-FWI imaging technology,’ said Harry McHugh, DUG’s chief information officer.
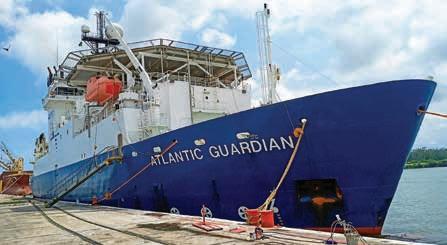
EMGS said it needs additional funding ‘within the near term’ to remain as a going concern and is ‘evaluating several alternatives’, including restructuring options.
The company has interest-bearing debt of $19.5 million outstanding and
‘based on current activity levels and the company’s outlook, the existing capital structure is ‘not considered sustainable.’
The company which specialises in electromagnetic (EM) and controlled source electromagnetic (CMEM) seismic data acquisition is evaluating a partial or complete conversion of its convertible bonds into new equity in the company.
‘Should EMGS elect to pursue a full conversion of the EMGS03 Bonds, there can be no assurance that the company will be able to obtain the requisite consent from a sufficient majority of bondholders to pass the bondholders’ resolution required to effect such conversion,’ said EMGS in a statement. ‘Furthermore, even if a
Viridien has announced a basinscale reimaging program within the hydrocarbon-prolific Balingian-Luconia-Baram basins, in collaboration with Petronas.
The company will reimage 44,000 km2 of legacy 3D seismic data, commencing in January 2026 with a basin-wide post-stack merge to deliver early data and key insights for further high-end reimaging. Prefunding is now open, allowing early participants to access
initial results and benefit from enhanced imaging beneath complex carbonate sequences as well as resolve long-standing velocity and attenuation challenges to unlock underexplored plays.
Dechun Lin, head of earth data, Viridien, said: ‘Supported by Viridien’s extensive regional imaging experience and geological insights from our proprietary GeoVerse database, the project will deliver a clearer subsurface picture.’
ADVERTISEMENT
conversion is successfully completed, there can be no assurance that this alone will be sufficient to establish a financially sustainable long-term solution for the company.’
EMGS redelivered the vessel Atlantic Guardian to her owners at the expiry of the charter period on 20 October 2025. Utilisation for the fourth quarter was 0% compared with 31% for the fourth quarter 2024. The company expects to recognise $3.5 million in multi-client prefunding revenue in the fourth quarter of 2025. Prefunding revenue in Q4 includes fully prefunded surveys acquired in the third quarter of 2025, for which final data delivery was made in the fourth quarter of 2025.
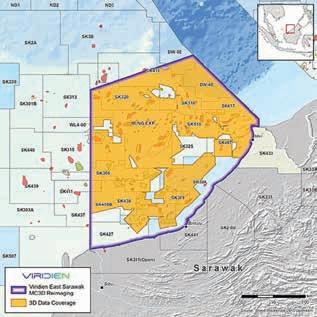

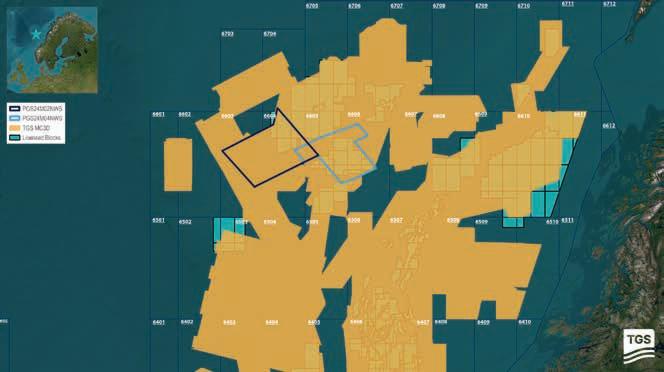
TGS has completed the PGS24M02NWS and PGS24M04NWS 3D seismic surveys in the Vøring Basin on the mid-Norwegian continental margin in the Norwegian Sea.
The surveys build on existing GeoStreamer coverage in the Vøring area. Acquisition was carried out using widetow triple sources to improve near-offset illumination, deep-tow multi-sensor GeoStreamer technology to enhance signal-to-noise ratio, and extended stream-
ers optimised for full waveform inversion. Broadband processing workflows, including machine learning-based noise attenuation, were applied to support improved imaging of deeper intrusive bodies and complex stratigraphy.
The Vøring Basin has seen limited exploration drilling over the past two decades. Discoveries to date, including Obelix, Irpa, Balderbrå and Haydn/Monn have primarily encountered gas in Paleocene
and Upper Cretaceous reservoirs, while the Aasta Hansteen field remains the only developed discovery in the area. Attempts to prove Lower Cretaceous and Jurassic targets have so far been unsuccessful, underscoring the technical challenges associated with imaging beneath volcanic and intrusive sequences, said TGS.
A major Paleocene to Early Eocene magmatic episode introduced widespread intrusions and hydrothermal vent complexes that have influenced reservoir architecture, maturation and fluid migration across the basin, the company added.
Meanwhile, TGS expects multi-client investment of around $120 million in Q4 2025, compared to $100.4 million in Q4 2024. Kristian Johansen, CEO of TGS said: ‘Our seismic vessel utilisation reached 79% in Q4, up from 73% in the previous quarter. Early in Q4 we deployed our third Ramform Titan-class vessel for multi-client work offshore Brazil, and we expect to maintain half of our streamer fleet in the region well into 2026. Interest-bearing debt has been reduced to $430 million.’
Equinor has won a preliminary injunction to allow construction to continue on the Empire Wind project offshore New York State.
The company filed a civil suit in the US District Court for the District of Columbia challenging the US Department of the Interior’s suspension of the Empire wind project offshore New York State. Empire is seeking a preliminary injunction to continue construction while the litigation proceeds.
Equinor said in a statement: ‘While Empire continues to work closely with the Bureau of Ocean Energy Management (BOEM) and the other relevant authorities to find a prompt resolution to the matter, the order is in Equinor’s view unlawful and threatens the pro-
gress of ongoing work with significant implications for the project. The preliminary injunction filing is necessary to allow the project to continue as planned during this critical period of execution and avoid additional commercial and financing impacts that are likely to occur should the order remain effective.’
In December President Trump announced that the US is pausing five offshore wind projects off the Atlantic Coast because of security concerns that they would interfere with radar signals. At that point Empire Wind was more than 60% complete and Equinor has invested over $4 billion.
‘Empire has coordinated closely with numerous federal officials on national security reviews since it exe-
cuted its lease for the project in 2017, including with the Department of War, and has complied with relevant national security-related requirements identified as part of the regulatory process,’ said Equinor. ‘In addition, Empire meets regularly with officials charged with oversight of security issues for the project, including weekly meetings with the US Coast Guard and other marine first responders.’
Empire Wind is being developed under contract with the New York State Energy Research and Development Authority (NYSERDA) to deliver electricity for New York. Once completed, the project is expected to provide enough power to electrify approximately 500,000 homes.

Meg O’Neill has been appointed as bp’s chief executive officer to replace Murray Auchincloss who stepped down on 18 December. Carol Howle, executive vice president, supply, trading and shipping is to serve as interim CEO until O’Neill joins as CEO on 1 April.
O’Neill currently serves as CEO of Woodside Energy. Since her appointment as CEO in 2021. ‘She has grown
Woodside Energy into the largest energy company listed on the Australian Securities Exchange,’ said bp in a statement. ‘She oversaw the transformative acquisition of BHP Petroleum International, creating a geographically diverse business with a portfolio of high-quality oil and gas assets.’
Before joining Woodside Energy in 2018, Meg spent 23 years at ExxonMobil in technical, operational and leadership positions around the world.
Albert Manifold, chair of bp, said: ‘Her proven track record of driving transformation, growth, and disciplined capital allocation makes her the right leader for bp. Her relentless focus on business improvement and financial discipline gives us high confidence in her ability to shape this great company for its next phase of growth and pursue significant strategic and financial opportunities.’
O’Neill said: ‘With an extraordinary portfolio of assets, bp has significant potential to re-establish market leadership and grow shareholder value. I look forward to working with the bp leadership team and colleagues worldwide to accelerate performance, advance safety, drive innovation and sustainability and do our part to meet the world’s energy needs.’
Viridien has completed the BM-S-2 seismic reimaging project in the southern Santos Basin, delivering a modern, 3D dataset across 8468 km2 in one of the most strategic, emerging offshore regions of Brazil.
The project uses time-lag full waveform inversion (TL-FWI), to provide clearer definition of post-salt stratigraphy, improved visibility of potential direct hydrocarbon indicators (DHIs), and new insights into underexplored pre-salt plays.
The reimaged BM-S-2 survey seamlessly integrates with Viridien’s broader Constellation Extension survey, creating
unified regional coverage that supports both play-scale screening and detailed prospect assessment across South Santos, said Viridien.
Dechun Lin, head of earth data at Viridien, said: ‘The BM-S-2 reimaging project represents a timely investment by Viridien in a rapidly evolving exploration corridor. By transforming a large vintage dataset with our state-of-the-art imaging technologies, we are providing the industry with the clarity needed to evaluate new opportunities with confidence and to derisk early-stage exploration and licensing decisions.’
OMV and Austria Wirtschaftsservice have signed a funding agreement of up to $147 million for one of Europe’s largest green hydrogen plants in Bruck an der Leitha (Lower Austria). The 140 MW project will have an annual capacity of 23,000 tonnes of green hydrogen from the end of 2027. The plant will save 150,000 tons of carbon emissions a year from the Schwechat refinery.
Norway has allocated two projects for floating offshore wind in Utsira Nord to a consortium of Equinor and Vårgrønn; and Harald Hårfagre AS. The companies may now apply for licences and may also be entitled to state aid. Maximum level of support is $3.5 billion.
TGS has deployed its first proprietary offshore wind and metocean measurement project in Australia. The one-year deployment in the Gippsland region of Victoria will record wind, wave, current and environmental parameters in water depths of about 60 m. The dataset will inform turbine selection, layout optimisation, foundation design, environmental assessments and grid connection planning. Data will be gathered using an EOLOS floating LiDAR buoy equipped with integrated ocean and environmental sensors. Measurements will be delivered daily through Wind AXIOM, the TGS site evaluation and analytics platform.
Fugro has extended its agreement with PTSC to provided geophysical, geotechnical and metocean data services in Vietnam. Fugro will provide marine site characterisation services to support Vietnam’s the growing offshore wind sector as well as the oil and gas sector. Vietnam has set ambitious offshore wind targets of approximately 6 GW of offshore wind energy by 2030, and 70 to 91.5 GW by 2050.
The UK has secured a record 8.4GW of offshore wind capacity in its latest auction for new clean power projects (Allocation Round 7). A record eight offshore wind farm projects surpass the previous record of six in the 2019 auction.
TGS has launched the APEX 1 a multi-client long-offset ocean bottom node (OBN) acquisition campaign in the Gulf of America.
The first-of-its-kind survey sets a benchmark for large-scale long offset multi-client seismic by deploying a denser node grid than previous ultra-long offset OBN programs and by being designed as a standalone exploration dataset, without reliance on underlying streamer seismic coverage.
APEX 1 is enabled by TGS’ Gemini enhanced frequency source and leverages the TGS’ expertise in long-offset OBN acquisition, processing, and Dynamic Matching FWI (DM-FWI), said the company. The combination of dense node spacing, ultralong offsets, and advanced imaging workflows is designed to deliver a step-change in subsurface resolution, velocity accuracy, and geological confidence for exploration and appraisal.
Node deployment for APEX 1 commenced in December 2025, and acquisition is expected to be completed in late Q2
2026. Early products are expected in Q3 2026 and final data delivery Q4 2027.
Meanwhile, TGS is opening an Imaging Centre in Kuala Lumpur to support its multi-client projects throughout the Asia-Pacific region.
‘The Kuala Lumpur Imaging Centre builds on the successful launch of TGS’ Advanced Capabilities Centres for Petrobras in Brazil, where the company has demonstrated how local geoscientists, supported by global experts, can accelerate project delivery and improve customer outcomes in complex offshore environments,’ said TGS.
During its first year of operation, the Kuala Lumpur Imaging Centre will be supported by TGS’ established imaging teams. The centre will leverage cloud-based infrastructure hosted in Malaysia to support efficient, secure, and compliant data processing workflows.
TDI Brooks International has started a geochemical survey for United Oil and Gas offshore on the Walton Morant Licence offshore Jamaica.
The vessel R/V Gyre is carrying out the multibeam echo sounder (MBES) survey, which will be followed by heat flow measurements and seabed piston coring operations.
The survey is designed to confirm the presence of thermogenic hydrocarbons. Certain seabed features such as shallow depressions or pockmarks, some of which can extend to several hundred metres in
diameter, can often be associated with hydrocarbons venting at the seafloor. These surface features may be linked to subsurface seismic features indicative of fluid migration, including vertical migration pathways (or fluid escape chimneys) and shallow amplitude anomalies which can be seen directly beneath the surface pockmarks, together with nearby seismic responses that may represent direct hydrocarbon indicators (DHIs) in the form of bright soft amplitude responses.
By targeting such features, the piston coring programme is intended to test for
the presence of a thermogenic hydrocarbon signature in recovered seabed sediment. A positive result would provide direct evidence of an active petroleum system and materially derisk the prospectivity of the Walton Morant Licence.
Brian Larkin, CEO of United Oil & Gas, said: ‘The results will play a central role in de-risking the licence and informing future strategic decisions as we continue to unlock the potential value of over 7.1 billion barrels of unrisked prospective resources in this highly prospective offshore area.
Exploration in Norway in 2025 was the second highest for 10 years, said the Norwegian Offshore Directorate
‘Last year was surpassed only by 2021. Many discoveries were made. Several discoveries are the result of applying advanced new technology,’ said the NOD in a statement. ‘Among other things, more than ten kilometres of wellbores have been drilled.’
Oil production of 106 million standard cubic metres is the highest since 2009. Production from the NCS is nearly equally distributed between oil and gas. A total of 120 billion standard cubic metres was sold, which represents a minor reduction from the record-breaking year of 2024.
‘We expect gas production to remain at this level over the next three to four years. Norwegian gas accounts for about 30% of EU gas consumption, and Norway is Europe’s largest supplier after cutting off Russian gas,’ Stordal said.
In 2026, the Norwegian Offshore Directorate expects investments of NOK 256 billion ($25 billion), a reduction of 6.5% from last year. ‘Leading up to 2030, we expect the investment level to decline gradually due to the completion of development projects without equivalent new projects to replace them. Toward the end of the 2020s, the Directorate expects a reduction in overall production.
Daniel Baltar Pardo1*
Abstract
In controlled-source electromagnetic (CSEM) interpretation and model building, generating accurate resistivity models of the Earth is essential. When hydrocarbons are present, this process requires developing reservoir resistivity models, which typically involve linking expected hydrocarbon saturation to reservoir resistivity at the field scale. In predrill scenarios — where no well logs or core data are available — field-scale resistivity expectations must be derived through modelling. However, these models often rely on simplifying assumptions, such as constant reservoir properties combined with well-established resistivity-saturation relationships. While these relationships are valid at the core or log scale (cm to m), their applicability at the field scale (m to km) is questionable.
This paper examines the impact of these simplifying assumptions and modelling techniques, with a focus on the consequences of neglecting hydrocarbon saturation variability. We explore the relationship between sediment resistivity and water saturation across scales, from core and log to field scale. Our findings highlight the significant role of saturation variability, driven primarily by pressure build up with height and reservoir property variations. To address these challenges, we propose a workflow that accounts for the main sources of variability, enabling the upscaling of core-scale relationships to the field scale. We illustrate our proposed methodology using an example from the North Sea.
The ability of a Controlled Source Electro Magnetic (CSEM) survey to detect a buried resistive body, such as a hydrocarbon field, is determined by a variety of parameters such as burial depth, resistivity of the surrounding sediment, water depth, equipment power, measurement accuracies, and the body’s area, thickness and resistivity, (Constable, 2010). Out of all these inputs one of the most difficult to understand and evaluate is the resistivity of the reservoir.
The typical application of resistivity in reservoir evaluation consists of using well log resistivity measurements to estimate hydrocarbon saturation. This is done through the application of resistivity-saturation relationships, ideally derived from cores, such as Archie’s relationship, (Archie, 1942). The difference in scale between the core and the log resolution can be neglected under certain conditions, though not always.
In contrast, in exploration scenarios ahead of drilling there are no well logs and reservoir properties are uncertain. This leads to the reservoir resistivity expectation to be estimated through the same saturation-resistivity relationship, using average constant properties as input (MacGregor and Tomlinson, 2014). Some of these average reservoir properties, such as average porosity and saturation, are often available from the prospect’s pre-drill evaluation, other parameters are estimated based on analog information. The underlying assumption is that the average properties
1 EMGS ASA
* Corresponding author, E-mail: dbaltar@emgs.com DOI: 10.3997/1365-2397.fb2026009
at the field scale, combined with a core-scale relationship, will provide a meaningful average resistivity for the whole field. The non-linearity of the core-scale relationship makes it unlikely this will be the case (Savage and Markowitz, 2009). At the field scale there is significant property variability, particularly that of the hydrocarbon saturation.
Throughout this paper it is assumed that Archie’s saturation-resistivity relationship in equation 1, (Archie, 1942), is correct for small and homogeneous rock samples. The same conclusions apply for other saturation-resistivity relationships that do not try to compensate for laminations or internal reservoir variability. (1)
Rt is the saturated rock resistivity, Rw is the resistivity of the brine, Φ is the porosity, Sw is the fraction of the pore space saturated with water, and the rest (a, m, and n) are parameters that depend on the pore geometry. Hydrocarbon saturation (Shc) is defined as one minus water saturation. In this paper we are trying to understand the relationship between Shc and Rt at different scales; when Shc and Rt are used alone they refer to small scale where properties can be considered constant, while average Shc or average Rt are used in cases where property variability is significant.
A simple case serves to illustrate the limitations of applying non-linear relationships to larger scales. Let’s start by evaluating the average reservoir resistivity for a reservoir with 25% porosity, Rw = 0.05 Ωm, and an average hydrocarbon saturation (Shc) of 60%. Assuming the reservoir’s Archie parameters are m = n = 2, the reservoir resistivity can be calculated. To make matters more interesting several equivalent cases are considered. These cases will only differ in having different Shc variability, though the average Shc will be the same. The first case will be constant saturation (Shc = 60%), while the other two will have two saturation values equally weighted: the second case will have a combination of 80% and 40% Shc, and the third will be made of a combination of 90% and 30% Shc
The core-scale Archie relationship for this reservoir is shown in Figure 1 and applies to all the constant-Shc-lithologies in the example. The results in Table 1 demonstrate that hydrocarbon saturation variability has a significant impact on the expected resistivity for a given average Shc. In this example the average resistivity in Case 3 is almost an order of magnitude larger than that of Case 1. Due to the curvature of the saturation-resistivity relationship in Figure 1 the presence of variability will always increase the expected average resistivity with respect to the constant Shc case. Since saturation variability at large scales is usually significant this factor cannot be ignored when calculating representative resistivities at scales larger than that of cores and logs.
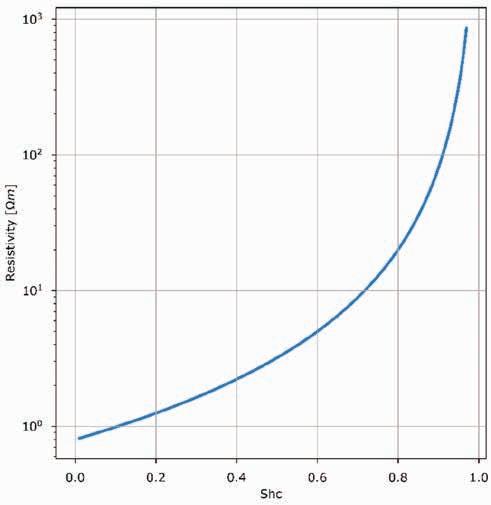
To assess the impact of saturation variability in the average resistivity, Monte Carlo simulations are used. To simplify the calculation, it will be assumed that when sampled at the core scale the hydrocarbon saturation of a field follows a normal distribution and that for each of those samples Archie’s relationship is the correct resistivity-saturation relationship. Thus, hydrocarbon saturation populations will be generated following a normal distribution with known average saturation and standard deviation. This population will be truncated on the low end and upper end to keep only Shc values in the interval [0, 0.985). The resistivity of each point in the resulting saturation population is calculated using Archie; thus, we will be able to calculate the population’s resistivity distribution and its average resistivity. This is done for a wide range of average saturations combined with several standard deviation (STD) values of the underlying probability distribution. To get smooth and stable results a population size of 500,000 points for each combination of average Shc and STD values was used. The results of this modelling in Figure 2 show that reservoir saturation variability increases the expected average resistivity for any given average saturation. The impact of the STD depends on the average Shc. Note that large STD values combined with truncation make it impossible to model populations with average Shc values close to the extremes, i.e. 0 or 1. This could be dealt with by applying methods beyond the scope of this paper.
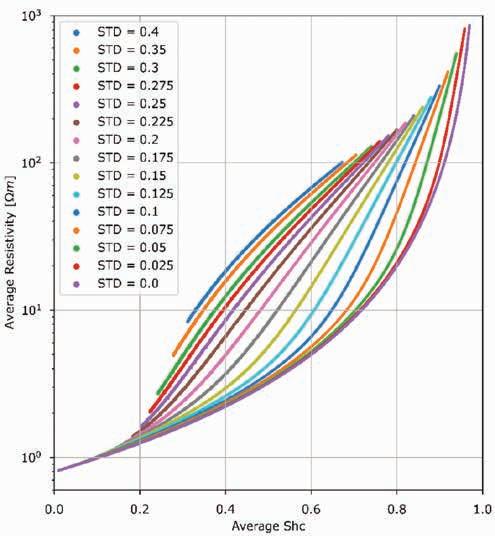
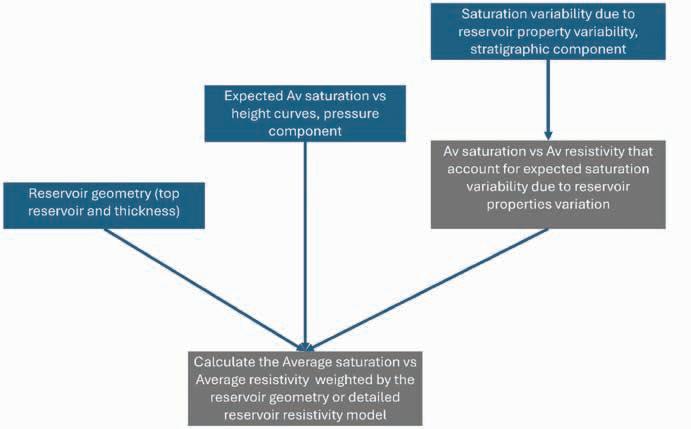
There is an intimate link between measurement variability and measurement scale; given the high sensitivity of resistivity to saturation variation we must have an elementary volume where saturation and all other reservoir properties are constant. Thus, when standard deviation is mentioned, it is assumed to be the standard deviation of the saturation population of whole field measured in core-sized samples (2.5 cm radius x 2.5 cm length). The exact shape of the distribution depends on factors such as reservoir and structural geometry, depositional environment, or property cut-offs applied to the distribution. The workflow presented here is independent of the distribution shape, though proper upscaling requires a good approximation thereof.
There are two main sources of Shc variability in real hydrocarbon accumulations, these are: the range of differential pressures due to the height above free water level at the different points of the accumulation and the reservoir quality variability. For simplicity we will refer to these sources of hydrocarbon saturation variability as pressure and stratigraphic components, respectively. As a first approximation it is assumed that the stratigraphic STD component is independent of pressure except for the required dependency introduced by the saturation cut-offs at the extremes of the distribution.
A natural way to incorporate the pressure component is to use an average Shc vs height curve. This average saturation for each height can be converted to average resistivity using a relationship corresponding to the expected stratigraphic variability. This means using a relationship such as those shown in Figure 2 to convert the average saturation to resistivity at each depth. Using these two components, either the average resistivity of the whole reservoir or a 3D resistivity model with the expected average resistivity for each depth can be generated. The advantage of the former is that it can be generated for many different hydrocarbon water contact depths, resulting in a field-scale average saturation vs resistivity relationship, which is useful to evaluate CSEM sensitivity in exploration scenarios. The latter can be generated for a reduced suite of contact depth values where more accurate models are required for imaging testing or where a reservoir model exists. Field-scale average
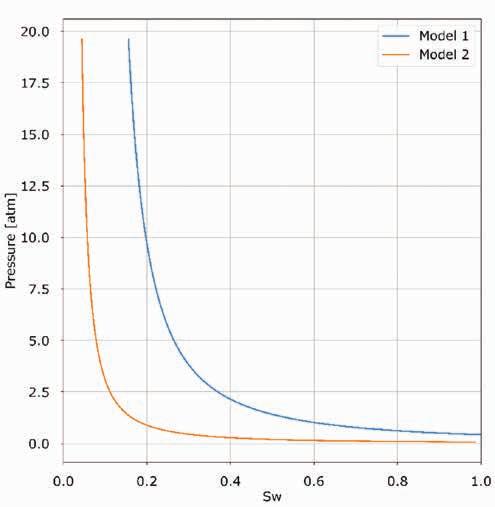
resistivity calculations are the focus of the rest of the paper. The general workflow followed is shown in Figure 3, with inputs in blue and calculated outputs in grey. The reservoir geometry is a key input on the evaluation of the field-scale average resistivity.
Using a structure that simulates a fan on a slope we can calculate the average saturation for a range of column heights / hydrocarbon-water contact depths and see the difference each component makes on the average reservoir resistivity. The top of the reservoir is shown in Figure 6, the reservoir is assumed to be a constant 50 m net thickness. Two different average saturation curves will be modelled: Model 1 represents a poor reservoir quality with slow saturation build up and Model 2 will act as a better reservoir with more efficient saturation build up, see Figure 4. The reservoir fluid will be assumed to be oil and have a 0.4 g/cc density contrast with the formation water, thus pressure can be converted to column height, see Figure 5. Using the reservoir geometry and these two saturation vs pressure/height
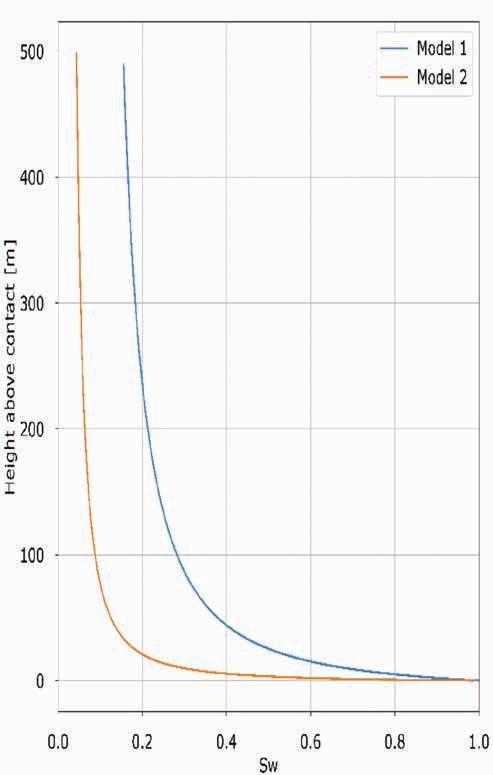
Figure 5 Average Sw vs Height for each model, the hydrocarbon to brine density contrast used was 0.4 g/cc. No stratigraphic variability was considered for the saturation to resistivity calculation. Note that the reference in the vertical axis is the contact and not the free water level.
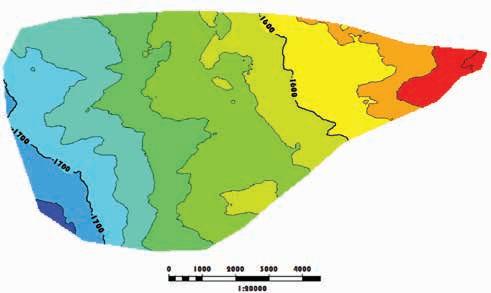
6 Top reservoir depth simulating a fan that is used for the calculations in this paper.
functions we can investigate the impacts of the pressure and the stratigraphic components.
To investigate just the pressure component, the average saturation vs average resistivity can be calculated using zero stratigraphic variation. To do this the average values of saturation and resistivity are calculated every metre for a range of hydrocarbon water contact positions from 1533 m to 1733 m depth. The resulting average saturation vs resistivity values are displayed in Figure 7. This shows how the better reservoir in Model 2 achieves
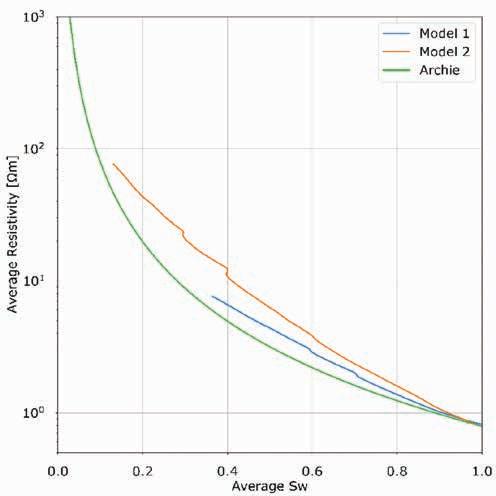
7 The average saturation to resistivity relationship using only the pressure variability component only. Archie is shown as a reference. Better reservoirs lead to higher saturations and higher variability than poorer reservoirs.
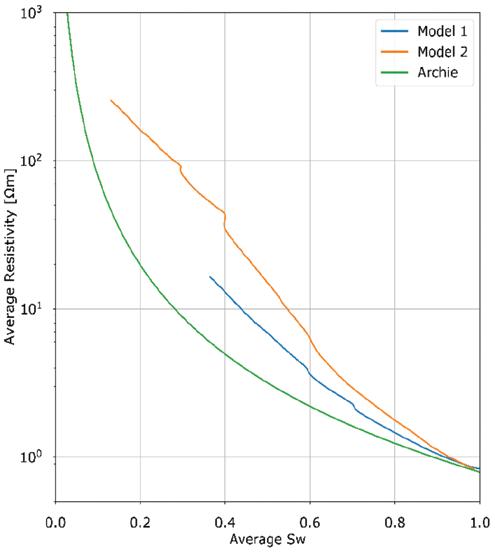
8 Average saturation vs resistivity combining pressure variability and STD = 0.1 stratigraphic variability for the whole reservoir.
higher average hydrocarbon saturations and strays further from the core-scale Archie relationship as it has larger saturation variability than Model 1. The non-smooth features in the average Sw to resistivity curves are due to the reservoir geometry.
The impact of stratigraphic variability can be added to the previous chart; as an example, the same model will be modified by adding a STD = 0.1 to the average saturation to average resistivity relationship. This variability is considered reasonable for a laminated reservoir. As a reference, for a pressure level with average Shc = 0.5 it would imply that 95% of the Shc values lie between 0.3 and 0.7. The addition of the stratigraphic component
further increases the separation between the Archie reference curve and the expected average resistivity for each average saturation value, Figure 8. The largest differences between the Archie reference curve and the calculated average resistivity curves happen in the 0.2 to 0.6 Sw range, where Archie’s resistivity estimation is between 4 and 10 times lower than when saturation variability is fully accounted for. This happens to overlap with commonly expected average Shc in exploration evaluations. i.e., Shc between 0.4 and 0.8, hence the relevance of following a workflow that accounts for saturation variability in such environments.
Ignoring variability will lead to an underestimation of the resistivity corresponding to a hydrocarbon saturation value; the consequences of this are many. In a sensitivity assessment for exploration scenario, where the ability of CSEM to detect a potential hydrocarbon accumulation is being assessed, an underestimation of the reservoir resistivity can lead to not using CSEM in targets that would be suitable. In the scenario where CSEM data has been acquired and a CSEM anomaly is present in the data it will lead to an overestimation of the hydrocarbon saturation needed to generate the measured anomaly magnitude.
Using data from well 24/9-12 (Data from Diskos, © original licence holders) in the Norwegian Continental Shelf we can confirm that the log-scale saturation resistivity relationship cannot be used directly to evaluate the average resistivity of the reservoir without accounting for the pressure and stratigraphic variabilities. In this case the reservoir is a very homogeneous injectite, thus only the pressure variability will impact the difference between the log-scale and field-scale relationships. Some well logs are
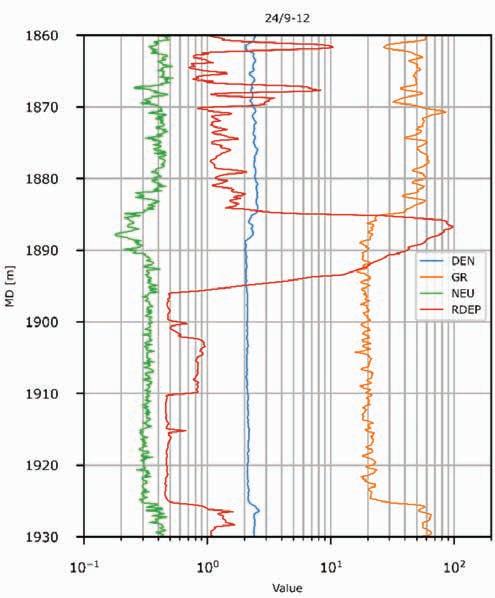
shown in Figure 9. The water saturation can be calculated by using Archie with Rw = 0.052 Ωm and m = n = 2; the result is shown in Figure 10. The average resistivity and saturation for the reservoir encountered in the well are compared with the

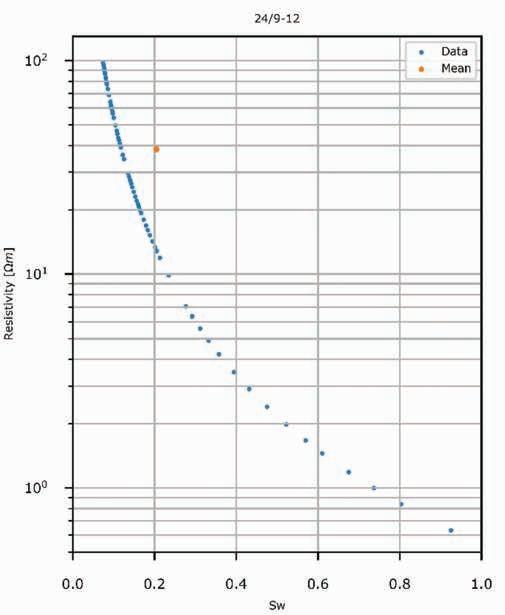
saturation and resistivity points measured at each sample across the reservoir in Figure 11. As expected, the average resistivity is close to 2.5 times higher than the sample resistivity measurement corresponding to the same water saturation value of 20%.
Model 2 with only pressure variability could have served as a good pre-drill analog to this reservoir. Assuming the reservoir shape can be ignored, we would have predicted an average reservoir resistivity of 42 Ωm for the 20% average water saturation case. This would be significantly higher than the 20 Ωm predicted by the simple application of Archie (green curve in Figure 7).
The well encountered 38 Ωm average resistivity with 20% average water saturation, much closer to the estimation made by accounting for pressure variability though the specific Archie relationships are different (porosities and Rw are different). This shows that accounting for saturation variability from the pressure build up is as important as having a good approximation to the specific Archie relationship when there is a need to understand the relationship between average resistivity and average saturation.
When evaluating the expected resistivity of a prospect for CSEM sensitivity assessment in an exploration scenario or data interpretation, using core-scale saturation-resistivity relationships to convert average saturation to resistivity will lead to resistivity underestimation. To provide more realistic resistivity values the effect of saturation variability must be considered. There are
two main sources of variability: pressure and stratigraphy. They can be accounted for by using an average saturation vs pressure/ height function combined with the expected standard deviation from the stratigraphic component when converting the average saturation to resistivity. Failure to account for variability will lead to significant underestimation of the expected resistivities that might lead to wrong sensitivity assessment or data interpretation.
The author would like to thank EMGS for providing the resources to carry out this work. The comments of two anonymous reviewers significantly improved the paper.
Archie, G.E. [1942]. The electrical resistivity log as an aid in determining some reservoir characteristics. Petroleum Technology/American Institute of Mining and Metallurgical Engineers, 5, 54-62.
Constable, S. [2010]. Ten years of marine CSEM for hydrocarbon exploration. Geophysics, 75(5), A67-A81. doi: 10.1190/1.3483451.
MacGregor, L. and Tomlinson, J. [2014]. Marine controlled-source electromagnetic methods in the hydrocarbon industry: A tutorial on method and practice. Interpretation, 2(3), SH13–SH32. doi: https:// doi.org/10.1190/INT-2013-0163.1.
Savage, S.L. and Markowitz, H.M. [2009]. The Flaw of Averages: Why We Underestimate Risk in the Face of Uncertainty. John Wiley & Sons.

Roderick Perez1* and Stuart Hardy 2
Abstract
Fault complexity in seismic data can be more accurately represented by integrating geomechanical simulation and forward seismic modelling. A multi-layer stratigraphic model subjected to progressive deformation was constructed using the Discrete Element Method (DEM). Acoustic impedance fields derived from mechanical evolution provided the basis for calculating vertical reflection coefficients, which were then convolved with zero-phase Ricker wavelets using a 1D approach to produce synthetic seismic sections. Compared to conventional planar-fault representations, the resulting images display intricate reflector terminations, and amplitude dimming associated with distributed fault damage and rotated blocks. These results highlight that even a single fault, when modelled with physics-based deformation, produces richer and more varied seismic responses than matrix-deformation/warping approaches used to create labelled training datasets, providing a more geologically reliable basis for AI fault-segmentation and interpretation.
Faults are fundamental geological structures that play a critical role in the generation, migration, and entrapment of hydrocarbons (Kim et al., 2004; Gudmundsson et al., 2010; Zeng and Liu, 2010; Ferrill et al., 2014; Peacock et al., 2017; Gong et al., 2019). Rather than simple breaks or cracks, faults are three-dimensional volumes of distributed deformation with petrophysical properties that differ from the host rock; this internal heterogeneity controls reflectivity and fluid flow and must be honoured when generating credible synthetics (Botter et al., 2014). Despite important advances in acquisition and imaging, interpretation remains challenging due to limited resolution, noise, and stratigraphic-structural ambiguity (Gunderson et al., 2022; Ma et al., 2024). Synthetic seismic modelling helps to bridge geology and data, but many traditional approaches rely on idealised geometry that washes out realistic fault-zone complexity (Alcalde et al., 2017; Zeng and Liu, 2010; Botter et al., 2014; Peacock et al., 2017). Here we integrate Discrete Element Method (DEM)-based mechanical modelling with 1D seismic forward modelling to move beyond idealised planar faults and demonstrate how structurally realistic models generate richer, more interpretable signatures.
In petroleum geoscience, a fault is often defined as a planar discontinuity in a rock volume across which significant displacement has occurred due to tectonic stresses (North, 1985). Interpreting faults from seismic data is a cornerstone of exploration and development workflows (Alcalde et al., 2017; Butler, 2023). The delineation of fault geometry is essential not only for understanding the structural framework but also for predicting compartmentalisation, assessing trap integrity, and optimising well placement (Perez et
1 OMV | 2 ICREA - Institució Catalana de Recerca i Estudis Avançats
al., 2024). Interpretation methods rely heavily on the recognition of lateral discontinuities in seismic reflections, such as abrupt amplitude terminations, vertical offsets, or phase changes (Kanasewich and Phadke, 1988; Ercoli et al., 2023). These are often enhanced through seismic attributes and advanced visualisation techniques (Chopra and Marfurt, 2007). However, seismic fault interpretation is not limited to detection; it also includes mapping the geometry, extent, and character of faults and associated damage zones (Planke et al., 2005).
Despite the advances in acquisition and imaging, fault interpretation remains challenging due to limited vertical and horizontal resolution, imaging noise, and ambiguities arising from overlapping structural and stratigraphic features (Romberg, 2002; Chopra and Marfurt, 2007). Some faults are barely visible or even seismically silent, particularly when they occur below tuning thickness or within noisy intervals (Slejko et al., 2011, Reicherter et al., 2023; Ercoli et al., 2023). As a result, interpreters must incorporate geological intuition, attribute-driven analysis, and increasingly, data-driven machine learning techniques to reduce uncertainty and bias (Freeman et al., 2010; Paxton et al., 2022). Nevertheless, these methods are ultimately limited by the accuracy of the subsurface representations used in training or calibration (Khosro et al., 2024).
Synthetic seismic modelling is a powerful tool to bridge geological understanding and seismic imaging (Vizeu et al., 2022). However, many traditional forward modelling approaches rely on simplified geometries and assumptions, such as perfectly planar interfaces, horizontally layered media, or artificial fault shapes generated using geometric routines (Mirkamali et al., 2023). While computationally convenient, these models lack the structural realism
* Corresponding author, E-mail: roderick.perezaltamar@omv.com, roderickperezaltamar@gmail.com DOI: 10.3997/1365-2397.fb2026010
and complexity observed in nature, which can lead to oversimplified and potentially misleading seismic responses (Oakley et al., 2023; Li et al., 2023). In this context, physics-based approaches that simulate fault growth and rock failure from first principles offer an opportunity to generate more representative seismic models rooted in geomechanics (Diao et al., 2024; Boyet et al., 2023).
The DEM, originally developed by Cundall and Strack (1979), provides a mesh-free approach to model large deformations and discontinuities, allowing faults and fractures to emerge as natural responses to applied boundary conditions and mechanical properties. In DEM, rock masses are represented as assemblies of rigid or deformable particles that interact via normal and shear contact forces. This framework has been used to model a wide variety of geological structures, including shear zones, fault-related folds, salt diapirs, and strike-slip fault systems (Morgan and Boettcher, 1999; Egholm et al., 2008; Hardy, 2018; Liu and Konietzky, 2018). Unlike continuum-based approaches, DEM can handle fragmentation, rotation, and sliding explicitly, making it well-suited for a more realistic geological fault evolution simulation.
More recently, DEM has been implemented as a practical modelling tool tailored to geological applications. DEM simulates deformation using rigid circular particles, allowing faults, splays, and complex fracture networks to emerge spontaneously from mechanical interactions (Botter et al., 2014; Cardozo and Hardy, 2023). The DEM method has been applied to problems ranging from caldera collapse to deltaic growth strata and provides an accessible yet robust platform for exploring the mechanical underpinnings of geological structures (Hardy, 2008; 2016; 2018; 2019a, 2019b; Hardy and Finch, 2007; Hardy et al., 2009).
Botter et al. (2014) explicitly present a two-dimensional proof-of-concept: they use 2D DEM to simulate faulting in a sandstone shale sequence and apply 2D seismic imaging to test how illumination direction and frequency affect the resulting image. They also note that the same physics-based workflow can be generalised to 3D for a more realistic representation of fault architecture and wavefield interactions. The study shows that mechanically consistent, non-planar fault models better explain seismic signatures in structurally heterogeneous domains and help bridge conceptual geology and synthetic seismic responses.
By integrating discrete element modelling with seismic forward modelling approaches presented here, we aim to go beyond idealised planar faults and demonstrate how structurally realistic models generate richer and more interpretable seismic signatures. This not only complements modern data-driven techniques but also reinforces the importance of geomechanically consistent models for improving seismic interpretation accuracy in complex faulted terrains.
In this study, we utilise a DEM-based model to simulate the development of a synthetic fault system along a 45-degree fault plane. Each circular element in the model is assigned compressional velocity (V p) and density (ρ) values, enabling the computation of acoustic impedance once deformation occurs. The resulting impedance distribution is used to calculate vertical reflection coefficients, which are then convolved (1D vertical incidence) with a synthetic and idealised zero-phase Ricker wavelet to produce a pseudo-seismic section that captures the dynamic evolution of faulting and associated displacement.
By explicitly modelling the mechanical response of circular DEM elements that interact through the frictional-cohesive contact law, rather than as a purely pre-bonded continuum, the DEM approach naturally reproduces complex fault-zone features such as irregular fault traces, rotated blocks, and a narrow zone of closely spaced splays elements often missing from traditional geometric models. Unlike earlier work that examined fault-related seismic responses using kinematic or continuum models or attribute-based analysis of existing data without explicitly propagating a mechanically consistent, strain-dependent property field into the synthetics (Townsend et al., 1998; Couples et al., 2007; Dutzer et al., 2010; Long and Imber, 2010; Iacopini and Butler, 2011) our workflow translates the full physical output of DEM simulations into synthetic seismic data. This makes it tractable to produce many geologically consistent examples for interpretation studies and method development, including machine-learning training and benchmarking. In terms of realism, our 1D synthetics reproduce tuning, reflector terminations, and diffraction-like edge responses driven by vertical sampling across lateral terminations, but they do not capture the full diffraction and survey-dependent illumination effects that Pre-Stack Depth Migration (PSDM) imaging handles (Lecomte et al., 2015; Botter et al., 2016). Future work will therefore couple the same mechanical models to PSDM to quantify the additional effects of lateral wave propagation and acquisition geometry.
We adopt the DEM formulation described in Cardozo and Hardy (2023). In this 2D lattice-solid variant (Mora and Place, 1993, 1994; Place et al., 2002), a rock volume is discretised into rigid circular elements that interact through normal and tangential contact forces; bonds break irreversibly when a threshold is exceeded, and elements also experience gravity and viscous damping. Motions are advanced with a velocity-Verlet integrator, and a time step linked to element mass (∆t), which ensures numerical stability.
For two bonded elements the normal (radial) force is (1)
where K n is the normal spring stiffness, r the instantaneous centre–centre distance, R the equilibrium distance (sum of radii), and r0 the dimensionless bond-breaking strain. A bond fails irreversibly when r R < r0R; thereafter no tensile attraction exists, although a repulsive force is retained for r ≤ R
In the frictional-cohesive formulation all bonds start broken. Normal contact forces still follow Equation 1, but shear resistance is added through a tangential spring whose magnitude is capped by a Coulomb criterion: (2)
with K s the shear stiffness, X s the accumulated tangential displacement, C0 a cohesive term, and μ the inter-element friction coefficient (Cundall and Strack, 1979; Mora and Place, 1994). If contact is lost all forces at that pair are reset to zero.
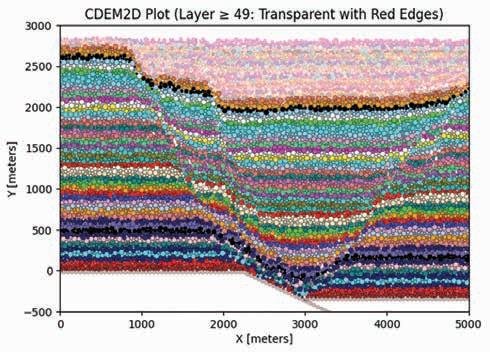
CDEM simulation example illustrating a progressive 30° fault plane normal-fault development and layer offset of ≈450 meters.
The net elastic force on element i is the vector sum of normal and shear contributions from every contacting neighbour j: (3)
to which a viscous damping force −nxi, where η is the damping constant, and a gravitational body force F g (increasing lithostatic stress with depth) are added. The total force is therefore: (4)
and particle motions are advanced with a velocity-Verlet integrator (Allen and Tildesley, 1987). Numerical stability is ensured by choosing the time-step: (5)
where mmin is the smallest particle mass, while η scales as Δt × 3.0 × 10⁹/ Ns/m (Table 1 in Cardozo and Hardy, 2023).
After deformation, we estimate a continuum strain field from displacement gradients of element-centre displacements (i.e., u and its symmetric part), used only as a kinematic descriptor; because the elements are rigid, this is not ‘particle’ strain and we do not update material properties from it. Instead, compressional velocity (V p) and density (ρ) are assigned by stratigraphic layer, to provide layer-consistent but laterally variable properties. We then rasterise these element-level properties onto a Cartesian grid with cell size ∆x = ∆y ≥ 5, Ravg (at least five times the mean particle radius). For each grid cell, we compute the arithmetic mean of V p and ρ over all elements whose centres fall inside the cell (empty cells receive the background layer mean). From the gridded fields we compute impedance (Z = ρV p) and vertical reflectivity (R = Z2 - Z1), where Z1 and Z2 are the impedances of vertically adjacent cells. The resulting reflectivity series is then convolved (1D vertical incidence) with a zero-phase Ricker wavelet to generate the synthetic seismic section.
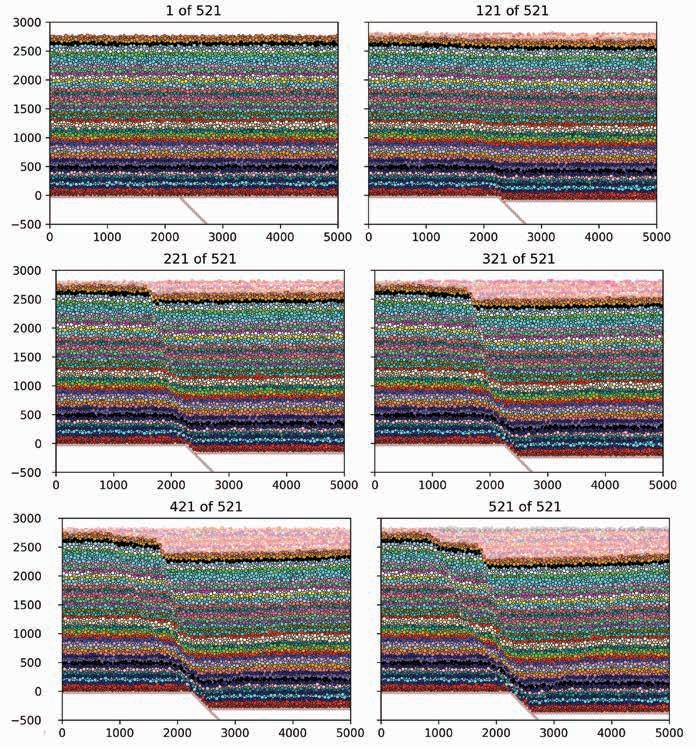
Figure 2 CDEM sequential particle plots at sixtime steps illustrating progressive 45° fault plane normal -fault development and layer offset.
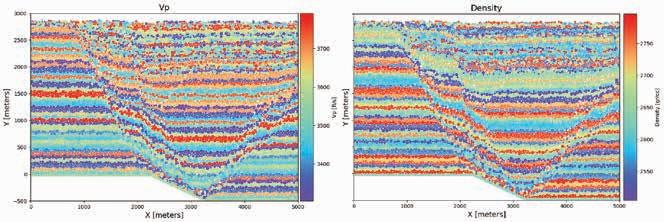
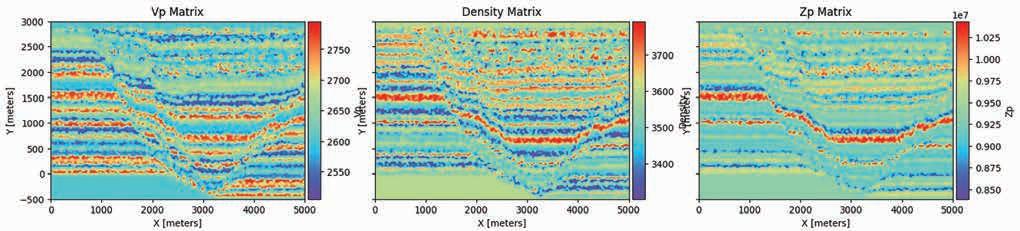
In this paper, PSDM denotes Pre-Stack Depth Migration, i.e., seismic imaging in depth using the pre-stack wavefield. When we refer to a ‘PSDM imaging simulation’ (as used in Botter et al., 2014), we mean a ray-based image-processing method. It ‘emulates’ the PSDM imaging process not by migrating synthetic shots (solving the full wave equation), but by convolving the reflectivity volume with Point-Spread Functions (PSFs) derived from ray tracing. This simulates the specific spatial resolution, diffraction, and illumination effects inherent to a PSDM image of a given survey geometry at low computational cost. By contrast, the 1D convolution used elsewhere in this study captures tuning but not the lateral scattering or survey-dependent illumination effects handled by PSDM.
(6)
This end-to-end workflow — DEM mechanics, layer-based assignment of rock-physics properties, impedance mapping, reflection modelling, and wavelet convolution — provides a physically grounded route from fault growth to seismic response, capturing amplitude variations.
Results
The starting model is 5 km wide by 2.77 km high, with 48 layers and 10,891 elements (Figure 1). In this example, a 30° normal fault is imposed through boundary displacements, and the model evolves over 521 time increments. At the particle scale, positions are defined by (x, y) centre coordinates, its radius, and a group identifier. Irregular fault traces and rotated blocks within a narrow damage zone, absent from kinematic models, are clearly visible.
Figure 2 shows the evolution of deformation at six equally spaced increments (1-521 in steps of 100), for a 45° fault plane normal-fault development. Notice how the layering progressively segments and rotates, with distributed splays and a narrow damage zone forming by time increment 221 and intensifying thereafter.
The velocity and density fields inherit this strain localisation; rasterised impedance then transforms it into spatially variable reflectivity. To visualise the model in cross-section, we plot circles whose colours denote stratigraphic ‘groups’ used for property assignment; elements with the same colour share the same and ρ ranges. Opaque circles represent the original (pre-deposition) elements, whereas semi-transparent circles indicate ‘deposited’ elements (sediment infill) inserted during the run to fill accommodation generated by hanging-wall subsidence; these deposited elements inherit the property ranges of the layer they infill. Across the six snapshots, deformation progressively localises onto the master fault, accompanied by widening of the damage zone with subsidiary splays and block rotations.
Figure 3 shows the circular particle elements, illustrating that the distributions of the V p and ρ attributes are equivalent to the results in Figure 1. These scatter plots emphasise the layered impedance stratification and its lateral interference within the fault zone. Rasterisation yields the raw property grids of Figure 4, where abrupt colour changes reflect the discrete sampling of circular elements. We map particle-level V p and ρ onto a 10 m × 10 m Cartesian grid by evaluating, for each grid cell, the position of its centre (xc, yc) relative to every element. If the cell centre falls inside an element’s radius, that element’s V p and ρ are accumulated for the cell; after looping over all elements, the sums are divided by the number of contributing elements, so each cell stores the arithmetic mean. Cells with no contributors are set to the background average.
To mitigate the pixel-scale aliasing and small ‘holes’ introduced by discrete sampling while preserving offsets and sharp boundaries, we apply a light Gaussian filter followed by a small-kernel median filter. This two-step smoothing suppresses high-frequency noise and fills isolated empty values, promoting layer-parallel coherence within units while preserving sharp contrasts and discontinuities at faults and layer terminations. We next compute reflection coefficients by iterating through adjacent cells vertically. Finally, we convolve the reflection coefficients with a Ricker wavelet (peak
frequency of 60 Hz) to simulate a band-limited seismic source and produce synthetic seismic amplitudes.
Figure 5a shows the final bandlimited seismic section, which exhibits the expected oscillatory wavelet character. Strong reflectors near faulted zones or abrupt lithological contrasts cause high amplitudes, while gradual V p / ρ transitions produce weaker reflections. Figure 5b overlays the DEM elements from Figure 1 on the seismic section of Figure 5a, confirming the tight correspondence between mechanical structure and seismic response.
Frequency sensitivity is illustrated in Figure 6, which shows sections generated with 20, 40, and 60 Hz wavelets across the same time steps as in Figure 1. These frequency-sensitivity results allow us to conclude that, as expected, 20 Hz highlights only gross offsets and broad dimming; 40 Hz begins to resolve major splays and reflector bending; and 60 Hz images minor reflectors inside the damage zone while remaining band-limited. Coherent edge responses that resemble diffraction tails emanate from abrupt terminations at higher frequency, and amplitude dimming beneath the fault core (‘amplitude shadows’) is visible where strain-related property changes reduce impedance contrast.
This synthetic approach goes beyond geometric/kinematic forward modelling commonly used in didactic or quick-look studies - e.g., uniformly tilting horizons or inserting a single planar fault, or applying parameterised folding/faulting to random reflectivity volumes for AI datasets (Vizeu et al., 2022; Wu et al., 2019). Field and outcrop observations show that major faults typically host subsidiary splays, drag, rotated blocks, and heterogeneous damage zones (Kim et al., 2004; Peacock et al., 2017). In our case, the DEM representation reproduces much of this complexity mechanistically, and the resulting seismic response reflects it. However, that expression is inherently limited by resolution constraints set by the finite element size and by the rasterisation grid
(10 m cells in our examples), so sub-particle and sub-cell features are not resolved. The steeply dipping master fault is therefore accompanied by irregular offsets and reflector terminations that would not arise in a purely planar model, underscoring the value of physics-based geometries.
Our mechanical-to-seismic workflow shares the conceptual framework of Botter et al. (2014), who coupled DEM, finite-strain rock-physics updates. However, unlike their use of a ray-based PSDM imaging simulation, we employ a simplified 1D convolutional model to study the visibility of fault-zone structure. We similarly link mechanical realism to seismic modelling, but we emphasise computational efficiency and ensemble generation: we deliberately use 1D convolution to accelerate large parameter sweeps while preserving first-order amplitude-frequency behaviour. This makes it tractable to produce many geologically consistent examples for interpretation studies and method development, including machine learning training and benchmarking. In terms of realism, our 1D synthetics reproduce tuning, reflector terminations, and diffraction-like edge responses driven by vertical sampling across lateral terminations, but they do not capture full 3D scattering and survey-dependent illumination that PSDM provides (Lecomte et al., 2015; Botter et al., 2016). Future work will therefore couple
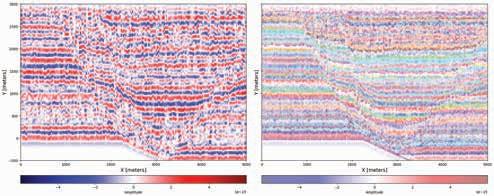
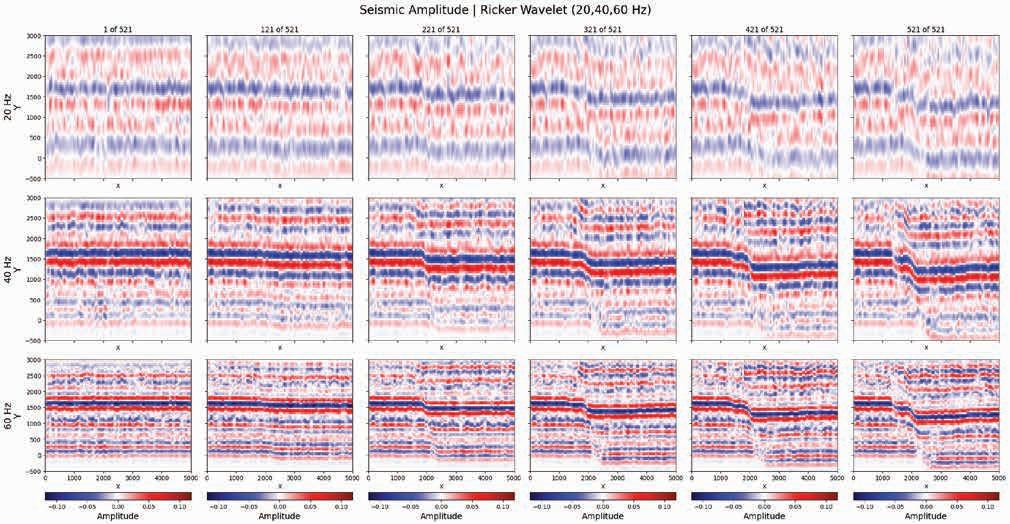
the same mechanical models to PSDM to quantify the additional effects of lateral wave propagation and acquisition geometry. Synthetic data derived from mechanically consistent models provide richer and more geologically faithful examples for both training and rigorous evaluation of fault-segmentation networks. By ‘stress-testing’ we mean benchmarking networks on controlled, labelled DEM-based scenarios that deliberately include difficult case – distributed damage zones, rotated blocks, variable impedance contrasts, tuning and amplitude dimming beneath the fault core, and abrupt reflector terminations – while varying peak frequency (20, 40, 60 Hz), signal-to-noise ratio (SNR), and grid resolution to quantify robustness (precision, recall, IoU) and failure modes. Because the DEM outputs encode distributed deformation and block rotation, and because they vary by layer within realistic ranges, the resulting seismic sections exhibit amplitude shadows, edge responses, and reflector terminations that resemble field data. By contrast, widely used synthetic training sets such as FaultSeg3D are generated by parameterised folding and faulting applied to random reflectivity volumes and do not enforce geomechanical consistency (Wu et al., 2019). Models trained and evaluated on DEM-based synthetics are therefore less likely to overfit to oversimplified geometries and more likely to generalise to field cases, offering a practical route to more robust and geologically reliable fault-segmentation AI models.
By assigning lithology-appropriate properties to DEM elements, updating those properties with finite strain, rasterising to impedance, and applying band-limited 1D convolution, we obtain synthetic sections that reproduce second-order consequences of realistic fault growth. Even with 1D convolution, the sections exhibit strong reflector terminations and coherent edge responses arising from vertical sampling across lateral discontinuities. Although these responses are not full diffractions like those in PSDM, these characteristics are useful for interpretation and for building geologically grounded datasets for AI training. Future work will couple the same mechanical models to a ray-based PSDM imaging simulation to explicitly incorporate lateral resolution and illumination.
References
Alcalde, J., Bond, C., Johnson, G., Butler, R., Cooper, M. and Ellis. J. [2017]. The importance of structural model availability on seismic interpretation. Journal of Structural Geology, 97, 161-171. https://doi.org/10.1016/j. jsg.2017.03.003.
Allen, M.P. and Tildesley, D.J. [1987]. Computer Simulation of Liquids. Oxford University Press.
Botter, C., Cardozo, N., Hardy, S., Lecomte, I. and Escalona, A. [2014]. From mechanical modelling to seismic imaging of faults: A synthetic workflow to study the impact of faults on seismic. Marine and Petroleum Geology, 57, 187-207, doi: 10.1016/j.marpetgeo.2014.05.013.
Botter, C., Cardozo, N., Hardy, S., Lecomte, I., Paton, G. and Escalona, A. [2016]. Seismic characterisation of fault damage in 3D using mechanical and seismic modeling. Marine and Petroleum Geology, 77, 973-990.
Boyet, A., De Simone, S. and Vilarrasa, V. [2023]. Physics-Based Modelling to Understand and to Propose Forecasting Methods of Induced Seismicity. Seismological Research Letters, 94(6), 2666-2678.
Butler, R. [2023]. Training the creation, visualization and interpretation of fault maps for the subsurface using tectonic geomorphology. Geological Society, London, Special Publications, 541, 181205. https://doi. org/10.1144/SP541-2022-353.
Cardozo, N. and Hardy, S. [2023]. cdem: A macOS program for discrete element modeling of tectonic structures. Geosphere, 19, 1259–1279.
Chopra, S. and Marfurt, K.J. [2007]. Volumetric curvature attributes for fault/fracture characterization. First Break, 25(7), 3546.
Couples, G., Ma, J., Lewis, H., Olden, P., Quijano, J., Fasae, T. and Maguire, R. [2007]. Geomechanics of faults: impacts on seismic imaging. First Break, 25(10), 83-90. https://doi.org/10.3997/1365-2397.25.10.27671
Cundall, P.A. and Strack, O.D.L. [1979]. A discrete numerical model for granular assemblies. Geotechnique, 29, 47-65.
Diao, F., Weng, H., Ampuero, J.P., Shao, Z., Wang, R., Long, F. and Xiong, X. [2024]. Physics-based assessment of earthquake potential on the Anninghe-Zemuhe fault system in southwestern China. Nature Communications, 15(1), 6908.
Dutzer, J.F., Basford, H. and Purves, S. [2010]. Investigating fault-sealing potential through fault relative seismic volume analysis. Geological Society, London, Petroleum Geology Conference Series, 7, 509-515. https://doi.org/10.1144/0070509
Egholm, D.L., Sandiford, M., Clausen, O.R. and Nielsen, S.B. [2008]. A new strategy for discrete-element numerical models: 2. Sandbox applications. Journal of Geophysical Research, 112, B05204.
Ercoli, M., Carboni, F., Akimbekova, A., Carbonell, R.B. and Barchi, M.R. [2023]. Evidencing subtle faults in deep seismic reflection profiles: Data pre-conditioning and seismic attribute analysis of the legacy CROP-04 profile. Frontiers in Earth Science, 11, 1119554. https://doi. org/10.3389/feart.2023.1119554.
Faulkner, D.R., Jackson, C.A.L., Lunn, R.J., Schlische, R.W., Shipton, Z.K., Wibberley, C.A.J. and Withjack, M.O. [2010]. A review of recent developments concerning the structure, mechanics and fluid flow properties of fault zones. J. Struct. Geol., 32, 1557-1575.
Ferrill, D., McGinnis, R., Morris, A., Smart, K., Sickman, Z., Bentz, M., Lehrmann, D. and Evans, M. [2014]. Control of mechanical stratigraphy on bed-restricted jointing and normal faulting: Eagle Ford Formation, south-central Texas. AAPG Bulletin, 98, 2477-2506, doi: 10.1306/08191414053.
Freeman, B., Boult, P.J., Yielding, G. and Menpes, S. [2010]. Using empirical geological rules to reduce structural uncertainty in seismic interpretation of faults. Journal of Structural Geology, 32(11), 16681676.
Gong, L, Bo, L., Xiaofei, F., Hadi, J., Shuai, G., Wenting, Y., Hongqi, Y., Rongzhi, F. and Zijie, W. [2019]. Quantitative prediction of sub-seismic faults and their impact on waterflood performance: Bozhong 34 oilfield case study. Journal of Petroleum Science and Engineering, 172, 60-69, https://10.1016/j.petrol.2018.09.049.
Gudmundsson, A., Simmenes, T., Larsen, B. and Philipp, S. [2010]. Effects of internal structure and local stresses on fracture propagation, deflection, and arrest in fault zones. Journal Structural Geology, 32, 1643–1655, doi: 10.1016/j.jsg.2009.08.013.
Gunderson, K.L., Zhang, Z., Payne, B., Cheng, S., Jiang, Z. and Wang, A. [2022]. Machine learning applications to seismic structural interpretation: Philosophy, progress, pitfalls, and potential Available to Purchase. AAPG Bulletin, 106(11), 2187–2202. https://doi.org/ 10.1306/12162121016.
Hardy, S. [2008]. Structural evolution of calderas: Insights from two-dimensional discrete element simulations. Geology, 36, 927-930. https://doi. org/10.1130/G25133A.1.
Hardy, S. [2016]. Does shallow dike intrusion and widening remain a possible mechanism for graben formation on Mars? Geology, 44, 107-110, https://doi.org/10.1130/G37285.1.
Hardy, S. [2018]. Coupling a frictional-cohesive cover and a viscous substrate in a discrete-element model. Marine and Petroleum Geology, 97, 32-44.
Hardy, S. [2019a]. Novel discrete element modeling of Gilbert-type delta formation in an active tectonic setting First results. Basin Research, 31(1), 77-91, https://doi.org/10.1111/bre.12309.
Hardy, S. [2019b]. Discrete element modeling of extensional, growth, fault-propagation folds. Basin Research, 31(3), 584-599. https://doi. org/10.1111/bre.12335.
Hardy, S. and Finch, E. [2007]. Mechanical stratigraphy and the transition from trishear to kink-band fault-propagation fold forms above blind basement thrust faults: A discrete-element study. Marine and Petroleum Geology, 24, 75-90. https://doi.org/10. 1016/j.marpetgeo.2006.0.
Hardy, S., McClay, K. and Muñoz, J.A. [2009]. Deformation and fault activity in space and time in high-resolution numerical models of doubly vergent thrust wedges. Marine and Petroleum Geology, 26(2), 232-248. https://doi.org/10.1016/j.marpetgeo.2007.12.003.
Iacopini, D. and Butler, R.W.H. [2011]. Imaging deformation in submarine thrust belts using seismic attributes. Earth and Planetary Science Letters, 302, 414-422. https://doi. org/10.1016/j.epsl.
Kanasewich E. and Phadke, S. [1988]. Imaging discontinuities on seismic sections. Geophysics, 53(3), 290-416. https://doi.org/10.1190/1.1442467
Khosro Anjom, F., Vaccarino, F. and Socco, L.V. [2024]. Machine learning for seismic exploration: Where are we and how far are we from the holy grail? Geophysics, 89(1), WA157-WA178.
Kim, Y., Peacock, D. and Sanderson, D. [2004], Fault damage zones. Journal Structural Geology, 26, 503–517. https://10.1016/j.jsg.2003.08.002.
Lecomte, I., Lavadera, P.L., Anell, I., Buckley, S.J., Schmid, D.W. and Heeremans, M. [2015]. Ray-based seismic modeling of geologic models: Understanding and analysing seismic images efficiently. Interpretation, 3(4), SAC71-SAC89.
Li, W., Yue, D., Colombera, L., Duan, D., Long, T., Wu, S. and Liu, Y. [2023]. A novel method for seismic-attribute optimization driven by forward modeling and machine learning in prediction of fluvial reservoirs. Geoenergy Science and Engineering, 227, 211952. https:// doi.org/10.1016/j.geoen.2023.211952.
Liu, X. and Konietzky, H. [2018]. DEM investigation on strike-slip fault mechanics. Tectonophysics, 722, 283–298.
Long, J.J. and Imber, J. [2010]. Geometrically coherent continuous deformation in the volume surrounding a seismically imaged normal fault-array. Journal of Structural Geology, 32(2), 222-234. https://doi.org/10.1016/j. jsg.2009.11.009.
Ma, L., Han, L. and Feng, Q. [2024]. Deep learning for high-resolution seismic imaging. Scientific Report, 14. https://10.1038/s41598-024-61251-8.
Mirkamali, M.S., Javaherian, A., Hassani, H., Saberi, M.R. and Sarallah-Zabihi, S. [2023]. Seismic forward modeling for investigating and interpreting thin beds in a carbonate reservoir in SW Iran. Exploration Geophysics, 54(6), 601-624.
Mora, P. and Place, D. [1993]. A lattice solid model for the non-linear dynamics of earthquakes. Int. J. Mod. Phys. C, 4(6), 1059-1074.
Mora, P. and Place, D. [1994]. Simulation of the frictional stick-slip instability. Pure and Applied Geophysics, 143, 61–87.
Morgan, J.K. and Boettcher, M.S. [1999]. Numerical simulations of granular-shear experiments. Tectonophysics, 324, 299-322.
North, F.K. [1985]. Petroleum Geology. Allen & Unwin, Boston.
Oakley, D., Cardozo, N., Vazquez, A.A. and Røe, P. [2023]. Structural geologic modeling and restoration using ensemble Kalman inversion. Journal of Structural Geology, 171, 104868. https://doi.org/10.1016/j. jsg.2023.104868.
Paxton, A., Zhang, L., Kholiq, A., Davey, L., Bisley, R., Fell, D., Leon, L. and Shadlow, J. [2022]. November. Reducing seismic quantitative interpretation uncertainty in complex geological environments: A case study from offshore Australia. In SEG International Exposition and Annual Meeting (D011S116R003).
Peacock, D., Nixon, C., Rotevatn, A., Sanderson, D. and Zuluaga, L. [2017]. Interacting faults. Journal of Structural Geology, 97, 1-22, doi: 10.1016/j.jsg.2017.02.008.
Perez Altamar, R., Wiebe, M. and Pablos Corredor, A. [2024]. Integration of deep-learning fault segmentation, horizontal transverse isotropy analysis, and ambient microseismic methods to enhance fracture prediction in the Crisol Anticline, Colombia. Interpretation, 12, SD1SD16. https://doi.org/10.1190/INT-2023-0046.1.
Place, D., Lombard, F., Mora, P. and Abe, S. [2002]. Simulation of the micro-physics of rocks using LSMEarth. Pure and Applied Geophysics, 159, 1911–1932.
Planke, S., Rasmussen, T., Rey, S.S. and Myklebust, R. [2005]. Seismic characteristics and distribution of volcanic intrusions and hydrothermal vent complexes in the Vøring and Møre basins. In: Dor´e, A.G. and Vining, B. (Eds.) Petroleum Geology: North-West Europe and Global Perspectives. Proceedings of the 6th Petroleum Geology Conference, Geological Society, London, 833-844.
Reicherter, K., Ritter, J.R., Baize, S., Steinritz, V., Pena-Castellnou, S. and Hürtgen, J. [2023]. Clustered activity of Intraplate Faults: The silent and slow active faults of southern Germany. Abstracts of the Annual AlpArray and 4D-MB Scientific Meeting, Bad Hofgastein.
Romberg, R. [2002]. Challenges in high-resolution seismic imaging of complex structures. First Break, 20, 567-574.
Slejko, D., Carulli, G.B., Garcia, J. and Santulin, M. [2011]. The contribution of “silent” faults to the seismic hazard of the northern Adriatic Sea. Journal of Geodynamics, 5, 2-3, 166-178. https://doi.org/10.1016/j. jog.2010.04.009.
Townsend, C., Firth, I.R., Westerman, R., Kirkevollen, L., Hårde, M. and Andersen, T. [1998]. Small seismic-scale fault identification and mapping. Geological Society, London, Special Publications, 147, 1-25. https://doi.org/10.1144/GSL.SP.1998.147.01.0.
Vizeu, F., Zambrini, J., Tertois, A.L., da Graça e Costa, B.D.A., Fernandes, A.Q. and Canning, A. [2022]. Synthetic seismic data generation for automated AI-based procedures with an example application to high-resolution interpretation. The Leading Edge, 41(6), 392-399.
Wu, X., Liang, L., Shi, Y. and Fomel, S. [2019]. FaultSeg3D: Using synthetic data sets to train an end to end convolutional neural network for 3D seismic fault segmentation. Geophysics, 84(3), IM35–IM45. https://doi.org/10.1190/geo20180646.1.
Zeng, L. and H. Liu. [2010]. Influence of fractures on the development of low-permeability sandstone reservoirs: A case study from the Taizhao district, Daqing Oilfield, China. Journal of Petroleum Science and Engineering, 72, 120-127, doi: 10.1016/j.petrol.2010.03. 009.
The seismic industry is being transformed by machine learning and artificial intelligence to produce better, more accurate and accessible data. The sector is continuing to flourish with big energy companies reporting huge annual savings from use of AI as well as claiming that its application to the geoscience sector is enabling seismic data to be analysed ten times faster. Digitalization is also helping energy companies to optimise where to look for the harder to find oil and gas still needed and machine learning tools are being increasingly used to prepare for energy transition projects.
Tagir Galikeev et al Illustrate an applications of multi-component seismology to a sinkhole that developed over a decade ago in the southern United States.
Samuel Cheyney et al supply a model with a set of known locations where a certain occurrence is present, and with the aid of an algorithm identify the key relationships between inputs to predict where similar potentially undiscovered occurrences may exist – thereby enhancing geothermal prospectivity.
Ciaran Collins et al present AI fault network workflows that are optimised to detect different fault expressions – ranging from subtle discontinuities to large-scale structural breaks – enabling a more comprehensive and robust understanding of subsurface structure for well planning.
Dr. Thibaud Freyd et al present a scalable, entitlement first Retrieval Augmented Generation (RAG) architecture that transforms unstructured, OSDU referenced content into actionable intelligence.
B. Lasscock et al present a practical framework for AI-assisted subsurface data access based on explicit data representations, agent-based workflows, and efficient information retrieval.
First Break Special Topics are covered by a mix of original articles dealing with case studies and the latest technology. Contributions to a Special Topic in First Break can be sent directly to the editorial office (firstbreak@eage.org). Submissions will be considered for publication by the editor.
It is also possible to submit a Technical Article to First Break. Technical Articles are subject to a peer review process and should be submitted via EAGE’s ScholarOne website: http://mc.manuscriptcentral.com/fb
You can find on www.firstbreak.org/guidelines the First Break author guidelines.
January Land Seismic
February Digitalization / Machine Learning
March Reservoir Monitoring
April Underground Storage and Passive Seismic
May Global Exploration
Further Special Topics may be added over the course of the year.
Tagir Galikeev1*, Tom Davis2 and Steve Roche3 Illustrate an application of multi-component seismology to a sinkhole that developed over a decade ago in the southern United States.
Introduction
Historically, the main mission of the Reservoir Characterization Project (RCP) at the Colorado School of Mines has been to conduct time-lapse multi-component data as a means of monitoring and characterising salient reservoir changes to improve reservoir recovery. Applications of multi-component seismology can be extended to monitoring seismic hazards such as the development of sinkholes. This paper illustrates one such application to a sinkhole that developed over a decade ago in the southern United States. More recent studies are now being undertaken in Guatemala and will hopefully aid in understanding the potential hazards of sinkhole development on infrastructure and the people of Guatemala.
Determining stress magnitudes in the subsurface is challenging at best but detecting changes in stress in the subsurface is achievable with multi-component seismometers that facilitate real time permanent reservoir monitoring. Shear waves result in more accurate determination of stress change in most consolidated media largely because it is the rigidity of the media that controls the propagation of shear waves. Some types of media are more stress-sensitive than others. Changes in stress in the subsurface can occur quite quickly which brings about the need for real-time seismic monitoring. Today a continuum of data can be analysed through artificial intelligence (AI) and data analytics.
As an example, we have analysed earthquake seismicity data from before and after the appearance of the sinkhole at the ground surface in Southern Louisiana. The most thoroughly studied literature example (Ford and Dreger, 2020) is the Napoleonville salt dome brine mine collapse, causing the appearance of the sinkhole on the surface. Southern Louisiana and neighbouring Gulf of America is known for its salt tectonics and related formation of oil traps and the consequent lucrative oil and gas exploration and production in the region. Salt domes occur when the deeper salt layer is mechanically deformed by the overburden and causes the formation of salt diapirs, which rise towards the surface (think lava lamp), ripping through the overburden layers and dragging them along. Stress-related faults surround the top and sides of the salt dome due to salt creep. The Napoleonville salt dome was actively mined for brine, which was used in the chemical industry. The brine mining process is quite simple: water is pumped down the borehole drilled in the salt dome and the washed-out brine is pipelined
to the chemical plant. With time the cavern around the borehole grows in size and fills up with water and sediments. Napoleonville salt dome had around 50 wells drilled into it at different times for brine mining. In addition to that, the area has old oil and gas wells (plugged and abandoned) drilled in the Eighties targeting structural reservoir traps close to the sides of the salt dome. Due to mechanical stress and related faulting caused by salt dome growth and creep, an unstable cap-rock and shallow gas trapped below the Mississippian River Alluvial Aquifer (MRAA), the integrity of the brine mine cavern failed. On 8 June 2012, locals felt the first tremors, but the analysis shows that the sinkhole-related events occurred as early as the second week of May through wavelet and hodogram analysis performed on the data recorded by a highly sensitive buried Trillium seismometer (EarthScope project).
Research mainly concentrated on the timing of the events and the geological framework which made the sinkhole appearance possible. Previous studies identified the main shock itself (Nayak and Dreger, 2018), which allowed us to employ a machine learning algorithm to hunt for like events.
Seismic observation from a three-component seismometer ground station of the USArray (EarthScope project) was actively recording seismicity from February 2011 to February 2013. This station is 11 km away from the location of a sinkhole that appeared at the surface in 2012. The station was the only instrument recording in the area with data available prior to and during the first sighting of the sinkhole on 3 August 2012.
The station’s full continuous dataset was downloaded from the Incorporated Research Institutions for Seismology (IRIS) server for analysis. Data were organised in a format suitable for data processing and analysis with an existing toolkit consisting of seismic processing software with implemented machine learning algorithms. Two main independent analyses were performed on the dataset for timing detection of the sinkhole-related events and both of them showed remarkably consistent results:
• Feature identification using a machine learning algorithm on the East recording element of the seismometer; and
• Hodogram and polarisation analysis on the East, North and Vertical recording elements.
The sinkhole appeared on 3 August 2012, but multiple events related to the location of the sinkhole were documented (Nayak
1 Unified Geosystems | 2 Colorado School of Mines | 3 Geophysical Consultant
* Corresponding author, E-mail: tagir@unifiedgeo.com
DOI: 10.3997/1365-2397.fb2026011
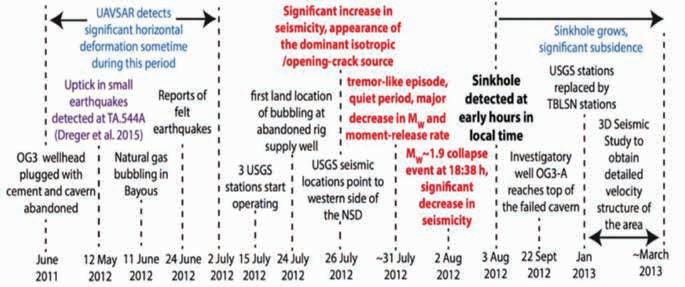
Figure 1 Detailed time scale of the major events associated with the sinkhole (modified from Nayak and Dreger, 2018).
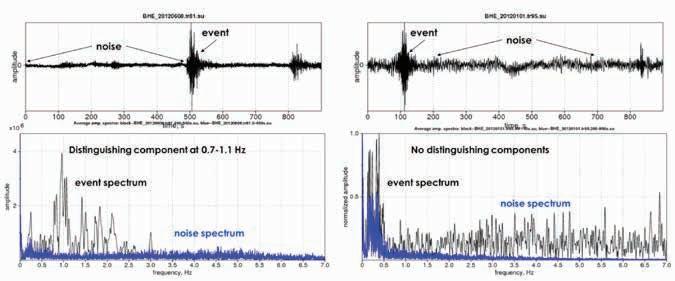
and Dreger, 2018), see Figure 1. Precursor events to the mainshock (significant event on 2 August 2012 in Figure 1) usually show statistical significance with a growing number of events leading to the main event and then a significant drop in the quantity of the events after the mainshock.
The three-component station registers events from all directions and distances. During the time the station was live, many daily seismicity events were recorded by the station. Our analysis shows that seismic events related to the sinkhole development in 2012 have distinguishing characteristics that correlate well to the underlying cause of the sinkhole. The station is located 11 km away from the sinkhole and within that same radius there are several prominent noise sources, which are also recorded by the seismometer. The surrounding area includes another brine mining facility at the White Castle Salt Dome to the west, as well as a sugar plant to the southeast. The region is also characterised by active agricultural land use.
Figure 2 shows sample waveforms recorded by the seismometer on different days. Although waveforms were consistently recorded each day, they vary in their characteristics due to differing source mechanisms. We exploit these variations — particularly in frequency and amplitude associated with sinkhole formation — by comparing them against the complete dataset to identify similar events that share the distinctive ‘fingerprint’ characteristic of sinkhole-related seismic signatures.
Figure 5 presents a comparison between the same sinkhole-related events recorded by the seismometer and those captured by a different USGS station on 29 July 2012. One can notice that the seismometer recordings include additional events that are unrelated to seismic activity at the OG-3 well cavern.
Figure 2 Sinkhole-related event of 8 June 2012 prior to human sighting of the sinkhole in August 2012 (left, top and bottom) have a distinguished frequencydomain characteristic from a waveform recorded on 1 January 2012 (right, top and bottom).
The USGS station was part of an array deployed by the US Geological Survey in the Bayou Corne area after a request for technical assistance from the State of Louisiana. This deployment was prompted by pre-emergent sinkhole-related seismic activity detected in July 2012. In total, six stations were installed, with the first becoming operational on 11 July 2012.
Qualitative analysis of records on all three components (horizontal component East, horizontal component North and vertical component) showed that the most pronounced events with the best signal-to-noise ratio were recorded on the Eastern component. Polarisation analysis revealed that sinkhole-related events exhibit strong East-West direction. This pattern can be attributed to faults formed on the western flank of the Napoleonville Salt Dome after the cavern failure. The newly created shallow faults are oriented NNE-SSW, causing energy to radiate along the salt body and fault plane, which in turn polarises the shear waves (SH) predominantly in the East-West direction.
Time-lapse geological interpretation of the two 3D seismic surveys was performed as part of the analysis. One survey was shot in 2007 and another one was acquired post sinkhole in 2013. The 2013 survey had better data coverage with bin size being approximately a quarter of the 2007 survey. Nevertheless, the 2007 survey was very helpful in identifying large radial faults emanating from the salt dome and comparing those to the 2013 images.
Radial faulting emanating from salt domes is a characteristic feature observed not only in the Gulf Coast region but also in salt basins worldwide. The stresses associated with dome formation develop over millions of years, generating extensional forces that produce radial faults. Once formed, these faults can serve as migration pathways for hydrocarbons, facilitating the charging of petroleum reservoirs, or alternatively function as seals. Consequently, understanding the timing and mechanisms driving
recurrent movement along these faults is essential for effective risk assessment.
The faults identified in the plots illustrated in Figure 3 were detected through detailed examination of the time period exhibiting the highest seismic activity, as reported in Nayak and Dreger (2018). These faults are not visible in the 2007 survey, indicating that they either healed or were absent entirely before the seismic shocks from June to August 2012 propagated through the salt dome and extended into adjacent sedimentary strata, thereby forming new faults or reactivating existing ones. The spatial locations of these faults align exceptionally well with the computed epicentres of the most intense seismicity events reported by Nayak and Dreger (2018).
Our analysis of time-lapse seismic data strongly suggests that the radial faults on the west/northwest side of the salt dome at depth were responsible for the failure of the brine mining cavern. Semblance attribute analysis reveals the presence of radial faults at multiple levels within the cavern, which spans depths of 3394 to 5654 feet. While these faults are present throughout the cavern, they are most likely concentrated near the bottom, where the cavern is in proximity to the salt boundary.
Movement along these faults triggered an earthquake in June 2012, the first strong seismic event reported by local residents. The fault eventually intersected the cavern, allowing brine to flow out into the fault zone, which facilitated further fault movement. This led to additional seismic activity. The earthquake generated
strong seismic waves, or shock waves, that propagated upward through the salt.
Salt is a high-velocity material capable of transmitting seismic energy over long distances. With no porosity and a brittle nature when subjected to sudden forces like an earthquake, salt concentrates seismic energy almost instantaneously above the source. Upon reaching the top of the salt, the seismic waves were amplified by the overlying cap-rock, causing shattering at the interface between the salt and cap-rock, and accelerating particle motion in the surrounding sediments. This amplified ground motion resulted in faulting in the shallow sediments along the edge of the salt, which provided a pathway for fluids to enter the dome from above. This led to salt dissolution, local subsidence, and the early formation of the sinkhole. Additionally, liquefaction and reactivated faults allowed gas to migrate upward along the shallow faults (at depths of 2000 feet and above) into the sinkhole.
A machine learning algorithm was implemented using template waveforms (reference signals) derived from the seismometer recordings on the Eastern component only. The events were processed at their full bandwidth of 0.1–1.1 Hz. All detected events exhibiting a similarity score greater than 0.45 were retained and subsequently tabulated to document their monthly and daily occurrences. Results of the analysis point to 7 May 2012 as a first day for sinkhole-related seismic activity (Figure 4).
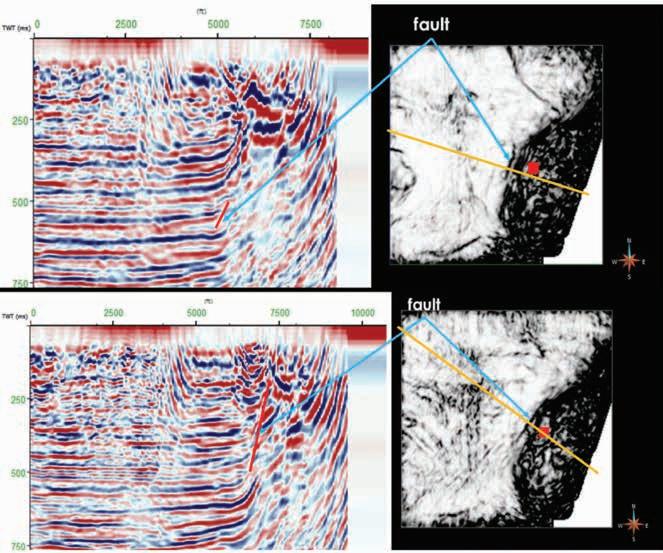
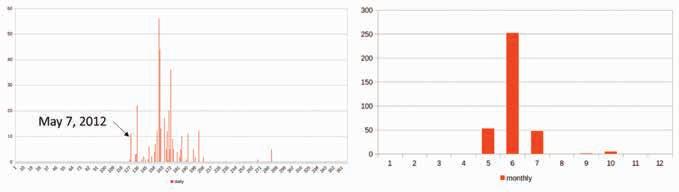
Figure 3 Upper and lower part of the picture shows identified faults on semblance slices at different levels (582 ms top and 500 ms bottom). Yellow lines show the location of the vertical sections to the left of semblance slices. Brine mining well location is denoted by the red square on the dark salt background.
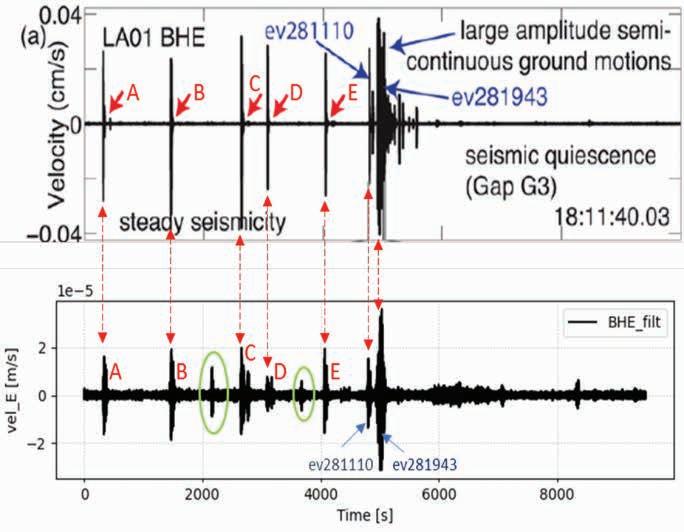
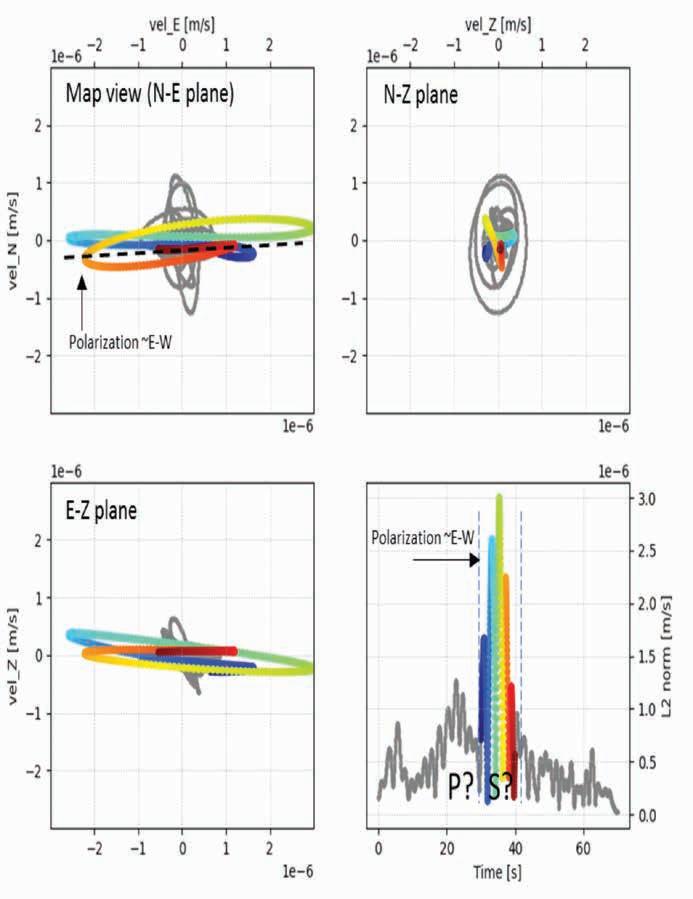
Figure 5 Events can be matched between the two stations, one near the sinkhole and one 11 km away (red double-arrows). Maximum amplitudes are more than 10x smaller on the station 11 Km from the sinkhole, due to attenuation over the 11+ km long travel path. Events only seen at station 544A (green circles) are likely to have been caused by local noise sources and are unrelated to the sinkhole (modified from Nayak and Dreger, 2018).
Figure 6 Polarisation analysis of event from 29 July 2012 (event B in Figure 5).
Another distinguishing characteristic of events related to sinkhole activity involves hodograms for wave polarisation analysis. The signal is recorded on three components, so it can be analysed as a vector and processed for particle motion analysis. Sinkhole-related event ‘B’ from Figure 2 was analysed for particle motion pattern (polarisation), showing a distinct East-West polarisation at low frequencies 0.1 Hz – 0.3 Hz (Figure 3). Automated hodogram analysis of the seismic events from January to August 2012 indicated 7 May 2012 as a date when the events first started to have a definite East-West polarisation as recorded on the station (Figure 3).
Polarisation analysis shows the onset of the East-West polarized events also at the beginning of May (Figure 6 and Figure 7).
The first reported indications of an incipient sinkhole occurred in May 2012. Precursor activities, including ground tremors and the formation of gas bubbles in surface waterways were documented between May and July 2012. Waveform classification (similarity analysis) algorithm and the hodogram (polarisation) analysis have been performed independently and in different frequency bandwidths. Both analyses show remarkably consistent results characteristic of the sinkhole-related seismic events starting to occur on 7 May 2012. East-West polarisation of the sinkhole-related seismic waveforms suggests that the most likely source for the events was movement along newly created faults associated with sinkhole development. Sinkhole-related seismic events were recorded at the seismometer station on 14 May 2012. The seismic activity that began during May 2012 continued and accelerated in strength until the sinkhole appeared at the surface in early August 2012.
The first human-perception reports of seismic events occurred on 8 June 2012. We believe that the seismic event felt by local residents and recorded by the station on 8 June 2012 was generated by movement from the underlying faults in the subsurface.
The recorded seismic events increased during June and July 2012. A marked increase in seismicity was recorded on 2 August 2012, the day prior to the formation of the sinkhole. Subsequent seismic activity continued between 8 June 2012 and the first observation of the sinkhole in early August.
Early warning of subsurface hazards like sinkholes can aid the public in relocation of people, infrastructure and facilities to aid in the mitigation of natural hazards due to karstification and ground water movement. Multi-component seismology applications are necessary in the detection of these natural hazards as we could not decipher the timing of sinkhole development from one-component (vertical) seismometers alone.
Guatemala in Central America has a history of geohazards related to sinkhole development in populated areas. Mechanisms include both karsting of near-surface carbonate formations and sinkhole development in volcanic tuff. Guatemala City is located on volcanic tuff. On 30 May 2010, a sinkhole 20 m in diameter and 90 m deep collapsed, swallowing a three-storey building. This subsidence occurred after a period of heavy rainfall. A similar sinkhole developed in Guatemala City in 2007. The city of Coban in north-central Guatemala had a sinkhole collapse after an extended period of rainfall in 2020. Coban is situated on the Ixcoy and Coban carbonate formations. Mechanism at the Coban site was classic carbonate karsting related to groundwater flow.
Geoscientists Without Borders (GWB) funded a project in Guatemala over the period 1 March 2022 to 31 August 2025. The project was titled ‘Increasing Natural Hazard Resiliency in Guatemala’. The objective was to augment the existing seismic array operated by Guatemala’s Instituto Nacional de Sismología, Vulcanología, Meteorología e Hidrología (INSIVUMEH). Twenty-one RaspberryShake 3C sensors and one Trillium 3C broadband sensor were deployed and integrated into the national INSIVUMEH network.
In November 2022, residents of Villa Nueva reported hearing low frequency noises and feeling vibrations in their homes and workplaces. Villa Nueva is a highly populated district located in southwest Guatemala City. INSIVUMEH staff, in conjunction with the GWB project team, deployed four of the RaspberryShake 3C sensors in an effort to gather data related to possible sinkhole development. The four sensors were deployed in a rectangular array approximately 2000 m east-west dimension and 1000m north-south. Data were recorded between 28 December 2022 to 15 March 2023. Three sensors of the were deployed elsewhere in the regional seismic array after 15 March but one station remained deployed and continues to record 3C data
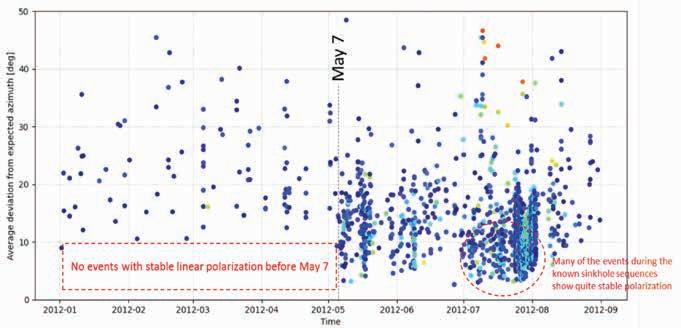
Figure 7 All events detected before 7 May don’t show the stable linear polarisation that is characteristic for many of the sinkhole events.
in Villa Nueva as of December 2025. In addition to the four sensors, there are approximately six regional 3C seismometers located within 100 km of Villa Nueva as part of the INSIVUMEH national seismic network.
Analysis of the data will be challenging due to low signal-to-noise ratio. Villa Nueva is densely populated with residential homes, office buildings, light manufacturing, and associated private and commercial traffic. Ambient noise level is high. As in the prior portion of this paper, we plan a two-fold approach.
• Analyse the data to detect small magnitude, small time duration events associated with subsurface collapse.
• Use 3C polarisation analysis to discern near-surface stress changes associated with subsidence as a precursor to collapse.
We will also make an effort to use natural earthquakes as sources to estimate the multicomponent receiver function over time at the four sensor locations. Approximately 180-250 earthquakes were recorded over this time period due to an earthquake swarm located 100 km southeast of Villa Nueva.
As of December 2025, there has been no sinkhole collapse in Villa Nueva.
The authors would like to thank Marc Lambert for in-depth hodogram analysis.
EarthScope Project. http://www.usarray.org/researchers/pubs#ta (last accessed December 2025).
Ford, S.R. and Dreger, D.S. [2020]. Pre-Sinkhole Seismicity at the Napoleonville Salt Dome: Implications for Local Seismic Monitoring of Underground Caverns. Seismol. Res. Lett., 91, 1672-1678, doi: 10.1785/0220190224.
Nayak, A. and Dreger, D.S. [2018]. Source inversion of seismic events associated with the sinkhole at Napoleonville salt dome, Louisiana using a 3-D velocity model. Geophysical Journal International, 214(3), 1808-1829, https://doi.org/10.1093/gji/ggy202.
The Louisiana Department of Energy and Natural Resources. [2013]. Blue Ribbon Commission Initial Technical Briefing, Louisiana State University, 3 April 2013, available at https://denr.louisiana.gov/page/ bc-public-briefings (last accessed November 2025).
USArray. [n.d.]. Retrieved from EarthScope’s USArray Transportable Array: http://www.usarray.org/files/docs/pubs/L48_TA_Report/ TA_L48_high-res.pdf (last accessed December 2025).


Abstract submission is open for the Sixth EAGE Workshop on Naturally Fractured Rocks, taking place 25–27 October 2026 in Al Khobar, Saudi Arabia.


Share your latest research , case studies, and practical insights on fractured reservoirs with an international audience of experts . Contribute to the technical discussions shaping best practices and innovation in naturally fractured rock characterization and development.
Abstract Submission Deadline: 30 April 2026


your Abstract!

Samuel Cheyney1*, Ross Smail1,
Catherine Hill1 and John Clark1 supply a model with a set of known locations where geological conditions are known to be favourable for either geothermal energy, or mineral exploration. An algorithm learns the key relationships between input datasets at these locations, enabling the prediction of areas where similar potentially undiscovered resources may exist.
Mapping the spatial distribution of the Earth’s natural resources is critical to energy security and for identifying the resources required for the energy transition. Resources such as hydrocarbons, copper, lithium, hydrogen and geothermal energy are often explored by using suites of geological and geophysical data. Machine learning (ML) is transforming the way geological interpretations are conducted by enabling more efficient, accurate, and scalable analysis, extracting patterns and interpretations from combinations of datasets. Its uses have been demonstrated in geological mapping, seismic interpretation, mineral exploration, as well as environmental and engineering applications (see e.g. Cracknell & Reading (2014), Li et al., (2019), Rodriguez-Galiano et al., (2015), Baghbani et al., (2022) respectively).
Forest-based regression techniques have been successfully used to map global surface heat flow in areas away from well and probe measurements (Webb et al., 2024). By understanding the geological and geophysical factors that contribute to heat flow we can generate a database of explanatory variables that might contribute to surface heat flow. Large crustal scale and smaller local-scale variations make it challenging to correlate individual variables with heat flow. Therefore, a multivariate, ML-based approach is sensible.
Alternatively, ML approaches can focus on whether the conditions found at a known location, for a particular resource, are replicated elsewhere. Here we supply the model with a set of known locations where a certain occurrence is present, and a broader suite of potentially influential explanatory variables. The algorithm then identifies the key relationships between inputs that help to predict where similar variable combinations — and thus potentially undiscovered occurrences — may exist.
Presence-only prediction is an ML technique that uses a maximum entropy method to predict the probability of an occurrence being present at a certain location. The maximum entropy method in machine learning is a way of estimating the most unbiased probability distribution possible, given only the information we
1 Getech
* Corresponding author, E-mail: samuel.cheyney@getech.com
DOI: 10.3997/1365-2397.fb2026012
actually know. The method was originally developed to model ecological species distribution (Phillips et al., 2006). In that instance there are known geographical locations where species can be observed as being present, but it is not possible to state that there are absence locations with 100% certainty just because species have not been observed yet. The fact that it is not required to provide the model with absence locations (i.e. locations where the occurrence is definitely known not to exist) is seen as a strength of the approach. This makes it ideal for applying to scenarios such as mineral exploration, where ground truth information may be limited in under-explored areas.
The Presence-only prediction modelling is based on training data (hereafter ‘occurrence locations’), which details locations where the presence has already been proven (such as proven mineral deposits, or active geothermal resource exploitation), and a series of explanatory variables. The relationship between the explanatory variables at the occurrence location is used to devise the model which is subsequently used to predict the probability of the presence at locations away from the original training points.
The study area is discretised into a series of background points, where the possibility of presence is possible, but unknown. Absence is not assumed in any location across the study area and the method compares the values of the explanatory variables at each occurrence location. The various datasets undergo data preparation, explanatory variable transformation, output data preparation, and model validation.
A simple application of Presence-only prediction for geothermal prospectivity is demonstrated below (Figure 1). The model has been trained on global occurrence locations of existing geothermal power plants (Figure 2). Data from Getech’s Globe product included subsurface temperatures, structural interpretations, sediment thickness, crustal types mapping and thickness, and Getech’s global databases of gravity and magnetic data. Some of the explanatory variables require preparation to make them more
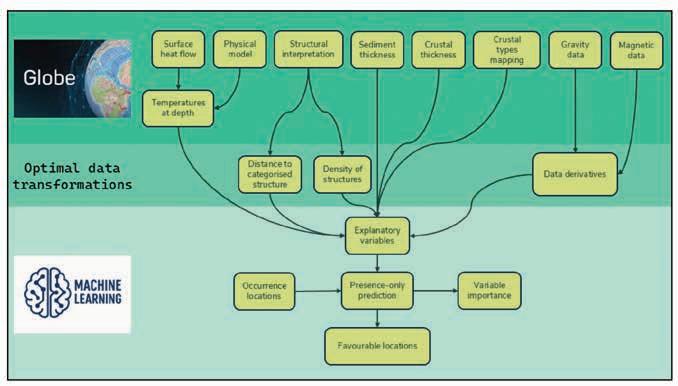
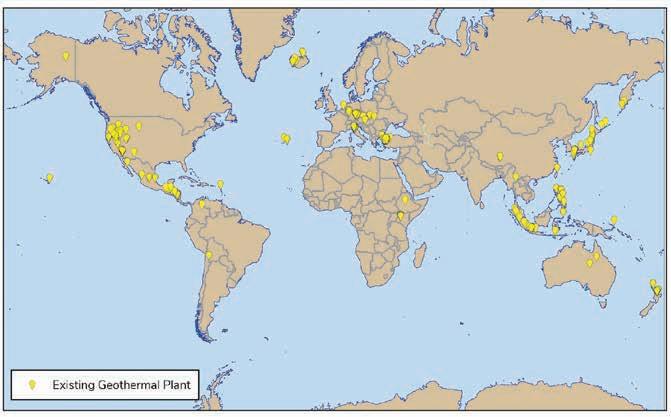
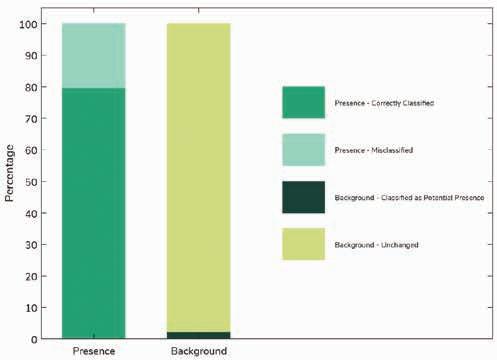
suitable for having a higher influence on the presence/absence of occurrence locations. For the structural interpretation this involved calculating the lateral distance to the nearest structure of each individual category, in order to test whether proximity to major structures differed from minor structures. For the gravity and magnetic data, advanced derivatives were calculated focusing
on the local phase and variability as opposed to the full waveform anomalies.
The statistical success of the prediction is related to the threshold applied, which relates to the amount of the unknown area that will be flagged as having the potential for presence. Care must be taken to limit the amount of the unknown areas that are flagged as having the potential for an occurrence, so that the result remains realistic and ranked based on the most likely locations for success. For example, here any prediction over a threshold of 0.5 is declared as the potential for presence. This results in a model that can successfully predict the locations of the training points for over 80% of the occurrence locations (Figure 3). Lowering the threshold would increase this percentage of the occurrence locations being successfully identified by the model, but at the expense of more of the unknown areas being flagged as having potential for presence.
The influence of the explanatory variables on the final model can be analysed by looking at the response curves (Figure 4). Each curve shows the effect that changing the values in each explanatory variable has on the presence probability, while keeping all other factors the same. Response curves that show a flat line have little predictive power to indicate the likelihood of a presence occurring. All other curve types show a relationship between that variable and the presence of the known features.
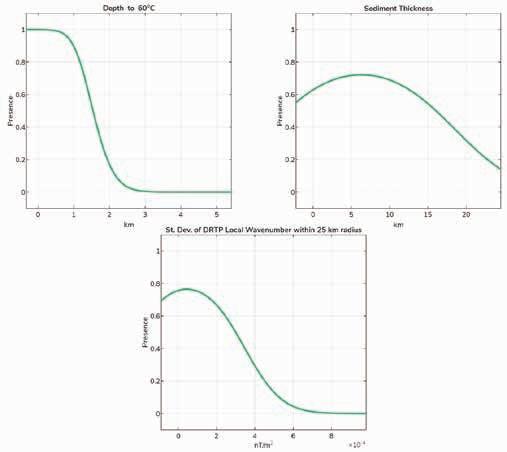
The resulting model shows which areas have explanatory variables similar to those observed at the training locations (known geothermal plants) and therefore highlights areas which are likely to be favourable for geothermal exploration (Figure 5). As expected, some of these areas classified as having high potential for geothermal exploration are proximal to the locations of the training data, yet others are located far from any known geothermal plant.
Figure 6 shows that in New Zealand high probability of presence is mapped around the Taupo volcanic zone where existing plants are present, but also along the Alpine Fault and other localities on South Island. In the UK, where no training data were present, favourable locations were mapped in Cornwall where the Eden Geothermal Project is active (but not included in the training data) and in the NW of England where several geothermal feasibility projects are currently being conducted.
Getech has also been utilising Presence-only prediction for proprietary mineral exploration studies, notably in areas of
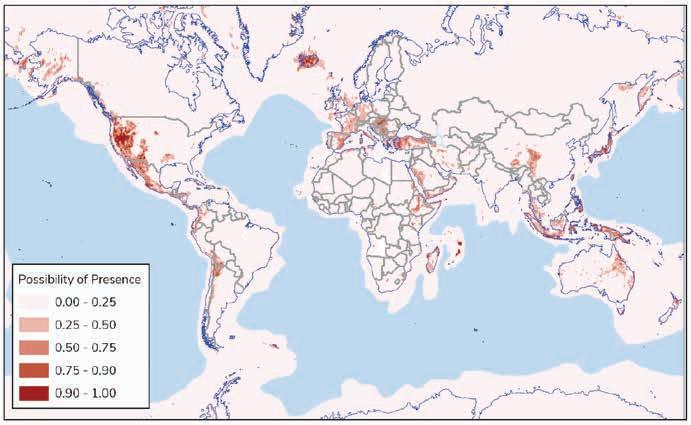
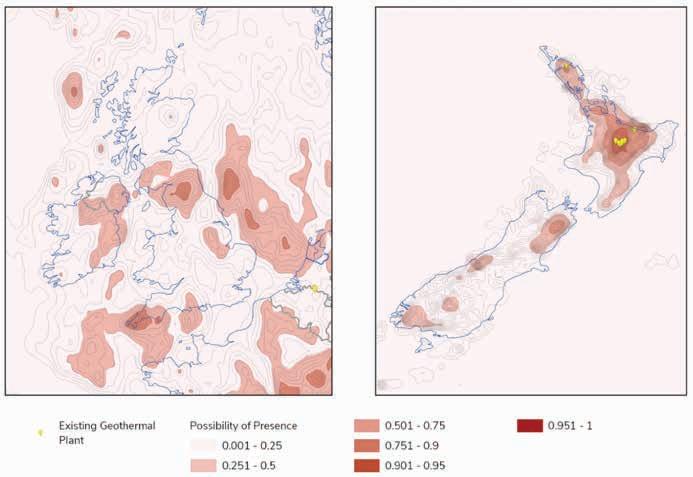
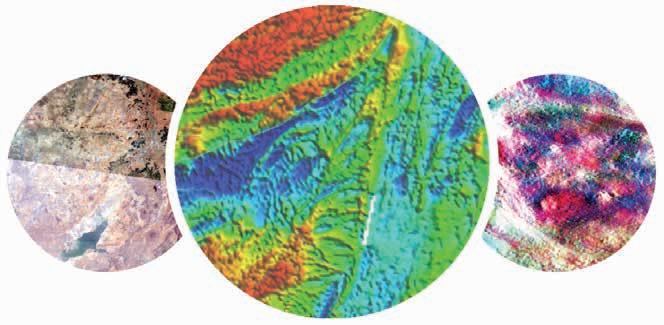
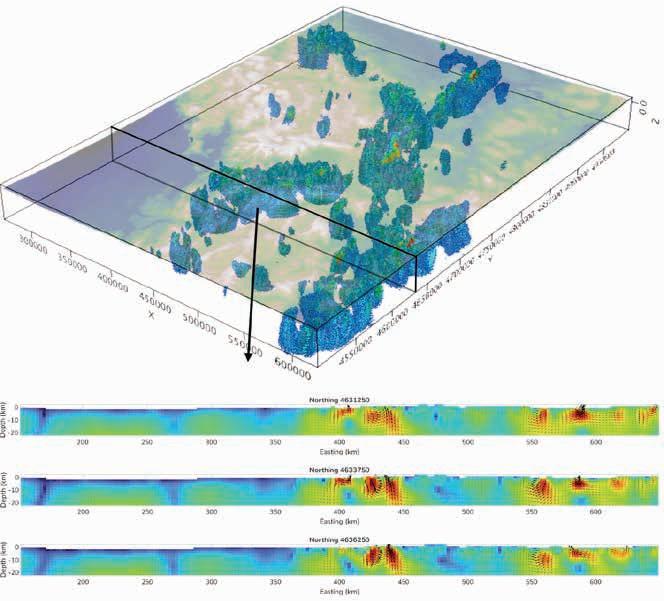
magmatic arcs, and fold and thrust belts. In these projects a range of mineral systems were analysed using training data from known discoveries, and the explanatory datasets were expanded to include remote-sensing data alongside Getech’s Globe product and potential fields datasets (Figure 7). Advanced Spaceborne Thermal Emission and Reflection Radiometer (ASTER) data were processed and levelled for each of the 14 wavelength bands, and 27 derived mineral indices. Sub-surface data were enhanced by conducting voxel-based inversion including 3D magnetic vector inversion (MVI) to model the amplitude and direction of magnetisation at depth (Figure 8). In total ninety-seven variables were used as explanatory variables in each of the models.
The same explanatory variables were used to model three different mineral systems, with the ML placing different weightings on each explanatory variable depending on its use for detecting favourable conditions for each. This powerful technique provides insights into geographical areas where multiple data show correlations similar to those observed at identified
Figure 7 Additional explanatory variables for mineral exploration, including Landsat (left), ASTER (centre) and radiometric data (right).
Figure 8 Example of an MVI model showing the 3D distribution of magnetisation. Depth slices from these types of models provided important sub-surface explanatory variables.
mineral systems, but also gives insight into which variables are the main influences on the prediction allowing a better understanding of the key datasets supporting the discovery of future mineral deposits. The studies correlated well with areas that had independently been identified for future exploration potential, as well as highlighting previously unconsidered locations that may have high potential.
Machine learning is becoming a powerful tool in a range of applications, including geoscience. The ability to integrate multiple datasets that cannot be directly linked through a physics-based approach, and to optimise the recognition of patterns between them without user bias has a wide range of applications, particularly in geological resource identification.
At Getech we have utilised remote-sensing and subsurface datasets from regional and local scales to provide predictions for presence of geothermal potential and mineral prospectivity.
This shows the broad range of applications that are likely to expand to other fields such as natural hydrogen. This approach is likely to complement traditional play-based exploration methodologies, and the incorporation of expert knowledge should not be overlooked (Davies et al., 2025), but critically these methods also provide feedback on the importance of different data sets to the successful identification of targets, which can help to guide future data collection and exploration strategies.
References
Baghbani, A., Choudhury, T., Costa, S. and Reiner, J. [2022]. Application of artificial intelligence in geotechnical engineering: A state-of-theart review. Earth-Science Reviews, 228, 103991.
Cracknell, M.J. and Reading, A.M. [2014]. Geological mapping using remote sensing data: A comparison of five machine learning algorithms, their response to variations in the spatial distribution of training data and the use of explicit spatial information. Computers & Geosciences, 63, 22-33.
Davies, R.S., Trott, M., Georgi, J. and Farrar, A. [2025]. Artificial intelligence and machine learning to enhance critical mineral deposit discovery. Geosystems and Geoenvironment, 4(2), 100361.
Li, D., Peng, S., Lu, Y., Guo, Y., Cui, X. 2019. Seismic structure interpretation based on machine learning: A case study in coal mining. Interpretation, 7(3) SE69-79.
Phillips, S.J., Anderson, R.P. and Schapire, R.E. [2006]. Maximum entropy modeling of species geographic distributions. Ecological Modelling, 190, 231-259.
Rodriguez-Galiano, V., Sanchez-Castillo, M., Chica-Olmo, M. and Chica-Rivas, M. [2015]. Machine learning predictive models for mineral prospectivity: An evaluation of neural networks, random forest, regression trees and support vector machines. Ore Geology Reviews, 71, 804-818.
Webb, P., Cheyney, S., Masterton, S. and Green, C. [2024]. Predicting Heat Flow for Resource Exploration Using Random Forest Regression. Artificial Intelligence for Geological Modelling and Mapping Conference, Proceedings


Ciaran Collins1* and Abdulqadir Cader1 present an integrated fault interpretation workflow using multiple 3D deep learning convolutional neural networks optimised to detect different fault expressions in seismic data and enabling a robust and comprehensive understanding of subsurface structure for well planning.
Introduction
Accurate fault interpretation remains a critical component of subsurface characterisation, particularly in structurally complex settings where fault presence and geometry directly influence well placement and reservoir performance. Traditional workflows, while trusted, are slow and often subjective, especially when imaging is poor or faults exhibit subtle displacement. In challenging structural settings (e.g. Figure 1) even small errors in fault geometry can lead to costly surprises during drilling.
Over the course of hundreds of client-led projects, we routinely observe that within a single study area, fault populations exist across a wide range of styles and expressions. Simply, any given dataset has a multitude of fault characteristics. While this is a somewhat obvious statement, this is where the implications of applying artificial intelligence (AI) workflows and techniques become nuanced.
For context, AI refers to computational systems designed to learn patterns from data and make predictions without being explicitly programmed for each task. In seismic interpretation, this capability is commonly realised through deep learning image-recognition architectures, particularly convolutional neural networks (CNNs), which were originally developed for computer vision applications such as object identification in
photographs (Rawat & Wang, 2017). CNNs learn spatial patterns and contextual relationships within images, and when applied to seismic data they treat the volume as a 3D image, identifying discontinuities that resemble geological faults (Garcia et al. 2022). Training these models involves exposing them to large numbers of labelled examples, allowing the network to iteratively learn the characteristic signatures of faults; in practice this includes interpreted fault sticks from real seismic datasets as well as synthetic models designed to capture a range of structural styles and data qualities. Pre-trained networks build on this process by being trained in advance on large, diverse datasets and optimised for fault detection, offering clear advantages over user-trained models by reducing the need for extensive local training. This accelerates deployment, and provides more robust and consistent predictions, particularly in areas where labelled data are sparse or difficult to interpret confidently.
In this article, a multi-network workflow is presented as a best practise solution. Each AI fault network produces a fault confidence volume (Han & Cader, 2020) representing the similarity to training data and thus, likelihood of fault presence at and around each voxel. Fault confidence volumes can be corroborated with traditional edge attribute workflows and mathematically combined to produce an optimised fault model (Williams et al.
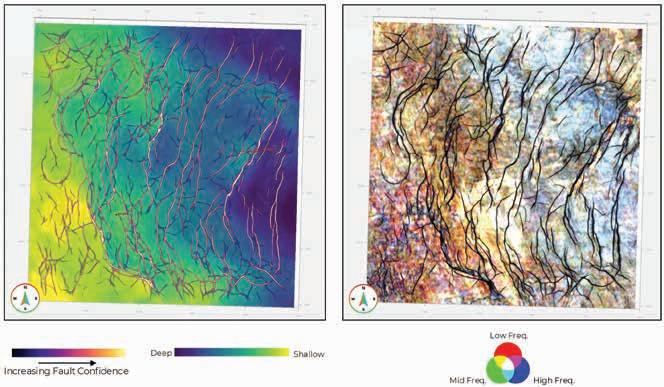
1 Geoteric
* Corresponding author, E-mail: Ciaran.collins@geoteric.com
DOI: 10.3997/1365-2397.fb2026013
Figure 1 Left: Combined and optimised AI fault confidence volume over a TWT map along the Balder Fm. Right: High-definition frequency decomposition colour blend (Eckersley et al. 2018) and optimised AI fault confidence volume. Note how some frequency responses are structurally bound.
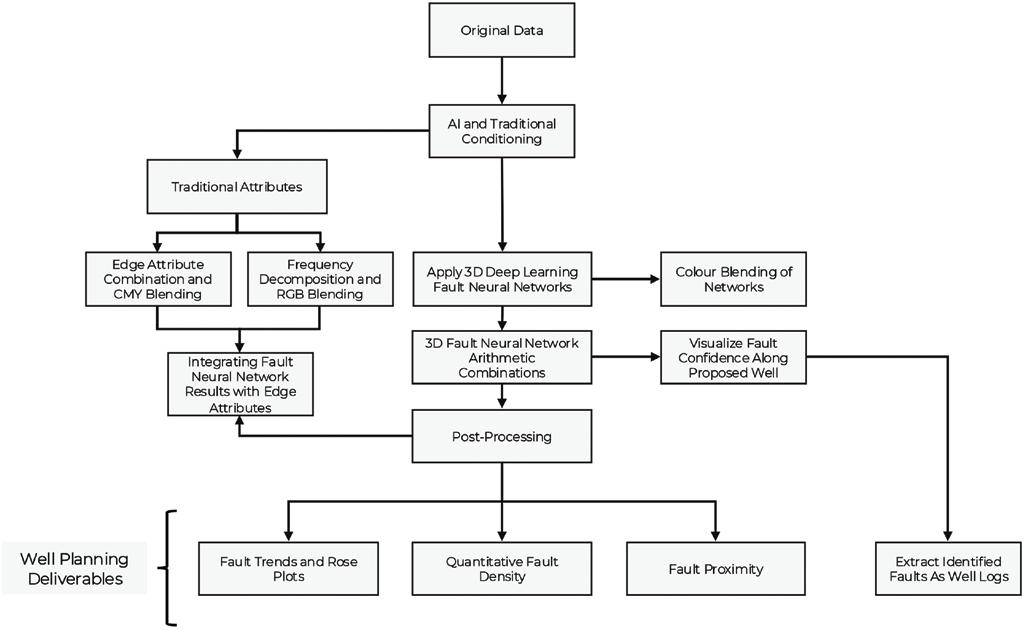
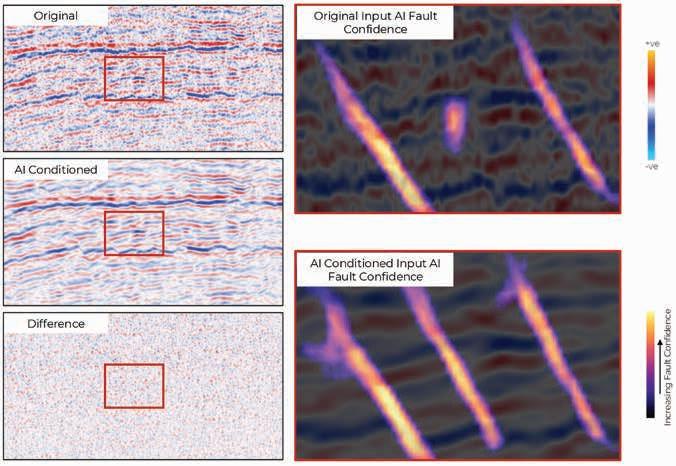
2024). By combining the outputs of several independently trained AI fault networks, of which each are optimised to detect different fault expressions – ranging from subtle discontinuities to largescale structural breaks – a more comprehensive and robust understanding of subsurface structure for well planning can be determined.
The objective of the workflow is to generate a suite of complementary deliverables – fault confidence volumes and logs, edge attributes, and derived post-processing structural products – that can be integrated and cross-validated. By building this body of evidence, interpreters can approach each decision with confidence,
3 Original input data, processed AI noise suppression with computation difference with corresponding AI Fault prediction results highlighting an uplift on processed data.
knowing that the information is consistent and geologically coherent, reducing uncertainty and supporting well planning.
The workflow, summarised in the accompanying flow diagram (Figure 2), begins with data conditioning, to processing multiple AI fault models, mathematical combination of model results, post-processing, derivative attribute analysis, until well visualisation and creation of key well planning deliverables (in the form of volumes and well logs) have been extracted. Integration and QA/QC of each volume produced
throughout the workflow is done before any decision can be made.
Resulting fault predictions are highly susceptible to the character and nature of input data. While some pretrained fault networks may be optimised for noisy or attenuated data, others, will be tuned differently. It is important then, to consider the optimal conditioning which aligns to desired fault objectives and applied AI fault networks. AI conditioning is optimally placed to undertake this task, as conditioning can be simple denoising of input data or complex image processing to best support further AI operations.
In general terms, AI fault detection models work best when using noise-supressed input data, as both random and coherent noise can obscure structural detail, making fault detection uncertain. The workflow begins by applying an AI seismic noise attenuation model which has been trained to detect and suppress random and coherent noise whilst improving reflector continuity and signal-to-noise ratio. This provides a cleaner and more geologically representative image for AI structural analysis, helping to reduce uncertainty and increase confidence in multi-network AI outputs (Figure 3).
Compared to traditional edge attributes, 3D CNNs exhibit substantial improvements in accurately distinguishing faults from non-fault related edges (stratigraphic or noise). To capture the full spectrum of fault geometries and facilitate integration into a multi-network interpretation workflow, outputs from individual
3D CNN models were combined using arithmetic techniques, including maximum and product operations (Figure 4). This approach yields a consolidated multi-network fault volume that enhances structural continuity and interpretational confidence.
The RGB blend in Figure 5 shows that in the Eocene, where faulting is dominantly polygonal, Network 1 (red) and Network 3 (blue) delineate a greater number of faults compared to Network 2. At the Top Balder Formation, seismic quality is such that fault breaks are well resolved and unambiguously apparent compared to the background, meaning that all 3 networks agree in most cases, producing an RGB response in white. In contrast, at the Top Tor Formation, fault character is variable and more complex, leading to poorer identification of fault breaks, and a wide variety of discrete colour responses with reduced overlap or agreement between all 3 networks. A reasonable conclusion then is that, where seismic quality is excellent and/or there is only a single characteristic style of faulting, a sensible fault model can be produced using results from only a single AI network model. In comparison, where seismic quality diminishes, or the structural style and fault character becomes more complex, a multi-network model will produce better results by accounting for the variability in each network’s ability to identify faults of varying seismic character, thereby ensuring that faults not visible to a single network are still captured in the final interpretation.
When considering variable AI fault model responses, the obvious challenge facing an interpreter is in answering ‘which model is best, and why?’ One potential solution is to apply
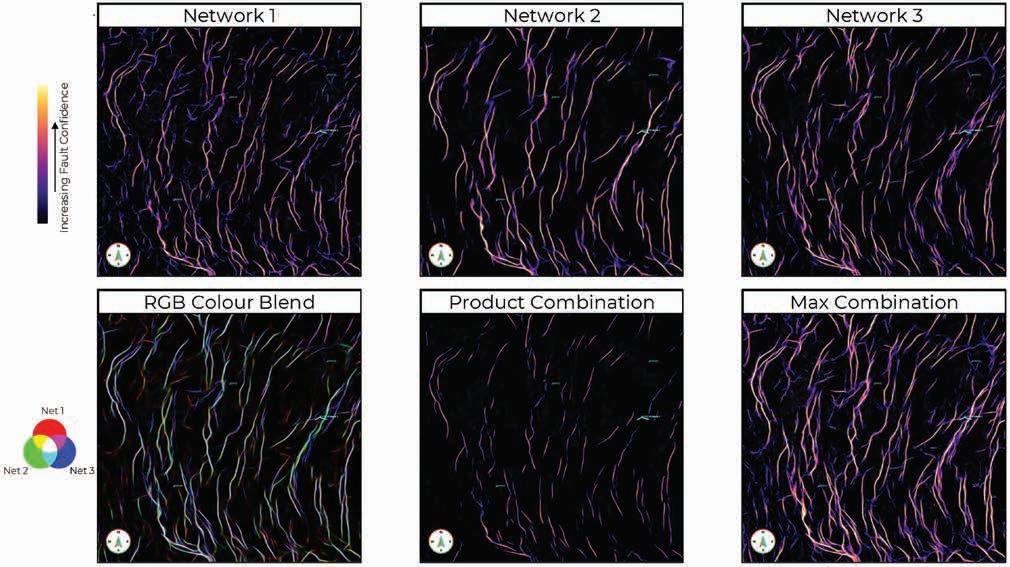
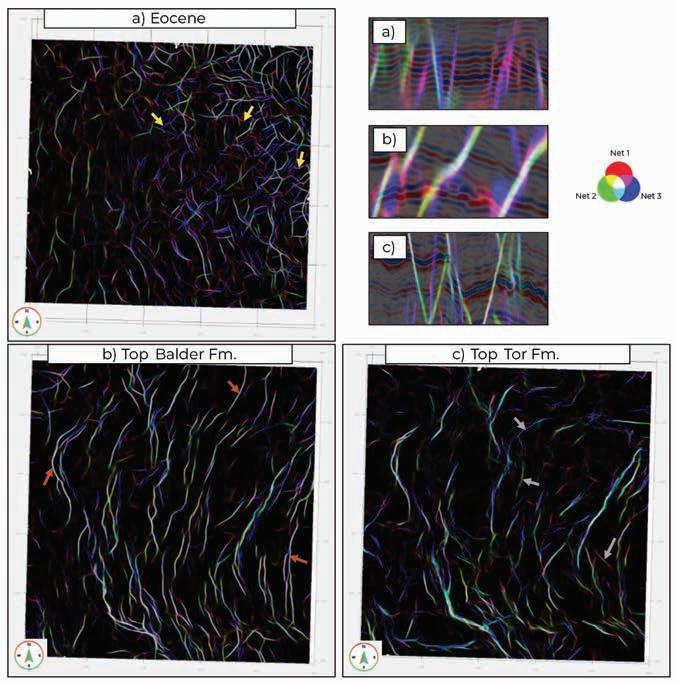
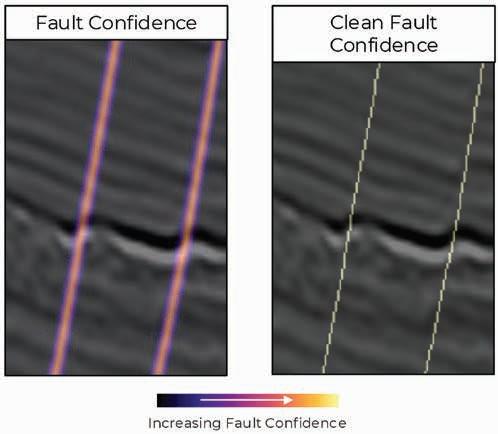
mathematical combinations of the different AI fault network outputs. The first combination is a product (multiplicative) combination, which emphasises agreement between networks, retaining only those fault responses that are consistently identified by all models. As a result, the resulting volume is typically clean and low in false positives, enabling high-confidence interpretation where structural certainty is critical. However, this conservatism can also be a limitation, as faults detected by only one or two out of three
Figure 5 RGB blend of Network 1 (red), Network 2 (green), and Network 3 (blue) along three different stratigraphic intervals. In the Eocene (a), faulting is primarily polygonal and fault patterns are best delineated by Network 1 and Network 3, indicated by yellow arrows. At the Top Balder Formation (b), all three fault network responses are primarily in agreement (white), indicated by orange arrows. At the Top Tor Formation (c), fault character is highly variable (grey arrows), leading to poorer agreement between three fault networks and more variation in results between the different network model results.
networks will be suppressed entirely, potentially undermining the intent of a multi-network workflow by removing valid but subtle or atypical fault expressions. In this sense, the product combination decides on behalf of the interpreter, prioritising confidence over completeness. In contrast, a maximum combination aggregates the strongest response from each network, producing a dense and highly detailed fault volume that captures the full range of fault expressions present across the models. While this approach is more inclusive and better suited to exploring structural complexity, it is also more prone to false positives and therefore carries higher interpretational risk if used in isolation.
As such, both combination strategies require rigorous manual QA and QC, with subsequent stages of the workflow focusing on integrating these results alongside seismic reflectivity, frequency decomposition blends, edge attributes, and derivative fault attributes to ensure geological plausibility and informed, interpreter-led modelling.
Post-processing is a critical step in structural interpretation for well planning because it converts fault confidence volumes into discrete single-voxel faults with associated confidence values (Figure 6). From these, we can derive useful products such as fault trends and dip, fault density, proximity volumes, and fault surfaces/sticks, which are powerful derivatives for analysis and interpretation.
Once thinned, the next step is visualising final fault delineations within the geological context by integrating single-voxel fault geometries into seismic reflectivity and edge attribute
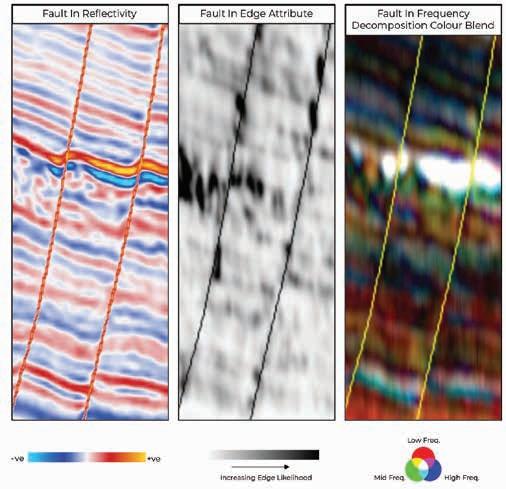
Figure 7 Single-voxel fault results embedded into seismic reflectivity, edge attribute (SO Semblance), and a high-definition frequency decomposition colour blend.
volumes to quality control results. Single voxel fault geometries were also embedded into frequency decomposition colour blends to ensure agreement between both structure and stratigraphy (Figure 7) further increasing interpreter confidence in AI model outputs.
Fault trend and dip analysis provides interpreters with a clear view of fault orientation across the seismic volume. These orientations are derived from post-processed single-voxel fault geometries and can be visualised using rose diagrams to reveal dominant structural patterns. Understanding these trends is critical because fault orientation influences compartmentalisation, pressure communication, and drilling risk. With data in an analytical domain, it is also possible to filter fault planes by orientation and model each result to isolate predictive fault sets most relevant to the field’s geomechanical and stratigraphic context, i.e. whether those orientations are known (from core, image logs, or regional stress studies) to be open, closed, or acting as baffles (Garcia et al. 2021). In practice, this lets teams prioritise monitoring and mitigation around the orientations most likely to impact well performance, while de-emphasising those that are less critical in the present geological regime (Figure 8).
Single-voxel outputs show where faults are predicted, but they don’t convey the broader structural context, which makes it hard to assess how faulting varies across the reservoir, whether an area is structurally complex or relatively stable, and the cumulative impact of faults on well trajectory planning and reservoir connectivity. Fault density maps aim to better visualise the intensity and complexity of faulting across a seismic volume, enabling engineers to mitigate risk when drilling within structurally complex corridors (Figure 9).
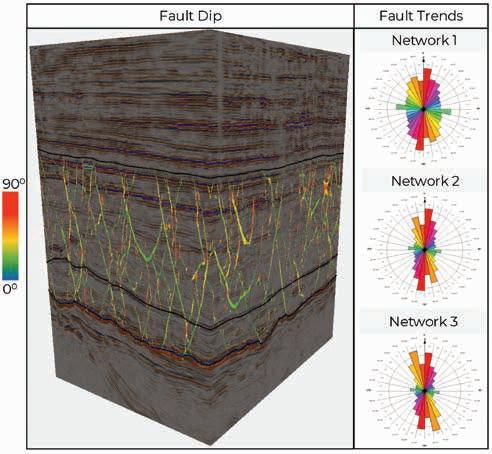
Figure 8 Fault dip values (left) visualised along the corresponding seismic reflectivity volume. Fault trends rose diagrams for three different 3D CNN models (right) highlighting the variability in the dominant orientation and trends between different network models. Most notably, Network 1 provides a comprehensive fault result, identifying a greater number of E-W trending faults in comparison to Network 2 and Network 3. Network 3 has improved clarity in delineating a greater number of faults trending NW-SE compared to Network 1 and Network 2.
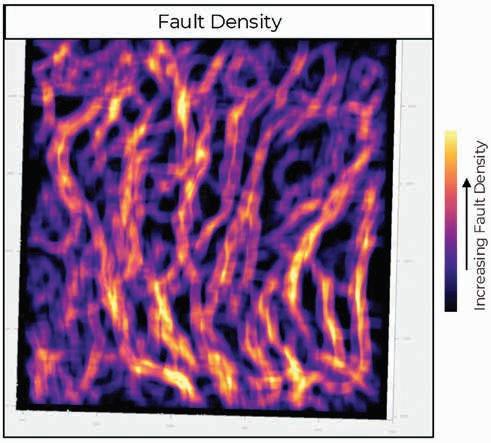
Figure 9 Fault density map of combined AI fault confidence volume showing the cumulative impact of faulting across the volume, highlighting regions of dense vs. sparse faulting. Hot zones show regions of high fault density, with cooler zones being relatively fault sparse.
Up to this point, fault density maps have helped to visualise structural complexity, but they do not quantify the actual number or character of faults. Quantitative fault density (Figure 10) represents the first step toward true fault characterisation – providing an objective measurement of both fault count and intensity. This shift from qualitative visualisation to quantitative analysis enables interpreters to move beyond ‘where faults occur’ and begin answering ‘how many, how dense, and what does that mean for well planning?’ This allows interpreters to distinguish between areas dominated by a single
major fault and zones containing multiple smaller faults, which may pose greater operational risk. By introducing a measurable, data-driven approach to fault complexity, quantitative fault density reduces uncertainty and delivers actionable insights for safer, more efficient drilling decisions.
Even with detailed fault interpretation, one critical question often remains unanswered: ‘How close is my well path to a fault?’ Fault proximity takes the single-voxel combined AI fault volume and calculates the 3D distance each voxel is to the nearest fault (Figure 11). This highlights areas that are far from seismically resolvable faults and fractures versus those located near such features (Szafian, 2015). For drilling, proximity maps help to identify zones where well trajectories may intersect fault corridors, allowing engineers to adjust paths or casing programs to mitigate risks such as wellbore instability or fluid migration. By converting complex structural geometry into a continuous dis-
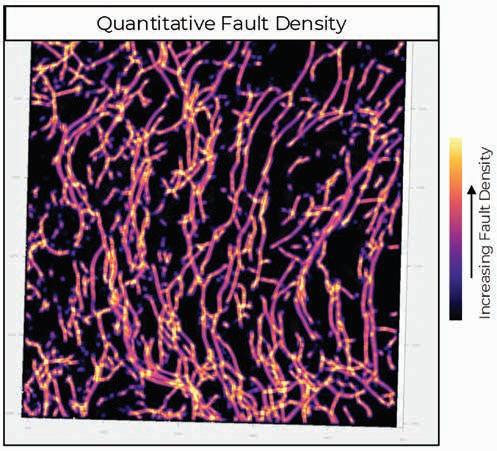
10 Quantitative fault density map of combined AI fault confidence volume. The result gives us a percentage of fractures and faults within a given analysis window around every voxel (Szafian, 2015), with a higher percentage of fractures/ faults in hot colours, and a low percentage of fractures/faults in cool colours.
tance attribute, fault proximity provides a practical, quantitative layer for risk assessment and integration into geomechanical or simulation workflows.
To support interpretability and sense check AI workflows, it is vital that the interpreter uses non-AI techniques and established best practice for baseline QA and QC. Here, a suite of edge attributes was generated from the input data and combined to produce an averaged attribute map of structural discontinuities, or edge likelihood (Figure 12). These attributes, sensitive to changes in amplitude, phase and dip, provide a qualitative visualisation of the various fault expressions within the seismic data (Williams et al. 2020). However, these attributes are susceptible to delineating non-fault related edges such as noise (Marfurt & Alves, 2015). Processed or merged multi-network fault models, with each component optimised to highlight faults with varying characteristics, can still be quality controlled by traditional edge
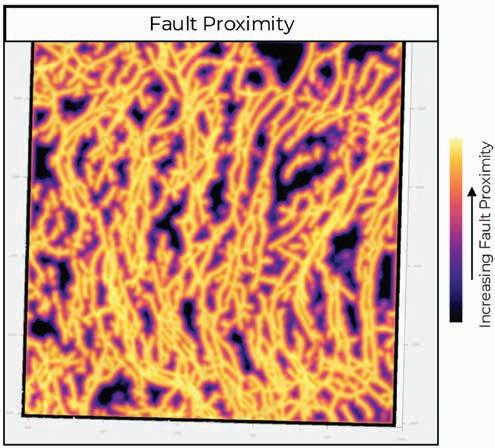
Figure 11 Fault proximity map of combined AI fault confidence volume. The fault proximity attribute calculates how far, in 3D, the non-fault voxels are from a fault. Here, cooler colours are farthest from a fault, and regions close to a fault are displayed in hotter colours.
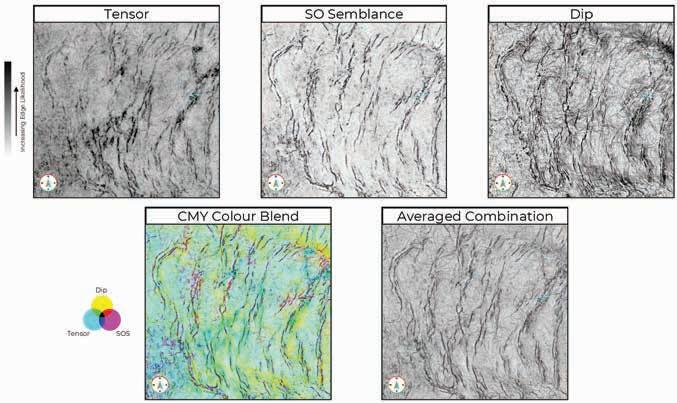
Figure 12 Traditional seismic edge attributes, such as Tensor, Structurally Oriented (SO) Semblance, and Dip, provide interpreters with a representation of structural discontinuities. These can be blended as a CMY Colour Blend (Purves and Basford 2011) or mathematically combined to produce an average combination volume. The blended and combined volumes can be used for QA by comparing independent and trusted edge attribute combinations with the multi-network model deliverables such as AI fault confidence.
attributes and frequency decomposition, which remain trusted by seismic interpreters, to produce a robust and confident fault interpretation to aid in well planning by balancing proven methodologies (e.g. edge attributes) with advanced machine learning techniques (Figure 13).
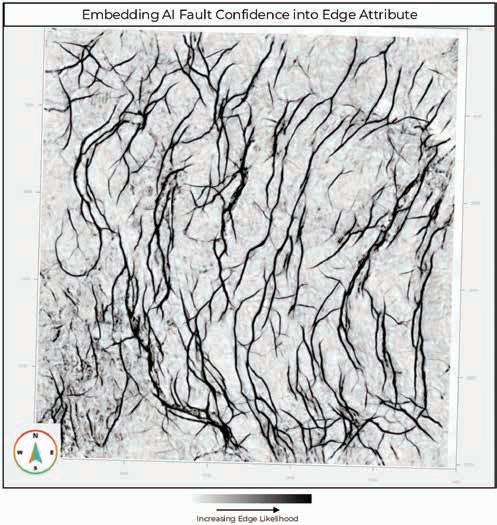
Figure 13 Combined and optimised AI fault confidence volume embedded in an edge attribute volume. This is done to ensure agreement between the traditional, trusted, and independent edge attributes with the results of multiple pre-trained 3D CNNs.
Visualisation is a critical step in turning AI fault predictions into actionable insights for well planning. By plotting fault confidence logs from multiple AI networks along proposed well paths, interpreters can quickly see which networks predict faults at specific depths and which do not (Figure 14). Viewing these results side by side in a single window enables rapid comparison, helping to identify intervals where at least one network flags a potential fault.
Once a potential intersection is identified, interpreters can interrogate the data in detail – examining confidence values, fault trend, and dip – to confirm geological plausibility and assess drilling risk. To streamline this process, fault confidence values, or derivative fault attributes e.g. fault proximity, results can be extracted as volume logs along the proposed trajectory and colour-coded by confidence level (Figure 15).
Beyond planning, these fault model logs can be integrated into reservoir modelling software or used during drilling operations. For example, in logging while drilling (LWD), extracted fault/property logs help to predict when a well is approaching a fault, enabling proactive decisions such as deviating to a safer location. In addition, fault proximity logs extracted along well paths can add additional information in knowing how close you are to a fault at any given point. This integration of AI-derived fault interpretation into well planning and real-time drilling workflows reduces uncertainty, mitigates operational risk, and supports more informed decision-making.
The integration of multiple, 3D AI fault networks with traditional seismic interpretation and advanced fault attribute
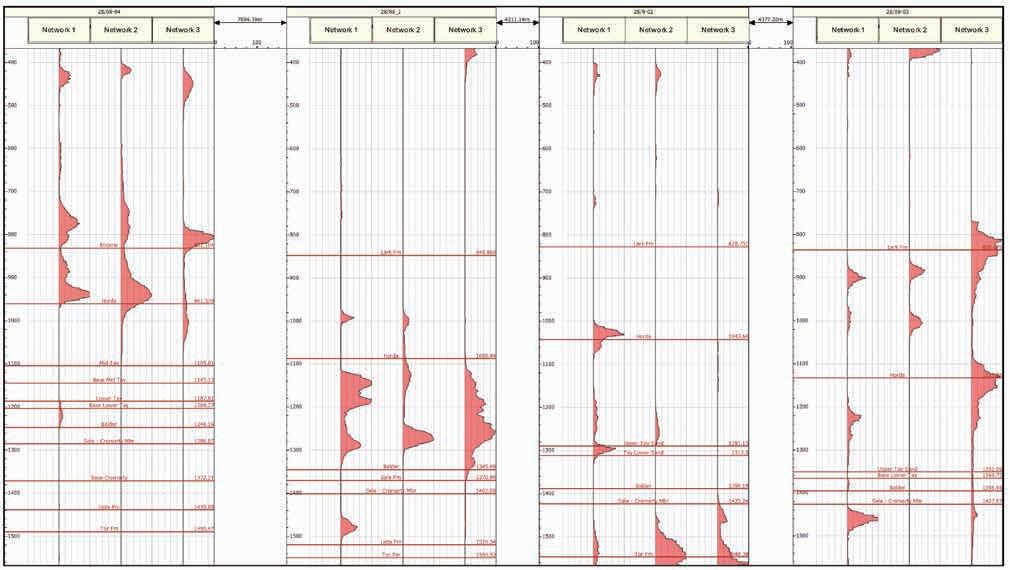
Figure 14 Fault confidence logs from three pre-trained deep learning networks plotted along four well trajectories. The X-axis represents fault confidence values for each network, while the Y-axis corresponds to depth. This visualisation enables interpreters to assess potential drilling hazards by identifying intervals where the proposed well path intersects predicted faults. By comparing confidence levels across multiple networks, interpreters can evaluate consensus, quantify uncertainty, and determine whether identified faults require mitigation during well planning.
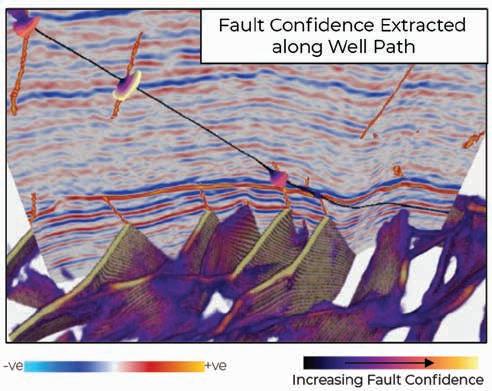
techniques offers a powerful approach to reducing structural uncertainty and de-risking well planning. We have shown that in scenarios where fault character and style is complex, a multi-network workflow will allow for more robust risk analysis along proposed well paths. The ability to leverage the complementary strengths of many diverse 3D deep learning CNNs and advanced attribute workflows moves us from a ‘one size fits all’ network model, and progresses towards multi-network, integrated, geoscience workflows. The ability to quantify fault confidence and assess structural risk along well trajectories represents a significant advancement in data-driven geoscience interpretation and supports more informed, lower-risk drilling decisions.
Acknowledgements
Data courtesy of Geoscience Australia and UK North Sea Transition Authority. Results were generated using Geoteric software.
References
Eckersley, A.J., Lowell, J. and Szafian, P. [2018]. High-definition frequency decomposition. Geophysical Prospecting, 66(6), 1138-1143. https:// doi.org/10.1111/1365-2478.12642.
Garcia, H.M., “Woody” Leel, Jr. W.G., Riehle, M. and Szafian, P. [2021]. Incorporating artificial intelligence into traditional exploration workflows in the Cooper-Eromanga basin, South Australia. AAPG Datapages/Archives. https://archives.datapages.com/data/international-meeting-for-applied-geoscience-and-energy/data/2021/7006.htm.
Garcia, H.M., Szafian, P., Han, C., Williams, R., and Lowell, J. [2022]. Convolutional neural networks for fault interpretation – case study examples around the world. Advances in Subsurface Data Analytics, 6, 141-164. https://doi.org/10.1016/B978-0-12-822295-9.00005-4.
Han, C. and Cader, A. [2020]. Interpretational applications of artificial intelligence-based seismic fault delineation. First Break, 38(3), 63-71. https://doi.org/10.3997/1365-2397.fb2020020.
Marfurt, K.J. and Alves, T.M. [2015]. Pitfalls and limitations in seismic attribute interpretation of tectonic features. Interpretation, 3(1), SB5–SB15. Doi: https://doi.org/10.1190/INT-2014-0122.1.
Purves, S. and Basford, H. [2011]. Visualizing geological structure with subtractive colour blending. GCSSEPM, Extended Abstracts
Rawat, W. and Wang, Z. [2017]. Deep Convolutional Neural Networks for Image Classification: A Comprehensive Review. Neural computation, 29(9), 2352-2449. https://doi.org/10.1162/NECO_a_00990.
Szafian, P. [2015a]. A quantitative volumetric fault density volume in Geoteric. Blog post. https://blog.geoteric.com/technical/2015/07/24/a-quantitative-volumetric-fault-density-volume-in-geoteric.
Szafian, P. [2015b] Geoteric: Fault Proximity. Blog post. https://blog. geoteric.com/wordpress/2015/09/25/geoteric-fault-proximity.
Williams, R., Brett, D. and Whittaker, H. [2024]. Understanding Well Performance Results through AI Seismic Interpretation. 85th EAGE Annual Conference & Exhibition (including the Workshop Programme), Extended Abstracts. https://doi.org/10.3997/2214-4609.2024101085.
Williams, R.M., Szafian, P. and Milner, P.A. [2020]. The evolution of structural interpretation from 2D to AI; the reinterpretation of the Cheviot Field. First Break, 38(7), 69-74. https://doi.org/10.3997/13652397. fb2020052.
ADVERTISEMENT

Dr Thibaud Freyd1* and Dr Raphael Peltzer1 present a scalable, entitlement first Retrieval Augmented Generation (RAG) architecture that transforms unstructured, OSDU referenced content into actionable intelligence.
Abstract
The oil and gas industry continues to digitise subsurface data, yet much of the high value information remains trapped in unstructured formats such as scanned final well reports, daily drilling reports, and biostratigraphy analyses. While the OSDU® Data Platform standardises structured datasets, unlocking value from unstructured records requires semantic enrichment and rigorous security.
This article presents a scalable, entitlement first Retrieval Augmented Generation (RAG) architecture that transforms unstructured, OSDU referenced content into actionable intelligence. The approach combines document reconstruction, header aware chunking, and hybrid retrieval - Best Matching 25 (BM25) + vector search fused via Reciprocal Rank Fusion (RFF) – with preretrieval filtering that maps Entra ID identities to OSDU Access Control Lists (ACLs). On a curated 250 question pilot set representative of subsurface workflows, semantic reconstruction and hybrid retrieval improved recall and precision by up to 20% relative to a naïve baseline, with reported reductions in time-toanswer. The article clarifies how RAG grounds generation and how ReAct agents can orchestrate multistep decision support on top of a trusted foundation.
Overall, the study outlines a practical path from unstructured ‘text soup’ to compliant, auditable answers suitable for enterprise deployment at scale.
Keywords: OSDU® Data Platform; Retrieval Augmented Generation (RAG); Reciprocal Rank Fusion (RRF); Entitlements; Azure AI Search; Microsoft Fabric; BM25; Microsoft Copilot.
Introduction: The unstructured data cliff Digital transformation in the subsurface domain has historically been a story of structured data. Over the past decade, the industry has moved from physical tapes to on-premises servers, and finally to cloud-native ecosystems like the OSDU® Data Platform. This transition has revolutionised how we handle well logs, seismic traces, and production rates. However, unstructured subsurface data remains one of the most persistent barriers to digital transformation in the energy industry.
While the OSDU Data Platform has successfully standardised structured logs, a significant volume of high-value subsurface
1 Cegal
* Corresponding author, E-mail: thibaud.freyd@cegal.com
DOI: 10.3997/1365-2397.fb2026014
evidence remains locked in unstructured formats like scanned reports and legacy PDFs (Kumar et al., 2023; IDC, 2023; MIT Sloan, 2021). These blind spots can delay well planning by days, increase intervention risk, and cost millions annually. Equinor’s CIO Åshild Hanne Larsen has noted that ~80% of employee time is spent searching unstructured information (as quoted in Walker, 2019).
These assets – such as Final Well Reports (FWR), Daily Drilling Reports (DDR), and biostratigraphy analyses – are mapped OSDU records with File/DataSet references and record level ACLs (Access Control Lists defining who can see what). Without semanticisation, PDFs remain opaque binaries behind File service pointers and force users back to filename or coarse metadata search.
Traditional keyword search approaches fail in this context because OCR noise, synonym gaps, and lack of contextual linkage mean queries like ‘Maastrichtian reservoir pressure’ return irrelevant results or miss critical data entirely.
The challenge is not merely retrieval – it is understanding. Semanticisation – the process of converting raw text into structured, domain-aware representations – is the cornerstone of this transformation. Metadata can narrow scope, but without semanticisation, values like ‘15% porosity’ remain meaningless without formation, depth, and well context.
For a geoscientist or reservoir engineer, the value of a dataset often lies in the narrative context buried within these files. A structured porosity log can tell you what the value is, but the final well report explains why the reservoir quality degrades in the northern sector. Today, locating the right files, reviewing them, and comparing multiple wells can take hours or even days. In situations like well intervention or well planning, such delays mean increased risk and higher costs.
This initiative is part of an continuing program to establish a robust AI foundation for one customer, starting with the most impactful challenge: unstructured data in their OSDU instance, where it can deliver the greatest value. By focusing first on semantic enrichment and secure retrieval of these documents, it lays the groundwork for future agentic workflows — automated processes that will not only answer questions but execute tasks across the subsurface lifecycle.
Breaking through the unstructured-data barrier requires more than raw text ingestion — it demands an architecture that transforms OCR output into structured intelligence. Simply extracting text is not enough; without reconstructing the logical relationships between headers, tables, and figures, critical geological context is lost.
The transformation process is organised into layers, each designed for scalability, governance, and precision. At the foundation is ingestion, where OCR-processed content from the operator’s OSDU instance enters the pipeline. These OCR outputs often suffer from formatting loss — tables split across pages, rotated headers, or shuffled content due to poor scan quality. Left untreated, these distortions break downstream retrieval and create brittle foundations for AI.
The processing layer attempts semantic layout reconstruction first, rebuilding the hierarchical structure of reports. This step is critical because subsurface documents are not flat text — they contain nested sections that convey meaning. Preserving this structure enables smart chunking, where content is segmented into semantically coherent blocks rather than arbitrary text splits. This dramatically improves retrieval accuracy and reduces token costs for downstream AI models.
However, reconstruction is not always possible. When document complexity or OCR quality prevents reliable structure recovery, the system falls back to naïve chunking — i.e. splitting text into fixed-size blocks of 2000 characters with an overlap of 500 characters. While less precise, this ensures continuity of processing and provides a baseline for retrieval.
Above that, the indexing layer generates embeddings for each semantic block, enabling high-precision semantic retrieval. These embeddings are stored in a vector index optimised for fast similarity search. The architecture leverages Microsoft Fabric for data engineering, and to feed Azure AI Search, which serves as the secure vector store and hybrid retrieval engine. The interfaces (ingest→reconstruct→index→retrieve) follow patterns that can be mapped to other enterprise platforms with equivalent capabilities (private networking, hybrid retrieval, and audit logging).
This approach matters because naïve chunking and keyword-only retrieval fail in real-world workflows. Without semantic reconstruction, a query such as ‘pressure trends in the Maastrichtian interval for Johan Sverdrup wells’ might return dozens of irrelevant chunks. Smart chunking, combined with hybrid retrieval (vector + keyword), ensures that contextually accurate results surface — even when phrased differently across documents.
Finally, the retrieval layer exposes this structured information through natural language queries. Instead of brittle keyword matching, the system leverages semantic understanding to return answers grounded in geological context. This design eliminates the need to manually sift through hundreds of pages and sets the stage for future agentic workflows, where retrieval triggers automated actions - such as generating well summaries or validating operational constraints.
Moving from chaos to context is not a cosmetic upgrade - it is the foundation for trust, scalability, and compliance in subsurface intelligence.
When dealing with subsurface data, security is not optional — it is foundational. In an industry where intellectual property and operational safety hinge on data integrity, any AI solution must enforce zero-trust principles from the ground up. The architecture described here (Figure 1) ensures entitlement checks occur before retrieval, not at the LLM layer. Anything else would represent a critical security flaw.
The architecture integrates Entra ID for identity and maps effective user/group membership to OSDU Access Control Lists (ACLs). Every retrieval candidate is filtered by entitlements before scoring or vector lookup, ensuring entitlement first access and eliminating leakage from unauthorised documents (Figure 2). This guarantees that only authorised content is retrieved, eliminating the risk of ‘hallucinated’ answers from documents the user should never see.
Many ‘Chat with PDF’ demos gloss over security, assuming filtering can happen after the model generates an answer. That approach
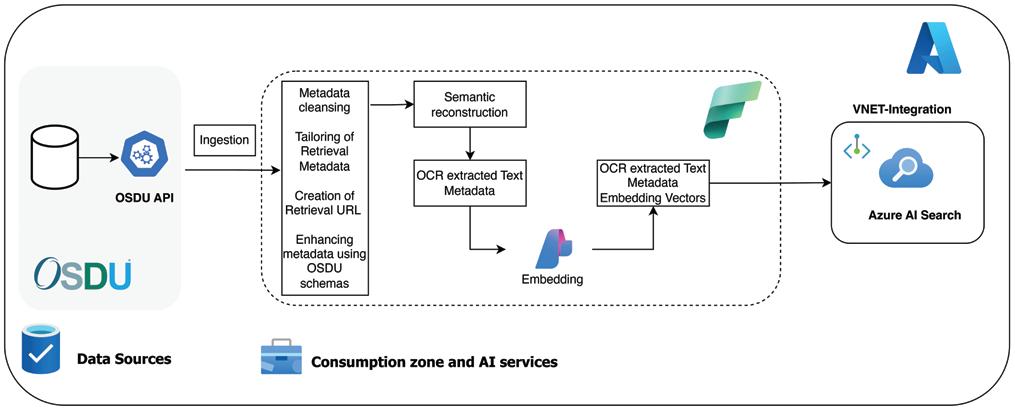
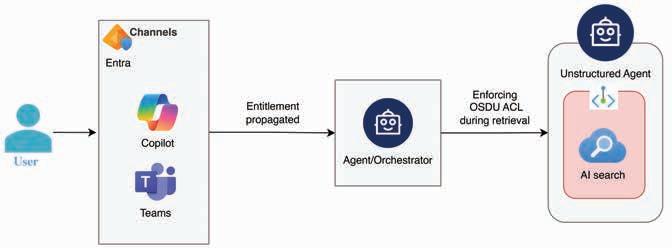
Mechanism of action
Security and entitlements
Latency profile
Retrieval quality (precision)
Scalability (terabyte scale)
Performs broad semantic vector search first, then applies metadata/security filters to the top-K results.
Probabilistic enforcement. Sensitive data is retrieved into temporary memory before being discarded. High risk of ‘silent leakage’ if the filter logic fails.
High and variable. Compute resources are wasted ranking documents that will ultimately be discarded. Latency increases linearly with total index size.
Suffers from ‘Pagination Gaps’. Requesting the top-10 results may yield only 2 valid documents after filtering, appearing to the user as poor recall or system failure.
Poor. Becomes computationally prohibitive when searching massive, multi-basin OSDU deployments.
is unacceptable in enterprise environments. This approach enforces compliance at the earliest possible stage.
Pre-retrieval trimming
Before any semantic search occurs, the system applies preretrieval trimming:
• Validate user identity via Entra ID and retrieve the user ACL groups
• Apply OSDU ACL filters to narrow the chunks the user has rights to access
• Pass only authorised chunks to the retrieval engine.
This sequence is critical for tenant isolation and auditability. Every query produces per request audit logs (identity, effective ACLs, retrieval set), satisfying regulatory and internal requirements. It also prevents cross user cross-referencing and preserves provenance via Source of Truth (SoT) pointers back to the authoritative record.
Secure integration
The entire pipeline runs within a VNET-integrated environment, ensuring that data never traverses public endpoints. Azure AI Search operates behind private links, and Microsoft Fabric orchestrates workflows without exposing sensitive metadata externally. This design is cloud-native yet cloud-agnostic, meaning it can be adapted to other enterprise-grade platforms without compromising security.
Single Source of Truth
A critical decision is to maintain a Single Source of Truth. The RAG layer does not host originals; it maintains a shadow index (chunks, embeddings, metadata) with signed pointers to the
Figure 2 Entitlement-First Retrieval workflow. Before any search occurs, user identity (via Entra ID) is matched to OSDU Access Control Lists (ACLs) to filter unauthorised content. This pre-retrieval step enforces zero-trust security and prevents sensitive data exposure.
Applies strict metadata and security constraints (OData filters) before executing the vector similarity search.
Deterministic enforcement. The search engine never scans unauthorised index segments. Zero-trust architecture by design.
Low and consistent. The search space is mathematically reduced before compute-intensive vector operations begin.
High precision. The top-K results returned are guaranteed to be both semantically relevant and authorised for the user.
High. Scales efficiently as the scope is narrowed to relevant assets (e.g., a single field) regardless of total data volume.
authoritative file (e.g., ADLS Gen2, OSDU records…). Every part of the generated answer comes with citation markers that link back to the original document. This allows for traceability of every part of the response and lets the end user contextualise information easily and helps to build trust into the solution for the end user by reducing the black-box feeling LLM-based solutions sometimes invoke. A sync pipeline detects upstream OSDU changes and update the index to prevent drift.
Business impact
Security is not just about risk mitigation — it enables scale and fosters trust. By embedding entitlement logic and zero-trust principles into the retrieval layer, the architecture supports collaboration across teams and accelerates adoption. This adaptability ensures that future AI-driven workflows can integrate seamlessly without compromising compliance or data integrity. In short, security becomes the enabler for innovation, not a barrier.
Entitlement enforcement: Pre-retrieval vs. post-retrieval filtering
To ensure both data security and retrieval relevance at scale, the architectural decision regarding when to apply metadata constraints (such as OSDU ACLs or specific well identifiers) is critical. As detailed in Table 1, our architecture adopts a strict Pre-Retrieval approach to overcome the significant latency and security drawbacks inherent in post-filtering large subsurface datasets.
Threat model checklist
The solution enforces tenant isolation (separate workspaces, private endpoints, no public ingress), entitlement flow (Entra
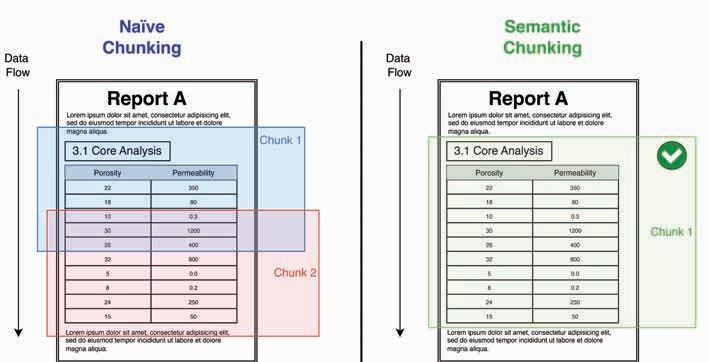
ID → effective groups → preretrieval OSDU ACL filtering), provenance (Source of Truth pointers such as record IDs/URIs), and controlled data handling (no originals in the RAG store; shadow index only). Reviewability is ensured through per answer citations and linkback to the controlled source.
Implementation and delivery
The architectural components, including the Vector Store (Azure AI Search) and Orchestration (Azure AI Foundry), are deployed on Azure to ensure compliance with data residency requirements. The final user interface is exposed via Microsoft Teams, ensuring that OSDU-sourced intelligence is accessible within the geoscientists’ daily collaborative environment without requiring a standalone application.
Semantic reconstruction and retrieval
Unstructured subsurface documents present unique challenges for retrieval due to formatting loss during OCR processing. Geological reports often contain multi-page tables, rotated headers, and complex layouts that break the logical flow of information. If these structures are not restored, downstream retrieval becomes unreliable and costly.
The system addresses the formatting loss by applying a mixed reconstruction pipeline. Due to their high diversity, documents are first classified using lightweight heuristics. LLM-based parsing is then applied only to those documents deemed highly relevant or structurally complex. The resulting LLM output is further used to infer section headers and reconstruct the hierarchical structure of the document. This approach ensures accurate structural recovery without incurring unnecessary computational cost.
Chunking strategy
Standard fixed-size chunking — often referred to as naïve chunking — provides a baseline but is not optimal for technical reports. Fixed splits can separate related concepts, reducing retrieval precision. To overcome this, the system implements a Header-Aware Splitting Strategy (Figure 3). It walks the reconstructed document tree and preserves entire sections (e.g., ‘3.1 Core Analysis’) as single chunks when they fit within the context
Figure 3 Naïve vs Semantic Chunking. The left panel shows fixed-size splits that break logical connections between headers and data, creating orphaned values. The right panel demonstrates semantic chunking, which preserves entire sections (headers and tables) for context-aware retrieval.
window. This method improves semantic coherence and reduces token usage for downstream AI models.
When reconstruction is not possible due to poor OCR quality or extreme layout complexity, the system falls back to naïve chunking. While less precise, this ensures continuity of processing and maintains operational reliability.
Vectorisation and retrieval stack
Once reconstruction and chunking are complete, text is vectorised using high-dimensional embedding models such as OpenAI’s text-embedding-3-large. These models provide the granularity needed to differentiate subtle geological concepts. However, vector search alone cannot guarantee precision in the energy domain.
To address this, the architecture employs a hybrid retrieval strategy:
• Vector retrieval: Captures semantic meaning (e.g., ‘reservoir quality’ ≈ ‘porosity’).
• Keyword search (BM25, Robertson, S. and Zaragoza, H., 2009): Ensures exact matches for industry-specific terms (e.g., ‘Schlumberger MDT’).
• Synonym mapping: Expands domain-specific language at query time (e.g., ‘Christmas Tree’ = ‘Flow Control Assembly’).
• RFF: Combines vector and keyword results for balanced relevance.
• Semantic reranker: Re-scores top candidates to prioritize contextual accuracy.
This multi-layered approach ensures that queries such as ‘pressure trends in the Maastrichtian interval for Johan Sverdrup wells’ return contextually accurate results — even when phrased differently across documents.
Interactive scope disambiguation.
To prevent entity confusion – retrieving data for ‘Well A’ when the user asks about ‘Well B’ – the system implements Interactive Scope Disambiguation. If the asset context is ambiguous, the agent actively solicits the scope (e.g., WellboreID) from the user to inject strict OData filters into the Azure AI Search query prior to execution. This human-in-the-loop step constrains the vector space to the specific asset, ensuring retrieval precision aligns with the user’s intent.
While the current implementation operates as a sophisticated single-agent pipeline, the architecture anticipates a multi-agent future. Planned agents include:
• Source-specific subagents for specialised retrieval.
• Workflow orchestrators for dynamic query planning.
• Synthesis and QA agents for cross-source validation.
This modular design positions the system as more than a retrieval engine — it is a foundation for autonomous, compliance-aware workflows in subsurface data intelligence.
Much like if a human was tasked with finding relevant documents from a large database of documents, metadata is essential in retrieving the right documents at the lowest possible cost. While finding all theoretically viable documents produces a lot of noise, it also produces a lot of cost.
The larger the context, the greater the latency and cost. Therefore, hybrid retrieval is aided by guardrails (metadata filters, decision heuristics) to keep context focused. In this pilot, the primary objective is retrieval quality; the latency is monitored and only metadata features that demonstrably improve precision/recall are retained. This, in addition to retrieval and context restraints are used to keep costs in check. While latency optimisation is important, prioritising retrieval accuracy is critical to preventing user frustration and trust erosion. Each incorrect result increases cognitive load and undermines confidence in the system.
The current solution extracts relevant metadata from OSDU, fills missing metadata, and enriches it using relationships with well-known schemas inside OSDU. This process yields two major upsides. First, the retrieval can be more targeted and allows us to cover more dimensions of user requests beyond geolocation (i.e. well, field etc.). Secondly, and more importantly, utilising such relationships builds the foundation for incorporating multiple search resources with each other and for building on existing master data as the Source of Truth when integrating different sources into a multi-agent framework.
Validation and results
The pilot phase demonstrated measurable improvements in retrieval quality and answer relevance compared to baseline approaches. Enhancements such as semantic reconstruction and hybrid retrieval significantly increased the accuracy of responses, while header-aware chunking delivered a noticeable uplift over naïve splitting methods.
Evaluation framework
Validation was conducted using a custom evaluation framework designed to reflect real-world complexity. The framework included:
• A curated set of 250 domain-specific questions representing diverse report types present in the corpus
• Metrics such as precision, recall, and cosine similarity scoring to quantify retrieval performance.
• Integration of a LLM-as-a-Judge framework (e.g., DeepEval or similar RAG evaluation frameworks) for reference benchmarking, providing an additional layer of qualitative assessment.
To strengthen evaluation robustness, the initial gold dataset of 250 domain-specific questions is planned to be augmented using LLM-based generation to expand the set to 5000-10,000 synthetic queries with human validation samples to control bias. Humanin-the-loop parameters (e.g., conservative answering thresholds) are evaluated separately from core retrieval metrics. In addition, end-user involvement is embedded from day one of development. Domain experts guide question formulation, retrieval tuning, and system behaviour, ensuring that the platform aligns with realworld workflows and delivers practical value.
This framework enabled systematic optimisation of relevancy thresholds and retrieval logic while maintaining compliance with strict customer requirements for conservative behaviour. The system was tuned to prioritise accuracy over coverage, ensuring responses did not include information from unrelated wells or fields.
• Semantic reconstruction improved recall/precision by up to 20% versus naïve across the evaluation set.
• Hybrid retrieval performance: Combining vector search with keyword-based BM25 and synonym mapping reduced false positives and improved contextual relevance.
• Latency vs. accuracy trade-offs: Introducing metadata-driven decision trees enhanced retrieval quality but added processing time. These trade-offs were quantified and balanced to meet operational requirements.
The improvements translated into tangible business benefits:
• Research time reduction: Users reported material reductions in time spent locating and validating subsurface evidence (internal pilot feedback).
• Economic signal: A simple model (roles × tasks/month × time saved × fully loaded rate) indicates potential millions of NOK savings at scale; exact values depend on adoption, corpus growth, and governance costs and are therefore reported as scenarios rather than a single figure.
• User trust: Conservative tuning and compliance-aware design increased confidence in system outputs, fostering adoption across teams.
This validation process confirmed that semantic reconstruction, hybrid retrieval, and entitlement-aware security form a robust foundation for enterprise-scale AI in subsurface data intelligence.
The current architecture is more than a retrieval engine — it serves as a foundation for intelligent, autonomous workflows across the subsurface lifecycle. With the RAG stack, semantic reconstruction pipeline, and entitlement-aware security in place, the system is positioned for scalable expansion.
Agentic workflows powered by ReAct
The next evolution introduces Reasoning + Acting (ReAct) to enable multistep reasoning and dynamic tool use (Yao et al., ICLR 2023). ReAct ≠ RAG: RAG (Lewis et al., 2020) grounds
generation in retrieved evidence, while ReAct interleaves reasoning and actions (e.g., plan → retrieve → verify → act).
This approach will allow agents to:
• Interpret complex, multi-entity queries.
• Plan retrieval strategies across heterogeneous data sources.
• Execute downstream actions such as anomaly detection or well-top extraction.
• Validate outputs through cross-agent consensus.
ReAct transforms the platform from a passive Q&A system into an active decision-support engine capable of orchestrating workflows across drilling, production, and compliance.
Agility is critical in this evolving ecosystem — models, orchestration frameworks, and OCR capabilities change monthly.
To future-proof the solution, we adopt modular components and continuous monitoring of vendor road maps, avoiding lock-in and enabling rapid adaptation. This flexibility ensures that the platform remains relevant as AI and cloud technologies advance.
Visualisation for contextual insights
Future iterations will integrate interactive visualisation layers to enhance usability and accelerate decision-making:
• Dynamic dashboards for performance trends.
• Geological interval maps linked to retrieved context.
• Entity-centric views combining structured and unstructured data for rapid interpretation.
These visualisations will provide intuitive access to complex subsurface relationships, reducing cognitive load and improving operational efficiency.
Scalability and business enablement
The road map (Figure 4) focuses on extending the platform’s reach and intelligence:
• Connecting additional sources: Incorporating drilling logs, production reports, and real-time sensor feeds for richer contextualisation.
• Expanding contextual intelligence: Linking structured and unstructured repositories to deliver multi-dimensional insights.
• Adding Specialised Agents: Introducing anomaly detection agents, compliance validators, and synthesis agents for crosssource QA.
This evolution positions the platform as an enterprise-grade intelligence ecosystem, enabling advanced analytics, automation, and compliance-aware decision support across the organisation.
Conversational AI for subsurface data is only viable when grounded in context and restricted by entitlements. This principle underpins the entire transformation described in this article. By combining the orchestration power of cloud-native platforms, the semantic precision of large-context embeddings, and the governance framework of OSDU, the architecture demonstrates a scalable path from unstructured ‘text soup’ to a trusted enterprise AI platform.
The transition from scanned legacy reports to a semantic knowledge graph is not just an IT upgrade — it is the foundation required to deploy the next generation of multi-agent AI in the
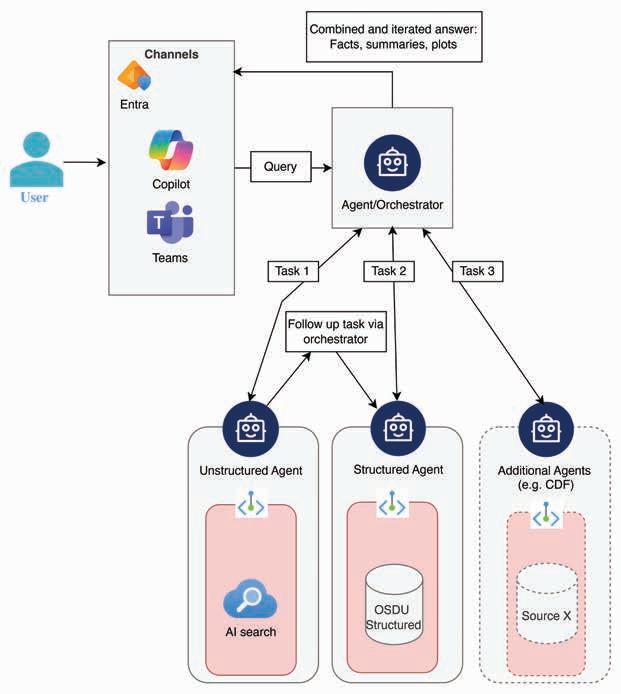
Figure 4 Multi-agent orchestration architecture. The orchestrator uses the ReAct pattern to break complex queries into sub-tasks, delegating them to agents for unstructured (RAG) and structured (OSDU) data and other relevant sources. Outputs are merged into a unified, lineage-aware response.
energy sector. This foundation enables organisations to move beyond retrieval toward reasoning and action, leveraging ReAct-driven workflows and interactive visualisation to unlock new efficiencies and insights.
With entitlement-aware security, metadata standardisation, and hybrid retrieval at its core, the platform ensures compliance, accelerates decision-making, and positions enterprises for continuous innovation. The road map is clear: connect more sources, enrich contextual intelligence, and orchestrate specialised agents to transform technical data into actionable intelligence.
This is not the end – it marks the beginning of a new era where energy companies can trust AI to deliver accurate, secure, and context-rich answers, paving the way for autonomous, compliance-aware workflows across the value chain.
References
Cormack, G.V., Clarke, C.L.A. and Buettcher, S. [2009] Reciprocal rank fusion outperforms Condorcet and individual rank learning methods.
SIGIR ‘09: Proceedings of the 32nd international ACM SIGIR conference on Research and development in information retrieval, 403-410.
IDC [2023] Worldwide Global DataSphere Structured and Unstructured Data Forecast, 2023-2027. International Data Corporation.
Kumar, P., Tveritnev, A., Jan, S.A. and Iqbal, R. [2023] Challenges to Opportunity: Getting Value Out of Unstructured Data Man-
agement. SPE Annual Technical Conference and Exhibition, SPE214251-MS.
Lewis, P., Perez, E., Piktus, A., Petroni, F., Karpukhin, V., Goyal, N., Küttler, H., Lewis, M., Yih, W., Rocktäschel, T., Riedel, S. and Kiela, D. [2020] Retrieval-Augmented Generation for Knowledge-Intensive NLP Tasks. Advances in Neural Information Processing Systems (NeurIPS), 33, 9459-9474.
MIT Sloan [2021] Tapping the Power of Unstructured Data. MIT Sloan Management Review
OSDU Forum [2023] OSDU Data Platform Technical Standard. The Open Group.
Robertson, S. and Zaragoza, H. [2009] The Probabilistic Relevance Framework: BM25 and Beyond. Foundations and Trends in Information Retrieval, 3(4), 333-389.
Walker, A. [2019] Oil and Gas Has a Problem With Unstructured Data. Journal of Petroleum Technology, 71(11), 32-34.
Yao, S., Zhao, J., Yu, D., Du, N., Shafran, I., Narasimhan, K. and Cao, Y. [2023] ReAct: Synergising Reasoning and Acting in Language Models. International Conference on Learning Representations (ICLR)
AI disclosure
GenerativeAI tools were used for language polishing and figure drafting; outputs were verified and edited by the authors. Microsoft, Azure, and the Azure logo are trademarks of the Microsoft group of companies.


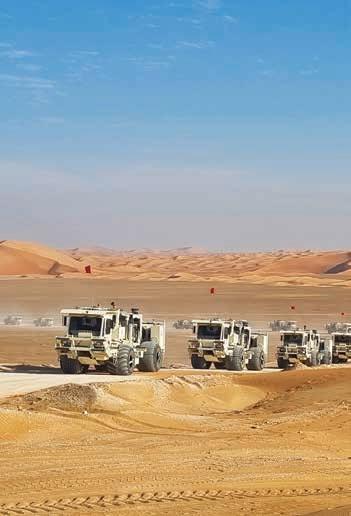


Submit your abstract and join industry experts at the Second EAGE Land Seismic Acquisition Workshop, taking place 16–18 November 2026 in Dubai, UAE. Abstract Submission Deadline: 15 May 2026


EarthDoc continues to grow, now hosting two new journals


- Exploration Geophysics and Preview Magazine - alongside EAGE publications and associated socitety content, giving you unparalleled access to cutting-edge geoscience research.


EAGE Publications Officer


ERIC VERSCHUUR


Access to reliable and valuable information is essential to the geoscience community, and this is precisely what EarthDoc strives to provide. The addition of two new journals from 2026 expands the reach of our platform and further strengthens our commitment to delivering the most comprehensive geoscience research experience possible.


82,000+


UNLOCK OPPORTUNITIES FOR GROWTH STUDENTS CAN APPLY FOR THEIR FIRST YEAR OF MEMBERSHIP FOR FREE (RE)ACTIVATE YOUR MEMBERSHIP TODAY!


PAPERS IN EARTHDOC FREE EAGE 1 JOURNAL OF YOUR CHOICE


B. Lasscock1*, D. Arunabha2, L. Chen2, M. Gajula1, K. Gonzalez1, C. Liu2, B. Michell1, S. Namasivayam1, V.S. Ravipati2, A. Sansal1, M. Sujitha2, G. Suren2 and A. Valenciano1 present a practical framework for AI-assisted subsurface data access based on explicit data representations, agent-based workflows, and efficient information retrieval.
Abstract
This article presents a practical framework for AI-assisted subsurface data access based on explicit data representations, agent-based workflows, and efficient information retrieval. We demonstrate large-scale conversion of SEG-Y archives into self-describing MDIO v1 datasets and present a case study on agent-driven reconstruction of seismic metadata from legacy text headers. A second case study evaluates embedding-based retrieval across acquisition and processing reports, showing that vector quantisation and graph-based indexing enable low-latency, relevance-driven search. These capabilities are integrated into an interactive, multi-agent system that supports natural-language analysis and coordinated access to structured and unstructured subsurface information.
Introduction
Energy industry organisations and data providers hold petabytes of seismic data, well data, and technical reports, yet much of this information remains difficult to locate, integrate, and use operationally. The challenge is rarely a lack of data; it is the absence of a consistent, machine-readable structure across legacy formats and fragmented metadata sources. When concepts such as geometry, sampling, units, and provenance are implicit, or scattered across SEG-Y headers, PDFs, and spreadsheets, automation becomes fragile, and digital workflows are obstructed. To address the issue, we have created a digital platform that make subsurface assets self-describing and accessible to modern
AI. We introduce a practical digitalization stack: (1) a self-describing seismic representation using MDIO v1 (Sansal 2023a, 2023b; Michell 2025), (2) schema standards based on templates that unify how seismic datasets are represented and used, (3) agent-driven workflows that reconstruct missing or inconsistent metadata in legacy SEG-Y files at scale with verification, and (4) embedding-based retrieval that enables fast, relevance-focused discovery across acquisition and processing documentation. Together, these components close the gap between ‘data in files’ and data that can be searched, validated, and utilised by downstream applications and AI systems.
The resulting ecosystem supports natural-language interaction across technical, commercial, and operational data by expressing each modality through explicit, machine-readable metadata. Seismic volumes expose geometry, coordinate reference systems, and processing context in a consistent form, while well-log data is integrated through columnar representations suitable for analytical and machine-learning workflows (Gonzalez 2024, 2025). Unstructured documents, such as acquisition and processing reports, are mapped to standardised metadata fields using automated template recognition and hybrid retrieval techniques, including dense retrieval methods (Karpukhin et al., 2020). Structured enterprise systems, including orders, entitlements, contracts, and financial records, are incorporated through normalisation pipelines. Collectively, this approach transforms subsurface data from static archives into an active, queryable knowledge layer that supports AI-assisted analysis, valida-
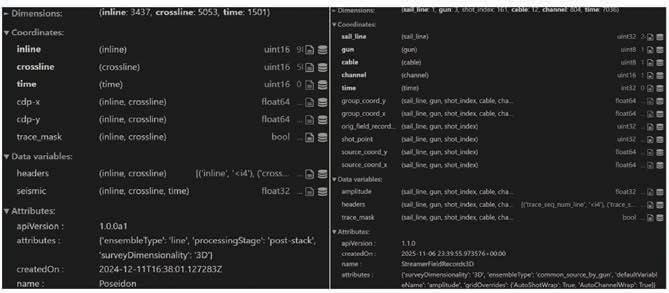
1 TGS ASA | 2 AWS Generative AI Innovation Center
* Corresponding author, E-mail: Ben.Lasscock@tgs.com DOI: 10.3997/1365-2397.fb2026015
Figure 1 A high-level view of two MDIO v1 datasets, viewed using Xarray (left) a 3D post-stack dataset; (right) a streamer field dataset.
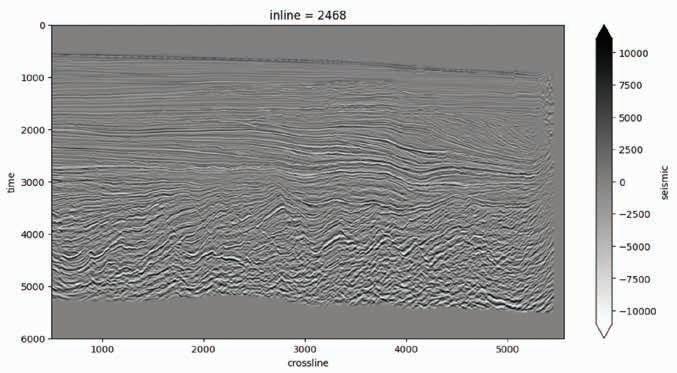
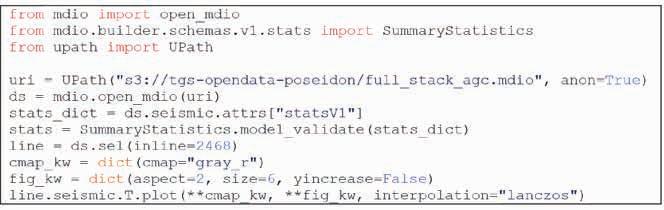
CocaGathers3D inline, crossline, offset, azimuth
inline, crossline
StreamerFieldRecords3D sail_line, gun, shot_index, cable, channel
StreamerShotGathers2D shot_point, channel
StreamerShotGathers3D shot_point, cable, channel
source x/y, group x/y, shot_ point, ffid
source x/y, group x/y, gun
Table 1 Summary of MDIO v1 seismic product templates currently used in data management. Each template defines the core dataset dimensions and coordinate variables that structure CDP, offset, angle, shot, streamer, common-offset/common-angle (CoCa), and post-stack data in 2D and 3D, with depth/time variants.
tion, and decision-making across technical and commercial workflows.
Most seismic digitalization challenges occur in the same area: geometry and semantics are implicit. In SEG-Y, key concepts such as dimensionality (2D vs. 3D, post-stack vs. gathers), coordinate scalars, and navigation are derived from trace-order and header conventions that vary by project and vendor. This makes automation fragile and requires every downstream process, analytics, visualisation, and ML to repeat the same interpretation logic.
An MDIO v1 dataset offers a self-describing representation of seismic data, with explicit structural metadata rather than
inferred. Each dataset specifies its main dimensions (e.g., cdp, angle, inline, crossline), along with associated coordinate variables (e.g., cdp_x, cdp_y, coordinate scalars). The MDIO dataset framework is defined as a JSON schema, which details coordinates, dimensions, masks, and key survey metadata as separate arrays. This design allows clear interpretation of survey geometry and navigation information where applicable. To promote open and reproducible use, MDIO is released as open-source software under the Apache 2.0 licence (Sansal 2025a), along with cloud-compatible SEG-Y parsing tools (Sansal 2025b). Each MDIO v1 dataset is naturally compatible with the popular Xarray Python library (Hoyer 2017), enabling access to seismic variables and coordinates through a well-established third-party tool.
The following example demonstrates interactive access to a post-stack 3D dataset using the Python MDIO v1 library. Here, seismic amplitudes are indexed by inline and crossline coordinates and visualised without additional geometry reconstruction. The dataset provides sel and isel commands to access data according to coordinate values and logical indexing, respectively. The result is shown in Figure 2 as a seismic inline sampled from the Poseidon dataset.
With MDIO v1, specific conventions for JSON-Schema or templates are designed to support a wide variety of seismic product types across acquisition, processing, and migration stages. Each template establishes the dataset’s dimensional structure and required coordinate variables, offering a standard representation for common seismic products. These templates form the structural foundation for both data ingestion and downstream use.
At the time of writing, we have ingested petabytes of seismic data from more than 100,000 individual SEG-Y files into MDIO v1, covering a wide variety of field data, pre-stack, and poststack seismic product types. Due to the large volume of SEG-Y data, providing a detailed schematisation of the seismic data was impractical, so that task has been deferred to generative AI
agents discussed in the next section. The current set of extendable seismic templates used in operational data management is summarised in Table 1. Importantly, because MDIO v1 separates headers, coordinates, and other data from the traces, these templates can be refined by editing the dataset without reingestion.
Large-scale ingestion of legacy SEG-Y data into MDIO v1 was benchmarked using source SEG-Y files stored in Amazon S3 (standard storage class). The ingestion workflow is designed to operate directly on object storage, without modifying or relocating the source data. Benchmark ingestion and conversion workflows were executed on c7g.8xlarge instances (32-core AWS Graviton processors), providing a reproducible and well-defined compute environment for parallel SEG-Y parsing. The ingestion process first scans the SEG-Y headers to discover and validate dataset dimensions, coordinate variables, and associated metadata required by the schema. This phase extracts geometry information without materialising trace data. Second, a write phase constructs the chunked MDIO v1 dataset and writes it directly to object storage in the MDIO format. Table 2 shows the timing data for ingesting a collection of post-stack SEG-Y files into MDIO v1. We find that the end-to-end throughput, including the
SEG-Y header scanning and writing, realises high throughput on the test machine, with linear scaling in wall time with the file size. We also observe that MDIO provides a consistent lossless data compression between 25%-39% despite explicitly storing coordinates and other information in the dataset.
Automated metadata reconstruction for largescale SEG-Y ingestion
We aim to ingest a library of more than 1 million SEG-Y files into the MDIO v1 format. This is addressed through three coupled metadata reconstruction tasks: (i) seismic product type identification, (ii) header field extraction, and (iii) schema mapping to standardised MDIO v1 fields.
Together, these steps define the minimum requirements for constructing MDIO v1 datasets with explicit dimensions, coordinates, and consistent metadata. The reconstruction process begins with the identification of the canonical seismic product type, which determines the dataset’s high-level geophysical structure (e.g., 2D vs. 3D, pre-stack vs. post-stack, gather organisation). MDIO v1 formalises this classification using a controlled taxonomy spanning marine, land, and ocean-bottom node (OBN) surveys. A representative subset of this taxonomy is summarised in Table 3.
SEG-Y text headers contain critical metadata describing survey geometry, acquisition environment, processing history, and product semantics. However, these headers are free-form, inconsistently structured, and weakly standardised, often encoding essential information using non-standardised language and project-specific conventions. Accurate interpretation, therefore, typically requires subject-matter expertise (SME). As an example, in Table 4, we give an example of information defined in the text header, and how they inform the MDIO v1 schema.
Moreover, SEG-Y text headers frequently declare custom header overrides, such as non-standard byte locations for inline and crossline coordinates, which must be extracted and applied to correctly interpret trace headers. In addition, the same geophysical concept may be referred to in the text header using multiple
cdp, angle, inline, crossline
cdp_x, cdp_y, coordinate_scalar
LINE = single value
coordinate fields
2D survey
INLINE or XLINE present MDIO: 3D survey
SOURCE = VIB/DYNAMITE MDIO: land acquisition
“PSDM”, “DEPTH MIGRATION” MDIO: post-migration
“CMP gathers” MDIO: pre-migration
“regularised”, “binned”, “resampled” MDIO: regularisation flag
PRODUCT keywords
different aliases over time (e.g., CDP, CMP, CMP NO.), requiring normalisation to derive a consistent metadata schema across the library. At the scale of a library with millions of SEG-Y files, manual interpretation of text headers is not feasible; an automated solution guided by subject matter expertise is required to fully populate.
To address these challenges, we constructed a labelled training and evaluation dataset derived from 57 manually interpreted SEG-Y files, each containing full text headers, binary header information, and SME-validated ground-truth annotations. Each session included canonical seismic product type labels, standardised header overrides, and unit definitions, providing authoritative reference data for product classification, field extraction, and schema mapping. Although modest in size, this dataset was intentionally curated to span heterogeneous acquisition types, processing workflows, and header conventions, encompassing approximately 800 distinct metadata labels representative of the broader seismic data library.
We then developed a multi-agent AI system to perform endto-end metadata reconstruction suitable for MDIO v1 ingestion. The system leverages large language models within a structured pipeline that combines free-text reasoning with explicit domain constraints derived from SME guidance. All agents were implemented using the Anthropic Claude Sonnet 4 LLM. No model fine-tuning was performed; performance gains were achieved through agent decomposition, prompt refinement, rule encoding, and SME-in-the-loop iteration. The automated pipeline consists of three primary agents:
1. Template (product type) classification agent – this agent determines the canonical seismic product type consistent with the MDIO v1 taxonomy. It evaluates structural cues (e.g., presence of LINE versus INLINE/XLINE), acquisition indicators (e.g., SOURCE descriptors), and processing descriptions (e.g., migration and regularisation statements). Outputs are validated using rule-based consistency checks. This step also includes an additional verification agent to verify the predicted template class from the classification agent.
2. Field extraction agent – given the selected template, it identifies relevant metadata fields from SEG-Y text and binary headers, including field names, byte locations, data types, and semantic intent. Extracted fields are normalised into an intermediate representation independent of the original SEG-Y syntax.
3. Schema mapping agent – this agent maps extracted fields to standardised MDIO v1 metadata namespaces, resolving SEG-Y aliases and assigning fields to their appropriate roles (dimensions, coordinate variables, or auxiliary metadata). Fields that cannot be mapped unambiguously are explicitly flagged. This step also includes an additional verification agent to verify if the mapped alias from the mapping agent indeed matches the same concept as the extracted field in SEG-Y data.
MDIO: product_type classification
Table 4 Mapping of key SEG-Y header cues — primarily from the text and binary headers — to their corresponding MDIO v1 interpretations.
Each stage is followed by an automated verification step enforcing internal consistency, domain constraints, and schema compatibility. Ambiguous cases and previously unseen patterns were routed
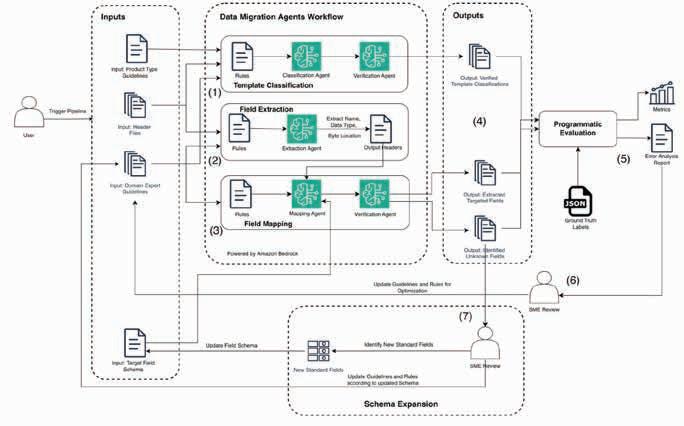
through an SME review loop, enabling controlled refinement of prompts, rules, and schema definitions. A conceptual overview of this workflow is shown in Figure 3.
The system was evaluated end-to-end on the labelled dataset across three primary tasks: template classification, field extraction, and field schema mapping. In Table 5, we show that the performance was assessed using exact-match accuracy against SME-validated ground truth. In addition, we report an end-to-end field extraction and mapping metric, in which a field is considered correct if and only if it is both successfully extracted and correctly mapped to the MDIO v1 schema.
These results demonstrate that an agent-based AI system can interpret heterogeneous SEG-Y headers and reconstruct standardised metadata at or above human-level accuracy, while dramatically reducing manual effort. The system achieved low operational latency and low cost, making it viable for large-scale migration of seismic archives exceeding one million datasets. By combining SME knowledge with structured agent reasoning, the approach enables full end-to-end metadata reconstruction, transforming implicit SEG-Y information into explicit MDIO v1 datasets with first-class dimensions, coordinates, and standardised metadata.
Having established standardised, self-describing seismic datasets through MDIO and agent-driven metadata reconstruction, the remaining challenge is how this information is accessed and combined in practice. In subsurface analysis, seismic data is important, but we also depend on a broader context of well logs,
technical reports, and commercial and operational records. We address this by introducing a chat-based analytical interface that enables natural-language queries to coordinate structured operations across seismic and related geoscientific and commercial data sources, without replacing existing systems.
The system is implemented as a hierarchical multi-agent framework (Google 2025) shown in Figure 4 in which a root agent interprets user intent and decomposes queries into explicit, inspectable sub-tasks executed by domain-specific agents. Each agent encapsulates procedural domain knowledge and invokes constrained computational tools, such as database queries, spatial operations, or document retrieval, to ensure reproducible and consistent results. This architecture supports multi-step, cross-domain analysis while maintaining transparency, traceability, and alignment with subject-matter-expert workflows.
As an example, in Figure 5, a user asks: ‘Find 3D marine seismic surveys in the Gulf of Mexico’. The UI streams information about agents and tool calls for the user.
The interface responds conversationally by summarising the results of the query. For example, when asked about available data, it identifies several 3D marine seismic surveys in the Gulf of Mexico and presents a short, ranked list (e.g., Survey A, Survey B), while indicating that additional results are available and can be explored on request.
‘Of course, I can help with that. I found several 3D marine seismic surveys in the Gulf of Mexico. Here are a few of them:
• Survey A
• Survey B
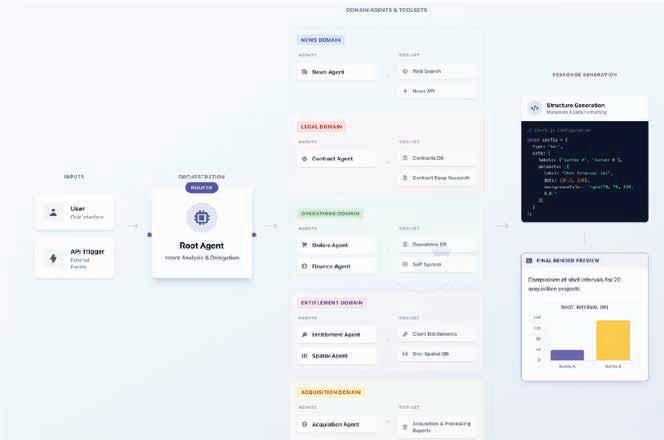
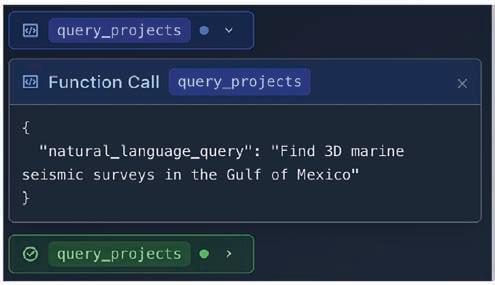
There are many more. Please let me know if you would like to know more about any of these surveys.’
Interactive analysis is driven by a deterministic rendering protocol that allows agents to communicate through a visual medium. By emitting streamed markdown containing both narrative text and structured code blocks (e.g., Chart. js), the language model moves beyond text-only responses to ‘express” via interactive visualidations (Figure 6). This architecture separates reasoning from execution: the model
4 A hierarchical multi-agent system for intent decomposition and cross-domain subsurface analysis.
generates the visual specification, while the interface renders the final output, ensuring reproducible, interpretable, and scalable analysis across large geoscientific and commercial datasets.
To enable efficient Retrieval-Augmented Generation (RAG) (Karpukhin et al., 2020) over a large corpus of seismic acquisition and processing reports, we implemented a semantic retrieval pipeline based on dense text embeddings using the Google Gemini embedding model (gemini-embedding001).
Scaling retrieval-augmented generation (RAG) to large subsurface archives is constrained by the storage and indexing cost of high-dimensional embeddings, which can exceed the size of the original text. We use 3072-dimensional embeddings to preserve technical fidelity, exceeding the default dimensional limits of standard PostgreSQL vector indexing (PGVector 2025). This is addressed using half-precision vector quantisation (halfvec) with PGVector, enabling support for the full embedding dimension while reducing index size by approximately 50% and improving distance-computation performance.
Figure 6 An auto-generated chart summarising the area of a collection of seismic surveys, prompt – ‘visualise the survey area’ with additional customisation available through the prompt –‘Implement a corporate-style blue-grey theme.’
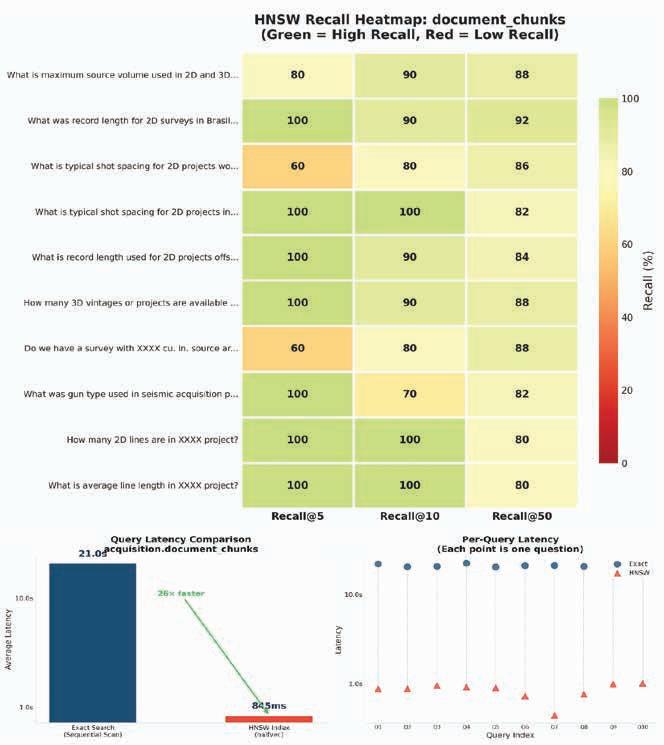
Embeddings are indexed using the Hierarchical Navigable Small World (HNSW) graph algorithm, selected for its sub-second query latency and scalability to millions of vectors. Index parameters were tuned to favour high recall, ensuring accurate retrieval of domain-specific technical details. Although retrieval is executed within PostgreSQL, the system implements a semantic RAG pipeline rather than a Text-to-SQL approach, retrieving unstructured text fragments based on semantic similarity. This is well-suited to subsurface reports, where key technical information is often embedded in narrative text rather than normalised fields.
Evaluation was performed on a corpus of 1445 seismic acquisition and processing reports using a representative set of ten domain-specific queries. Retrieval performance was evaluated using Recall@K, defined as the fraction of top-K chunk results returned by a halfvec HNSW index that match the top-K results from an exact full-precision (FP32) exhaustive vector search. Documents were indexed at the chunk level, with 1000-character segments and 200-character overlap, yielding 242,312 embeddings (approximately 167 chunks per document) and preserving technical context across segments.
The query set used in the evaluation was constructed to represent typical subsurface information retrieval tasks:
1. What is the maximum source volume used in 2D and 3D surveys offshore?
2. What was the record length for 2D surveys in Brazil from 2000 to the present?
Figure 7 (top) Recall statistics for each of the questions in the acquisition evaluation set. (bottom) The performance impact of replacing exhaustive vector scanning with graph-based HNSW indexing at half precision.
3. What is typical shot spacing for 2D projects worldwide?
4. What is typical shot spacing for 2D projects in Brazil?
5. What is the record length used for 2D projects offshore Canada?
6. How many 3D vintages or projects are available in the Santos Basin?
7. Do we have a survey with XXXX cu. in. source array in our library?
8. What was the gun type used in seismic acquisition projects?
9. How many 2D lines are in XXXX project?
10. What is the average line length in XXXX project?
As shown in Figure 7, the HNSW half-precision index maintains high retrieval fidelity despite aggressive quantisation. For approximately half of the queries (e.g., Q2, Q4, Q5, Q6, Q9, Q10), 100% recall was achieved at Recall@5, indicating that the most relevant document chunks consistently surfaced among the top results. More abstract or globally scoped queries, such as worldwide shot spacing (Q3) or specific source-array configurations (Q7), exhibited lower initial recall (60% at K=5). However, recall increased substantially to 86-88% at Recall@50. This behaviour is well aligned with RAG workflows, where retrieving relevant context within the top 20-50 chunks is sufficient to fully populate a standard LLM context window, ensuring that downstream answer generation remains robust.
Using HNSW half-precision indexing yields a 26× improvement in throughput, reducing average query latency from 21 s
to 845 ms. As shown in Figure 7 (bottom), HNSW maintains stable, sub-second latency across all queries, whereas exact sequential scans exhibit consistently high execution times. This demonstrates that approximate indexing combined with half-precision quantisation effectively removes the latency bottleneck of exhaustive vector scanning, enabling interactive semantic retrieval over domain-specific acquisition reports at scale. While vector quantisation and HNSW indexing are well established in general information retrieval, these results provide an evaluation of their performance on a subsurface reports corpus. The observed performance gains and limited impact on retrieval accuracy support real-time retrieval-augmented analysis in energy-sector applications.
This work demonstrates that subsurface digitalization can be advanced by coupling self-describing seismic representations with tool-augmented, agent-based AI workflows. Together, these components enable large-scale conversion of legacy SEG-Y archives into explicit, machine-readable datasets and support accurate reconstruction of standardised seismic metadata, providing a practical foundation for scalable analysis and AI-assisted workflows.
An interactive, agent-based interface brings together seismic data, acquisition and processing documents, contracts, operational reports, and related metadata through a deterministic, markdown-based protocol that separates language-model reasoning from data execution. Within this interface, embedding-based semantic retrieval enables efficient natural-language search over a corpus of subsurface-specific documents. Benchmarking shows that half-precision vector quantisation combined with HNSW indexing delivers substantial reductions in query latency with minimal impact on retrieval quality, enabling interactive use at scale. While these techniques are well established in general information retrieval, their application and performance characteristics for subsurface acquisition and processing reports are evaluated here.
Gonzalez, K., Sansal, A., Valenciano, A. and Lasscock, B. [2025]. Well log foundation model – Making promptable AI models for interpretation. IMAGE 2025, Proceedings Gonzalez, K., Sylvester, Z., Valenciano, A. and Lasscock, B. [2024]. From well logs to 3D models: A case study of automated stratigraphic correlation in the Midland Basin. IMAGE 2024, Proceedings, 10.1190/image2024-4101544.1.
Google. [2025]. Agent Development Kit (ADK) Documentation. Google AI. Retrieved from https://google.github.io/adk-docs/.
Hoyer, S. and Hamman, J. [2017]. Xarray: N-D labeled arrays and datasets in Python. Journal of Open Research Software, 5(1), 10.
Karpukhin, V., Oğuz, B., Min, S., Lewis, P., Wu, L., Edunov, S., Chen, D. and Yih, W.-T. [2020]. Dense Passage Retrieval for Open-Domain Question Answering. In 2020 Conference on Empirical Methods in Natural Language Processing (EMNLP), Proceedings, 6769–6781.
Michell, B., Sansal, A., Lasscock, B. and Roberts, M. [2025]. MDIO v1: Schematizing seismic data for AI and processing. IMAGE 2025, Proceedings
PGVector. [2025]. Open-source vector similarity search for Postgres (Version 0.8.x) [Computer software]. https://github.com/pgvector/ pgvector.
PGVector. [2025]. HNSW index support. GitHub documentation. https://github.com/pgvector/pgvector?tab=readme-ov-file#hnsw.
Sansal, A. [2025a]. mdio-python: Python library for the MDIO multidimensional energy data format (Version 1.1) GitHub https://github. com/TGSAI/mdio-python.
Sansal, A. [2025b]. segy: The Ultimate Python SEG-Y I/O with Cloud Support and Schemas (Version 0.4.1.post2). https://github.com/ TGSAI/segy.
Sansal, A., Lasscock, B. and Valenciano, A. [2023a]. MDIO: Open-source format for multidimensional energy data. The Leading Edge, 42(7), 465–473.
Sansal, A., Lasscock, B. and Valenciano, A. [2023b]. Integrating energy datasets: the MDIO format. First Break, 41(10), 69-75.

Sofia Damaris Alvarez Roa1*, Md Arhaan Ahmad2, Guillaume Bayvet3, Aymeric Besnard3, Nikhil S. Deshmukh2, Eliott Gallone3, Juan Sebastián Gómez-Neita1,4, Angélica González Preciado1, Ángela Mishelle Ramos Pulido1, Lopamudra Sharma2, Juan Esteban Tamayo Sandoval1, Julie Vieira3 and Abhinav Vishal2
Competition results
Congratulations to the teams who prepared technical reports and gave excellent online presentations in the semi-final round of the 2025 Minus CO2 Challenge, and to the three finalist teams who presented in person at the Global Energy Transition (GET) Conference in Rotterdam, Netherlands in October 2025 (Figure 1).
A. ‘Carbon Cartographers’ Rajiv Gandhi Institute of Petroleum Technology, India (RGIPT).
B. ‘Uni4storage’ UniLaSalle, France, Beauvais.
C. ‘GeoAndes’ Pedagogical and Technological University of Colombia, Sogamoso (UPTC).
Introduction
The Minus CO2 Challenge 2025, organised by the EAGE Student Affairs Committee in collaboration with Dalhousie University, aimed to evaluate the potential of Cambro-Ordovician saline aquifer systems (COSS) for carbon and energy storage at global and regional scales (Figure 2). The project was structured in two stages, combining a literature-based global and regional screening of Cambrian saline aquifers with the design of a geological carbon storage (GCS) project in Southern Ontario, targeting long-term injection of approximately 20 Mtpa of CO2 over 20 years. Growing interest in carbon capture and storage (CCS) reflects its strategic role in climate change mitigation; a geological CO2 storage resource is defined as the quantity of CO2 that can be securely stored in a geological formation (SPE,
2017). This study adopts the carbon-sequestration geosystem concept (Hart, 2024), in which storage capacity is governed by reservoir properties, trapping mechanisms, and environmental, economic, and regulatory context. COSS are recognised as attractive storage targets due to their favourable geological and geochemical characteristics, depth, thickness, and operational suitability, with documented occurrences across North America, Europe, China, and the Middle East, several of which host active or planned CCS projects. While Western Canadian COSS are relatively well characterised, this study focuses on Ontario, Canada’s most industrialised province, which was not evaluated in the US Carbon Storage Atlas (NETL, 2015). Nevertheless, Eastern Canadian COSS exhibit the key elements of a carbon-sequestration geosystem, indicating strong potential for CCS deployment. Accordingly, the suitability of the Ontario COSS is assessed through static and dynamic reservoir modelling, capacity and pressure analysis, and economic and societal evaluation.
The Uni4Storage team (UniLaSalle, France) conducted a structured screening during Phase 1, classifying 12 Cambro–Ordovician basins worldwide based on UNFC and SPE-SRMS criteria, integrating geoscientific data, project maturity, and the economic, institutional, and social context. This led to three categories: favourable basins (Illinois, Western Canadian

(A) L.
and A.
(B) E. Gallone, J. Vieira, G. Bayvet, A. Besnard (Uni4storage), (C) J. Tamayo, S. Alvarez, A. Ramos, A. González (GeoAndes).
1 Universidad Pedagógica y Tecnológica de Colombia | 2 Rajiv Gandhi Institute of Petroleum Technology
3 UniLaSalle Polytechnic Institute | 4 Universidade Federal do Rio Grande do Sul
* Corresponding author, E-mail: sofia.alvarez@uptc.edu.co
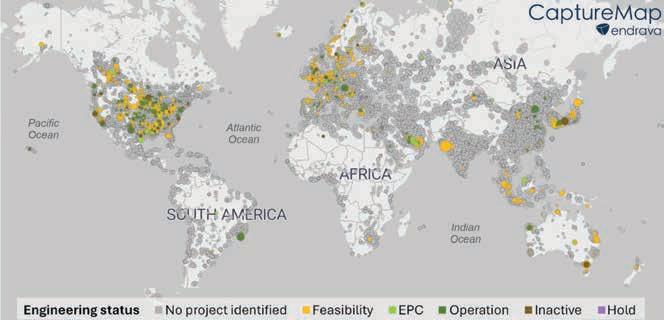
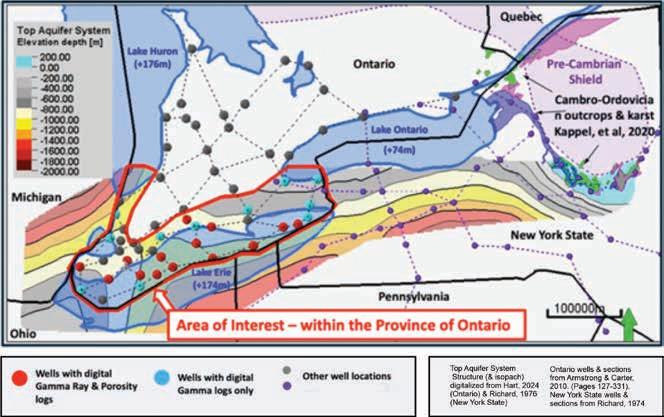
Alberta, Williston, Precaspian, Ordos), characterised by active CCS projects (Peck et al., 2013; SPE, 2017; Government of Alberta, 2023), good injectivity, and supportive regulatory frameworks; moderately favourable basins (Baltic, Michigan, Murzuq, Tarim), requiring further studies despite preliminary data; and unfavourable basins (Tunguska, Amadeus, Quebec), limited by data scarcity or geographic and regulatory constraints.
The Carbon Cartographers team (RGIPT, India) developed a complementary literature-based global ranking workflow, integrating reservoir quality, seal integrity, tectonic stability, pressure regime and hydrodynamics, along with data availability and project maturity, consistently aligned with UNFC and SPE-SRMS frameworks (SPE, 2017). Their ranking identified Scandinavia as the most attractive region due to high-quality Cambrian sandstones, regionally continuous shale seals, strong tectonic stability, and advanced CCS maturity. China ranked second, with widespread but more uncertain Cambrian reservoirs, while Russia ranked lower owing to limited data accessibility, volcanic complexity, and lower project maturity.
The GeoAndes team (UPTC, Colombia) framed the global screening within the concept of carbon-sequestration geosystems, emphasising that storage capacity is controlled by reservoir thickness, porosity, permeability, efficiency, and regulatory
Figure 2 Global screening of carbon storage systems. Summary map. Modified from Capturemap (2024).
Figure 3 Study Area in the Ontario Province, Canada. Modified from Rickard (1973), Armstrong and Carter (2010), and Hart (2024).
context (SPE, 2017; Hart, 2024). They highlighted the global occurrence of COSS in North America, Europe, China, and the Middle East, many of which already host active or planned CCS projects, supporting their relevance as first-order storage targets.
The study area lies in Eastern Canada between Lakes Huron, Erie, and Ontario, along the US border (Figure 3). The COSS consists of a mixed siliciclastic-carbonate succession with significant potential for CO2 storage in deep saline aquifers. As part of the CO2 Minus Challenge, teams were provided with geophysical log data from 24 wells. Stratigraphic interpretation identified four main units: the Mt. Simon Formation, the Lower and Upper Eau Claire formations, and the Trempealeau Formation. In addition, structural maps defining the top and base of the CambrianOrdovician succession were also provided (Rickard, 1973; Hart, 2024). The well dataset includes gamma ray, density, PEF, and neutron logs.
The Uni4Storage team (UniLaSalle, France) identified two main reservoirs: the Mount Simon Sandstone, the thickest deep clastic unit, and the Lower Eau Claire interval, comprising a porous basal sandstone to sandy dolostone overlain by a tighter dolos-
tone acting locally as an internal baffle. Regionally continuous (Figure 4) seals were mapped above both reservoirs. Net reservoir volume was derived using porosity- and shale-constrained net-togross ratios, and total pore volume was calculated from effective porosity (Equation 1). A storage efficiency of ~1-5%, consistent with large-scale saline aquifer studies, yields a theoretical multi-hundred-megaton capacity, supporting a ~400 MtCO2 injection target over 20 years (Table 1).
under SPE-SRMS as 1C ~220 Mt, 2C ~0.82 Gt, and 3C ~3.28 Gt.
Overall, the Cambrian aquifer system was inferred to have been confined at injection timescales, limiting pressure dissipation and injection rates, but enhancing long-term containment through restricted plume migration and dominant residual and solubility trapping.
The GeoAndes team (UPTC, Colombia) evaluated multiple injection scenarios. A first case with 56 injection wells did not reach the 20 Mtpa target, leading to a second scenario with 100 wells (Figure 7). Achievable injection rates were 4986 Mtpa (56 wells) and 7695 Mtpa (100 wells), with cumulative injections of ~32.2 Mt and ~51.3 Mt, respectively, demonstrating that ~20 Mtpa is not technically feasible under these assumptions. Using the Bump and Hovorka (2024) pressure-space approach, mean static
The GeoAndes team (UPTC, Colombia) developed an independent well-based static model, identifying sandstone and dolostone facies mainly in the southeastern area. Grid sizes of 500-1000 m (Figure 5) yielded average porosity of ~3.58% and a total pore volume of ~69.6 km³. Harmonic upscaling and geostatistical permeability modelling indicated low permeability, suggesting limited pressure dissipation and constrained storage performance.
The Carbon Cartographers team (RGIPT, India) constructed a 3D Petrel model with ~100 vertical layers (Figure 6). Conventional log-derived porosity (~10–13%) was preferred over higher machine-learning estimates (~18–22%), which were considered optimistic. The resulting model showed NTG ~0.75 and net pore volume ~1.78 × 10¹¹ m³. Static volumetric calculations yielded an upper-bound capacity of ~3.3 Gt CO2, while a pressure-constrained assessment for this confined system gave a realistic capacity of ~0.82 Gt CO2, classified
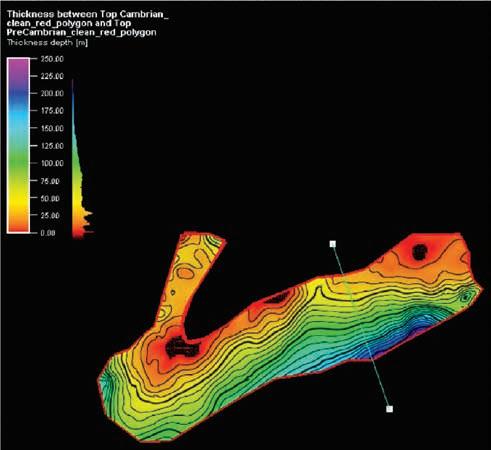
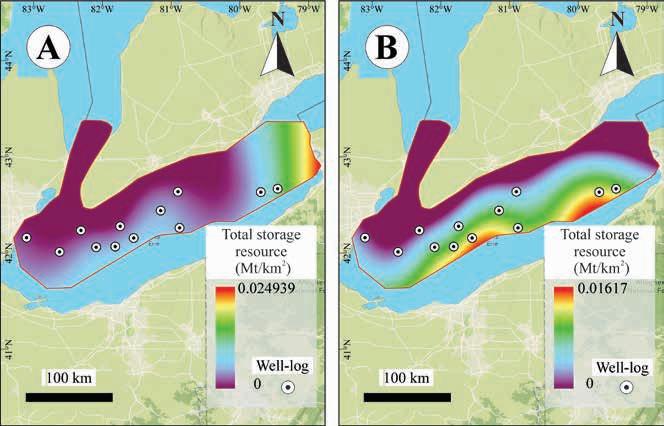
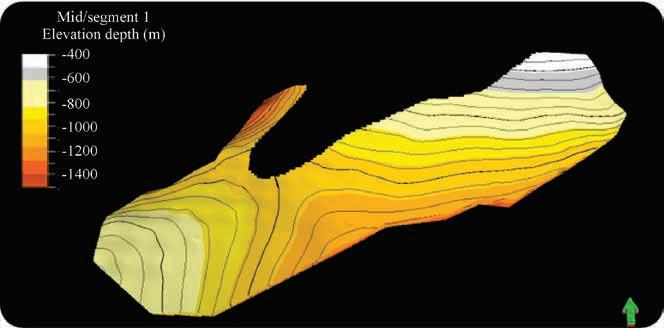
Figure 5 Calculated repository potential of the COSS injection interval in eastern Ontario. A) Total storage resource for the sandstone repository. B) Total storage resource for the sandstone and dolostone repositories.
capacities of ~140 Mt (sandstone) and ~237 Mt (sandstone + carbonate) were estimated (Table 2).
The Uni4Storage team (UniLaSalle, France) adopted a coupled inject-produce strategy, simulating 24 injection wells (five high-rate in the Mount Simon, nineteen lower-rate in the
Table 2 Storage capacity for the studied sedimentary succession. Algorithm from Bump and Hovorka (2024).
Lower Eau Claire) for a total injection rate of ~20 Mtpa. Over 20 years, this configuration stores ~400 Mt CO2. Active brine production in the Mount Simon Formation was used to control pressure, maintain BHP below BHP_max and fracture pressure, protect caprock integrity, and extend effective storage
efficiency, enabling scalability toward 20 Mtpa-class projects (Table 3).
The Carbon Cartographers team (RGIPT, India) conducted CMG simulations with Petrel-based geological models. Their base-case scenario injected 20 Mtpa via 40 wells (~0.5-0.55 Mtpa per well) over ~30 years, corresponding to ~600 Mt CO2 injected, with an upside case extending injection to ~41 years and approaching ~820 Mt CO2 (Figure 8). Results showed that injectivity is not the limiting factor; instead, pressure management and available pressure space control feasible injection rates and well count are the limiting factors.
The GeoAndes team developed a cost model initially assuming 20 Mtpa injection with 56 offshore wells. Based on Smith et al. (2021) and Mohamadi-Baghmolaei et al. (2025), estimated Capex is $964 million and Opex ~$67 million/yr, yielding an IRR >18% and a levelised storage cost of ~$83/tCO2 (Table 4). Due to pressure and injectivity constraints, the injection rate was revised to ~2.6 Mtpa, and cash-flow analyses were performed for a baseline case and 56 and 100-well scenarios, consistent with dynamic modelling results.
The Carbon Cartographers team evaluated the levelised cost of CO2 transport and storage, excluding capture costs but still accounting for drilling, surface facilities, Opex, infrastructure reuse, and policy incentives. Incorporating federal CCUS tax credits and regulatory support, they obtained a levelised transport and storage cost of ~$5/tCO2, with sensitivity analyses confirming robustness to variations in injection rate, well count, and carbon price (Table 5).
The Uni4Storage team conducted a long-term economic evaluation, estimating Capex of CAD 2.206 billion and Opex of CAD 232 million. Assuming a CO2 price of CAD 25/t, an 8% inflation rate, and a 20-year horizon, the project would generate ~CAD $10 billion in revenues, with a return on investment of 13.92%, an IRR of 12.62%, and a net present value (NPV) of ~CAD $750 million (Figure 9).
Risks and uncertainties / quality, health, safety, and environment (QHSE)
GeoAndes (UPTC, Colombia) highlighted that CO2 injection in saline aquifers entails safety risks that must be managed over the full project lifecycle. Based on conceptual pre- and post-injection models (Worden, 2024), they noted that Southern Ontario
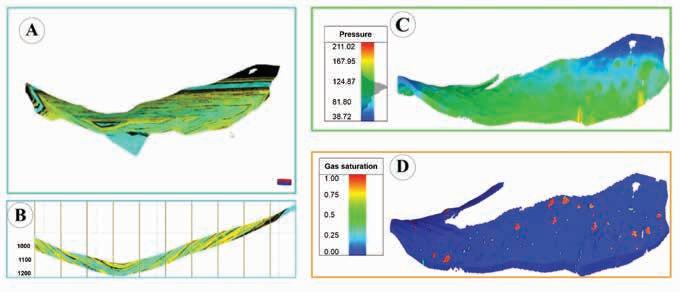
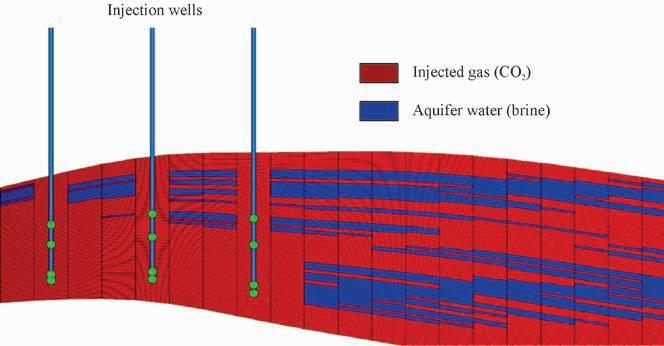
7 Model of the COSS. A) Static threedimensional representation of the COSS model for the Ontario study area. B) Representative crosssectional view of the static model, illustrating the stratigraphic framework. C) Spatial distribution of reservoir pressure corresponding to the second simulation scenario. D) Gas saturation distribution following CO2 injection, highlighting plume evolution within the storage formation.
exhibits low natural seismicity and no major fault systems (Shafeen et al., 2004), although pressure-induced seismicity remained a potential risk in the confined (COSS). They further emphasised that multiple injection wells improve pressure distribution, monitoring capability, and risk mitigations (Bump and Hovorka, 2024). Due to the great age of the hydrogeological system and the presence of highly saline brines, they considered that the risk of potable groundwater contamination is low. However, offshore injection beneath Lake Erie introduces additional transport and storage risks.
Carbon cartographers (RGIPT, India) focused on containment risks and technical uncertainties, identifying potential leakage
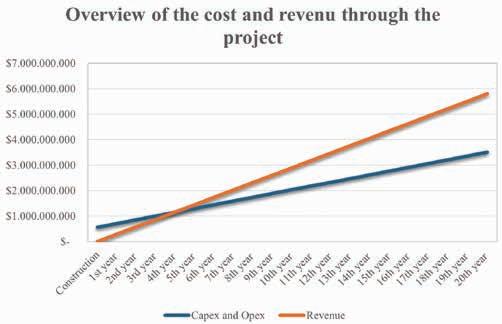
through faults, caprock discontinuities, and legacy wells. They reported the presence of approximately 2500 undocumented wells, with ~189 wells shallower than ~700 m considered most vulnerable due to possible cement degradation. While natural seismicity is low, they stressed that pressure build-up may induce seismicity, requiring conservative pressure management. They also highlighted uncertainties related to porosity, permeability, sweep efficiency, effective CO2 saturation, pressure behaviour during injection, geochemical interactions between CO2, brine, reservoir rock and cement, and variations in brine chemistry and CO2 stream composition.
Uni4Storage (UniLaSalle, France) framed QHSE as essential to maintaining a social licence to operate and integrated it directly into project design. Their approach was based on four pillars: containment, ensured by injection into deep, highly saline formations isolated from freshwater and operated below bottom-hole and fracture pressure limits; monitoring, including continuous wellhead surveillance, downhole pressure gauges, and repeated subsurface imaging; risk management, through lifetime integrity assessments of all injection and legacy wells (cement, casing, corrosion); and community value creation, via co-production of low-carbon heat and local employment linked to drilling, pipelines,
heat network operation.
Overall, QHSE was treated as a core design constraint, integrating geological risk, operational safety, and social acceptance from project inception through long-term operation.
These studies demonstrated that COSS, and in particular the Eastern Cambro-Ordovician Saline System (COSS) in Southern Ontario, offer substantial and realistic potential for large-scale geological carbon storage. While static volumetric estimates indicate very large theoretical capacity, pressure space rather than pore volume governs feasible long-term storage.
Integrated static geological modelling, pressure-based capacity assessment, dynamic reservoir simulation, and economic analysis indicated that sustained injection of 20 Mtpa CO2 is technically and economically achievable when injection is distributed across approximately 40 wells. Targeting the Mount Simon Sandstone in the southern Ontario-Lake Erie region provides favourable depth, capacity, and proximity to major emission sources.
The authors would like to express their sincere appreciation to the judges, organisers, and administrators of the international challenge within which this work was developed. Their technical guidance, rigorous evaluation, and constructive feedback were essential to strengthening the quality and impact of the manuscript. We particularly acknowledge the significant commitment of time and expertise provided alongside their full-time professional responsibilities.
We gratefully acknowledge Antonia Hardwick (Lithothermal Resources / Hardwick Geophysical Limited), Laurent Fontanelli (UniLaSalle), Joeri Brackenhoff (TU Delft), Thomas Finkbeiner (Kaust), Arjan Kamp (Adnoc / Total), Roger Clark (University of Leeds), Dick Jackson (Geofirma / University of Waterloo), Grant Wach (Dalhousie University), and Bill Richards (Dalhousie University) for their rigorous technical review, expert insights, and valuable recommendations.
We also extend our sincere thanks to Maria Jose Rodriguez and Maria Paula Bohorquez Tellez of the EAGE for their institutional support, coordination, and administrative management, which were instrumental to the successful development and dissemination of this project in an international academic setting.
Armstrong, D.K. and Carter, T. R. [2010]. The subsurface Paleozoic stratigraphy of Southern Ontario (Ontario Geological Survey Special Volume 7, 301 pp.). Ontario Geological Survey. ISBN 978-1-44351847-5.
Bump, A.P. and Hovorka, S.D. [2024]. Pressure-constrained assessment of CO2 storage resources in saline aquifers. International Journal of Greenhouse Gas Control, 132, 104090.
CaptureMap. [2024]. Global CO2 capture and storage projects database. https://www.capturemap.org.
Government of Alberta. [2023]. Carbon capture, utilization and storage (CCUS) in Alberta. Alberta Energy Regulator, Edmonton.
Hart, B.S. [2024]. Carbon sequestration geosystems: A framework for geological CO2 storage assessment. International Journal of Greenhouse Gas Control, 128, 103942.
Mohamadi-Baghmolaei, M., Ghorbani, A. and Zendehboudi, S. [2025]. Economic evaluation of large-scale CO2 storage projects under uncertainty. Journal of Petroleum Science and Engineering, 235, 111641.
NETL (National Energy Technology Laboratory). [2015]. Carbon Storage Atlas – Fifth Edition. U.S. Department of Energy, Pittsburgh, PA.
Peck, W.D., Bachu, S., Knudsen, D.J., Hauck, T., Crotty, C.M., Gorecki, C.D., Sorensen, J., Peterson, A. and Melnik, A. [2013]. CO2 storage resource potential of the Cambro-Ordovician Saline System in the western interior of North America. Energy Procedia, 37, 5230-5239. https://doi.org/10.1016/j.egypro.2013.06.439
Rickard, L.V. [1973]. Stratigraphy and structure of the subsurface Cambrian and Ordovician carbonates of New York. New York State Museum and Science Service Bulletin 432.
Shafeen, A., Croiset, E., Douglas, P.L. and Chatzis, I. [2004]. CO2 sequestration in Ontario, Canada. Part I: Storage evaluation of deep saline aquifers. Energy Conversion and Management, 45, 2645–2659.
Smith, J.A., Brown, T.R. and Wilson, K.L. [2021]. Cost estimation for CO2 injection wells and surface facilities. International Journal of Greenhouse Gas Control, 109, 103351.
Sminchack, J. [2025]. Geological carbon storage potential of the Illinois Basin. Environmental Geosciences, 32(1), 45–62.
SPE (Society of Petroleum Engineers). [2017]. CO2 Storage Resources Management System (SRMS). SPE, Dallas, TX.
Worden, R.H. [2024]. Conceptual models for CO2 injection and post-injection behaviour in saline aquifers. Geological Society, London, Special Publications, 528, 1–18.


1-6
dgg2026.dgg-tagung.de
6-7 May DGMK/ÖGEW Spring Conference 2026 dgmk.de/en/events/dgmk-oegew-spring-conference-2026/
11-13 May First EAGE/ALNAFT Workshop – Unlocking Hydrocarbon Potential of West Mediterranean Offshore Frontier Basin of Algeria www.eage.org
May Second EAGE/ALNAFT Workshop on Techniques of Recovery of Mature Fields and Tight Reservoirs www.eage.org
May 8 th Asia Pacific Meeting on Near Surface Geoscience & Engineering www.eage.org
18-20 May Fifth AAPG/EAGE Hydrocarbon Seals Workshop www.eage.org
19-22 May InterPore2026 www.interpore.org
www.eage.org
www.eage.org
2026 1-4 Jun ARPEL Conference 2026 www.arpel.org
8-11 Jun 87 th EAGE Annual Conference & Exhibition www.eageannual.org
2026 21-22 Jul EAGE Workshop on Reservoir Intelligence: From Data to Decisions www.eage.org
27-31 Jul 9 th EAGE Conjugate Margin Conference & Exhibition www.eage.org
28-29 Jul APGCE 2026 Curtain Raiser: EAGE Workshop on Exploration and Opportunities in the Paleogene Play www.eage.org
August 2026 11-12 Aug EAGE Conference on Deepwater, Decarbonisation and New Energies www.eage.org
September 2026
1-2 Sep EAGE Exploration Workshop: Unlocking New Zealand’s Upstream Potential www.eage.org
7-9 Sep Fifth EAGE Marine Acquisition Workshop www.eage.org


SSA Unlocking Energy potential through research, technology & innovation


13-15 APRIL 2026


Early Registration Deadline: 9 March 2026


NOW AND BE PART OF THIS IMPORTANT REGIONAL DIALOGUE.


Join us at the EAGE Sub-Saharan Africa Energy Forum, taking place 13-15 April 2026 in Maputo, Mozambique. Engage with industry leaders and experts to discuss key developments , opportunities, and the evolving energy landscape across Sub-Saharan Africa.