
SPECIAL TOPIC
Data Management and Processing
EAGE NEWS Unmissable field trips for Oslo 2024
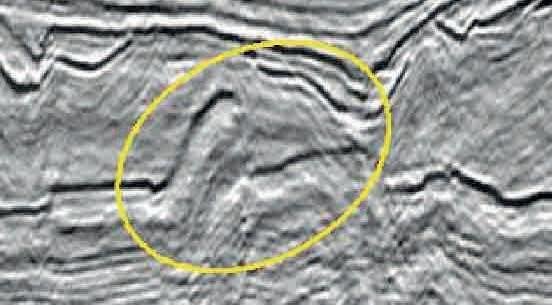
TECHNICAL ARTICLE Deep structural imaging in the Vienna basin

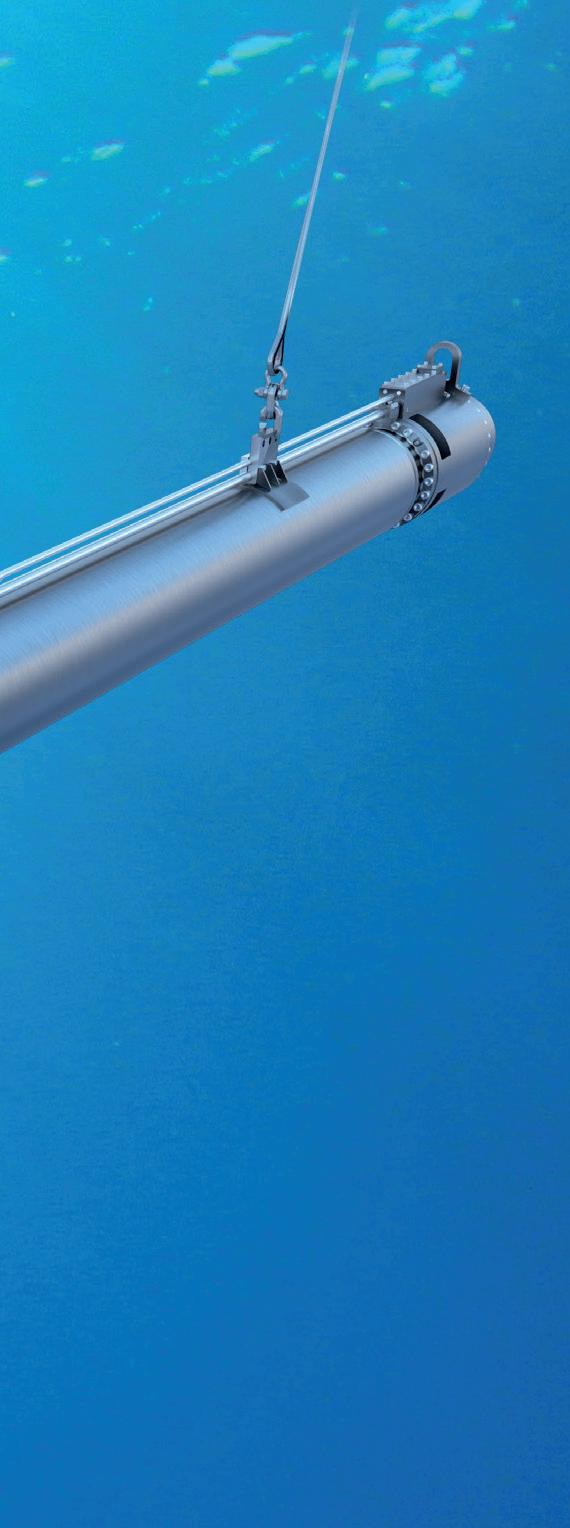
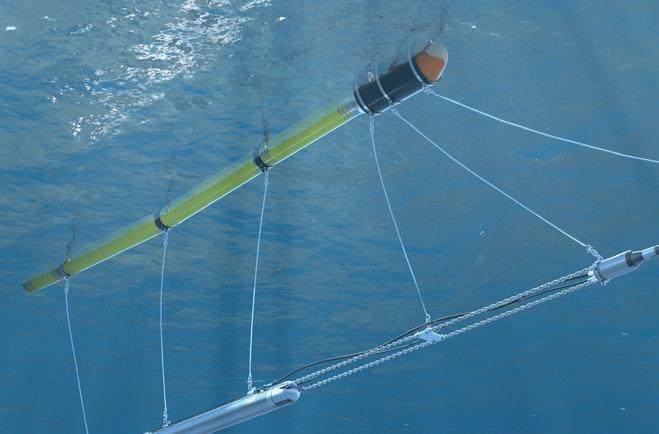
(TUNED PULSED SOURCE)


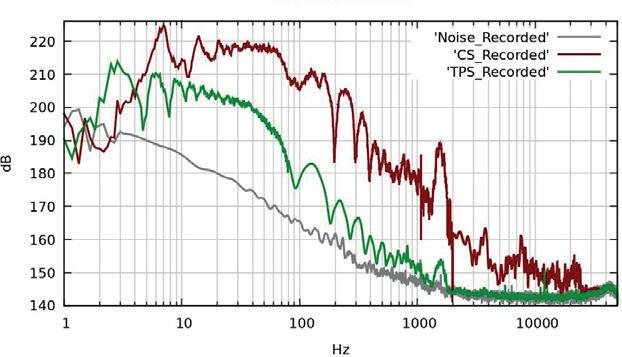
Innovative Low Frequency Broadband Marine Seismic Source

SPECIAL TOPIC
EAGE NEWS Unmissable field trips for Oslo 2024
TECHNICAL ARTICLE Deep structural imaging in the Vienna basin
Innovative Low Frequency Broadband Marine Seismic Source
TPS provides geophysical clarity by enhancing the quality and value of seismic data and enabling effective imaging of the most complex geologies. It has been successfully deployed in commercial marine acquisition operations.
Choose TPS to Optimize Your Marine Seismic Acquisition
•Improved imaging
•Reduced environmental impact
•Enhanced operational efficiency
•Improved safety


CHAIR EDITORIAL BOARD
Gwenola Michaud (gmichaud@gm-consult.it)
EDITOR
Damian Arnold (arnolddamian@googlemail.com)
MEMBERS, EDITORIAL BOARD
• Lodve Berre, Norwegian University of Science and Technology (lodve.berre@ntnu.no)
Philippe Caprioli, SLB (caprioli0@slb.com) Satinder Chopra, SamiGeo (satinder.chopra@samigeo.com)
• A nthony Day, PGS (anthony.day@pgs.com)
• Peter Dromgoole, Retired Geophysicist (peterdromgoole@gmail.com)
• Kara English, University College Dublin (kara.english@ucd.ie)
• Stephen Hallinan, CGG Stephen.Hallinan@CGG.com
• Hamidreza Hamdi, University of Calgary (hhamdi@ucalgary.ca)
Clément Kostov, Freelance Geophysicist (cvkostov@icloud.com) Pamela Tempone, Eni (Pamela.Tempone@eni.com)
• A ngelika-Maria Wulff, Consultant (gp.awulff@gmail.com)
EAGE EDITOR EMERITUS
Andrew McBarnet (andrew@andrewmcbarnet.com)
MEDIA PRODUCTION
Saskia Nota (firstbreakproduction@eage.org)
PRODUCTION ASSISTANT
Ivana Geurts (firstbreakproduction@eage.org)
ADVERTISING INQUIRIES corporaterelations@eage.org
EAGE EUROPE OFFICE
Kosterijland 48 3981 AJ Bunnik
The Netherlands +31 88 995 5055
• eage@eage.org www.eage.org
EAGE MIDDLE EAST OFFICE
EAGE Middle East FZ-LLC Dubai Knowledge Village Block 13 Office F-25 PO Box 501711 Dubai, United Arab Emirates
• +971 4 369 3897
• middle_east@eage.org
• www.eage.org
EAGE ASIA PACIFIC OFFICE
UOA Centre Office Suite 19-15-3A No. 19, Jalan Pinang 50450 Kuala Lumpur
Malaysia
• +60 3 272 201 40 asiapacific@eage.org
• www.eage.org
EAGE AMERICAS SAS Av. 19 #114-65 - Office 205 Bogotá, Colombia
• +57 310 8610709
• +57 (601) 4232948
• americas@eage.org www.eage.org
EAGE MEMBERS CHANGE OF ADDRESS NOTIFICATION
Send to: EAGE Membership Dept at EAGE Office (address above)
FIRST BREAK ON THE WEB www.firstbreak.org
ISSN 0263-5046 (print) / ISSN 1365-2397 (online)
Streamlining energy and production data management from field to processing.
31 Deep structural imaging in the Vienna basin
Ahmed Mamdouh, Klaus Pelz, Sandor Bezdan, Erika Angerer, Alexandra Oteleanu, Harald Granser, Abdelrahman Abubakr, Alexander Sakharov and Ian F. Jones
37 Applied fault topology: understanding connectivity and uncertainty of fault systems that define and affect commercial and environmental projects
Frank Richards, Mark Cowgill and Megan Rayner
47 Automating the data flow — how AI and ML can reimagine subsurface data management
Christopher Hanton and Venkatesh Anantharamu
52 Streamlining energy and production data management from field to processing
Kristy DeMarco
57 Large-scale industrial deployment of machine learning workflows for seismic data processing
Julien Oukili, Jyoti Kumar, Jon Burren, Steve Cochran, Martin Bubner, Denis Nasyrov and Bagher Farmani
65 How the latest SEG-Y revision will improve data management
Jill Lewis, Shawn New, Joel Allard and Victor Ancira
69 Data agility: Innovative approaches to subsurface data management
Jose Chapela
73 Affordably making the invisible unmissable Neil Hodgson, Karyna Rodriguez, Helen Debenham and Lauren Found
77 Advanced imaging of hybrid acquisition data: Exploring new frontiers
Sylvain Masclet, Fang Wang, Guillaume Henin, Loic Janot, Olivier Hermant, Hao Jiang, Nicolas Salaun, David Le Meur and Daniela Donno
86 Calendar

Esther Bloem Chair
Andreas Aspmo Pfaffhuber Vice-Chair
Micki Allen Contact Officer EEGS/North America
Adam Booth Committee Member
Hongzhu Cai Liaison China
Deyan Draganov Technical Programme Officer
Wolfram Gödde Liaison First Break
Hamdan Ali Hamdan Liaison Middle East
Vladimir Ignatev Liaison CIS / North America
Musa Manzi Liaison Africa
Myrto Papadopoulou Young Professional Liaison
Catherine Truffert Industry Liaison
Mark Vardy Editor in Chief Near Surface Geophysics
Florina Tuluca Committee member
Oil & Gas Geoscience Circle
Yohaney Gomez Galarza Chair
Johannes Wendebourg Vice-Chair
Lucy Slater Immediate Past Chair
Erica Angerer Member
Wiebke Athmer Member
Tijmen Jan Moser Editor-in-Chief Geophysical Prospecting
Adeline Parent WGE & DET SIC liaison
Matteo Ravasi YP Liaison
Jonathan Redfern Editor-in-Chief Petroleum Geoscience
Aart-Jan van Wijngaarden Technical Programme Officer
Carla Martín-Clavé Chair
Giovanni Sosio Vice-Chair
SUBSCRIPTIONS
First Break is published monthly. It is free to EAGE members. The membership fee of EAGE is € 80.00 a year including First Break, EarthDoc (EAGE’s geoscience database), Learning Geoscience (EAGE’s Education website) and online access to a scientific journal.
Companies can subscribe to First Break via an institutional subscription. Every subscription includes a monthly hard copy and online access to the full First Break archive for the requested number of online users.
Orders for current subscriptions and back issues should be sent to EAGE Publications BV, Journal Subscriptions, PO Box 59, 3990 DB, Houten, The Netherlands. Tel: +31 (0)88 9955055, E-mail: subscriptions@eage.org, www.firstbreak.org.
First Break is published by EAGE Publications BV, The Netherlands. However, responsibility for the opinions given and the statements made rests with the authors.
COPYRIGHT & PHOTOCOPYING © 2023 EAGE
All rights reserved. First Break or any part thereof may not be reproduced, stored in a retrieval system, or transcribed in any form or by any means, electronically or mechanically, including photocopying and recording, without the prior written permission of the publisher.
The publisher’s policy is to use acid-free permanent paper (TCF), to the draft standard ISO/DIS/9706, made from sustainable forests using chlorine-free pulp (Nordic-Swan standard).
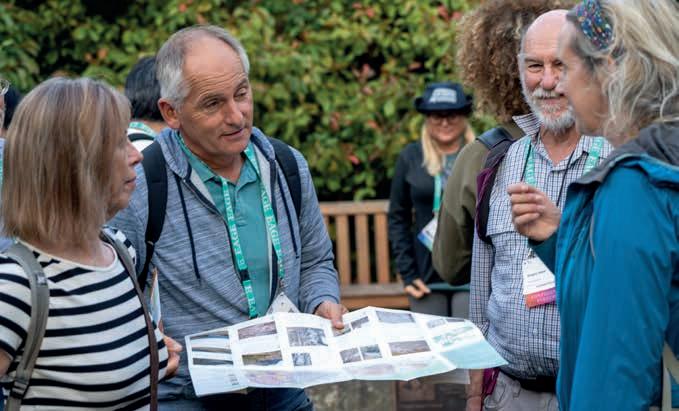
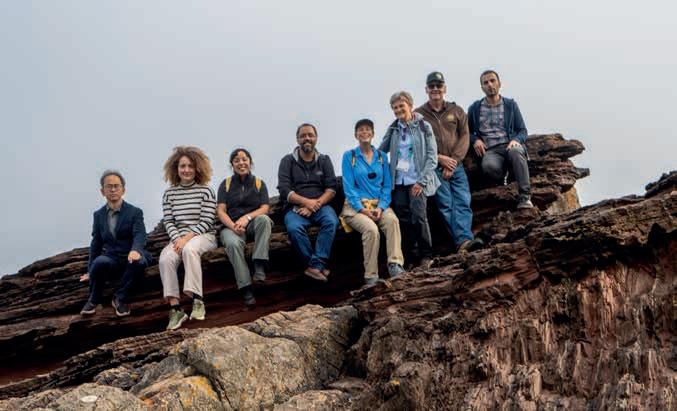
Plans for the field trips to be included in the programme for next June’s 85th EAGE Annual Conference and Exhibition in Oslo are already underway. As tradition, we will offer a wide range of interesting and knowledgeable field trips to our delegates as part of the main conference. Looking at all the positive feedback that we got from participants of field trips during the EAGE Annual Conferences in the past, we want to keep expanding our portfolio of field trips in 2024. We offer various topics in which you can choose to participate depending on your own interests.
This is a great opportunity for geologists and engineers in the energy industry to have a better insight into the geology of the Oslo region, exchange knowledge and learn from each other. A total of five field trips will be held on Sunday 9 June, Monday 10 June and Friday 14 June 2023.
The Geology Cambrian field trip is set to take place prior to the conference on Sunday 9 June. It will be a one-day field trip, starting in the morning from Lillestrøm to Huk-Bygdø to discover some small faults and folds. In the afternoon, the group will continue to visit a seismic scale fault by Oslo graben in Nessoden. On the same day, we will organise the Architecture and Geology field trip, with the support of the Natural History Museum of Oslo. Participants in this special field trip will be offered the opportunity to visit the museum
with a guided tour and an explanatory walk in the Tøyen area.
The following day, Monday 10 June, we offer a half-day field trip to Hovedøya. The island of Hovedøya is only 5 mins sailing from the Oslo harbour and the Askerhus castle. Mooring on the northern corner, delegates will walk across the southern part of the island, focusing on three uppermost Ordovician formations: Skogerholmen, Husbergøya and
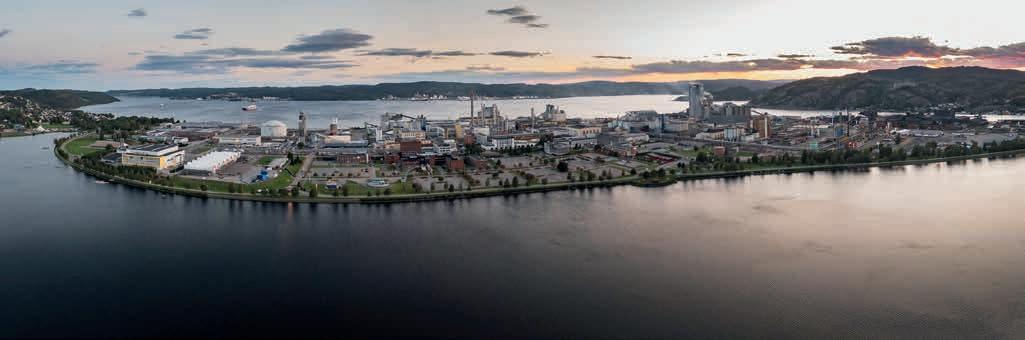
where the group can get an overview of companies engaged in the energy transition and then end with the tour of the Equinor facility focused on CO2 capture transport and sequestration.
Another field trip will take participants to the Shearwater and Norwegian Geotechnical Institute (NGI) technology centres. While NGI facilities will be the opportunity to witness geotechnical testing that can measure behaviour of geomaterials
Langøyene. Along the walk, the group will pass the ruins of a Cistercian monastery dating back to 1147 which was destroyed after the reformation in Norway in 1536.
On the last conference day, to wrap up the programme, together with our event host Equinor, is the CCS tour: Herøya Industrial Park field trip will take place on Friday 14 June 2023. The visit will kick-off with an introduction session about the main facility, followed by a tour of the park
when subjected to the loads that come from planned construction such as buildings, roads, tunnels, platforms, and the like, the Shearwater Technology and Innovation Center will guide you through the development of products to be used in geophysical data acquisition.
If you are interested in joining one of our field trips, please visit our website www.eageannual.org for more detailed information. Stay tuned for new updates in the upcoming months.
The 85th EAGE Annual Conference & Exhibition, in Oslo on 10-13 June 2024, is set to be another milestone event for the industry as we explore the contributions of geoscientists and engineers under the theme ‘Technology and talent for a sustainable energy future’. Now is the time to consider submitting an abstract for the main technical programme for which the deadline is due on 15 January 2024.
The location in Norway presents a valuable opportunity for the global geoscience audience to connect with a local
community of researchers, operators and service companies leading the transformation of the Norwegian Continental Shelf into a broad energy province.
Reflecting on the programme for the upcoming event, Erling Vågnes, SVP subsurface exploration production international, Equinor and chair, EAGE Annual 2024 Local Advisory Committee, says, ‘We look forward to a broad and balanced technical programme built on in-depth discipline knowledge, focused on technical integration for holistic solutions and on cross-fertilisation between oil and
gas, CCS, renewables and infrastructure geosciences. Abstract submissions should reflect the latest technological advances and key case studies demonstrating the contributions of our deep technical disciplines in achieving a more sustainable and secure energy future.’
Technical submission topics include Geophysics, Geology, Reservoir Engineering, Integrated Subsurface, Energy Transition, Mining & Infrastructure, and Data & Computing Science.
The Technical Programme for the Oslo Annual will be a balanced mix of topics, ranging from Energy Transition (CCS, geothermal energy, and hydrogen storage) to Near Surface (infrastructure planning and natural risk mitigation), along with a focus on O&G production and exploration. Reservoir engineering will also hold a significant spotlight. Our primary objective in crafting this programme is to facilitate knowledge sharing and the cross-fertilisation of ideas among various sectors.

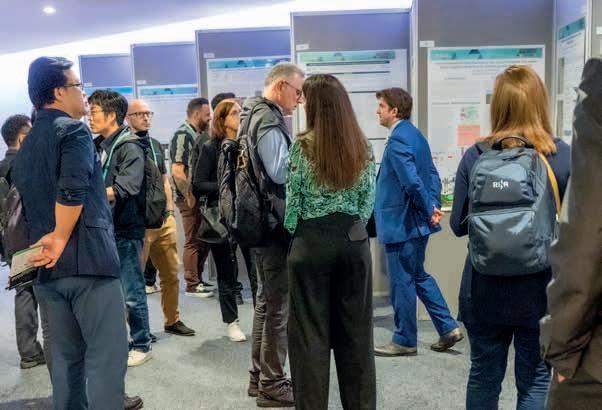
Presenters will also have the chance to choose between oral and printed poster presentation formats. The poster sessions provide a great space for presenters looking for a high level of interaction in a more relaxed setting. It also provides an opportunity for networking with more extended one-on-one discussions during the hour-long sessions.
Our Technical Programme Committee is also working closely with the Local Advisory Committee, the Research Committee and the Technical Communities to prepare high-quality workshops and dedicated sessions. More details will be released soon.
You can submit your papers and check out the new developments on the way to the EAGE Annual 2024 at www.eageannual.org.
Centered around ‘Unlocking New Energy Resources’, the 4th EAGE Eastern Mediterranean Workshop (4-6 December in Athens, Greece) delves into the intricate regional geology, structural styles, and depositional systems, shedding light on their impact on prospects and future potential in the Eastern Mediterranean. 35 papers will be presented.
The first issue of Geoenergy is available. New issues of Near Surface Geophysics and Basin Research will be published in December.
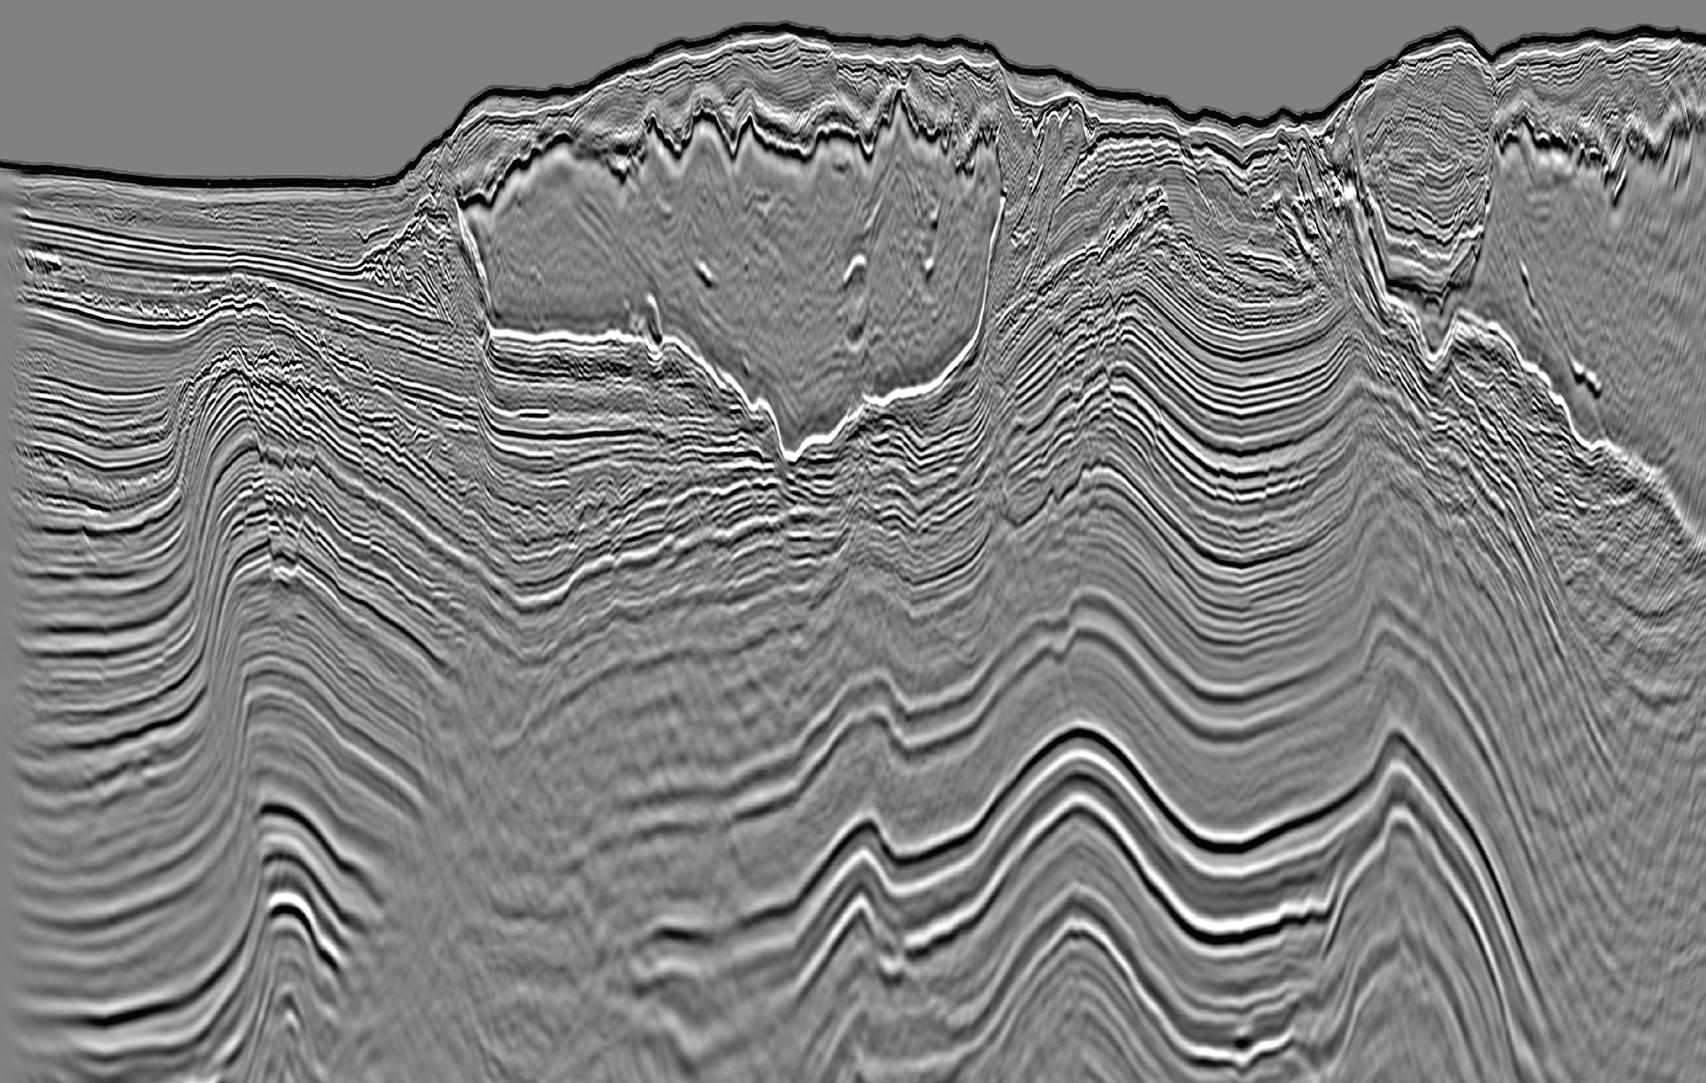
Let's play
Hint: The power of least-squares imaging with the full wavefield.
1.DUG’S MULTI-PARAMETER FWI IMAGING USING RAW FIELD DATA
2.RTM USING THE SAME RAW FIELD DATA
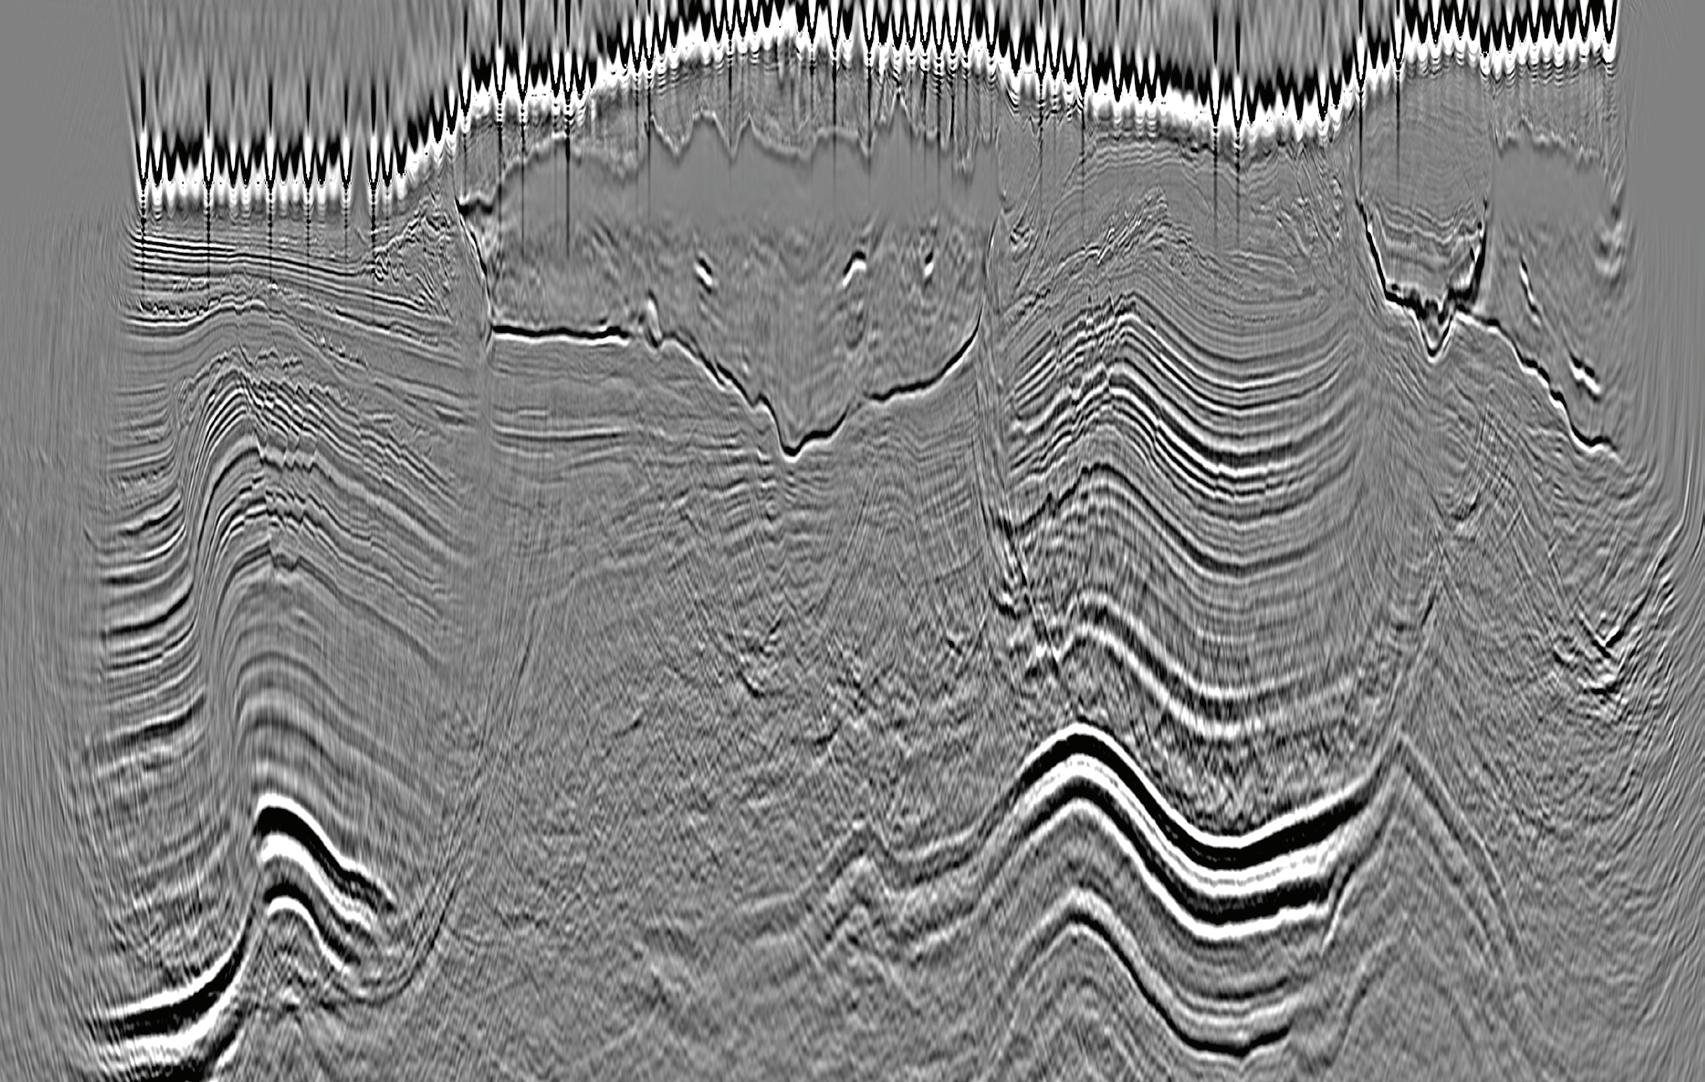
Data courtesy of Shell
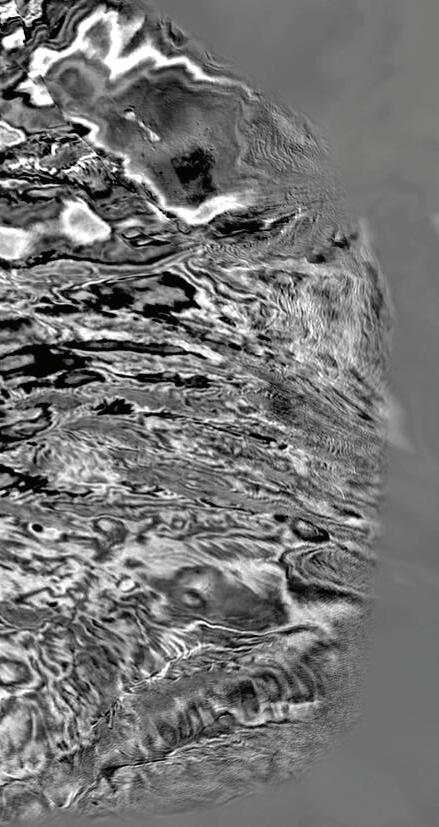
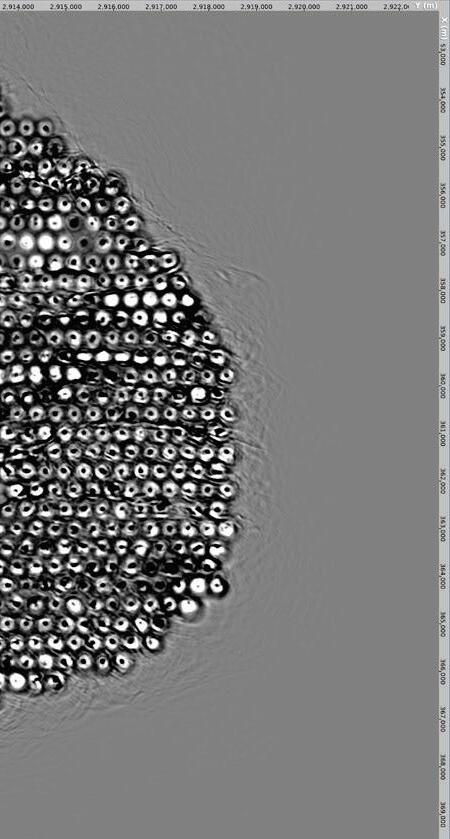
Near-surface amplitude-extraction
Answers: The top image has designature, deghosting, demultiple, interpolation, regularisation, superior focussing, superior illumination, true amplitudes, superior vertical and horizontal resolution.
Full waveform inversion. Multi-parameter. Superior resolution. Superior imaging. A complete replacement for the conventional processing and imaging workflow.
Let’s talk — contact info@dug.com
The energy industry is changing and, more than ever, creating bridges across disciplines, people and careers has become necessary to fulfill its demands. In 2023, this premise was at the heart of the EAGE Women in Geoscience and Engineering activities.
Dr Lim, she delivered a ‘thought-provoking keynote that articulated how driving equity is not just a moral imperative but also a strategic necessity for achieving sustainability. Her nuanced insights into the systemic challenges at the workplace, supply chain, and community levels

Dr Anna Lim, WGE Community chair, says that in the context of current global challenges, such as energy transition, diverse leadership can offer unique perspectives and solutions. That’s why the team organised a session on the role of women’s leadership in securing a sustainable future at the 84th EAGE Annual Vienna, ‘for its timely relevance and critical importance to promote diversity and inclusion while spotlighting the role of women in sustainability’.
The session featured Mikki Corcoran, VP of sustainability at SLB. According to
offered both a deep understanding of the issues at hand and a call to immediate action.’
The WGE Community also continued exploring ways to contribute towards an inclusive industry by hosting a discussion on ‘Neurodiversity in geosciences’. During this engaging online panel session, attendees were provided with an introduction to the topic, making it accessible to those new to the subject. The four keynote speakers not only shared their personal journeys and experiences but also discussed practical strategies
for navigating neurodivergence while pursuing fulfilling careers. Additionally, the panel addressed the prevalent but potentially misleading notion of a trade-off between accommodating work environments and productive work environments, shedding light on a complex issue within the discussion.
Participants share that ‘thanks to these engaging initiatives, they could walk away not only with actionable insights but also with a renewed sense of empowerment.’
In 2024, the WGE community will continue with its mission of growing a collaborative network across genders, ages and specialisations to support equity in the fields of geoscience and engineering. A session on ‘Empowering diverse talent in a tech-driven world’ is in the planning for our upcoming Annual Conference in Oslo.
If you would like to connect with the WGE Community, just update your affiliations – with EAGE Circles, Local Chapters, Special Interest and Technical Communities.
R. GODFREY
Update your EAGE affiliations!


The inaugural EAGE Data Processing Workshop planned for 26-28 February 2024 in Cairo, Egypt, will focus on discussions concerning the significance of data acquisition technology and computational capacity.
With the increasing demands of energy transition initiatives, such as the development of offshore wind farms, the extraction of critical minerals, decarbonisation efforts, and the shift away from fossil fuels, there is a growing need for high-resolution data processing. Furthermore, satellite imagery data is becoming increasingly prominent as the cornerstone of precise site characterisation.
Participating in this workshop presents a valuable opportunity to share the outcomes of advancements in technology and innovative thinking. It will bring together experts from the industry to engage in discussions and share their ground-breaking concepts with a global audience. Don’t miss this exceptional chance to gain insights into state-of-the-art technologies, connect with industry leaders, and contribute to the ongoing discourse. Register now to take advantage of the early bird registration rate and join us in exploring the future of energy.
Our Near Surface Geophysics ( NSG ) journal is calling for submissions of original research work relating to the multi-scale hydrogeophysical studies carried out to achieve water sustainability. Efforts will be made to include geographically well-distributed studies conducted over diverse hydrogeological terrains. The contributions can deal with water sustainability-related issues at global, regional, or local scales. Studies on the development of improved methodology for modelling and those dealing with the application of emerging technologies employing UAVs or ATVs etc. are welcome.
The journal’s premise for this Special Issue is that our planet is in the throes of extreme climate variability. Inextricable linkages of climate with the hydrosphere at different scales are playing havoc with the availability of water resources essential for the well-being and survival of humanity. Anomalous climate extremes are causing unexpected floods and long
periods of droughts in different parts of the earth, exacerbating water sustainability challenges. Hydrogeophysical investigations effectively address various related issues at global, regional, and local scales. We intend to highlight the latest applications of hydrogeophysics at various scales to address the problem of water sustainability. Topics for this call for papers include but are not restricted to: Groundwater sustainability in the time of climate extremes; Geophysical studies for groundwater sustainability at different scales and Recent advancements in geosciences to address groundwater sustainability.
Guest editors are Saurabh Verma, Subash Chandra and Virendra Tiwari (National Geophysical Research Institute, India), John Lane (USGS, USA) and Tim Munday (CSIRO, Australia). Manuscripts should be prepared according to the author’s guidelines published on the NSG website and submitted using the online submission webpage.
When submitting your manuscript, please answer the question ‘Is this submission for a special issue?’ by selecting the special issue title from the drop-down list.
All manuscripts will be peer-reviewed in accordance with the journal’s established policies and procedures. The final selection of papers will be based on the peer review process as well as reviews by guest editors and the editor-in-chief. Submission deadline is 30 June 2024.
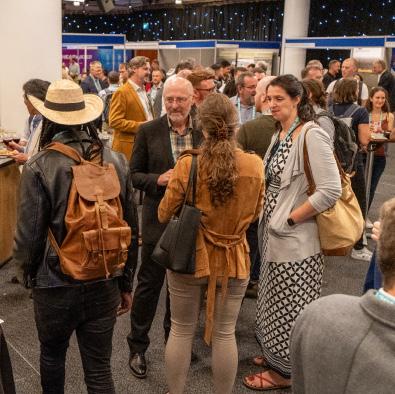
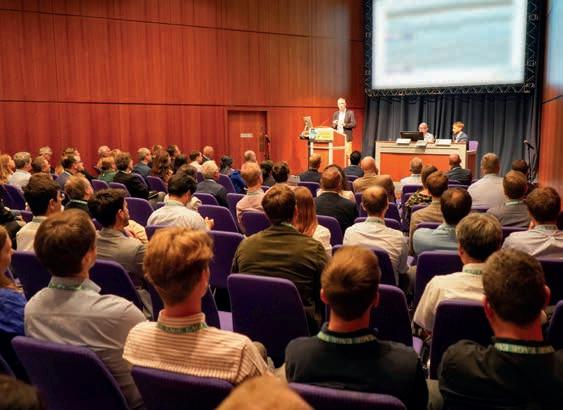
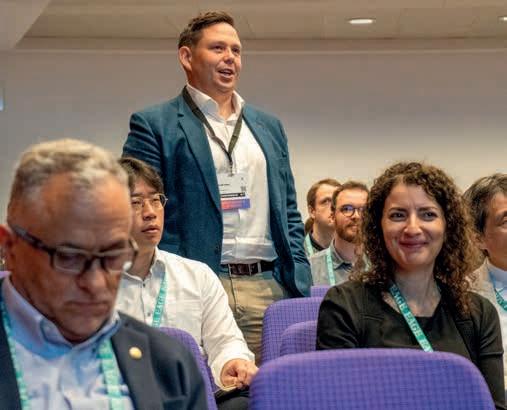
It was thrilling to welcome 560 participants to the Edinburgh event, bringing together a diverse group of academic, research, and commercial practitioners of geosciences, united with the common goal of sharing knowledge and insights.
Through the convergence of four parallel conferences: the 29th European Meeting of Environmental and Engineering Geophysics, the 3rd Conference on Geophysics for Infrastructure Planning, Monitoring and BIM, the 2nd Conference on Hydrogeophysics and the 1st Conference on Sub-surface Characterisation for Offshore Wind, the event succeeded in showcasing the synergy between different geophysical techniques.
One of the standout aspects of the conference was the growing interest in the integration of geophysical and geotechnical approaches, with a strong emphasis on supporting civil engineering, geotechnical, and infrastructure sectors. This emphasis on understanding the strengths and weaknesses of different methodologies and using the right tools for the job significantly enhances the chances of a successful survey and meaningful results.
The community’s commitment to addressing the challenges society faces today was also evident throughout the event. In a world grappling with geo- and anthropogenic hazards, energy transition, and shifts in human behaviour concerning infrastructure and soil and groundwater use, the need for geoscientists to work together and offer their insights to the public and policymakers is more crucial than ever. The willingness and urgency of policy-makers and the general public to make changes were highlighted, reinforcing the need for geoscientists to bridge the gap between their solutions and the wider world outside. Arre Verweerd, chair of the Local Advisory Committee, said: ‘Looking back on a successful four days of NSG2023 in Edinburgh, I feel we have created deeper understanding and focus as a geoscience community on the issues society is struggling with today.’
NSG2023 also shed light on significant developments in geophysics for offshore wind. With offshore wind farm expansion growing globally to meet climate targets, a deep understanding of the near-shallow subsurface is paramount for successful foundation designs. The first conference on subsurface characterisation for offshore wind held in one of Europe’s offshore wind capitals, Edinburgh, was timely. It showcased a range of new technologies and data processing methods, notably ultra-high-resolution 3D seismic imaging. This was a key highlight, as it is instrumental for wind farm foundation designs. The conference dedicated its last half-day to near-shore investigations for landfalls, an area often underrepresented but equally important for offshore wind projects. Discussions focused on the need for early consultations with various stakeholders to optimise ground modelling approaches and quantify risks effectively.
Another series of talks delved into quaternary geology, data integration, and ground modelling at various offshore wind farms across Europe. The discussions provided valuable insights into the challenges related to sedimentary and erosional environments, chalk formations, and the presence of boulders. The glacial history around the UK was a central topic, shedding light on its implications for subsurface characterisation.
Maarten Vanneste, co-chair of the 1st Conference on Sub-surface Characterisation for Offshore Wind, said: ‘As the EAGE’s first dedicated offshore wind conference, it received a lot of interest, excellent presentations, and marks a new and exciting part of the EAGE Near Surface Geoscience programme.’
Other talks during NSG2023 explored broadband processing for diffraction imaging, the repurposing of legacy seismic data, and advances in seismic data. Novel geophysical approaches, such as
surface and shear wave methods, were also discussed, including the use of fibre optic-based geophysics, i.e., digital acoustic sensing (DAS). Jonathan Chambers, chair of the 29th European Meeting of Environmental and Engineering Geophysics, said: ‘This is an exciting and rapidly emerging technology that will shape the field of near-surface geophysics for years to come.’
Moreover, the integration of machine learning in geophysics was emphasised, with a focus on using algorithms to assist
in interpretation rather than blindly following computer-generated results. This shift reflects the evolving landscape of geophysics, moving toward more intelligent and informed decision-making.
EAGE Near Surface Geoscience Conference and Exhibition will celebrate its 30th edition next year in Helsinki, and it promises to be an extraordinary milestone. Make sure to save the date, 8-12 September 2024, and keep a close watch on www.eagensg.org for the latest updates and exciting developments.
Anticipation is already building for the next EAGE Digital conference to be held in Paris on 25-27 March 2024 where the theme will be ‘Digital: Delivering better energy in a transforming world’. As the energy industry undergoes a significant change, EAGE Digital 2024 promises to be a crucial gathering for industry leaders, innovators and experts seeking to explore and shape the future of energy.
The rapidly changing landscape of the energy industry provides exceptional challenges across the value chain. Energy companies are constantly pressed to adapt their business models and practices to stay competitive in the face of pricing fluctuations and shifting demand. Amidst these challenges, the power of digital transformation emerges as a game-changer, offering unprecedented opportunities
for sweeping changes and value creation. Furthermore, collaboration with new-tech industries has become imperative in our collective pursuit of the energy transition.
In the inaugural edition of the EAGE Digital conference, we laid the foundation by focusing on the leadership aspects needed to enable digitalization and its impact on our business. The following edition dealt with digitalization as a key enabler to innovation and to the industry transformation needed through energy transition. These previous editions set the stage for the forthcoming one where our focus will be on organising with new tools and workflows to deliver the energy the world needs.
We are looking for innovative and disruptive technologies that transform the digital space across different applications
of geoscience and energy transition. Are you one of the pioneers in the digital transformation of the energy industry? Have you gained insights, knowledge, or valuable lessons from your journey with digital transformation? If so, EAGE Digital 2024 offers you a unique opportunity to share your expertise and contribute to this transformative journey. Be integral to the discussions and presentations that will shape the future of the energy sector.
There are still chances to join the line-up of our technical programme speakers. Hurry up and submit an abstract before 10 December 2023 to become a part of the event. Your contributions can make a significant impact on the industry, influencing the path it takes in this era of digital transformation.
Visit eagedigital.org for more details.

Near Surface Geophysics (NSG) is an international journal for the publication of research and developments in geophysics applied to the near surface. The emphasis lies on shallow land and marine geophysical investigations addressing challenges in various geoscientific fields. A new special edition (Volume 21, Issue 6) will be published within December.
The Third Geoscience Technologies and Applications Conference (EAGE GeoTech) will make a comeback next spring (8-10 April 2024) in The Hague with the bonus of being two workshops packaged into one event.

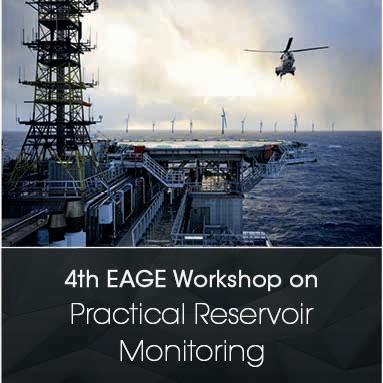
Following the success of the previous editions in 2021 (online) and 2022 (hybrid and London), the third edition of EAGE GeoTech is being adapted to in-person format, offering two technical workshops as part of one high-powered multi-disciplinary programme, namely the 4th EAGE Workshop on Distributed Fibre Optic Sensing and the 4th EAGE Workshop on Practical Reservoir Monitoring.
Basin Research (BR) publishes primary research on the science of geophysics as it applies to the exploration, evaluation and extraction of earth resources. A new edition (Volume 35, Issue 6) will be published in December.
Geoenergy focuses on the publication of timely and topical research in subsurface geoscience, critical for this new era of sustainable energy. The journal considers articles on the themes of: energy storage, subsurface disposal and storage, geothermal energy, hydrogen energy, critical minerals and raw materials, and sustainability. The first issue is still in progress and will close at the end of 2023. Accepted papers are available to read on EarthDoc.
Participants will benefit from exposure to two dedicated technical programmes, providing unique opportunities for interaction and fostering cross-discipline knowledge sharing to tackle some of the major challenges facing the industry with the ongoing energy transition.
The 4th EAGE Workshop on Distributed Fibre Optic Sensing will continue with the exploration of the well-established use of distributed optical fibre sensors for diverse energy and industrial applications. The workshop will focus predominantly on geoscience and engineering applications utilising distributed acoustic (DAS), temperature (DTS) and strain (DSS) systems, including new emerging fields of application. The technical programme will contain presentations on advancements in instrumentation including 3C optical sensors, applications, and technology integration. A special focus will also be placed on current challenges, business impacts and evolving best practices.
The 4th EAGE Workshop on Practical Reservoir Monitoring aims to show how the use of modern reservoir surveillance practices can be applied to ensure safe injection and drainage, while optimising field production and maximising value. The workshop will continue to investigate the benefits through multi-disciplinary data integration, of geophysical and engineering data, and increased digitisation that allow for improved work processes to enhance reservoir monitoring capabilities. The workshop positions itself as a great platform for showcasing embryonic ideas and technologies as well as future trends.
To learn more or submit an abstract for these workshops, please visit the conference website at www.eagegeotech.org. Abstracts submission deadline is 22 January 2024.

This year, EAGE offered its members more than 90 short courses in diverse formats, covering topics from geoscience and energy to engineering. Some of our presenters explain the rationale behind their recently introduced programmes.
A new self-paced course titled ‘Near surface modelling for static corrections’ by Ralph Bridle is accessible on Learning Geoscience, EAGE’s online learning platform. Bridle says: ‘There are many reasons to study the near-surface and it is important to define the scope of this study. For civil engineering and archaeology, the aim is to create a highly defined image of the near surface. In engineering and exploration applications there is a huge difference in scale of the projects, and required accuracy of the modelling. In this class we are concerned with calculating a time correction for seismic reflection surveys as used in mineral and hydrocarbon exploration. For calculating time corrections for seismic reflection surveys, we are not so much interested in an exact model to image the near surface. Rather, the objective is a time shift to correct near-surface travel times, in order to eliminate false time structures, thereby avoiding the possibility of dry wells. The class introduces the complexities of the near surface. Then it describes the theories, assumptions and shortcomings of some methods in modelling the near-surface’.
One of our new Interactive Online Short Courses (IOSCs) is ‘The interpreter’s guide to depth imaging’ by Dr Scott MacKay. It is intended to cater for seismic interpreters looking to incorporate depth imaging into their evaluations and depth-processing imagers aiming to enhance their collaboration with interpreters.
‘Basics of carbon capture and storage’ by Prof Mike Stephenson, part of the EAGE Education Tours (EET), was offered on-site during the EAGE Annual
Conference in Vienna, attracting over a hundred participants. Prof Stephenson explains: ‘The course satisfies a part of the market that is not currently catered for – the wider science, risks, financing, planning and social licence aspects of CCS. These are issues that are as important as the technical issues in the sense that any of them can be a show-stopper for CCS. Many geologists in companies first starting out in CCS will need to have a broad background of the science, technology, risks and policy planning aspects of CCS - also technical civil servants and planners want to know about the new technology of CCS including its risks, environmental aspects and social licence.’
Prof Stephenson also offers an IOSC on ‘Palynology for Geologists’ which, despite its name, is not exclusively for palynologists. It is designed to bridge the gap between palynology specialists and geological specialists working on plays or prospects. He says: ‘This course provides succinct information and insight into palynological data and techniques by instilling an understanding of the main palynomorph groups, their uses, advantages and disadvantages, and what they can

and cannot do - helping the non-specialist geologist get the most out of their palynological data.’
In 2023 ‘Navigating career challenges and oportunities of the energy transition’, also known as the Coaching Programme, was launched as one of the Extensive Online Short Courses (EOSCs). Our coaching organisers explain ‘The EAGE Coaching Programme prepares early career professionals with soft skills and strategies to navigate the challenge of choosing a career among several options. Its purpose is to maximise participants’ personal and professional potential by raising open questions and self-discovery. Reflecting on and dispelling false feelings and beliefs will allow young professionals to plan activities and track progress toward stated career goals. As well as to develop new habits to prioritise their following tasks and gain confidence to overcome obstacles that could arise in their original plan.’
No matter where you are in your professional journey, EAGE is committed to supporting your professional development and learning needs by providing the latest and high-quality learning opportunities.
EAGE strives to make online education accessible to everyone, particularly early career professionals, by offering courses at affordable prices. Those interested in taking multiple courses per year can save up to 50% on total registration fees with Education Packages, which are valid for one year. Long-term EAGE members who are between jobs also have the opportunity to apply for financial assistance through the EAGE Economic Hardship Programme.

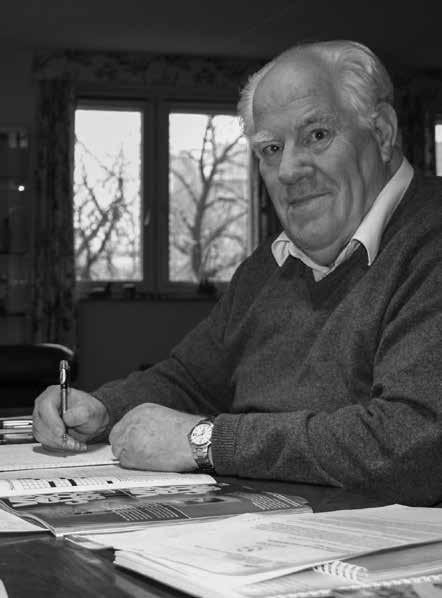
Koenraad Johan Weber, recipient of the EAGE’s Alfred Wegener Award in 2001, died peacefully on 12 September 2023 at the age of 89. Koen Weber had a remarkable career as an engineer and geologist. He was widely known for his contributions that were key to development geology and reservoir geology being recognised as distinct technical disciplines in the oil and gas industry. His contributions are reflected by the honours he received from his peers in the industry. In addition to the Alfred Wegener Award from the EAGE, Weber received the Van Waterschoot van der Gracht Medal from the Royal Geological and Mining Society of the Netherlands, the Sidney Powers Memorial Award from the AAPG, and the NGMS/Shell Award from the Nigerian Mining and Geosciences Society. He also received an honorary doctorate from Heriot-Watt University in Edinburgh.
Weber graduated in 1960 as a mining engineer at Delft University of Technology and joined Shell as a research engineer at Shell’s E&P laboratory in Rijswijk near The Hague. Shortly afterwards, he visited Iran to review the geological model and the production performance of the Gachsaran field. During this assignment he learnt two fundamental lessons that he applied throughout his career. Lesson 1: Never accept the data that you receive at face value. Always check how data are acquired and their accuracy. Lesson 2: When proposing a new method or technique that differs from ‘standard practice’, always clearly outline the expected benefits of your proposal.
In 1968 Koen Weber transferred to Shell’s Nigerian operations. There he laid the basis for his main expertise: geologically realistic modelling of oil and gas reservoirs. A well-known paper from this period is: ‘Sedimentological aspects of oil fields in the Niger Delta’ [Geologie & Mijnbouw 50, 559-620]. In the late seventies,
during a second posting to Nigeria and in spite of increased managerial tasks, Weber still found time for fundamental scientific work. Together with his Nigerian colleague Edmund Daukoru, he wrote the much-cited ‘ Petroleum geology of the Niger Delta’. Some 20 years later, Weber’s close collaboration with Daukoru paid off in an unexpected manner. At a symposium organised by the students of the Faculty of Petroleum and Mining Engineering at Delft University of Technology, the Secretary General of OPEC 2006/2007 – Edmund Daukoru – was the keynote speaker. Not bad for the student society in question.
In 1985 Shell promoted Weber to senior consultant reservoir geology. At the same time, he was appointed as professor production geology at the Faculty of Petroleum & Mining Engineering at Delft University of Technology. As senior consultant he was excused from most management tasks and could concentrate on technical work and teaching. He combined his part-time professorial role with tours as distinguished lecturer for the AAPG, EAGE and the SPE. In addition, he was associate professor at École Nationale Supérieure du Pétrole et des Moteurs in Paris, external examiner at Heriot-Watt University (Edinburgh) and at Imperial College London. During this period, he published papers such as ‘Framework for constructing clastic reservoir simulation models’ and ‘The role of faults in hydrocarbon migration and trapping in Nigerian growth fault structures’.
In 1993 Weber formally retired from Shell at the age of 59 (retirement age was 60, with service in tropical regions counting double). Retirement allowed him to dedicate more time to research and teaching at Delft University of Technology. In total he supervised some 70 MSc and/or PhD projects, and most of his students followed rewarding careers in the oil and gas industry. In 1999 Weber also
retired as professor at Delft University of Technology, but he did not rest on his laurels. As well as continuing with his geological research he resumed work on research hobbies from his youth: archaeology and history. He also became actively involved again in the ‘Mijnbouwkundige Vereeniging’, the student society at the Faculty of Petroleum & Mining Engineering at his alma mater. His ‘Puzzles for mining engineers’, were regularly published in the student magazine.
Koen Weber’s last major public communication project was a documentary about the history of ‘Mijnbouwstraat 120 – Een markant gebouw’. Mijnbouwstraat 120 housed the Faculty of Mining Engineering / Petroleum Engineering for well over 100 years. Weber was a student in this building in the Fifties, returning there some 25 years later as a full professor. In the documentary [www. youtube.com/watch?v=EQCVQzLrqDY] Weber shares memories from his distinguished career.
With Koen Weber’s passing we have lost a good friend and our mentor during the early years of our own careers in Royal Dutch / Shell.
Contributed by J. Evert van de Graaff and Lucia van Geuns
We are excited to unveil an exciting array of events set to take place in Latin America in 2024. These conferences and workshops are designed to bring together leading experts and professionals in the geosciences and engineering fields, focusing on advancing knowledge, fostering collaboration, and promoting innovation.
On 6-8 August 2024, Mexico City will take centre stage in the world of geoscientific exploration as EAGE organises its 3rd Conference on Near Surface & Mineral Exploration in Latin America, complemented by the 2nd Workshop on Water Footprint plus the 3rd Workshop on Geothermal Energy in Latin America. This great event promises to explore all the challenges and opportunities presented by the region’s unique geological characteristics.
On 12-13 September, Cartagena, Colombia, will be the focal point of a significant event in the geosciences calendar as experts from around the world convene to explore the role of Artificial Intelligence (AI) in Full-Waveform Inversion.
This workshop aims to foster collaboration among experts to unlock the full potential of this advanced recovery technique.
Once again, Mexico City will be a focal point on 24-25 October 2024, this time for the 3rd EAGE Workshop on Advanced Seismic Solutions in the Gulf of Mexico showcasing cutting-edge technologies and methodologies to address the unique challenges of this dynamic region.
Then on 5-7 November in Trinidad & Tobago, the 1st EAGE Conference on Energy Opportunities in the Caribbean will be held promising to be an event that will hold groundbreaking discussions about new energy opportunities in the region.
To cap off the second half of the year, we are thrilled to announce that Rio de Janeiro, Brazil will host the 1st EAGE/ SBGf conference on the roadmap towards low carbon emissions. This collaborative event will be a platform for sharing strategies and initiatives to reduce carbon emissions in the region’s energy sector.

The event will emphasise AI’s potential to revolutionise seismic data analysis.
The energy-rich region of Rio de Janeiro, Brazil, will host the 4th EAGE Conference on Pre-Salt Reservoirs on 17-19 September enabling researchers and professionals to share their insights and experiences in exploring and exploiting these valuable reserves.
Argentina’s capital, Buenos Aires, will be the hub of discussions on Enhanced Oil Recovery (EOR) on 3-4 October 2024.
We are sure these events will be an invaluable resource for professionals and researchers in the geosciences and engineering fields. With a diverse range of topics and locations across Latin America, we hope to foster knowledge exchange, technological innovation, and collaboration in these critical fields. Mark your calendars for these exciting gatherings which promise to shape the future of geosciences and engineering in the LATAM region.


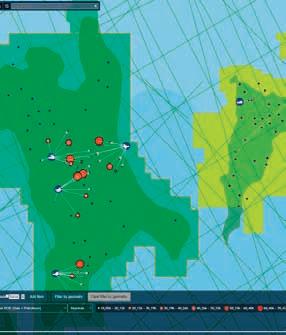


Katalyst Data Management’s Geopost Virtual Data Room

Katalyst’s VDR platform allows you to market your assets to a worldwide audience. With industry leading tools for promotion, visualization, and interpretation of your assets, Katalyst can support you with your asset divestiture.
us at:

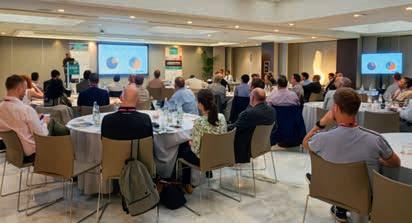
Technical Committee co-chairs Husain Nassir (Saudi Aramco) and Rafael Guerra (SLB) report on the 7th EAGE Borehole Geophysics Workshop held in Milan in September.
Our workshop, entitled Borehole Geophysics ‘Bridging the gap between surface and reservoir’, provided a forum for lively discussion between operators, service companies, consultants and academics.
As on previous occasions, the location was chosen to be easily accessible to an international audience, to have a strong local operator and geoscience research presence, and to have points of cultural interest for a good social programme.
The Technical Committee, drawn from across the industry reflecting the diversity of the delegates, selected a technical programme of 29 oral and seven poster papers to be presented over three days, interspersed with four keynote presentations by invited speakers.
There was an exhibition area for companies to showcase their latest technology and a social programme to provide networking opportunities. The workshop attracted around 60 delegates from 26 different organisations and feedback from delegates on the choice of venue, the Melia Hotel in Milan, was overwhelmingly positive.
The committee was honoured to receive the opening address from Davide Calcagni, Eni head G&G operations. He highlighted the role of DAS technology in improving the efficiency of Eni’s operations, including CCUS monitoring. This was followed by a keynote presentation from David Hill, CTO of Sintela, on distributed fibre optic sensing technology and its applications in the energy sector and beyond.
On the second day, Eric Verschuur (Delft University Seismic Inversion & Imaging) promoted the integration of borehole and surface seismic, including in survey design and imaging. During the joint session, Ahmad Riza Ghazali (PETRONAS chief scientist) gave a high-level overview of seabed seismic and DAS 3DVSP technologies from a company perspective.
Shujaat Ali (SLB borehole seismic expert) reported on advances in cross-well seismic, including the use of anisotropic eFWI to obtain high quality images from a CCUS project in the USA, and showed how to overcome the challenges of DAS 3DVSP noise in producing wells.
The technical papers reflected the broad scope of borehole geophysics and were divided into eight sessions: Borehole data acquisition & greener operations, Conventional VSP applications and robust well ties, Advanced processing, anisotropy and inversion (two parts), Microseismic monitoring, bridging the scale gap of acoustic measurements, Time lapse VSP Monitoring, and a joint session between the Seabed Seismic and Borehole Geophysics workshops. At the end of each session, presenters were invited on stage for a panel discussion to further explore the studies presented. The authors of each poster submission described their work in a short introduction, before the delegates were invited to view the posters in the break-out area.
The complete list of workshop abstracts is available at EarthDoc with some highlights mentioned here.
Liborio (Eni) presented the geological interpretation of high-resolution DAS 3DVSPs recorded in four producing wells which supported the drilling of successful development wells. Alfataierge (Aramco) showed a high-density DAS walkaway VSP recorded in two deep wells with fibres strapped to tubing, with very good data quality. Lesnikov (TotalEnergies) obtained very good geophone walkaway results, including AVO and anisotropy estimation, from a project offshore Guyana. His colleague, H. Klemm, went a step further and inverted the walkaway gathers at the well location for Vp and Vs logs. Mizuno (SLB) discussed the importance of velocity model
calibration in microseismic monitoring in event detection (less of a problem for migration-based methods) and in event location.
Rufino (SLB) showed a case study of high quality LWD seismic VSP imaging from offshore. Martinez (SLB) presented DAS offset VSPs recorded in very challenging completions with multi-mode fibres inside coiled tubing clamped to tubing in cased hole, the data quality was good and better than expected. Shashkin (Curtin University) showed the correct formula relating DAS strain amplitudes to rock density and velocity. His colleague, Pevzner, analysed the non-linear effects on the vibroseis signals recorded by downhole DAS. Soulas (ASL) showed comparisons between different DAS manufacturers and geophone tools, demonstrating that all DAS interrogators are different.
Guerra (SLB) showed a DAS VSP recorded in minutes offshore UK using extra-strength hybrid logging cable technology. This allowed the cancellation of conventional geophones, saving hours of rig time and tonnes of CO2. Nassir (Aramco) demonstrated how to attenuate vibroseis harmonic cross-correlation artefacts using template matching. Belleza (OGS) presented an interesting DAS VSP project recorded in Türkiye in shallow but very hot wells (2500C), using engineered fibres and a miniature electric vibroseis source, but the results had relatively low SNR.
During the joint session with the seabed workshop, Yu (BGP) presented a world record DAS 3DVSP survey recorded for ADNOC in 13 flowing wells offshore UAE, during OBN acquisition with two vessels shooting simultaneously, with deblending and some advanced processing applied. Haacke (CGG) obtained good DAS 3DVSP results in a survey recorded for BP in the Caspian Sea in a producing well with fibres clamped to tubing, but no increase in
DAS resolution compared to OBN data was achieved due to the complex velocity model and high flow noise. Moore (CGG) presented a nice DAS 3DVSP test in one of Equinor’s Johan Sverdrup water injection wells with fibres clamped to tubing; 4D modelling was performed to assess repeatability and detectability of CO2 injection.
Verschuur (Delft University) discussed the design of sparse geometry surveys, including the use of migrated image quality to automatically update source and receiver locations. Haldorsen (MagiQ) showed the audience how to locate acoustic sources in the sea using a multi-component array with DAS fibre and point sensors. Finally, Gupta (SLB) presented good S-DAS PrP and PrSv
results with dark fibres buried under the seafloor over a distance of 80 km.
Following the workshop, a one-day short course on distributed fibre-optic sensing technology was given by Dr David Hill (Sintela CTO). The course explained the key concepts of distributed fibre optics in DAS, DTS, DSS and was well received by the participants who were generally more familiar with seismic methods than with optics. There were many questions and clear explanations followed.
The committee voted on the best technical contributions to the programme and presented the best paper prize to
Carolina Liborio, Eni geoscientist, for her thorough geological integration of DAS 3DVSP and well data. The resulting improved reservoir model has helped in the successful drilling of development wells. The best delegate paper was presented to Eric Verschuur for his constructive engagement and insights shared during the workshop.
The proceedings were brought to a close by co-chairs Husain Nassir and Rafael Guerra, who thanked everyone involved in the success of this workshop and the event’s invaluable Platinum level sponsors: Saudi Aramco, BGP and Eni, as well as the sponsors: SLB, VSProwess and Avalon Sciences. Planning is already underway for the next workshop in 2025!
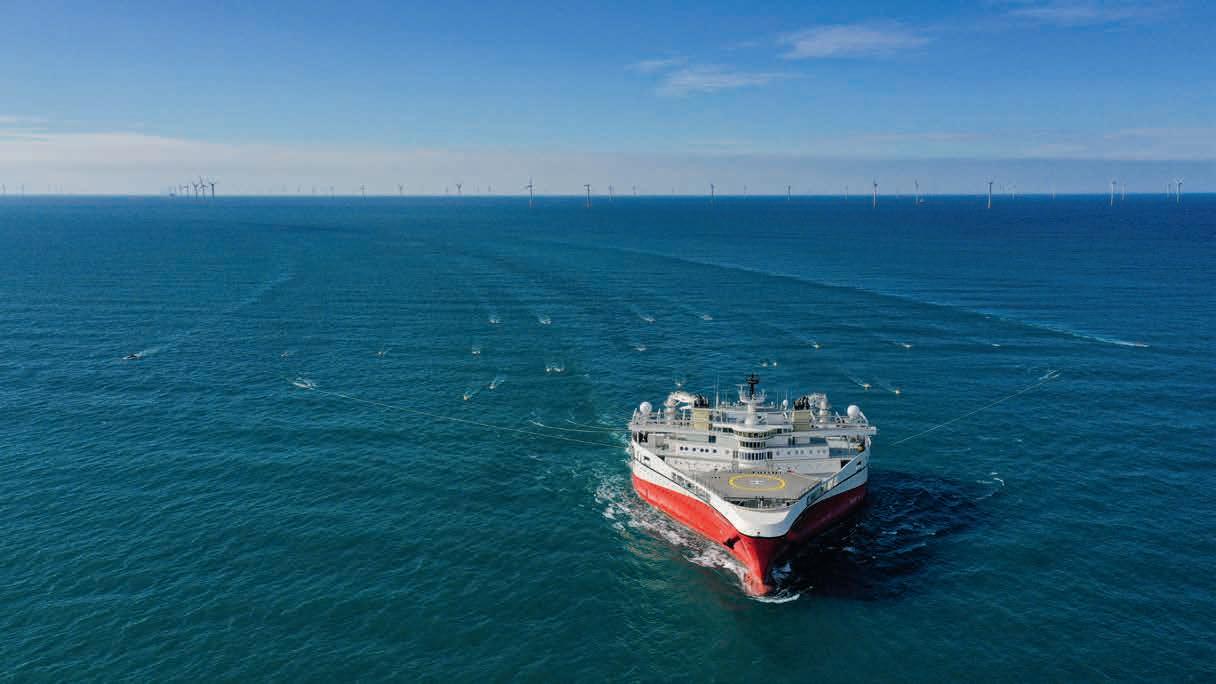
Technical Committee chair Martin Widmaier extends an invitation to join the geophysical acquisition community in Oslo.
The 4th EAGE Workshop on Marine Acquisition will take place once again in Oslo on the 2-4 September 2024. This popular workshop will be a forum for operators, contractors, manufacturers, and academia to discuss latest geophysical and technical developments and innovations as well as applications.
We will take a closer look at recent advances in marine seismic equipment, operations, and survey design. Recently, the energy trilemma has forced the industry to review strategies and the correspond ing technology demand. Challenges and change can drive innovation in the industry.
The workshop will also cover energy transition related applications such as CCS and offshore wind. While marine seismic methods will again be the key focus of the workshop, contributions related to other relevant marine geophysical methods are very welcome.
novel acquisition geometries and survey design solutions, as well as operational aspects.
The workshop aims to provide a comprehensive overview on the latest advances in marine acquisition covering
We would like to share recent experiences and lessons learned from case studies and explore future visions. The workshop scope covers a wide range of applications from hydrocarbon explora-
transition-related topics such as high resolution near surface methods for offshore wind, CCS development surveys and monitoring, nuclear waste management as well as marine mineral exploration.
Abstracts can be submitted until 31 March 2024. For more details visit the Calendar of Events at www.eage.org.
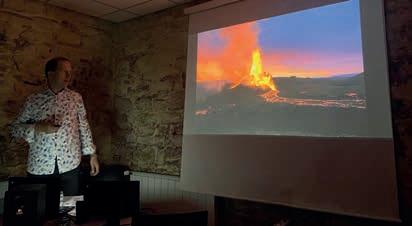
Our Local Chapter Czech Republic chose to organise their autumn meeting on an explosive topic. Jeroným Lešner (Geotechnik CZ) was invited to lead a lecture on volcanism including his recent expedition to the Litli-Hrútur volcano, Iceland.
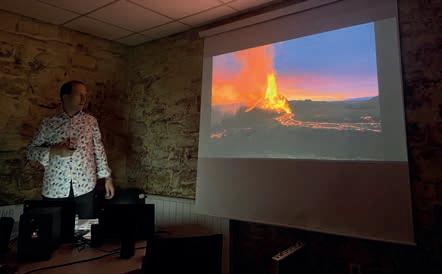
The participants enjoyed wonderful images, stories and videos of the spectacular eruption of Litli-Hrútur (312 m), which is part of the Fagradalsfjall, an area that has already seen three eruptions since 2021. Lešner described the work and the experiments carried out with the flowing lava on-site. We saw unique videos capturing little air twisters forming over the lava flows and discussion on formation of Pele’s hairs and tears. We tried holding the long shovel designed to extract fresh lava samples, saw how rock transforms when exposed to fresh lava and were instructed on how to
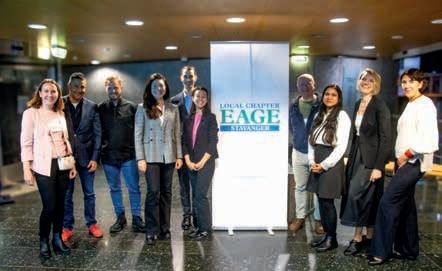
On 2 November, EAGE Local Chapter Stavanger celebrated a Grand Opening – its first in-person gathering!
LC Stavanger was established two years ago by Surender Manral and a group of local volunteers, amid the Covid-19 pandemic. From its inception, the Chapter has operated primarily online, driven by the mission to promote geoscience for the next generation, facilitate the exchange of knowledge, and champion diversity within the local geoscience community. The latest event marked a pivotal shift, representing the Chapter’s first endeavour into in-person gatherings and a promising new phase in the Chapter’s journey, solidifying its vision for the future.
The event was held at the iconic Norsk Oljemuseum in Stavanger, an apt choice allowing members to mingle and network amidst the captivating artifacts that illustrate the evolution of oil and gas offshore operations as Norway’s most important industry. The event was attended by around 60 enthusiastic geoscientists who came together to make it a resounding success. One of the
evening’s highlights was the outstanding and diverse presentations delivered by keynote speakers Carlos Alonso Gil Figueroa and Kjetil Westeng, igniting compelling conversations about the future of industry, whether in terms of energy transition or digitalization.
Gil, vice-president of subsurface and area development at Equinor, discussed the critical role that subsurface will play in energy transition, with geoscientists positioned at the core of the transformation of the Norwegian Continental Shelf from an oil and gas province into a broad energy province. He illustrated this through real case examples that Equinor has undertaken.
Kjetil Westeng, advanced petrophysicist at Aker BP Norway, presented his award-winning project on next-gen subsurface solutions. The project was awarded the Exploration Innovation award at the NCS Exploration conference held in Oslo earlier this year. He demonstrated how Aker BP has ventured into a journey towards the integration of automated solutions and digitization in subsurface interpretation.
breathe through air filters to keep safe from volcanic fumes. The talk attracted the attention of scientists from the Geophysical Institute which is mapping seismic activity in this region of Iceland through their own seismic network as well. Originally scheduled for one hour, the discussion extended well beyond that and provided an excellent opportunity for networking.
Local Chapter Czech Republic is also the organiser of the Vlastislav Červený Student Prize for the best Master and Bachelor thesis in applied geophysics, which will be awarded later in the year.
The success of the event was the result of tireless efforts and meticulous planning by the board members and volunteers of LC Stavanger including Anastasiia Jacobsen, Alexandra Zaputlyaeva, Victor Aarre Madsen, Maria Josefina Cuello, Khushboo Havelia, Olesya Zimina, Cristiano Camatel and Hilde Grude Borgos.
The feedback from attendees resonated with a shared sense of satisfaction and anticipation. They were pleased with the Chapter’s transition to in-person gatherings and voiced their expectation for it to continue providing an avenue for the community to convene and build meaningful connections. To stay updated, you can follow the EAGE LC Stavanger on LinkedIn.
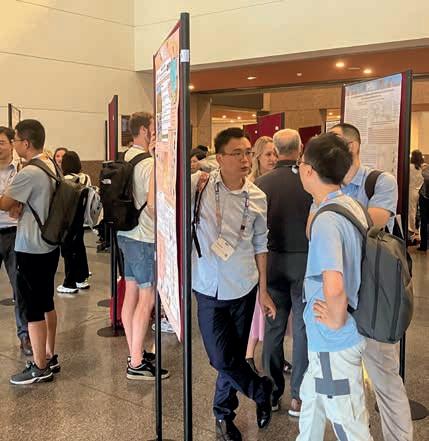
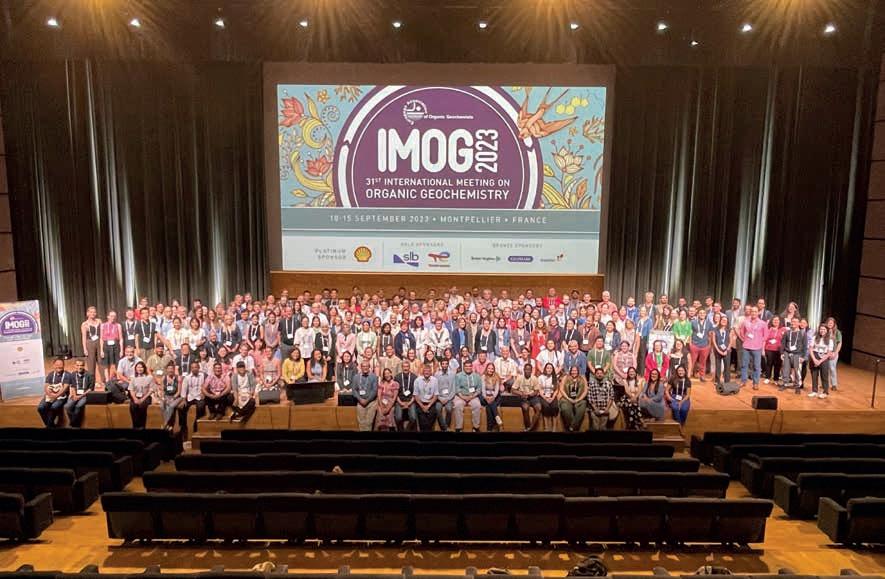
The 31st International Meeting of Organic Geochemistry (IMOG) took place in Montpellier, France from 9 September to 15 September 2023. Convened by the European Association of Organic Geochemistry (EAOG) and EAGE, the meeting again featured the latest science of organic geochemistry for environment, paleoclimate, and petroleum industry applications.
EAOG consists of over 500 members and is one of the few communities whose participants cross broad applications using geochemical tools. Knowledge sharing and community engagement are both intrinsic to the value of IMOG which always showcases new discoveries and advances.
At the 2023 conference, a new analytical approach emerged as a significant theme in the scientifical programme. The orbitrap mass spectrometer provides intramolecular stable isotope analysis for a range of compounds. Researchers are using this instrument to advance understanding on the formation and fate of important molecules. Mass spectrometer imaging, another emerging technique, was featured in the opening presentation of the Congress, by the Geoff Eglinton Lecture awardee Janina Grongina from the University of Bremen.
Industry scientists presented work featuring the ways in which energy companies use organic geochemistry to understand the origin and production of naturally occurring petroleum, with study areas from Mozambique, the Middle East, China, and throughout North and South America. For example, researchers showed new approaches to the analysis and interpretation of diamondoids, as well as new tools that provide geochemical interpretation early to guide drilling decisions. Company scientists also presented the value organic geochemistry brings to the energy transition topics such as carbon capture and storage, hydrogen, and reducing stray gas emissions.
Doctoral students are always important participants in the scientific programme. IMOG 2023 featured 57 student presenters, including plenary and session talks and posters. The IMOG Scientific and EAOG Awards committees collectively judged and selected the winners of the best student presentations awards based on scientific and presentation quality. The winners were Katrin Haettig, Luke Brosnan, Ilya Kutuzov, and Alice Fradet.
Important awards were also conferred on both early career and senior scientists. Gordon Inglis from the University of Bristol received the EAOG’s Pieter Schenck Award. Stuart Wakeham received the prestigious career Treibs Medal, awarded by the Geochemical Society, for his lifetime contributions to understanding the carbon cycle, especially in anoxic basins.
During the general assembly, EAOG elected new Board members, and paid tribute to the exiting members. As Courtney Turich takes on the chairperson role, she notes that the EAOG Board has reached historic gender parity for the first time in its 60-year history.
IMOG 2025 planning is already in full swing, and we look forward to welcoming scientific content and enthusiastic participation in Porto, Portugal in September 2025. Organic geochemistry is important in many different aspects of our science and energy transition. IMOG will remain the conference where cutting-edge research in organic geochemistry is introduced and further developed.
In 2023, the EAGE Student Fund played a pivotal role in empowering the next generation of geoscientists and engineers to foster innovation in our industry. Thanks to the generosity of you, EAGE members, we could support EAGE Student Chapters from around the world and promote the learning of geosciences among new scholars.
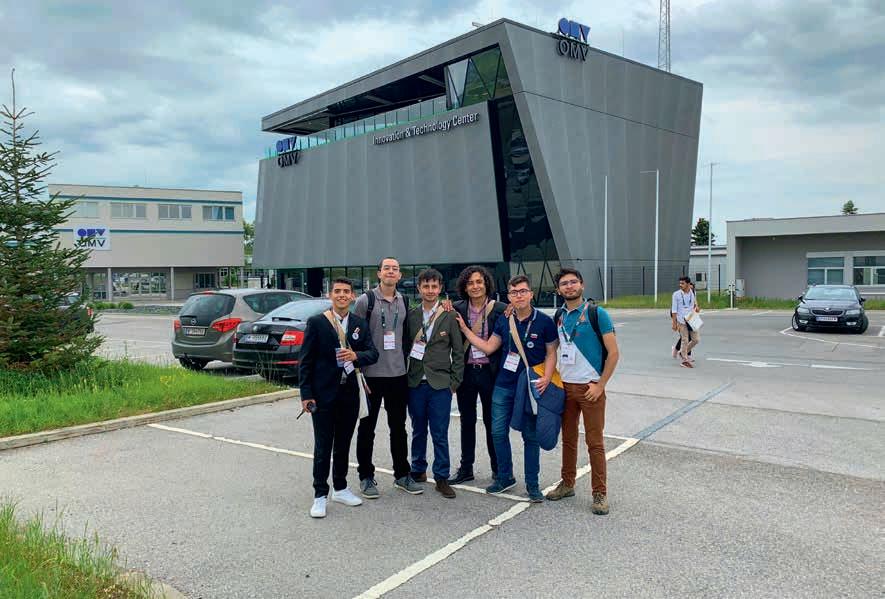
In June, for example, the Student Chapters from the University of Miskolc (Hungary), Universidad Nacional de Colombia (UNAL Bogotá), and the Federal University of Bahia (Brazil) were able to participate in the 84th EAGE Annual Conference and Exhibition in Vienna thanks to the support of the Fund.
The EAGE Student Chapter Universidad Nacional de Colombia stated: ‘We had a wonderful experience in Vienna, where we participated in the Laurie Dake Challenge, the EAGE Annual, and the Global Geoquiz. We worked on a realworld problem related to geothermal ener-
gy and presented our solution to a panel of experts. We also networked with professionals and researchers from different countries and disciplines and learned about the latest developments and innovations in geosciences. We are very grateful to the EAGE Student Fund for supporting us and giving us this unforgettable experience.’
The EAGE Student Fund also recognised and supported the exceptional performance of the University of Strasbourg, at the Global GeoQuiz 2023, and those of The University of Manchester and University M’hamed Bougara Boumerdes in their winning of the 2023 editions of the
Laurie Dake Challenge and Minus CO2 Challenge respectively.
In 2023, the Student Fund provided EAGE Student Chapters with a platform for networking, knowledge exchange, and collaborative activities under the EAGE umbrella. In this regard, the Fund donated 15 student memberships for each of our 38 EAGE Student Chapters, provided 300 complimentary memberships for first time student members, and financially supported early careers dedicated events.
Marie Gärtner, Jan-Phillip Föst, and Rune Helk told us: ‘Thanks to the generous support of the EAGE Student Fund, we successfully hosted the Geophysikalische Aktionsprogramm (GAP) in Karlsruhe, Germany from 11-14 May 2023. This year marked a significant turning point for GAP, as we welcomed 75 participants and 30 volunteers. Our participants came from 11 different universities, and we organised various activities, including excursions, talks, and networking opportunities. We owe a special thanks to our sponsors, including the EAGE Student Fund, for making this event possible.’
To all members, please continue to provide students with your support enabling a lasting impact in 2024 in nurturing the next generation of geoscientists and engineers. Donations can be made while renewing your 2024 membership, or via donate.eagestudentfund.org.
The EAGE Student Fund supports student activities that help students bridge the gap between university and professional environments. This is only possible with the support from the EAGE community. If you want to support the next generation of geoscientists and engineers, go to donate.eagestudentfund.org or simply scan the QR code. Many thanks for your donation in advance!
With a few twists and turns Daniella Bordon has pursued her early fascination with the marine environment in a career that has now evolved into global ESG manager, BGP Offshore based in Rio de Janeiro. Much of her work in the last 16 years has involved seabed seismic technology companies working offshore Brazil including early adopters such as RXT, Oceangeo and ION Geophysical.
My parents came from low-income families in Brazil and worked very hard to put me and my siblings into good schools. I have always been a good student and in the first year of high school I had a list of possible careers in the back of my notebook. I loved science and my mother wanted me to go to med school. But, influenced by a great biology teacher who lived in Australia and worked with coral reefs, I decided to become a marine biologist. Many adventures came with this choice - living in amazing places doing internships and working with marine mammals.
On my last day at university, I was given a brochure on my way out the gate for a work abroad programme. I did not speak English back then and it sounded like the next important step in my career plan. My parents did not approve of my choice. Anyway I sold my car and paid for the programme. From my first day of work at a hotel breakfast buffet, I was forced to learn English quickly (often making a fool of myself in the process). After three months in cold Pennsylvania, I went to Hawaii to fulfil one more dream. What was meant to be a three-week trip became the next chapter of my life. I got a job providing spray on tattoos, then selling cookies at a swap meet and later at a store in the mall. My main goal was to work at the Sea Life Park aquarium, but when I did get a job there I actually felt bad for the captive animals. I wanted
to be back at sea working with wild animals, and so that’s what I did.
After two years abroad I returned home but planning grad school back in the USA. However, at the time, there were lots of geophysical surveys happening in Brazil, and I was offered work as a marine mammal observer. It proved an incredible experience working with a multi-national crew, learning new things and getting five weeks off to travel some more which is a passion of mine.
A company called RXT was coming to Brazil to work on a two-year project doing ocean bottom cable surveys for Petrobras, technology then in its infancy. They needed someone to manage the environmental aspects of the survey and liaise with local authorities. I was referred to them by a friend and later interviewed at the international airport by my future boss.
I embarked on several courses from certificates in environmental management to a master’s degree in development practices while working with various companies in the seabed seismic business. Luckily I still work with many of the same amazing people from when I started, but these days focused on environment, social and governance (ESG), my real passion. My responsibilities range from managing risks at project level to developing BGP Offshore’s envi-
ronmental and social strategies at corporate level. I have visited 40 countries and seen many interesting cultures, living the challenge and delights of being a woman in a male-dominated industry.
My company started implementing at least one community outreach programme per project. For example we engaged with a local foundation in Sao Tome and Principe to support their school with supplies and their local orchestra with uniforms. In Suriname we donated wheelchairs and industry-recognised courses with our partners TGS and CGG. Now we are launching our first small grants programme focused on the recovery of our oceans.
It did take me almost 10 years to feel good about what I do. As a biologist, I felt like I was working for the dark side! What changed was understanding how energy access is essential to pull people out of extreme poverty and feeling like I was able to make a real change. Today, I believe my company is very much onboard with the idea of leaving a positive legacy for the environment and people.
When not working I try and be on the beach and nature as much as possible with my children, and twice a week, religiously (when not travelling on business), I play beach volleyball … what a cliché for a Brazilian!


BY ANDREW M c BARNET

In his 2015 State of the Union address President Obama was perhaps rash to state unequivocally that the ‘debate was settled. Climate change is a fact …’ It provided deniers an immediate opening to counter that science is never settled, which of course is indisputable. Scientific conclusions can only be based on the available evidence, balance of probabilities, etc and are most convincing when mainly or overwhelmingly pointing in one direction.
At issue is what determines when we as a society can trust science to offer an acceptable certainty upon which we can base decisions. For example, apart from some weird minority sects, we all go along with the research and practical experience that shows anti-polio vaccinations are a worthwhile protection, but Covid-19 not so much. A significant swathe of people in many countries proved unpersuaded by the medical evidence. The current parliamentary inquiry into the UK government’s handling of the Covid crisis under Boris Johnson has revealed a chaotic response. Medical counsel was weighed against alternative explanations of the virus as well as political and other self-serving considerations. In the US, the president of the time at one point advocated swallowing disinfectant as an antidote to Covid.
Such goings-on illustrate the vulnerability of science, and the trust we are prepared to place in it. Overcoming doubt about scientific hypotheses through research, experiments, tests, pilot studies, etc are all part of building scientific knowledge. In practice the process is literally not a perfect science. Findings are challenged, mistakes are made.
checked out online a doctor’s diagnosis, indeed who hasn’t used the internet for a bit of self-diagnosis of some ailment or other.
The point is that we can all become instant experts, and instant critics in the science sphere. The evolution of social media has magnified the trend enabling everyone to express their views with no filter on their validity. Hence we have a much-discussed information crisis with everyone challenged to know whom to trust. Traditional media sources based on at least some semblance of journalistic research and verification of the facts are in serious decline as a guide. This is not just because of the sheer volume of competing news and opinion feeds out there – Twitter (X), emails, Instagram, Facebook and so on. Rapid dissemination of huge amounts of material also takes its toll on a clear narrative.
Most significantly this loose structure is open to obvious manipulation by vested interests, e.g., perpetrating fake news, flooding media with false/bias opinions, distorting the consensus, etc. We may often suspect governments and business interests are culpable, but often it requires a whistleblower to reveal the extent of involvement.
‘The process is literally not a perfect science’
In the medical field, the dispensing of Thalidomide medication to pregnant women to counter nausea caused terrible birth defects. It took a major newspaper campaign, among other things, to expose the tragedy. That was in the pre-internet days of the Sixties and Seventies.
Today public discussion of science topics has changed dramatically. The internet makes an incredible amount of information on just about every subject you choose instantly accessible, from the authoritative to the bogus. Sticking with medicine, who hasn’t
Needless to say, geoscience is not immune from this world of disinformation. Objections to recent proposals by Danish company Ørsted to install two offshore wind turbine developments off the coast of New Jersey because of potential danger to whales provide a classic example of how science can be questioned in spite of seemingly incontrovertible evidence. According to The Guardian newspaper, ex-president Trump at a 2024 presidential campaign rally in South Carolina on 24 September, had clearly judged the issue. He attributed a wave of recent whale strandings on the US East Coast to ‘windmills’ driving the mammals ‘crazy’ and ‘a little batty’. He noted ‘You wouldn’t see that once a year – now they are coming up on a weekly basis’.
Trump was correct in his observation that stranding of whales has become a more common phenomenon in recent years. He would have known that last December, 30 New Jersey coastal mayors called for a moratorium on offshore wind activity,
prompted by the ninth dead whale to be washed ashore in the state that month.
For those familiar with the marine seismic industry’s challenges to comply with increasingly strict mammal protection regulations to enable surveys in offshore regions around the world, this is well travelled territory. It requires minimal reference to know that the US Bureau of Ocean Energy Management and predecessor authorities have played an important role in establishing the guidelines for seismic vessels working in US territorial waters, particularly in the Gulf of Mexico.
In the New Jersey case, the National Oceanic and Atmospheric Administration (NOAA) made clear in a statement nearly a year ago that any surveys for offshore wind companies have been focused on collecting data for future projects and ‘produce much smaller impact zones (compared with seismic) because in general they have low noise, higher frequency and narrow beam-width’.
A noted marine environmental researcher Dr Douglas Nowacek of Duke University, currently engaged in a five-year study on offshore wind energy and its impact on wildlife, was quoted by Factchek. org as stating that ‘there’s basically zero chance that those surveys have caused any mortality.’
According to the NOAA, explanation for the death or stranding of an increasing number of different species of whales (humpbacks, North American right whales and minke whales) can most probably be put down to vessel strikes and entanglement with fishing gear. The conclusion was based on the evidence of some 40% of carcasses it was possible to examine. This fits with a number of factors that may be in play, some predating the relatively few offshore turbines so far installed off the US east coast.
sound’ and expressed her fears for the area’s fishing business and those who depend on it. Carlson noted ‘Whales use sound to navigate. So why wouldn’t that be affecting or killing them? You’re applying the principles of science,’ adding that offshore wind was the ‘DDT of our times’ referring to the toxic pesticide that was banned in 1972.
As a spokesperson for the fisheries business, Lapp has since repeated the gist of her argument at a packed public hearing in Wildwood, New Jersey, in March and in various subsequent interviews, also echoing concerns over the practicality of fishing around wind turbines. Locals have also complained that the turbines will spoil views from the New Jersey coast.
It is no surprise that the controversy has been overtaken by politics. Local Republican Party representatives and organisations such as the Texas Public Policy Foundation (TPPF), said by opponents to be fossil-fuel friendly, have weighed in with support. They have spotted an opportunity to attack President Biden’s renewable energy policy which envisages substantial expansion of windpower, rolling out 30GW of offshore wind capacity by 2030.
‘An opportunity to attack President Biden’s renewable energy policy’
The emotional charge of whales dying on the beach has turned out to be an achilles heel for those who want to stick to the rational, science-based explanation. It is impossible to adequately deny the coincidence of marine surveys and the increased strandings, and it is pretty easy to drum up public sympathy.
First, climate change is said to be warming the oceans and altering the distribution of available nutrition in the ocean. Whales are apparently moving out of protected areas and closer to shores which make them more vulnerable to vessel strikes and fishing gear entanglement. Secondly, New York and New Jersey ports have reported significant growth in shipping activity meaning more vessels and potential collisions with whales. Thirdly, the whale population in the case of humpbacks in the mid-Atlantic has grown, thereby increasingly the likelihood of mishaps.
With such a clear rebuttal of the claims made against offshore turbine-related surveys available, the Trump allegations need some context from which, depending on your appetite for conspiratorial explanations, conclusions can be drawn. However, let’s not forget that the whole episode points to a serious disregard for scientific findings which seemingly goes unbridled.
Trump may well have taken his cue from a Fox News interview earlier this year between the now dismissed news commentator Tucker Carlson and Meghan Lapp, fisheries liaison for Seafreeze, the largest producer and trader of sea-frozen seafood on the US East Coast. Lapp referred to offshore wind developers as ‘essentially carpet bombing the ocean floor with intense
Coincidence or not, Ørsted, the biggest company in the business worldwide, last month cancelled its plan for the two big Ocean Wind I and II developments off the New Jersey coast incurring an estimated impairment cost of more than $3 billion. High inflation, rising interest rates and supply chain bottlenecks were given as reasons for the cancellation. The company is now faced with sorting out generous state subsidy arrangements agreed with New Jersey Democrat Governor Phil Murphy, who had been a strong advocate of the projects and the opportunity for renewable energy investment. For the record, Ørsted last month also quit a consortium with Fred Olsen Renewables and Hafslund Eco developing windpower offshore Norway, citing ‘a prioritization of investments’ in its portfolio.
It is tempting to dismiss the New Jersey fracas and turning science evidence into a political football as a peculiarly American phenomenon born out of hopelessly polarised politics. Yet a similar debate over the impact of seismic on marine life is underway in southwest Victoria, Australia. A local environmental group is protesting against a ConocoPhillips survey plan in the Otway Basin, currently at the consultancy stage, based on the noise factor, despite decades of regulated seismic surveys having been carried out offshore Australia.
The problem is that the science is never totally settled, and that applies to the much bigger issues such as climate change mitigation and protection against pandemics.
Views expressed in Crosstalk are solely those of the author, who can be contacted at andrew@andrewmcbarnet.com.
The UK has offered 27 licences in the North Sea in areas prioritised because they have the potential to go into production more quickly than others.
Shell, Total Energies, Equinor, Eni, Anasuria Hibiscus, Athena Exploration, Bridge Exploration, DNO, Ithaca Energy, Neo Energy, Ping Petroleum, Tailwind Energy and Tangram Energy are among the 14 operators to have won contracts.
Norwegian operator DNO which, with JV partner Aker BP, landed blocks 9/9f, 9/10c, 9/14c and 9/15d, which are contiguous to the Norwegian maritime boundary and just west of the Aker BP-operated Alvheim hub offshore Norway.
The offshore UK area also comprises the Agar discovery from 2018, in which DNO held a 25% interest until it was relinquished in 2020.
DNO said it will acquire additional 3D seismic data and potentially reprocess the data to reduce risk and volume uncertainty.
Meanwhile, the UK government has introduced the Offshore Petroleum Licensing Bill to require annual oil and gas licensing rounds subject to stringent new emissions and imports tests.
In addition, six more blocks, which were also ready to be offered, have been merged into five existing licences.
The 33rd Oil and Gas Licensing Round was launched on 7 October 2022 with 931 blocks and part-blocks made available for application. In total, the UK North Sea Transition Authority (NSTA) received 115
applications from 76 companies for 258 blocks/part-blocks when the application window closed on 12 January 2023. This was the highest participation since the introduction of the Innovate Licences in 29th Round in 2016/17.
There are currently 284 offshore fields in production in the UK North Sea and an estimated 5.25bn boe in total projected production to 2050, said the UK Transition Authority. Oil and gas currently contribute around three quarters of domestic energy needs and official forecasts show that, during the energy, they will continue to play a role in our energy mix for decades to come, it added.
Stuart Payne, NSTA chief executive, said: ‘Ensuring that the UK has broad options for energy security is at the heart of our work and these licences were awarded in the expectation that the licensees will get down to work immediately. The NSTA will work with the licensees to make sure that where production can be achieved it happens as quickly as possible.
A recommendation for the remaining 203 blocks will be made once the Habitat Regulation Assessment Further Appropriate Assessment process has been completed.
Companies winning a share of blocks include Aker BP, Triangle Energy, BP and Dana Petroleum.
‘The introduction of regular licensing for exploration will increase certainty, investor confidence and make the UK

more energy independent,’ said the NSTA in a statement. ‘This new regime will be subject to two key tests being met: that the UK is projected to remain a net importer of both oil and gas; and that the carbon emissions associated with the production of UK gas must be lower than the average of equivalent emissions from imported liquefied natural gas.’
Supporting continued production in the UK will also reduce reliance on higher-emission imports – with domestic gas production having around one-quarter of the carbon footprint of imported liquefied natural gas, said the NSTA.
Secretary of state for energy security and net zero Claire Coutinho said: ‘As energy markets become more unstable it’s just common sense to make the most of our own homegrown advantages and use the oil, gas, wind and hydrogen on our doorstep in the North Sea. Rather than importing dirtier fuels from abroad, we want to give industry the certainty to invest in jobs here and unlock billions of pounds for our own transition to clean energy.
CGG has joined Phase 3 of a project to monitor background seismicity at the Northern Lights CO2 storage project offshore Norway, the world’s first large-scale open-source infrastructure for receiving and storing CO2 from multiple sources and industries.
As a partner in the HNET Horda Platform Region Project, CGG has made available the 3D velocity model from its 44,000 km2 Northern Viking Graben multi-client seismic data set. Phases 1 and 2 of HNET investigated onshore and offshore seismic monitoring instrumentation solutions, by implementing a
new onshore array (HNAR) on Holsnøy island north of Bergen and assessing the integration of offshore nodes which form part of existing permanent reservoir monitoring (PRM) sensor arrays in the area.
Phase 3, lasting three years, aims to understand natural seismicity in the planned CO2 injection site. With a background seismicity data set the operator will be able to assess the nature of tectonic seismic activity prior to CO2 injection underground and more accurately assess any induced seismicity during the injection period. For this, the HNAR
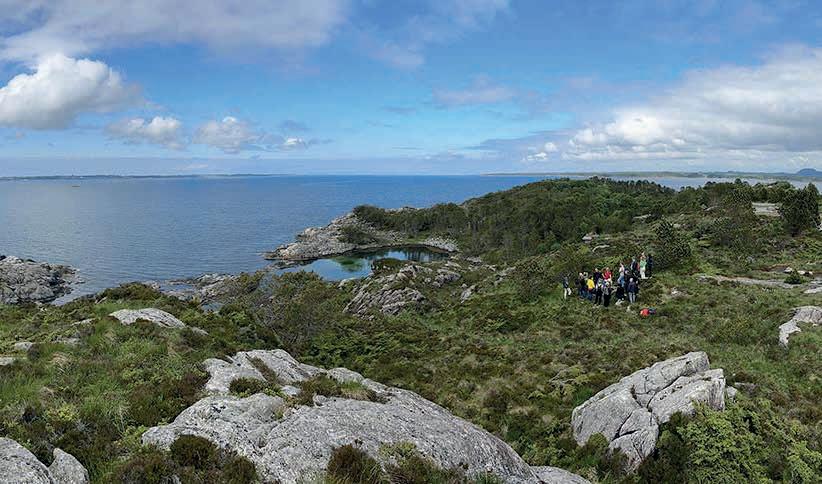
onshore monitoring array and a selection of offshore PRM nodes will continue to be used to refine and improve detection accuracy.
PGS has completed a 3D seismic survey over the Poseidon CCS licence area (licence EXL005) in the Norwegian North Sea for clients Aker BP and OMV.
The 500 km2 survey, 100 km off the Norwegian coast, was carried out by the vessel Ramform Atlas . The campaign aimed to generate high-resolution imaging of the CO2 storage complex and to provide a baseline for monitoring of the storage integrity.
In March 2023, Aker BP ASA and OMV (Norge) AS were awarded the Poseidon licence (licence number EXL005) in accordance with the CO2 Storage Regulations on the Norwegian
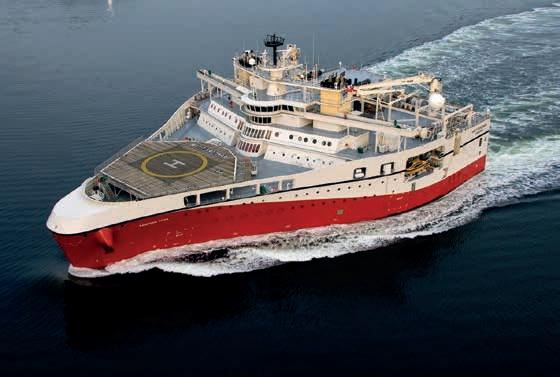
Continental Shelf. The licence has a work programme which includes a 3D seismic acquisition and related studies, followed by a drill-or-drop decision by May 2025 at the latest. Poseidon is a 50/50 partnership, operated by Aker BP.
The Poseidon 3D seismic survey was safely executed within schedule and budget, said Aker BP and OMV.
Meanwhile, PGS has won a 3D exploration contract in the Mediterranean.
The vessel Ramform Titan is scheduled to mobilise for the survey this month and the contract has a total duration of approx. 160 days.
‘The Mediterranean is a hotspot serving the European gas market and we see potential for more work in this prolific region,’ said Rune Olav Pedersen PGS, president and CEO.
PGS, in partnership with SNPC, has also completed a fourth phase of reprocessing of the Congo Vision project, adding more than 3900 km2 rejuvenated 3D seismic data to create a regional dataset, and covering open blocks Marine XIX and Marine XXX. The company has increased regional coverage of its Congo
Vision dataset by targeting deepwater open acreage. The latest phase expands Congo Vision to the south, along strike from significant Angolan fields in the core of the Congo Fan depocentre.
Congo Vision now comprises a contiguous volume of nearly 13,000 km2 broadband processed KPSDM data across the shelf and deep water, offshore Congo to create a seamless 3D seismic dataset that reveals prospectivity in both pre- and post-salt stratigraphy.
Acreage included in the fourth phase of Congo Vision has previously yielded Upper to Lower Miocene discoveries, and the rejuvenated data images inboard Albian and pre-salt fields. Congo Vision provides the means to further evaluate exploration opportunities with confidence, at both play and prospect level.
Finally, PGS has won a 4D acquisition contract offshore West Africa. Mobilisation is scheduled for Q4 and the contract has a total duration of approx. 60 days.
‘We experience continued high activity in our core West African markets,’ said PGS president and CEO, Rune Olav Pedersen.
iDROP has signed an agreement with ExxonMobil, Hess Corporation and Woodside Energy Technologies to develop the Oceanid system – an autonomous OBN (ocean bottom node).
The system comprises a self-navigating drone – Oceanid, that by gravity and ballast shift propels itself autonomously to a pre-plot location on the seabed. A complementary and automated handling system is under development for unmanned deployment, and subsequent recovery of nodes from the ocean surface.
‘The agreement involves both technical and financial support, opening up exciting field test options and is a commercial breakthrough for iDROP and its Oceanid system,’ said Kyrre J. Tjøm chief executive officer and founder.
The Oceanid development project is funded by the European Union, the Eureka global R&D and innovation funding network, Innovation Norway and the Norwegian Research Council, with industry support from several European major energy companies.
Realtimeseismic has agreed a multi-year collaboration with Star Energy Group to carry out seismic processing covering more than 3000 km of multi-vintage 2D seismic data, acquired over UK urban areas from 1970s up to the present day.
The processing campaign is split into five discrete projects, each supporting a hydro-geothermal development from the Star portfolio.
‘Realtimeseismic, with its pro-
prietary near-surface, denoising and velocity-modelling solutions, is ideally positioned to address all the data challenges and project objectives,’ said Realtimeseismic in a statement.
Star’s processing campaign for geothermal applications is the 75th seismic processing commitment undertaken by Realtimesseismic in the ‘New Energy’ sector, and the 24th onshore UK over the past five years.
TGS and PGS’ respective boards of directors have unanimously approved a definitive merger agreement in line with the terms previously announced.
The merger is to be structured as a statutory, triangular merger between TGS NewCo AS, a newly established wholly owned subsidiary of TGS designated for such purpose, TGS and PGS in accordance with Chapter 13 of the Norwegian Companies Act.
TGS NewCo will be the surviving entity and PGS shareholders will receive 0.06829 ordinary shares of TGS for each PGS share held.
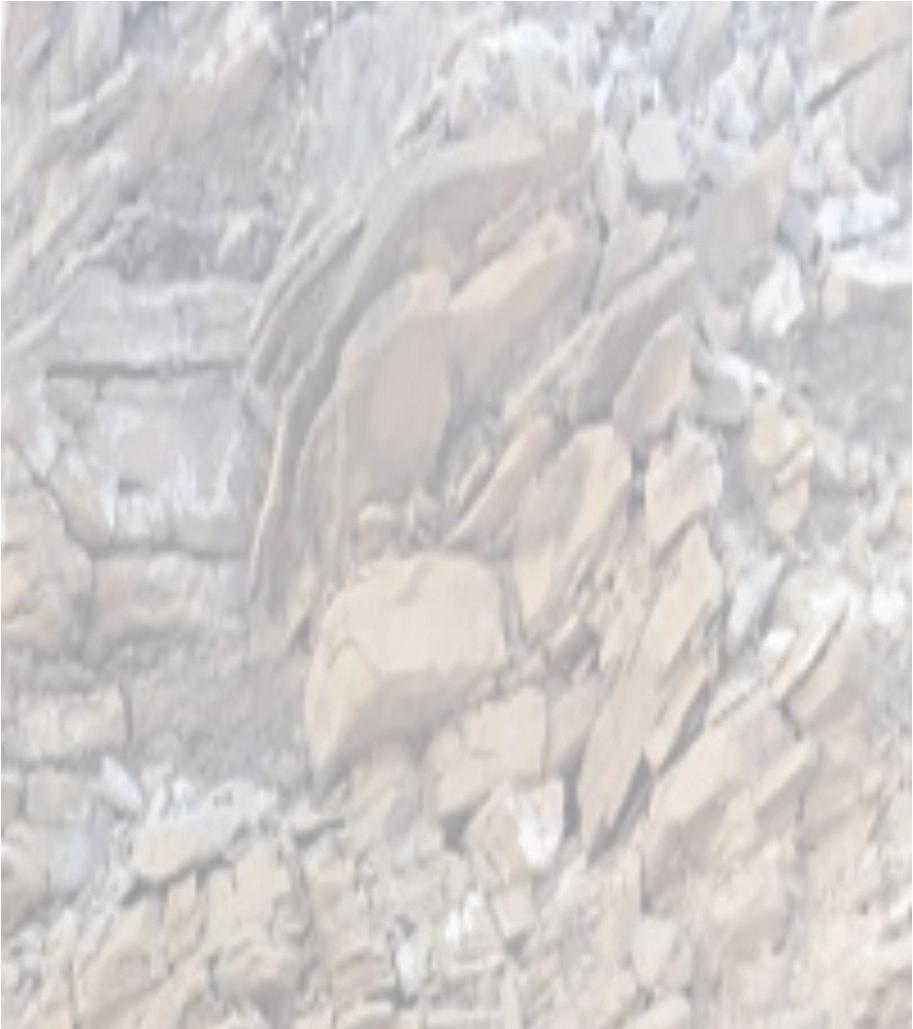

After the completion of the merger, TGS shareholders will own around a two thirds of the company and PGS shareholders will own the remaining third.
Completion of the merger is subject to approval by extraordinary general meetings at TGS and PGS, expected to be called for shortly and held within one month thereafter.
The merger is expected to generate synergies worth $100 million, including up to $70 million in operating costs (above a previous indication of $50 million). Vessel utilisation will be 2-3% higher (a worth $15-20 million).
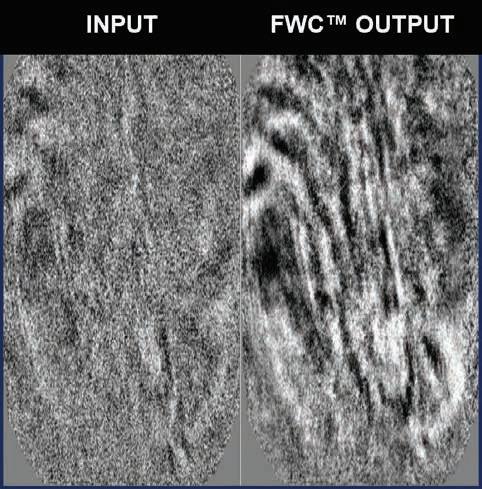


Over the last five years fossil fuels have met only half of the new demand for energy globally, according to DNV’s Energy Transition Outlook
The report found that between 2017 and 2022 renewables met 51% of new energy demand, while the remaining demand was supplied by fossil fuels. Renewables are still just meeting increased demand rather than replacing fossil fuels and in absolute terms fossil fuel supply is still growing, said DNV.
To reach the goals of the Paris Agreement, CO2 emissions would need to halve by 2030, but DNV forecasts that this will not even happen by 2050. CO2 emissions will be only 4% lower than today in 2030 and 46% lower by mid-century. Energy-related CO2 emissions are still hitting record highs and are only likely to peak in 2024, which is effectively the point at which the global energy transition begins.
‘Globally, the energy transition has not started, if, by transition, we mean that clean energy replaces fossil energy in absolute terms,’ said Remi Eriksen, Group president and CEO of DNV. ‘Clearly, the energy transition has begun at a sector, national, and community level, but globally, record emissions from fossil energy are on course to move even higher next year.’
Energy security has strengthened as a driver of energy policy due to changes in the geopolitical landscape. Governments are willing to pay a premium for locally
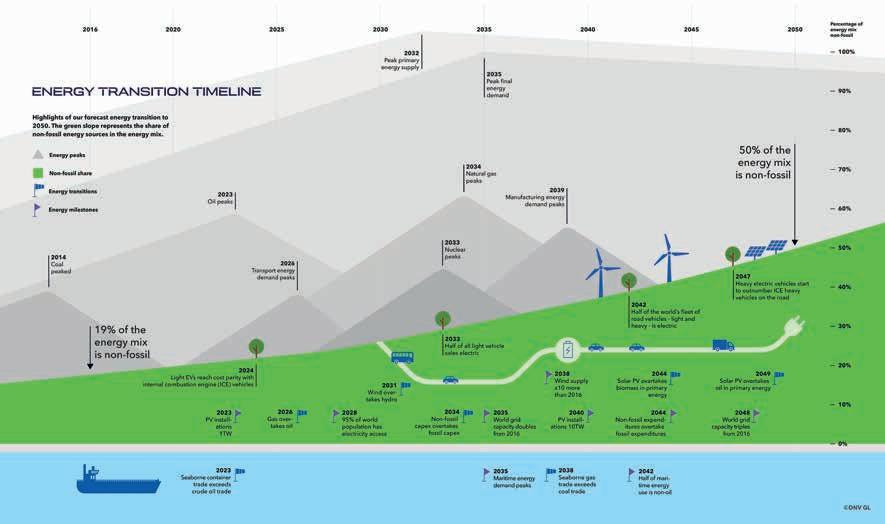
sourced energy, which has had a notable impact on the Outlook’s results. For example, the Indian Subcontinent is now forecast to transition slower with more coal in the energy mix. In Europe the transition is accelerating with the alignment of climate, industrial and energy security objectives.
Even if the transition is yet to get out of the starting blocks, once it starts renewables will outsprint fossil fuels. From now, most energy additions are wind and solar, which grow 9-fold and 13-fold respectively between 2022 and 2050. Electricity production will more than double between now and 2050, bringing efficiencies to the energy system. The fossil to non-fossil split of the energy mix is currently 80/20 but this
will move to a 48/52 split by mid-century.
Solar installations reached a record 250 GW in 2022. Wind power will deliver 7% of global grid-connected electricity and installed capacity will double by 2030, despite inflationary and supply chain headwinds.
‘There are short term set-backs due to increasing interest rates, supply chain challenges, and energy trade shifts due to the war in Ukraine, but the long-term trend for the energy transition remains clear: the world energy system will move from an energy mix that is 80% fossil fuel-based to one that is about 50% non-fossil fuelbased in the space of a single generation. This is fast, but not fast enough to meet the Paris goals,’ said Eriksen.
CGG and AI company LightOn have joined forces under a new contract to leverage CGG’s industrial high-performance computing (HPC) solutions. This will enable LightOn to optimally evaluate and test Large Language Models (LLMs) to support the industrial deployment of AI.
LightOn can now use CGG’s HPC and AI Centre of Excellence to benchmark their LLMs, exploring innovative hardware configurations hosted by CGG to identify the most optimal solution.
‘LightOn is at the forefront of innovation in AI, creating from scratch and delivering no less than 12 LLMs,’ said Laurent
Daudet, Co-CEO, LightOn. ‘We’re on a mission to transform business productivity for our clients and revolutionise how companies perceive and use generative AI. Having access to CGG’s latest HPC technology will accelerate our evaluation and testing, and ultimately our overall business strategy.’
A British arbitration tribunal has ruled in PGS’s favour in a dispute over transfer fees under several data licensing agreements.
In 2022, PGS recorded revenues of approximately $30 million of transfer fees relating to a change of control event under several data licensing agreements, where the amount was still not agreed with the client.
Given the inability to conclude the negotiations, PGS initiated two separate arbitration proceedings under the dispute resolution provisions in the agreements. The tribunal in the first arbitration proceeding has now issued a decision in PGS’s favour. The award includes late payment interest and reasonable legal costs. The amount due to PGS, net of any revenue share to third parties, is estimated to be approximately $40 million.
The second arbitration proceeding is expected to conclude during the second half of 2024, unless a settlement between the parties is reached earlier.
As a result of the proceedings, PGS expects to recognise extra revenues in Q3 2023 of $15 million – in addition to the estimated $168 million Q3 2023 revenues
reported in the company’s pre-announcement to the market October 10, 2023. PGS will in addition recognise ‘a significant amount’ as interest income.
Meanwhile, PGS will soon release results from its 2D feasibility study earlier this year in Danish waters to support screening and characterisation of potential CCS sites.
The study for the Geological Survey of Denmark and Greenland (Geus) and industry partners is phase 1 of a regional 2D rejuvenation project in the Danish
North Sea to be launched at the beginning of 2024.
Work is focused on offshore sites identified by GEUS for maturation. It includes seven seismic sections from three surveys using state-of-the-art 2D processing including pre-processing, tomography and final VTI Kirchhoff PSDM (alternatively PSTM).
‘We aim to demonstrate the uplift achievable by reprocessing the data and to prepare the processing sequence for the larger project planned in 2024,’ said PGS.
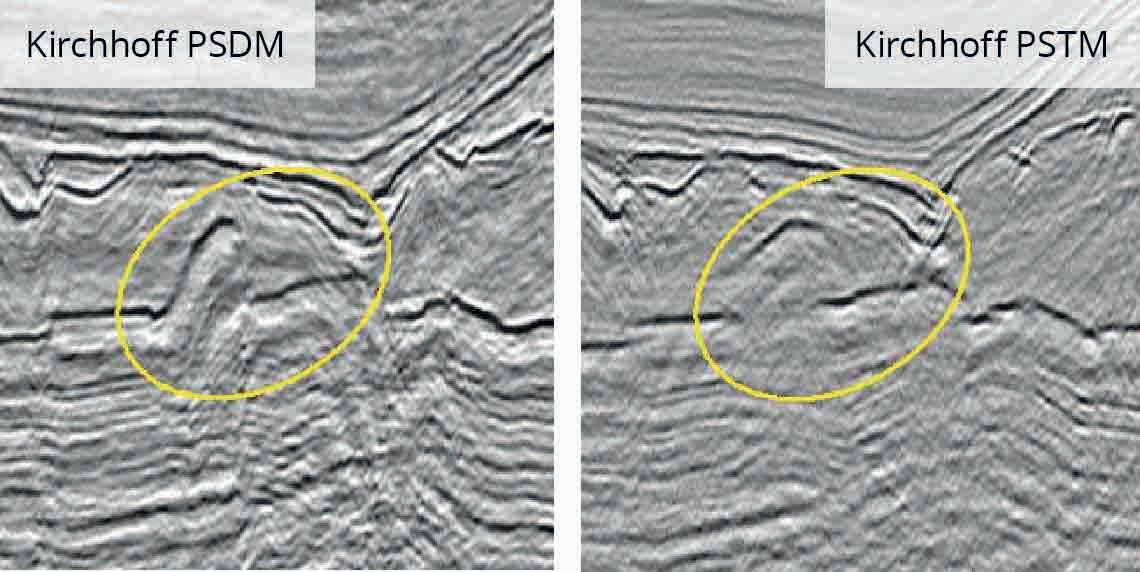
TGS has won a three-month proprietary ocean bottom node (OBN) data acquisition contract in the Gulf of Mexico (GoM) for a repeat customer.
Acquisition will start in Q4 2023 and complete during Q1 2024.
Kristian Johansen, CEO at TGS, said: ‘This project further highlights the integral role OBN acquisition has in providing our clients improved seismic data quality and help them to make better reservoir development and management decisions.’
Meanwhile, TGS, in partnership with SLB and Petrobangla, has com-
pleted the 12,636 km first phase of a 2D seismic acquisition program in April 2023, offshore Bangladesh. The project covers the Bengal Fan, one of the world’s largest deep-water fans with good evidence of working petroleum systems. It is considered one of the most extensive unexplored frontier areas, said TGS.
Finally, TGS has won a four-year extension to a proprietary reservoir monitoring and source acquisition contract in Norway, with a further option to extend by another two years.
SeaBird Exploration has reported third quarter revenues of $6.5 million with EBITDA of $4.2 million and cash flow of $3.2 million. Net-interest bearing debt was $12.6 million. Vessel utilisation was 96%.
Equinor is preparing to sell a 20% stake in its Rosebank oil development in the British North Sea, which could fetch about $1.5 billion, two industry sources said.
Equinor has agreed with Libya’s National Oil Corporation to study and evaluate the oil and gas potential offshore Libya.
Eleven blocks are being offered offshore Suriname in shallow offshore areas, in water depths up to 150 m, located south of the deepwater discoveries and north of the onshore producing oilfields. The data room will open from 18 December with bids required by 31 May 2024.
Australia is inviting bids on eight onshore areas for petroleum exploration in Western Australia. The blocks are in the Canning, Northern Carnarvon, Amadeus, and Perth basins, and vary in size from 400 to 7070 km2. Hydraulic fracturing will not be authorised within any of the exploration permits. The application period will close on 19 January 2024.
The US Bureau of Ocean Energy Management is postponing Lease Sale 261, originally scheduled for September 27, 2023, and later scheduled for November 8, 2023, in response to judicial orders. Until the court rules, BOEM cannot be certain of which areas or stipulations may be included in the sale notice.
The US Bureau of Ocean Energy Management (BOEM) has finalised four new Wind Energy Areas (WEAs) in the Gulf of Mexico. Option J is 495,567 acres located 47.2 miles off the coast of Texas. Option K is 119,635 acres 61.5 miles off the coast of Texas. Option L is 91,157 acres 52.9 miles off the coast of Texas. Option N: 56,978 acres located 82 miles off the coast of Louisiana.
TGS reported a net profit of $16 million on revenues of $293 million compared with a net loss of $2 million on revenues of $119 million in Q3 2022.
POC operating profit of $68 million was up from a loss of $7 million in Q3 2022.
Multi-client revenues were $178 million during Q3 2023 compared to $140 million in Q3 2022. Early sales of $88 million compared to $39 million in Q3 2022. Late sales of $72 million, compared to $65 million in Q3 2023, were ‘below expectations’. Total POC order backlog, including acquisition, is $475 million.
Full-year multi-client investment guidance has been increased to $400 million with a minimum early sales rate of 75%.
‘We are pleased to present a Q3 2023 report that is strong on all parameters. POC revenues are up 34% y/y (pro-forma), driven by robust performance in all business areas. Moreover, excellent operating performance and tight cost control leads to a healthy operating margin of 23%. Finally, cash flow was solid during the quarter, with a free cash flow of $45 million, further enhancing the balance sheet ahead of the announced
acquisition of PGS. With leading exposure across the energy data value chain, TGS is well positioned to continue benefiting from the expected market growth going forward,’ said Kristian Johansen, CEO of TGS.
Cash flow from operations of $117.6 million, compared to $177.9 million in Q3 2022
In the quarter the company focused on multi-client programmes in Europe, Brazil, Egypt and Malaysia. ‘Prefunding revenues of $101 million reflect strong interest for ongoing acquisition projects and significant sales from surveys in the processing phase, resulting in a prefunding level of 144%,’ said TGS.
The company’s order book increased 28% sequentially. A major part of the increase is contract work with pricing for the winter season at similar levels to the summer. TGS has 60% of 3D vessel capacity booked for the first half of next year. Meanwhile, TGS has won a four-year extension to a proprietary reservoir monitoring and source acquisition contract in Norway, with a further option to extend by another two years.
PGS has reported a net loss of $7 million on revenues of $185 million compared to a net profit of $3 million on revenues of $216 million.
Operating profit (excluding impairments) of $12 million compared with $34 million in Q3 2022.
Rune Olav Pedersen, president and chief executive officer said: ‘As the global energy transition evolves, PGS expects global energy consumption to continue to increase over the longer term with oil and gas remaining an important part of the energy mix. Offshore reserves will be vital for future energy supply and support demand for marine seismic services. The seismic market is improving on the back of increased focus on energy security, several years of low investment in new oil and gas supplies, and high oil and gas prices.
Offshore investments in oil and gas exploration and production are increasing in 2023. The seismic acquisition market is benefiting from the higher exploration and production spending, and a limited supply of seismic vessels.
PGS expects full-year 2023 gross cash costs to be below $550 million. Multi-client cash investments are expected to be approximately $190 million. Capital expenditures for 2023 are expected to be below $100 million.
Some 45% of 2023 active 3D vessel time is expected to be allocated to contract work.
The order book amounted to $437 million on September 30, 2023. On June 30, 2023, and September 30, 2022, the order book was $341 million and $253 million, respectively.
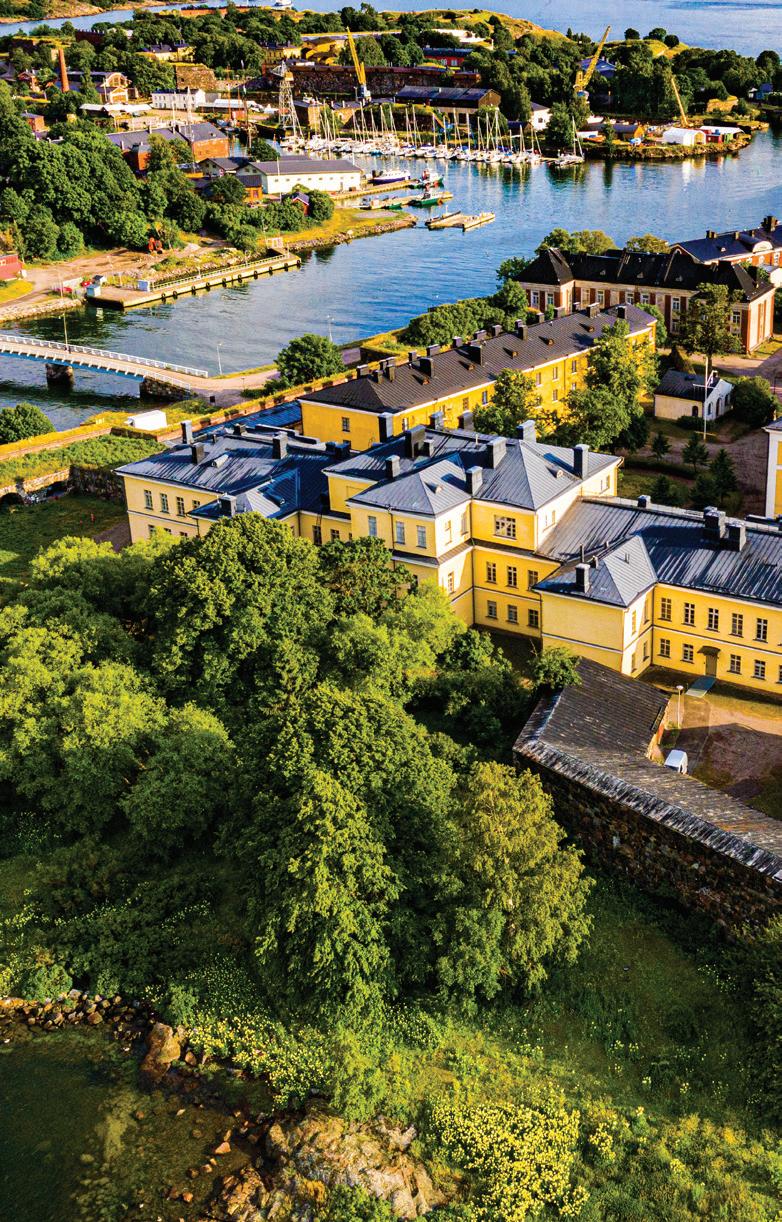
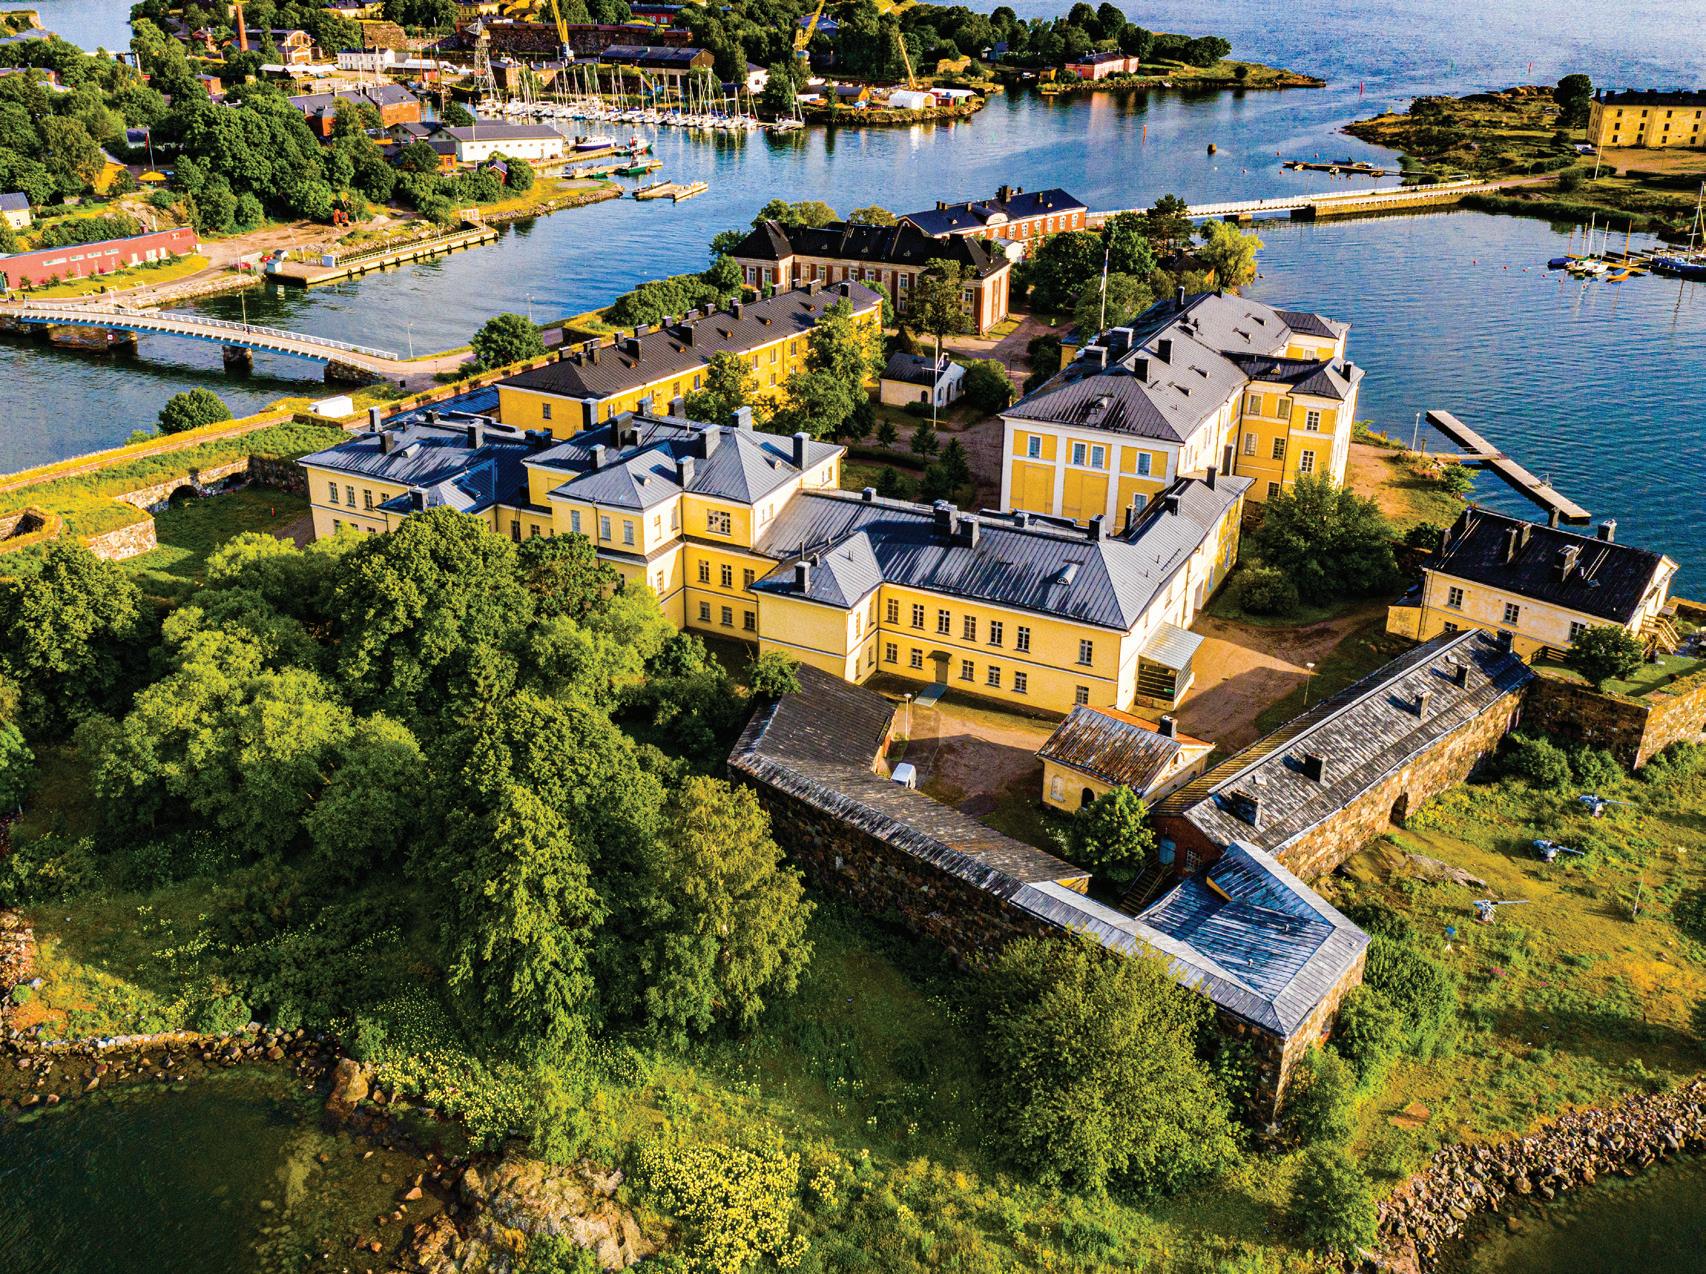


The industry has innovated to offer more and better-quality data. Geoscience companies are competing with each other to offer improved data processing and management packages for new acquisition and reprocessing of vintage data, often using the latest innovations in machine learning and artificial intelligence. Ever more powerful computing capability is aiding geoscientists’ application of complex algorithms and integration with different data types to give a more complete picture of the subsurface – both for oil and gas reservoirs and increasingly for renewable energy projects needed for the Energy Transition.
Christopher Hanton et al review the limitations of traditional subsurface data management tools and look at how machine Learning and artificial intelligence offer the capability to redesign how we manage data in our industry.
Kristy DeMarco addresses key challenges in data management and provides useful solutions for data aggregation, transportation and activation
Julien Oukili et al discuss the benefits of implementing deep neural networks for certain steps of seismic data processing on data examples from around the world.
Jill Lewis et al explain how the SEGY update to SEG-Y_r2.1 is updating historic data and enabling auto-access to historic data.
Jose Chapela explores the challenges associated with data management and review solutions to overcome them.
Neil Hodgson et al demonstrate how reprocessing vintage data can bring new prospectivity to basins in Oman and East Coast India.
Sylvain Masclet et al illustrate how the leveraging of sparse node data through an interferometry approach and the use of elastic FWI can enhance streamer seismic imaging.
First Break Special Topics are covered by a mix of original articles dealing with case studies and the latest technology. Contributions to a Special Topic in First Break can be sent directly to the editorial office (firstbreak@eage.org). Submissions will be considered for publication by the editor.
It is also possible to submit a Technical Article to First Break. Technical Articles are subject to a peer review process and should be submitted via EAGE’s ScholarOne website: http://mc.manuscriptcentral.com/fb
You can find the First Break author guidelines online at www.firstbreak.org/guidelines.
January Land Seismic
February Digitalization / Machine Learning
March Reservoir Monitoring
April Unconventionals and Passive Seismic
May Global Exploration Hotspots
June Securing a Sustainable Future Together
July Modelling / Interpretation
August Near Surface Geo & Mining
September Reservoir Engineering & Geoscience
October Energy Transition
November Marine Acquisition
December Data Management and Processing
More Special Topics may be added during the course of the year.


13-15 May Fourth EAGE/AAPG Hydrocarbon Seals Workshop www.eage.org
13-15 May 6th Asia Pacific Meeting on Near Surface Geoscience and Engineering www.eage.org
13-16 May InterPore 2024 events.interpore.org/event/46/
10-13 Jun 85 th EAGE Annual Conference and Exhibition www.eageannual.org
Aug 3 rd EAGE Conference on Carbon Capture and Storage www.eage.org
Aug 4th EAGE Workshop on Fiber Optic Sensing for Energy Applications www.eage.org
18-23 Aug Goldschmidt 2024 conf.goldschmidt.info/goldschmidt/2024/meetingapp.cgi
Sep Near Surface Geoscience Conference and Exhibition 2024 www.eagensg.org
12-13 Sep First EAGE Workshop on
Sep Asia Petroleum Geoscience Conference and Exhibition (APGCE) icep.com.my/apgce