Strong Spending and Shifting Labour Benchmarks Complicate Fed Decision Consumer spending rose 0.5 percent in July, according to the latest Personal Income and Outlays report, with the Personal Consumption Expenditures PCE Price Index—the Federal Reserveʼs preferred inflation measure - climbing 2.6 percent from a year earlier, with the core measure rising 2.9 percent. These figures highlight the difficult policy trade-offs the Fed faces ahead of its September 1617 interest rate-setting meeting.
Consumer Spending, Income and Inflation Pressures Household demand in the US continues to remain solid. Motor vehicles led the gains in durable goods purchases in July, while spending also increased on recreational goods, clothing, and food. Services outlays rose 0.4 percent, supported by healthcare, housing, and financial services. However, restaurant and hotel spending weakened, and energy outlays declined as gasoline prices fell. Tariffs remain a key factor in the inflation outlook. While some businesses have relied on inventories or absorbed costs, the effects are beginning to appear in financial services and manufactured goods.
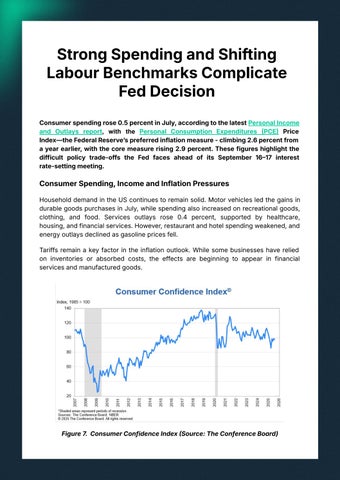
Figure 7. Consumer Confidence Index Source: The Conference Board)