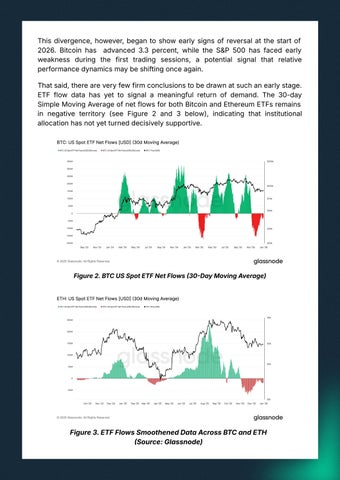
This divergence, however, began to show early signs of reversal at the start of 2026. Bitcoin has advanced 3.3 percent, while the S&P 500 has faced early weakness during the first trading sessions, a potential signal that relative performance dynamics may be shifting once again. That said, there are very few firm conclusions to be drawn at such an early stage. ETF flow data has yet to signal a meaningful return of demand. The 30-day Simple Moving Average of net flows for both Bitcoin and Ethereum ETFs remains in negative territory (see Figure 2 and 3 below), indicating that institutional allocation has not yet turned decisively supportive.
Figure 2. BTC US Spot ETF Net Flows 30Day Moving Average)
Figure 3. ETF Flows Smoothened Data Across BTC and ETH Source: Glassnode)