MARKETSTABILISES,BUT MOMENTUMREMAINSTENTATIVE

MARKETSIGNALS

BitcoinSupportLevelsHolding,But MarketIsFragile
MACROUPDATE
TheFedintheFog:Policy,Prices, andtheReturnofTradeTensions


BitcoinSupportLevelsHolding,But MarketIsFragile
TheFedintheFog:Policy,Prices, andtheReturnofTradeTensions
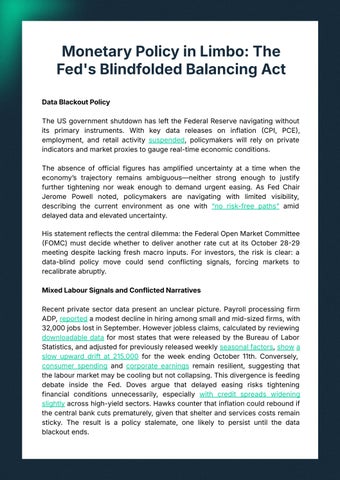
Following the historic $19 billion market liquidation event on October 10th, crypto markets have stabilised within narrower ranges. Bitcoin continues to defend its key structuralsupportat$107,500,whichisthelowerendoftheJulyairgapwhichnow serves as a critical floor. However, BTC remains below several key on-chain resistance levels, suggesting that while downside momentum has eased, the recoveryphaseisstilltentative.
The 18.1 percent peak-to-trough drawdown we have seen this month remains consistent with prior cycle-high retests since 2023, typically marking consolidation phases rather than trend reversals. Yet, institutional demand has yet to return decisively. Bitcoin ETFs recorded over $1.22 billion in net outflows last week, mirroring equity market weakness. Long-term holders have also reduced supply by roughly 0.3 million BTC since July, signalling steady profit-taking while new inflows lag behind. For now, the $107,000$108,000 zone remains a key inflection point. Failuretosustainaboveitwouldindicatedemand-sidefragility,potentiallyleadingto furtherlocaliseddrawdownsbeforeequilibriumisrestored.

The US economy is entering a period of heightened uncertainty as the Federal Reserveisforcedtooperatewithoutkeydataamidagovernmentshutdown.With official reports on inflation, jobs, and spending suspended, policymakers are relyingonprivateindicatorstoguidedecisionsaheadofthelate-Octobermeeting.
Theeconomyshowsneitherclearweaknessnorstrength,leavingtheFeddivided over whether to cut rates further. Markets are pricing in a 25 basis point cut, but tightening liquidity, volatile bond yields, and widening credit spreads reveal growinganxietyaboutapotentialpolicymisstep.
Inflation remains stubbornly high, increasingly driven by tariffs rather than domestic demand. New trade measures have added roughly half a percentage pointtocoreinflation,withfoodanddurablegoodspricesrisingsharply.Grocery costs are now the top source of consumer stress, keeping inflation expectations elevated and limiting the impact of future rate cuts. The manufacturing sector is feeling the strain, factory activity has contracted as input costs rise, while the housingmarketshowsearlyrecoverysignsthankstolowermortgagerates.
Meanwhile, escalating USChina tensions have reintroduced global supply chain risks.NewChineseexportrestrictionsandpotentialUStariffsofupto100percent threaten to disrupt trade flows and push costs higher. Although markets remain calm, supply-driven inflation risks are re-emerging as companies shift production toMexicoandSoutheastAsia.
The US crypto landscape is rapidly maturing as institutions and policymakers move to integrate blockchain into mainstream finance. At the policy level, Florida introducedabillthatwouldallowupto10percentofthestateʼspublicandpension fundstobeinvestedinBitcoin,tokenisedassets,andcryptoETFsby2026,asign ofgrowingacceptanceofdigitalassetsaslegitimateportfoliodiversifiers.
Meanwhile, Ripple announced a $1 billion acquisition of GTreasury, marking its expansion from blockchain payments into corporate treasury infrastructure. The deal aims to give Ripple more exposure to enterprise liquidity and cash management.Addingtothemomentum,NewYorkCityhaslaunchedan Officeof Digital Assets and Blockchain Technology, in an attempt to develop its own position as a potential hub for responsible crypto innovation and institutional adoption.
MarketSignals 2. GeneralMacroUpdate 3. NewsFromTheCryptosphere
● BitcoinSupportLevelsHolding,butMarket IsFragile

● MonetaryPolicyinLimbo:TheFed's BlindfoldedBalancingAct
● TariffsComplicatetheFedʼsInflationFight
● FactoryActivityContracts,WhileBuilder ConfidenceClimbsonRateCuts
● TradeandSupplyChainRisk:USChina TensionsReturntoCentreStage
● FloridaFloatsProposaltoLetState& PensionFundsAllocateUpto10Percentto BitcoinandCryptoETFs
● RippleEntersCorporateTreasuryDomain via$1BAcquisitionofGTreasury
● NewYorkCityEstablishesOfficeofDigital AssetsandBlockchainTechnology

Followinglastweekʼsmarketturmoil,whichonOctober10th,saw$19billion ofliquidations,mostcryptoassetshavestagedpartialrecoveriesandarenow consolidating within relatively narrow ranges. Bitcoin has notably held its highertimeframerangesupportlevelnear$107,500,thesame“airgapˮzone wehaveflaggedbeforeasapotentialresistancelevel,andthis continuesto serveasacriticalstructuralfloorforthemarket.
However, BTC is now trading below several key on-chain resistance thresholds, signalling that the recovery phase is still in its early stages. Marketparticipantsarelookingaheadtoseveralimportantcatalystsintothe end of October, including the anticipated Trump–Xi meeting, additional potential rate cuts, and major technology earnings releases - all of which couldinfluencerisksentimentandliquidityconditions.
With volatility compressed and positioning reset following the liquidation cascade,thenexttwoweeksarelikelytodeterminewhetherthemarketcan transitionfromstabilisationtosustainedrecovery.

CryptoinvestorsentimentremainsfragilefollowingrecentvolatilityonOctober 10th,whichsawover$19billioninliquidations.BTCiscurrentlydownabout14 percent from its all-time high, reached on October 6th, with a peak-to-trough drawdownof18.1percent.Thisscaleofcorrection,however,isconsistentwith prior false ATH breakouts and cycle-high retests observed since 2023, all of whichultimatelyresolvedtotheupside.
That said, downside risk remains a relevant consideration for investors. BTC continuestotradenearrangelows,withinstitutionaldemandyettore-emerge decisively; ETF dip-buying has been muted, and geopolitical uncertainty continues to weigh on broader risk appetite. However, given the magnitude of lastweekʼsliquidationeventandthedegreeofstructuraldeleveragingalready absorbed,anyfurtherdownsideislikelytobelesssevereandlessvolatilethan whatthemarketexperienced onOctober10th.
In short, while caution is warranted, historical precedent suggests that drawdownsofthissizewithinongoingbullcyclesoftenrepresentconsolidation ratherthantrendreversals.
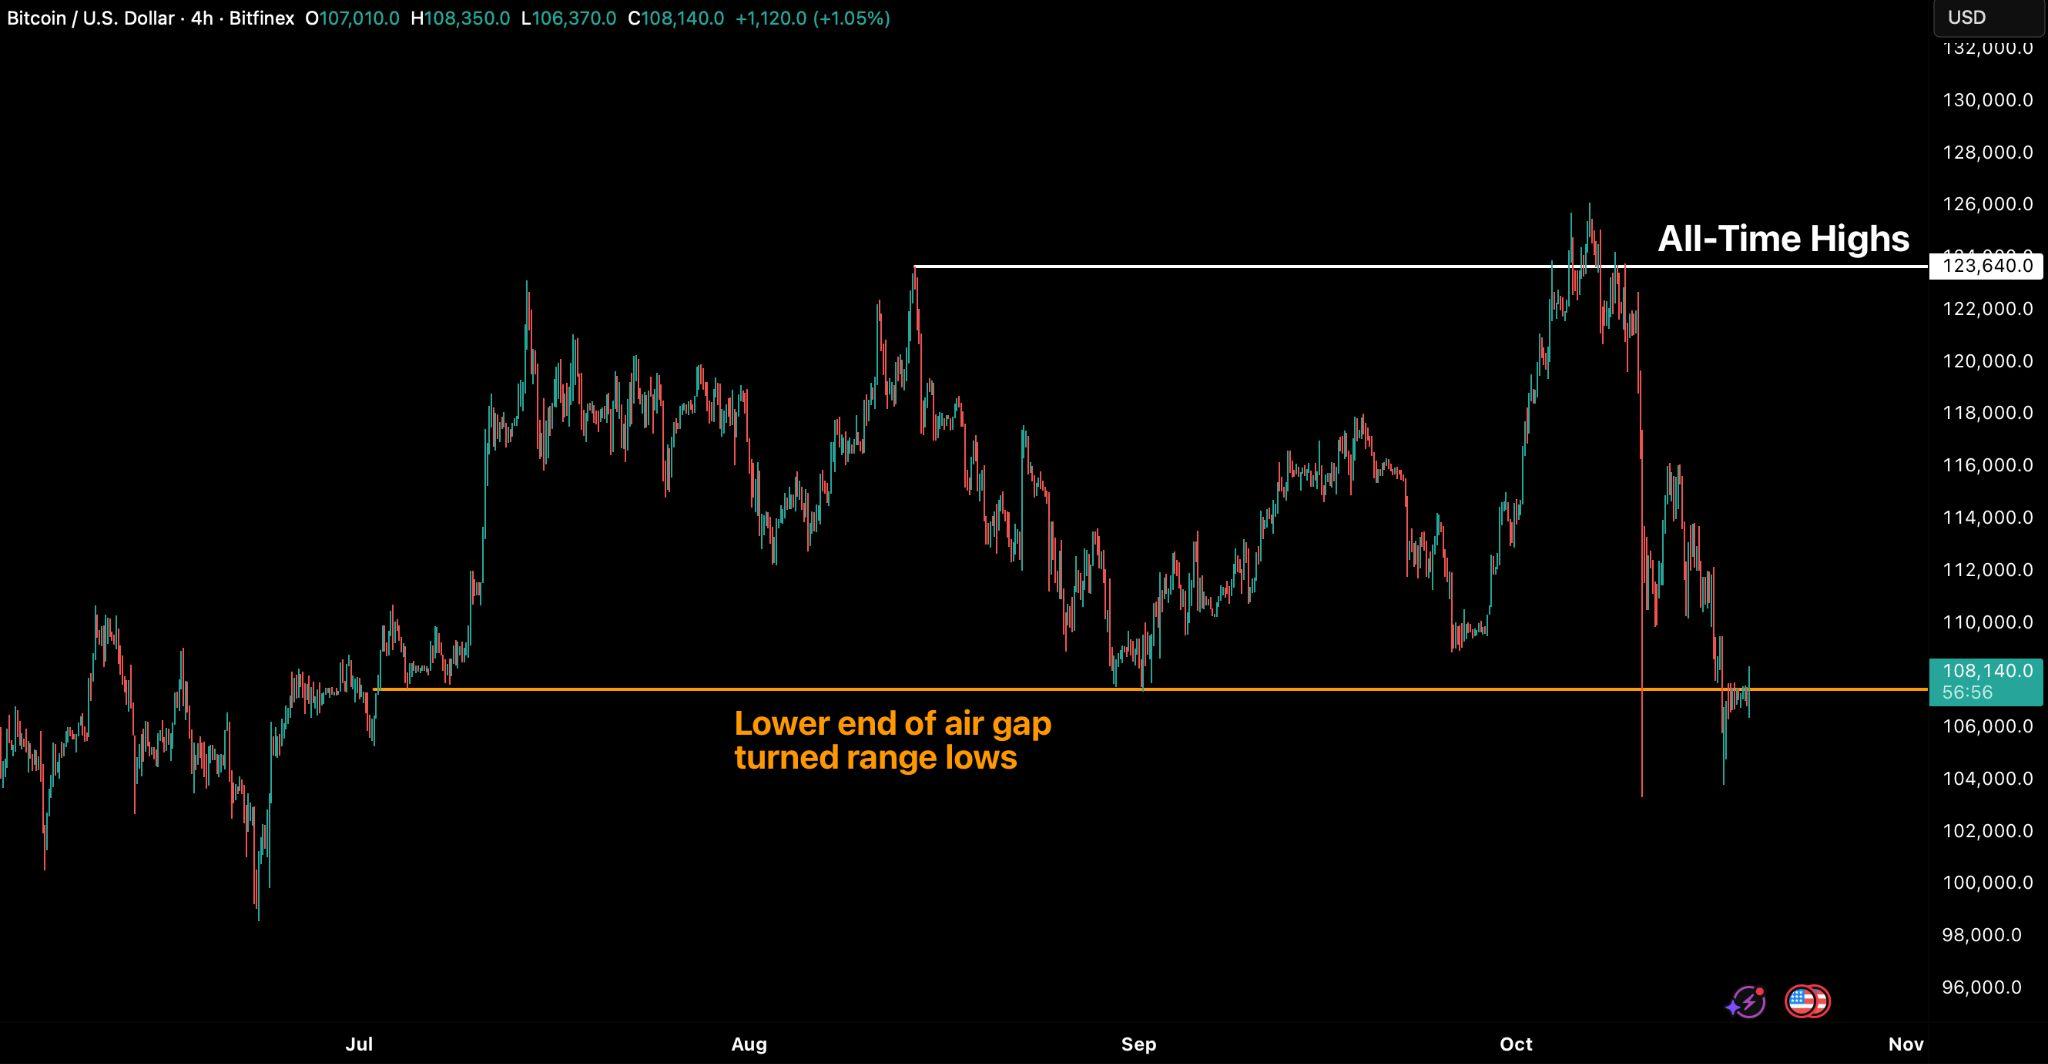
This latest contraction is particularly notable, marking the third instance since lateAugustthatBTCʼsspotpricehasfallenbelowthe0.95-quantilepricemodel at $117,100 which is a threshold where more than 5 percent of supply, largely heldbytopbuyers,isnowsittingataloss.SeeFigure2 below).BTCcurrently trades within the 0.850.95 quantile range between $108,400 and $117,100 where10percentofthesupplyhaschangedhandsonchain.
Figure2BitcoinPriceAgainsttheCostBasisAcrossVariousQuantiles. Source:Glassnode)

Absentafreshcatalysttopropelpricesbackabove$117,100,themarketfaces theriskofadeepercontractionbelowthelowerboundaryofthisrange,which now has both on-chain data and technical level significance. Historically, failure to hold this zone has often preceded extended mid- to long-term corrective phases, as sentiment weakens and capital rotation stalls. A sustained break below $108,000 would therefore serve as a key warning signal, suggesting structural fragility and raising the probability of a more prolongedconsolidationperiod.
Recent ETF flow data underscores the current absence of meaningful dip-buying from institutional investors. Bitcoin ETFs recorded net outflows exceeding $1.22 billion over the past trading week (see Figure 3 below), reflecting reduced conviction across traditional finance channels. These ETF flows have also remained closely correlated with equity market performance, whichsimilarlyexperiencedbroad-baseddrawdownslastweek.
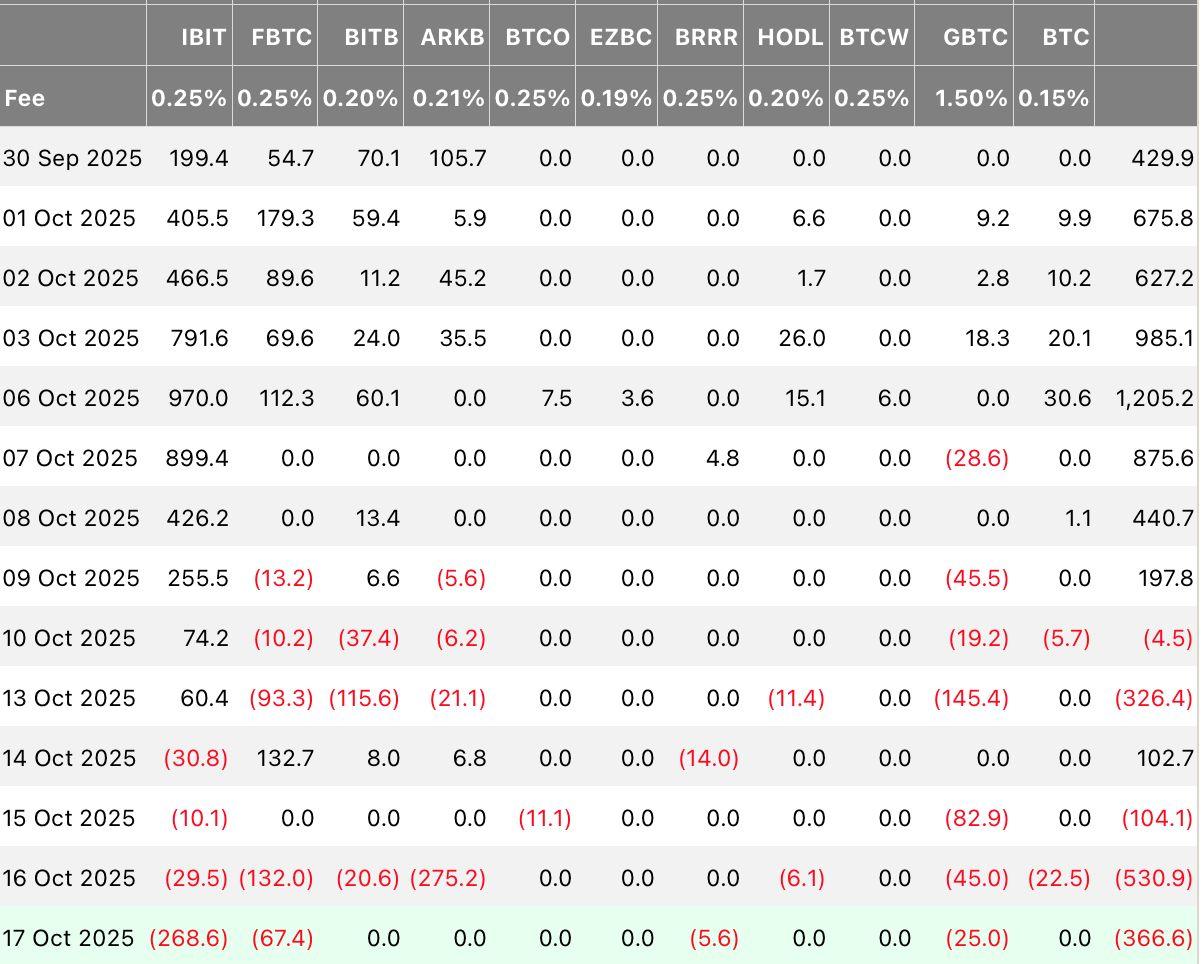
The lack of institutional accumulation has made the $107,000$108,000 zone increasinglydifficulttodefendassupport.Addingtothispressure,DigitalAsset Treasuries and Bitcoin treasury companies have recently seen a contraction in their net asset value premiums. This development is partly linked to the equity pullback. This compression further constrains their ability to act as marginal buyers in the near term, reinforcing the challenge for BTC to sustain current levelswithoutaclearrevivalininstitutionaldemand.
We believe that the current moderation in market activity reflects hesitation rather than any reversal in sentiment. However, if weakness persists or ETF inflows fail to recover meaningfully in the coming weeks, it would point to growing demand-side fragility. Such a scenario could undermine one of the primary forces behind previous rallies - consistent institutional accumulation, heighteningtheriskofamoreprolongedconsolidationphase.
Adding to the marketʼs difficulty in sustaining higher price levels, persistent distribution by long-term holders LTHs since July 2025 has further limited upside momentum. Over this period, the total LTH supply has declined by approximately 0.3 million BTC, signalling steady profit realisation among older investors, and at a time where new marginal buyers are not generating the sameamountofbuypressurerelativetopreviousmonths.
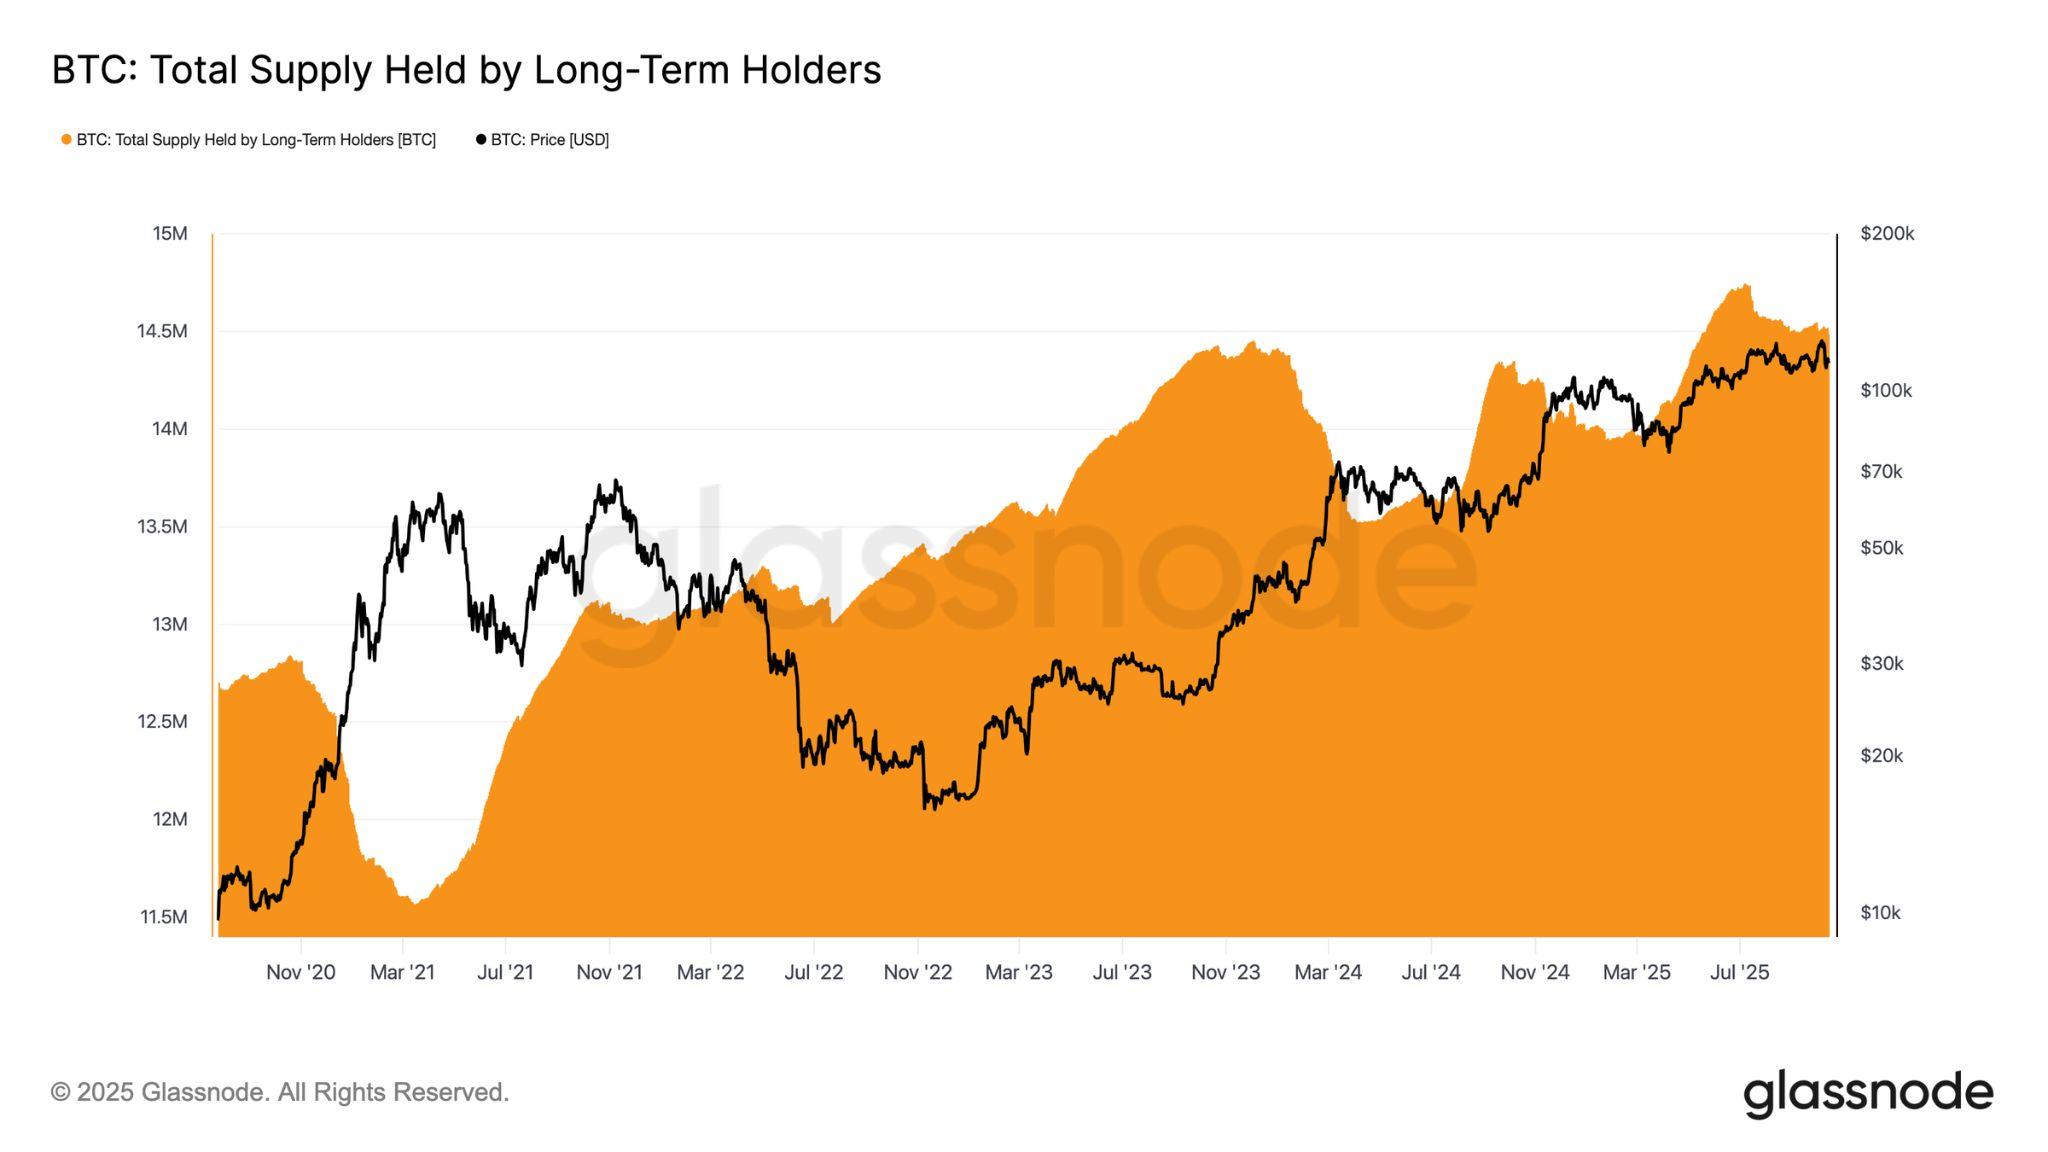
This ongoing sell-side pressure underscores the growing risk of demand exhaustion, particularly as institutional inflows and spot accumulation remain muted. In such an environment, the market is likely to shift into a consolidation phase,characterisedbyreducedvolatilityandrange-boundpriceaction.Should LTH distribution continue without a corresponding resurgence in new demand, periodic corrections or localised drawdown events could emerge before a new equilibriumisestablished.


The US government shutdown has left the Federal Reserve navigating without its primary instruments. With key data releases on inflation CPI, PCE, employment, and retail activity suspended, policymakers will rely on private indicatorsandmarketproxiestogaugereal-timeeconomicconditions.
The absence of official figures has amplified uncertainty at a time when the economyʼs trajectory remains ambiguous—neither strong enough to justify further tightening nor weak enough to demand urgent easing. As Fed Chair Jerome Powell noted, policymakers are navigating with limited visibility, describing the current environment as one with “no risk-free pathsˮ amid delayeddataandelevateduncertainty.
Hisstatementreflectsthecentraldilemma:theFederalOpenMarketCommittee FOMC) must decide whether to deliver another rate cut at its October 2829 meeting despite lacking fresh macro inputs. For investors, the risk is clear: a data-blind policy move could send conflicting signals, forcing markets to recalibrateabruptly.
Recent private sector data present an unclear picture. Payroll processing firm ADP,reportedamodestdeclineinhiringamongsmallandmid-sizedfirms,with 32,000jobslostinSeptember.Howeverjoblessclaims,calculatedbyreviewing downloadable data for most states that were released by the Bureau of Labor Statistics,andadjustedforpreviouslyreleasedweeklyseasonalfactors,showa slow upward drift at 215,000 for the week ending October 11th. Conversely, consumer spending and corporate earnings remain resilient, suggesting that thelabourmarketmaybecoolingbutnotcollapsing.Thisdivergenceisfeeding debate inside the Fed. Doves argue that delayed easing risks tightening financial conditions unnecessarily, especially with credit spreads widening slightlyacrosshigh-yieldsectors.Hawkscounterthatinflationcouldreboundif thecentralbankcutsprematurely,giventhatshelterandservicescostsremain sticky. The result is a policy stalemate, one likely to persist until the data blackoutends.
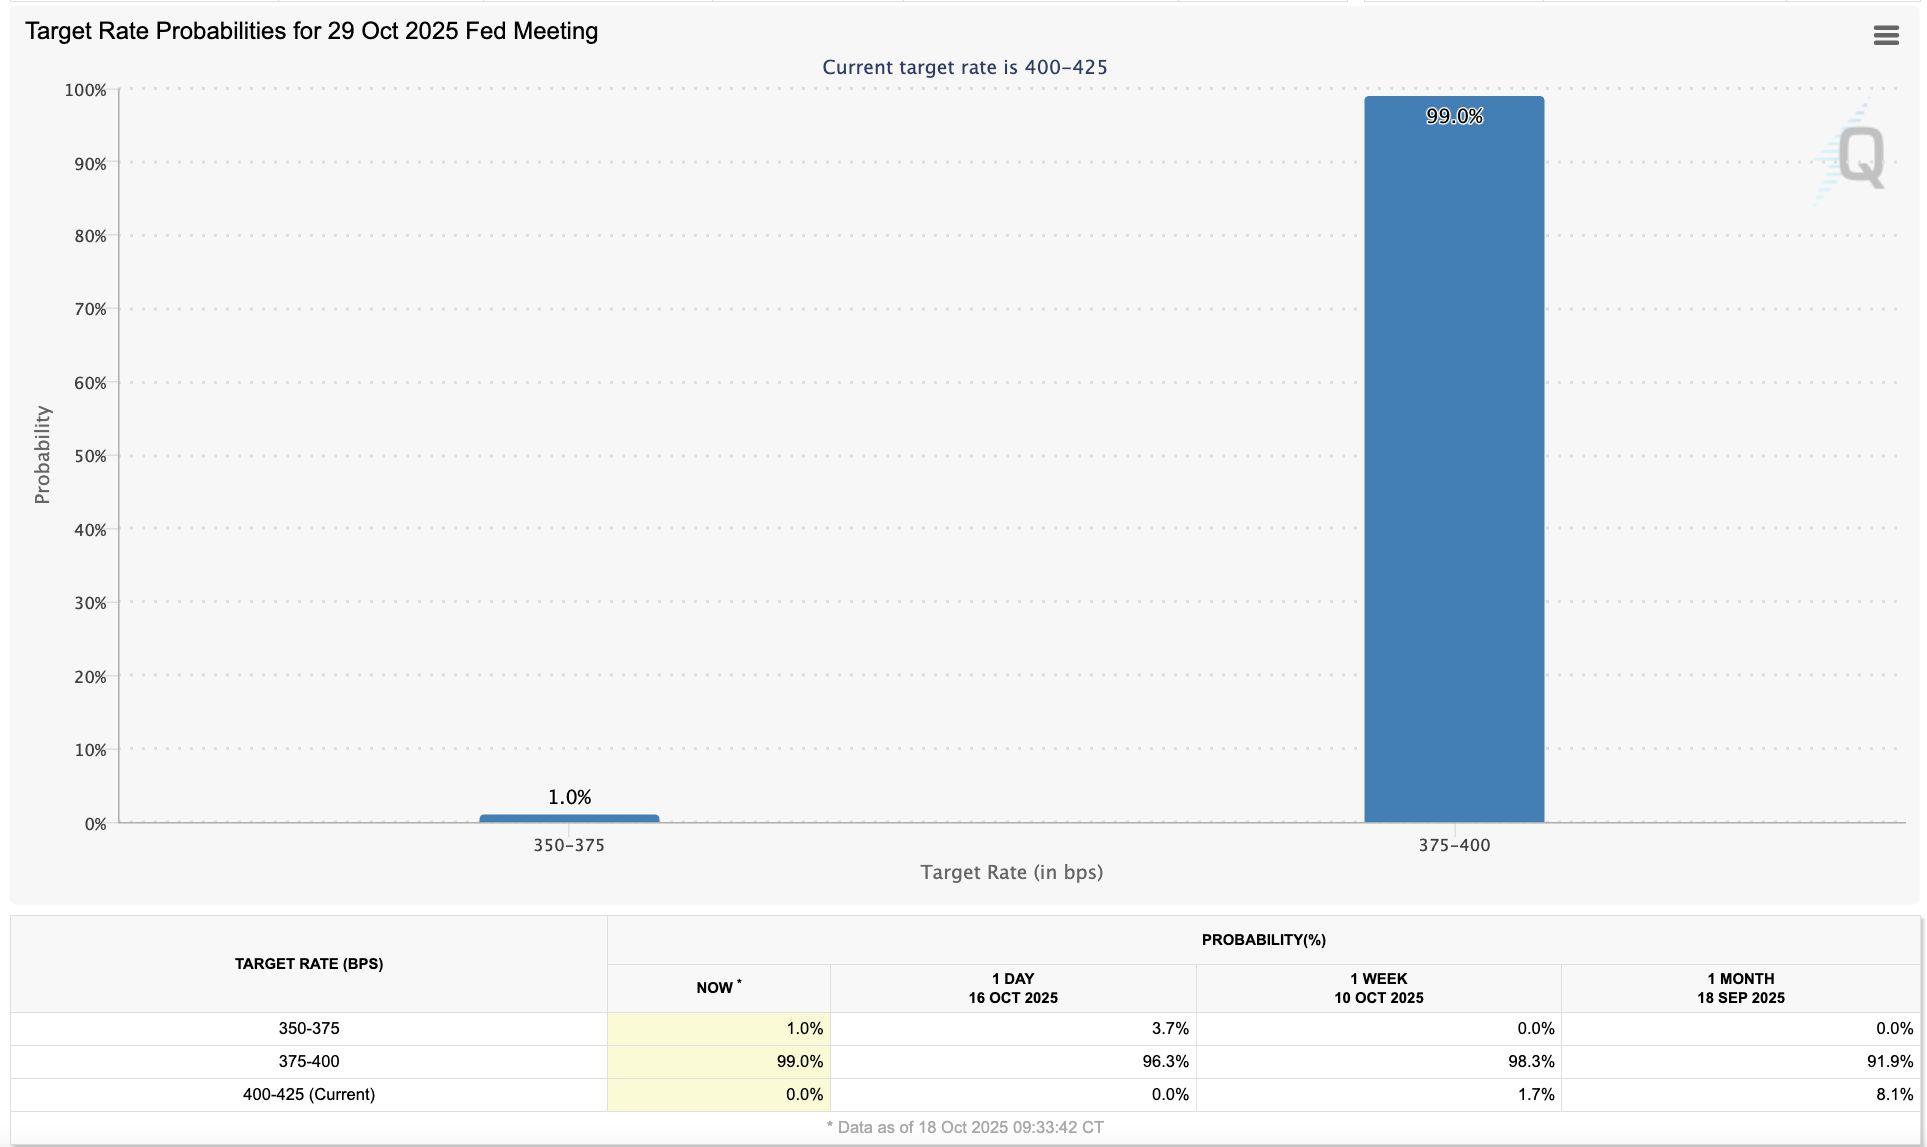
In the absence of official guidance, financial markets have become the de factointerpreterofeconomichealth.TheCMEFedwatchToolcurrentlyprices in a 99 percent probability of a 25 basis point cut, though expectations fluctuatedailyasinvestorsparseeverypubliccommentfromFOMCmembers.
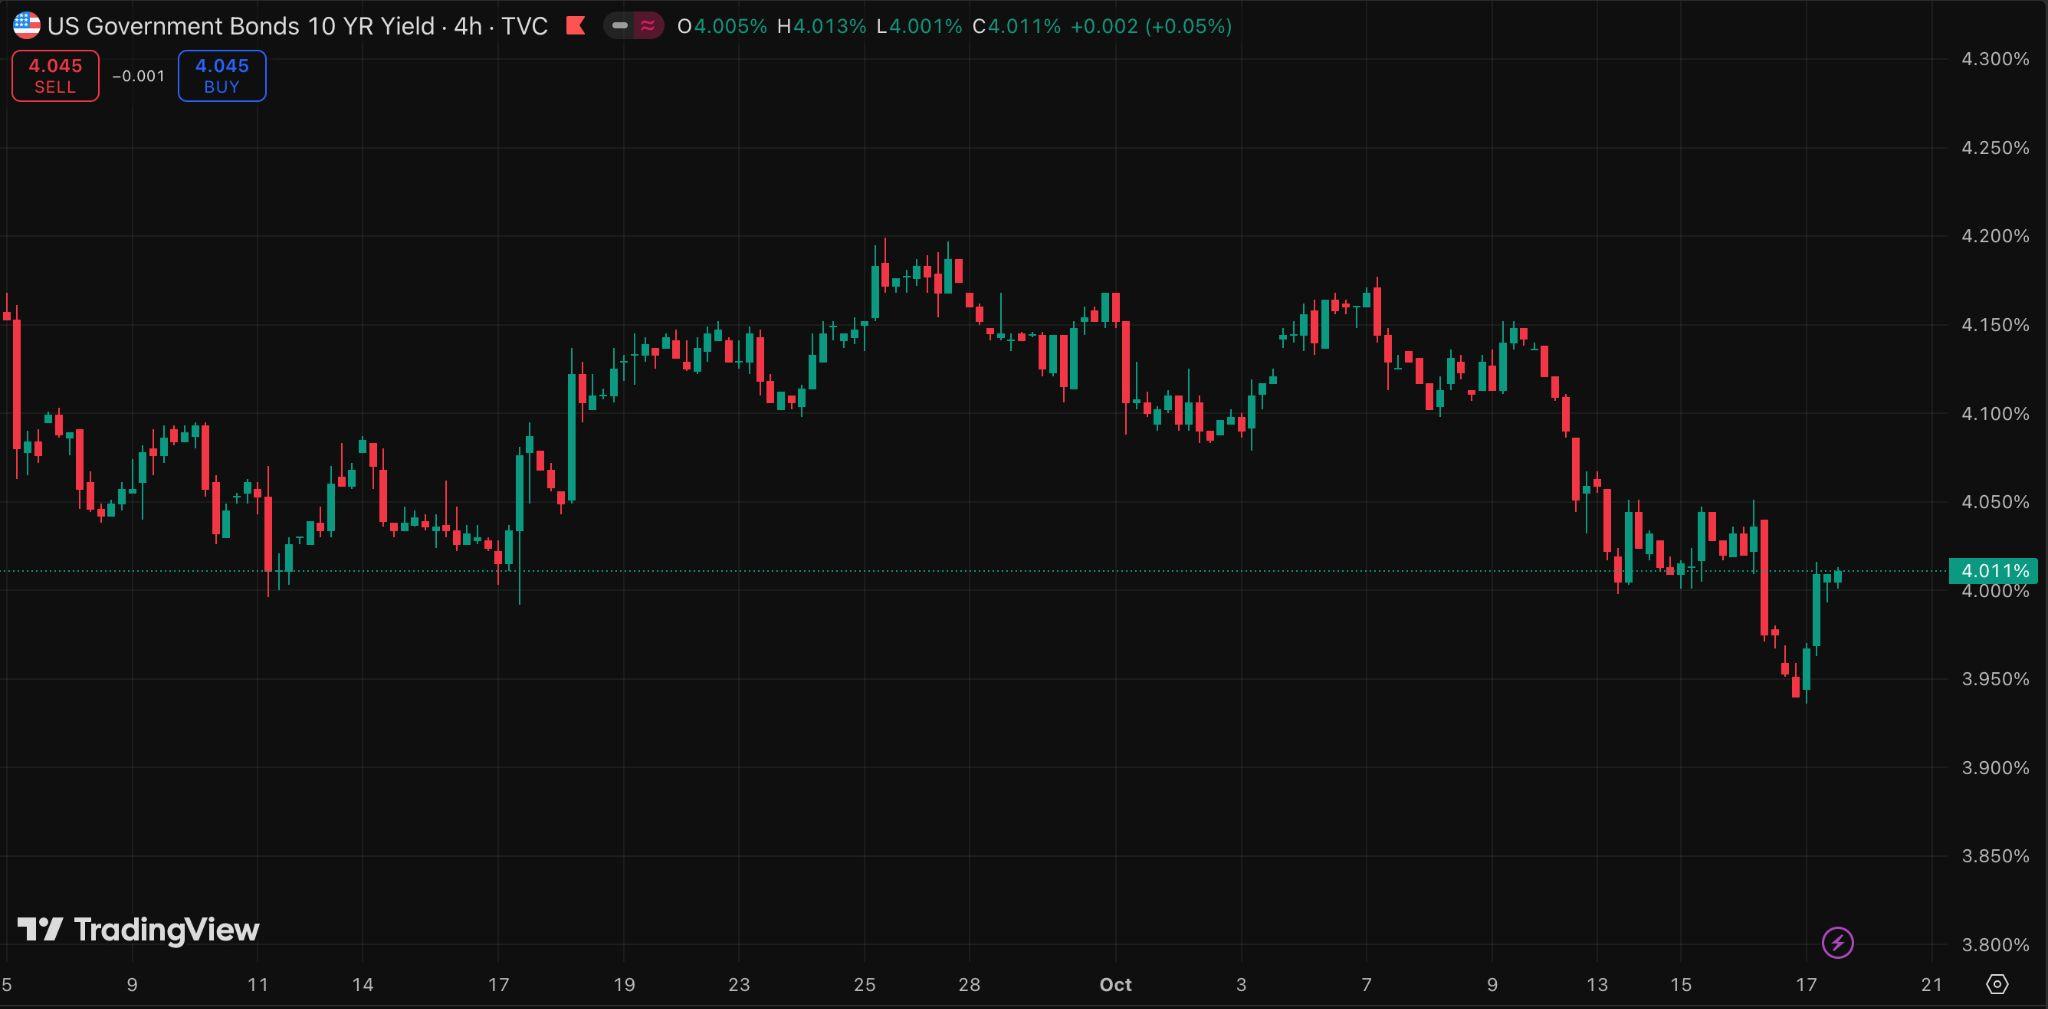
Bondmarkets,meanwhile,reflectclassicsignsofpolicyuncertainty:the10-year Treasury yield has traded within a roughly 23-basis-point range this month, oscillatingbetween3.94and4.17percentasinvestorsrepositionaroundshifting Fed expectations. Equities remain cautiously bid on the assumption that lower rates are coming, but a delay or reversal could prompt rapid repricing. A Fed surpriseineitherdirectioncouldunleashthetypeofcross-assetturbulencelast seen during the 2018 Fed miscommunication episode, when misaligned messagingtriggeredaglobalrisk-offmove.
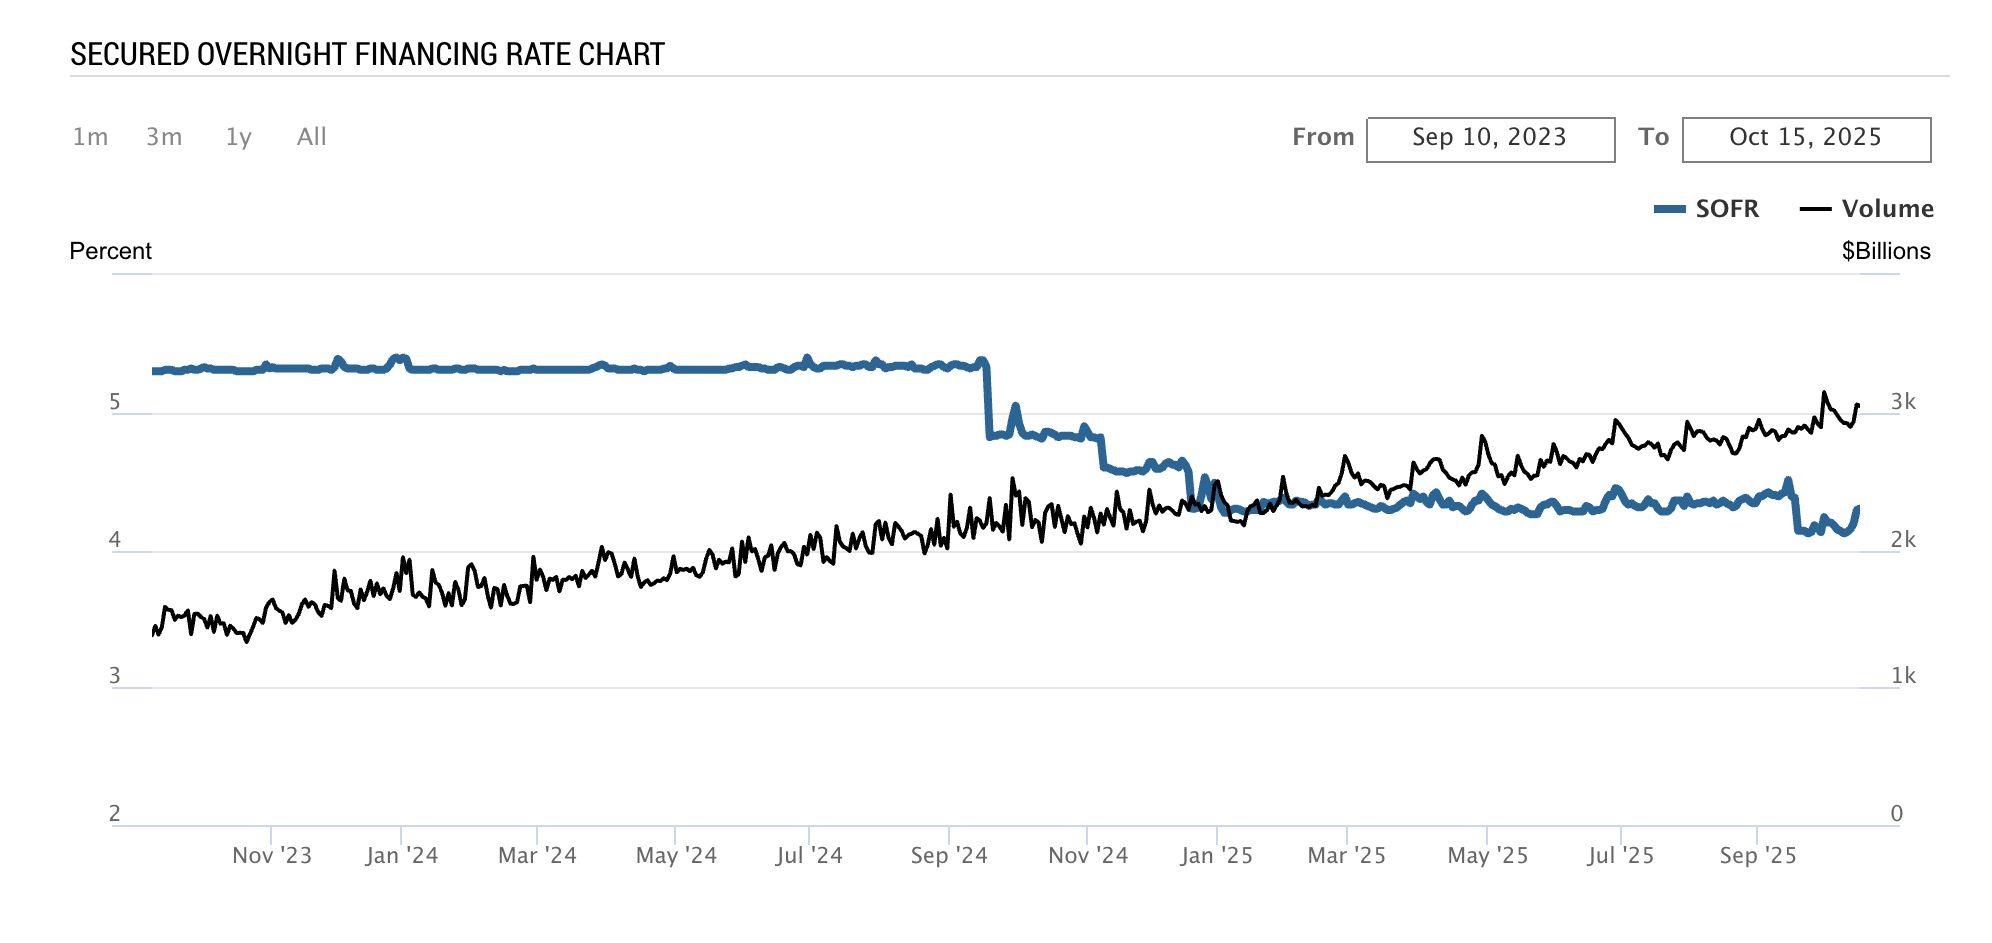
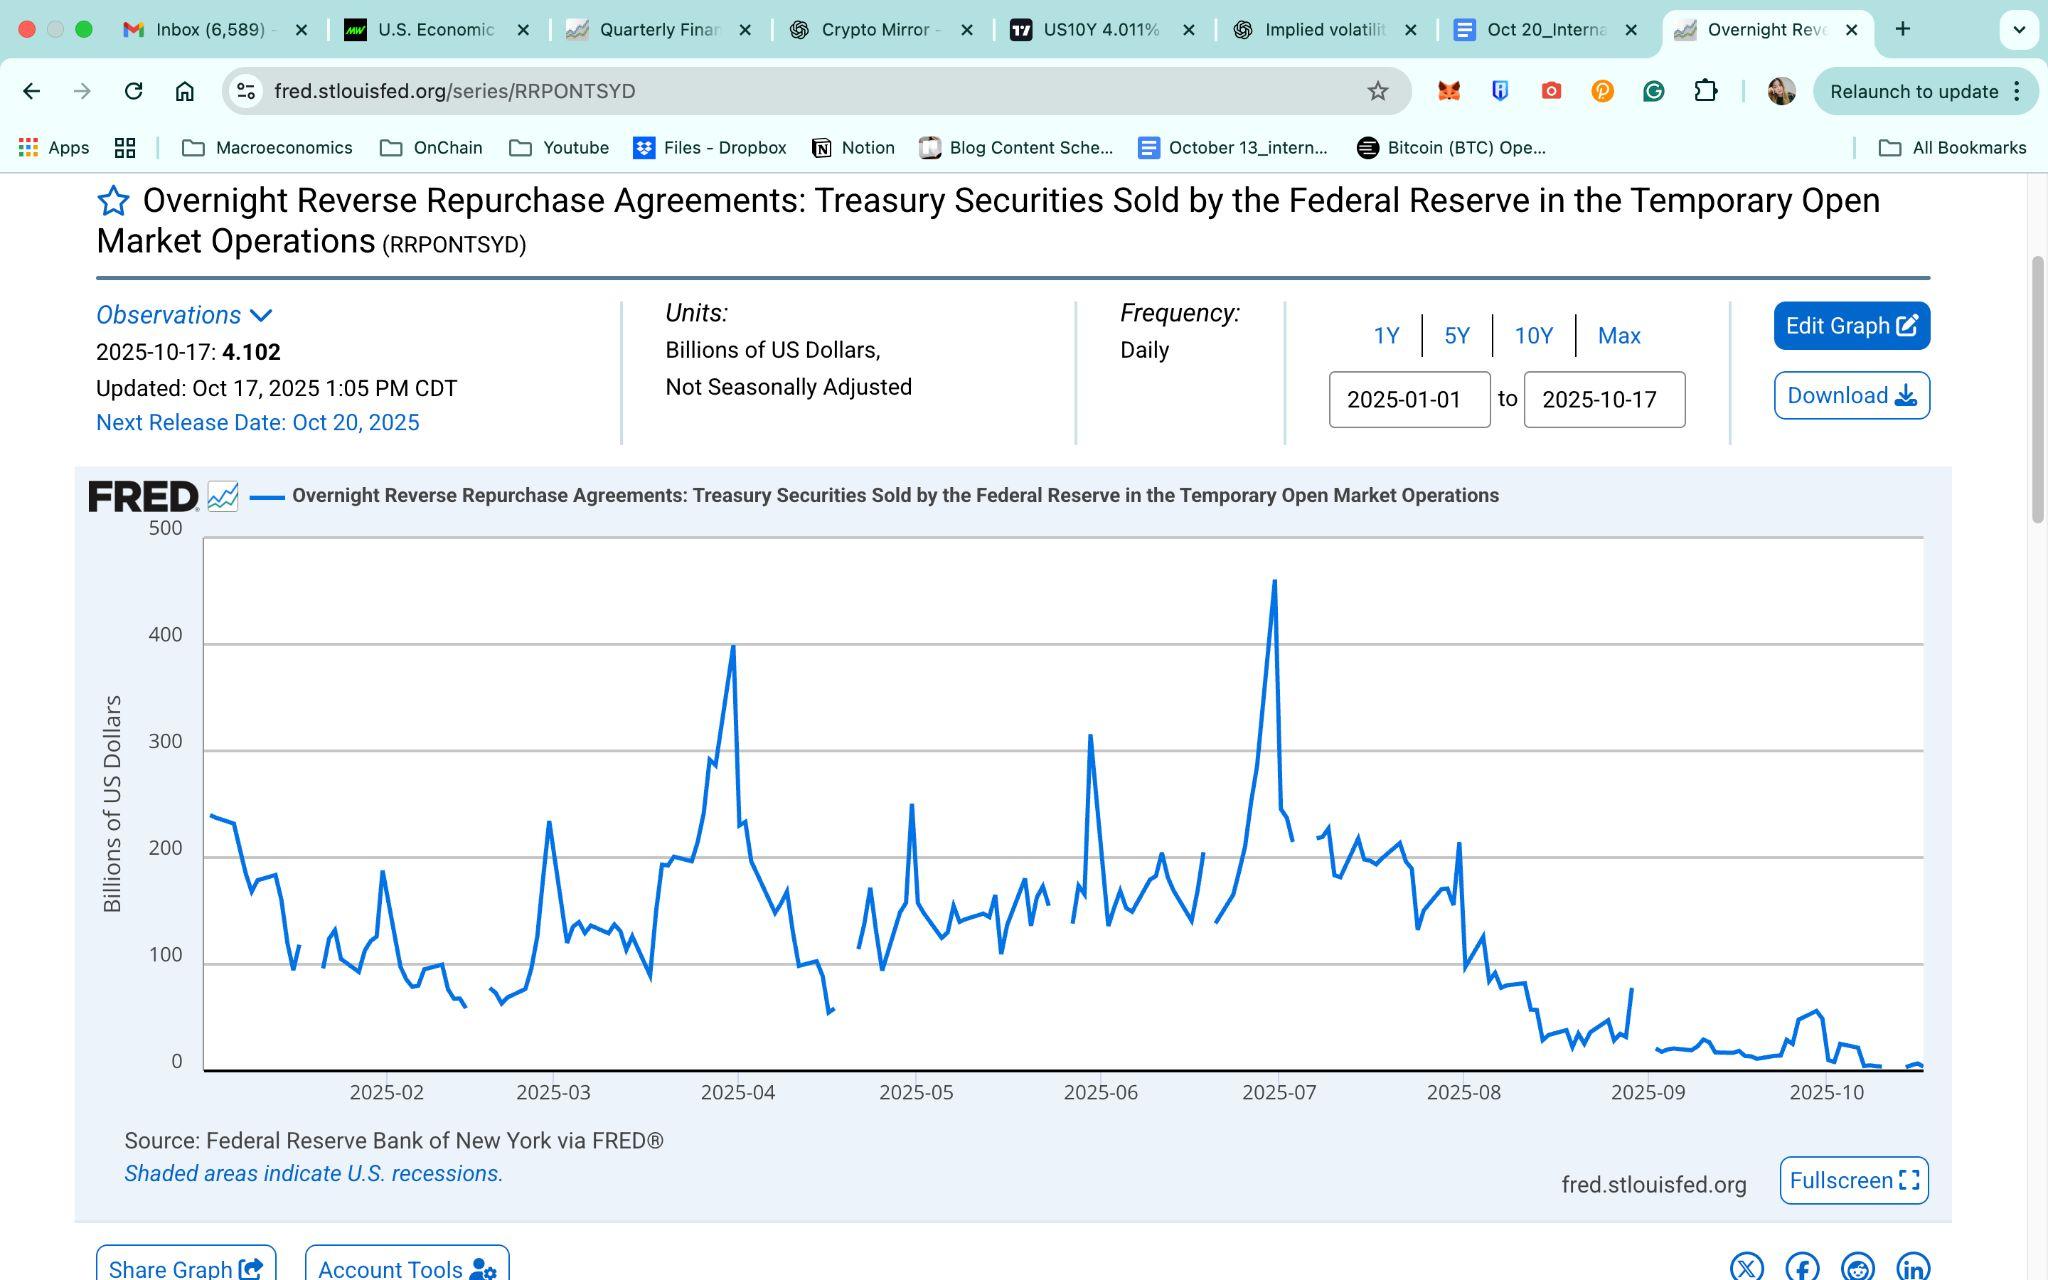
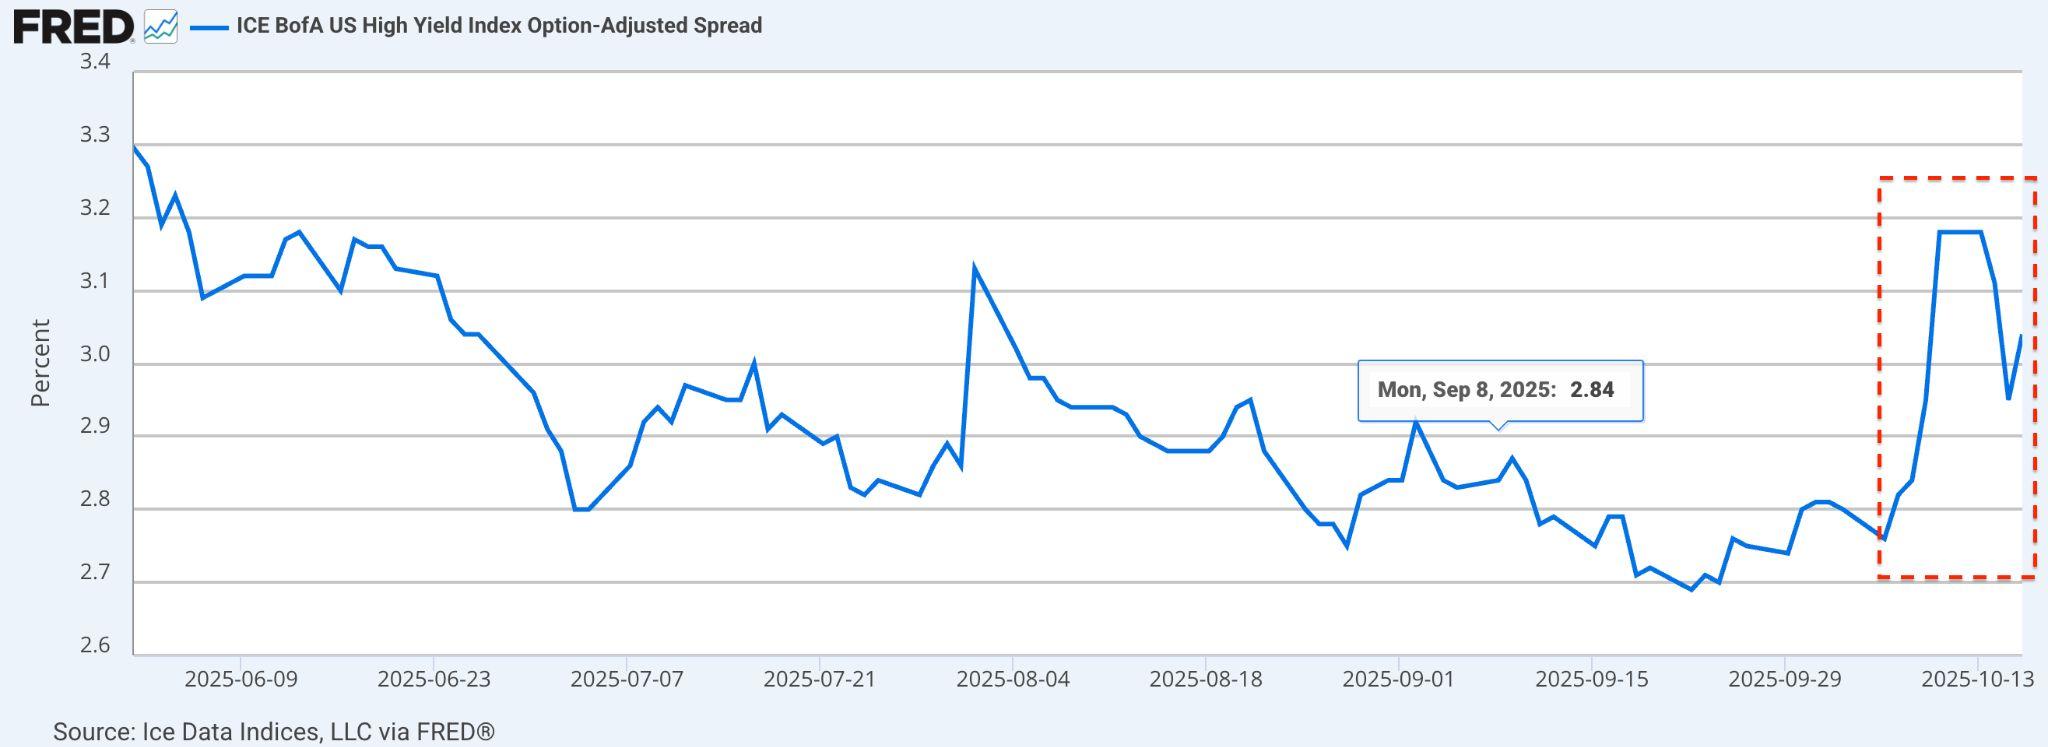
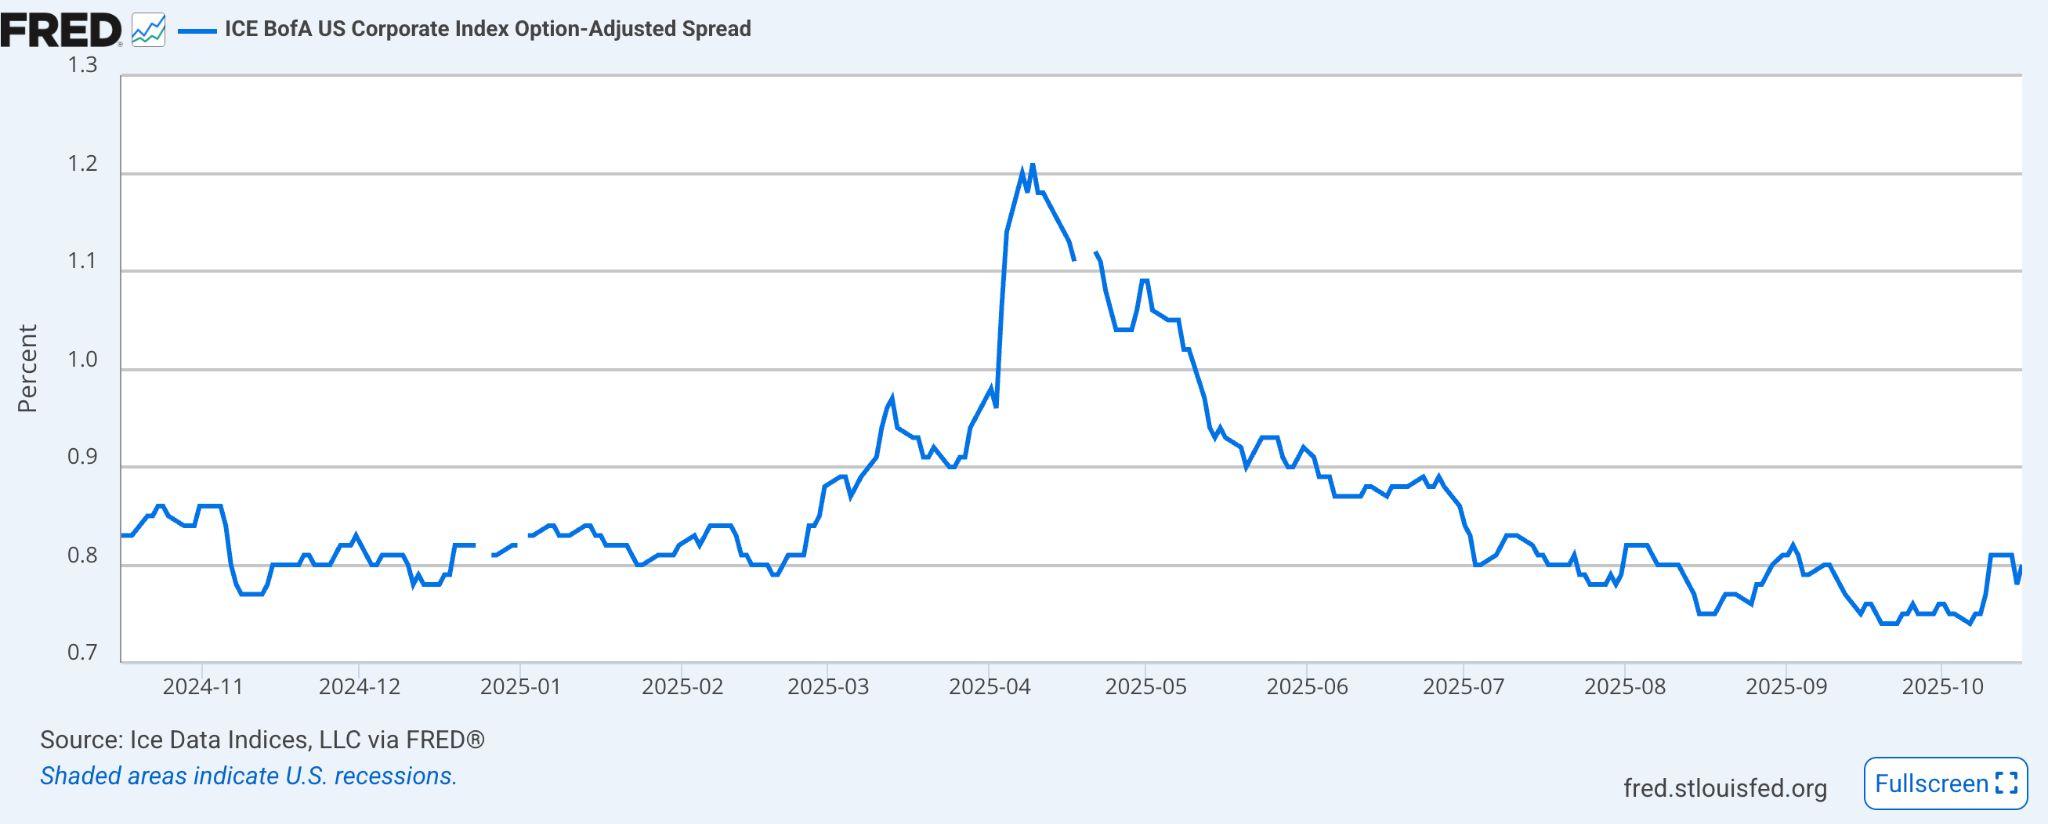
Moneymarketindicatorshintthatliquidityistighteningatthemargin.TheSecured Overnight Financing Rate SOFR) rose briefly above 4.83 percent amid end-quarterfundingpressure,whilereverserepobalancescontinuetodeclineto $4 billion as investors migrate toward higher-yielding Treasury bills. Investment-grade credit spreads are hovering around 80 basis points on the ICE BofAUSCorporateIndexOAS(seeFigure10below),amodestuptickthatsignals cautiouspositioningamidpolicyuncertainty.
Historically, when fiscal impasses shutdown statistical agencies, markets have leaned heavily on Fed communication for direction. But with policymakers themselves divided, clarity remains elusive. Each new speech or interview from regionalFedpresidentsnowmovesmarketsasmuchasthedataoncedid.
Until official economic releases resume, the Fed's next move will rest more on judgmentthanevidence.Thisheightenstheriskofapolicymisread,eithercutting toolittleandstiflinggrowthorcuttingtoomuchandreignitinginflation.
AsUSinflationprovesstickierthanpolicymakershoped,newdatasuggests thattariffsareplayingagrowingroleinkeepingpriceselevated,particularly infoodanddurablegoods.
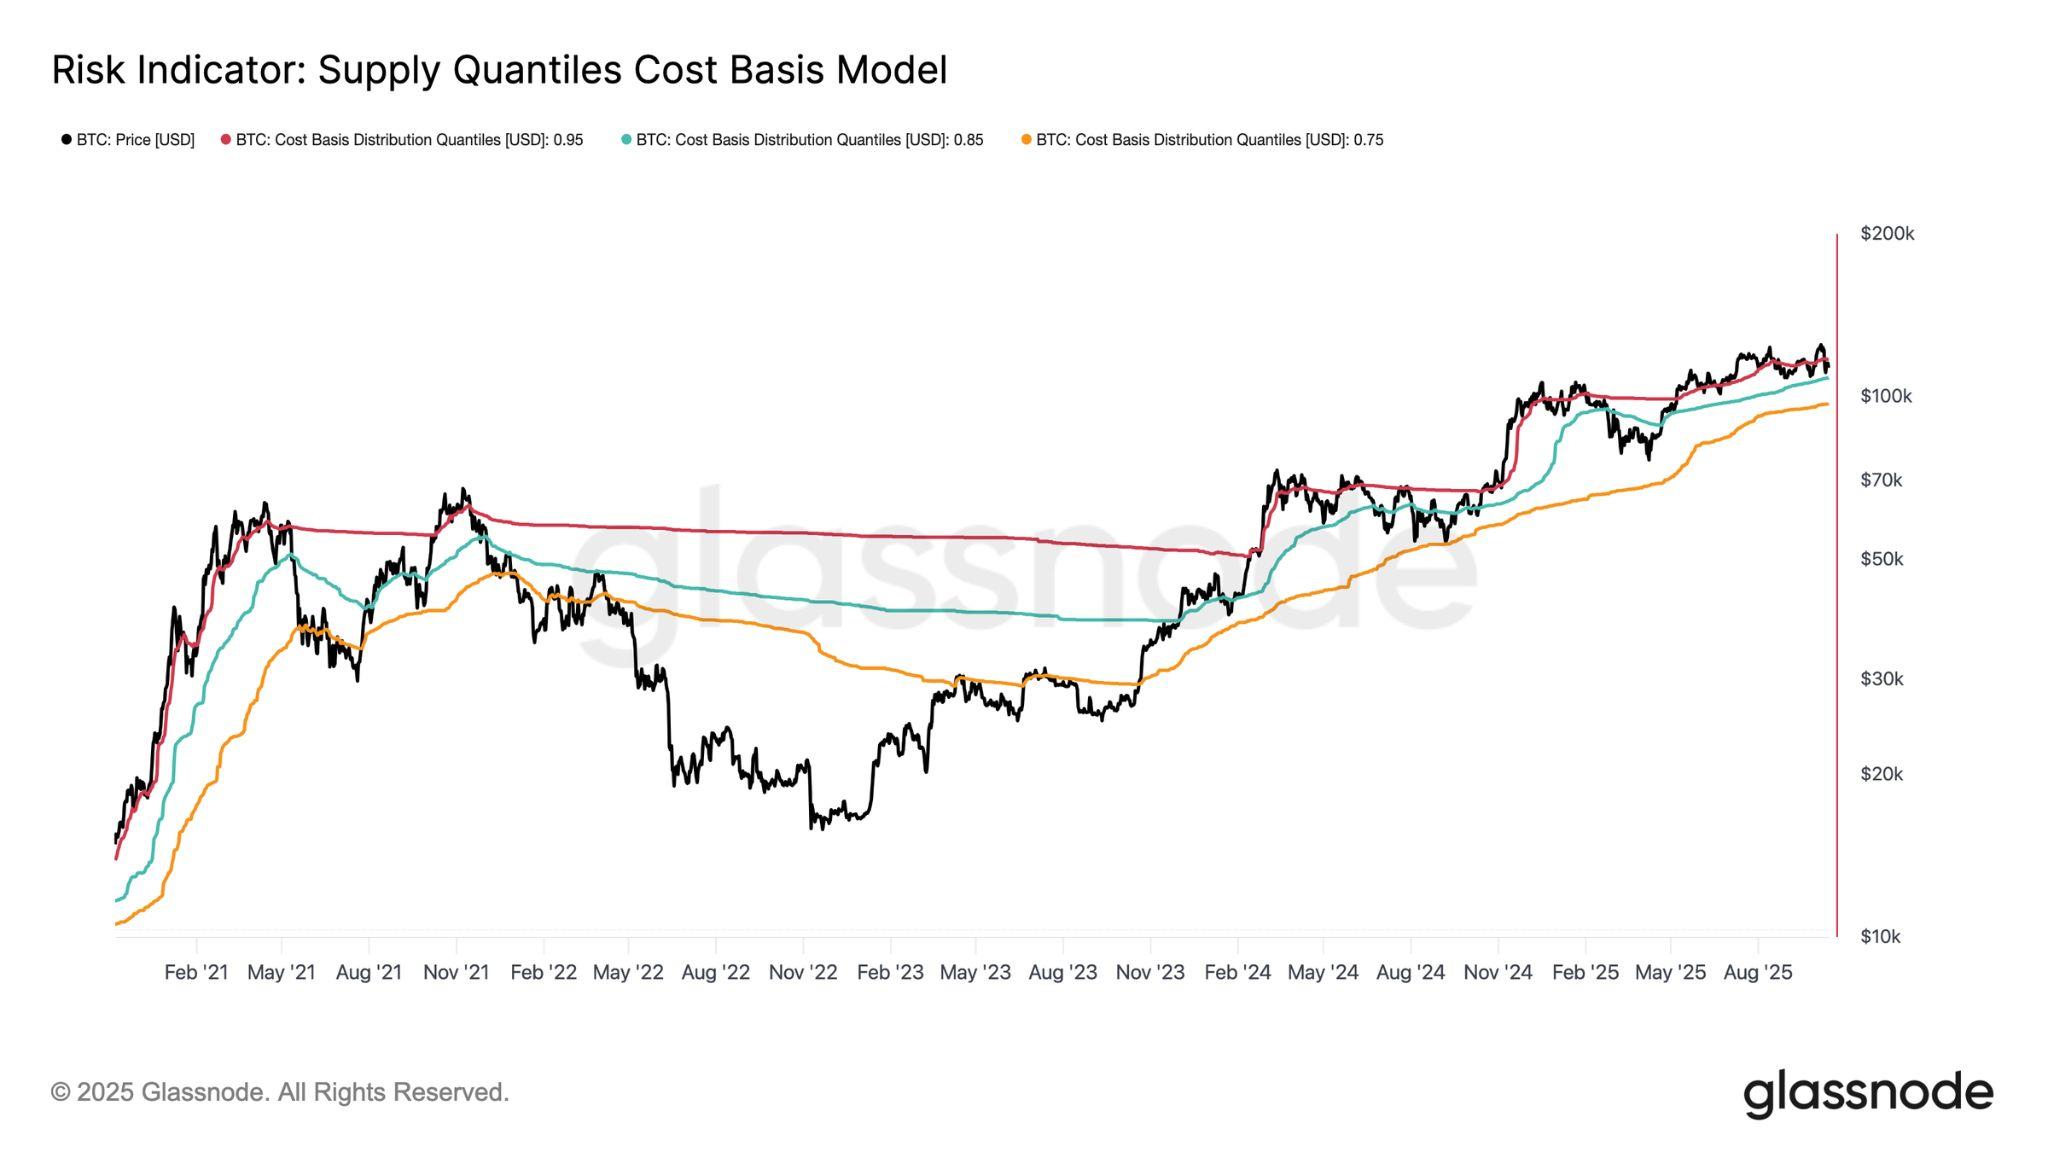
LastFriday,October17th,theInflationNowcastfromtheFederalReserveBank ofClevelandshoweda0.22percentriseintheheadlineConsumerPriceIndex CPI)anda0.25percentincreaseinthecoremeasure,whichexcludesfoodand energy.ThatwouldplaceCPIinflationat2.97percentyear-over-year,abovethe Fedʼs2percenttarget.
Figure11.InflationMonth-over-MonthPercentChangeNowcast
Source:FederalReserveBankCelveland)
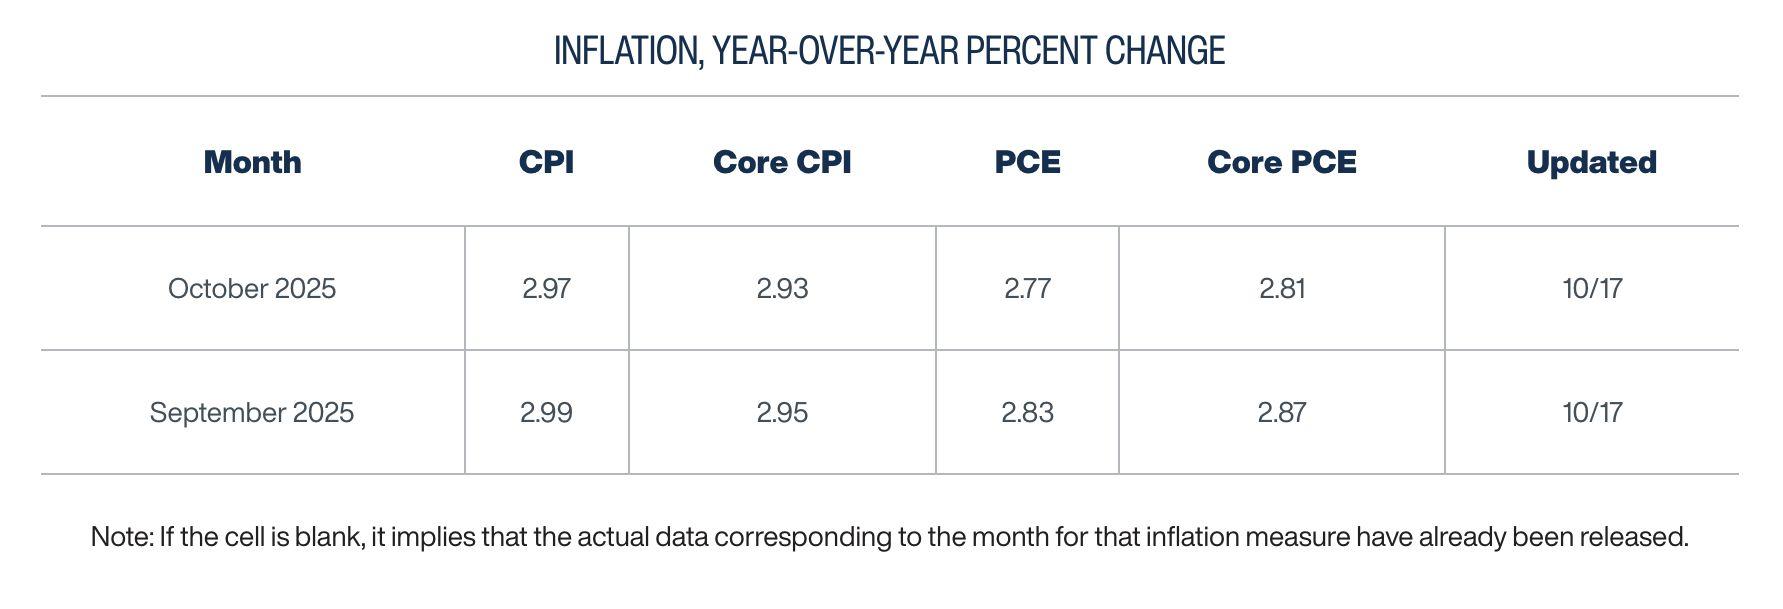
Figure12.InflationYear-over-Year PercentChangeNowcast
Source:FederalReserveBankCleveland)
Since early 2025, tariff policies have become a central driver of US price pressures.AccordingtotheFederalReserveBankofSt.Louis,tariffsaccountedfor roughly 0.5 percentage points of headline Personal Consumption Expenditure PCE) inflation and 0.4 percentage points of core PCE inflation between June and August 2025. The impact began early this year, becoming more pronounced throughthesummerasnewtrademeasurestookeffect.
Only part of the full inflationary effect has materialised, which means businesses maystillbeabsorbingsomecostsordelayingpriceadjustments.Nonetheless,the evidencepointstotariffsexertingupwardpressureonconsumerprices.
While the tariff impact is visible in imported goods, American households are also feelingitingroceryaisles.Foodpricesrose3.2percentyear-over-yearinAugust, the fastest pace since the 20212022 inflation shock, according to the Bureau of LaborStatistics.
Higher food costs have become the main source of inflation anxiety among consumers,asenergypriceshaverecentlyretreated.TheUniversityofMichiganʼs consumersurveyshowshouseholdsexpectinflationtoreach4.6percentoverthe next year and 3.7 percent over the next five years, expectations that remain well abovetheFedʼscomfortzone.
If tariff-driven costs persist and food inflation stays high, the risk is that householdsʼ expectations become entrenched, making it harder for rate cuts to restorepricestability.Historically,ithasoftentakenarecessiontorealigninflation expectationsclosertotheFedʼsgoal.
Inflation in the US is increasingly shaped by policy choices rather than pure demand dynamics. Tariffs have not only lifted import prices but also complicated the Fedʼs path toward easing. At the same time, elevated food costs continue to erodehouseholdpurchasingpower,particularlyamonglow-incomefamilies.
The US economy continues to send mixed signals as fresh data reveal diverging trends between manufacturing and housing, two sectors highly sensitivetoinflationandinterestrates.
Last Thursday, October 16th, the Federal Reserve Bank of Philadelphiaʼs Manufacturing Business Outlook Survey reported that factory activity in the mid-Atlantic region unexpectedly contracted, even as more manufacturers faced higher costs for inputs and sold goods at rising prices. The business activity index dropped sharply to 12.8 in October from 23.2 in September, signalling contraction in the regionʼs manufacturing base across eastern Pennsylvania,southernNewJersey,andDelaware.
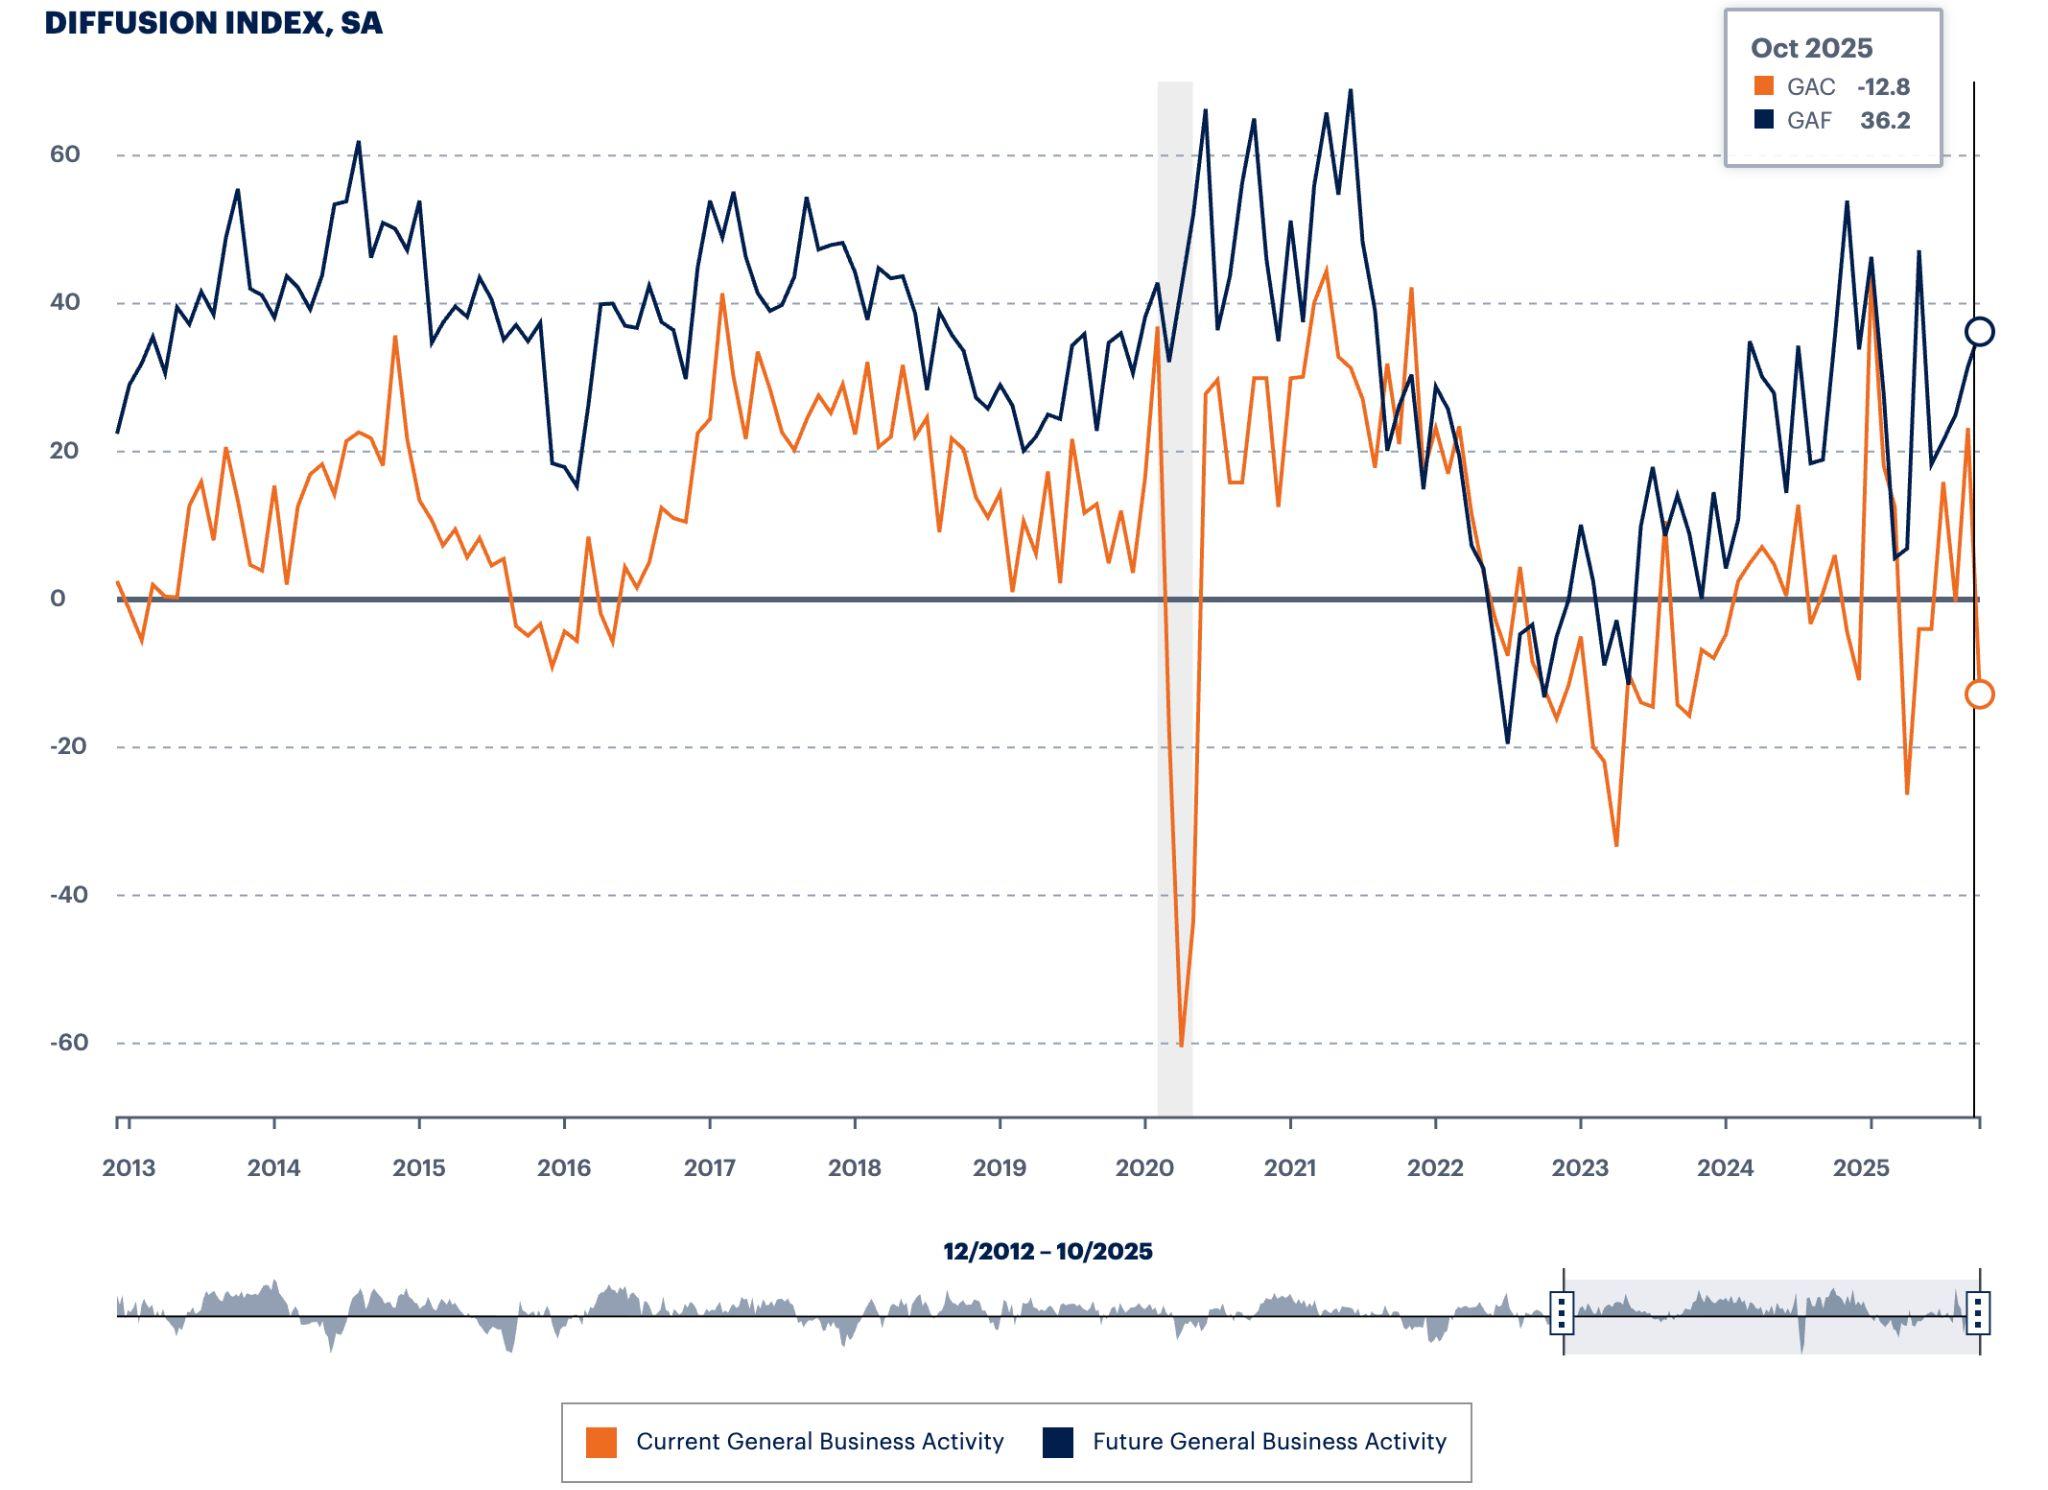
Figure13.BusinessActivityIndex
Source:TheFederalReserveBankofPhiladelphiaʼs)
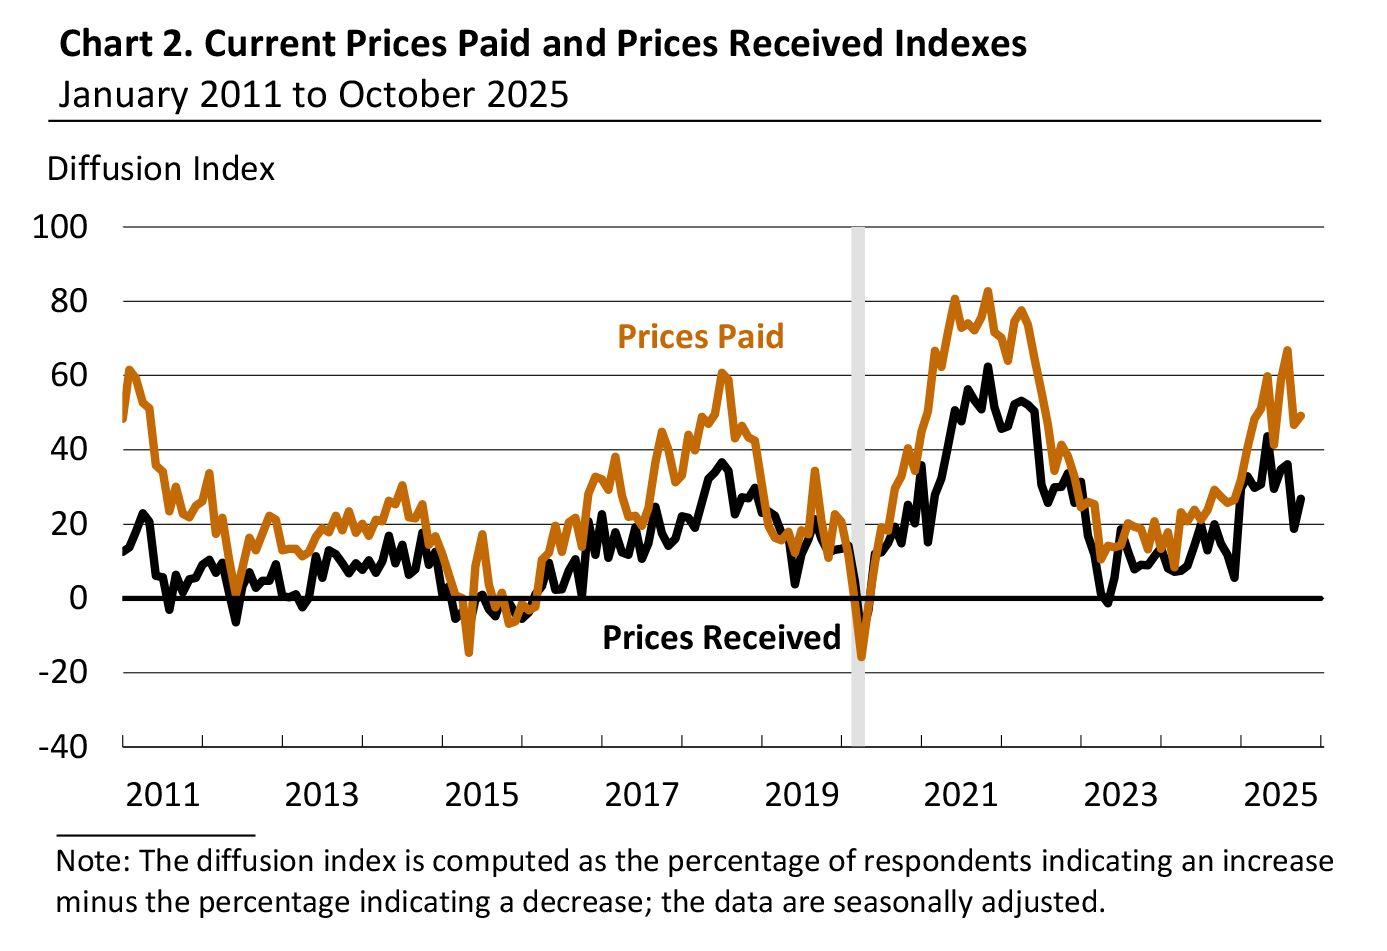
Figure14.PricesPaidbyBusinesses
Source:TheFederalReserveBankofPhiladelphia)
Theconsensusforecastwasasofterdeclineto8.5,butthesteepdropreflected persistent cost pressures. Nearly half of surveyed firms 49 percent) reported paying more for raw materials, while 28 percent said they were charging higher pricesfortheirproducts.Nonereportedlowerinputprices.Bothinputandoutput price measures remain above their long-term, non-recession averages, suggestingthatinflationarypressureshavenotyetfullysubsided.
The Philadelphia Fed noted that recent price increases are consistent with the delayedpass-throughoftariffsonimportedgoods,whichhasintensifiedasfirms rundowninventoriesbuiltbeforethetrademeasurestookeffect.
While it is uncertain whether the impact will be temporary or prolonged, the factory survey underscores the risk that cost pressures could persist through year-end. That would further complicate the Federal Open Market Committeeʼs FOMC) efforts to bring inflation back toward its 2 percent target, even as policymakerssignalreadinessforanotherratecutlaterthismonth.
In contrast to manufacturingʼs weakness, the housing sector is showing early signs of stabilisation. The National Association of Home Builders NAHB reported that its Housing Market Index HMI) rose to 37 in October from 32 in September,markingitshighestlevelsinceAprilandbeatingforecastsfor33.
The HMI, based on monthly surveys of around 900 home builders, gauges sentiment on current and future single-family sales and buyer traffic. Although any reading below 50 still signals a pessimistic outlook, the sharp October reboundreflectsoptimismthatrecentmortgageratecutsandimprovedfinancing conditionswillspuractivityinthemonthsahead.
Together, these developments highlight the uneven effects of monetary policy andtrademeasuresacrosstheeconomy.Themanufacturingsectorcontinuesto bearthebruntoftariffsandinputcostinflation,whilethehousingsector,highly sensitive to interest rate movements, has started to benefit from easier financial conditions. However, the improvement in housing is unlikely to offset broader inflation pressures. Tariff-related cost pass-throughs risk slowing the decline in consumerprices,keepinginflationexpectationselevated.
The current uneasy truce between Washington and Beijing is showing renewedstrain.Overthepastweek,PresidentDonaldTrump hasreaffirmed that the US is already in a trade war with China, following new export restrictions imposed by Beijing on rare earth minerals, essential for the manufacture of advanced semiconductors and defence components. In response the US Trade Representatives office has begun drafting a tariff packagethatcouldraisedutiesonselectedChineseimportstoashighas100 percent.
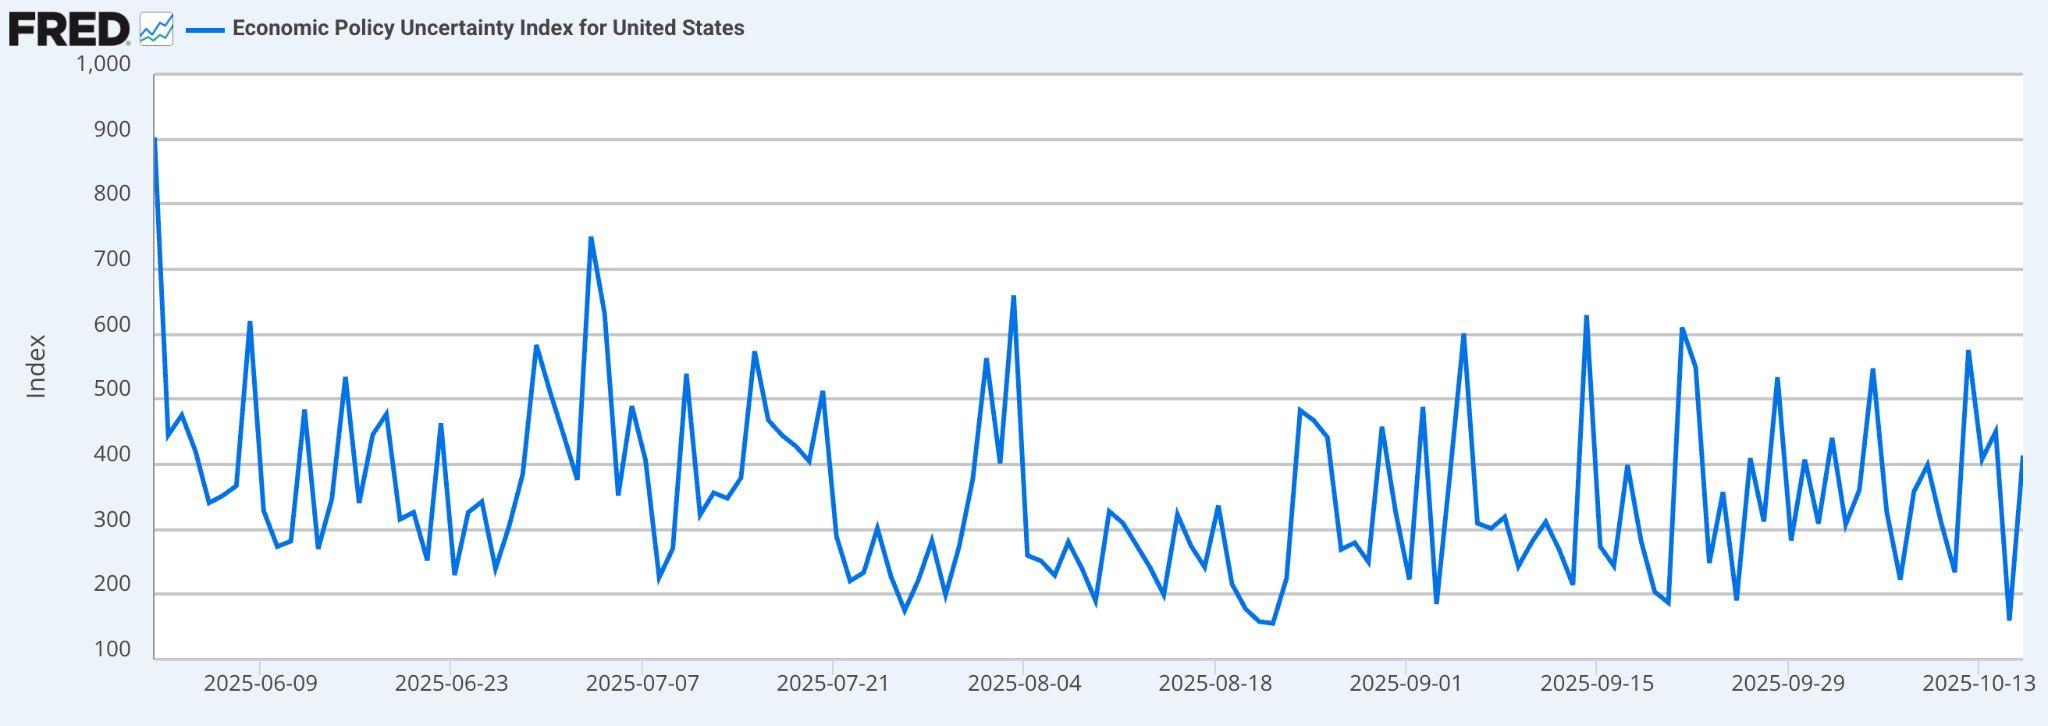
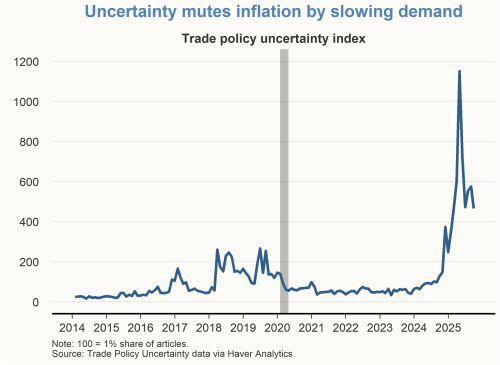
Figure15.EconomicUncertaintyIndexSource:Fred)
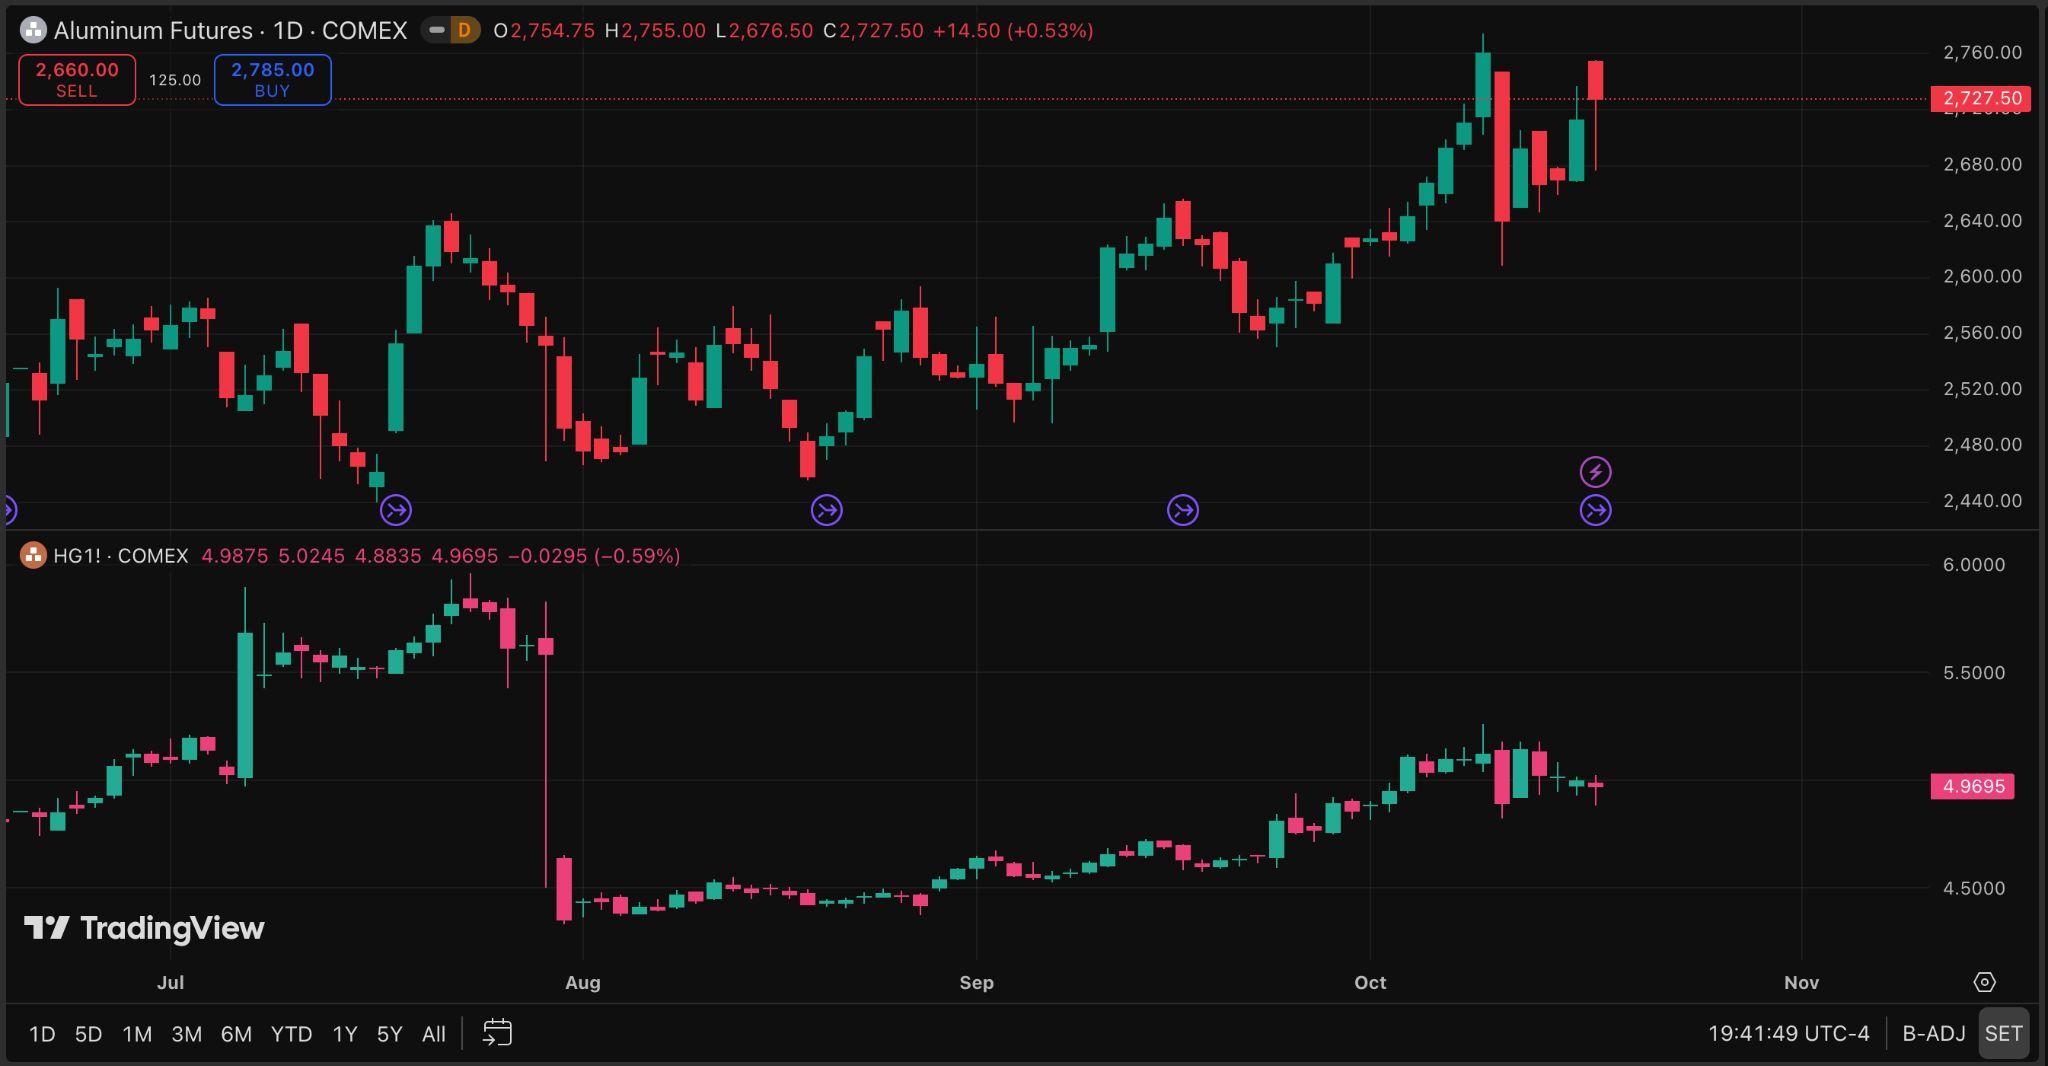
Financialmarketshavetakennoticebutnotyetpanicked.TheEconomicPolicy Uncertainty Index climbed back to 413 last Thursday, while copper and aluminumfuturesfell1.2percentlastweekastraderspricedinpotentialsupply disruptions.Equitymarkets,however,remainanchoredbyexpectationsthatthe Federal Reserve will continue easing policy, cushioning the immediate impact ofgeopoliticalshocks.
The re-emergence of trade hostilities threatens to undo much of the post-pandemic realignment in global supply chains. While the World Trade Organisation now projects global merchandise trade volume growth of 2.4 percent for 2025, it warns that growth will slow sharply to just 0.5 percent in 2026.
At the same time, disruptions are uneven across industries. In chipmaking, Taiwanʼs economy ministry finds no immediate impact from Chinaʼs new rare‐earth curbs on local fabs. By contrast, US export controls on semiconductor equipment are poised to blunt Samsung and SK Hynixʼs China-basedlines,forcingthesefirmstorelymoreonplantsinKorea.Inshort, semiconductors face new bottlenecks and re-routing, even as Asia-wide productionremainsrobust.
We expect multinational corporations that are impacted to start diversifying aggressively toward Southeast Asia, India and Mexico, but the transition remainscapital-intensiveandslow.Thepaceofchange isalsofuelledbythe US government's habit of taking back the customs duty policies, post discussion with its foreign counterparts. Many multinationals are accelerating “China+1ˮdiversificationtohedgesuchrisks.TheIMFreportsthat,drawingon lessonsfrom2018,alargershareofintermediategoodsisnowflowingthrough Southeast Asia and other regional hubs. China is still the largest exporter of manyinputs,butitsshareisshrinking.
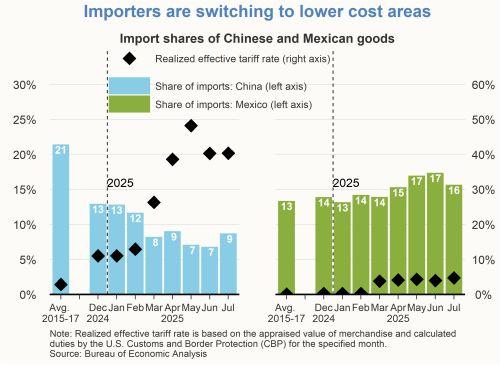
Figure17.USImportSharesfromChinaBlueBars)HaveFallenSharplyWhile MexicoʼsGreenBars)HaveRisen.HigherUSTariffsDiamonds)HaveDriventhis Re-RoutingofSupplyChains.
Source:FederalReserveBoard,H.10,viaSFFed
USimportdataillustratesthetrend:ChinaʼsshareofUSimportshasfallensharply, while Mexicoʼs share has climbed. Similarly, suppliers are expanding in Vietnam, Indiaandelsewhere,drawnbylowertariffsandpoliticalstability.Theseshiftstake timeandcapital: buildingnewfactories,trainingworkersandestablishinglogistics networks is costly, so fragmentation remains gradual. The transition is also complicated by policy whiplash: Chinaʼs commerce minister recently warned that last-minute US tariffs had “seriously harmedˮ Chinaʼs interests and undermined businessconfidence,underscoringtheuncertaintythatmakescompaniescautious.
Cost pressures are re-emerging.
Even though many PMI reports in early October still showed only modest input‐price inflation, businesses note that higher tariffs and shipping frictions are pushing up component costs in some sectors. The Fed now faces the classic dilemma of a “supply-drivenˮ inflation shock: it must consider further easing to support slowing growth (after a prolonged tightening cycle) while guarding against a fresh uptick in inflation.
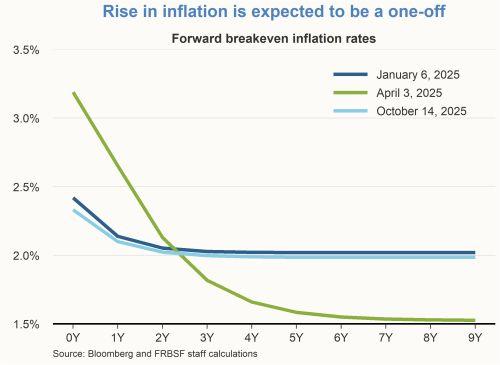
Figure18.ForwardBreakEven InflationRates
Market-based inflation expectations (breakeven rates) have inched higher but remain around historical norms. For example, five- and ten-year US breakeven rates are only in the 2 percent range, implying that investors do not currently seearunawayinflationaryspiral,eveniftariffsbroaden.Nonetheless,anynew waveoftariffsorexportcontrolscouldquicklyraiseinputcostsandconsumer priceslaterthisyear.
Source:FredCharts)
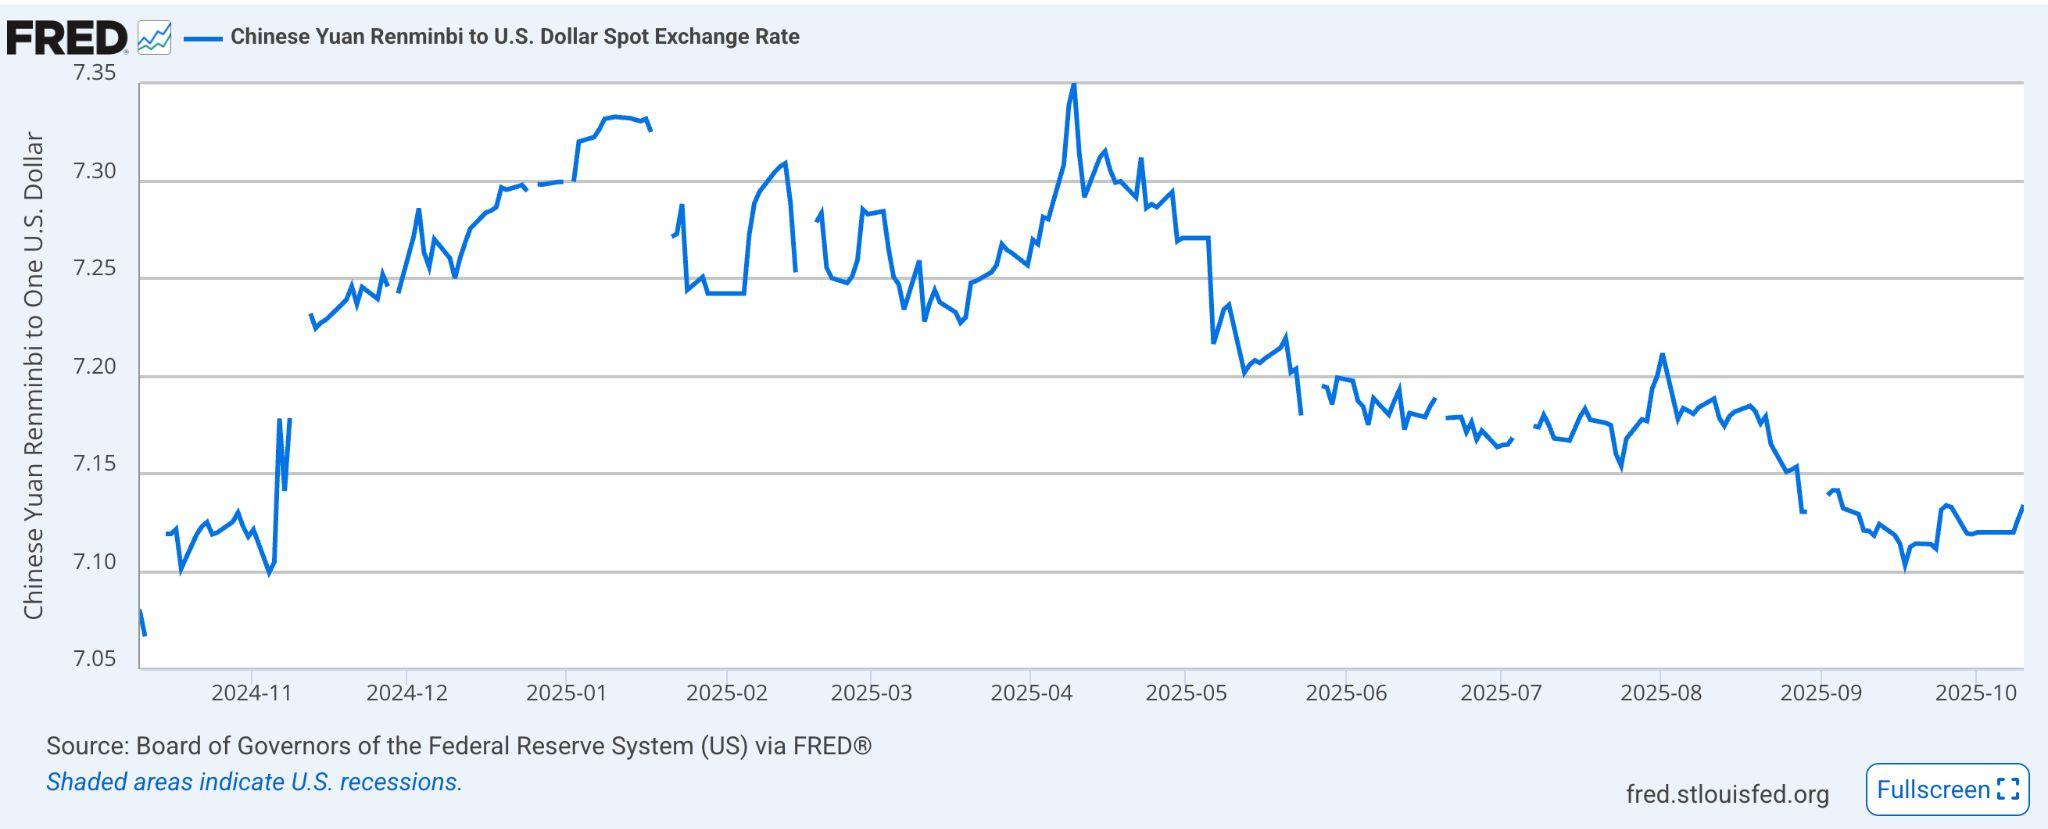
Trade tensions are also showing up in financial markets and exchange rates. Traditionally,asurgeintradebarrierswouldstrengthensafe-havenassets.For example, when President Trump announced new 50100 percent tariffs in late May,goldpricesjumpedover2percentasinvestorsfledtosafehavens.More recently, the yuan has traded around ¥7.137.15 per dollar (mid-October spot), reflecting both Chinaʼs defensive interventions and the broad dollar rally in risk-offmoves.FundsmightfleeemergingmarketsasUSyieldsattractmoney, adynamicreminiscentofthe20182019trade-warepisodes.
For now, both sides are testing political resolve rather than seeking outright confrontation.Yethistorysuggeststhatoncetariffmeasuresareactivated,they tend to persist far longer than intended. Even a temporary standoff could compress global trade volumes, delay corporate investment, and retighten globalliquidityconditions.
Policy
FederalReserveBankofSanFrancisco)
In short, policy uncertainty has once again become a macro variable. Markets remain steady but the margin of safety is narrowing. A constructive de-escalation before November would restore confidence, while any further escalation, particularly involving semiconductor or technology exports, risk becomingthedefiningmacrocatalystforlate2025.

● Floridaʼs House Bill 183 would allow up to 10 percent of state and pension funds to be invested in Bitcoin, tokenised assets, and crypto ETFs,withstrictcustodyandregulatorysafeguards

● The bill positions digital assets as inflation hedges and fiscal diversifiers, also permitting certain taxes to be paid in crypto
Florida lawmakers have introduced House Bill 183, a legislative proposal that, if approved, would permit the state to invest a portion of its public and pension funds in digital assets, namely Bitcoin, tokenised securities, and crypto-based exchange-traded products. Under the billʼs structure, Floridaʼs Chief Financial Officer could allocate up to 10 percent of specified public funds (such as the General Revenue Fund, Budget Stabilisation Fund, and various trust funds) into “digitalassetsˮorETFs.Simultaneously,theStateBoardofAdministrationwould be empowered to do likewise with up to 10 percent of the Florida Retirement SystemTrustFund.
Importantly, the bill seeks to define “digital assetsˮ broadly, encompassing Bitcoin,tokenisedsecurities,andevennon-fungibletokensNFTs.However,the proposal embeds safeguards: permissible custody and control arrangements include retaining assets through the CFO, via a qualified custodian, or via an SEC-registered ETF. The effective date for the bill is floated as July 1, 2026, assumingitpassesthroughcommittee,bothlegislativechambers,andgainsthe governorʼsapproval.
The rationale presented by proponents frames Bitcoin and other digital assets aspotentialstoresofvalueorhedgesagainstinflation,therebyaddinganovel tool to the stateʼs fiscal arsenal. The bill also includes a provision to allow Floridaresidentstopaycertaintaxesandfeesindigitalassets;thosepayments would then be converted into US dollars for the stateʼs general fund.
If enacted, HB 183 would place Florida alongside a handful of US states, such as Arizona, Texas, and New Hampshire, that have already passed legislation enabling state-level digital asset reserve or allocation programs. The proposal still faces significant hurdles: committee assignment, legislative debate, possibleregulatorypushback,andthegovernorʼssignature.Butitsintroduction signals continued momentum among US states to integrate crypto into traditionalpublic-financeportfolios.


● Ripple announced a $1 billion acquisition of GTreasury, aiming to merge blockchain payments with traditional treasury management andbringreal-time,on-chainliquiditysolutionstocorporatefinance
● ThedealexpandsRippleʼsstrategybeyondpayments,positioningits digital assets and stablecoins at the core of enterprise treasury operations and marking a step toward reshaping how global firms manageanddeploycapital
In an expansion of its corporate reach, Ripple announced last Thursday, October 16th, the planned $1 billion acquisition of treasury management software firm GTreasury, signalling the companyʼs attempt to enter the multitrillion-dollar corporate treasury market. With this move, Ripple aims to merge its digital asset infrastructure and payments capabilities with the treasury operations expertise of GTreasury, to help companies to manage, deploy,andmovecapitalinmorenimble,on-chainways.
GTreasury is well established in the treasury software space, supporting liquidity forecasting, risk management, compliance, foreign exchange operations, and debt & investment optimisation for large corporates. Its platform also provides connectivity across banks and enterprise resource planning systems, making it a central hub for corporate cash operations. According to Ripple, the integration of these legacy treasury functions with its blockchain and payments stack will allow corporate clients to unlock “idle capital,ˮ tap into short-term markets (such as repo), and perform real-time cross-border payments at 24/7 speed, all while preserving compliance, audit standards,andriskcontrols.
The acquisition follows other strategic moves by Ripple in 2025, including its purchasesofprimebrokerHiddenRoadandstablecoinplatformRail,apattern thatunderscoresRippleʼsambitiontobecomemorethanapaymentsorledger provider.RippleCEOBradGarlinghouseframedthemoveasaresponsetothe inefficiencies of traditional payments and treasury systems, asserting that capital is often “trappedˮ by slow infrastructure, problems blockchain is uniquelysuitedtosolve.
For GTreasury, the acquisition is positioned as a transformation from a pure softwarevendortoanactivatorofcapital,itsforecasting,risk,andcompliance capabilities will now serve a modern toolkit of payments, tokenised deposits, andtreasuryliquiditytools.Thecompaniessaythedealissubjecttoregulatory approvalsandisexpectedtocloseinthecomingmonths.
Strategically, this move aims to place Ripple in closer proximity to corporate CFOs and treasury decision-makers, offering a pathway for the firmʼs digital assets,stablecoins,andcross-borderpaymentsolutionstomigratefromniche or adjunct roles into core treasury operations. If successful, the combined entity could influence how corporate balance sheets are managed, how liquidity is deployed, and how real-time settlement becomes embedded into theinfrastructureoflargeenterprises.


New York City Mayor Eric Adams has officially signed an executive order creatingtheOfficeofDigitalAssetsandBlockchainTechnology.Accordingtoa pressreleaselastTuesday,October14th,thenewofficewilloperateunderthe MayorʼsOfficeandreportdirectlytotheChiefTechnologyOfficer,taskedwith fosteringresponsiblegrowthintheblockchainanddigitalassetsector.
Theofficewilldeveloppoliciestoattractinvestment,coordinatewiththecityʼs EconomicDevelopmentCorporation,andserveasabridgebetweenregulators, institutions, and emerging blockchain firms. It will also focus on educating the public and promoting the responsible use of digital assets in accordance with existinglaws.
This marks a pivotal step for crypto adoption at the municipal level. By institutionalisingsupportforblockchaininnovationwithincitygovernment,New York is signaling that digital assets are becoming part of mainstream finance infrastructure.Themovestrengthensthecityʼsbidtoremaintheglobalfinancial capital as digital assets and tokenization reshape how value is stored, transferred,andregulated.