

A Food Access Project for the Springfield Food Policy Council
 Aspen Anderson / Kerry Morgan / Daniella Portal The Conway School Winter 2024
A Food Access Project for the Springfield Food Policy Council
Winter 2024
Aspen Anderson / Kerry Morgan / Daniella PortalWe would like to thank the many people who helped push this project forward. We extend a special thanks to the Springfield Food Policy Council for funding this project and to our core team members, Liz O’Gilvie, Catherine Sands, Becky Basch, and Benjamin Bland, for their guidance and sharing of knowledge. We also thank the farmers, advocates, planners, city officials, and other individuals who shared their time and insights throughout the project. A special thanks to Jacob Dolinger and Jason Mann for providing crucial GIS data as well.
Lastly, a thank you to our faculty, staff, and peers at the Conway School for their continued support, inspiration, and teachings.
We acknowledge that the city of Springfield is on Indigenous land, known to the original Algonkian Indian (Native American/Indigenous) inhabitants as “Agawam,” or “Akawaham.” The Indigenous name for this place is a locative term that roughly translates to “low-lying marshy lands,” describing a large region along both sides of the Kwinitekw (now called the Connecticut River) from present-day Enfield, Connecticut to the Holyoke Range. For at least 10,000 years, since the last era of glaciation, the Agawam people engaged in trade, diplomacy, and kinship with other regional Indigenous people, most notably: the Quaboag to the East; the Podunk to the South; the Woronoco to the West; and the Nonotuck, Pocumtuck, and Sokoki to the North.
During the 1630s, when Agawam leaders invited English colonial settlers to build a small settlement here, they attempted to preserve, in written deeds, Indigenous cartographies and rights to hunt, fish, plant, and live on tribal lands. When diplomatic relations failed, the Agawam people were decimated and dispersed as a direct result of colonial deceit, disease, and warfare. Although the survivors sought refuge with other Native communities across the northeast, very few direct descendants of the Agawam people live in Springfield today.
We acknowledge, however, that many Indigenous nations, from the territory we now call “southern New England,” still survive and still exercise sovereignty. We acknowledge, in particular, these contemporary Indigenous nations: the Nipmuc to the East; the Wampanoag and Narragansett to the Southeast; the Mohegan, Pequot, and Schaghticoke to the South; the Mohican to the West; and the Abenaki to the North, among many others. Recognizing that the entirety of the North American continent constitutes territory considered to be original Indigenous homelands, we respect the sovereignty of these and hundreds of other Native American Indigenous nations that survive today and we pledge to support the rights of these nations and the interests of Indigenous peoples.
Authors: This land acknowledgement was written by Margaret M. Bruchac (Professor Emerita of Anthropology, University of Pennsylvania) & Laurel Davis-Delano (Professor of Sociology, Springfield College), who provided permission for its inclusion in this document.
For this and more educational resources, go to sites.google.com/view/ springfieldagawam-landacknowl/
• Project Overview • Historical Context • Social & Economic Context • Community Context: Land & People • Food Security/Food Apartheid
Health & Wellbeing
• Building Community
• Sustainability & Green Space
• Economic Opportunities & Development
• Tier 1 Criteria & Methodology
• Tier 2 Criteria & Focus Area
• Tier 3 Criteria & Ground-Truthing
Parcels
• Farmers Markets Criteria & Methodology
• Farm Stands Criteria & Methodology
Initiatives,
• Municipal Initiatives
• Barriers Encountered
• Recommendations
• Urban Agriculture Ordinances in other Massachusetts Municipalities
• GIS Analysis
• Analysis Findings
• Works Cited
• Interviews & Correspondence
• Additional Sources
What would the City of Springfield look like if it could offer reliable access to nutritious foods year-round to all of its residents? Currently, many neighborhoods in the city are considered low income, with numerous households not owning a car and located far from stores with high-quality foods—causing many individuals and families to struggle with food insecurity. Some grassroots and policybased initiatives have developed in recent years with the goal of promoting a more equitable and effective food system within the city. One opportunity has emerged that has the potential to expand and integrate the city’s food system further within the grasp of residents: vacant lots. Such lots, which are abundant throughout Springfield, offer a potential space to grow and sell fresh foods close to home. Several vacant lots have already been cultivated for this purpose.
To continue the momentum and development of the local food system, this report, prepared for the Springfield Food Policy Council, maps existing vacant lots within Springfield to assess their suitability for food production and food access sites. The types of food production for which these lots could be used include community gardens, community farms, and urban orchards. Food access sites explored include farmers markets and farm stands. Through spatial analysis, recommended lots are guided by special criteria based on environmental factors, zoning considerations, structures on site, location, and overall size.
In addition to considering the usability of a site, this report identifies a focus area within the city, with the goal of determining which neighborhoods may benefit the most from increased access to land for growing fresh food or establishing food access sites. Criteria for the focus area considers the many benefits of urban agriculture centering around
health, community, sustainability, and general quality of life improvements; subsequently, the focus area is created based on maps of neighborhood vulnerability statistics, current health outcomes, and environmental factors relating to land use history.
Alongside recommending lots, this report gathers opportunities and recommendations on a municipal level with the goal of supporting the growth and ease of urban agriculture within Springfield. Special focus is given to potentially expanding Springfield’s existing Community Gardens Ordinance through the creation of an Urban Agriculture Ordinance, which could further support existing and potential farmers. These suggestions are based on the many farmingrelated city ordinances, zoning regulations, and general policies that have been adopted by other Massachusetts cities; in addition, recent goals articulated in municipal and statewide planning documents are highlighted. This section of the report aims to help support the Springfield Food Policy Council as it “develops community-driven municipal and statewide policy recommendations, including legislative bills focused on agriculture, retail, and builtenvironment solutions” (SFPC).
¿Cómo se vería la ciudad de Springfield si se pudiera ofrecer comidas saludables a todos los residentes todo el año? A pesar de ser una de las ciudades más grandes en Massachusetts, Springfield ofrece pocas opciones accesibles de comida fresca para los residentes. Muchos vecindarios en la ciudad son considerados de bajos ingresos. También, muchas familias no tienen un carro y viven lejos de mercados con comida saludable. Como resultado, muchas personas y familias tienen inseguridad alimenticia. Algunas iniciativas políticas y de base se han formado en años recientes con el objetivo de cultivar un sistema alimentario más equitativo y efectivo en la ciudad. Una oportunidad que ha surgido que tiene potencial de crecer e integrar el sistema alimentario de la ciudad más cerca de las manos de los residentes: parcelas vacantes. Estas parcelas, que son numerosas en Springfield, ofrecen un lugar potencial para cultivar y vender comida fresca cerca de casa. Algunas parcelas vacantes ya están usadas para este objetivo.
Para continuar el progreso del sistema alimentario local, este reporte, preparado para el Consejo de Política Alimentaria de Springfield (CPAS), muestra mapas de las parcelas vacantes que existen en Springfield y evalúa su conveniencia para ser sitios de producción y acceso de comida. Los tipos de producción de comida que estas parcelas pueden ser usados incluyen jardines comunitarios, granjas comunitarias, y huertos urbanos. Sitios para acceder comida incluyen ferias y puestos de granja. Por análisis especial, las parcelas son recomendadas a través de criterios sobre el medio ambiente, zonificación, edificios en sitio, ubicación en la ciudad, y tamaño.
También, este reporte identifica un área de interés en la ciudad, con el objetivo de decidir cuáles vecindarios pueden tener más
beneficios con la introducción de lugares para cultivar o comprar comida fresca. El criterio por el área de interés considera los beneficios de la agricultura urbana, que influye la salud, la comunidad, la sostenibilidad, y la calidad de vida. Seguidamente, el área de interés está creada por mapas de vulnerabilidad de vecindarios, resultados de salud, y la historia del uso de la tierra.
Además de recomendar parcelas, este reporte obtiene oportunidades y recomendaciones municipales con el objetivo de apoyar el crecimiento y facilidad de agricultura urbana en Springfield. Especialmente, la Ordenanza de Jardines Comunitarios debía expandirse con la creación de una Ordenanza de Agricultura Urbana, que podría apoyar a los agricultores nuevos y vigentes. Estas propuestas son fundadas en las ordenanzas, normas de zonificación, y pólizas usadas por otras ciudades en Massachusetts. También, los objetivos declarados en documentos municipales y de planificación están destacados. Esta parte del reporte es para apoyar el Consejo de Política Alimentaria de Springfield (CPAS) en cuanto proporciona “recomendaciones de políticas impulsadas por la comunidad, así como soluciones agrícolas, minoristas y para entornos construidos” (CPAS).
Food justice has long been a topic of conversation in Springfield. Many reports providing context, resources, and guidance on next steps have come before this one and helped address a myriad of food system concerns, while local organizations such as the Springfield Food Policy Council have helped lead the charge to “facilitate racially equitable food and social justice by developing a vibrant local food system with urban agriculture at its center” (SFPC). This report builds on a 2014 report, Food in the City, which assessed Cityowned vacant lots in Springfield for their suitability for use as community gardens, community farms, commercial farms, and urban orchards. Identifying suitable parcels, displaying case studies, and advocating for urban agriculture were the main purposes of Food in the City. A decade later, this report aims to provide updated information in a similar context to Food in the City, while further analyzing the connection between food access, land use, historical context, and public health outcomes. This report was conducted for and overseen by the Springfield Food Policy Council, and written by a team of graduate students from the Conway School.
Community engagement for this project consisted of eight individual interviews with core team members, farmers, City and state officials, and planners in Springfield. Interviews were conducted over Zoom, lasting thirty to sixty minutes each. The following people were interviewed for this project, and details of each interview can be found in the Appendices section of this report.
• Becky Basch, Senior Planner, Pioneer Valley Planning Commission
• Benjamin Bland, Mass in Motion Coordinator, City of Springfield
• Liz O’Gilvie, Director, Springfield Food Policy Council and Gardening the Community, Springfield
• Ashley Randle, Commissioner, Massachusetts Department of Agriculture
• Catherine Ratté, Director of Land Use and Environment Department, Pioneer Valley Planning Commission
• Anne Richmond, Owner, Nordica Street Community Farm, Springfield
• Catherine Sands, Founder, Fertile Ground LLC.
• Patrick Sullivan, Director, Department of Parks, Buildings, and Recreation Management, City of Springfield*
* Also present at this interview were Alex Sherman, Forestry; Tom McCarthy, Clean City Division; and Tom Dougal, Assistant Director of the Department of Parks, Buildings, and Recreation Management

“In
this world, the advancement of one community depended on the destruction of the other, creating collective advantage for one group at the expense of targeted groups’ ability to survive. As the economy grew, it developed in tandem a social world riven by racialized inequality and violence.”
-K-Sue
Park, “Race, Innovation, and Financial Growth: The Example of Foreclosure”
The geography and natural resources of what would be called the Connecticut River Valley has long attracted human use and settlement. Indigenous peoples hunted, fished, foraged, and planted in the fertile alluvial soils along the river for over 10,000 years. In the 1630s, the Agawam peoples first encountered English colonists from the Massachusetts Bay Colony who sailed up the Connecticut River hoping to procure new areas for expanding the profitable beaver fur trade. William Pynchon, who is referred to in many histories as the “founder” of Springfield, was one of three colonists to sign a deed along with thirteen Agawam people that in 1636 allowed for white settlement on hundreds of acres on both sides of the Connecticut River, from the present day city of Holyoke to the town of Agawam. The Pynchon family was eager to have a strategic location to establish a trading post near three major rivers—the Connecticut, the Chicopee, and the Westfield—that also intersected with Native trails that became important roadways connecting the area to Boston to the east and to Albany to the northwest.
Among the many skills that the colonists learned from the Indigenous people that enabled the settlers to carve a living from the land, two stand out: how to clear the unfamiliar woods with fire, and how to grow Indian corn (maize), which became the North’s leading agricultural product (Rothbard 2012). What the two groups certainly did not share was an understanding of land as a commodity. The trade activities that colonists established with the Indigenous populations were based on credit, with the promise of the Native people to supply furs in exchange for trade goods. When the fur supply started to wane in the 1650s and the Native people were unable to pay their debts, they were forced to sell land to discharge their debts. This practice
established what one scholar describes as “the Pynchon family’s famous monopoly” wherein both Pynchon and colonial subtraders, who were themselves indebted to Pynchon, acquired mortgaged deeds from most of the Native families still living in Springfield. By the 1670s, the imposition of mortgages and foreclosures had a “‘virtually catastrophic’ effect on the Woronoco, Agawam, Norwottuck, Pocumtuck, and Squakheag” as “colonists’ land hunger threatened the communities with starvation” and after the King Philip’s War of 1675-76 “ultimately forced their migration from the area” (Park 2021, 41).
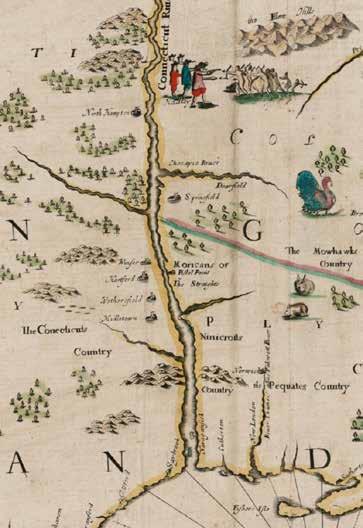
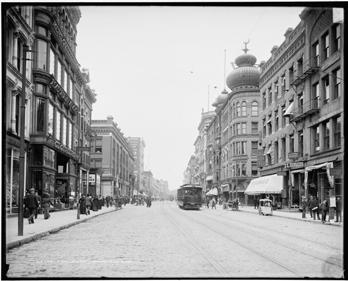
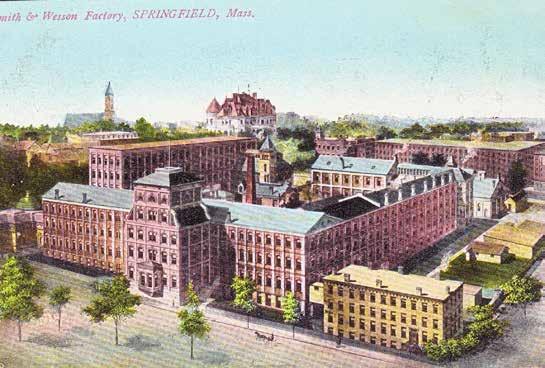
Thanks to the abundance of waterpower and its position as a meeting point between trade routes, Springfield quickly evolved from an important distribution point for agricultural goods and livestock to manufacturing. Early industrialization included small grist and saw mills, and by the end of the eighteenth century there were paper mills, distilleries, and pottery manufacture among other industries (Foster et al. 2006). George Washington’s selection of Springfield to be the location of the country’s first arsenal in the 1770s propelled the city’s metal manufacturing business. As a producer and depot for weapons and ammunition, the Springfield Armory was the site of innovative technical advances and led to the development of a skilled labor force. Over the next century, dozens of new companies manufactured railroad coaches, locomotives, motorcycles, and even ice skates.
Source:
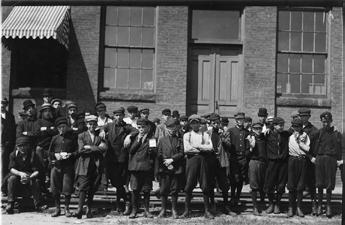
Lewis Hine, Group in front of Indian Orchard
Co
1911, Indian Orchard, Mass. Hine worked for the National Child Labor Committee that documented the use of child labor throughout the U.S.
Parts of the complex survive today as the Stockbridge Court apartments.
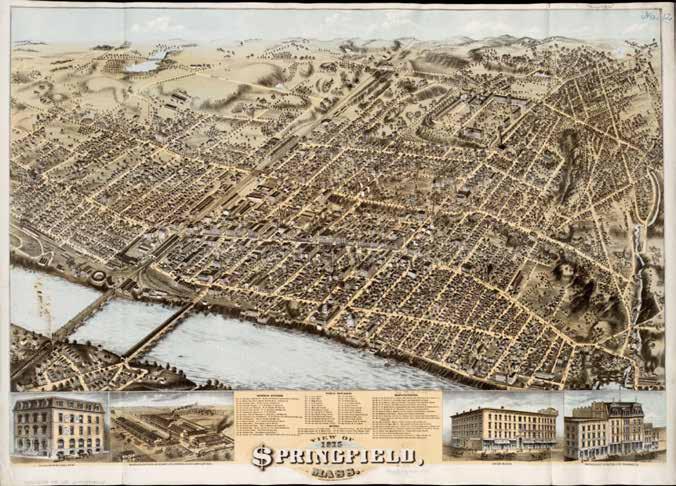
The 1875 bird’s-eye map of Springfield highlights the city’s manufacturing and business prowess, as evinced by the dollar sign that stands in for the “S” in Springfield. An extensive legend on the map attests to the range of businesses, public institutions, and industries that were feeding the flourishing economy. Not surprisingly, during this same period a housing boom occurred. A notable example is the establishment of one of the first planned residential neighborhoods in the U.S., the McKnight neighborhood. The purchase of a twenty-two-acre farm in the 1870s by John and William McKnight grew into the acquistion of hundreds of more acres, many of which were bought from Primus Mason, a very successful Black entrepreneur
and philanthropist (Our Plural History 2009). The 250-acre historic McKnight neighborhood is on the National Register of Historic Places and contains 850 buildings, most constructed before 1910. Springfield was given the nickname “The City of Homes” in response to the construction of these numerous Victorian mansions as well as numerous single-family homes for manufacturing workers (Springfield 2021).
Not represented in the map is the extractive nature of the land use or the human labor that made it possible. As the demand for labor grew children entered the labor market, working in dangerous industrial settings until curtailed by law (“Teaching with Documents”).
Source: Digital Commonwealth
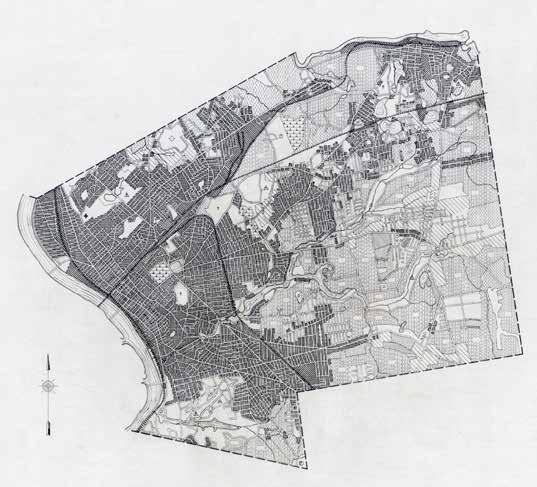
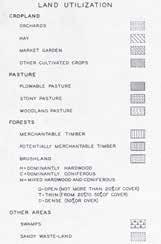
As a center for trade and industry, Springfield has long been a city that attracted newcomers, which vitalized and diversified the city. In the early decades of the twentieth century the city continued to grow eastward from the city center, particularly along railways and roadways. As the 1940 Land Utilization Map made for the Works Progress Administration (WPA) indicates, remaining open space is differentiated as types of
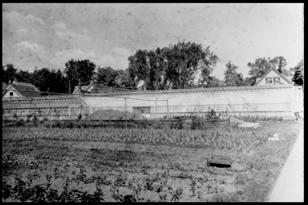
cropland, pasture, and forest with a variety of light-colored lines and hash marks. The densest areas of development are the darkest lines identified as “thickly settled areas” or “industrial and commercial areas” in the map’s symbology. However, what is not identified on the map is the degree to which urban agriculture was taking place. For example, photographs of Springfield taken by the WPA at the same time indicate that there were urban farms in these denser “thickly settled areas.”
In the second half of the twentieth century the long-standing manufacturing sector began a steep decline, including the closure of the Springfield Armory in 1968 (Mass Moments). At the same time, federal highway projects such as Interstate-91 tore into lower-income Black and Hispanic neighborhoods and separated the city from the Connecticut River. The loss of skilled, working class jobs negatively affected Springfield’s financial prosperity as did racist policies and actions of loan corporations that encouraged white flight, wherein white families en masse moved from the city into the surrounding suburbs, further decreasing Springfield’s tax base and economic resources. This trend was not unique to Springfield, but rather occurred across the country.
In 2009 the Massachusetts’ legislature created a designation for mid-size cities that had a largely industrial past, lower-income residents, and below-average education-attainment levels compared to the state average. These “Gateway Cities,” as they were labeled, are urban centers with larger populations of people of color that have been discriminated against and under-resourced for decades. Springfield is recognized as one of these twenty-six Gateway Cities that has enormous potential and has thus been eligible for particular state grant programs.
Springfield, with a population of 155,929 people per the 2020 U.S. Census Bureau statistics, has long been the third most populous city in the state. It has benefitted from its diversity of people who came to the city by choice, necessity, or in bondage. Black people have helped build Springfield since its establishment in the seventeenth century.
John Pynchon, son of William Pynchon, is recorded as having enslaved numerous Black persons (Carvalho 2010, 6). Slavery was given the sanction of law in 1641 and other prominent and affluent people held Black people as slaves until the state abolished slavery in 1791 (Kazini 1977, 2). Before the Civil War, many aspects of the burgeoning economy were tied to the slave economy of the South, even as Springfield itself became a locus of abolitionist sentiment. A growing population of free African-Americans moved to the city in the 1830s to 1850s and helped establish Springfield as a way-station in the Underground Railroad. The Black population established important institutions in the city and continued to thrive despite discriminatory hiring and housing practices (Kazini 1977; Viles and Palpini 2017).
Since the mid-nineteenth century, the city has also been a gateway for waves of Irish, German, Italian, French Canadian, and Polish immigrants. As part of the Great Migration, thousands of Black people fled the South and the community in Springfield grew considerably between 1900 and 1940, from 1,021 to 3,212 (Our Plural History 2009).
After WWII, the Latino population grew significantly, especially Puerto Rican people who began arriving to fill agricultural jobs in western Massachusetts. Springfield has the state’s largest population of Puerto Ricans, which increased in 2017 in the wake of Hurricane Maria and is a regional center of Latino culture and opportunity (Granberry and Valentino 2020; Our Plural History 2009).
Today, immigrants continue to be drawn to the U.S. by economic opportunities and Springfield
is no different. There are growing vibrant immigrant communities among West African and Southeast Asian populations.
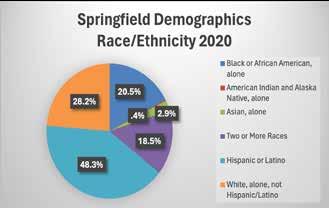
According to the 2020 U.S. Census, the largest ethnic or racial group in Springfield is Hispanic/Latino, constituting over 48% of the population. By comparison, the white, nonHispanic population is over 28% and the Black population constitutes a little over 20%. However, according to a follow-up study by the Census, the Hispanic and Black populations were undercounted. The Hispanic or Latino population had a statistically significant undercount rate of 4.99%. The Black or African American alone or in combination population had an undercount of 3.3% (U.S. Census 2022). As a Brookings report pointed out, these undercountings have real consequences: “there is widespread concern among Latino leaders and advocates about what this undercount could mean for their communities. In short, undercounting Latinos has drastic implications for health care, families, education, and political representation for at least the next decade if not more” (Sanzhez 2022).
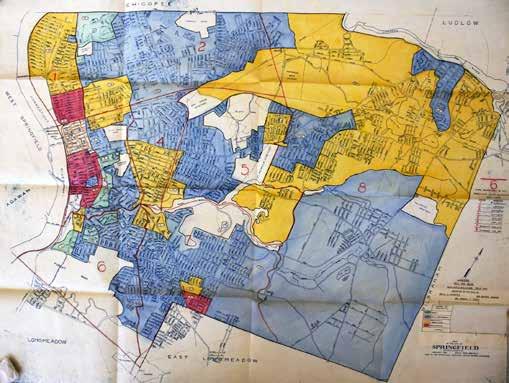
Beginning in the 1930s as part of the New Deal, the federal government created a government-sponsored loan corporation that assessed the level of risk involved in lending money to specific neighborhoods. Color-coded “residential security maps” were developed and used by the Home Owners’ Loan Corporation (HOLC) to decide whether or not a property was a good candidate for investment. The colors—from green to blue to yellow to red— indicated the risk level. The most “hazardous” were red, hence the term “redlining.”
The delineation of these “risky” neighborhoods was largely based on race, so that Black individuals and other people of color would be cut off from lending and investment. As a result, many people of color were excluded from the opportunity to invest in property and build generational wealth (Rothstein 2018). The result of these discriminatory practices can be seen decades later in Springfield’s economic and racial distribution patterns.
in decision-making processes, which has allowed discrimination and racism to perpetuate and infiltrate many aspects of marginalized communities’ everyday lives, as can be seen with health inequality. As mentioned, practices such as redlining and discriminatory zoning have unfortunately played a large role in determining what groups
Environmental Justice (EJ) is based on the principle that all people—regardless of race, color, nationality, or income—have the right to be protected from environmental pollution and to live in a clean, healthy environment. Historically, people of color and lower-income individuals have been excluded from influence
of people live in certain areas, contributing to racial segregation and inequitable distribution of resources and hazardous sites. Marginalized communities are more likely to live near toxic waste sites, in areas with high air pollution, and in low-quality housing. These longstanding structural inequities also result in fewer healthcare providers, decreased transportation options, and limited access to health information due to a lack of education about resources and minimal bilingual options (Egede 2023).
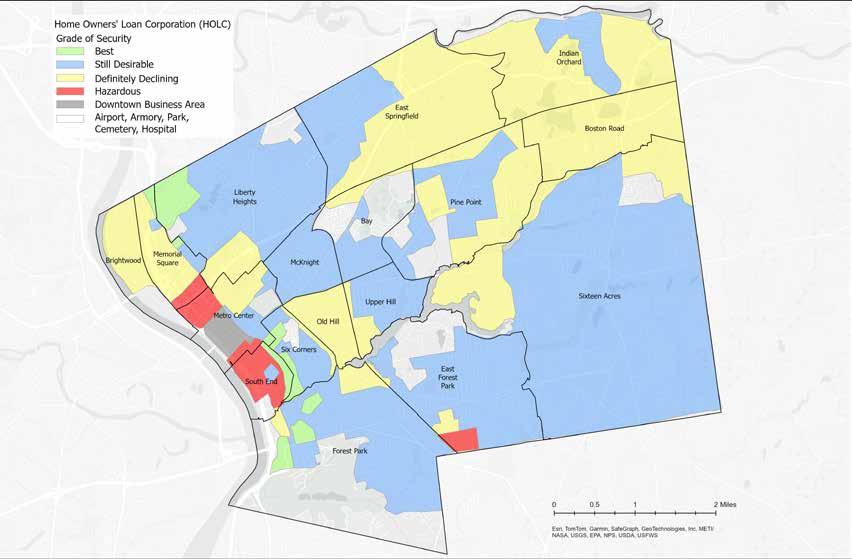
Source: Mapping Inequality website: Springfield, MA
This map indicates that very little property in the City of Springfield was considered “Best,” or areas eligible for mortgages and lower interest rates. Although large sections were considered “Still Desirable,” sizable areas along the most industrial parts of the city were designated “Definitely Declining.” The oldest and densest part of the city center along the Connecticut River was labeled “Hazardous.”
“The history of redlining, segregation, and disinvestment not only reduced minority wealth, it impacted health and longevity, resulting in a legacy of chronic disease and premature death in many high minority neighborhoods.... On average, life expectancy is lower by 3.6 years in redlined communities, when compared to the communities that existed at the same time, but were high-graded by the HOLC.”
-National Community Reinvestment Coalition, “Redlining and Neighborhood Health”
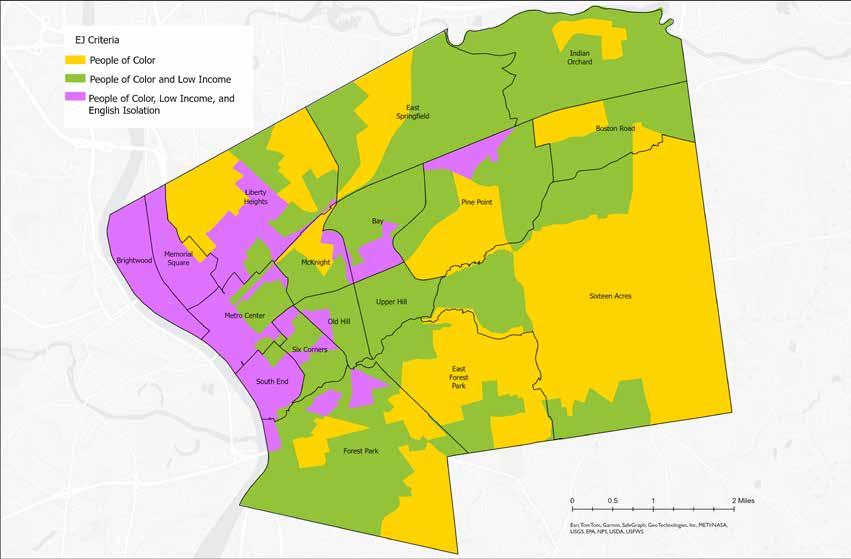
Source: MassGIS: Environmental Justice Populations (2020)
Building on federal guidelines, the Commonwealth of Massachusetts established criteria by which communities throughout the state are identified as the most susceptible to environmental injustice. The Environmental Justice blocks indicate that areas with the highest concentrations of people of color, with low income, and with English isolation are located in the western portion of Springfield, although the entire city qualifies as an “Environmental Justice community.” This designation directs all state agencies to involve EJ populations in the decision-making process when drawing up policy and
undertaking projects. In addition, it grants financial resources or technical assistance to the most overburdened communities (“Environmental Justice Policy” 2022).
The areas indicated in purple and darker green roughly correspond with the neighborhoods that were classified as red (“Hazardous”) and yellow (“Definitely Declining”) in the 1935 Residential Security (Redlining) Map. This is one way we can see the effects of underinvestment, decreased access to mortgages, and decreased opportunities to build generational wealth in these areas of the city today.
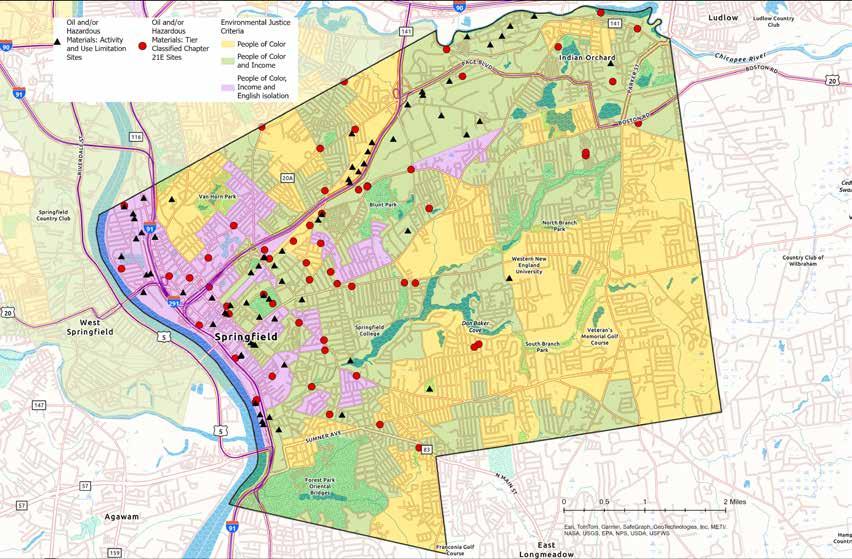
Source: MassGIS: Environmental Justice Blocks (2020), MassDEP Tier Classified Oil and/or Hazardous Materials Sites (MGL c. 21E) (2024), MassDEP Oil and/or Hazardous Material Sites with Activity and Use Limitations (AUL) (2024)
The 2020 Environmental Justice map is presented with a basemap highlighting major highways that bisect neighborhoods along the Connecticut River and diagonally along a northeast axis. These are overlaid with data layers indicating the presence of contaminated sites. The two categories for the oil and/or hazardous material disposal sites indicate the level of risk that they pose. Sites that have not been cleaned up within one year are ranked and classified as Chapter 21E sites for continued remediation (fifty-eight properties) and Activity and Use Limitation (AUL) sites indicate that there is some level of
contamination remaining after a cleanup (seventy-six properties).
The majority of the hazardous sites are situated in the westernmost section of the city, located along the largest and busiest roads and interstates, and in areas where the population falls into at least two EJ criteria categories. These are the areas where highways have been built, waste is stored, industrial warehouses and facilities are concentrated, and where natural resources have been readily exploited. This map demonstrates the long-lasting effects of redlining and environmental injustice.
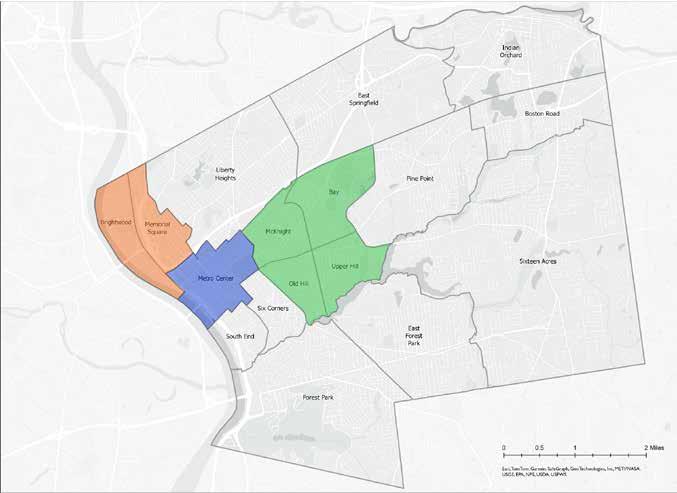
Springfield contains seventeen neighborhoods: Brightwood, Memorial Square, Liberty Heights, East Springfield, Indian Orchard, Boston Road, Pine Point, Bay, Upper Hill, Old Hill, McKnight, Metro Center, South End, Six Corners, Forest Park, East Forest Park, and Sixteen Acres. Certain neighborhoods of the city are often talked about in groups, as they share a zip code, and some of those groupings are referenced throughout this report. Brightwood and

Memorial Square are “North End”; Metro Center is “Downtown; and Bay, Upper Hill, Old Hill, and McKnight are referred to as “Mason Square,” named after the Black philanthopist Primus Mason and the commercial area where the four neighborhoods converge.
The maps presented in this section of the report demonstrate present-day Springfield’s patterns in land use and centers of community.
Source: City of Springfield: Neighborhoods
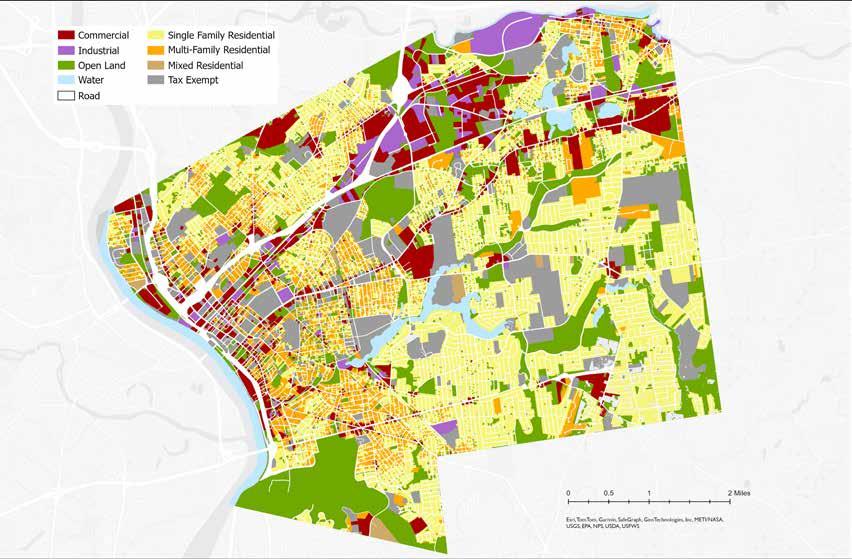
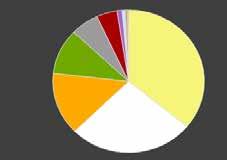
Similarly to the patterns of the redlining and environmental justice maps, the composition of land use shifts dramatically from the western to the eastern side of Springfield. Concentrated in the western side of the city, along the Connecticut River and following major roads, a mix of uses including commercial, industrial, and multi-family homes is in place. Moving east, the uses change to predominantly single-family homes with larger swaths of open land, usually taking the form of city parks. In the northern part of the city, commercial and industrial uses follow Highway 291.
Industry, highways, and commercial use in the western and northern parts of the city can create air, noise, and soil pollutants, and proximity to these areas may lead to negative effects on residents’ health. These effects are shown in a series of health outcome maps in the Identifying Parcels for Food Production: Tier 2 Criteria and Focus Area section of this report. Increased access to green space, seen in the eastern part of the city, is shown to better physical and mental health outcomes (“How Parks and Green Spaces” 2022).
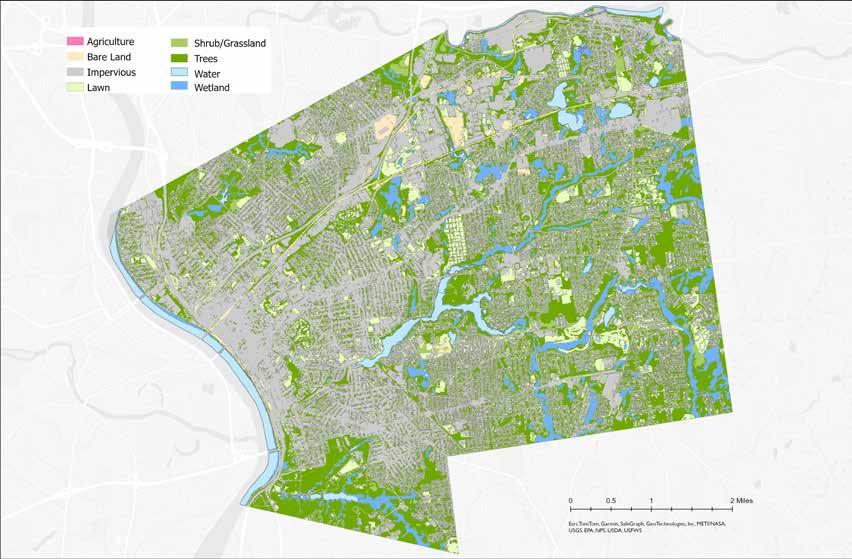
Source: MassGIS: Land Use/Land Cover (2016)
Land cover is heavily influenced by land use in Springfield. Impervious surfaces dominate the western portion of the city where there is a mix of commercial, industrial, and multi-family residential uses, while trees and shrubs are much more present throughout the eastern portion of the city.
A study conducted by ReGreen Springfield in July 2023 aimed to “comprehensively examine the relationship between tree canopy, land cover, demographic information, and environmental justice in the neighborhoods of Springfield” (ReGreen 2023, 1). It was found that neighborhoods with the least tree
coverage coincide with neighborhoods with the highest percentage of lowest income and people of color, as shown in the “Environmental Justice Blocks” map on the previous pages. Benefits trees provide include improved air quality, mitigation of respiratory problems, lower surface temperatures, social and psychological benefits, and ecological benefits (ReGreen 2023). Considering the evidence from this study in conjunction with the land use and land cover maps helps identify areas of the city that might benefit from increased access to green space or canopy cover.
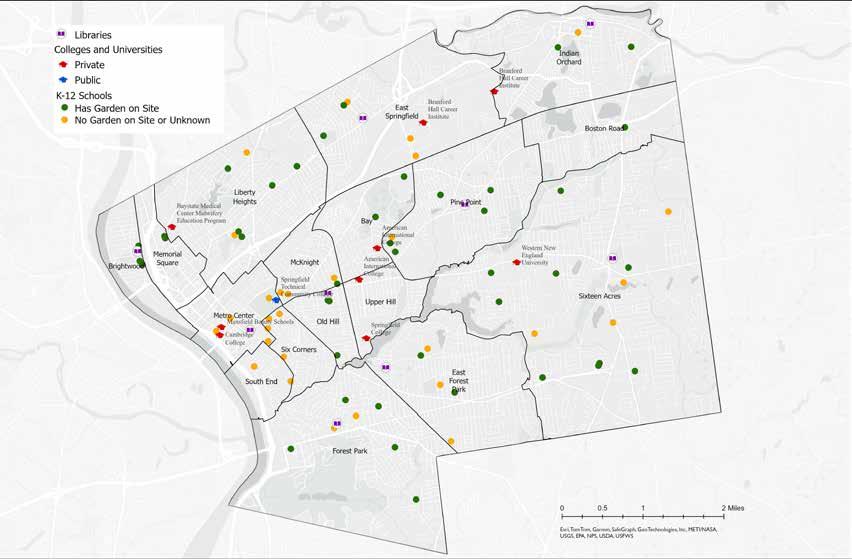
Source: MassGIS: Colleges and Universities (2018), Massachusetts Schools Pre-K through High School (2023), Libraries (2017); Springfield Public Schools Garden Coordinator: list of SPS with gardens on site (2024)
K-12 schools are present in every neighborhood of Springfield, and are fairly evenly distributed spatially across the city. Over forty of the sixty-six schools in the Springfield Public School District have raised garden beds for educational use with dedicated staff to oversee their upkeep (Home Grown Springfield 2024). The school garden program is part of the Springfield Public School’s larger Home Grown Springfield Culinary and Nutrition Program that the Springfield Food Policy Council was
instrumental in developing (Sands, Transforming School Food 2020). Springfield Technical Community College (STCC), the only public institution of higher education in the city, is located in the Metro Center neighborhood. The remaining colleges and universities in Springfield are private, and are scattered across the northern and central parts of the city.
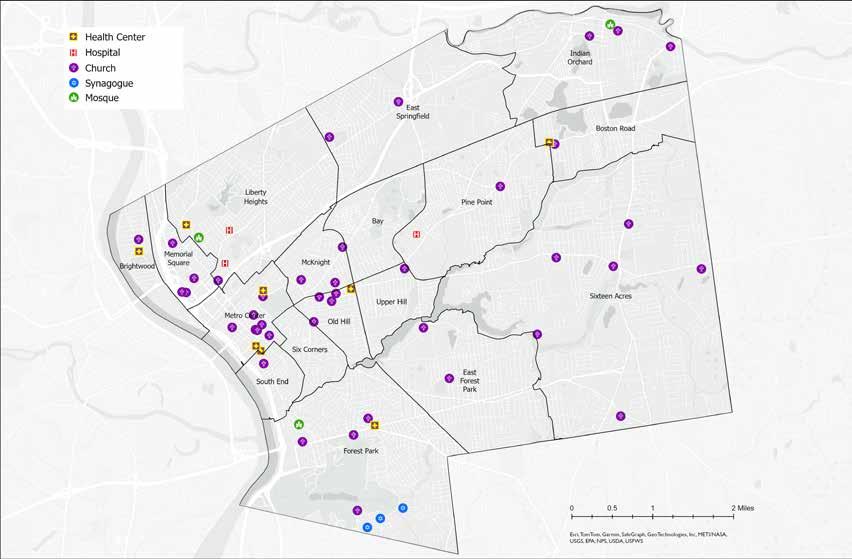
Source: MassGIS: Acute Care Hospitals (2018), Non-Acute Care Hospitals (2018), Community Health Centers (2019), Places of Worship (2022)
There are places of worship in almost every neighborhood of Springfield, with Metro Center and parts of the Mason Square neighborhoods being the most densely populated with churches. The hospitals are located in the Liberty Heights and Pine Point neighborhoods, outside of the downtown area, while community health centers are located closer to downtown.
Similar to schools and libraries, places of worship, health centers, and hospitals provide opportunities to locate gardens, farm stands, and farmers markets. An added benefit is that these institutions already host a community of individuals who regularly visit the site, which can encourage consistent involvement in whichever type of urban agriculture may occur there.
Having access to an adequate supply of healthy food is a basic human right. When considering the absence of this right, the phrase “food apartheid” has been used by food justice advocates in lieu of the more common term “food desert” as it highlights the deeply rooted history of racial discrimination and inequitable policies that have shaped food access and control (Jensen 2024; Walker 2023; Rivera 2023). The USDA stopped using the term “food desert” more than a decade ago because it did not adequately describe the type of food insecurity that the data was charting. Their Food Access Research Atlas replaced the older Food Desert Report (USDA “Food Access Research Atlas”). The City of Springfield experiences food apartheid: many residents have low access to healthy food as well as face socioeconomic and racial barriers. Food apartheid not only describes the lack of resources available to a community, but also the health consequences that come with it. Areas experiencing food apartheid typically have higher densities of convenience stores and fast-food restaurants (Bower 2013).
Convenience stores are heavily patronized in densely populated neighborhoods as a
replacement for the lack of larger grocery stores in the area (Eisenhauer 2001). The quality of food offered is often lower compared to fresh produce found in a typical supermarket and the price of the food items is also higher in convenience stores.
A 2018 study, Springfield Food Retail Environment Survey for Health (FRESH), conducted by the Springfield Department of Health and Human Services (SDHHS) Mass in Motion Program with assistance from the Pioneer Valley Planning Commission (PVPC), looked at the availability of different products and stores’ use of SNAP/WIC programs and accessibility. The objective of the research was “to quantify ways in which small food retailers are or are not improving health food access in the communities in which they do business” (Springfield FRESH 2018). The results of that study indicated that most convenience stores were not providing healthier food options such as fresh/canned/frozen/dried fruit and vegetables, fat free or low fat dairy and milk alternatives, 100% fruit juices, whole grain breads and cereals, whole grain and low fat snack bars, and nuts (Springfield FRESH 2018).
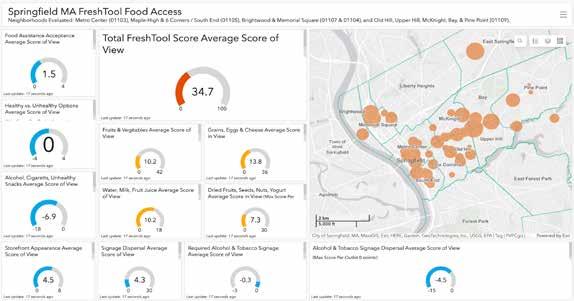
This dashboard, produced as part of the Springfield FRESH study, is updated in real time. It can be accessed at https://pvpc.maps.arcgis.com/apps/dashboards/f6ba82f6b1f6417a96b3871c482f9705.
Food availability is more than just the number of food options available; it is also about the diversity of stores from which to choose and the availability of transportation from where people live to food access points.
Food inaccessibility is determined by the spatial accessibility and affordability of food retailers. It considers factors like travel time to shopping, available transportation options, and food prices.
Food insecurity is affected by a broad array of factors, with food inaccessibility and food unavailability involved. It could be defined as the instability of food intake due to financial, socioeconomic, and other factors that ultimately have negative effects on one’s health. The USDA simply defines food insecurity as “the lack of access, at times, to enough food for an active, healthy life” (“Food Security in the U.S.: Overview” 2023).
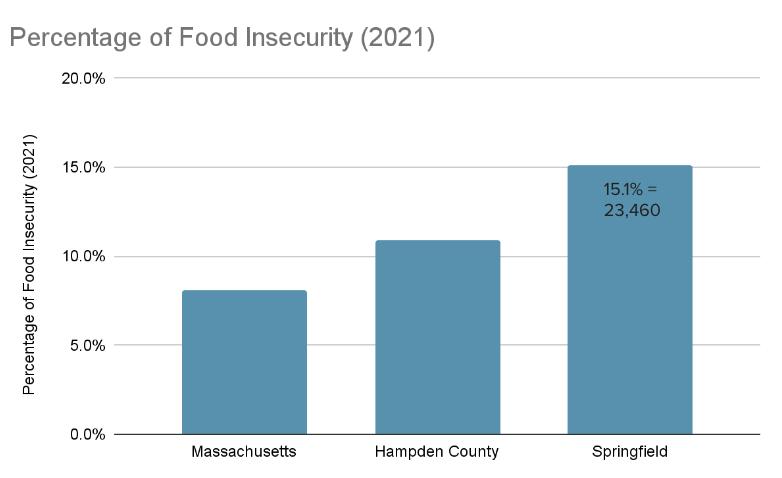
Source: Feeding America’s “Map the Meal Gap 2023: An Analysis of County and Congressional District Food Insecurity and County Food Cost in the United States in 2021” and The Food Bank of Western Massachusetts’s “Local Hunger Data” (accessed 5 March 2024).
According to the Food Bank of Western Massachusetts, Hampden County has the highest rate of food insecurity in the state at 10.9%, and Springfield has the second highest rate after Holyoke at 15.1%. The Massachusetts food insecurity rate in 2021 was 8.1%.
Feeding America started producing annual estimates of local food insecurity in 2011. The Map the Meal Gap data source for the U.S. population takes into consideration unemployment rates, median income, adjusted poverty rates, homeownership rates, percent of the population that is Black, and percent of the population that is Hispanic, and disability rates (Map the Meal Gap 2023: Technical Brief).
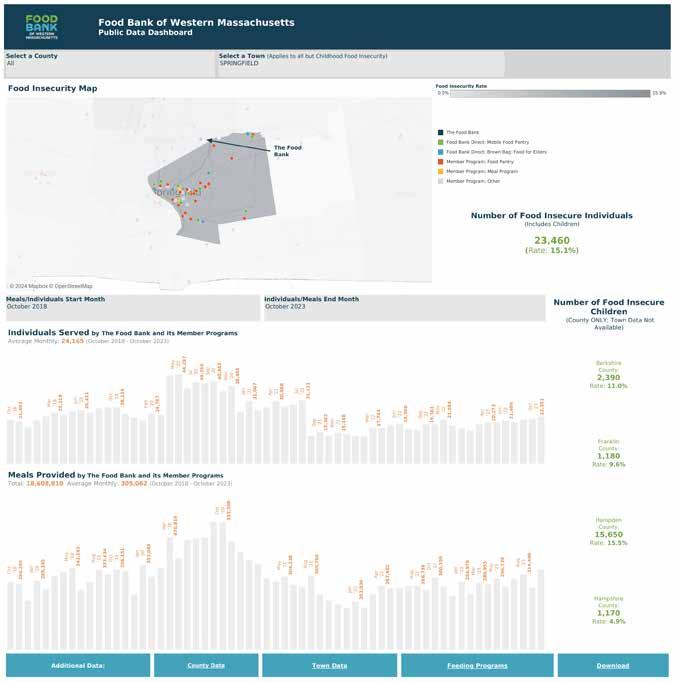
The Food Bank of Western Massachusetts provides statistics about local food insecurity not provided by Feeding America or the USDA. According to its website, the Food Bank collects data about food insecurity at its distribution sites and its partner member agencies. It asks for a person’s place of residence, the number of people in their household, and the age ranges of people in their household. The data graphs show the range of distributions over a five-year period. The numbers demonstrate that there was a spike in food insecurity during the first year of
the COVID-19 pandemic and then a subsequent decrease in the second half of 2021-2022.
Clay Gregory, senior content coordinator at the Food Bank of Western Massachusetts, explained that the implementation and expansion of federal assistance programs decreased food insecurity levels to below prepandemic levels beginning in August 2021. However, the expiration of those programs in 2023, coupled with rapid inflation, has accelerated food insecurity.
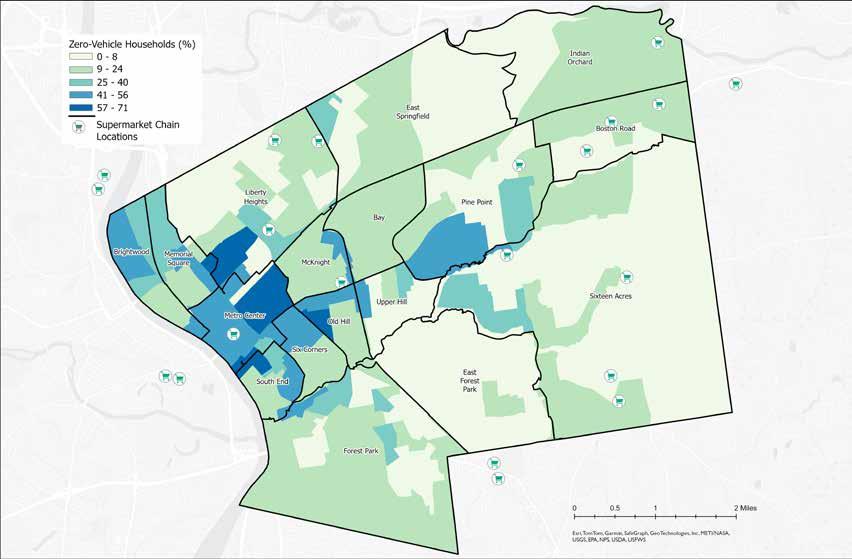
This vehicle access map is developed from 2022 census data. Darker tones indicate higher percentages of zero-vehicle ownership. This map differs slightly from the USDA’s 2019 low-vehicle access map, which considers tracts—each with varying population densities—as low-access if one hundred or more households do not own a vehicle. The national average for zero-vehicle ownership is 8% (Forbes); on this map, every area except the palest color exceeds the national average, with some neighborhoods reaching up to 71%.
Zero-car ownership is highest in portions of Memorial Square, Liberty Heights, Metro
Center, Old Hill, and South End.
Given America’s history of car-centric planning, basic resources such as large grocery stores are frequently far from many residential areas. Not owning a car is especially burdensome in these cases, for individuals must rely on public transportation or walking to reach their destinations. The difficulty of such travel naturally leads families to choose food options closer to home, which may be convenience stores or fast-food restaurants that have lower-quality foods with minimal nutritional value.
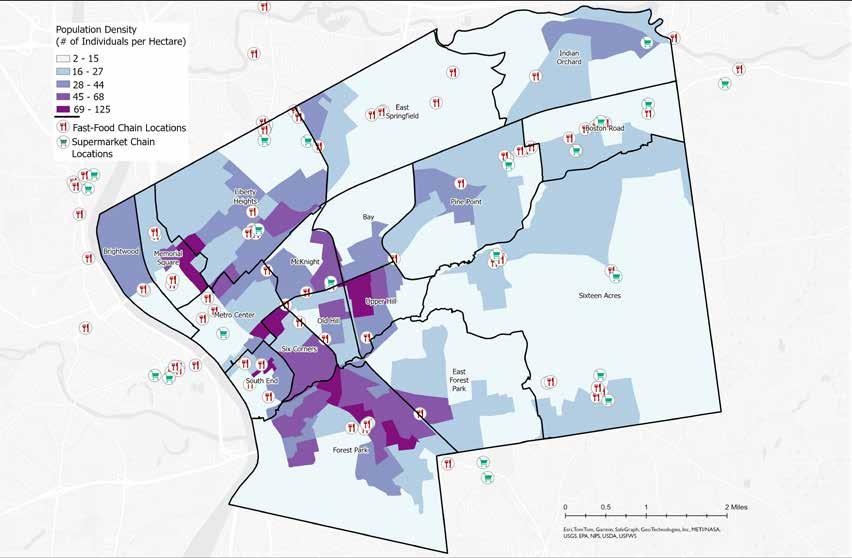
Springfield is most densely populated within Memorial Square, Metro Center, Six Corners, Four Corners, and Forest Park, with one census block in South End having the highest density of 125 individuals per hectare. Fast food locations are common along major roads and shopping plazas, and are distributed throughout the densest areas of the city. Supermarkets also follow major roads and shopping plazas, but are not as common in the denser neighborhoods. Presumably, neighborhoods with a larger population could support stores that offer
basic necessities, such as fresh food. However, as evinced by this map, locations of large supermarkets are not based on population density. While major roads and plazas have larger parcels of land for chains to buy and build upon, fast food locations within the city find ways of buying and using smaller parcels within dense areas. More density means more customers. Individuals living within the densest areas of Springfield have an easier time accessing poor-quality foods than fresh, nutritious options. This is exacerbated by the fact that many households in these neighborhoods also do not own cars.
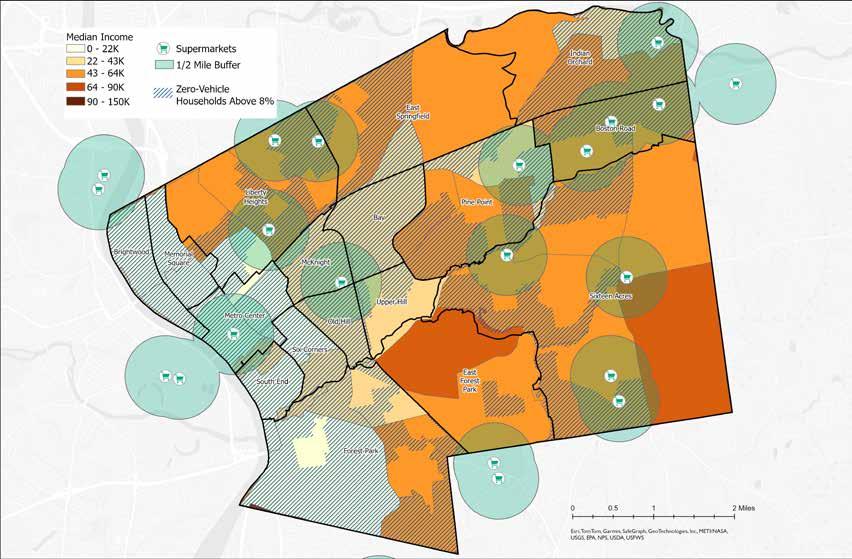
Source: US Census: Median Household Income (2020), Supermarket input points sourced from Google Maps (2024)
This map uses income and ease of access to large supermarkets as food access indicators. There are different ways to define low income and low access. This map uses similar criteria as that used to produce the USDA’s Food Access Research Atlas (formerly the Food Desert Report). The Atlas uses one of three ways to determine low income: 1) the tract’s poverty rate is 20% or greater; 2) the tract’s medium family income is less than or equal to 80% of the state-wide median family income; or 3) the tract is in a metropolitan area and has a median family income less than or equal to 80% of the metropolitan area’s median
family income (“Food Access Research Atlas Interactive Guide”).
Since using 80% of the median income in the metropolitan area would misrepresent income challenges in the city, for this map the lowincome census tract is one where the median family income is less than or equal to 80% of the Commonwealth’s median family income. In 2020, the median household income for Massachusetts was $84,385 (datausa.io/ profile/geo/massachusetts). Using 80% of this number as a reference, all of Springfield except for the darkest orange tracts—one in the easternmost section of Sixteen Acres and
one in the East Forest Park neighborhood— qualifies as low income (i.e., less than $67,500). Access to the nearest supermarket is represented by a half-mile buffer, which corresponds to a ten-to fifteen-minute walk to the store. Combining this information with the low vehicle access map shows that the neighborhoods that have the most limited means of accessing food include Brightwood, Memorial Square, Bay, Six Corners, South End, and Forest Park (which is a bit of an anomaly because much of the Forest Park tract is a City-owned park and sparsely populated).
“A lack of access to quality food sources and thus adequate nutrition has been a central cause of diminished health in the urban poor, and this reduced access has constrained choices and changed behavior over generations. Consequently, poor urban health is as much linked to 20th century urban history as it is to individual, behavioral causes.”
-Elizabeth Eisenhauer, “In Poor Health: Supermarket Redlining and Urban Nutrition”
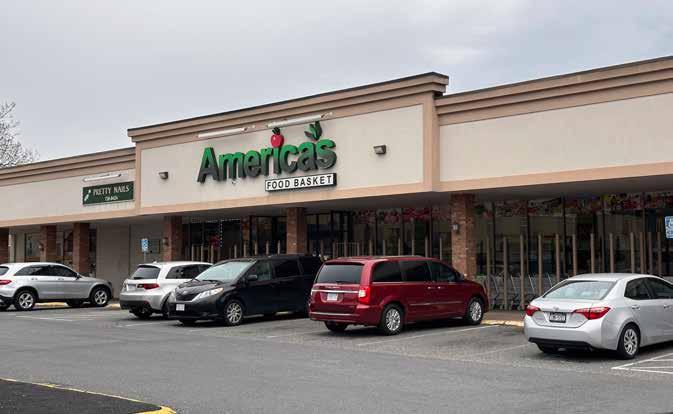
This American’s Food Basket is located at 790 State Street, Springfield. It is the only grocery store serving the four neighborhoods of Mason Square. America’s Food Basket is a Lake City, New York-based regional
cooperative with forty-seven stores located in Connecticut, Massachusetts, New Jersey, New York and Rhode Island. The stores vary in size from 5,000 to 20,000 square feet (Webber 2016).
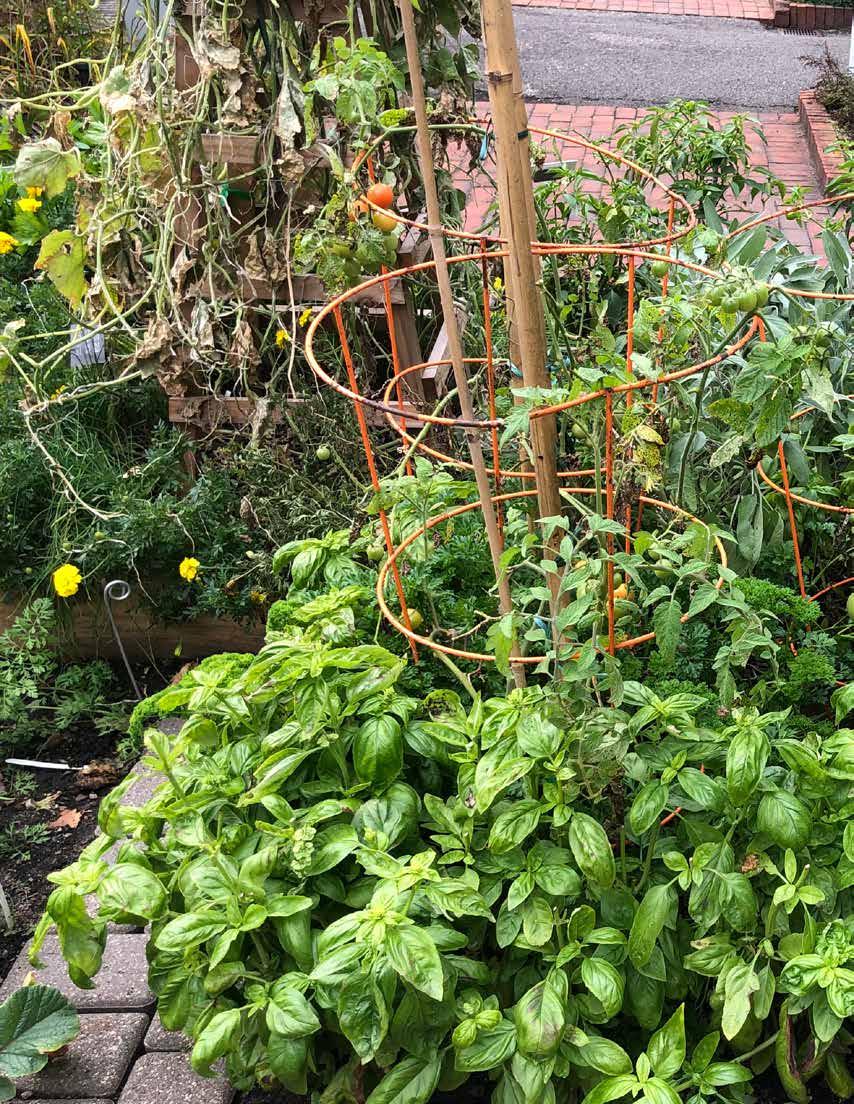
Source: Gardening the Community
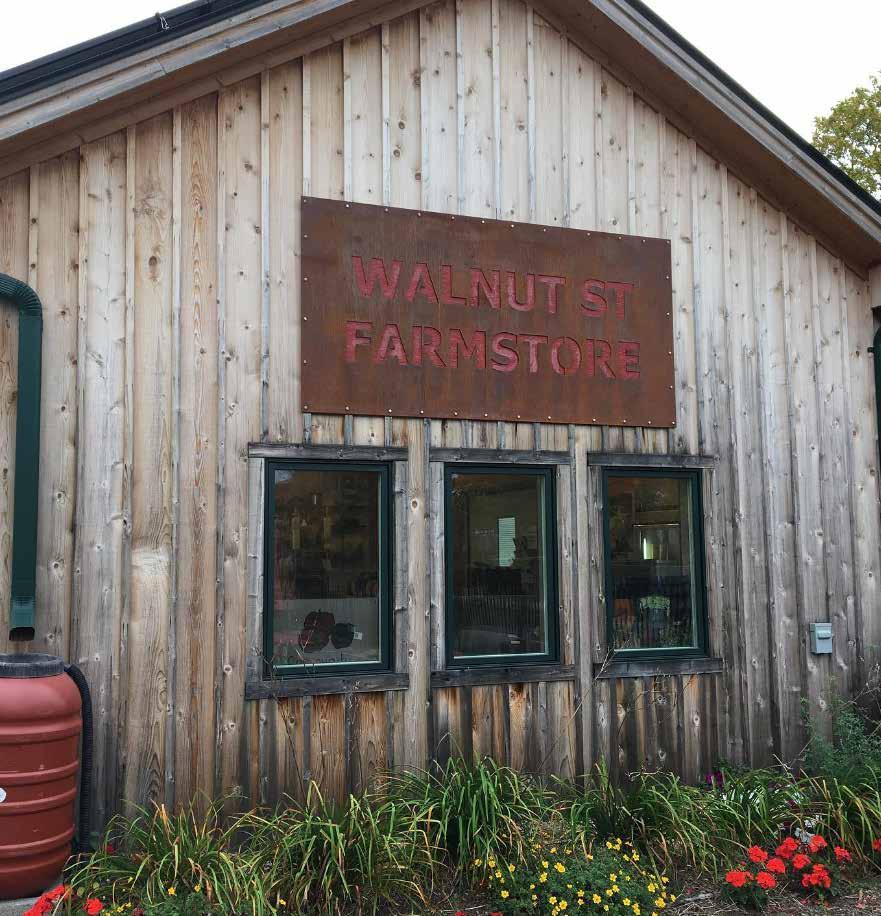
Urban agriculture is an umbrella term that describes a range of food-growing practices, including the cultivation, processing, marketing, and distribution of food in urban areas, from backyard gardens to urban farms.
While urban agriculture has many positive effects, access to land ownership and stewardship has been historically and actively denied to specific racial and ethnic groups within the United States, limiting these groups’ ability to enjoy such benefits. Black individuals especially have endured centuries of racist policies and under resourcing, contributing to Black farmers making up only 1% of all farmers in America (Gripper 2020). Ensuring members of minority racial and ethnic groups the ability to farm can play a role in healing historical scars related to land access.
“Many Black urban communities have kept in touch with their agricultural roots, establishing farms and gardens throughout the United States. Black people have ancestral ties to this land—to caring for it, nurturing it, loving it, and allowing it to heal our communities and us—and we have faced immeasurable discriminatory practices and policies as we sought to reclaim and live in relationship with the land.”
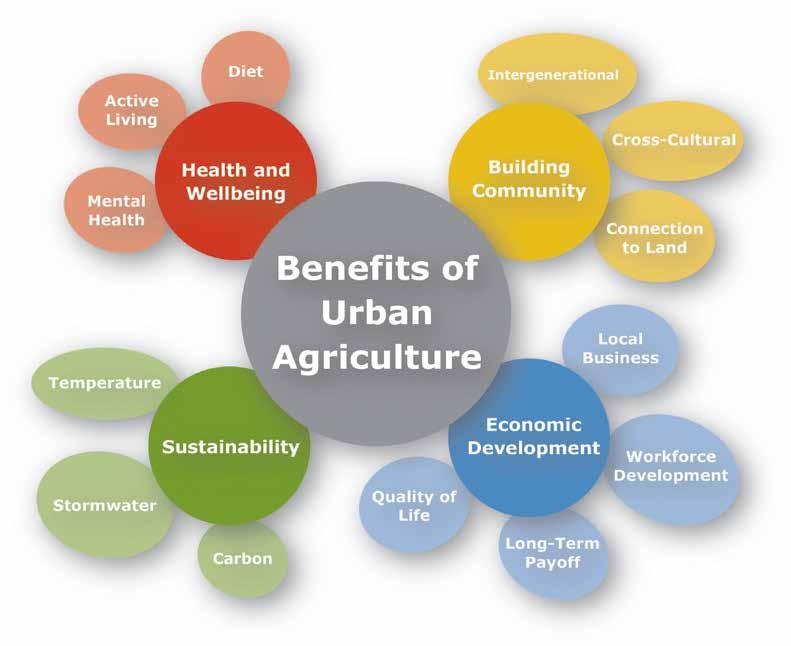
-Dr. Ashley Gripper, assistant professor of Community Health and PreventionAn obvious benefit of urban agriculture is increased access to fresh, unprocessed foods that support and strengthen the body. In addition, urban agriculture fosters wellbeing further by encouraging active living and improving mental health.
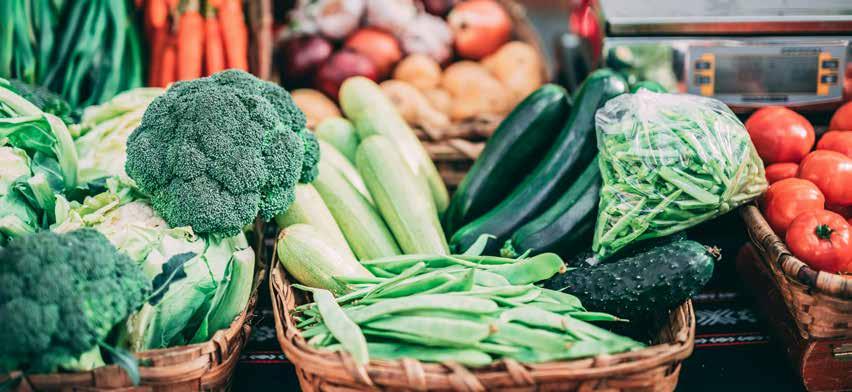
Diet is a powerful determinant of the prevalence of chronic illness, subsequent symptoms, and overall quality of life (Entwistle et al. 2021). The freshness of food, determined by the time since harvest, plays a part in determining its nutritional value, as vitamins naturally degrade throughout the process of transportation, retail, and storage (Kuhnle and Niranjan 2023). Buying locally or growing one’s own food can help ensure minimal nutrient loss, as foods move from farm to plate quicker than in conventional retail.
However, the type of food consumed has much more influence in determining an individual’s level of nutrition, and subsequent longevity (Boston 2023). A 2021 study found that individuals with diets higher in whole plant foods—which entails unprocessed fruits and vegetables—have higher longevity compared to those with other types of diets; this was especially true when compared to a more standard “western” diet—heavily composed of red meat, artificial sugars, and oils—which was associated with the lowest life expectancy of all diets studied (Entwistle et al. 2021). Such processed foods, which are commonly sold in convenience stores and fast-food restaurants, tend to be high in LDL cholesterol and saturated fatty acids, and contain simple carbohydrates. Meanwhile,
fruit and vegetables contain none of these negative compounds, and instead are high in fiber, micronutrients, antioxidants, and unsaturated fatty acids. These compounds have been found to naturally ameliorate some common chronic illnesses, such as type 2 diabetes (Kim and Giovannuci 2022).
The American Heart Association promotes increased consumption of fruit and vegetables of all kinds—fresh, frozen, canned, or dried— within the average American diet, especially as a method for combating heart disease, the leading chronic but preventable illness in the country. The association has promoted gardening, including community gardening, as a means of increasing access to and appreciation for fresh produce (Homegrown Foods). Getting children involved in growing their own food has also been found to increase the amount of produce they eat, along with what kinds of foods they find palatable, which can encourage healthy development and lifelong habits (Davis et al. 2021).
Dr. Ashley Gripper, an assistant professor in Community Health and Prevention, summarizes the power of urban agriculture when she states, “growers and activists understand that [...] a major key to population health and collective healing is having control over what goes in our bodies” (2020).
Massachusetts’ Food is Medicine initiative focuses on the potential of food in improving public health. The state plan believes that “by addressing nutritional needs within the context of health care, Food is Medicine interventions play an important role in preventing and/or managing many of the chronic conditions that drive health care costs.”
-MA Food is Medicine State Plan, June 2019
Just thirty minutes of gardening several times a week can produce noticeable health benefits—even just a half-hour of weeding can burn one-hundred and eighty calories. All the major muscle groups are used throughout gardening’s varied activities, many of which do not apply excess pressure to joints and bones as do other exercises, such as jogging (Ross). Additionally, gardening is a self-paced activity that can be made easier with the use of tools. This can make exercise possible for individuals with a wide range of physical abilities, ages, and health conditions such as asthma. Managing plants also innately requires frequent, sometimes daily, care, which can encourage consistent movement regimes in individuals.
When community gardens and farmers markets are within walking distance, as they often are, they can promote movement for many people in the area. Additionally, weather and temperature permitting, the act of going outside offers benefits, such as increased vitamin D.
Gardening has been linked to not only increased physical wellbeing, but also mental wellbeing. Gardens, along with other green spaces, have been found to decrease stress hormones in individuals, even when just sitting within the space (Gupta 2022). Within urban environments, where green space is often lacking, having spaces of respite with trees, gardens, and other greenery can help create a healthy state of mind for residents. Additionally, gardens provide an opportunity to create meaningful and positive humannature interactions (Soga et al. 2017), which can be especially soothing in contemporary times, where negative associations between humans and nature, and general climateanxiety, is often abundant.
Gardening is also a great activity for supporting the mental wellbeing of all ages, but especially for children and older adults. Children are given a space to play, explore, and learn, whether that be through observing the tricks of experienced gardeners, discovering a new bug never seen before, or by tasting and being accustomed to new foods and flavors. For older adults, gardening
While backyard gardens promote increased produce consumption and exercise, community gardens, farms, and farmers markets further foster personal wellbeing by strengthening connections between people, cultures, and the land.
There are few gathering spaces where people of all ages, ethnicities, and other backgrounds feel equally welcomed and encouraged to meet, collaborate, and share with other individuals on the same land. Community gardens and farms offer such a space. This interpersonal exchange can be very fulfilling for youth, who are currently spending on average only four to seven minutes of unstructured outdoor play per day (Marshall). Community gardens can provide a safe space for children to play outdoors, learn about natural processes, and discover new foods and how they are grown—this is especially meaningful within urban environments, which may contain little open space. Additionally, deep generational gaps currently exist due to many factors such as the loss of extended family units, increased migration, and overabundant screen time (Schmidt-Hertha 2014). Growing food is one way to preserve intergenerational interactions and knowledge, both between families and across communities, as the practice is frequently taught through listening to, observing, and mimicking experienced gardeners. In reality, knowledge is not only passed from elder to child, but is also a life-long process involving learning from all types of individuals. Akin to the sharing of information, community gardens and farms also allow for the sharing of experiences and food between individuals as they share both work and yields.
Farmers markets, especially due to their social element, attract many families and individuals into a shared space to enjoy a variety of vendors, music, and community. The public is also given the chance to meet and talk with the farmers growing their food,
and build interpersonal connections with the people creating the foundation of their local food system.
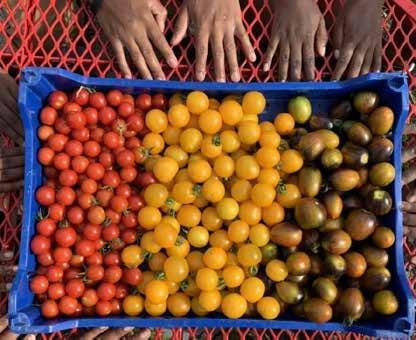
Food hubs are historically a way for individuals to practice cultural expression and preserve culturally relevant crops, recipes, and farming practices. Oftentimes, many commercial-chain supermarkets sell products most likely to appeal to the largest consumer base, so it can be difficult to find foods within these stores that the average American does not buy, regardless of the food’s popularity in other countries. Thus, if the local climate allows for it, specific crop varieties not sold in stores can be planted, harvested, and enjoyed within community gardens and farms. Even if a crop cannot be grown due to climate, greenhouses may offer a solution to growing food common in warmer areas of the world. Uncommon crop varieties provide the opportunity for members of the same community garden or farm to experience new foods and expand their own taste palette or garden.
While experiencing the richness of other cultures is one benefit of community gardening, meeting other members of the same culture can also be extremely fulfilling, especially if individuals face English isolation within a neighborhood. Farming may be a very meaningful practice for new arrivals, especially those who were already growing food in their country or place of origin. Maintaining the habit of farming while in a new land is a powerful way of easing the
sense of cultural identity loss common in immigrants and new arrival. In one qualitative study interviewing refugees who garden in communal plots, one immigrant is described as “relieved to have a land here to dig. He believes it was very important for an African person, if they didn’t go to school, which majority didn’t, they had to be a farmer. So the closeness was very good, the bond between the human and the soil was of great importance. … This is the only place here for him to dig so that is why it is important for him” (Harris 2014).
Farmers markets may similarly fill a cultural niche if they offer culturally relevant foods, especially if the vendor is bilingual and can welcome and interact with non-fluent English speakers. Having diverse vendors can expose the public to new foods, and allow individuals of the same background to meet within a shared space, and having affordable vendors with consistent prices, clear advertising, and bilingual signage allows the market to be more accessible for a wider audience.
Community gardens, farms, and farmers markets are not only able to deepen interpersonal and cultural relationships, but can also foster a greater connection, responsibility, and care for the land one lives on, as referenced with the African refugee’s newfound relationship with American land. Communal gardens and farms are especially important within urban areas, as many individuals rent and do not have access to private land for food production. A sense of belonging to land is partially generated through the stewardship aspect of gardening, where humans and natural processes work together towards a shared goal. This positive exchange can be meaningful, especially when many individuals perceive urban environments as the antithesis of nature. Growing food can also expose individuals to the growth and importance of other organisms, such as crop plants or pollinators. Similarly, relying on seasonal food grown by oneself or local farmers can allow individuals to become more in-tune to changes in seasons and weather (Lin 2018). Farmers markets have the added benefit of allowing the public to gain a greater understanding of where their food comes from, as farmers are able to explain what varieties they grow, as well as what practices they use to grow them.
Nordica Street Farm is a CSA and farm stand in northern Springfield that is developing a communal medicinal herb garden, stewarded by women of the surrounding community and available to any member of the public.
-Anne Richmond, founder of Nordica Street Community Farm
States and municipalities across the U.S. are assessing their resiliency in light of human-caused climate change, which is resulting in higher temperatures, increased flooding, and more unpredictable weather. Urban agriculture, which is considered a type of green infrastructure, can be employed to increase climate and weather resiliency (Dekissa 2021).
The increasing severity of heat waves and overall temperatures can have a negative impact on human health and general wellbeing. Extreme temperatures cause the body to overheat, causing heat stroke, and also increase the chance of heart attack or respiratory diseases like pneumonia. Each year more than 1,300 deaths in the U.S. can be attributed to extreme heat, and that is likely an undercount (“Climate Change Indicators”).
Urban areas are particularly vulnerable to sustained elevated temperatures, since the land is covered by large swaths of impervious surfaces such as sidewalks, rooftops, and buildings made of concrete, asphalt, and metal. Concurrently, urban areas tend to offer low tree canopy coverage. As a result, these places become “heat islands” compared to
outlying suburban or rural areas. Some effects of urban heat islands (UHI) include increased energy consumption (especially through air conditioning), air pollutants and particulate matter, and smog and ozone formation (Humanaida 2023).
The addition of green space within urban areas is one effective strategy to combat the UHI effect. Plants decrease temperatures through providing shade, as vegetative cover reduces the amount of sunlight that reaches the ground and buildings, thereby lowering surface temperatures. Additionally, air is cooled through evapotranspiration, where water droplets collect on the underside of leaves and absorb heat before becoming water vapor. Plants also improve air quality by acting as natural air filters, absorbing carbon dioxide and other pollutants (“How Does Urban Agriculture” 2023).
To help absorb stormwater runoff, Springfield’s Climate Action and Resilience Plan (CARP) suggests the use of small agricultural plots that provide permeable surfaces, along with other sorts of green infrastructure like bioswales and rain gardens.
-City of Springfield CARP, 2017
Within urban environments—which contain abundant concrete, asphalt, compacted dirt, and other impervious surfaces—minimal rainwater is typically absorbed into the ground compared to less developed areas. Such impervious areas are considered to have high runoff, which contributes greatly to urban flooding events. These events are predicted to only become more extreme as climate change progresses and precipitation events become more severe and unpredictable (Monier and Gao 2015). Flood events can be economically catastrophic, as they can damage infrastructure–including roads, buildings, underground pipes, and equipment–as well as topography–where soils, fertilizers, and possible contaminants are moved (“Torrential Flooding”).
Most rainwater that does not become absorbed into the ground enters the sewage system. While much of this water becomes treated, the sewer infrastructure within many older U.S. cities is unable to accommodate high water inputs that can accumulate during major storm events. To avoid backed-up or leaking pipes, these sewer systems combine both untreated street runoff and household waste and overflow into local water bodies, severely harming natural habitats and human health (Zhu 2021).
One way to reduce combined sewer overflow (CSO) events is to reduce the amount of stormwater entering a sewer system in the first place, such as through adding green infrastructure. Such features can include trees, roadside rain gardens, and green spaces, such as urban agriculture plots (Deksissa 2021). The greater the amount of vegetation, the greater the land’s ability to absorb water. In this regard, revegetation of any sort can improve urban ecosystem
resilience to extreme precipitation, reducing flood risk and water runoff. A study in Beijing demonstrated that the amount of runoff reduced by urban green spaces “resulted in benefits equivalent of 75% of flood maintenance cost” (Humaida 2023).
According to the USGS, carbon sequestration is “the process of capturing and storing atmospheric carbon dioxide. It is one method of reducing the amount of carbon dioxide in the atmosphere with the goal of reducing global climate change” (USGS: Carbon Sequestration). As plants grow, they develop biomass primarily by storing atmospheric carbon within their leaves, stems, and roots. As these parts naturally decay overtime, the carbon stored within them becomes part of the organic matter composition of the surrounding soil. Through this process, carbon is moved from the air and into soil, where it is “stored.” Agriculture in the form of community gardens, community farms, and urban orchards can be an effective strategy for carbon sequestration within urban environments, especially if plant materials are composted and used on site (Barnard). The farming practices found to promote more carbon sequestration compared to other methods include cover cropping, reduced tillage, and crop rotation. Additionally, woody perennial crops generally hold more biomass, and thus carbon, than annual crops do (Massachusetts 2022).
Conventional economic development models typically focus on direct financial gain, which can involve generating wage employment, attracting outside capital investment, and increasing tax revenues. However, urban agriculture can contribute to the fiscal health of a municipality within this model and beyond, such as through strengthening local economies, reducing expenses, and promoting quality of life.
The economic benefits of urban agriculture can be directly seen in farmers markets and farm stands, where local farmers are given a dedicated space to directly sell their goods to consumers; this can be very beneficial for vendors amidst the larger commercial farming system that big agricultural chains typically dominate. Also, unlike major food chains, local farmers are able to directly contribute to the economy they work in and provide for.
Gardening the Community (GTC) has a strong focus on youth development, where “youth receive a stipend and are taught principles of urban sustainable living and urban agriculture [and] also bring food home to their families.”
-GTC Website
In regards to community farms, many youthfocused programs and organizations are able to pay teenagers who take on agricultural work, which can introduce and develop their finance skills, start their personal investment, or supplement their family’s income. These financial opportunities can be immensely beneficial in food-insecure communities. Alongside such support, engaging youth in urban agriculture can develop their knowledge of horticulture and nutrition, as well as build essential social and personal skills. Similarly, urban farms can offer fulltime agricultural work opportunities, which are often scarce in highly urbanized areas. The ample number of vacant lots, many of which have no plans for immediate development, is a ripe opportunity to create such positions.
Even before youth enter the workforce, their future careers can be supported by improving their public education environment. Numerous studies have connected academic performance with the quality of food consumed by students, where children that are fed and fueled by nutritious foods are more focused and present in the classroom (Bleiweiss-Sande et al. 2020). Feeding kids is part of economic development, as improved academic performance may lead more individuals to attend higher education and attain higher-paying jobs.
As detailed in previous sections, urban agriculture has the potential to positively influence physical, social, and environmental health. Many of these services have financial weight; for instance, by promoting citizen health and stormwater catchment, the costs of healthcare and infrastructure services, respectively, can be reduced. Although sometimes not obvious, urban agriculture can promote fiscal health through preventing municipal long-term costs.
The primary goal of economic development is not generating wealth or avoiding unnecessary costs for the sake of it, but rather to benefit the community through improving the quality of life of individuals. As mentioned, urban agriculture can directly contribute to quality of life by improving physical and mental health through nutrition, exercise, and green space; creating spaces for convivial social engagement and intergenerational and cross-cultural learning; and cooling hot cities, cleaning air and water, and storing carbon. Urban agriculture becomes a strategy of directly providing conditions for the improvement of quality of life for individuals and communities—which is the goal of economic development—while skipping over conventional methods that require direct economic growth.
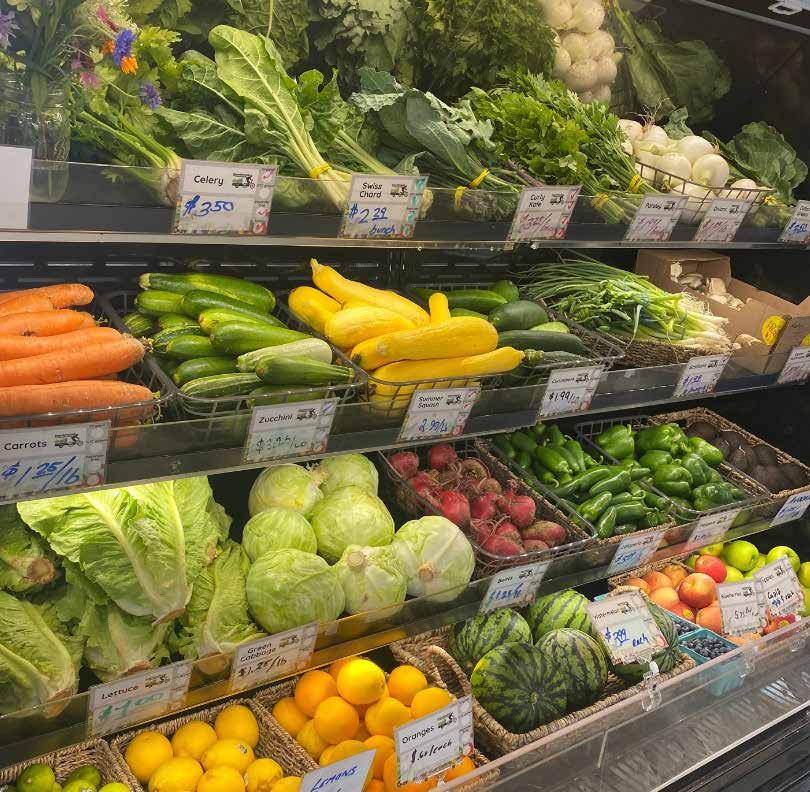
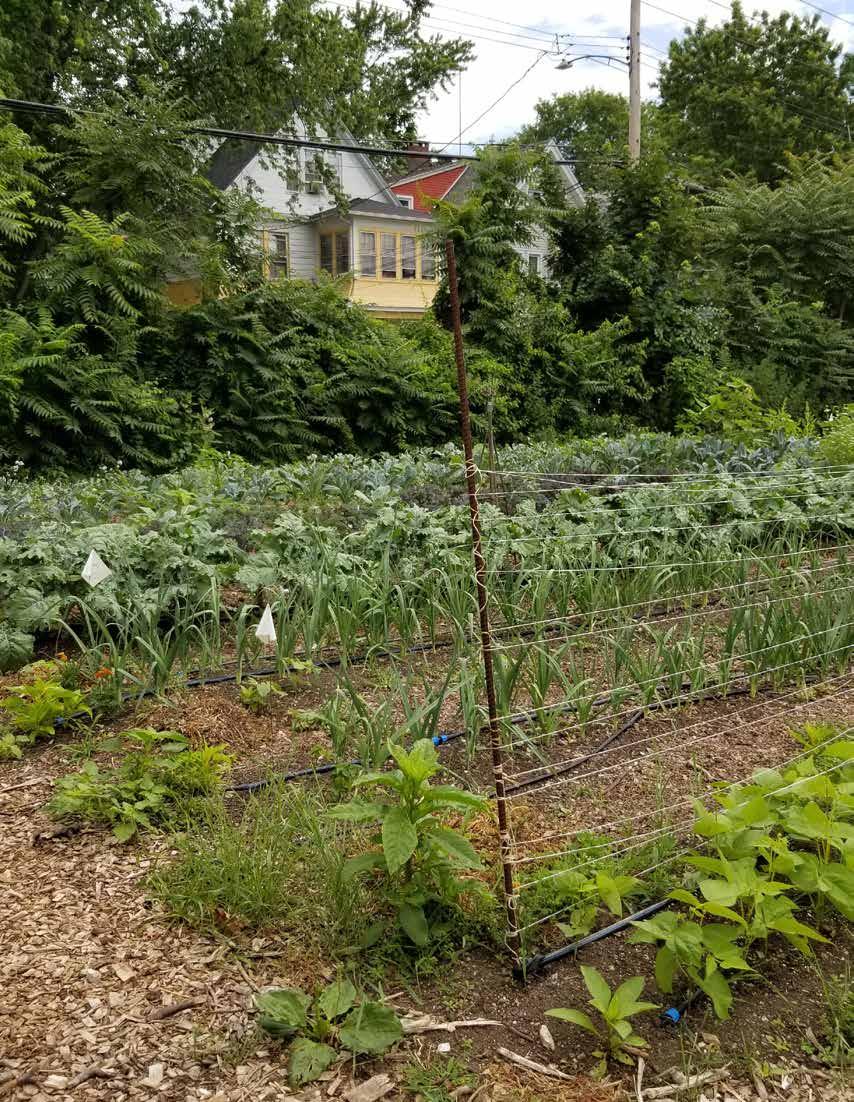 Source: Daniella Portal
This section of the report demonstrates a process for identifying which City-owned vacant lots are the most suitable for food production (i.e., community gardens, community farms, or urban orchards). Four tiers of criteria, informed by environmental restrictions, feedback from the Springfield Food Policy Council (SFPC), the City, and processes of past reports with similar goals, such as Food in the City (2014), and A Spatial Analysis Supporting Holyoke’s Food System (2022), are used to reduce the number of City-owned vacant lots to a short list of recommended parcels.
Tier 1A and 1B criteria are both mappable and will be used to eliminate sites that do not meet the criteria outlined. Tier 1A criteria include environmental restrictions and barriers that might make a vacant lot unusable without significant alteration. If a site meets all of the criteria presented in Tier 1A, it will move on to the Tier 1B criteria. Tier 1B criteria are also mappable, but focus more on ease of use and safety of the site, as well as the size of the site for different food production uses. Tier 2 criteria are mappable and consider public health criteria as an overlay to the sites remaining after Tier 1B. This tier of criteria helps create a focus area of the neighborhoods that would most benefit from increased access to food production sites. All of the sites remaining in the focus area determined from Tier 2 then move on to Tier 3. Tier 3 includes criteria that are not always necessary for food production, but increase the ease of use of the site. Tier 3 also includes criteria that require further ground-truthing, and were not addressed in this report due to time constraints. Lots meeting all of the tiered criteria are deemed “most suitable” for food production according to the model. However, any lot meeting Tier 1A criteria may be suitable. All lots identified in the model require
further ground-truthing to determine suitability. The rationales for choosing each of the criteria found in Tier 1A and 1B are as follows.
• Owned by the City of Springfield: As outlined by SFPC, identifying and communicating with the owners of privately owned lots can be a difficult process, making land transfers for urban agriculture timeintensive and complicated. For this reason, the model prioritizes City-owned vacant lots.
• Not in FEMA 100-year floodplain: Given that climate change may increase flood frequency, the model eliminates lots within the 100-year floodplain designated by the Federal Emergency Management Agency (FEMA). Elimination of these sites helps to prioritize lots with a lower risk of flooding, making them enjoyable and usable as food production sites for years to come.
• Not in NHESP priority habitat: To avoid disturbing or destroying important habitat for agriculture use, the model eliminates lots within priority habitat areas identified by the National Heritage and Endangered Species Program (NHESP).
• Not in a wetland: Many delineated wetlands are protected by both federal and state laws that require buffer zones to preclude certain activities. Although in some cases agriculture may be permitted in wetland buffers and wetlands themselves, obtaining a permit to do so can be a time-intensive process. The Department of Environmental Protection (DEP) wetlands layer used in this analysis does not show all current delineated wetlands, only likely wetland areas.
• Slope is no more than 5%: It is important that these sites are accessible to people with different ability levels. This criterion is <5%, as this is generally regarded as the maximum accessible slope for people using wheelchairs when there are no handrails in place. This model recognizes that food can be grown on slopes steeper than 5% and that grading can be used to achieve a desired slope, and therefore does not eliminate sites that have slopes higher than 5%, but rather selects sites with at least 500 square feet of accessible slopes.
• Not a Tier Classified Chapter 21E Site: Chapter 21E refers to the Massachusetts Oil and Hazardous Material Release Prevention and Response Act. Property that is designated by the Commonwealth as “Chapter 21E” has been identified as hazardous and has not yet undergone sufficient remediation. Because the contaminated land can pose a significant risk to human health and the environment, it should not be used for food production. Examples of Tier 1 imminent hazard contaminants include cyanide, petroleum, and lead.
• Not zoned “Commercial-P”: Lands that are designated by the City zoning code as commercial-P are sites used for the primary purpose of parking. Not all parking lots are commercial-P, as a parcel hosting both a business and a parking lot would be zoned for business. However, all commercial-P sites are parking lots; for example, a business can obtain an adjacent parcel for the sole purpose of hosting or expanding a parking lot if the lot is designated commercial-P. Parking lots leach chemicals and heavy metals into the soil underneath them over time, and are also consistently exposed to pollutants from vehicles, making them unfit for food production (Azadgoleh et al 2022). City zoning
prohibits any food production use on commercial-P sites.
• Doesn’t have structures: Feedback from the Department of Parks, Buildings, and Recreation Management informed the decision to eliminate lots with structures on them, as these are lots that are more likely to be used for future housing use.
• Has permeable surface: Similarly to the criteria for slopes, the model selects parcels with at least 500 square feet of permeable surface on them. Although it is possible to grow food in raised beds on impervious surfaces or remove impervious surfaces altogether to create garden beds, the model prioritizes permeable surfaces to increase the ease of use for establishing food production.
• Located within a half-mile of public transportation: Lots that are within walking distance to public transportation, which includes the PVTA bus lines in Springfield, are selected by the model in order to make them accessible to users without vehicle access.
• Not located within 100 feet of a busy street: High numbers of vehicles using major roads generates increased noise pollution as well as increased levels of fine particulate matter in the air, lowering air quality. Busy roads can also pose a threat to pedestrians working on site or walking to and from a site. In order to reduce health risks associated with poor air quality and increase the overall safety of the site, the model applies a 100-foot buffer around any road seeing more than 15,000 cars a day. Lots located within this buffer zone are not considered for food production.
• Lot size: Community gardens, community farms, and urban orchards have different size requirements. Size requirements are drawn from the 2014 study, Food in the City. Lots identified for community gardens are less than 5,000 square feet, for community farms exceed a quarter acre, and for urban orchards exceed 1,000 square feet.
Methodology: Vacant Lot Suitability for Food Production

Source: MassGIS: Property Tax Parcels (2023)
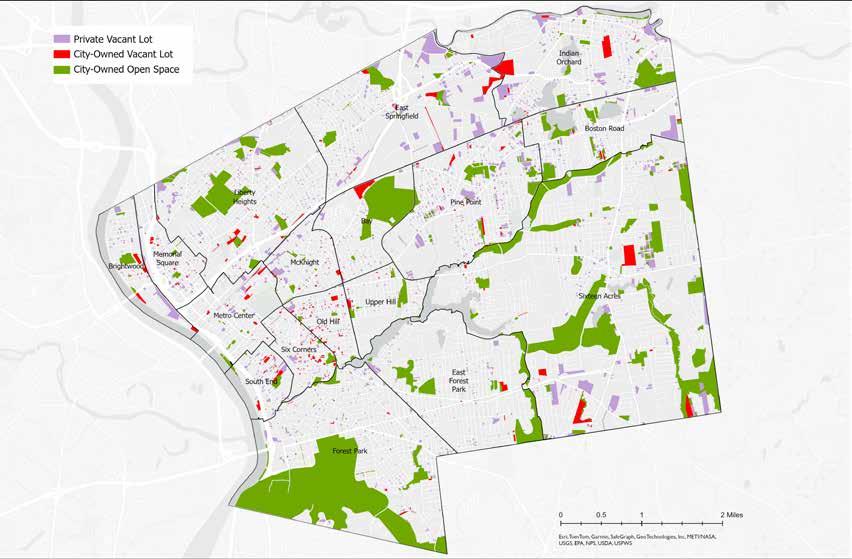
Vacant land in Springfield can be classified into three categories: privately-owned vacant lots, City-owned vacant lots, and City-owned open space. There are a total of 2,867 privately owned vacant lots, 486 City-owned vacant lots, and 478 parcels of City-owned open space across Springfield. City-owned open space is not necessarily vacant, but is considered undevelopable and can host a variety of uses, such as parks, sports fields, or cemeteries. The larger swaths of City-owned open space are in the eastern and northern parts of the city, as well as in Forest Park. Private and City-owned vacant lots are much smaller in size than the City-owned open space parcels, and are dispersed unevenly throughout the city.
Because City-owned open space can vary greatly in its use from parcel to parcel, certain parcels may be more compatible with urban agriculture than others. For example, a City park may be an appropriate location to host a farmers market or a community garden, but a sports field or a cemetery should not be used for urban agriculture. The larger size of the City-owned open space parcels allows for some flexibility, as particular portions of a parcel may be used for urban agriculture while the rest of the parcel maintains its intended use. However, because of the great variety in use of this land, the model does not assess City-owned open space parcels using the same tiered system of criteria mentioned prior.
Identifying and negotiating with the owners of privately-owned lots, as well as paying for the use of private land, can be a complicated process, making land transfers for urban agriculture time-intensive and potentially expensive. With these factors in consideration, the model does not assess privately owned vacant lots for food production either. In the pages that follow, the model only examines City-owned vacant lots in order to identify the lots that are most suitable for food production.
Source: MassGIS: FEMA National Flood Hazard (2023), NHESP Estimated Habitats of Rare Species (2021), MassDEP Wetlands (2017), Chapter 21E Tier Classified Sites (2024), Property Tax Parcels (2023)
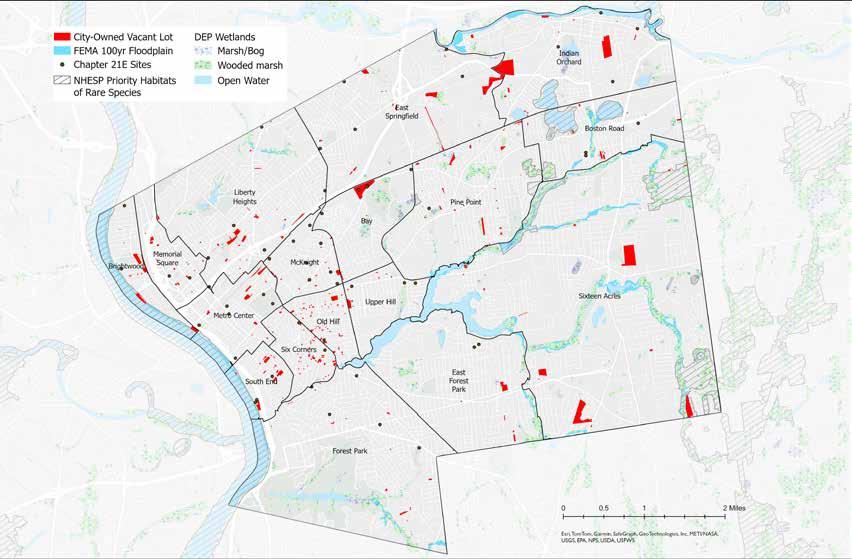
Environmental factors such as the FEMA 100year floodplain, wetlands, hazardous or contaminated sites in Chapter 21E, and NHESP protected habitat prohibit or limit the use of land for food production. Looking at these environmental factors relative to all Cityowned vacant lots shows parcels that should be avoided for siting food production. Avoiding lots with environmental restrictions allows these important environmental areas to stay undisturbed, and minimizes physical obstacles to the establishment of food production. On sites where a portion of a lot intersects with
the flood zone, priority habitat, or a wetland, the model selects the site for consideration so long as there is at least 500 square feet of land that does not overlap with the environmental restriction. The portion of the land that is left over and does not interfere with the restriction may still be suitable for food production.
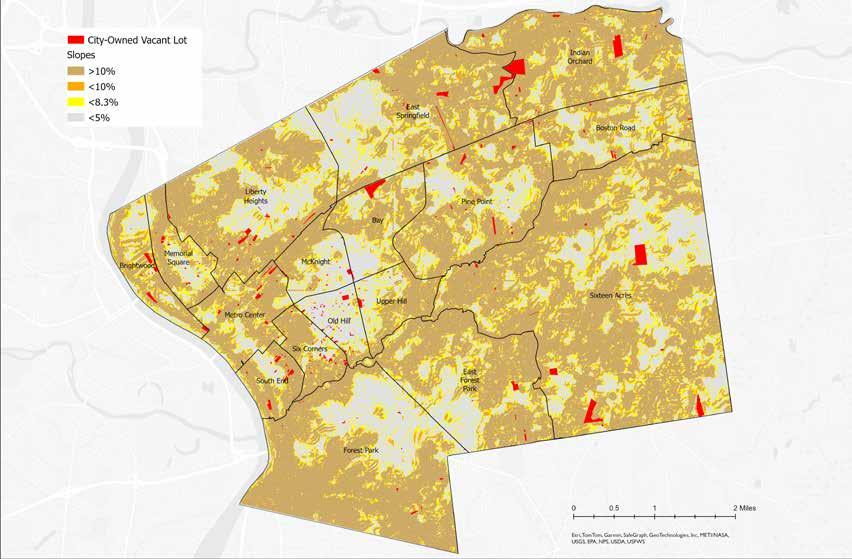
Source: MassGIS: Property Tax Parcels (2023), NOAA Data Access Viewer: Lidar (2015)
Following ADA standards, slopes on a solid and stable surface at 5% or less are accessible to people with varying ability levels, especially those with wheelchairs; slopes up to 8.3% are accessible when paths have a handrail. To ensure maximum accessibility, the model considers a slope of 5% or less as an accessible slope. Given that food can be grown on slopes steeper than 5%, and that grading can be used to achieve a desired slope in many cases, sites with slopes higher than 5% are not eliminated if they have at least 500 square feet of accessible slopes.
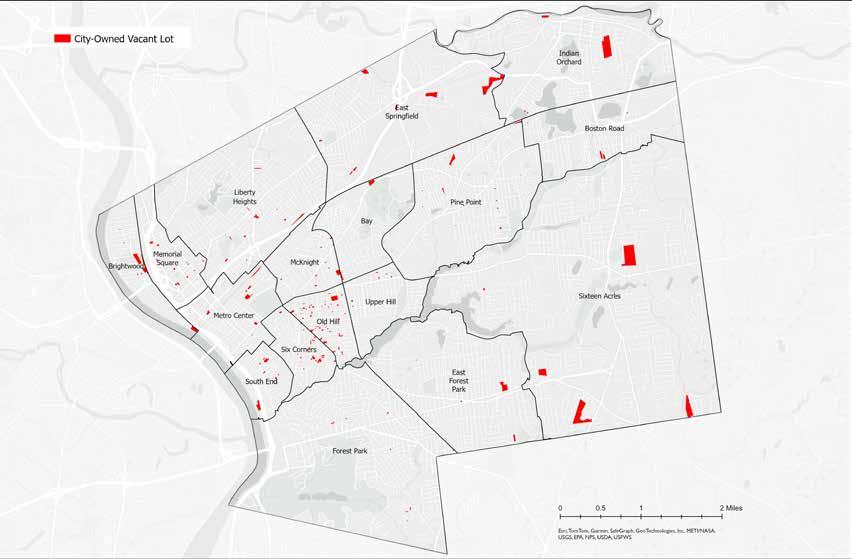
Source: MassGIS: Property Tax Parcels (2023)
After applying all of the criteria listed in Tier 1A, 227 City-owned vacant lots remain, and the number of lots within the Old Hill neighborhood starts to become more pronounced. These lots will now be examined with the mappable Tier 1B criteria, which include factors related to the ease of use and safety of a site, as well as the size of a site for different food production uses.

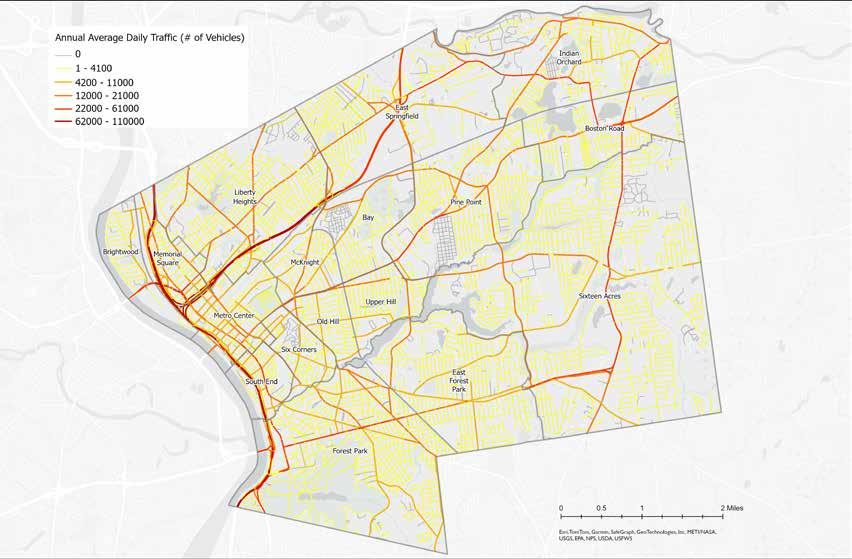
Source: MassGIS: MassGIS - MassDOT Roads (2023)
The most heavily-trafficked roads are within the western portion of the city, indicated by shades of red and orange. Minor streets, which have significantly fewer vehicles per day, are represented by yellow roads. The categorization of roads is based on the annual average of daily traffic. The high number of vehicles using major roads generates increased noise pollution as well as increased levels of fine particulate matter in the air, lowering air quality. Both of these factors can make outdoor activity, like food production on a site, and walking to and from a site, difficult, uncomfortable, and potentially harmful.
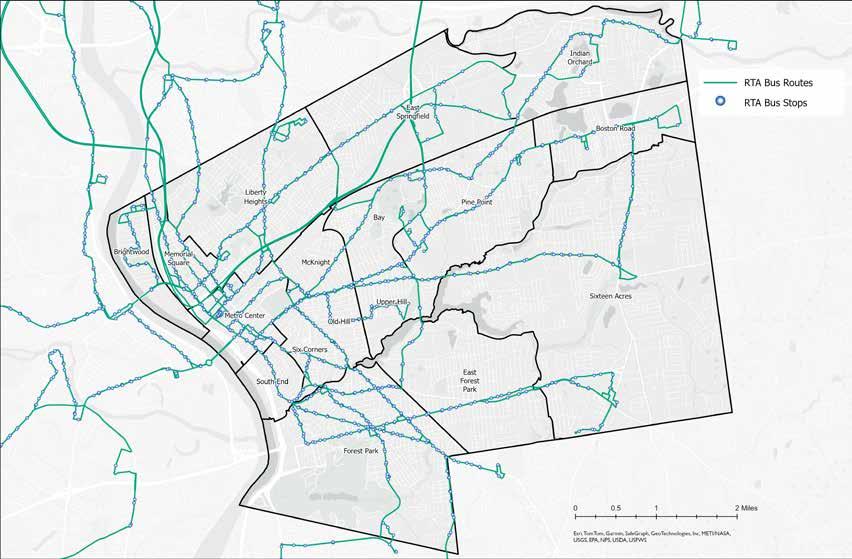
Source: MassDOT: RTA Bus Routes (2024), RTA Bus Stops (2024)
The Regional Transit Authority (RTA) that serves Springfield, among many cities within the region, is the Pioneer Valley Transit Authority (PVTA). The PVTA bus lines are a crucial resource within Springfield, considering many families do not own personal vehicles. The lines have many stops, allowing for a short walking distance to many destinations around the city. Many of PVTA’s routes are congregated in western Springfield, and generally follow major roads shown in the previous map. Bus stops are evenly spaced throughout all routes, about one stop per one
to two blocks. This map does not display the frequency of routes.
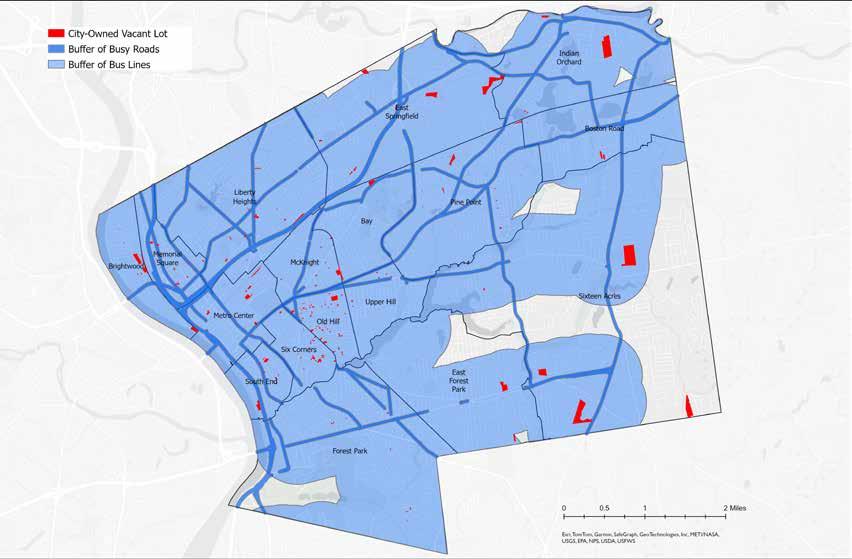
Source: MassGIS: Property Tax Parcels (2023), MassGIS - MassDOT Roads (2023); MassDOT: RTA Bus Routes (2024)
The model considers any site within a halfmile of a bus line (light blue areas) to be within walking distance, and eliminates any lots that are outside of this buffer zone. It is important to keep in mind the proximity these bus lines have to major roads that host a large number of vehicles per day, as vehicle traffic is linked to higher levels of air and noise pollution. Using a 100-foot buffer around any road that sees more than 15,000 cars a day (dark blue lines), the model eliminates lots within this buffer zone to increase safety of the site and lower health impacts caused from
proximity to fine particulate matter. Lots that are located within the light blue areas, but not within the dark blue lines, are prioritized in the model as being safest from busy roads and within walking distance to bus lines.
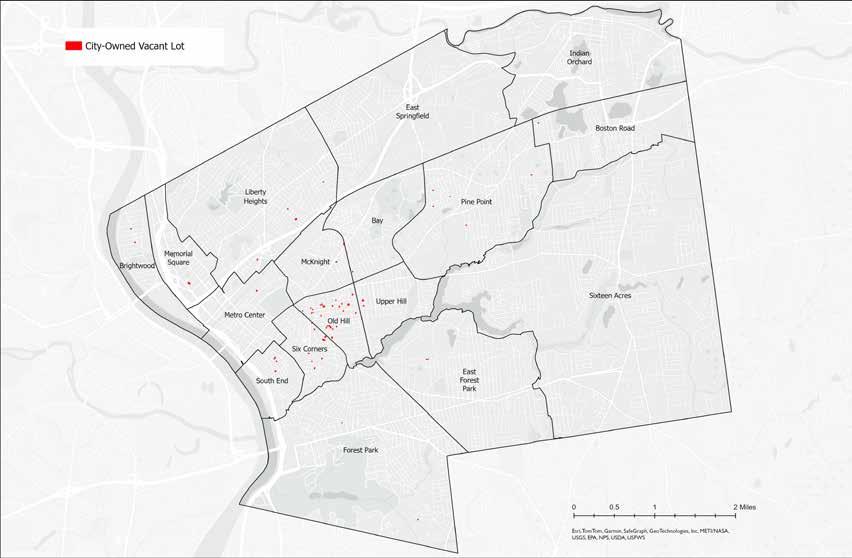
Source: MassGIS: Property Tax Parcels (2023)
After all other criteria from Tier 1B have been applied, the model selects lots less than 5,000 square feet to be considered for possible community gardens. There are eighty-three City-owned vacant lots identified as meeting all of Tier 1B criteria and the size requirement of community gardens. The model does not identify any suitable lots for community gardening in the neighborhoods of Indian Orchard, Sixteen Acres, or East Springfield based on the criteria used.
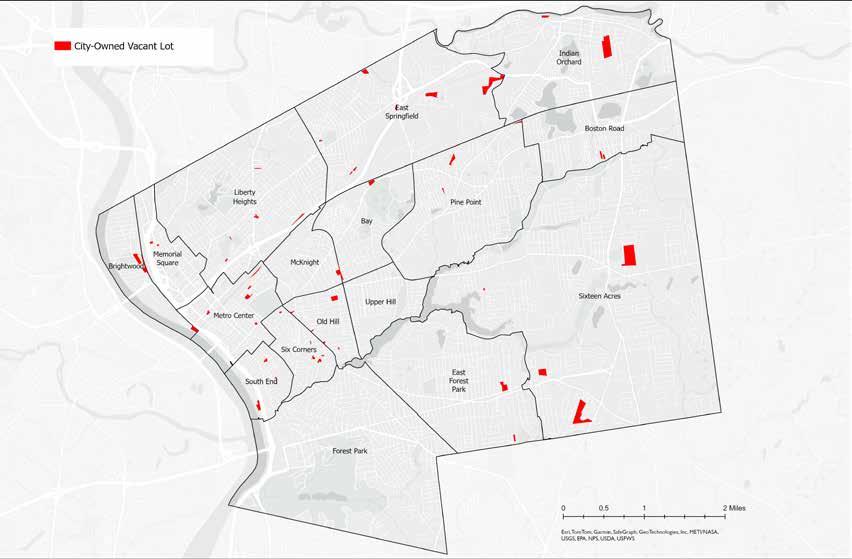
Source: MassGIS: Property Tax Parcels (2023)
The model considers lots meeting Tier 1B criteria and greater than a quarter-acre in size to be suitable for community farming. This map shows the fifty-four City-owned vacant lots identified as potential community farm sites. The model does not identify any suitable lots for community farms in the neighborhoods of Upper Hill or Forest Park based on the criteria used.
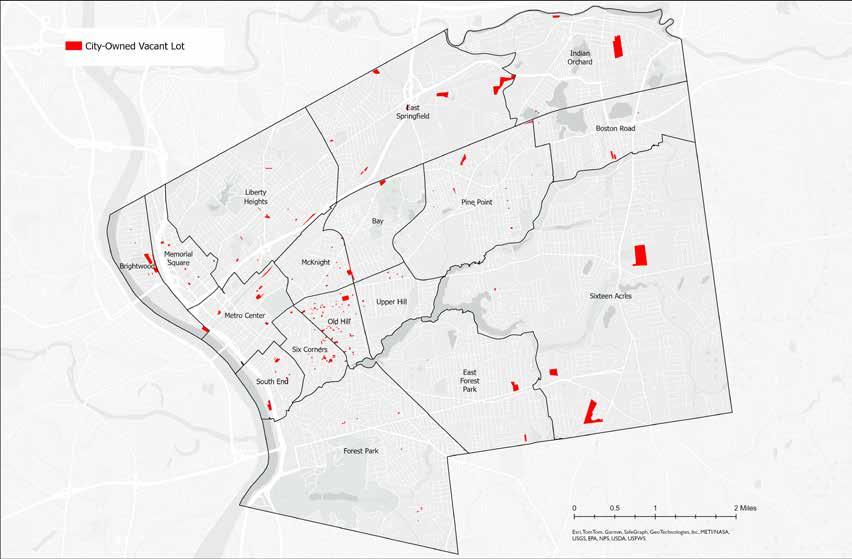
Source: MassGIS: Property Tax Parcels (2023)
The model considers lots greater than 1,000 square feet to be a suitable size for urban orchards. This map displays the 211 Cityowned vacant lots identified as potential urban orchard sites. The model identifies suitable sites for urban orchards in every neighborhood of Springfield.
The size requirement for urban orchards is the most lenient of the three different types of food production explored in this report, with a relatively small minimum square footage and no cap on how big the lot can be. Therefore, the model returns the most results for urban
orchards in every neighborhood of Springfield. Lots identified as most suitable for urban orchards or community farms with no maximum size requirement may be large enough to support multiple types of food production on them. Therefore, while the size requirements help identify the lots that are the most suitable for each of the three types of food production, the lots identified as suitable for one type of food production may be used for other types of food production as well.
The criteria listed in Tier 2 of the model are shown in a series of maps on the following pages. In this section of the report, public health outcomes and factors that contribute to public health are used to help identify a focus area of the neighborhoods whose health and wellbeing would benefit the most from increased access to food production sites. Remaining lots that meet Tier 1A and 1B criteria are not eliminated in this stage of the model.
The rationales for choosing each of the criteria in Tier 2 are as follows.
• In an area with low vehicle ownership: It is important to site community gardens, community farms, and urban orchards in areas that people can access. In developing the focus area, the model selects neighborhoods where vehicle ownership is lower than average so that residents without vehicle access have the opportunity to participate in and benefit from urban agriculture close to home.
• In an area with limited access to green space due to impervious surfaces and low tree canopy: Studies show that limited access to green space and low tree canopy coverage can lead to poorer physical and mental health outcomes (How Parks and Green Spaces Can Improve Your Health). In an effort to identify areas that could benefit from increased green space through urban agriculture, the model selects neighborhoods where impervious surface percentage is high and tree canopy cover percentage is low to be a part of the focus area.
• In an area with high surface temperature: High heat indexes increase the ozone formation, resulting in poorer air quality and increased health effects (UCAR Center for
Science Education 2024). The model prioritizes neighborhoods where heat indexes are highest to encourage increased greening and cooling of these areas through urban agriculture.
• In an area with high chronic disease rates (asthma, diabetes, cardiovascular, obesity, etc.): Diet is a major factor in determining the severity of many different chronic diseases. The model prioritizes neighborhoods where chronic disease rates are highest in an effort to increase access to healthy foods through increased food production in these neighborhoods.
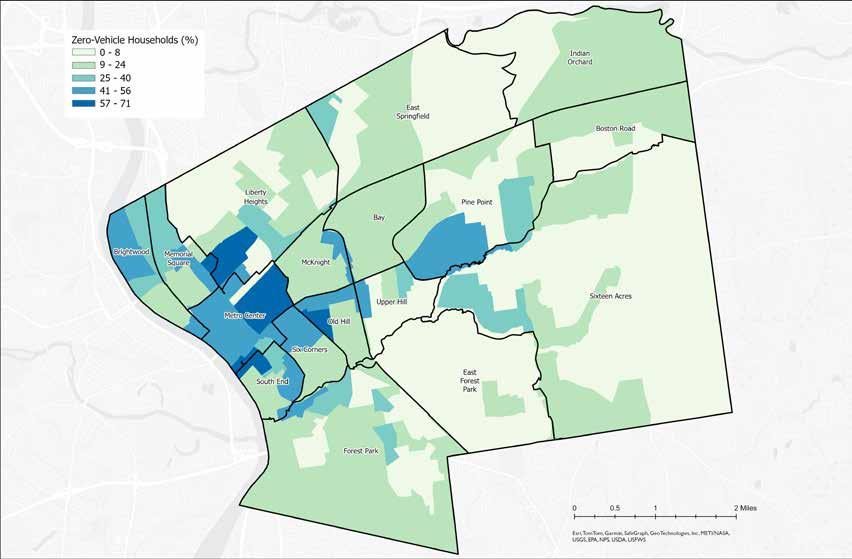
Source: 2020 Census Data
The national average for households with no vehicles owned is 8% (Forbes). In Springfield, many areas are equal to or below this average (whitish-green), while other portions of the city are well above it, with percentages two to eight times the national average. Portions of Liberty Heights, Metro Center, South End, and Old Hill have the highest rates of households without vehicles, up to 71%.
Being burdened by numerous heavy grocery bags while walking or riding the bus long distances is an extremely difficult or impossible task for many individuals.
Rightfully, such individuals are hesitant to make the trip to larger grocery stores, typically farther away, without a personal vehicle, and must instead buy their food in nearby, smaller markets or convenience stores with limited options. Considering neighborhoods with the highest rates of zerovehicle ownership as key areas for food production sites addresses this issue, as gardens offering fresh, nutritious produce could be just a block or two away from home.
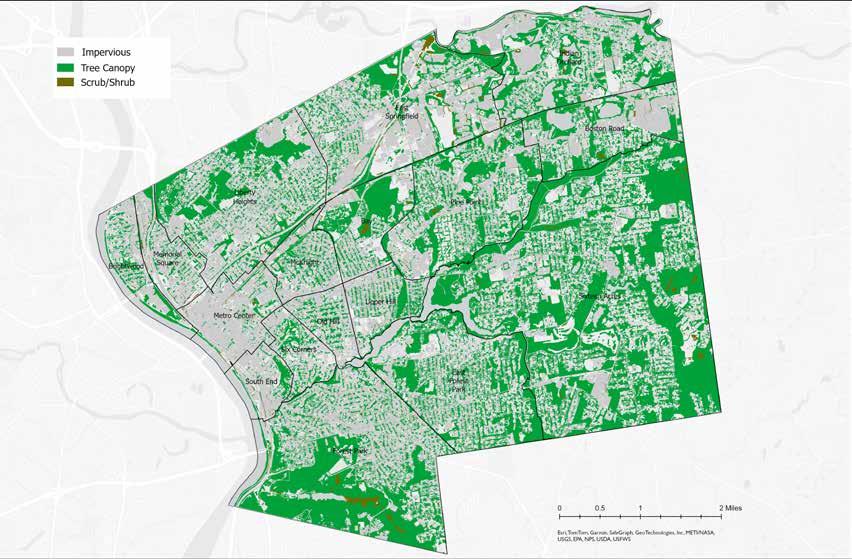
Source: NOAA Data Access Viewer: Impervious Surfaces (2021), Canopy Cover (2021)
Impervious surfaces are “any hard surface that prevents or hinders the absorption of water into the soil, or that causes reduced quality of runoff water, or causes water to runoff in greater quantities or at greater flow rates than the natural surface” (“Impervious Surfaces Definition”). Examples of impervious surfaces include rooftops, roads, and parking lots. Areas with dense impervious surface coverage (define) are congregated on the western side of the city, with Memorial Square, McKnight, Metro Center, Old Hill and South End containing more than 50% impervious surface cover each, as shown in the graph.
Neighborhoods with the highest percentage of tree canopy coverage are congregated in the southern and eastern portions of the city, with Forest Park, East Forest Park, and Sixteen Acres containing more than 50% tree canopy cover each.

highest impervious surface coverage and the lowest tree canopy coverage are prioritized in the model to help define the focus area.
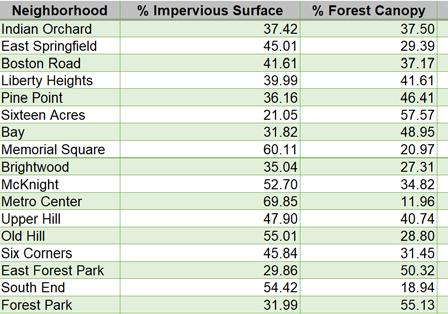
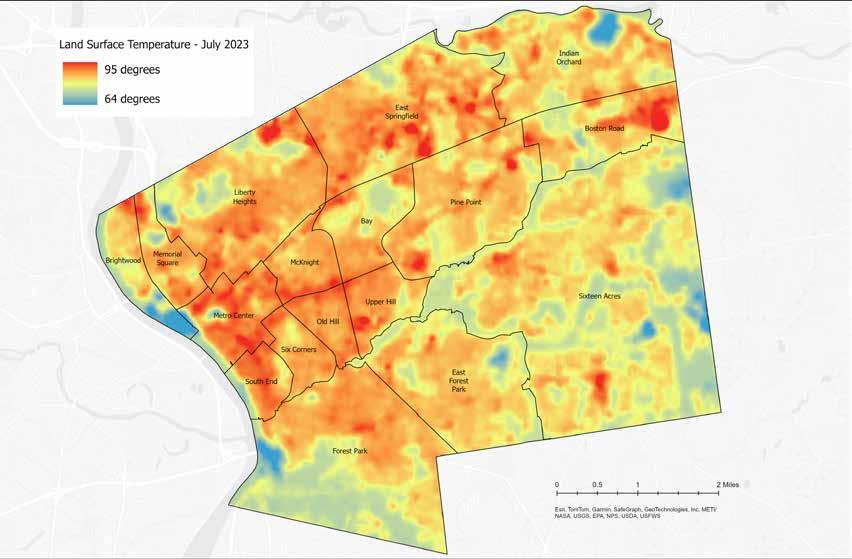
Source: LANDSAT8; Median Surface Daytime Temperatures (2023)
Land surface temperature is a measurement of how hot the ground or any other surface is to the touch. It is different from air temperature because surfaces heat and cool more quickly. This land surface temperature map depicts the average daytime temperatures that were measured over the month of July 2023. The warmest temperatures are red, the coolest are blue, and the more moderate temperatures are orange and yellow. The warmest temperatures are focused in Metro Center and South End, with other hot spots along a diagonal that extends to Indian Orchard in the northeast. The coolest areas are along water bodies and the southeastern edge of the city.
The hottest areas of the city correspond with the highest percentage of impervious surface and the lowest percentage of tree canopy cover. The red, hot areas northeast of the city center are industrial centers that include primarily parking lots and building rooftops. This infrastructure absorbs the sun’s radiation more than natural landscapes like forests and water bodies do. High heat indexes also increase the ozone formation, resulting in poorer air quality (UCAR Center for Science Education 2024). This map helps identify which areas of the city could benefit the most from increased “greening” through urban agriculture.
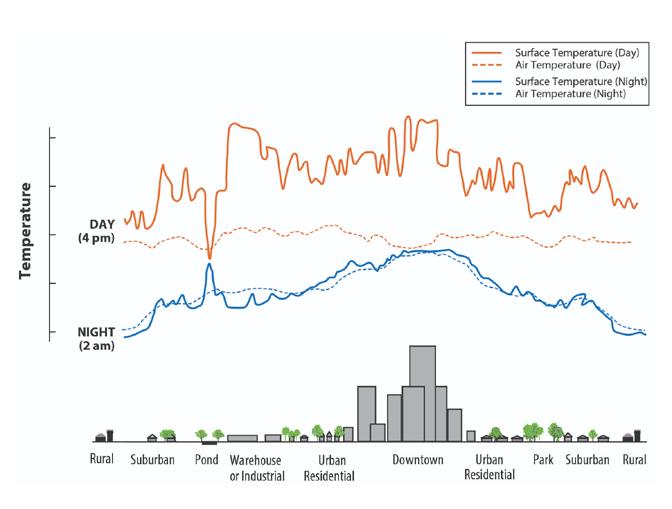
Source: https://www.epa.gov/heatislands/learn-about-heat-islands
This heat island diagram demonstrates how surface temperatures vary from atmospheric air temperatures during the day and night. The extreme dips and spikes in surface temperature, which are similar to the wide ranging temperatures recorded in the map on the left, show that bodies of water, parks, and open land do not absorb the sun’s energy as do buildings and impervious surfaces. This affirms why green and blue infrastructure is so important in creating cooler areas within a city.
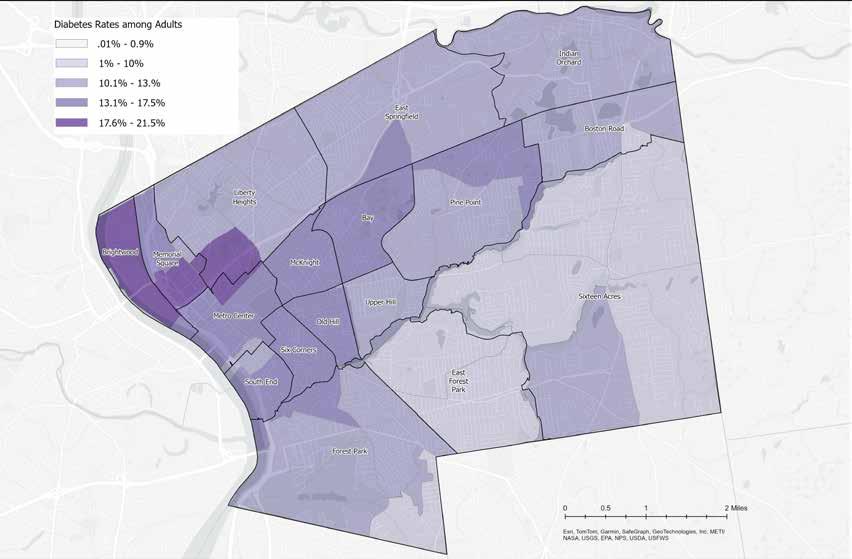
Source: CDC: Interactive Atlas of Heart Disease and Stroke: Diagnosed Diabetes Rates among Adults, 20+ (2019)
Diabetes is a disease that occurs when blood sugar exceeds normal levels within the bloodstream, caused by a lack of insulin in the body. This map of Springfield shows the rates of diabetes among adults in census tracts across the city based on 2019 U.S. Census data. The highest levels are indicated in the darkest purple color in Brightwood, Memorial Square, and the southwestern corner of Liberty Heights. Other high levels are in Metro Center, McKnight, Bay, Old Hill, Six Corners, and South End.
Diabetes rates have been rising in the U.S. for the last two decades, and show no signs of
abating (Diabetes Research Institute Foundation 2023). The disease does not affect populations equally. Variables like poverty level and race influence diabetes rates as they coincide with a lack of access to healthy affordable foods and health care services, and exposure to environmental toxins (Gaskin 2014). While the 2021 Massachusetts average is 7.8%, the highest rate for adults in Springfield is a staggering 21.5% according to the census data. Overlaying City-owned vacant lots with health statistics in the city indicates areas where more urban agriculture, and thus fresh food options, should be focused.
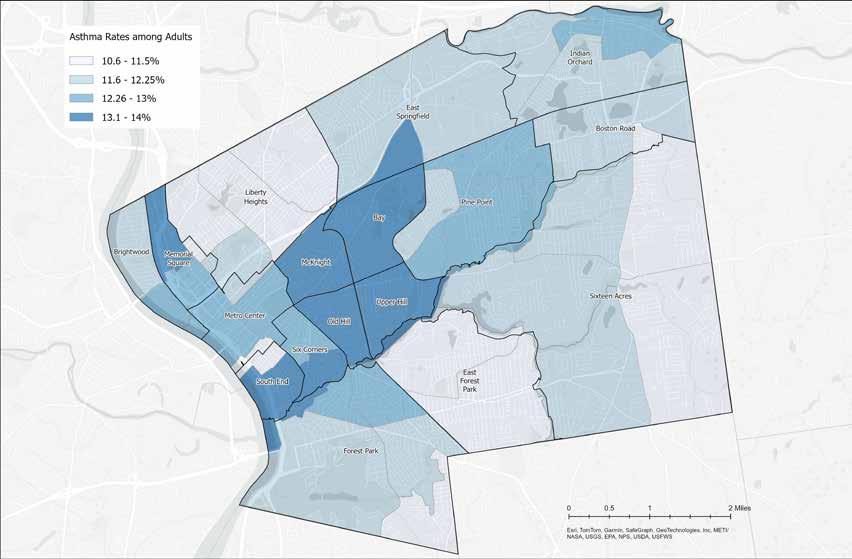
Source: CDC: 500 Cities: Current Asthma among Adults Aged >=18 (2019)
Asthma is a chronic disease that causes inflammation and swelling in the airways. In 2019, the year that Springfield was ranked the number one “asthma capital” of the U.S. by the Asthma and Allergy Foundation, the prevalence of asthma among adults in Springfield ranged from 10.6% to 13.9% according to CDC statistics (Asthma and Allergy Foundation of America 2019). The areas with the highest rates are in McKnight, Bay, Upper Hill, Old Hill, and portions of Memorial Square, Six Corners, South End, and East Springfield.
Asthma rates are not the same across demographic groups, as Blacks, Puerto Ricans, and Indigenous peoples are disproportionately diagnosed with asthma as compared to other racial and ethnic groups and subgroups. Social determinants such as socioeconomic status, education, neighborhood and physical environment, employment, social support networks, and access to health care affect the prevalence of asthma (“Asthma Disparities in America” 2023). Springfield has the largest population of Puerto Ricans in the state, with most living in Brightwood, Memorial Square, and Liberty Heights (Granberry 2020).
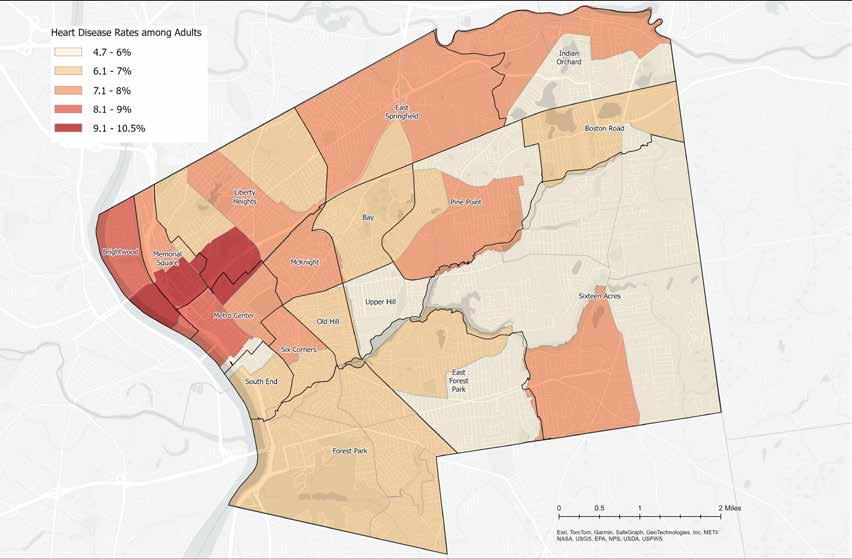
Source: CDC: 500 Cities: Coronary Heart Disease among Adults Aged >=18 years
Heart disease describes a range of conditions that affect the heart or blood vessels. The most common of which is coronary artery disease, which causes heart attacks (“NCI Dictionary of Cancer Terms”). The highest percentage of adults with heart disease in Springfield is between 9% and 10.5%, in parts of Brightwood, Memorial Square, and Liberty Heights. The second highest areas include Metro Center and other parts of Brightwood.
Heart disease is the leading cause of death in the United States. High blood pressure, high LDL cholesterol, smoking, obesity, diabetes, excessive drinking, lack of physical activity, and an unhealthy diet can all contribute to heart disease (“Heart Disease Facts” 2020). Studies have established a strong connection between food insecurity and a higher risk of developing cardiovascular disease (Liu 2021). Increasing the availability of healthy foods in areas where there is a high prevalence of the disease is one way of addressing the problem.
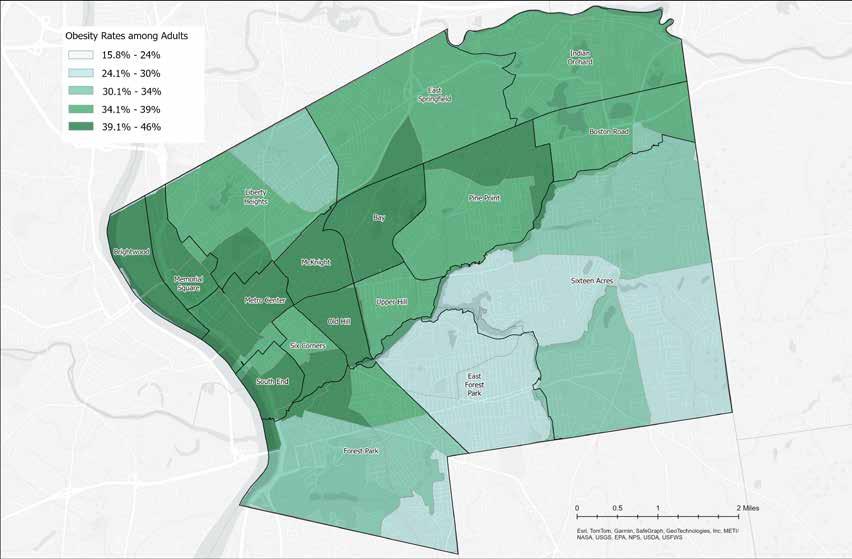
Source: CDC: Interactive Atlas of Heart Disease and Stroke: Obesity Rates among Adults, 20+ (2019)
Obesity is a complex health issue that can be both a chronic health condition as well as a serious risk factor for other health conditions. Obesity puts individuals at an increased risk for many poor health outcomes, including diabetes, heart disease, stroke, osteoarthritis, and some cancers. (“Health Effects of Overweight and Obesity” 2022). In Springfield, the neighborhoods with the highest percentage of obesity include Brightwood, Memorial Square, Metro Center, McKnight, Bay, Old Hill, and significant portions of South End, and Six Corners.
The areas of Springfield where obesity rates are highest strongly correlate with the previous health maps. Although obesity is influenced by genetics, diet is a major factor in determining its severity. When individuals are physically or financially unable to access healthier foods, diet is no longer a personal choice.
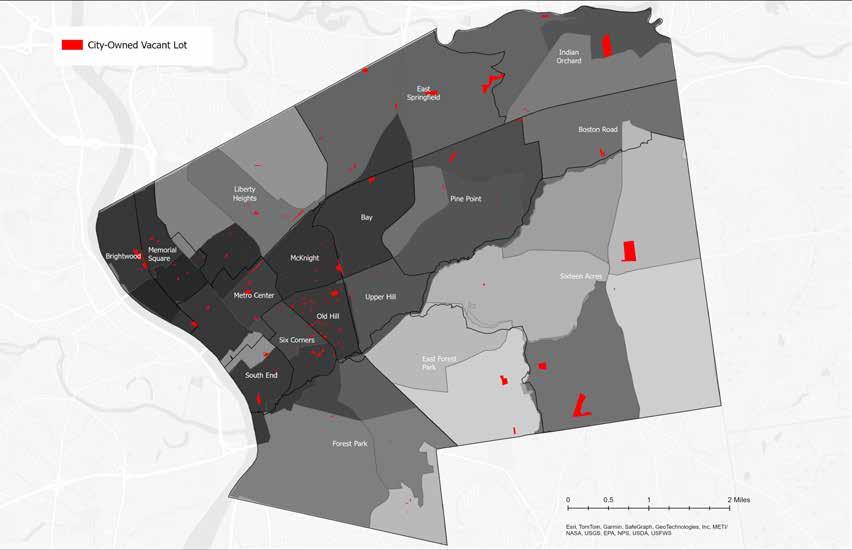
Source: CDC: Interactive Atlas of Heart Disease and Stroke: Diagnosed Diabetes Rates among Adults, 20+ (2019), 500 Cities: Current Asthma among Adults Aged >=18 (2019); 500 Cities: Current Asthma among Adults Aged >=18 (2019), Interactive Atlas of Heart Disease and Stroke: Obesity Rates among Adults, 20+ (2019); MassGIS: Property Tax Parcels (2023)
This is an overlay of all four previous health maps at 25% transparency. The darker the area, the worse the health outcome. The neighborhoods with the most severe health outcomes are Brightwood, Memorial Square, a small section of Liberty Heights, Metro Center, McKnight, Bay, Old Hill, and significant portions of Six Corners and South End.
This map, along with the rest of the maps presented in this section, informs the selection of a focus area of the neighborhoods most vulnerable to experiencing poor public health outcomes.
Based on the maps presented in Tier 2, the model identifies the neighborhoods of Brightwood, Memorial Square, Metro Center, McKnight, Bay, Upper Hill, Old Hill, Six Corners, and South End as the appropriate focus area moving forward. The focus area highlights neighborhoods where food production opportunities should be increased in an effort to better health outcomes and lessen environmental impacts that contribute to poor health. The map below shows Cityowned vacant lots that meet all of the Tier 1A
and 1B criteria, but have not yet had a size requirement applied to determine the particular type of food production that is most suitable for each lot. Of the 213 City-owned vacant lots that meet all of Tier 1A and 1B criteria, 156 of them are located within this focus area. The neighborhoods identified are the focus for Tier 3 criteria, which further refine the process for selecting suitable Cityowned vacant lots for food production.

The criteria in Tier 3 of the model are factors that aren’t always necessary for food production, but increase the ease of use of the site. These criteria will be assessed on a lot by lot basis through a mixture of GIS mapping and satellite imagery to continue to identify the most suitable lots for food production in the focus area.
The rationales for choosing each of the criteria found in Tier 3 are as follows.
• Tree coverage: Tree shade can be an obstacle to and an asset for growing food and keeping the users of the lot safe. Lots with greater than 80% tree coverage are eliminated from the model, and remaining lots are selected on a case by case basis depending on the amount of tree cover present and the location of tree cover on the lot.
• Walkability: Walkability is determined by the presence and width of sidewalks, as it is important to provide a safe walking option for users of the site. Lots with any sized sidewalk present are prioritized in the model.
• Adjacent to another vacant lot: The model prioritizes City-owned vacant lots with an adjacent vacant lot, as they offer the opportunity to expand in the future and have the potential to increase sun exposure, bettering growing conditions.
Due to time constraints, further groundtruthing efforts were not able to be completed for this report. However, the following criteria are crucial to a site’s ability to be used for food production and should inform ground-truthing.
• Water access: Access to water for irrigation is a large obstacle to establishing any type of food production site in Springfield. Though there are many water mains and service lines throughout the neighborhoods, the cost of getting lines hooked up to a vacant lot is high. This criteria requires groundtruthing to understand which lots have active service lines. Priority should be given to lots with water hook-ups in place and active service lines.
• Soil testing: It is stated in the current Community Gardens Ordinance that “if gardeners test the toxicity of soil, and results show that the soil is clean, raised beds are not required” (Springfield, Community Gardens 2012). This criteria requires ground-truthing to determine soil health. Priority for in-ground growing should be given to lots without toxicities such as high levels of lead in them. However, raised beds can be used for growing on any soils.
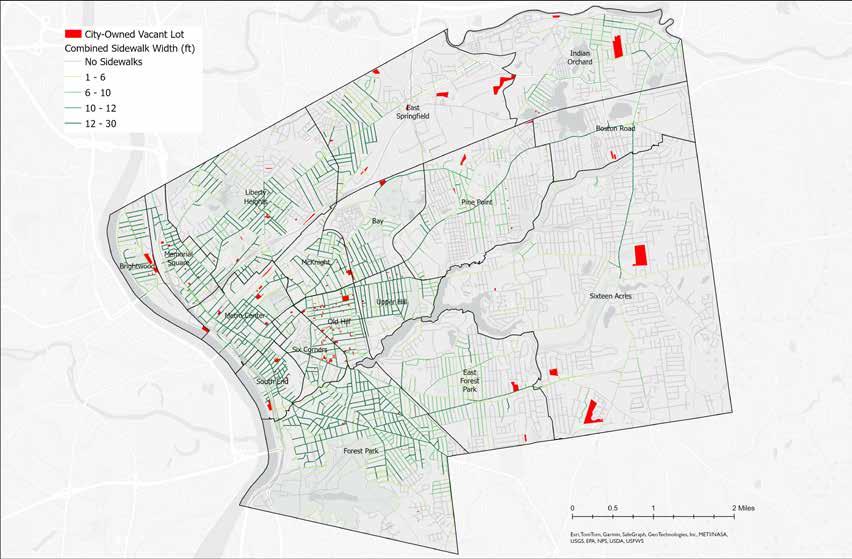
Source: MassGIS: MassGIS - MassDOT Roads (2023), Property Tax Parcels (2023)
Walkability increases both access and safety of the people who will be using the site. Within Springfield, sidewalks (shades of green) are most prevalent within the western half of the city, while areas with no sidewalks (gray) are concentrated in the eastern half. The darker the green, the wider the sidewalk (combining the sidewalks on both sides of the street). For example, a street with four-foot sidewalks on both sides is given an eight-foot value, while a street with an eight-foot sidewalk on one side and no sidewalk on the other would also be given an eight-foot value.
This map shows all City-owned vacant lots meeting Tier 1B criteria overlaid with sidewalks in Springfield. Although a larger combined sidewalk width is preferable, the model selects lots within fifty feet of any sidewalk to meet the walkability criteria.
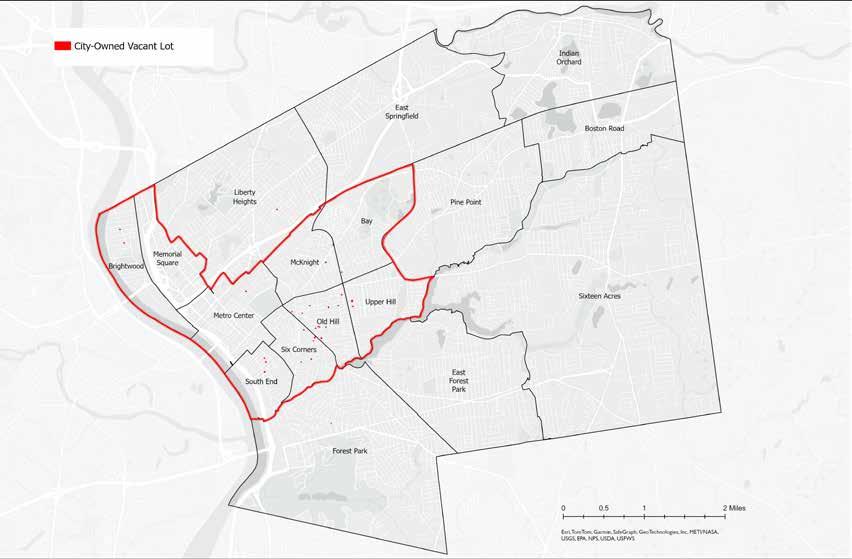
Source: MassGIS: Property Tax Parcels (2023)
After eliminating any lots with greater than 80% tree canopy coverage and within fiftyfeet of a sidewalk, the model identifies thirtythree remaining community garden sized lots within the focus area, the majority of which are in Old Hill. Satellite imagery confirms that many of these thirty-three sites look suitable for community gardening. However, further ground-truthing is required to determine their suitability.
The following lots meet Tier 3 criteria (less than 80% tree coverage, within fifty feet of a sidewalk, and adjacent to another vacant lot). Further ground-truthing is required to determine water access and soil conditions on any site identified. For the purposes of this report, these four sites are the most suitable City-owned vacant lots for community gardening.
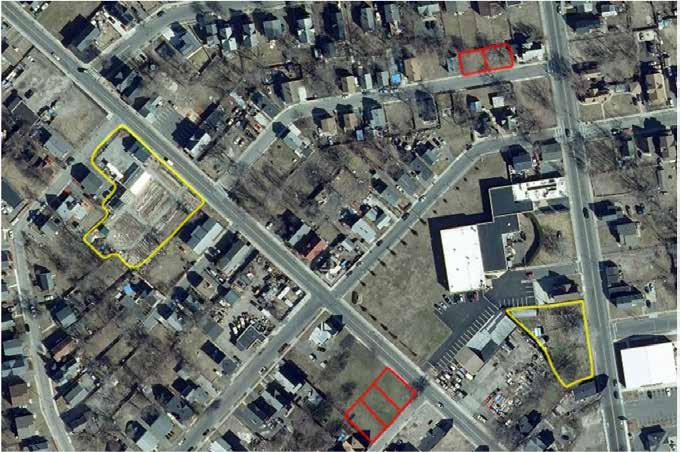
Two of the four identified sites are located on the border of Old Hill and Six Corners, and are within a few blocks from Gardening the Community’s (GTC) existing youth farm and farm store, and GTC’s existing Hancock Street community garden. The proximity of these sites to existing farms and gardens, as well as to each other, may provide opportunities for expansion of food production in this neighborhood. However, if demand for more growing space is not high enough at existing food production sites in this neighborhood, it may be more beneficial to site community gardens in a new location. This report does
not map all existing food production sites in Springfield, and therefore does not consider proximity to existing food production sites as a criterion. Without knowledge of the success of the current community garden in this neighborhood, and potential demand for more space, it is difficult to determine the benefits or drawbacks of another food production site within the vicinity of an existing youth farm and community garden. Further groundtruthing could help determine the need for more food production sites in this neighborhood.
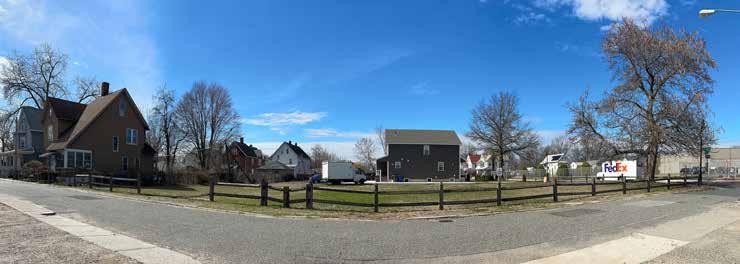
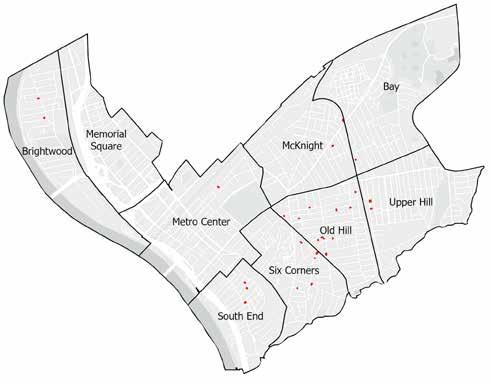
Located on the border of Old Hill and Six Corners, these three vacant, adjacent lots are in almost full sun with tree shade around the edges of the property, a benefit to both growing and working conditions on this site.
Ground-truthing highlighted that parking may be difficult at this site, as there are “No Parking” signs along the wooden fence.

Two smaller City-owned vacant adjacent lots exist on Queen Street in Old Hill. These two lots could receive more shade than the previous lots mentioned due to their proximity to houses on either side and tall trees bordering the site. These lots are located about a block from GTC’s youth farm on Walnut Street and two blocks from their community gardens on Hancock Street.

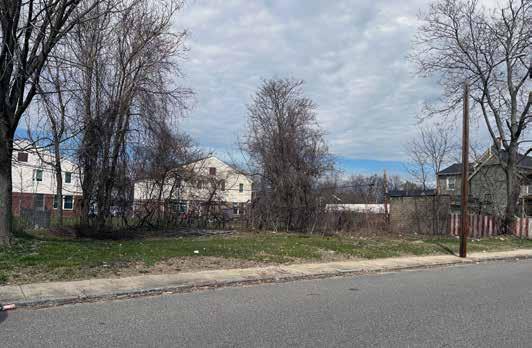

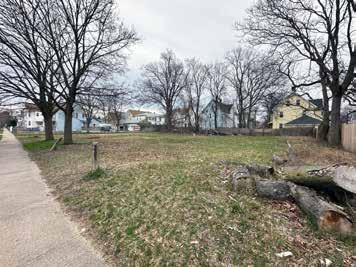
Located in Upper Hill, these two Cityowned vacant, adjacent lots offer the opportunity for community garden expansion in another neighborhood.
Ground-truthing highlighted that this neighborhood has a mixture of single-family homes and older buildings that have been renovated into apartments. The high density of residents in this neighborhood could make this a potentially great site for community gardening given resident interest. There are some remnants of brick and stone on site, and further ground-truthing is required to determine the extent of said remnants.
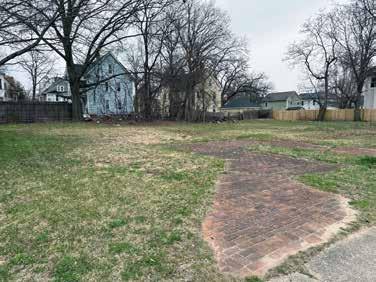

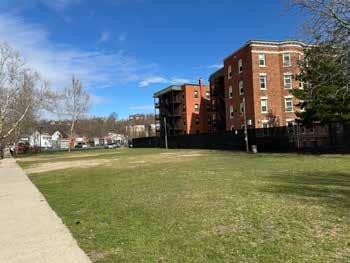
Two City-owned vacant adjacent lots exist on Adams Street in South End. This site provides near full sun, which makes for great growing conditions, and a wide sidewalk is present, improving walking conditions. Ground-truthing highlighted that this site has high visibility, is in a neighborhood with mixed and high-density housing, and has a water hook-up on site, making this a potentially great location for community gardening. Further groundtruthing is required to determine whether or not said water lines are active.
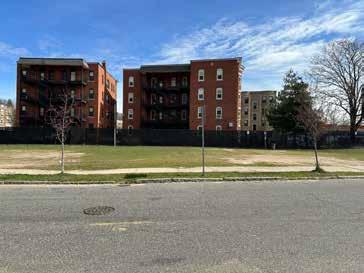
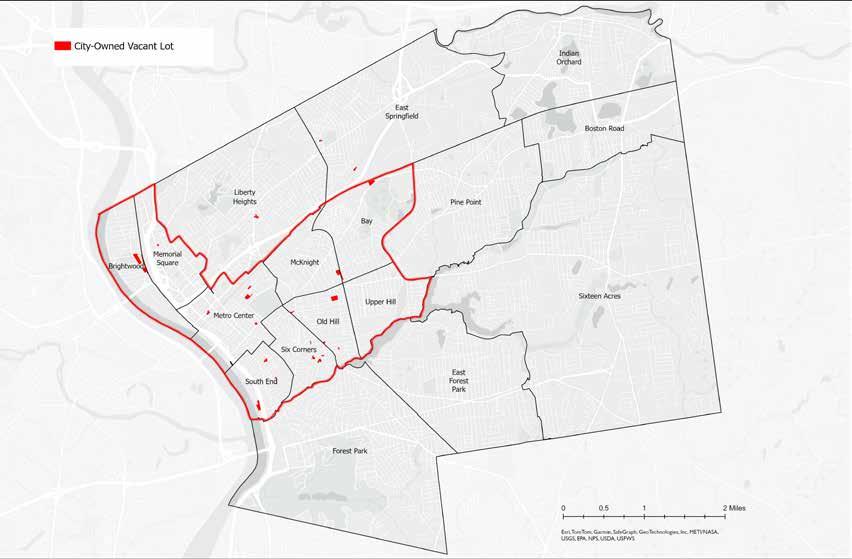
Source: MassGIS: Property Tax Parcels (2023)
After eliminating any lots with greater than 80% tree canopy coverage and including lots within fifty-feet of a sidewalk, the model identifies twenty-three remaining community farm sized lots within the focus area. Satellite imagery confirms that four lots in Six Corners and one in Memorial Square look suitable for community farming. The rest of the twentythree identified lots have parking lots or buildings on them, and were not eliminated from the model due to inaccuracies in the data.
The following lots meet Tier 3 criteria (less than 80% tree coverage and within fifty feet of a sidewalk). Vacant lot adjacency was not used as a criterion for community farms. The five sites identified below are the most suitable City-owned vacant lots for community farming, though further ground-truthing is required to confirm their suitability and determine water access and soil conditions on site.
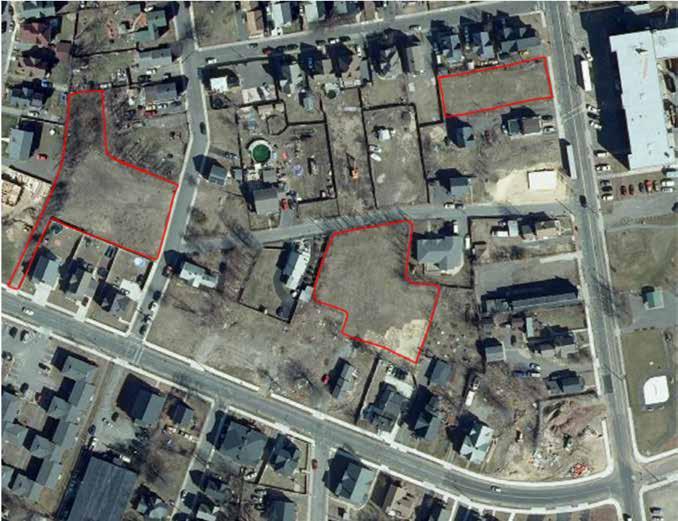
The three outlined sites in Six Corners may be suitable for community farms. The proximity all of these lots have to one another may offer opportunities for expansion as needed. However, if demand for more growing space is not high enough in this neighborhood, selecting only one of these sites for community farming may suffice. Additionally, ground-truthing confirmed the establishment of multiple new houses in this neighborhood. Although the influx of residents in this neighborhood may increase the need for food production, these three identified lots may be at risk of development for housing in the near future.
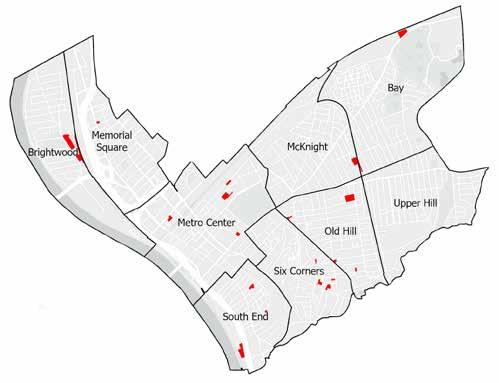
The lot identified on Clark Street in Six Corners is shown to the right. This lot provides nearly full sun, which makes for great growing conditions. This parcel was also mentioned as having good potential for urban agriculture by Tom McCarthy, the Clean City Manager for the City of Springfield, who oversees the maintenance of ninetysix City-owned vacant properties (Sullivan).
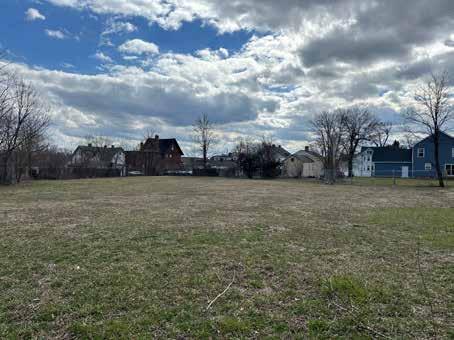

The lot identified on Central Street in Six Corners is shown here. This lot provides nearly full sun, which makes for great growing conditions. This is one of the four contiguous lots that were identified as having the highest potential to become a commercial farm in the earlier food access report Food in the City (2014, 41). The other three lots identified in Food in the City are also situated along Central Street but have since been turned into residential homes.
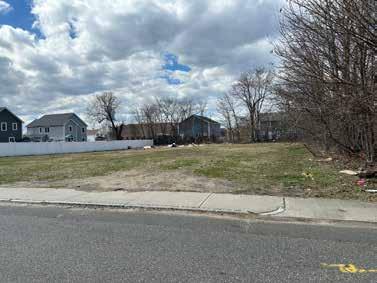
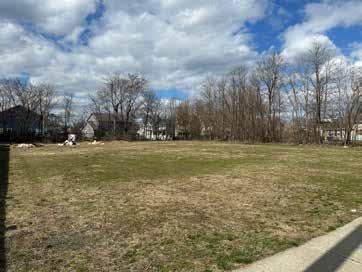

The lot identified on Hancock Street in Six Corners is shown here. This lot was one of the three sites identified for community/youth farming in Food in the City (2014, 97). It provides nearly full sun, which makes for great growing conditions, and is located across the street from newly converted mixed-income apartments in the former Elias Brookings Elementary School that was severely damaged in the 2011 tornado (OSRP 2022, 12). The establishment of a community farm across the street may provide opportunities for residents to be engaged with urban agriculture close to home.
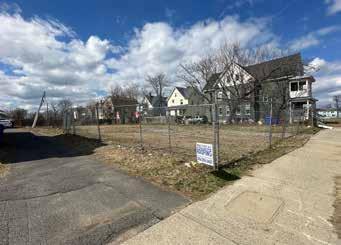
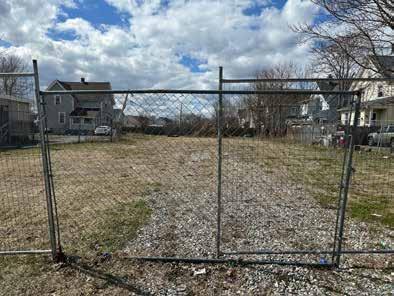
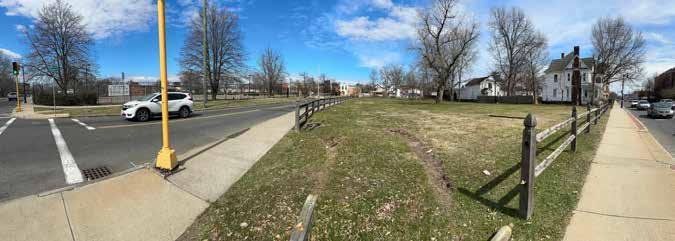

This City-owned vacant lot on Walnut Street and Union Street in Old Hill is regularly maintained and meets all criteria for a potential community farm. The site has a mixture of sun and shade, creating benefits for growing conditions and working conditions. Ground-truthing highlighted that parking is difficult in this area due to high traffic volumes, and that a commercial site is for sale across the street. The proximity of said commercial lot could provide opportunities for parking, selling food, or further storage of farm equipment and vehicles.
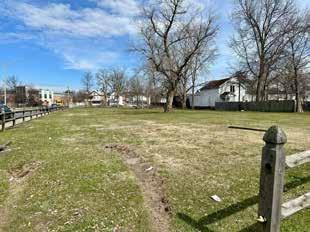
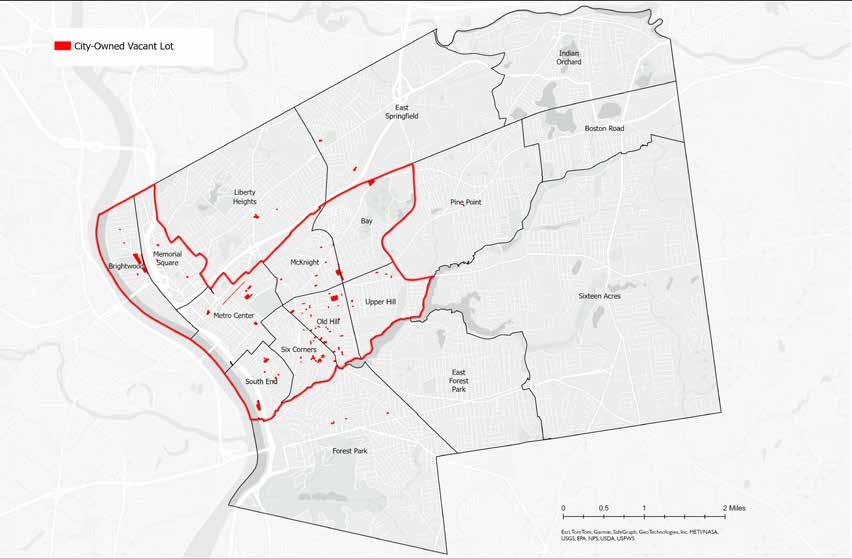
Source: MassGIS: Property Tax Parcels (2023)
After eliminating any lots with greater than 80% tree canopy coverage and including lots within fifty-feet of a sidewalk, the model identifies ninety-three urban orchard-sized lots within the focus area. Because of the 1,000 square foot minimum size requirement, identified urban orchards include a range of mid-sized lots between 5,000 and 10,200 square feet that were excluded from the identified community gardens and community farms due to size criteria. Given that the size requirement for urban orchards has no maximum limitation, lots identified as most suitable for urban orchards may be large
enough to support multiple types of food production on them. Conversely, sites identified as most suitable for community gardens or community farms may also be able to host a small orchard on them. Further ground-truthing and preference of user will determine the placement of urban orchards in the focus area.
This City-owned vacant lot on Hayden Street in Bay meets all criteria for a potential urban orchard. This parcel was also mentioned as a good potential lot for urban agriculture by Tom McCarthy, the Clean City Manager for the City of Springfield, who oversees the maintenance of ninety-six City-owned vacant properties (Sullivan).
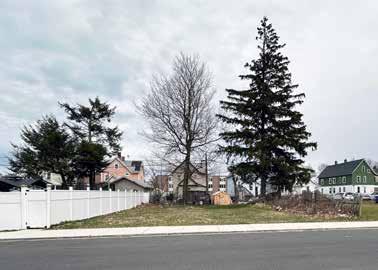
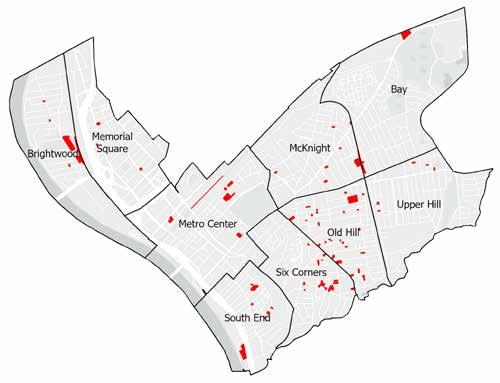
This City-owned vacant lot on Dwight Street and Grosvenor Street in Memorial Square meets all criteria for a potential urban orchard, and provides full sun, making for great growing conditions on site.
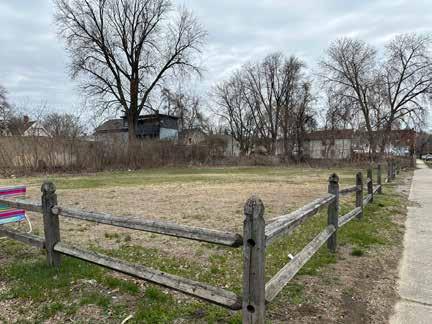

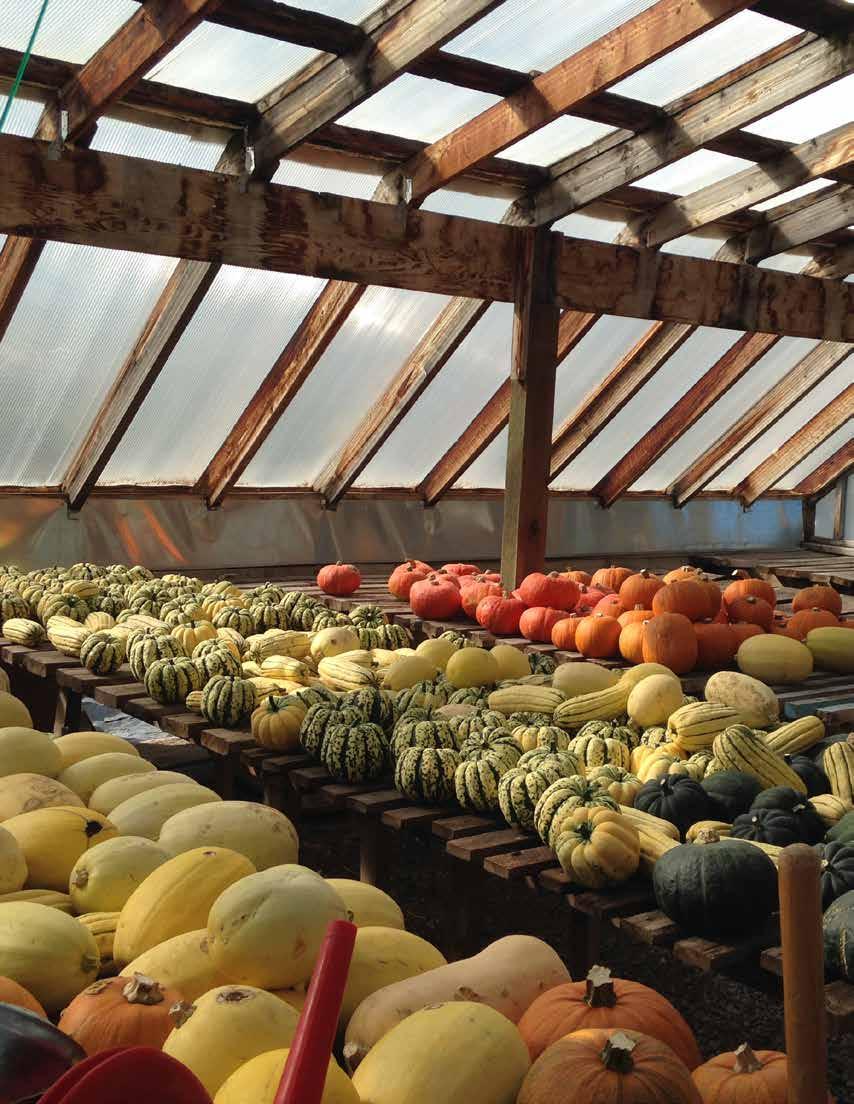 Source: Aspen Anderson
As outlined in the “Food Access and Food Apartheid” section of the report, access to fresh, healthy food is an ongoing struggle for residents of Springfield. This section of the report aims to increase access by identifying potential sites for farmers markets and farm stands in the focus area identified using Tier 2 methodology. Vendors at these sites, as well as at mobile markets, farm stores, and CSA farm share programs, are eligible to become HIP-authorized, and therefore make healthy foods not only available, but more affordable than if residents were to buy them from a grocery or convenience store where HIP is not accepted. For this reason, it is important to encourage the expansion of HIP-eligible food access sites in the most vulnerable areas of Springfield.
Farmers markets and farm stands, though both food access sites, serve somewhat different purposes in a community. Farmers markets generally serve two or more vendors, and usually have a social element to them, acting as an event that can bring together farmers, bakers, artisans, and community members. They also sometimes offer activities for kids or community resources. Farm stands, on the other hand, host one vendor, and are an opportunity first and foremost for that farmer to sell their products. Two other types of food access sites are mobile markets and community supported agriculture (CSA) pick-up locations. This report does not identify locations for either of these types of food access sites. Similarly to
The Massachusetts Healthy Incentives Program (HIP), run by the Department of Transitional Assistance (DTA), is an automatic Supplemental Nutritional Assistance Program (SNAP) benefit for all SNAP users. While SNAP benefits are eligible at most food distribution sites from grocery stores to bodegas, HIP is available only at farm-affiliated food access sites. HIP incentivizes buying from local farmers by putting “money back on your EBT card when you use SNAP to buy healthy, local fruits and vegetables from HIP farm vendors.” Depending on household size, monthly HIP incentives range from $40-80 (“Massachusetts HIP”).
The use of HIP “helps build an economically sustainable food system, helping make healthy food available to more people, and supporting farmers to be able to charge fair prices for what they grow, allowing them to better steward their land, protect natural resources, and contribute to the local economy” (Massachusetts Food System Collaborative 2024). HIP was initially instituted as a pilot-program in Hampden County from 2011 to 2012. It was launched as a statewide program in 2017, and has continually grown in use since its inception.
farm stands, mobile markets generally serve one vendor who sells their product out of a vehicle or at a small pop-up stand. However, where farmers markets and farm stands benefit from being located in the same place every week, mobile markets provide the opportunity to be agile, changing location and operating hours to meet demand. Community
Supported Agriculture, or CSA, generally refers to a “share” of produce or other products that customers pick up directly from a farmer each week. CSA’s require up-front payment for a set number of shares at the beginning of the season, and therefore are not available as general food access sites for community members to buy produce from without already being signed
up for a share. For the purposes of this report, only locations for potential farmers markets and farm stands will be identified.
In identifying the most suitable location for farmers markets, three categories of criteria should be considered: mappable criteria, nonmappable social criteria, and non-mappable physical criteria. The model created for this report examines mappable criteria and displays the outcomes through a series of maps. The other two categories of criteria (non-mappable social and physical) require site analysis and engagement with community members, and are not examined by the model. However, it is recommended that the latter two categories of criteria be evaluated before instituting new farmers markets in Springfield.
Using the mappable criteria outlined on the following pages, the model performs separate analyses on City-owned vacant lots and centers of community as it assesses their suitability for hosting a farmers market. Cityowned vacant lots that do not meet the listed criteria are eliminated from the model.
As mentioned in the Existing Conditions section of this report, centers of community are located in every neighborhood of Springfield, and offer valuable social and physical resources. These resources also meet several of the non-mappable social and physical criteria. Because centers of community are existing entities that already meet several of the criteria used to select Cityowned vacant lots, they are all assumed to be suitable for hosting a farmers market, and
therefore the model does not recommend particular centers of community nor eliminate centers of community based on any of the criteria listed. Instead, the model maps centers of community in relation to two criteria.
Centers of community identified in the model include places of worship, hospitals, health centers, K-12 schools, universities, libraries, and community centers. At the Massachusetts Commercial Urban Farming Symposium 2024, presenters on the panel “Developing a Market: Case Studies of Farm Stands/Markets, CSA, and Mobile Markets” noted that it can be confusing to customers if farmers markets are located at a site where free food is being distributed, such as a food pantry or a senior center (“Developing a Market”). For this reason, these types of organizations are not included in the model’s “centers of community.”
The criteria used to determine suitable farmers market sites was informed by the Springfield Food Policy Council (SFPC), state law, and recommendations from presenters at the Massachusetts Commercial Urban Farming Symposium on March 8, 2024 in Lowell, MA.
The rationales for choosing each of the criteria in the three categories (mappable, nonmappable social, and non-mappable physical), and for the two different types of sites (Cityowned vacant lots and centers of community) are as follows.
• Owned by the City of Springfield: As outlined by the client, identifying and communicating with the owners of privatelyowned lots can be a difficult process, making land transfers time-intensive and complicated. For this reason, the model selects City-owned vacant lots.
• Not in FEMA 100-year floodplain: Given that climate change may increase flood frequencies, the model eliminates lots within the 100-year floodplain designated by the Federal Emergency Management Agency (FEMA). Elimination of these sites helps to prioritize lots with a lower risk of flooding, making them enjoyable and usable food access sites for years to come.
• Not in NHESP priority habitat: To avoid disturbing or destroying important habitat, the model eliminates lots within priority habitat areas identified by the National Heritage and Endangered Species Program (NHESP).
• Not in a DEP wetland: Many delineated wetlands are protected by both federal and state laws that require buffer zones to preclude certain activities. Although farmers markets can be permitted in wetland buffers, obtaining a permit to do so can be a timeintensive process. Therefore, the model eliminates lots located within wetlands and their 100 foot buffer zones. The Department of Environmental Protection (DEP) wetlands layer used in this analysis does not show all current delineated wetlands, only likely wetland areas.
• Slope is no more than 5%: It is important that farmers markets are accessible to customers and vendors with different ability levels, and for the ground where vendors locate their tables and tents to be relatively flat. This criterion is <5%, as this is generally regarded as the maximum accessible slope for people using wheelchairs when there are no handrails in place. The model selects sites with at least 500 square feet of accessible slopes.
• Not a Tier Classified Chapter 21E Site: Chapter 21E refers to the Massachusetts Oil and Hazardous Material Release Prevention and Response Act. Property that is designated by the Commonwealth as “Chapter 21E” has been identified and classified as hazardous and has not yet undergone sufficient remediation. Because the contaminated land can pose a significant risk to human health and the environment, it should not be used for farmers markets. Examples of Tier 1 imminent hazard contaminants include cyanide, petroleum, and lead.
• Access to Public Transportation: In order to make farmers markets more accessible to people with or without vehicle access, it is important to select lots that are within walking distance to public transportation, which includes the PVTA bus lines in Springfield. The model selects lots within a quarter mile of Springfield’s bus lines.
• Doesn’t Have Structures: Feedback from the City informed the decision to eliminate lots with structures on them, as these are lots that are more likely to be used for future housing use.
• Not Competing with Other Farmers: It is important to consider the location of existing farmers markets, farm stands, and mobile markets when proposing new farmers markets. In order to not compete with existing vendors, the model selects city-owned vacant lots that are more than a half-mile away from these food access sites.
• Greater than a Quarter-Acre: General size requirements for each farmers market vendor’s stall is ten feet by ten feet (“How to Run a Farmers Market”). In addition, vendors may need space to park vehicles on site, and there should be ample open space for customers to move freely. With all of these factors in mind, the model eliminates all sites less than a quarter-acre in size.
Centers of community are considered suitable places to host farmers markets. Because centers of community are already established, the model evaluates them using only two of the criteria listed for City-owned vacant lots. These criteria include access to public transportation and not competing with other farmers.
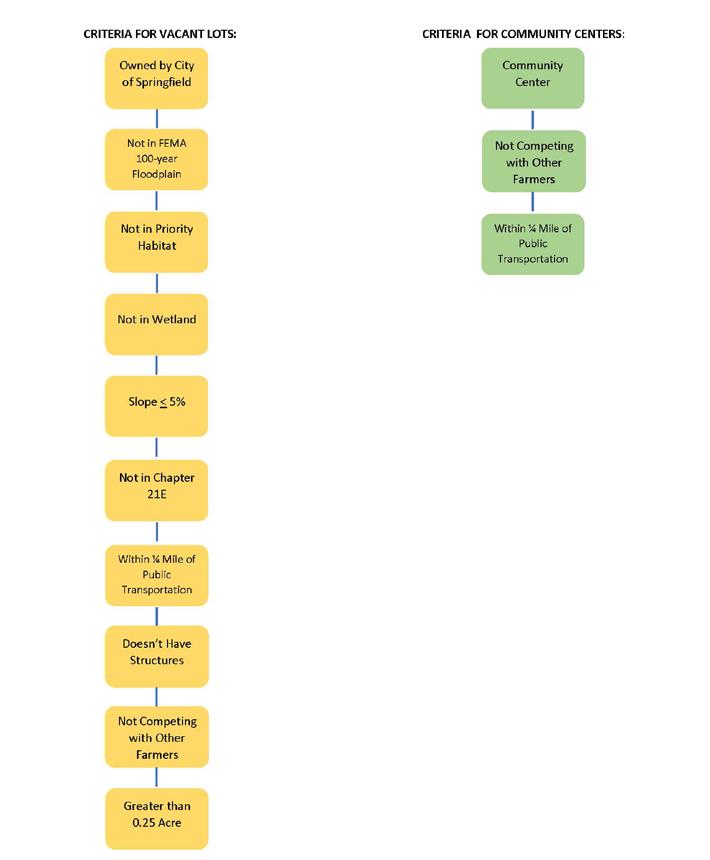
These are additional criteria that may influence the location of a farmers market. The criteria below cannot be easily mapped an are therefore not included in the model to identify vacant lots and centers of community suitable for farmers market locations. Assessing whether sites meet these criteria will rely on site analysis and conversations with existing organizations.
• Access to Restrooms: State law requires that farmers markets must have access to restrooms (“How to Run a Farmers Market”). This criteria would likely be met if the market was sited at or near a center of community, otherwise the site would require placement of permanent or temporary restrooms.
• Access to Hand-Washing Facilities: State law requires that farmers markets must have access to hand-washing facilities (“How to Run a Farmers Market”). This criteria would likely be met if the market was sited at or near a center of community.
• Access to Electricity: Farmers market vendors with heating or refrigeration devices for their products may need access to electricity at their stand. This criteria would likely be met if the market was sited at or near a center of community.
• Convenience for Vendors: Another factor that increases the suitability of a site for farmers markets according to presenters on the panel “Developing a Market: Case Studies of Farm Stands/Markets, CSA, and Mobile Markets” is the ability for vendors to store materials, such as tents and tables, on site (“Developing a Market”). This allows vendors to create more room for their products in their
vehicles. This criteria has a greater chance of being met if the market was sited where a building or storage shed is already in place, such as at a center of community.
• Parking: It is important that safe and designated parking for vendors and customers be available at farmers markets. Parking for vendors must be large enough to fit box trucks, and is preferable if it is close to or behind each vendor’s stall. Parking for customers, whether designated or on the street, should be located within a quarter mile of the site to ensure walkability. Some or all of this criteria would likely be met if the market was sited at a center of community, as many have existing parking lots.
• Environment: Because vendors are likely to have tents and tables set up, it is important to consider the surrounding environment such as sun and shade availability, or features that might contribute to wind tunnels. It is also important that the site be a safe and open space for customers to enjoy.
• Visibility: Siting a farmers market on a corner lot or a busier street may increase site visibility and draw more customers in. A corner lot also allows for increased sign placement advertising the market.
• Insurance: Many times, farmers markets and farmers market vendors need a certificate of liability insurance in order to sell their products. Although state law allows vendors “to sell their fruits, vegetables or other farm products raised or produced by them or their family at farmers markets without obtaining a hawkers’ or peddlers’ license” (Mass.Gov), the City of Springfield requires a license for “any person engaged in selling or offering for sale fruits and vegetables, either at wholesale or retail, without having a regular place of business for the sale of such products in the City during 12 months of the year and during reasonable hours of every business day in the year” (City of Springfield).
• Designated Site Coordinator: The Regional Environmental Council (REC) from Worcester, MA, has experience running and participating in farmers markets, and recommends having a designated site coordinator at a farmers market (“Developing a Market”). This person may be in charge of opening the building for access to restrooms each week and creating a layout for vendor stalls. Presenters on the panel “Developing a Market: Case Studies of Farm Stands/Markets, CSA, and Mobile Markets” noted that it is preferable that the site coordinator knows their community well and is able to help with outreach about the market in the community. It was also suggested that the site coordinator help provide translation services for vendors (“Developing a Market”).
• Consistency (Time, Place, Day): It is important to keep consistent the location, day, and time of a farmers market each week in order to establish a simple and reliable food access site for customers.
• Walkability: As customers may be walking up to a quarter mile from their parking spot or bus line, it is important that sidewalks are available around the site to ensure safe foot traffic to and from farmers markets.
• Community Building: One of the social benefits of farmers markets is their ability to help build community. A market with many vendors, artists, and activities may feel more like an event in itself, drawing in community members to come together around food.
Because farm stands are somewhat transient in nature, and the fact that they generally only serve one vendor, there is a wide range of possibilities for where they could be sited. Much of the critical criteria is the same as the criteria outlined for farmers markets. For example, farm stands should still be located within a quarter of a mile to a bus route for ease of access, and should not compete with existing farmers markets or farm stands. In addition, farm stands are often located on site at community farms so as to decrease the need for hauling produce off site to sell. For this reason, farm stands should be sited on any City-owned vacant lots that were identified as most suitable for community farms in the Identifying Parcels for Food Production: Tier 3 section of this report, so long as a community farm is established there.
“During the pandemic, when the grocery stores did not have their shelves fully stocked[…]we saw a tremendous increase in individuals visiting local farm stands or farms setting up pick up locations, or different delivery models, like home delivery[...]I think a lot of that interest has continued in shopping locally, but now that we are in 2024, a lot of people have gone back to their old buying habits and we have to continually remind individuals that your local farms are still a source of the most local, nutritious food you can access”
-Ashley Randle, Commissioner, Massachusetts Department of Agricultural Resources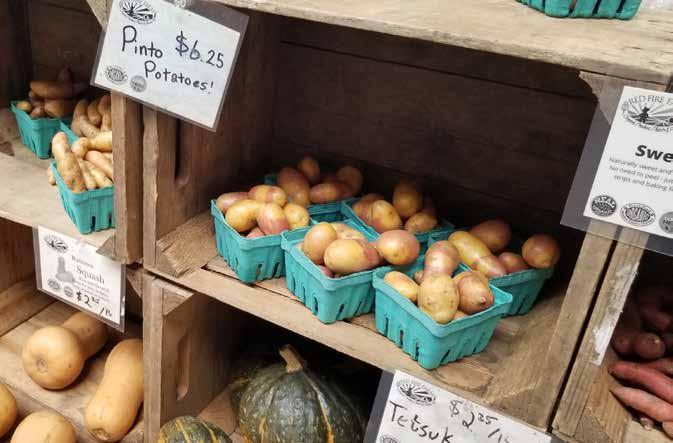
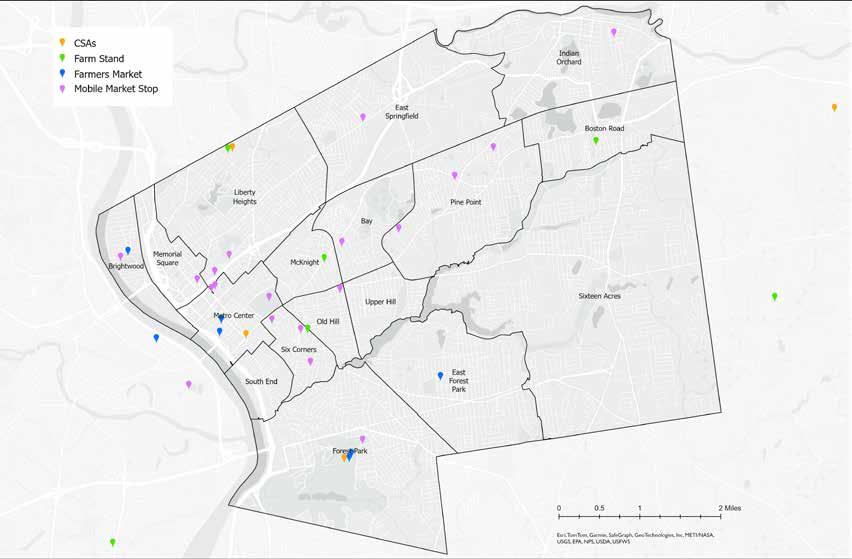
Source: GoFresh and AgricOrganics Mobile Market Schedules (2024); MAPC: HIP Vendors (2020); MassGrown Map (2024)
Food access sites including CSA pick-up locations, farm stands, farmers markets, and mobile markets are present in every neighborhood of Springfield except Sixteen Acres. The majority of these food access sites are mobile markets. Mobile markets have the ability to be dynamic in their location from week to week, making them somewhat difficult to map, while farmers markets often stay in the same place each week but can offer a wider variety of products. Because of the niches that these food access sites fit, it
may be possible for multiple food access sites to thrive in a similar location. The model considers each of the above food access sites except stand-alone CSA pick-up locations to carry the same weight in the analysis, regardless of said niche, and therefore adds a half-mile buffer around each site to decrease competition with other farmers. This buffer zone can be seen in the following map.
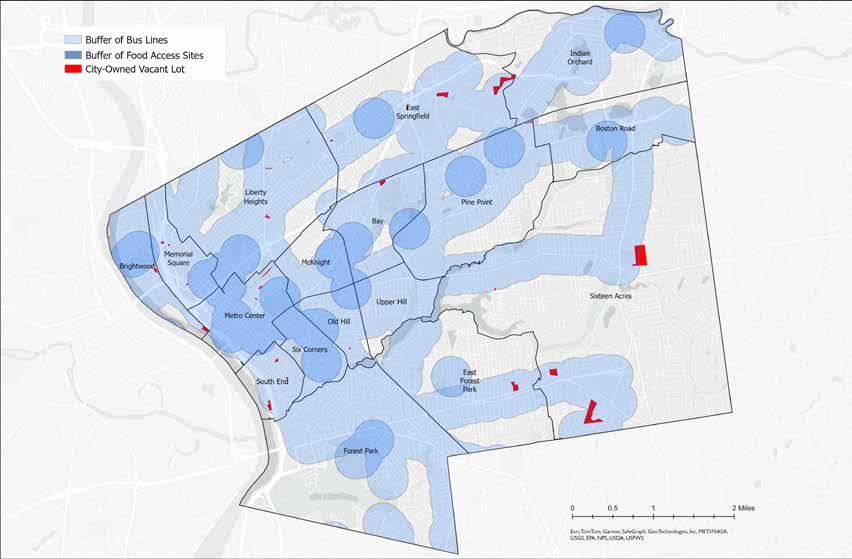
Source: MassGIS: Property Tax Parcels (2023); MassDOT: RTA Bus Routes (2024); GoFresh and AgricOrganics Mobile Market Schedules (2024); MAPC: HIP Vendors (2020); MassGrown Map (2024)
The City-owned vacant lots shown in this map meet all of the mappable farmers market criteria outlined except the “within a quartermile of public transportation” and “not competing with other farmers” criteria. The remaining fifty-eight lots are overlaid with a quarter-mile buffer of all PVTA bus lines in Springfield (light blue), and a half-mile buffer of all of the existing food access sites (farm stands, farmers markets, CSAs and mobile markets) in Springfield (dark blue). The model eliminates any lots outside of the bus line buffer or inside of the food access sites buffer
in order to identify lots that are accessible to public transportation and far enough away from existing access sites to minimize competition with other farmers.
Core team input suggested prioritizing major bus routes when siting farmers markets. These follow major roads such as Boston Road, Main Street, State Street, Bay Street, Roosevelt Avenue, or Liberty Street. Major roads may also offer quicker and easier access to farmers markets and provide greater visibility of sites.
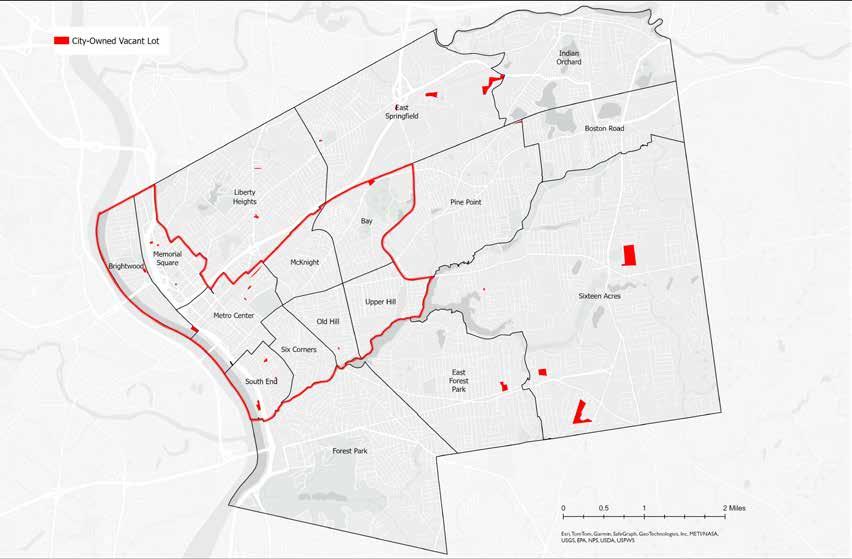
Source: MassGIS: Property Tax Parcels (2023)
There are twenty-six City-owned vacant lots across Springfield that meet all of the mappable farmers market criteria, none of which exist in Forest Park, Boston Road, Upper Hill, or McKnight. Within the focus area determined in the Identifying Parcels for Food Production: Tier 2 section of the report, thirteen lots are identified by the model as potentially suitable for farmers markets. Further ground-truthing using non-mappable social and physical criteria is necessary to determine suitability for any of these remaining lots.
A City-owned vacant lot on Main Street and Waverly Street in Memorial Square was identified as a potential farmers market site. Ground-truthing highlighted that several areas were marked with wooden stakes and a sizable hole was dug on site, which could be potential signs of development. Further groundtruthing is required to determine said development.
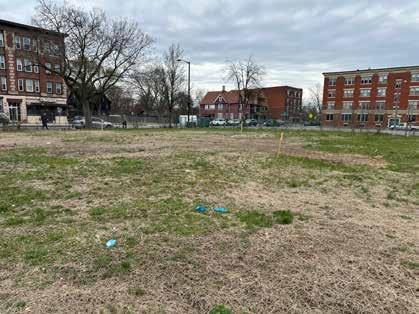
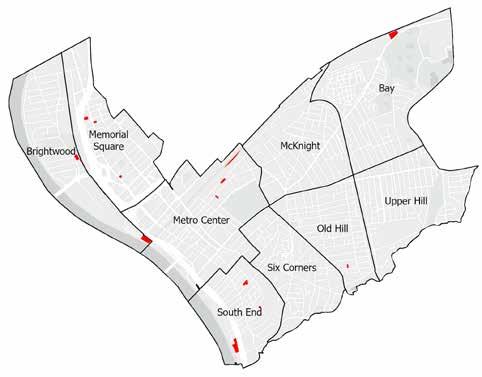
This lot is adjacent to a large parking lot, which could be beneficial for providing parking or extra space at a farmers market. The parking lot currently appears to be used for The Food Bank’s free food distribution program: New North End Citizens Council, which takes place on the first and third Thursdays of each month. Because of the infrequency of the Food Bank’s presence in the adjacent lot, this site may still be suitable for hosting a farmers market on a day that the Food Bank is not present, lowering the possibility for direct competition with the Food Bank. This lot is also located on Main Street, which was identified by the core team as a busy street that would be important to site a farmers market on or near.
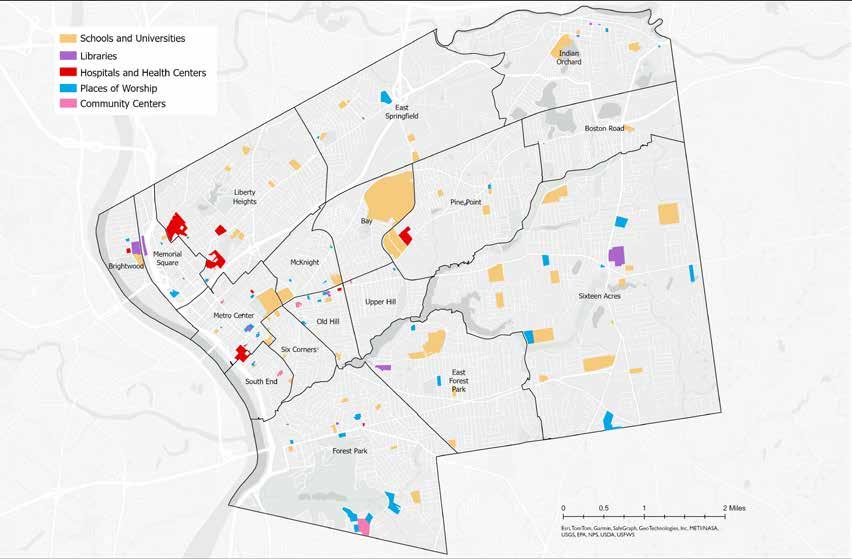
Source: MassGIS: Colleges and Universities (2018), Massachusetts Schools Pre-K through High School (2023 ), Libraries (2017), Acute Care Hospitals (2018), Non-Acute Care Hospitals (2018), Community Health Centers (2019), Places of Worship (2022); Google Maps: Community Centers (2024)
Centers of community, identified as places of worship, hospitals, health centers, schools, universities, libraries, and community centers on this map, are scattered throughout every neighborhood of Springfield. While schools are most plentiful across all neighborhoods, places of worship are most common in the downtown area, and hospitals and libraries are located somewhat sporadically across the neighborhoods. The ease of access, ample parking, and availability of restroom and handwashing facilities at all of these centers of
community qualify them as potential places to host farmers markets.
Siting farmers markets at any of these locations has the potential to bring benefits to the communities these centers serve and beyond. For example, the presence of farmers markets at schools provides opportunities to extend youth gardening education, while farmers markets at hospitals may provide opportunities for patients and visitors to access fresh food during their stay.
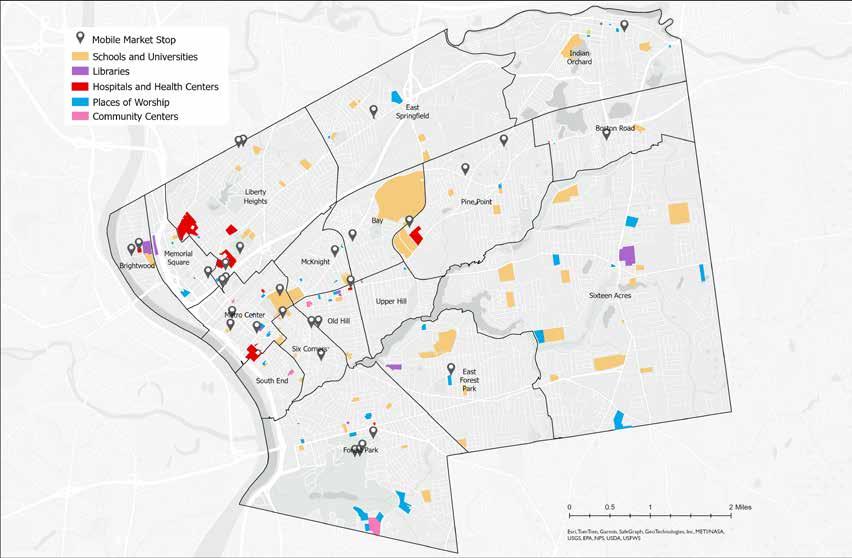
Source: MassGIS: Colleges and Universities (2018), Massachusetts Schools Pre-K through High School (2023 ), Libraries (2017), Acute Care Hospitals (2018), Non-Acute Care Hospitals (2018), Community Health Centers (2019), Places of Worship (2022); Google Maps: Community Centers (2024) GoFresh and AgricOrganics Mobile Market Schedules (2024); MAPC: HIP Vendors (2020); MassGrown Map (2024)
On the other hand, siting farmers markets at centers of community may also present unique challenges. For example, because schools are closed on the weekends, a site coordinator who is able to open the building for restroom and hand-washing use may be necessary. While some sites’ programming may be synergistic with a farmers market, others may pose a conflict.
As the map shows, some centers of community in Springfield are already host to a food access site or located nearby one. For example, GoFresh and AgricOrganics’ mobile markets visit a number of churches and libraries in the area in addition to senior centers and low-income apartment complexes (“Products and Schedule”).
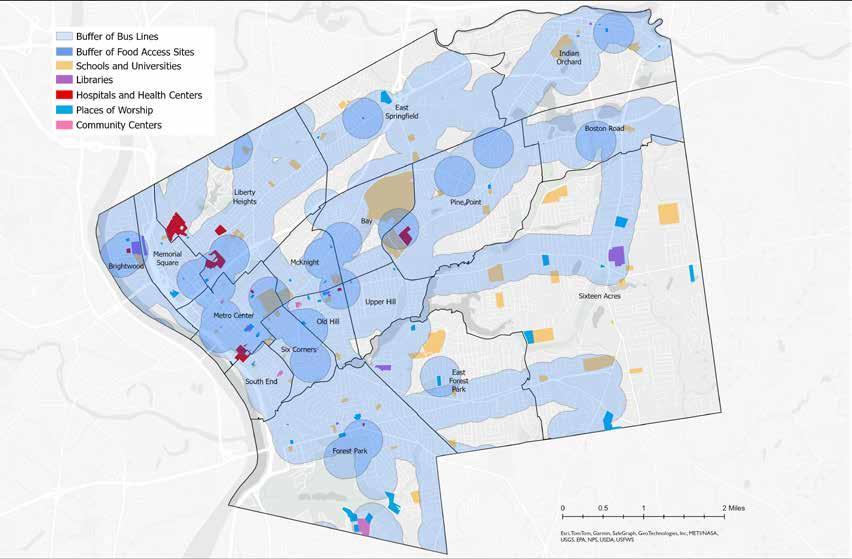
Source: MassGIS: Colleges and Universities (2018), Massachusetts Schools Pre-K through High School (2023 ), Libraries (2017), Acute Care Hospitals (2018), Non-Acute Care Hospitals (2018), Community Health Centers (2019), Places of Worship (2022); Google Maps: Community Centers (2024); GoFresh and AgricOrganics Mobile Market Schedules (2024); MAPC: HIP Vendors (2020); MassGrown Map (2024); MassDOT: RTA Bus Routes (2024)
All centers of community are overlaid with a quarter-mile buffer of all PVTA bus lines in Springfield (light blue), and a half-mile buffer of all of the existing food access sites in Springfield (dark blue). The model prioritizes centers of community inside of the bus line buffer but outside of the food access sites buffer in order to identify areas where the addition of farmers markets could be beneficial. Of the 128 total centers of community, seventy meet these two criteria.
Client input suggests prioritizing major bus routes when siting farmers markets. These follow major roads such as Boston Road, Main Street, State Street, Bay Street, Roosevelt Avenue, or Liberty Street. Major roads may also offer quicker and easier access to farmers markets and provide greater visibility of sites.
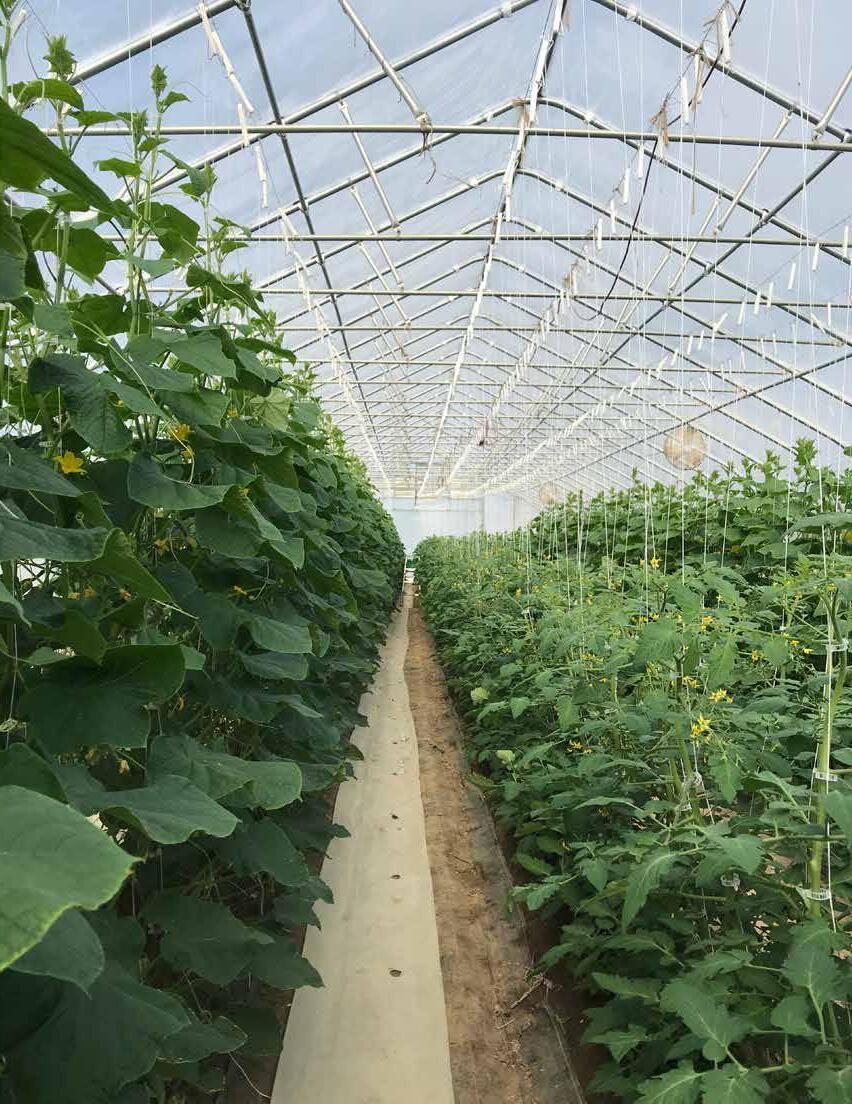 Source: Aspen Anderson
Increased investment in urban agriculture could provide numerous benefits to Springfield by augmenting climate resiliency, community engagement, and environmental education at the same time as helping to address food insecurity. Over the past fifteen years the City has responded to concerns about hunger and community health by supporting initiatives to increase healthy food access. One of the most vital and long-lasting has been the establishment of the Springfield Food Policy Council (SFPC). Constituted in 2010, the SFPC has engaged in a wide range of advocacy work to improve access to affordable and nutritious food (Springfield Food Policy Council; Springfield, Community Gardens 2012). Early SFPC efforts involved collaborating with the City, as well as community members involved in the youth farm Gardening the Community (GTC); these efforts led to enacting a Community Gardens Ordinance (Richmond; Springfield OSRP 2022, 19-20).
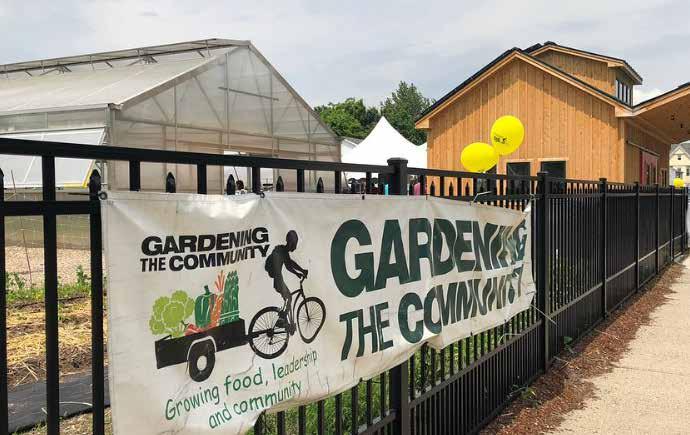
The 2012 Community Gardens Ordinance identifies the many benefits of community gardening projects, including access to healthy and affordable food options and its importance to public health, a source of employment and
leadership for youth and adults, increased food security by encouraging residents to grow and sell their own food, productive use of vacant lots, decreased crime and vandalism, and connecting people to the environment and educating them about sustainable living. The ordinance importantly allows 1) community gardening to take place in any zoning district where agriculture is permitted (which is all zones except commercial-P), and 2) community gardeners to sell their excess produce at any licensed venue. City departments are charged with helping identify potential City-owned vacant lots, providing an initial land clearing free of charge, and assisting with compost delivery. The ordinance identifies SFPC as a liaison between the City and the garden growers by providing guidelines to potential garden entities, accepting requests for starting a community garden, and maintaining a list of current community gardens. If potential community gardeners plan to use a City-owned lot, they must fill out a “community garden application” and a “hold harmless” agreement. The community garden entity is responsible for collecting trash, maintaining the site year round, and covering the cost of tapping an existing water main and monthly water bills (Springfield, Community Gardens 2012).
Another important collaboration between the City, SFPC, and other local businesses and nonprofits was the development and subsequent opening of the Springfield Culinary Nutrition Center (SCNC) and the Home Grown Springfield (HGS) program in 2019. With the goal of alleviating student hunger, the Springfield Public Schools and its food service provider, Sodexo, initiated a program to reshape the practices and culture around school food. Developed with the help of the SFPC and Mercy Medical Center, the systems-change approach included the goals to, “1) Produce delicious, healthy, scratch-cooked meals at its path-breaking Culinary and Nutrition Center (CNC), 2) Offer free breakfast and lunch to all students, and 3) Offer comprehensive food, nutrition, and garden education” (Sands, Transforming School Foods). Some of the district-wide transformations included providing locally sourced foods and culturally relevant menus, new curriculum focused on nutrition, and the installation of raised gardening beds at more than forty K-12 public schools to provide hands-on learning opportunities. Although the nutrition center is too new to track substantial change, MDAR Commissioner Ashley Randle believes that “Springfield is really a leader,” as the partnership with Sodexo has allowed them “to source more local food, which I think is creating a model for other school meal programs across the state.” Catherine Sands, director of the organization Fertile Ground LLC who was hired to write about the process of establishing the CNC, attests that in 2024 “I know that they have changed how they produce [school] food, but how they are able to shift what kids are eating is the challenge.”
“Within the schools, there are opportunities for more work around both food literacy and [educating] about where are the access points in the region for local food....I think Springfield is really a leader in the front, with the facility they have, to be able to provide food to all of the schools within the district. Through a partnership with Sodexo they have built out their kitchen, allowing them to source more local food, which I think is creating a model for other school meal programs across the state.”
-Ashley Randle, Commissioner, Massachusetts Department of Agricultural Resources
The City of Springfield has also demonstrated a commitment to improving urban green spaces and addressing the health impacts of climate change, particularly as they disproportionately affect disadvantaged neighborhoods. Fulfilling a goal outlined in the 2017 Strong, Just, and Healthy: Springfield’s Climate Action and Resiliency Plan (SHJ), the City has been replacing the more than 100,000 trees that were lost between 2011 and 2013 when five major weather events occurred (9). Working with the non-profit ReGreen Springfield, as of 2023 more than 2,000 trees have been planted, primarily in the McKnight, Bay, Upper Hill, and Old Hill neighborhoods. Thanks to $6 million in additional federal funds, another 3,000 trees will be added (Tuthill 2023; McCorkindale 2023). The impact of these regreening efforts is evident when comparing the 2016 and 2021 tree canopy cover maps on the following pages.
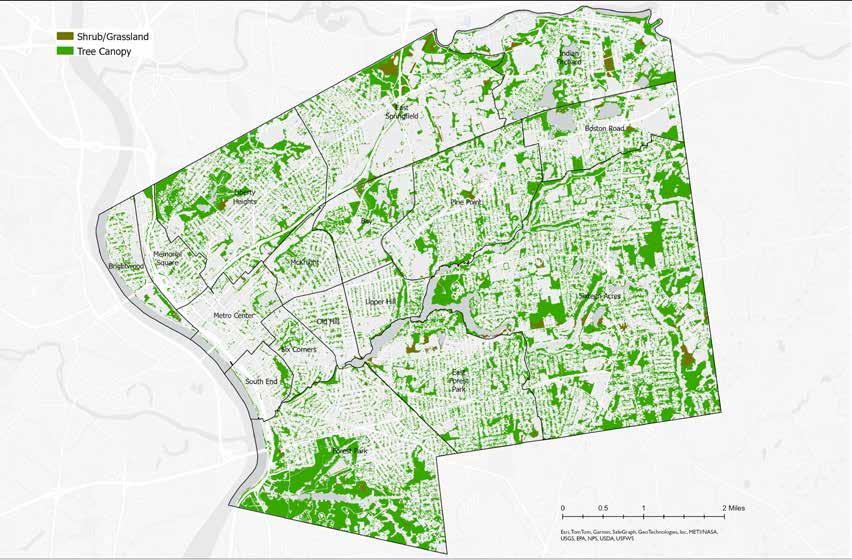
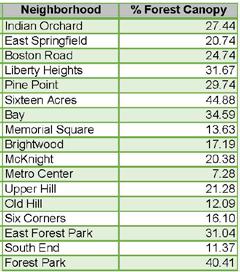
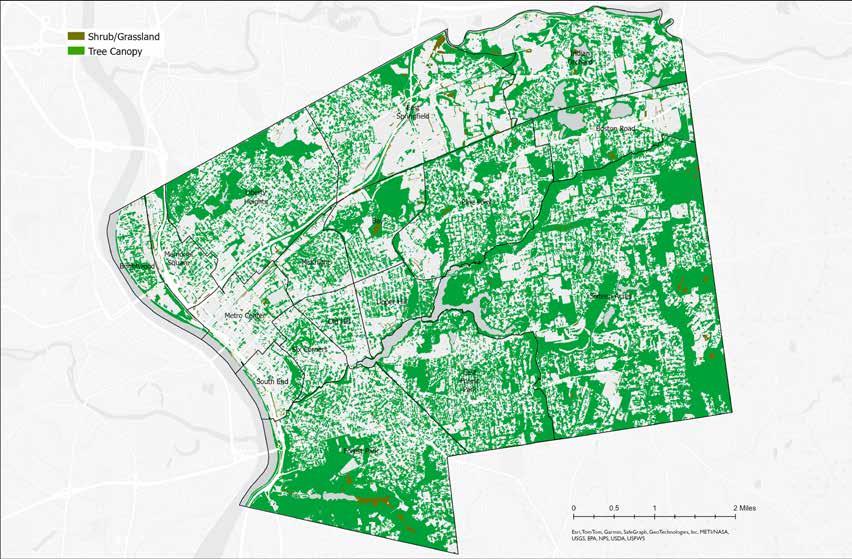
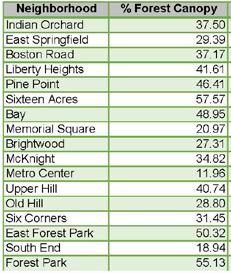
Barriers to increasing urban agriculture on City-owned land, as identified by the core team, interviewees, and the Department of Parks, Buildings, and Recreation Management (PBRM), are outlined below.
A major barrier to establishing food production sites on vacant lots discussed by the core team members is access to water for irrigation use. Water mains exist on nearly every street in Springfield, but as Jaimye Bartak from the Springfield Water and Sewer Commission (SWSC) explained, service lines that are no longer connected to buildings are usually discontinued and either dug up or capped off because of the potential risk of rupture. According to Patrick Sullivan and Tom McCarthy in the Department of Parks, Buildings, and Recreation Management (PBRM), the regulations that exist around inspecting and re-activating these lines make it a costly process. They estimate that re-establishing discontinued lines can cost around $2,000, but can be more expensive given the length of the line, with additional expenses involved for the set up of irrigation services (Sullivan).
These water costs can be prohibitive. Catherine Ratté from the Pioneer Valley Planning Commission (PVPC) noted that after the 2011 year of natural disasters, the community development organization Way Finders tried to establish community gardens in the neighborhood of Old Hill, but “they did not take off because of issues with water access.” She thinks the high water costs are one of the reasons why the adoption of the 2012 Community Gardens Ordinance has not greatly increased the number of community gardens in the city (Ratté). Liz O’Gilvie, Director of the Springfield Food Policy Council
and current Director of Gardening the Community, noted that Gardening the Community had to pay for the waterline at their Walnut Street site. It was an expense they could afford, but few individuals and smaller nonprofits would be able to do so (O’Gilvie). Although a public, independent utility, SWSC operates separately from the City’s municipal structure. For this reason, O’Gilvie doubts that it would be possible to have the City cover the cost of water access for community gardens.
As established through the Community Gardens Ordinance (CGO), lands obtained for the purpose of establishing community gardens on City-owned property are held through a license, known as a Temporary Non-Exclusive License and Hold Harmless Agreement. This agreement is offered as a one-year or a five-year license, and must then be renewed for the site to continue to be used (Springfield, Community Gardens 2012). While permitting land to be accessed for community gardens, the limited time frame can hinder gardeners from making long-term investments and improvements because continued land tenure is not guaranteed. Additionally, the CGO specifies the need for “Insurance. All community gardeners on Cityowned land will be required to sign a ‘hold harmless clause’ with the City.” The actual one-year and five-year agreements specify that the “Licensee hereby agrees to provide at all times and maintain at its own expense [emphasis added] public liability insurance in the form of a commercial or comprehensive general liability policy, or an acceptable substitute policy form as permitted by the City, with a minimum combined single limit of 100,000.00 individual and 300,000.00 aggregate for any one occurrence and suitable auto coverage and such other
insurance as applicable (the coverages required herein shall be subject to review and approval and change from time to time by the City), with the City listed as an additional insured, with companied authorized to do business in Massachusetts and having such terms and conditions as are approved by the City. The City reserves the right to waive the Insurance requirements” (“Temporary License and Hold Harmless Agreement Community Gardens”).
This insurance requirement by the City seems to be unique as far as research into other community garden rules and regulations in Massachusetts has shown. To avoid this cost, garden entities are encouraged to look into being added onto a policy held by a larger organization “such as a city, school, church community group or neighborhood association” (Hahn 2013). In an effort to make urban agriculture more accessible, cities such as New York City started extending their municipality liability protection to gardens on city-owned land almost twenty years ago (Hahn 2013).
Even without the liability insurance, community gardens require heavy financial input, labor, and resources to get established, including repairing or reopening water lines, removing contaminated topsoil, purchasing fresh soil and compost, building raised beds, and organizing volunteers and gardeners. When it is uncertain if an established garden will exist for more than a single year, let alone five years, organizations and individuals are much more hesitant to begin to cultivate a plot for urban agriculture.
Not having enough municipal staff positions to oversee the work that needs to be done can
hinder the establishment and success of urban agriculture production and access sites. Anne Richmond from Nordica Street Community Farm and core team member Benjamin Bland both identified a lack of capacity among City employees as a major barrier to implementing more urban agriculture on City-owned land. Bland notes that “everyone is well intentioned and understands the need,” but that the challenge comes from the paucity of full-time staff positions.
A lack of staff and volunteers associated with the food production and food access sites is also a challenge. Becky Basch from the Pioneer Valley Planning Commission (PVPC) noted that community gardens are more successful when there is a designated person from the community to manage and oversee them. Also, Jodi-Lyn Manning, the manager of the Farmers Market at Forest Park and the Downtown Springfield Farmers Markets, noted in an interview the need for both more vendors and more employees to support the vendors (Manning 2022). Ashley Randle, commissioner of MDAR, stated that she recognizes the difficulty in recruiting farm labor as another obstacle to increasing urban agriculture in Massachusetts. In this regard she extolled the work of Gardening the Community, as the organization “has done a great job of inspiring and teaching youth to become the next generation of urban agriculture” (Randle).
As referenced when discussing water access, land tenure, and staffing, many food projects throughout Springfield have large goals, but may not have the financial means to accomplish them quickly or completely. Catherine Ratté, director of Land Use and Environment at PVPC, states that while the Community Gardens Ordinance (2012) has helped the establishment of some food production sites, it remains difficult to start a community garden due to a lack of funding and little overall support. Catherine Sands, director of Fertile Ground LLC, an organization that works to create equitable food systems, believes that long-term grants are necessary to provide the financial stability necessary for agricultural projects to succeed and grow: “three years is not enough—5 years, 6 years,
7 years, 8 years, 9 years begins to make a dent. Give organizations money so they can actually create positions…then you can create some traction.”
The lack of resources is a problem echoed by Anne Richmond, owner of Nordica Street Community Farm; she notes that capacity and funding are the two biggest barriers for expanding her farm into a community resource, where she hopes to host agricultural training and workshops. When she was first developing her farm, she “received no guidance from the City as to how to establish a CSA”—she had to learn everything and find funding herself. She mentioned that all farmers in the area are “just feeling their way,” as there exists little guidance or resources for new farmers (Richmond).
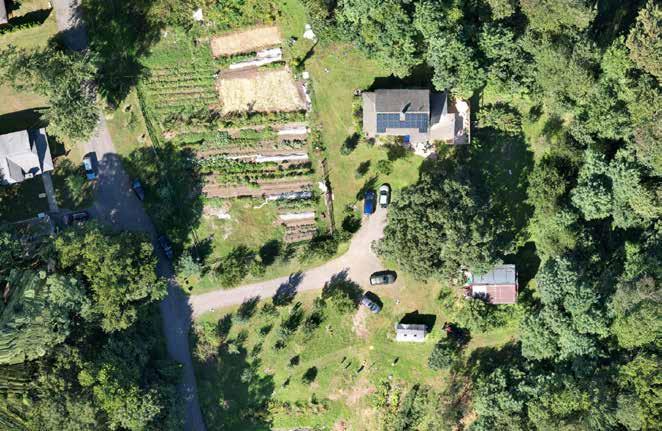
Numerous planning reports and action plans have been published over the past decade to guide Springfield’s development. These reports clarify issues, establish goals, and propose methods for attaining those target goals. However, the suggestions within these reports are usually not legal requirements, and many action items are not pursued or carried out to completion.
For example, Springfield’s 2022 Open Space and Recreation Plan (OSRP) presents sevenyear action plan goals, and Goal #5 specifically addresses food production and access under two objectives: “Collaborate to further resident access to healthy and affordable food options via community gardens, and static or mobile farmers markets” and “Identify vacant land to be used for the development of urban agriculture plots while decreasing blight and crime” (Springfield OSRP 2022, 58).
The City departments designated to help enact these objectives include the Office of Planning and Economic Development and the Department of Parks, Buildings, and Recreation Management (PBRM). The OSRP projects to be completed within the 2022 to 2028 fiscal years include: supporting Springfield Food Policy Council staff and initiatives, implementing the Community Gardens Ordinance, assessing vacant lots for agricultural and community benefit, conducting a feasibility study of irrigation funds for community gardens, and partnering with nonprofits to develop new agricultural projects (Springfield OSRP 2022, 71-72). These action items were almost identical to the 2015 OSRP. Only one item was dropped entirely from the 2022 plan, which was to establish soil standards to incorporate into
the Community Gardens Ordinance (Springfield OSRP 2015, 67). Although a recent interview with staff in the Department of PBRM reflected a desire to work with the Springfield Food Policy Council and a concern for and interest in the productive use of Cityowned vacant lots, they were less familiar with the Community Gardens Ordinance and the existence of “hold harmless” agreements between potential gardeners and the City (Sullivan).
Similarly, Strong, Healthy, and Just: Springfield’s Climate Action and Resiliency Plan (SHJ) from 2017 suggests several key strategies that the city should undertake in order to adapt to the incoming effects of climate change. Creating community gardens is one of the recommendations as they “can be considered a form of green infrastructure (especially those on vacant lots) as they reduce temperatures, infiltrate stormwater, build community cohesion, address local food insecurity, and get rid of impervious surface that worsens the urban heat island effect” (SHJ 2017, 21). However, City staff might not be familiar with green infrastructure objectives or methods of implementation, as noted by Philip Dromey, the Deputy Director of the Office of Planning and Economic Development. Understandably, the City’s departments are working on numerous projects and are understaffed, but undertaking and completing the recommendations and action plans set forth in the many reports developed for Springfield would advance the city, especially with regards to its food system, green space, and climate resiliency.
Some challenges to expanding and sustaining home gardens, community gardens, community farms, and urban orchards include residential use zoning restrictions that pertain to agricultural use on parcels less than five acres. According to the current Springfield municipal zoning code, the term “Agriculture” includes “all forms of farming and forestry on five (5) or more acres of land” and includes activities as wide ranging as dairying, apicultural, aqua cultural, viticultural, silvicultural and the packaging, storing, and transporting of products. By contrast, a “Community Garden” is more narrowly defined as “a garden of less than five (5) acres used for the cultivation of fruits, flowers, vegetables or ornamental plants that is used by more than one person or family”; a “Market Garden” is “a home-based occupation where food or ornamental crops are grown by hand in a garden setting to be sold and/or for donation”; and a “Farmer’s Market” is “the selling…of vegetables or produce, flowers, crafts, orchard products and similar agricultural products, including eggs, poultry, meat, and dairy” (Springfield, Zoning Ordinance, Section 2.2).
The activities of home or yard gardeners in all zoning districts are addressed separately as “Supplemental Regulations for Residential Uses” under “Agriculture and Animals” (Springfield, Zoning Ordinance, Section 4.2.11). One of the zoning requirements is that “There shall be no gardening activity and/or compost bins located within the front yard” (Section 4.4.11, A.7.) While restricting compost bins from front yards is common among other Massachusetts municipalities, the restriction on home or yard gardening is not. In Springfield the front yard setbacks are sizable (Residential A and A-1 are 25 ft., Residential B is 15 ft., Residential B-1 and Residential C are 10 ft., and Residential C-1
and C-2 are 25 ft.) and could severely restrict the growing of food for many city residents (Section 5.2.10). Other restrictions on properties less than five acres preclude the “production or keeping of any animals” (Section 4.4.11, A.1) and the on-site sale of any product other than agriculture grown where the “practitioner permanently resides” (Section 4.4.11, A.2 & A.4).
Some of the limitations to the Community Gardens Ordinance include signage allowances as the “one identification sign” that is permitted must “comply with the size regulations of the Springfield Zoning Ordinance” (Springfield, Municipal Code, Community Gardens §154-3, B.2.). For residential zoning districts A, A-1, B, C and OS, an identification sign cannot be larger than 1 square foot or 144 square inches (Springfield, Zoning Ordinance, Sections 9.6.11 & 13), which is quite small. However, if the community garden lot is in a business, commercial, or industrial zoning district then the sign allowances are much more flexible in type and generous in size (Section 9.8.40).
Recommendations are a reflection of the ideas, suggestions, and guidance provided by interviewees, core team members, and prior reports.
1) Increase the use of City-owned vacant lots and City-owned open space for urban agriculture
The passing of the Community Gardens Ordinance has been identified as a “success” in Strong, Healthy, and Just: Springfield’s Climate Action & Resilience Plan summary (SHJ 2017, 39). The City, in coordination with the Springfield Food Policy Council, could continue to build on this perceived strength. There is evidence of support for the use of City-owned vacant lots among City staff in the Department of Parks, Buildings, and Recreation Management (PBRM). While staff hopes that City-owned vacant lots are turned over for housing first and foremost, it envisions practicing greening efforts on these lots in the meantime, such as temporary tree nurseries or community gardens, and believes that “no lot should be thought of as
an obstacle” to establishing these uses (Sullivan). Department head Patrick Sullivan suggested having the City build portable raised garden beds on City-owned vacant lots that could be moved from site to site as the lots get turned over for other uses.
In addition to the City-owned vacant lots, there are 478 City-owned open space parcels across Springfield totalling almost 3,000 acres (Springfield OSRP 2022, 111). These lots are protected from development, and encompass a variety of different uses, from forested lands to cemeteries to sports fields.
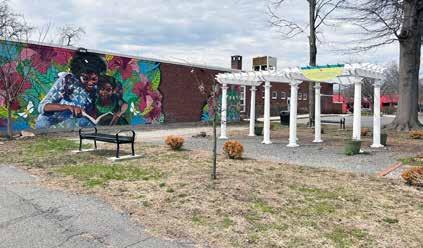
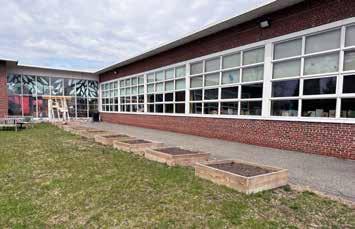
The space above appears as a vacant lot in the City’s property tax parcels data. However, it is adjacent to the Mason Square branch of the Springfield Library and has been transformed into “The Discovery Garden.” A collaboration with the City, several nonprofits, and numerous residents, the landscaped space includes a mural, benches, flowers, and raised garden beds. The success of the space might have encouraged the librarians to start their own raised beds on the west side of the library property, as evinced by the photograph to the left.
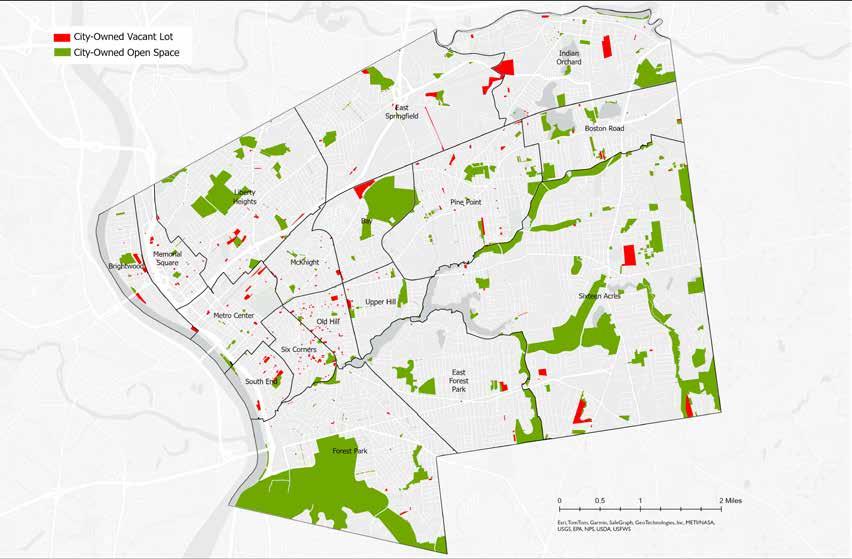
Source: MassGIS: Property Tax Parcels (2023)
The largest City-owned open space property is Forest Park, a 735-acre site that includes a zoo, botanical gardens, outdoor amphitheater, ice rinks, and a host of other recreational opportunities. The City runs an environmental education center here to introduce youth to horticulture, and has plans to expand it into a K-12 program that includes raised garden beds for growing food, according to PBRM Director Patrick Sullivan. Forest Park also hosts the city’s longest running farmers
market from May to October each year and an indoor winter market from November to April. The park is an excellent example of how a city can use open space to support a variety of urban agricultural activities.
Staff from the Department of Parks, Buildings, and Recreation Management expressed interest in using more of these City-owned open spaces for growing food, specifically community gardens (Sullivan). According to the 2022 OSRP, there are two City-owned parks that currently support community gardens: Linda Petrella Park (aka “Linda’s Park”) in the Memorial Square neighborhood and Myrtle Street Park in the Indian Orchard neighborhood (90, 92). In addition, Duggan Park is slated to have community gardens included in that renovation (83). However, ground truthing indicated that Linda’s Park is no longer used in that capacity. At Myrtle Street Park the community gardens are limited to just three small beds.
Currently there is only one public urban orchard in the city, Johnny Appleseed Park in the Six Corners neighborhood, which has over thirty fruit trees, fruit-producing shrubs, and flowering perennials (“Johnny Appleseed Orchard Gets Fall Clean Up”). Planting urban orchards is one way to expand tree cover on public land while also growing fruits and nuts for consumption (Wilson 2016). The City’s Forestry Division has been extremely successful in securing funding for increasing the urban tree canopy; their plans to use city parks for establishing tree nurseries could be expanded to include the growing of fruit and nut trees and the promotion of “edible food forests” (Tuthill 2023).
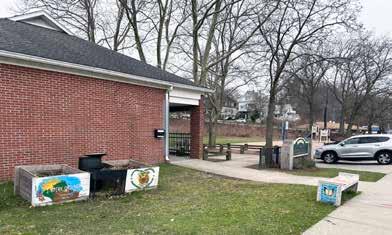
Due to the logistics involved in running a farmers market, Sullivan suggested using schools or other centers of community (e.g., churches, libraries, etc.) as potential farmers markets across the city. He specifically suggested Rebecca M. Johnson Elementary School as it is also adjacent to the Early Childhood Education Center in the McKnight neighborhood.
There are specific state-funded programs overseen by the Executive Office of Energy and Environmental Affairs (EEA) such as the PARC (Parkland Acquisitions and Renovations for Communities) Program Grants and the Gateway City Parks Program (GCPP) that support the acquisition of land and the construction, restoration, or rehabilitation of land for park and outdoor recreation purposes.
According to a presentation by Kurt Gaertner, director of land policy and planning at the EEA, the cities of Somerville, Salisbury, Medford, and Haverhill have received grants to build community gardens as a part of a larger park renovation through the PARC program and the cities of Fitchburg and Pittsfield have received funding for community gardens through the GCPP (“Planning and Urban Agriculture”). In future grant funding applications, Springfield’s Department of PBRM could include the establishment of community gardens on Cityowned open space.
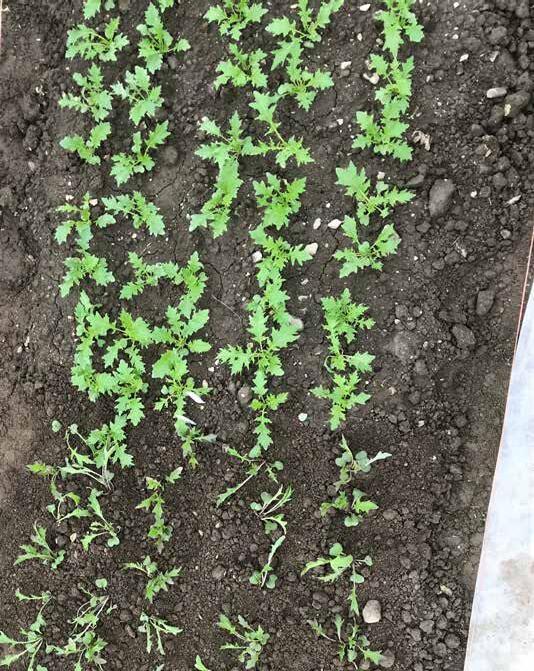
2) Protect City-owned parcels with prime farmland soils from development
The Massachusetts Department of Agricultural Resources (MDAR), in its 2023 Massachusetts Farmland Action Plan (MFAP), highlighted that the “The Commonwealth, municipalities, federal government, regional planning agencies, land trusts, and private landowners all play a role in farmland protection” (MFAP 2023, 5). Much of the City-owned open space mentioned is on prime farmland soils. According to the City of Springfield’s 2022 OSRP, there are efforts underway to protect other City-owned parcels with prime farmland soils, primarily in the Sixteen Acres neighborhood, by putting more of them under conservation (Springfield OSRP 2022, 128).
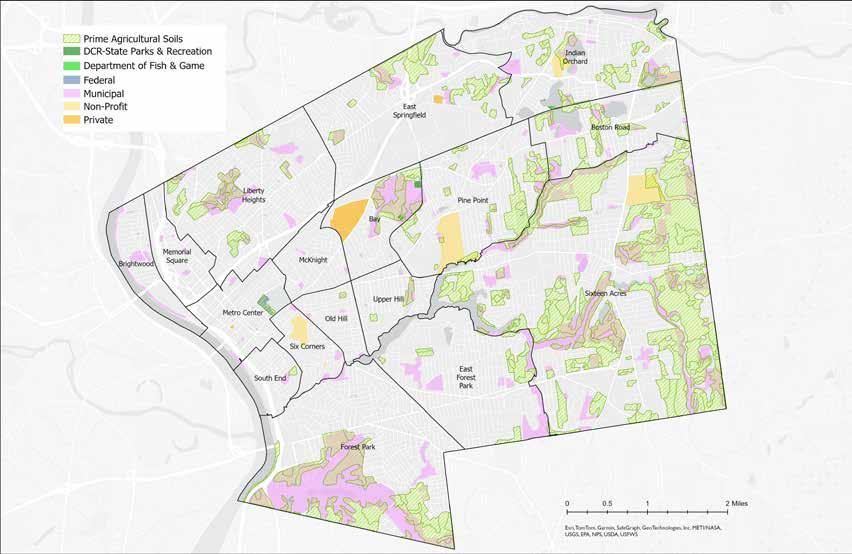
Source: MassGIS: Protected and Recreational Open Space (2023), Soils SSURGO-Certified NRCS (2020)
This map presents who owns and oversees the different open spaces in Springfield and identifies parcels that overlap with soils designated as “prime farmland soils” by the Natural Resources Conservation Service (NRCS). The largest areas of prime farmland soils are primarily located in the eastern half of the city, many of which are already municipal parks. The Springfield Armory, a National Historic Site and home to the Armory Beehive, also overlaps with prime farmland soils in Metro Center (“Things to Do”).
City parks with prime farmland soils may prove to be suitable places for community gardens. Any open space identified on this map as overlapping with prime farmland soils should be assessed using similar criteria as applied to City-owned vacant lots (see pg. 53) to determine which parcels may be suitable for in-ground food production if the soils have not become contaminated.
Springfield’s 2022 OSRP includes a recommendation to conduct a Garden Irrigation Fund Feasibility Study in 20232025. This same recommendation was included in the 2015 OSRP and was initially suggested in the 2014 Food in the City report (OSRP 2015, 68; Berg 2014, 72). Conducting such a study and making the results publicly available could help identify where funding is available for infrastructure improvements. The Pioneer Valley Planning Commission could help conduct this study under the state’s District Local Technical Assistance Program (Ratté). Among the different grant programs overseen by the Massachusetts Department of Agricultural Resources (MDAR) to fund commercial agriculture and community farms, the Urban Agriculture Grant Program could potentially fund irrigation hook-up costs on new food production sites. The need for greater resources in this area are mentioned in the 2023 MA Farmland Action Plan: “Fund infrastructure development to support agriculture on publicly held land (i.e., irrigation, high tunnels, etc.)” (59). As those policies are explored, hopefully state officials will continue to consult with Liz O’Gilvie, who has articulated a need for some kind of incentive, like a state policy to underwrite the cost of water (O’Gilvie). Municipalities like Springfield might not otherwise have the financial or structural ability to alleviate the burden of water costs for community gardens, farms, and orchards.
Land access in Springfield is a racial equity issue due to the numerous historical barriers previously mentioned. Municipal plans are beginning to address ways for the City to be more actively involved in facilitating access to land to farm. Included in Strong, Healthy, and Just: Springfield’s Climate Action and Resilience Plan is the recommendation that “The City can provide helpful assistance to potential garden-starters by transferring Cityowned property at low cost, or by purchasing privately-owned lots from willing owners” (SHJ 2017, 22). This recommendation could possibly be met through the establishment of or collaboration with land trusts, community land trusts, or an urban land bank.
Source: Kerry Morgan
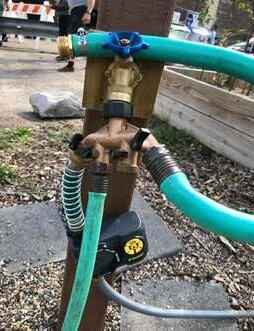
Land trusts are nonprofits that actively work to conserve land either through acquisition or conservation easements with landowners. Once the parcel is conserved, land trusts steward and manage the land (“About Land Trusts”). In Massachusetts, unlike some states, “there is no single land trust that focuses solely on statewide agriculture and protection,” instead, there are “a number of regional and local land trusts [that] focus on farmland protection” (MFAP 2023, 34). Massachusetts Commissioner of Agriculture Ashley Randle and other interviewees were not aware of many examples where a land trust secured land for urban agricultural purposes, as that is largely outside of their typical work (Randle, Ratté, Basch). The Trust for Public Land, however, worked in Boston to transform “local vacant lots into climate-smart urban farms”
(“Boston Urban Agriculture” 2022). In Lawrence, MA, the nonprofit community trust Groundwork Lawrence, which is a member of the national organization Groundwork USA, “operates a growing network of community gardens, providing another source of fresh food to Lawrence residents, while transforming formerly vacant and often contaminated open space into attractive and productive community gathering spots.” Its website states that at least one of these gardens was created through its land trust subsidiary, GWL Recreational Access Inc. (“Community Gardens”).
As noted in the Massachusetts Farmland Action Plan, there is a difference between land trusts and community land trusts. Community land trusts are also nonprofits, but they separate ownership of land from homes or other structures. Community land trusts own the land on behalf of the community, resulting in lower costs for homeowners. These are increasingly “used in Massachusetts and elsewhere to support whole farming communities, including housing and urban farms and community gardens, supporting both affordable housing and food security” (MFAP 2023, 34). Anne Richmond, owner of Nordica Street Community Farm, expressed the need for a community land trust in Springfield to help hold land ownership and decrease the costs associated with purchasing land for urban agriculture use.
Liz O’Gilvie, director of the Springfield Food Policy Council, also proposed the idea of starting an urban land bank for privatelyowned vacant lots. A dedicated fund could be established to cover the high cost of foreclosure or funds could be directed to nonprofits who want to push foreclosures forward (Liz O’Gilvie).
Acknowledging this need for increased access to land, Ashley Randle noted that MDAR has two different grant programs, the Food Ventures Grant Program and the Urban Agriculture Grant Program, that fund commercial agriculture and community farms. The Urban Agriculture Grant Program funding “can help with purchasing of land and remediation of land which is often more necessary in urban areas” (Randle). The City can apply for this grant program in an effort to lower the costs associated with purchasing land for beginning farmers and gardeners.
More and different avenues for securing land might be available to Springfield in the future. The Massachusetts Farmland Action Plan suggested that the Commonwealth “Pilot ‘lease-to-own’ opportunities to catalyze the development of permanent urban farming properties in historically underserved communities” (MFAP 2023, 60).
Other funding opportunities for urban agriculture are highlighted in the State’s Resilient Lands Initiative: Expanding Nature’s Benefits Across the Commonwealth: A Vision and Strategy (2023). The second priority area is “Focus on Food” and seeks to “expand the amount of locally grown food, especially in food deserts, and ready the Commonwealth’s local food production system for future stress from droughts, floods, storms, sea level rise, and other climate change impacts” (Resilient Lands Initiative 2023, 27). The Action Items overseen by MDAR include:
• Action #1a: Seek to Create a “Vacant Lots to Farms” program in Massachusetts cities.
◦ Funding will start with grants to all cities to produce urban farm/garden plans, to transfer priority tax title parcels to city control, and to purchase priority private parcels. Toward the end of the 2020s, grants would also be used to support organizations in ten selected cities to create fifty acres of new farms, covering their first three years of operation.
• Action #1b: Seek to expand MDAR’s Urban Agriculture Program.
◦ Funding focuses on building the network of capable urban farming organizations and expanding their production, marketing, infrastructure, and collaboration with nearby neighborhoods, especially in the cities not selected for Action #1a.
• Action #1c: Look to expand community farms by creating a small grant program to support and enlarge community farms and gardens.
Another source of potential state funding is the proposed Plot Restoration Opportunity Program (PROP). This action item in Massachusetts’ Resilient Lands Initiative (RLI) cites the 34,000 privately-owned vacant lots across the Commonwealth that could be developed for housing and the plots not suitable for development could be “transformed into urban farms, gardens, micro-forests, and parks. Doing so would address urban heat island concerns, help alleviate flooding, and have many other benefits” (RLI, 32).
• This Action could green up to 2,400 acres in Boston and Gateway Cities in partnership with local communities and state housing and economic development agencies, and could include clean-up, new soil, landscaping and planting. Program design could include stipends for neighborhood stewards via grants to local NGOs to continue to care for lots after renovation, as the stewardship of new greenspace is often a concern for city governments.
4) Consider establishing Urban Agriculture Overlay Districts or Urban Agriculture Incentive Zones
An Urban Agriculture Overlay District (UAOD) would establish use regulations and standards for specific areas within the city. The Pioneer Valley Planning Commission (PVPC) hosts on its webpage a “Toolkit for Food Security” that includes a section that explains the potential benefits of and strategies for establishing an Urban Agriculture District (“Food Security Toolkit”). Aspects to be considered are permitted uses, accessory uses, and zoning standards. Some other activities not mentioned in the PVPC toolkit could include consolidating organic composting operations in a central location, requiring stormwater management techniques be used to address standing water, and limiting the use of pesticides and other known carcinogens within the UAOD and requiring that alternative practices be used to control pests (Cuyahoga County 2012).
In an Urban Agriculture Overlay District Health Impact Study for Cuyahoga County, OH, the following criteria were provided for deciding where to site an overlay district. They include:
• Large tracks of vacant land
• Close proximity to underserved areas of the city that lack healthy food options
• Lower income and higher density communities of color with higher levels of poverty
• Each district should contain at least one farmers market
• Districts should be discouraged in known contaminated sites unless cleaned prior to district establishment
• Proximity to transit rail, bus, bicycle
• Proximity to schools and retail areas
Establishing a special purpose zoning overlay district would not be new to Springfield since the City currently has six. These include the Casino Overlay District, Floodplain Overlay District, Neighborhood Commercial Design Overlay District, Shopping Center Overlay District, Smart Growth District, and West Columbus Urban Renewal Overlay District (Springfield, Municipal Zoning, Article 8).
Urban Agriculture Incentive Zones (UAIZ) have been used in cities and states such as San Francisco, Cleveland, Missouri, and Louisiana to support local food production. A new zoning act could authorize the City to enter into contracts with owners of private, vacant, undeveloped land who commit their land into urban agricultural use for at least three or five years, thereby providing public benefits to the City as well as land access and land security for City farmers and gardeners. In return, the City would provide a property tax reduction (Healthy Food Policy Project).
The Healthy Food Policy Project website hosts an urban ag policy database, food systems framework, and case studies. A particularly useful resource for updating zoning regulations is their downloadable pdf “Zoning for Urban Agriculture: A Guide for Updating Your Community’s Laws to Support Healthy Food Production and Access” (Healthy Food Policy Project 2024).
6) Consider establishing an Urban Agriculture Ordinance
An Urban Agriculture Ordinance (UAO) would be applied citywide.
• Decide what types and scales of agriculture should be allowed in an UAO and develop definitions designed to support these uses
With input from community members, potential gardeners/farmers, and other stakeholders, decide what types of activities should be included in an ordinance that builds upon, clarifies, and expands the opportunities afforded in the Community Gardens Ordinance. For example, Springfield’s current zoning ordinance does not explicitly define entities like farm stands or urban farms or allow for front yard gardening or small animal husbandry on land smaller than five acres. See appendix for list of possible activities that could be included in an expansive UAO.
• Make zoning laws more food and environment friendly
Zoning ordinances play a part in allowing and incentivizing food equity by explicitly permitting urban farms, farmers markets and farm stands, hydroponics, aquaponics, and agricultural structures. Making the following changes to Springfield’s zoning requirements would reduce obstacles to food production:
• Eliminate the residential zoning restrictions on agricultural activities in front yards.
• Allow for larger signs (maximum 4 feet by 6 feet) to be situated on any size property in any zoning district if being used as a farm stand, market garden, community garden, community/urban farm, or urban orchard.
• Remove the requirement that persons engaged in agriculture on City-owned properties have to provide liability insurance.
• Develop a staff position for an urban agriculture coordinator of City-owned land
As previously mentioned, understaffing and lack of capacity hinder the establishment of more urban agriculture on City-owned vacant lots and City-owned open space. Recommendations from Anne Richmond, owner of Nordica Street Community Farm, and Benjamin Bland, Mass in Motion Coordinator, include developing a position for someone to oversee urban agriculture on City-owned lands within either the Community Development Department, the Office of Planning and Economic Development, or Department of Parks, Buildings, and Recreation Management. It was also noted that this need not be a new hire if there is capacity for someone to take on this responsibility. This position may be in charge of assessing City-owned lands suitable for urban agriculture, giving guidance to people interested in using City-owned land for agricultural use, and inspecting City-owned lands with current agricultural use on them to make sure all practices comply with the current ordinance. Centralizing this work in one city department would make applying for a City-owned lot much easier. Currently, in the five-page Community Garden Ordinance there are five different City departments mentioned as points of contact. Streamlining this process could benefit both residents and City staff.
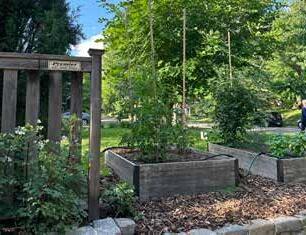
• Create a webpage on the City’s website that links to urban agriculture ordinances and to available lots
The current Community Garden Ordinance makes no mention of making public which vacant lots are available. However, the advisory Massachusetts Farmland Action Plan (MFAP) lists under strategy A. “Make more land available for agriculture” with action item 1. “assess all existing, publicly held land for its suitability for agriculture and make more of it available for agriculture” and implementation objective a. “explore a requirement for state agencies and departments, counties, and municipalities to identify and publicly list all publicly owned land that is either in current agricultural production or suitable for agricultural production” as an avenue to achieving the second major goal of the plan “Increase access to farmland” (MFAP 2023, 59).
Consider making publicly available the Cityowned vacant lot data produced in this report
or creating a similar dataset that is easily accessible to members of the community; such datasets could be editable as City-owned vacant lots change usage or availability. The City of Minneapolis hosts this sort of public inventory of vacant lots on a webpage (Minneapolis, “Garden Leases”).
The most oft-repeated benefit to engaging in urban agriculture is its ability to build community, in real life and in real time. With in-person socialization decreasing and political polarization increasing, people need more opportunities to come together outdoors, engage in the physical labor of gardening, and reap the benefits of harvesting and eating fresh, healthy, and culturally significant foods. There is knowledge and power in having sovereignty over what and how you eat. Forward-thinking City officials, working in collaboration with Springfield’s residents, businesses, and nonprofit institutions, can address the structural shifts that need to happen in how and what we produce and consume. It requires hope, fortitude, and good planning.
“I think the community-building aspect and the social aspect [of urban agriculture] are more important than ever. And certainly with urban ag, it is a critical outlet to be able to connect with the older generation, the younger generation, to bring everyone together….It is an opportunity to learn from one another.”
-Ashley Randle, Commissioner, Massachusetts Department of Agricultural Resources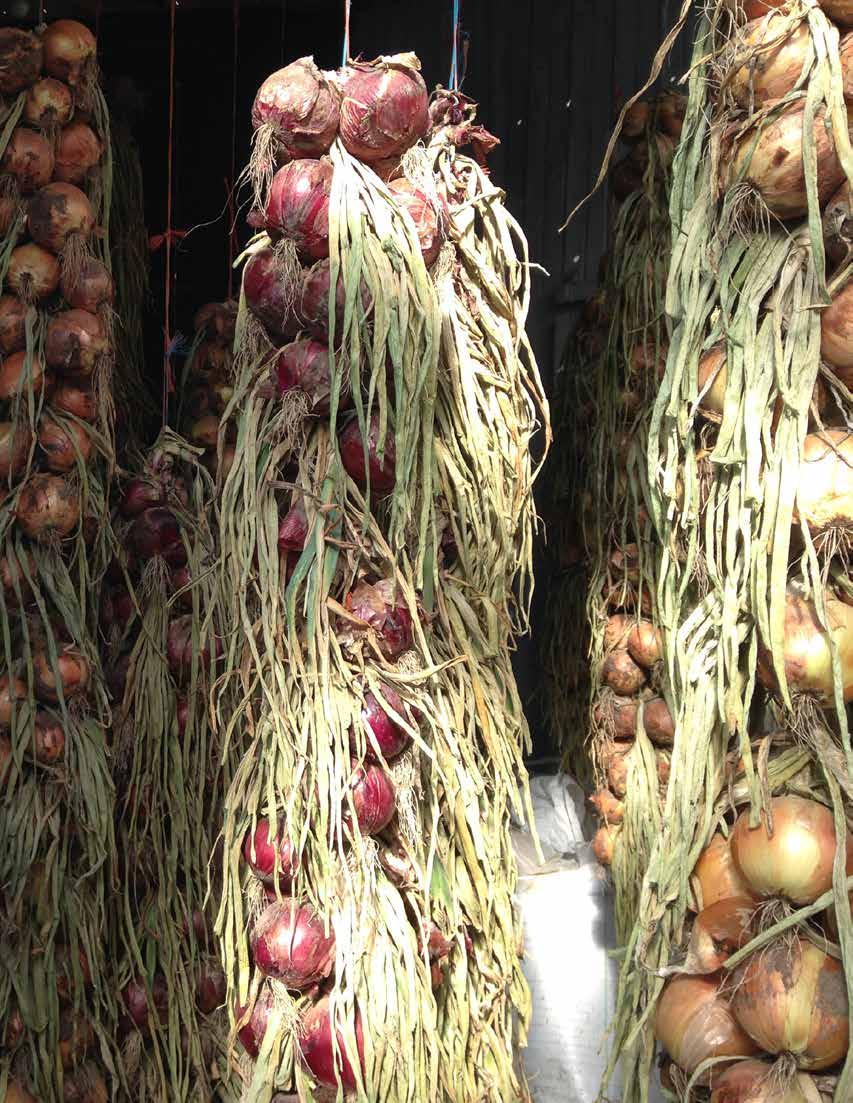
Research into what types of urban agriculture are permitted within the Commonwealth included an assessment of thirty towns and cities. They included the twenty-six Gateway Cities, along with Boston, Cambridge, Plymouth, and Somerville. Urban agriculture is sometimes mentioned in cities’ OSRPs (such as Chicopee) and a few cities, such as Brockton, have commissioned specific plans outlining ways of encouraging it (Kilduff 2017). However, few municipalities have adopted comprehensive policy or zoning changes. The municipalities that have specially designated urban agriculture ordinances that apply to five or more types of urban agriculture include Boston, Revere, Salem, Somerville, and Worcester. What these ordinances include varies widely. In some cases there are separate community gardening ordinances (e.g. Boston, Revere). Most cities offer user-friendly guides, such as the City of Salem that hosts a webage about their urban agriculture ordinance with downloadable fliers in both English and Spanish highlighting what the ordinance allows.
The City of Cambridge, which is working to establish an urban agriculture ordinance, outlined in their report A Health Lens Analysis of Urban Agriculture Policy (2019), these potential activities to be considered:
• Beekeeping
• Henkeeping
• Commercial Farming
• Community Gardening
• Community Agriculture Organizations
• School Gardening and STEAM Curriculum
• Medical Healthy Food Prescription Programs
• Composting
• Food Retail
• Food Donation
What are not mentioned in this list, and are included in several of the urban agriculture ordinances are rooftop and vertical gardening, farmers markets, and farm stands.
The absence of any specific ordinances related to various types of urban agriculture does not preclude the existence of well coordinated and successful urban agricultural practices. The City of Lawrence, for example, only recently amended its zoning ordinance to allow for “Agriculture, horticulture, floriculture, and viticulture on less than five acres” as well as “Indoor agriculture uses such as Aquaponics, Aquaculture, and Hydroponics,” but only in a specific Planned Industrial Development District (Lawrence, Additional Amendments). But just the same, over the past eighteen years the nonprofit organization Groundwork Lawrence has been successful in establishing throughout the city twelve community gardens that currently include 230 beds and an urban farm that employs youth to serve as a “Green Team” (“About Groundwork Lawrence”; “Climate Resiliency and Urban Agriculture”).
The maps created in both the Identifying Parcels for Food Production and Identifying Parcels for Food Access sections of this report were created in ArcGIS Pro using a weighted sum analysis. In a weighted sum analysis, multiple inputs with varying weights are combined to demonstrate levels of importance. This analysis was performed for each feature layer relative to the criteria, with the desired result receiving a weight of “1,” and the undesired result receiving a weight of “0.” For example, City-owned vacant lots that exist within a wetland defined by the MassGIS DEP Wetlands layer received a value of “0,” where all other City-owned vacant lots received a value of “1.”
Parts of this analysis were performed by the model seen below, while others were performed manually. The City-owned vacant lots layer used in this analysis was created from the 2023 MassGIS Tax Parcels data layer. The steps to each “1” or “0” assigned are outlined below.
MassGIS: DEP Wetlands, FEMA 100-year floodplain, and NHESP priority habitat layers were run through this model to determine the amount of each lot inside one of these feature layers. Any lot with at least more than 500 feet of said parcel outside of the feature layer received a “1,” while parcels with less than 500 feet outside of the feature layer received a “0.”
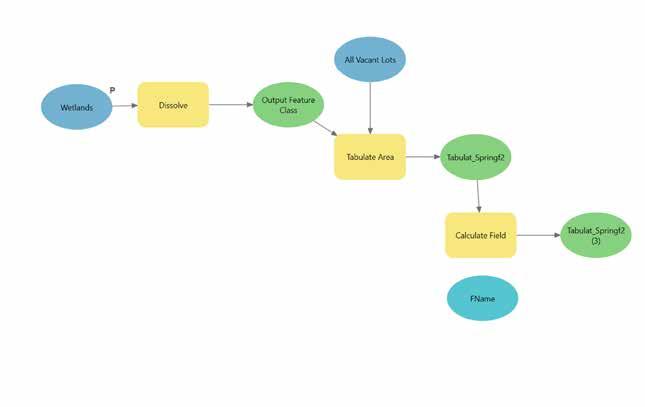
Once each feature layer relative to the criteria was given a value, all values were added up and City-owned vacant lots with the highest value for each tier were selected. Because City-owned vacant lots was already its own data layer, they were not weighted like the rest of the criteria. With that in mind, Tier 1A lots were selected with a total combined score of “8,” as this was the highest possible score if a lot met each of the criteria listed. In Tier 1B, three more criteria were added for a total combined score of “11.” Tier 2 criteria were not part of the weighted sum analysis, and Tier 3 added two more weighted criteria for a total combined score of “13.” The adjacent vacant lot criteria in Tier 3 was assessed visually through satellite imagery.
Wetlands
MassGIS: DEP Wetlands (2017)
1. “Dissolve” multiple polygons into one
2. “Tabulate area” of parcel inside of wetland
3. “Calculate field” to rename the tabulated area
4. “Join” table of tabulated area to City-owned vacant lots layer
5. “Calculate field” to add join to City-owned vacant lots layer
6. “Calculate field” to subtract area of parcel in a wetland from the total parcel area
7. “Select by attribute” to identify parcels with greater than 500 feet remaining
City-owned vacant lots with at least 500 feet outside of wetland = 1
City-owned vacant lots with less than 500 feet outside of wetland = 0
Floodplain
MassGIS: FEMA National Flood Hazard Layer (2023)
1. “Dissolve” multiple polygons into one
2. “Tabulate area” of parcel inside of 100 year floodplain
3. “Calculate field” to rename the tabulated area
4. “Join” table of tabulated area to City-owned vacant lots layer
5. “Calculate field” to add join to City-owned vacant lots layer
6. “Calculate field” to subtract area of parcel in 100 year floodplain from the total parcel area
7. “Select by attribute” to identify parcels with greater than 500 feet remaining
City-owned vacant lots with at least 500 feet outside of 100 year floodplain = 1
City-owned vacant lots with less than 500 feet outside of 100 year floodplain = 0
Priority Habitat
MassGIS: NHESP Priority Habitats of Rare Species (2021)
1. “Dissolve” multiple polygons into one
2. “Tabulate area” of parcel inside of priority habitat
3. “Calculate field” to rename the calculated area
4. “Join” table of tabulated area to City-owned vacant lots layer
5. “Calculate field” to add join to City-owned vacant lots layer
6. “Calculate field” to subtract area of parcel in priority habitat from the total parcel area
7. “Select by attribute” to identify parcels with greater than 500 feet remaining
City-owned vacant lots with at least 500 feet outside of priority habitat = 1
City-owned vacant lots with less than 500 feet outside of priority habitat = 0
NOAA: Lidar, shaded relief (2015)
1. Convert shaded relief to slope using “slope” tool
2. “Reclassify” into four fields: <5%, <8.3%, <10%, and >10%
3. “Tabulate area” of parcel inside each slope percentage
4. “Join” table of tabulated area to City-owned vacant lots layer
5. “Calculate field” to add join to City-owned vacant lots layer
6. “Calculate field” to subtract area of parcel on >5% slope from the total parcel area
7. “Select by attribute” to identify parcels with greater than 500 feet of <5% slope remaining
City-owned vacant lots with >500 feet of <5% slope = 1
City-owned vacant lots with <500 feet of <5% slope = 0
Pervious Surfaces
NOAA: Impervious Surfaces (2021)
1. “Tabulate area” of parcel with impervious surfaces
2. “Join” table of tabulated area to City-owned vacant lots layer
3. “Calculate field” to add join to City-owned vacant lots layer
4. “Calculate field” to subtract area of parcel with impervious surfaces from the total parcel area
5. “Select by attribute” to identify parcels with greater than 500 feet of pervious surfaces remaining
City-owned vacant lots with at least 500 feet of pervious surfaces = 1
City-owned vacant lots with less than 500 feet of pervious surfaces = 0
MassGIS: Chapter 21E Tier Classified Sites (2024)
1. “Select by location” to identify City-owned vacant lots that intersect with Chapter 21E sites
City-owned vacant lots that do not intersect with Chapter 21E sites = 1
City-owned vacant lots that intersect with Chapter 21E sites = 0
Commercial- P
City of Springfield: Springfield Zoning (2023)
1. “Select by location” to identify City-owned vacant lots that intersect with commercial-P
City-owned vacant lots that do not intersect with commercial-P sites = 1
City-owned vacant lots that intersect with commercial-P sites = 0
MassGIS: Building Structures (2-D) (2023)
1. “Select by location” to identify City-owned vacant lots that contain structures
City-owned vacant lots that do not contain structures = 1
City-owned vacant lots that contain structures = 0
1. “Calculate field” to add all values together
2. Total score for Tier 1A = 8
3. Change symbology to only reflect City-owned vacant lots with value of “8”
Roads
MassGIS: MassGIS-MassDOT Roads (2023)
1. Use the “buffer” tool to create 100 foot buffer around roads seeing more than 15,000 vehicles a day
2. “Select by location” to identify City-owned vacant lots that have their center in the buffer
City-owned vacant lots with their center in the buffer = 1
City-owned vacant lots that do not have their center in the buffer = 0
Bus Lines
MassDOT: RTA Bus Routes (2024)
1. Use the “buffer” tool to create a half-mile buffer around all PVTA bus lines
2. “Select by location” to identify City-owned vacant lots that intersect with the buffer
City-owned vacant lots that intersect with the buffer = 1
City-owned vacant lots that do not intersect with the buffer = 0
Plot Size: Community Garden
City-owned vacant lots
1. “Select by attribute” to identify parcels less than 5,000 square feet in size
City-owned vacant lots less than 5,000 square feet = 1
City-owned vacant lots greater than 5,000 square feet = 0
Plot Size: Community Farm
City-owned vacant lots
1. Use “select by attribute” to identify parcels greater than or equal to a quarter-acre in size
City-owned vacant lots greater than or equal to a quarteracre = 1
City-owned vacant lots less than a quarter-acre = 0
Plot Size: Urban Orchard
City-owned vacant lots
1. “Select by attribute” to identify parcels greater than or equal to 1,000 square feet in size
City-owned vacant lots greater than or equal to 1,000 square feet = 1
City-owned vacant lots less than 1,000 square feet = 0
Tier 1B Total
1. “Calculate field” to add all values together including Tier 1A values
2. Total score for each type of food production after Tier 1B = 11
3. Change symbology to only reflect City-owned vacant lots with value of “11”
Tree coverage
NOAA: Tree Canopy (2021)
1. “Tabulate area” of parcel with tree canopy
2. “Join” table of tabulated area to City-owned vacant lots layer
3. “Calculate field” to add join to City-owned vacant lots layer
4. “Select by attribute” to identify parcels with greater than 80% tree canopy
City-owned vacant lots with <80% tree canopy = 1
City-owned vacant lots with >80% tree canopy = 0
MassGIS: MassGIS-MassDOT Roads (2023)
1. “Select by location” to identify City-owned vacant lots that are within 50 feet of sidewalks
City-owned vacant lots within 50 feet of a sidewalk = 1
City-owned vacant lots within >50 feet of a sidewalk = 0
Tier 3 Total
1. “Calculate field” to add all values together including Tier 1A and Tier 1B values
2. Total score for each type of food production after Tier 3 = 13
3. Change symbology to only reflect City-owned vacant lots with value of “13”
Wetlands
MassGIS: DEP Wetlands (2017)
1. “Dissolve” multiple polygons into one 2. “Tabulate area” of parcel inside of wetland
3. “Calculate field” to rename tabulated area
4. “Join” table of tabulated area to City-owned vacant lots layer
5. “Calculate field” to add join to City-owned vacant lots layer
5. “Calculate field” to subtract area of parcel in a wetland from the total parcel area
6. “Select by attribute” to identify parcels with >500 feet remaining
City-owned vacant lots with more than 500 feet outside of
wetland = 1
City-owned vacant lots with less than 500 feet outside of wetland = 0
MassGIS: FEMA National Flood Hazard Layer (2023)
1. “Dissolve” multiple polygons into one
2. “Tabulate area” of parcel inside of 100 year floodplain
3. “Calculate field” to rename tabulated area
4. “Join” table of tabulated area to City-owned vacant lots layer
5. “Calculate field” to add join to City-owned vacant lots layer
6. “Calculate field” to subtract area of parcel in 100 year floodplain from the total parcel area
7. “Select by attribute” to identify parcels with >500 feet remaining
City-owned vacant lots with more than 500 feet outside of 100 year floodplain = 1
City-owned vacant lots with less than 500 feet outside of 100 year floodplain = 0
Priority Habitat
MassGIS: NHESP Priority Habitats of Rare Species (2021)
1. “Dissolve” multiple polygons into one
2. “Tabulate area” of parcel inside of priority habitat
3. “Calculate field” to rename tabulated area
4. “Join” table created to City-owned vacant lots layer
5. “Calculate field” to add join to City-owned vacant lots layer
6. “Calculate field” to subtract area of parcel in priority habitat from the total parcel area
7. “Select by attribute” to identify parcels with >500 feet remaining
City-owned vacant lots with more than 500 feet outside of priority habitat = 1
City-owned vacant lots with less than 500 feet outside of priority habitat = 0
Slopes
NOAA: Lidar, shaded relief (2015)
1. Convert shaded relief to slope using “slope” tool
2. “Reclassify” into four fields: <5%, <8.3%, <10%, and >10%
3. “Tabulate area” of parcel inside each slope percentage
4. “Join” table created to City-owned vacant lots layer
5. “Calculate field” to add join to City-owned vacant lots layer
6. “Calculate field” to subtract area of parcel on greater than 5% slope from the total parcel area
7. “Select by attribute” to identify parcels with greater than 500 feet of <5% slope remaining
City-owned vacant lots with at least 500 feet of <5% slope = 1
City-owned vacant lots with less than 500 feet of <5% slope = 0
MassGIS: Chapter 21E Tier Classified Sites (2024)
1. “Select by location” to identify City-owned vacant lots that intersect with Chapter 21E sites
City-owned vacant lots that do not intersect with Chapter 21E sites = 1
City-owned vacant lots that intersect with Chapter 21E sites = 0
Structures
MassGIS: Building Structures (2-D) (2023)
1. “Select by location” to identify City-owned vacant lots that contain Structures
City-owned vacant lots that do not contain structures = 1
City-owned vacant lots that contain structures = 0
City-owned vacant lots
1. “Select by attribute” to identify parcels greater than or equal to a quarter-acre in size
City-owned vacant lots greater than or equal to a quarteracre = 1
City-owned vacant lots less than a quarter-acre = 0
MassDOT: RTA Bus Routes (2024)
1. Use the “buffer” tool to create a quarter-mile buffer around all PVTA bus lines
2. “Select by location” to identify City-owned vacant lots that intersect with Bus Lines Buffer
City-owned vacant lots that intersect with the buffer = 1
City-owned vacant lots that do not intersect with the buffer = 0
MassDOT: RTA Bus Routes (2024); GoFresh and AgricOrganics Schedules (2024); MAPC: HIP Vendors (2020); MassGrown Map (2024)
1. Use the “buffer” tool to create a half-mile buffer around all food access sites
2. “Select by location” to identify City-owned vacant lots that intersect with the buffer
City-owned vacant lots that do not intersect with the buffer = 1
City-owned vacant lots that intersect with the buffer = 0
1. “Calculate field” to add all values together
2. Total score for farmers markets on City-owned vacant lots = 9
3. Change symbology to only reflect City-owned vacant lots with value of “9”
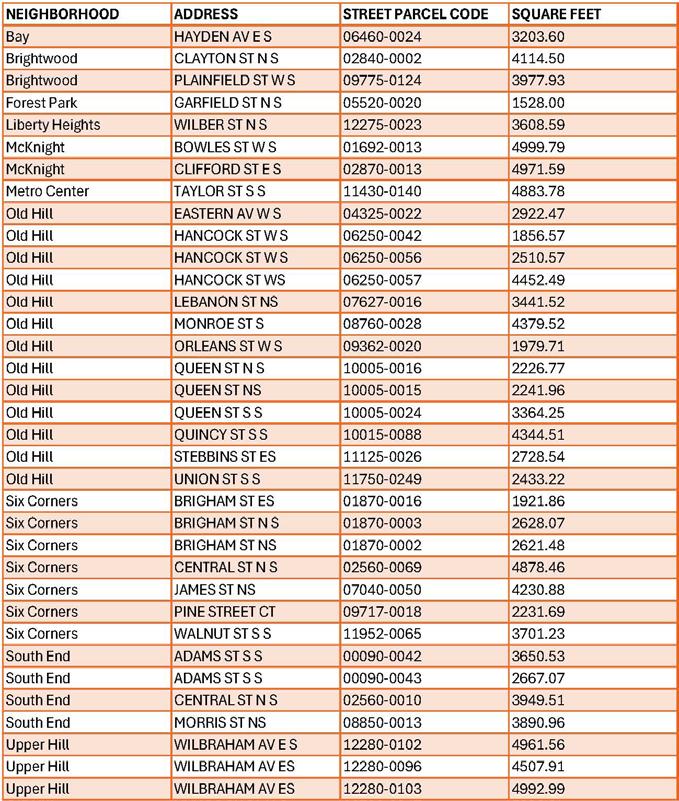

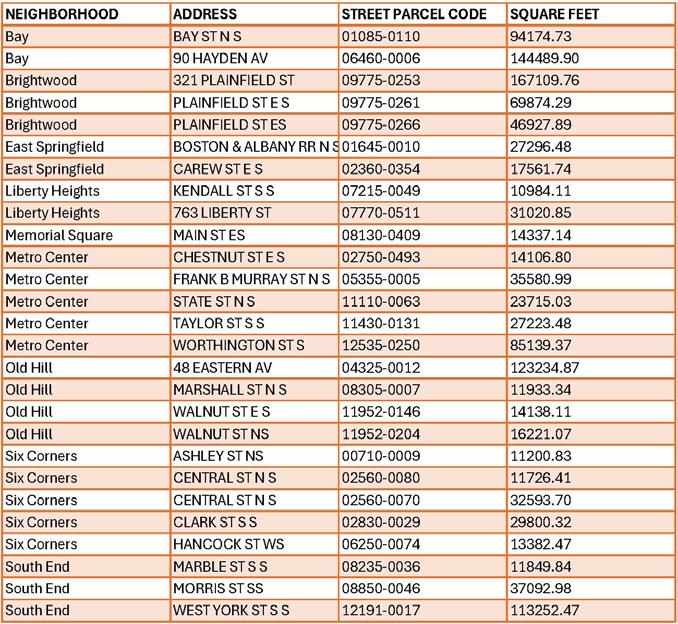

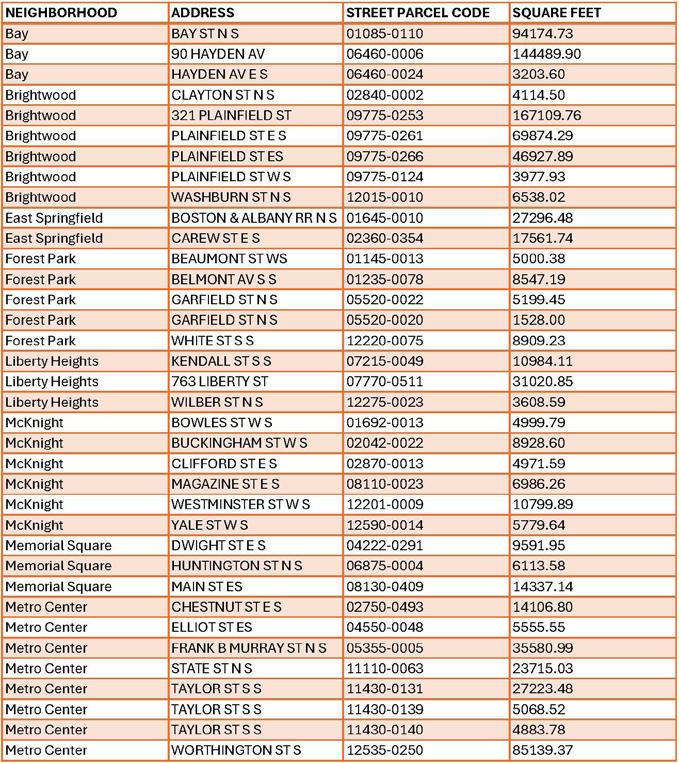
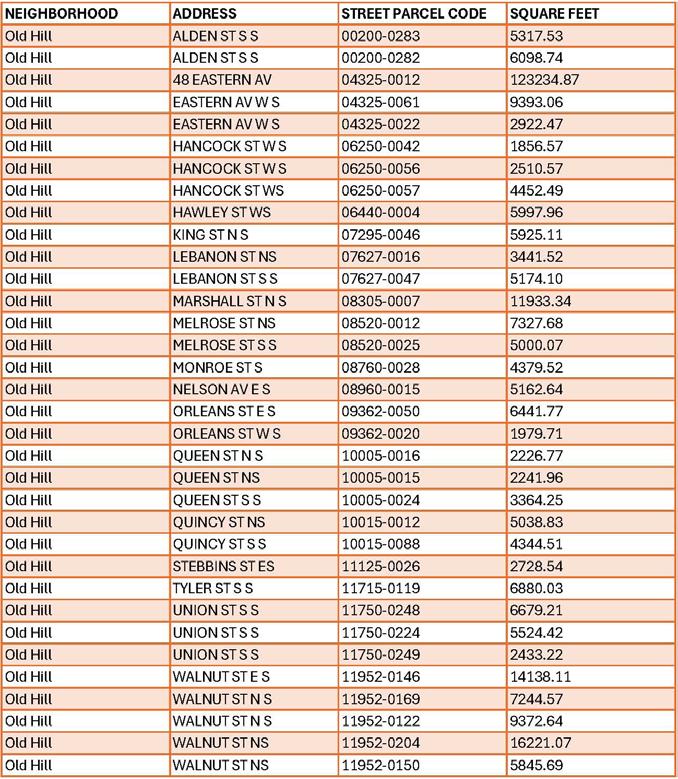
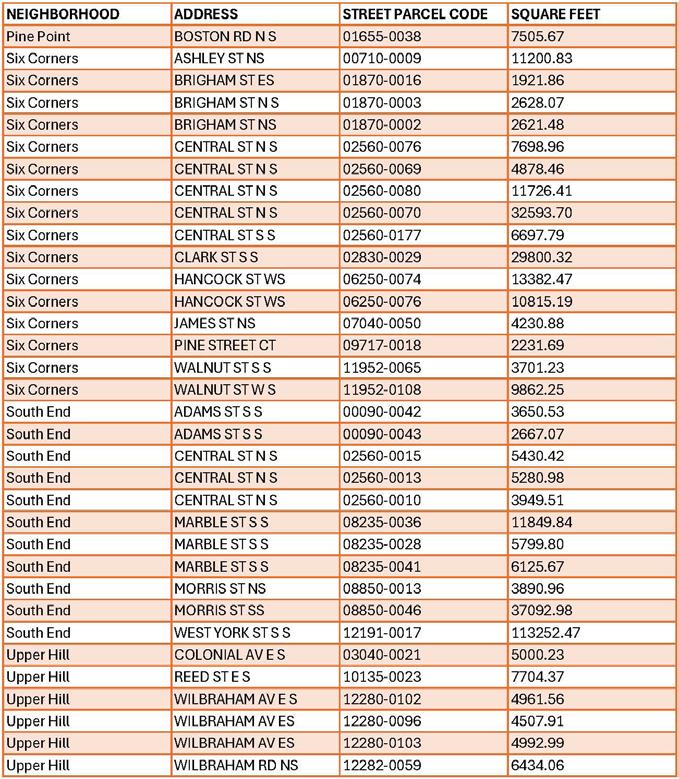
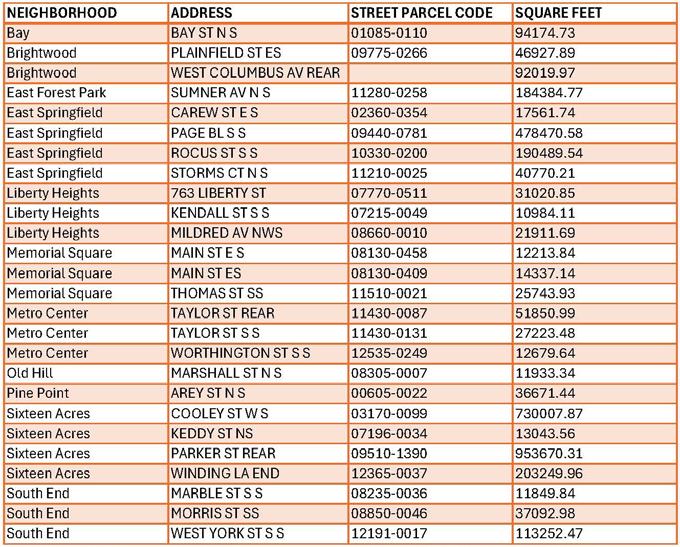
“Asthma and Allergy Foundation of America Announces 2019 Asthma Capitals.” GlobeNewswire News Room, Asthma and Allergy Foundation of America, 7 May 2019, globenewswire.com/ en/news-release/2019/05/07/1818280/0/en/Asthma-and-Allergy-Foundation-of-AmericaAnnounces-2019-Asthma-Capitals.html.
“Asthma Disparities in America.” Asthma and Allergy Foundation of America, 14 Sept. 2023, aafa.org/asthma-allergy-research/our-research/asthma-disparities-burden-on-minorities/.
Barnard, Jenna. “How Can Urban Agriculture Help Us Achieve Net Zero?” Repowering the Black Country, District Eating, zerocarbonhubs.co.uk/how-can-urban-agriculture-help-usachieve-net-zero.html. Accessed 22 Mar. 2024.
Berg, Emily, Abigail Elmwood, and Marie Macchiarolo. Food in the City: An Old Way in a New Time. Prepared for the Springfield Food Policy Council Urban Agriculture Committee, The Conway School, 2014.
Bleiweiss-Sande, Rachel, et al. “Processed food consumption is associated with diet quality, but not weight status, in a sample of low-income and ethnically diverse elementary school children.” Appetite, vol. 151: 104696, 2020. Doi:10.1016/j.appet.2020.104696.
Boston, Gabriella. “Fresh vs. Frozen: Eat Enough of the Good Stuff and It Doesn’t Really Matter.” The Washington Post, 15 Jan. 2023, washingtonpost.com/lifestyle/wellness/freshvs-frozen-eat-enough-of-the-goodstuffand-it-doesnt-really-matter/2013/01/14/f19dca24488c-11e2-b6f0-e851e741d196_story.html.
“Boston Urban Agriculture - Our Work in Ma.” Trust for Public Land, 24 Aug. 2022, tpl.org/ourwork/boston-urban-agriculture.
Bruchac, Margaret M., and Laurel Davis-Delano. Springfield-Agawam Indigenous Land Acknowledgement, sites.google.com/view/springfieldagawam-landacknowl. Accessed 15 Mar. 2024.
CCambridge, Mass. Health Lens Analysis of Urban Agriculture Policy Cambridge, MA. Metropolitan Area Planning Council, Feb. 2019, cambridgema.gov/-/media/Files/CDD/Planning/ urbanagriculture/cambridgehealthlensanalysis_final.pdf
“Car Ownership Statistics 2024.” Edited by Ashlee Valentine and Kelly Anne Smith, Forbes Advisor, Forbes Magazine, 12 Mar. 2024, forbes.com/advisor/car-insurance/ car-ownership-statistics.
Carvalho III, Joseph. Black Families in Hampden County, Massachusetts 1650-1865. Revised second edition, 2010. Accessed on academia.edu 29 Mar. 2024.
“Climate Change Indicators: Heat-Related Deaths.” United States Environmental Protection Agency, epa.gov/climate-indicators/climate-change-indicators-heat-related-deaths. Accessed 22 Mar. 2024.
“Climate Resiliency and Urban Agriculture.” Massachusetts Commercial Urban Farming Symposium, 8 Mar. 2024, Lowell, MA.
“Community Gardens.” Community Gardens | Groundwork Lawrence, groundworklawrence.org/ UrbanAgriculture. Accessed 22 Mar. 2024.
Cuyahoga County, OH. “Urban Agriculture Overlay District Health Impact Study.” pewtrusts. org/~/media/Assets/2012/01/01/UrbanAgricultureOverlayHIAPresentation.pdf.
Davis, Jaimie N., et al. “School-based gardening, cooking and nutrition intervention increased vegetable intake but did not reduce BMI: Texas sprouts - a cluster randomized controlled trial.” Int J Behav Nutr Phys Act, vol. 18, no. 18, 2021. Doi.org/10.1186/ s12966-021-01087-x.
Deksissa, Tolessa, et al. “Integrating Urban Agriculture and Stormwater Management in a Circular Economy to Enhance Ecosystem Services: Connecting the Dots.” Sustainability, vol., 13, no. 15:8293, 2021. Doi.org/10.3390/su13158293.
“Developing a Market: Case Studies of Farm Stands/Markets, CSA, and Mobile Markets.” Massachusetts Commercial Urban Farming Symposium, 8 Mar. 2024, Lowell, MA.
“Diabetes Statistics.” DRIF, Diabetes Research Institute Foundation, 10 Oct. 2023, diabetesresearch.org/diabetes-statistics/.
Egede, Leonard E., et al. “Modern Day Consequences of Historic Redlining: Finding a Path Forward.” Journal of General Internal Medicine, U.S. National Library of Medicine, May 2023, ncbi.nlm.nih.gov/pmc/articles/PMC9901820/.
Eisenhauer, Elizabeth. “In Poor Health: Supermarket Redlining and Urban Nutrition.” GeoJournal, vol. 53, no. 2, 2001, pp. 125–33. JSTOR, www.jstor.org/stable/41147594. Accessed 4 Apr. 2024.
Entwistle, Marcela R., Donald Schweizer, and Ricardo Cisneros. “Dietary patterns related to total mortality and cancer mortality in the United States.” Cancer Causes Control, vol. 32, 2021, pp. 1279–1288. Doi.org/10.1007/s10552-021-01478-2.
“Environmental Justice Policy.” Mass.Gov, Oct. 2022, mass.gov/info-details/ environmental-justice-policy.
Finnell, W. Kyle, Sean Hagan, and Harrison Takeno Houser. A Spatial Analysis Supporting Holyoke’s Food System: Mapping Food Production, Composting, and Healthy Food Access. Prepared for the City of Holyoke, The Conway School, 2022.
“Food Access Research Atlas Interactive Guide.” Experience, USDA, gisportal.ers.usda.gov/ portal/apps/experiencebuilder/experience/?id=a53ebd7396cd4ac3a3ed09137676fd40&pa ge=Introduction. Accessed 20 Mar. 2024.
“Food Access Research Atlas.” USDA ERS - Food Access Research Atlas, 27 Sept. 2023, ers. usda.gov/data-products/food-access-research-atlas/.
“Food Establishments at Events and Farmers Markets Questions and Answers.” Mass.Gov, 25 July 2019, mass.gov/info-details/ food-establishments-at-events-and-farmers-markets-questions-and-answers#what-arethe-restroom-and-handwashing-requirements-farmers-markets-or-events?
“Food Security in the U.S.: Overview.” USDA ERS - Food Security in the U.S., 25 Oct. 2023, ers. usda.gov/topics/food-nutrition-assistance/food-security-in-the-u-s/.
“Food Security Toolkit.” PVPC, Pioneer Valley Planning Commission, pvpc.org/content/foodsecurity-toolkit. Accessed 23 Mar. 2024.
Foster, Paul, et al. “A Demographic and Economic Analysis of the City of Springfield,” Pioneer Valley Planning Commission, Sept. 2006, springfield-ma.gov/planning/fileadmin/Planning_ files/Springfield_Market_Study_2006.pdf.
GGaertner, Kurt. “Planning and Urban Agriculture,” Mass.gov, n.d., mass.gov/doc/kurt-gaertnereea/download.
Gaskin, Darrell J, et al. “Disparities in Diabetes: The Nexus of Race, Poverty, and Place.” American Journal of Public Health, U.S. National Library of Medicine, Nov. 2014, www.ncbi. nlm.nih.gov/pmc/articles/PMC4021012/.
Granberry, Phillip, and Krizia Valentino. “Latinos in Massachusetts: Puerto Ricans.” Gastón Institute Publications, March 2020. 249, scholarworks.umb.edu/gaston_pubs/249.
Gripper, Ashley. “We Don’t Farm Because It’s Trendy; We Farm as Resistance, for Healing and Sovereignty.” Environmental Health News, 27 May 2020, ehn.org/black-farming-foodsovereignty-2645479216.html.
“A Guide to Selling at Farmers’ Markets.” Mass.Gov, mass.gov/ guides/a-guide-to-selling-at-farmers-markets. Accessed 19 Mar. 2024.
Gupta, Anindita. “Gardening and stress management.” International Journal of Home Science, vol. 8, no. 2, 4 Mar. 2022, pp. 61–63, homesciencejournal.com/archives/2022/vol8issue2/ PartB/8-2-1-196.pdf.
HHahn, Kristine. “Insurance for Community Gardens,” Michigan State University Extension, 30 Dec. 2013, https://www.canr.msu.edu/news/insurance_for_community_gardens.
Hamin, Elisabeth, August Williams-Eynon, and Catherine Ratté. “Springfield Climate Action & Resiliency Plan: Vulnerability and Resilience.” Landscape Architecture & Regional Planning Studio Research, 53, 2017, scholarworks.umass.edu/larp_grad_research/53.
Harris, Neil, Fiona Rowe Minniss, and Shawn Somerset. “Refugees Connecting with a New Country through Community Food Gardening.” International Journal of Environmental Research and Public Health, vol. 11, no. 9, 2014. Doi.org/10.3390/ijerph110909202.
“Health Effects of Overweight and Obesity.” Centers for Disease Control and Prevention, 24 Sept. 2022, cdc.gov/healthyweight/effects/index.html.
Healthy Food Policy Project. Center for Agriculture and Food Systems at Vermont Law School (CAFS), the Public Health Law Center (PHLC), and the Rudd Center for Food Policy and Health at the University of Connecticut, 16 Mar. 2022, healthyfoodpolicyproject.org.
“Heart Disease Facts.” Centers for Disease Control and Prevention, 15 May 2023, cdc.gov/ heartdisease/facts.htm.
“Homegrown Foods from the Garden Make Family Meals Healthier” American Heart Association, heart.org/en/healthy-living/healthy-eating/cooking-skills/meal-planning/homegrownmeals. Accessed 22 Mar. 2024.
Home Grown Springfield. “School Garden Program.” Springfield Public Schools Food, 2024, homegrownspringfield.org/.
“How Does Urban Agriculture Help Mitigate the Urban Heat Island Effect?” Eco.Gov.Capital, 12 Sept. 2023, eco.gov.capital/ how-does-urban-agriculture-help-mitigate-the-urban-heat-island-effect/.
“How Parks and Green Spaces Can Improve Your Health.” College of Natural Resources News, North Carolina State University, 20 Apr. 2022, cnr.ncsu.edu/news/2022/04/ parks-green-spaces-improve-health/.
“How to Run a Farmers Market.” Mass.Gov, www.mass.gov/guides/how-to-run-a-farmersmarket. Accessed 5 Apr. 2024.
Humaida, N, et al. “Urban gardening for mitigating heat island effect.” IOP Conference Series: Earth and Environmental Science, vol. 1133, no. 1. Doi. org/10.1088/1755-1315/1133/1/012048.
I“Impervious Surfaces Definition.” Law Insider, www.lawinsider.com/dictionary/impervioussurfaces. Accessed 5 Apr. 2024.
Jensen, Emily. “Food Apartheid.” Regeneration.Org, regeneration.org/nexus/food-apartheid. Accessed 20 Mar. 2024.
“Johnny Appleseed Orchard Gets Fall Clean Up.” ReGreen Springfield, 20 Nov. 2016, regreenspringfield.org/johnny-appleseed-orchard-gets-fall-clean-up/.
Kazini, Imani. “Black Springfield: A Historical Study.” Contributions in Black Studies: A Journal of African and Afro-American Studies, vol. 1, Article 2, 1977, scholarworks.umass.edu/ cibs/vol1/iss1/2/.
Kazini, Imani. “Black Springfield: A Historical Study.” Contributions in Black Studies: A Journal of African and Afro-American Studies, vol. 2, article 4, 1978, scholarworks.umass.edu/ cibs/vol2/iss1/4/.
Kilduff, Andrew and Tim Tensen. A Plan takes Root: Brockton Urban Agriculture Plan. Prepared for the City of Brockton Department of Planning and Economic Development, The Conway School, 2017.
Kim, Jihye, and Edward Giovannucci. “Healthful Plant-Based Diet and Incidence of Type 2 Diabetes in Asian Population.” Nutrients vol. 14, no. 15: 3078, 27 Jul. 2022, doi:10.3390/ nu14153078.
Kuhnle, Gunter, and Niranjan, Keshavan. “Frozen and Tinned Foods Can Be Just as Nutritious as Fresh Produce – Here’s How.” The Conversation, 21 Mar. 2023, theconversation.com/ frozen-and-tinned-foods-can-be-just-as-nutritious-as-fresh-produce-heres-how-201740.
LLawrence, Mass. Additional Amendments to the Zoning Ordinance; Planned Industrial Development District, Add to Section 29-11: Use Table, May 2019, cityoflawrence.com/ DocumentCenter/View/12710/ Additional-amendments-to-the-Zoning-Ordinance-May-2019-PDF.
Lin, Brenda, Monica Egerer, and Allesandro Ossola. “Urban Gardens as a Space to Engender Biophilia: Evidence and Ways Forward.” Front. Built Environ, vol. 4, no. 79, 17 December 2018. Doi.org/ 10.3389/fbuil.2018.00079.
Liu Y, Eicher-Miller HA. “Food Insecurity and Cardiovascular Disease Risk.” Curr Atheroscler Rep 2021 Mar 27, ncbi.nlm.nih.gov/pmc/articles/PMC8000689/.
Lutheran Senior Services. “Health Benefits of Gardening for Seniors.” lssliving.org/news/ resources/health-benefits-of-gardening-for-seniors/. Accessed 22 Mar. 2024.
Manning, Jodi-Lyn. Interview by Mass Farmers Markets. “The Farmers Market at Forest Park is Open!” Mass Farmers Markets, 17 Aug. 2022, massfarmersmarkets.org/news/ forest-park-farmers-market.
“Map the Meal Gap.” Food Insecurity Among Overall (All Ages) Population in the United States, Feeding America, map.feedingamerica.org/. Accessed 22 Mar. 2024.
Marshall, Lisa. “Why Your Kids Should Spend Time Outdoors.” WebMD, www.webmd.com/ parenting/features/kids-spend-time-outdoors. Accessed 22 Mar. 2024.
“Massachusetts.” Data USA, datausa.io/profile/geo/massachusetts. Accessed 22 Mar. 2024.
Massachusetts. “Food Is Medicine State Plan,” The Center for Health Law and Policy Innovation of Harvard Law School, Community Servings, June 2019, foodismedicinema.org/.
Massachusetts Food System Collaborative. “HIP Fact Sheet.” Massachusetts Food System Collaborative, 20 Mar. 2024, www.mafoodsystem.org/projects/ campaign-for-healthy-incentives-program-funding/.
“Massachusetts Hip Gives You Money Back When You Use Your SNAP Benefits to Buy Healthy, Local Fruits and Vegetables from Hip Farm Vendors.” Mass.Gov, mass.gov/massachusettship-gives-you-money-back-when-you-use-your-snap-benefits-to-buy-healthy-local-fruitsand-vegetables-from-hip-farm-vendors. Accessed 5 Apr. 2024.
Massachusetts. Massachusetts Healthy Soils Action Plan. Executive Office of Energy and Environmental Affairs, 2022, mass.gov/doc/healthy-soils-action-plan-2023/download.
Massachusetts. Resilient Lands Initiative: Expanding Nature’s Benefits Across the Commonwealth. Executive Office of Energy and Environmental Affairs, Jan. 2023, mass. gov/doc/the-resilient-lands-initiative-2023/download.
McCorkindale, Emma. “Springfield Receives Two Major Grants for Parks around the City.” WWLP, 31 Oct. 2023, www.wwlp.com/news/local-news/hampden-county/ springfield-to-receive-two-major-grants-for-parks/.
“Mission.” Gardening the Community, gardeningthe.org/mission.html. Accessed 22 Mar. 2024. Monier, E., Gao, X. “Climate change impacts on extreme events in the United States: an uncertainty analysis.” Climatic Change, vol. 131, 2015, pp. 67–81. Doi.org/10.1007/ s10584-013-1048-1.
Nelson, Robert K., LaDale Winling, et al. “Mapping Inequality: Redlining in New Deal America.” Edited by Robert K. Nelson and Edward L. Ayers, American Panorama: An Atlas of United States History, 2023, dsl.richmond.edu/panorama/redlining.
“NCI Dictionary of Cancer Terms: Heart Disease.” National Cancer Institute, cancer.gov/ publications/dictionaries/cancer-terms/def/heart-disease. Accessed 17 Mar. 2024.
Our Plural History Springfield MA. “Industrialization and Immigration.” Springfield, MA - Our Plural History, Springfield Technical Community College, 2009, ourpluralhistory.stcc.edu/ industrial/.
Our Plural History Springfield MA. “Recent Arrivals: Puerto Rican Communities in the Valley.” Springfield, MA - Our Plural History, Springfield Technical Community College, 2009, ourpluralhistory.stcc.edu/recentarrivals/puertoricans.html.
Our Plural History Springfield MA. “Resisting Slavery - Primus Mason.” Springfield, MA - Our Plural History, Springfield Technical Community College, 2009, ourpluralhistory.stcc.edu/ resistingslavery/primus.html.
Park, K-Sue. “Race, Innovation, and Financial Growth: The Example of Foreclosure.” Histories of Racial Capitalism, edited by Justin Leroy and Destin Jenkins, New York Chichester, West Sussex: Columbia University Press, 2021, pp. 27-52. Doi.org/10.7312/jenk19074-003.
Park, Sin-Ae, et al. “Gardening Intervention for Physical and Psychological Health Benefits in Elderly Women at Community Centers.” HortTechnology hortte, vol. 26, no. 4, 2016, pp. 474-483. Doi.org/10.21273/HORTTECH.26.4.474.
Piracha, Awais, and Muhammad Tariq Chaudhary. “Urban Air Pollution, Urban Heat Island and Human Health: A Review of the Literature.” Sustainability vol. 14, no. 15: 9234, 28 July 2022, doi.org/10.3390/su14159234.
“Products and Schedule.” HOME, gofreshmobilemarket.org/. Accessed 5 Apr. 2024.
RReGreen Springfield. “Examining Springfield’s Environmental Equity Using Key Environmental and Demographic Indicators: Community-based reporting using i-Tree Landscape and EPA EJSCREEN.” July 2023, /viewer.joomag.com/ examining-springfields-environmental-equity-clf-reportdb/0175380001689026145?short&.
Richardson, Jason, et al. “Redlining and Neighborhood Health.” NCRC, National Community Reinvestment Coalition, 28 June 2023, ncrc.org/holc-health/.
Rivera, Diana. “Should We Still Be Saying ‘Food Desert’?” HealthCity, healthcity.bmc.org/policyand-industry/should-we-still-be-saying-food-desert. Accessed 22 Mar. 2024.
Ross, Clare. “Gardening as Exercise.” Maryland Primary Care Physicians, mpcp.com/articles/ healthy-lifestyle/gardening-as-exercise/#:~:text=Gardening%20works%20all%20the%20 major,to%20healthier%20bones%20and%20joints. Accessed 22 Mar. 2024.
Rothstein, Richard. The Color of Law: A Forgotten History of How Our Government Segregated America. Liveright Publishing Corporation, a Division of W.W. Norton & Company, 2018. Rothbard, Murray N. “Disintegration of the Fur Monopoly.” Mises Institute: Austrian Economics, Freedom, and Peace, 17 Jan. 2012, mises.org/mises-daily/disintegration-fur-monopoly.
Sanchez, Gabriel R. “What Are the Consequences of the Latino Undercount in the 2020 U.S. Census?” Brookings, The Brookings Institution, 24 Mar. 2022, brookings.edu/articles/ what-are-the-consequences-of-the-latino-undercount-in-the-2020-u-s-census/.
Sands, Catherine, and Kristen Whitmore. Transforming School Food, Transforming Communities: Ingredients for Building a Holistic School Meal Program in Springfield, MA In partnership with Springfield Public Schools, Sodexo, Mercy Medical Center, Springfield Food Policy Council, and Springfield’s Culinary and Nutrition Center Advisory Council, June 2020, fertilegroundllc.com/wp-content/uploads/2020/09/FERTILE-GROUNDTRANSFORMING-SCHOOL-FOOD-TRANSFORMING-COMMUNITITES.pdf.
Schmidt-Hertha, Bernhard, and Sabina Jelenc Krašovec. “Learning Across Generations in Europe.” Edited by Marvin Formosa. Research on the Education and Learning of Adults, vol. 2, 2014. Doi.org/10.1007/978-94-6209-902-9.
Soga, Masashi, et al. 2017. “Health Benefits of Urban Allotment Gardening: Improved Physical and Psychological Well-Being and Social Integration” Intl Journal of Environmental Research and Public Health, vol. 14, no. 1: 71, 2017. Doi.org/10.3390/ijerph14010071.
“Springfield Armory Closes.” Mass Moments, MassHumanities, massmoments.org/momentdetails/springfield-armory-closes.html. Accessed 15 Mar. 2024.
“Springfield Food Retail Environment Survey for Health (FRESH): an Assessment of Healthy Food Access in Low-Income Neighborhoods in Springfield, MA.” The Springfield Department of Health and Human Services (SHHS) Mass in Motion, Pioneer Valley Planning Commission (PVPC), 2018.
Springfield Food Policy Council, www.springfieldfoodpolicycouncil.org/. Accessed 19 Mar. 2024.
Springfield Food Retail Environment Survey for Health (FRESH): an Assessment of Healthy Food Access in Low-Income Neighborhoods in Springfield, MA. City of Springfield, Department of Health and Human Services (SHHS) Mass in Motion, Pioneer Valley Planning Commission (PVPC), 2018.
Springfield, Mass. Open Space and Recreation Plan 2022-2027, City of Springfield, 2022, springfield-ma.gov/park/fileadmin/Laura_Walsh/Spfld_Open_Space___Recreation_ Plan_2022_FINAL_VERSION.pdf.
Springfield, Mass. Open Space and Recreation Plan 2015-2022, City of Springfield, 2015, springfield-ma.gov/planning/fileadmin/Planning_files/Open_Space_Plan/OpenSpace_ FINAL_2015.pdf.
Springfield, Mass. Strong, Healthy, and Just: Springfield’s Climate Action and Resiliency Plan, City of Springfield, 2017, pvpc.org/sites/default/files/SHJ_REPORT_FINAL_REV_2017.pdf and springfield-ma.gov/dr/fileadmin/community_dev/DR/CARP_FINAL_REV_2017.pdf.
Springfield, Mass. Municipal Code, Part II: General Legislation, ch. 154 § Community Gardens (2012).
Springfield, Mass. Zoning Ordinances, 2013, updated 2023, springfield-ma.gov/planning/ fileadmin/Planning_files/Zoning_2013_Documents_Images/Final_5_28_13_ Effective_8_26_13_Amended_7_18_23.pdf.
Springfield, Mass. “Temporary License and Hold Harmless Agreement Community Garden, 1 Year License,” springfield-ma.gov/planning/fileadmin/Planning_files/Temporary_License_ and_Hold_Harmless_Agreement_-_Community_Garden_-_1_Year_License.pdf.
Springfield, Mass. “City of Homes.” City of Homes: City of Springfield, MA, 19 Aug. 2021, www. springfield-ma.gov/cos/gtk-homes.
T“Teaching with Documents: Photographs of Lewis Hine: Documentation of Child Labor.” National Archives and Records Administration, National Archives and Records Administration, www.archives.gov/education/lessons/hine-photos. Accessed 19 Mar. 2024.
“Things to Do.” National Parks Service, U.S. Department of the Interior, nps.gov/spar/ planyourvisit/things2do.htm. Accessed 19 Mar. 2024.
“Torrential Flooding.” Cybersecurity and Infrastructure Security Agency, cisa.gov/topics/criticalinfrastructure-security-and-resilience/extreme-weather-and-climate-change/torrentialflooding#. Accessed 22 Mar. 2024.
Tuthill, Paul. “Springfield Expands Tree Planting Program to a Fifth Neighborhood.” WAMC, WAMC Northeast Public Radio, 10 Oct. 2023, wamc.org/news/2023-10-10/ springfield-expands-tree-planting-program-to-a-fifth-neighborhood.
UCAR Center for Science Education. “How Weather Affects Air Quality.” How Weather Affects Air Quality | Center for Science Education, 2024, scied.ucar.edu/learning-zone/air-quality/ how-weather-affects-air-quality.
Unsplash, unsplash.com/. Accessed 6 Apr. 2024.
U.S. Census Bureau. “Census Bureau Releases Estimates of Undercount and Overcount in the 2020 Census.” Census.Gov, 10 Mar. 2022, census.gov/newsroom/pressreleases/2022/2020-census-estimates-of-undercount-and-overcount.html.
Viles, Chance, and Kristin Palpini. “Forgotten: Springfield’s Black History Is Nowhere in Sight.” Valley Advocate, 5 June 2017, valleyadvocate.com/2017/06/05/ forgotten-springfield-black-history-nowhere/.
Walker, Jo. “Food Desert” vs. “Food Apartheid”: Which Term Best Describes Disparities in Food Access?, 29 Nov. 2023, seas.umich.edu/news/ food-desert-vs-food-apartheid-which-term-best-describes-disparities-food-access.
Webber, Liz. “Supervalu Gains Wholesale Business of America’s Food Basket.” Supermarket News, 9 Nov. 2016, www.supermarketnews.com/retail-financial/ supervalu-gains-wholesale-business-americas-food-basket.
Wilson, Beattra. “Urban Fruit for Urban Communities.” USDA, 16 Dec. 2011, usda.gov/media/ blog/2011/12/16/urban-fruit-urban-communities.
“What Is Carbon Sequestration?” United States Geological Survey, United States Department of the Interior, usgs.gov/faqs/what-carbon-sequestration. Accessed 22 Mar. 2024.
Zhu, Rui, and Galen Newman. “The projected impacts of smart decline on urban runoff contamination levels.” Computational Urban Science, vol. 1, no. 2, 2021, doi.org/10.1007/ s43762-021-00002-1.
“Zoning for Urban Agriculture.” Healthy Food Policy Project, 7 Mar. 2024, healthyfoodpolicyproject.org/key-issues/zoning-for-urban-agriculture.
Bartack, Jaimye. Communications Manager, Springfield Water and Sewer Commision. “Re: Conway School GIS data.” Received by Daniella Portal, 4 Mar. 2024.
Basch, Becky. Senior Planner at Pioneer Valley Planning Commission. Personal interview. 1 Mar. 2024.
Bland, Benjamin. Mass in Motion Coordinator, City of Springfield, MA. Personal interview. 6 Mar. 2024.
Cesan, Kerry. Springfield Public Schools Garden Coordinator. “Re: Food Access Project for Springfield Food Policy Council.” Received by Kerry Morgan, 1 Mar. 2024.
Dromey, Philip. Deputy Director of Planning, City of Springfield, MA. “Re: Stakeholder Interview - Springfield Food Policy Council Food Access Project.” Received by Kerry Morgan, 4 Mar. 2024.
Gregory, Clay. Senior Content Coordinator, Food Bank of Western Massachusetts. “Re: Contact Us, Food Insecurity Data.” Received by Kerry Morgan, 28 Feb. 2024.
O’Gilvie, Liz. Director, Springfield Food Policy Council and Director, Gardening the Community. Personal interview. 6 Mar. 2024.
Randle, Ashley. Massachusetts Commissioner of Agriculture. Personal interview. 26 Feb. 2024.
Ratté, Catherine. Director, Land Use and Environment Department, Pioneer Valley Planning Commission. Personal interview. 26 Feb. 2024.
Richmond, Anne. Owner of Nordica Street Community Farm, Springfield, MA. Personal interview. 2 Feb. 2024.
Sands, Catherine. Founder of Fertile Ground LLC. Personal interview. 20 Feb. 2024.
Sullivan, Patrick with Alex Sherman, Tom McCarthy, and Tom Dougal. Department of Parks, Buildings, and Recreation Management, City of Springfield, MA. Personal interview. 28 Feb. 2024.
All of the photographs included in this report were provided by individuals affiliated with the Conway School, Gardening the Community, or the Creative Commons (Unsplash).
[Detail] Foster, John. A map of New-England, being the first that ever was here cut, and done by the best pattern that could be had, which being in some places defective, it made the other less exact ; yet doth it sufficiently shew the scituation of the countrey, and conveniently well the distance of places. [1677]. Web. 23 Mar 2024. <https://ark. digitalcommonwealth.org/ ark:/50959/3f462s808>.
P. 13
[Detail] Seller, John, fl. 1658-1698, and active 17th century John Hills. A map of New England. London: And are to be sold at his shop at the Hermitage in Wapping and by Iohn Hills in Exchange Alley in Cornhill, [1675]. Web. 12 Mar 2024. <https://ark. digitalcommonwealth.org/ ark:/50959/3f462s90h>.
P. 14
Main Street, Springfield, Mass., c. 1905, Library of Congress. <https://www.loc.gov/ pictures/item/2016799846/>.
Lewis Hine, Group in front of Indian Orchard Mfg. Co., 1911, Indian Orchard, Mass. Wikimedia Commons. <https:// en.m.wikipedia.org/wiki/File:Group_in_front_ of_Indian_Orchard_Mfg._Co._Everyone_in_ photo_was_working._Indian_Orchard,_ Mass._-_NARA_-_523445.jpg#metadata>.
Smith & Wesson Factory, Springfield, Mass., c. 1910. Agawam Historical Sites and Images. <https://imagemuseum.smugmug.com/ History/Springfield-2/i-KG7Ttzv>.
O.H. Bailey & Co. View of Springfield, Mass. [N.P, 1875] Map. Retrieved from the Library of Congress, <www.loc.gov/item/75694606/>.
16
Left: Massachusetts. State Planning Board. Land Utilization City of Springfield. February 1940. Web. 12 Mar 2024. <https://ark. digitalcommonwealth.org/ark:/50959/ jd475n14w>.
Right: 437–449 Bay Street, WPA photograph, 1938-39. Retrieved from the Springfield Preservation Trust, https:// springfieldpreservation.org/wpa/.
P. 31, 32, 67
American Community Survey (ACS) info:
Steven Manson, Jonathan Schroeder, David Van Riper, Katherine Knowles, Tracy Kugler, Finn Roberts, and Steven Ruggles. IPUMS National Historical Geographic Information System: Version 18.0 [dataset]. Minneapolis, MN: IPUMS. 2023. http://doi.org/10.18128/ D050.V18.0
Maps that use NRCS SSURGO data:
“This Soil Survey Geographic (SSURGO) database was produced by the U.S. Department of Agriculture, Natural Resources Conservation Service and cooperating agencies for the Soil Survey of Hampden County, MA. Enlargement of these maps to scales greater than that at which they were originally mapped can cause misunderstanding of the detail of mapping. If enlarged, maps do not show the small areas of contrasting soil that could have been shown at a larger scale.
The depicted soil boundaries and interpretations derived from them do not eliminate the need of onsite sampling, testing, and detailed study of specific sites for intensive uses. Thus, this map and its interpretations are intended for planning purposes only. Digital data files are periodically updated. Files are dated, and users are responsible for obtaining the latest version of the data.”
Integrating urban agriculture into the framework of municipal planning has been gaining momentum over the past several decades, as increasing access to and the cultivation of green spaces have been found to positively affect public health, food security, racial equity, and climate change resiliency. This is true of Springfield, Massachusetts, which is the third largest city in the state and a regional center. Residents and nonprofits have been actively working with the City to strengthen the local food system and this report, prepared for the Springfield Food Policy Council, builds on these precedents. Looking at vacant lots within Springfield as sites of possibility, the report assesses their suitability for food production in the form of community gardens, community farms, and urban orchards, as well as food access in the form of farmers markets and farm stands. Alongside recommending lots, this report gathers opportunities and recommendations on a municipal level with the goal of supporting the growth of urban agriculture within Springfield.
