

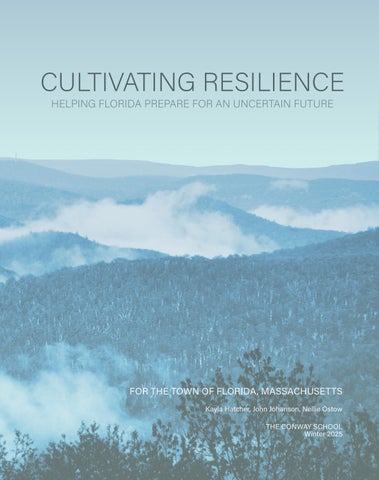

Kayla Hatcher, John Johanson, Nellie Ostow
THE CONWAY SCHOOL
Winter 2025


Deep gratitude to the many communities and individuals that supported the creation of this report: Faculty and staff from the Conway School; Jill Craig & Andy Vecchio from Conservation Works, LLC; the town representatives from Florida: Joan Lewis (Town Administrator), Timothy Zelazo (Town Select Board), Neil Oleson (Town Select Board), Chief Mike Gleason (Town Fire Department Chief), James White (Town Highway Department), Matthew Cole (Great River Hydro), and Martin McEnvoy (Principal, Abbott Memorial School); Sergeant Andy Canata from the State Police; Emma Sass (Regional MVP Coordinator), Jeffrey Zukowski (State Hazard Mitigation Planner), and Luke Labendz (State DCR Field Operations Team Leader) from the State of Massachusetts; ecologists and foresters Jesse Bellemare, Tom Brule, and Bill Patterson; Dr. Jeff Bendremer (Tribal Historic Preservation Officer) from the Stockbridge-Munsee Community; non-profit stakeholders Angela Sirois (The Nature Conservancy), and Melanie Winters & Nick Pitel (Berkshire Natural Resources Council); Dave Hearn from Crisis Relief and Recovery; and, Raine Brown for sharing the Stanley L. Brown Photo Archive.

The town of Florida is a small, rural community in the northwest corner of Massachusetts in Berkshire County. The Town hired Conservation Works, LLC, to create a combined Municipal Vulnerability Preparedness Plan (MVP) and Hazard Mitigation Plan (HMP) which this report is supporting. The combined MVP/HMP seeks to assess hazards and vulnerabilities in the municipality and plan for greater climate-change resilience. This report, prepared by graduate students at the Conway School, begins to consolidate and analyze the hazards and risks that the community is concerned about and suggests actions that can be taken to support Florida’s resilience and adaptability.
This report contains three main sections: Environmental, Infrastructural, and Societal. In each of parts of the report, existing conditions and analyses are provided in the context of natural hazards and vulnerabilities that affect the town of Florida. Each section also includes recommendations to consider in the MVP/HMP planning process. While the report is organized into three sections, there is overlap between each: Florida is a tapestry that weaves together the threads of its ecological landscape, infrastructural components, and societal network. Therefore if one thread is affected, it will impact the others.
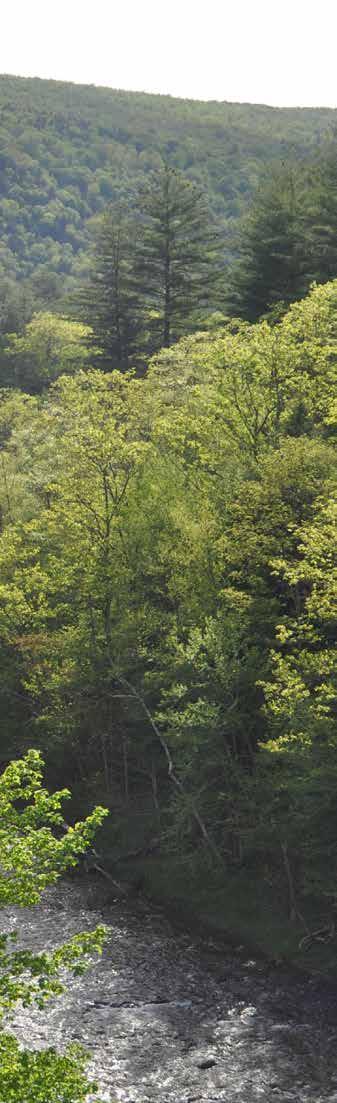
Environmental: One of Florida’s many assets is that it remains very forested, with intact ecosystems that support not only the Florida community but also a range of wildlife and plants. There are potential risks posed to these ecosystems which stand to have a substantial impact on both Florida’s biodiversity and the human community in turn. Some of the hazards to Florida’s habitats may include the potential of increased risk of wildfire, the spread of pests and pathogens that impact a variety of tree species, and the potential of future development and associated fragmentation of ecosystems.
Infrastructural: Florida’s infrastructure is vital for local and regional transit, communication, and housing security. Florida contains State Route 2, a wind turbine farm, the Hoosac Tunnel (a five-mile long train tunnel), and a hydroelectric dam on the Deerfield River. The town's structures and water, sewer, and stormwater management are decentralized and have existing points of water supply contamination. Potential damage to Florida’s infrastructure stands to increase due to the growing frequency and intensity of extreme weather events. There is a neighborhood in the low-lying valley next to the Deerfield River that has a unique set of associated hazards including flooding, dam breach, and potential risks associated with the rail infrastructure coming through the Hoosac Tunnel.
Societal: The 2023 census reports 770 residents forming a tight-knit community. Generally the population is aging and a small number of people have social and health vulnerabilities; some households don’t have access to transportation. The main concerns pertain to the community’s capacity to respond to crises and localized disasters that impact vulnerable populations, such as elderly folks or those with disabilities. The community's reliance on neighboring towns for medical, grocery, and fuel increases their vulnerabilities and creates a heightened risk of health and safety concerns for the town in the event of an emergency or natural disaster.
Recommendations: The recommendations in each section seek to provide suggestions for the Town and residents to help prepare for greater resilience in the face of known and unknown hazards. They include improving communications, infrastructure, and planning in order to prepare the Florida community for the risks associated with a shifting climate and the increased frequency of extreme weather events.
This report is supporting the creation of a combined Municipal Vulnerability Preparedness Plan (MVP) and Hazard Mitigation Plan (HMP) for the Town of Florida, Massachusetts. A team of graduate students from the Conway School worked from January 2025 to April 2025 alongside Conservation Works, LLC, which will ultimately complete the combined plans in June 2025. The Conway team’s scope of work was to conduct preliminary mapping of assets, vulnerabilities, and hazards in the town of Florida, which will inform the development of the MVP/HMP.
A Municipal Vulnerability Preparedness Plan (MVP) aims to help municipalities identify climate hazards, assess vulnerabilities, and develop action plans and projects to increase resilience to climate change (ResilientMass).
A Hazard Mitigation Plan (HMP) helps to form the basis for a community’s long-term strategy to reduce disaster losses and break the cycle of disaster damage and reconstruction (FEMA).
The Conway team has been involved in the standard MVP/HMP process of community engagement, facilitated by Conservation Works, LLC. The MVP process has involved multiple meetings with a Core Team from the Town of Florida, including the Town Administrator, members of the Select Board, the Fire Chief, the Highway Department, and other representatives. The MVP process also includes two, four-hour Community Resilience Building Workshops (CRB) that are open to other community members to share and prioritize concerns about hazards in the community. One of these CRB workshops took place on March 15, 2025, and the Conway team was present. The next one will take place on May 10, 2025 which is after the conclusion of the Conway team’s work. The Core Team meetings and CRB Workshops have the goal of identifying natural hazards and vulnerabilities that the community has faced or could face, and outlining action items to help Florida to be more prepared in the future. The concerns and experiences of the residents of the town of Florida have been incorporated into a section of this report on Community Perspective.
Completion of this plan by Conservation Works, LLC, and the Town of Florida will enable Florida to apply for grant funding to address specific projects in alignment with the plan’s goals and recommendations. This funding is for climate-adaptation projects that mitigate future impacts resulting from natural hazards that pose risks to the community, such as extreme weather, flooding, or severe heat.
The following terms used in the MVP process will also be used throughout this report:
Natural hazard: a source of harm or difficulty created by a meteorological, environmental, or geological event. These do not preclude human-made hazards.
Vulnerability: a description of which assets, including structures, systems, and populations, are at risk from the effects of the identified hazard(s).
Community assets: the people, structures, facilities, and lifelines that have value to the community.
Risk: the potential for damage or loss created by the interaction of natural hazards with community assets, such as infrastructure or cultural resources. Risk is the overlap between hazards and community assets. The bigger the overlap, the higher the risk.
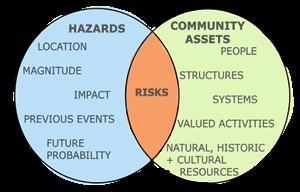
GRAPHIC ADAPTED FROM RESILIENT MASS
This report contains three main sections (Environmental, Infrastructural, and Societal) as these categories are used in the MVP planning process. In each of these sections, existing conditions and analyses are provided in the context of natural hazards and vulnerabilities that affect the Town of Florida. Each section includes recommendations or next steps to consider in the planning process.
Florida is situated in the traditional homeland of the Mohican People, today known as the federally recognized Stockbridge-Munsee Community, and was historically frequented by Abenaki, Pocumtuck, and Nipmuc ancestors (Native Lands). While these tribes were forcibly displaced by European colonizers, Native peoples continued to live in the region and have palpable connections to these ancestral homelands. In particular, while the majority of the Stockbridge-Munsee Mohican people were displaced from the region in the late eighteenth century, and were eventually resettled on a reservation in Wisconsin in 1856, they currently operate an active Tribal Historic Preservation Office based in Williamstown, MA (Stockbridge-Munsee Band of Mohicans). The Conway team had a chance to learn more from this office about how they are stewarding their relationship to their homelands.

The Many Trails symbol designed by Edwin Martin, a Mohican, symbolizes the many moves from the East to Wisconsin which left Many Trails for the tribe to retrace in search of their history (Stockbridge-Munsee Mohicans).
A conversation with the Tribal Historic Preservation Officer, Dr. Jeff Bendremer, revealed that present-day Florida exists at an intersection of many tribal lands due to its location along the Deerfield River between the Hudson River Valley and Connecticut River Valley. While tribes settled and traveled along these life-giving bodies of water and valleys, Florida was situated on an important trail and mountain pass connecting the two river valleys (via the Hoosic and Deerfield Rivers). These valleys functioned as meeting points for travel, trade, cultural exchange, and intertribal marriage. This footpath laid the groundwork for what eventually became the state highway, Route 2, also called the Mohawk Trail. The contemporary development along the Deerfield River in Florida, related to the construction of Fife Dam, also revealed archaeological sites of cultural significance to the Stockbridge-Munsee Mohican people.
Any future development in Florida should include consultation with the Stockbridge-Munsee Mohican Community, consistent with existing historic preservation state and federal statutes, and honor the heritage, cultural sites, and ongoing legacy of the Mohican people.
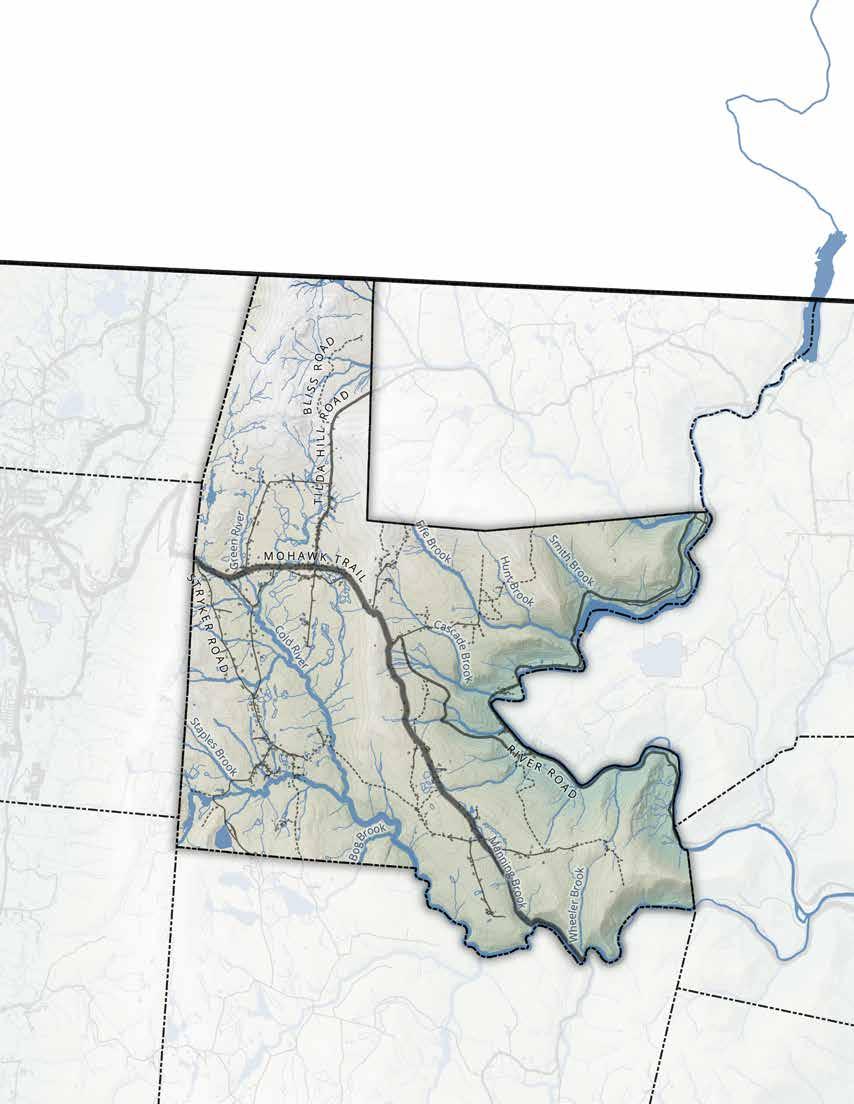
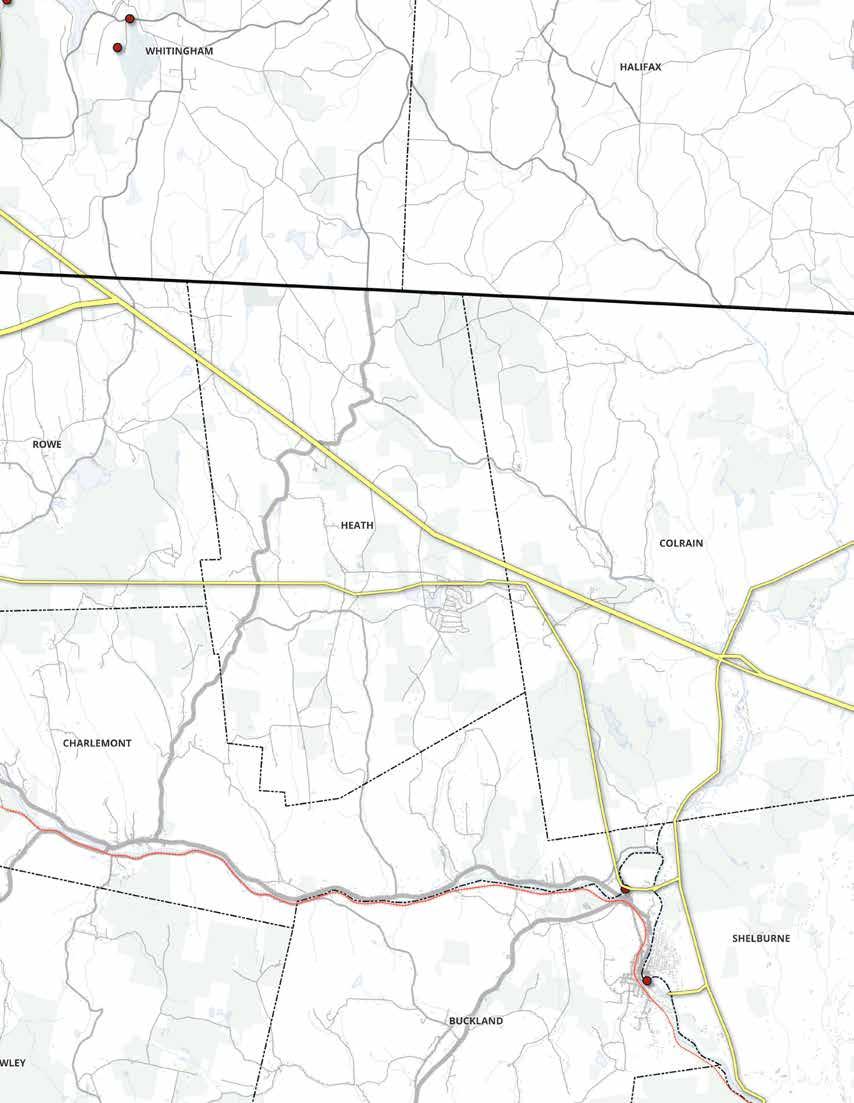
The town of Florida is a small, rural community located in the northwest corner of Massachusetts in Berkshire County. Florida is bordered by Clarksburg, North Adams, and Adams to the west; Savoy to the south; Monroe, Rowe, and Charlemont to the east; and the state of Vermont to the north.
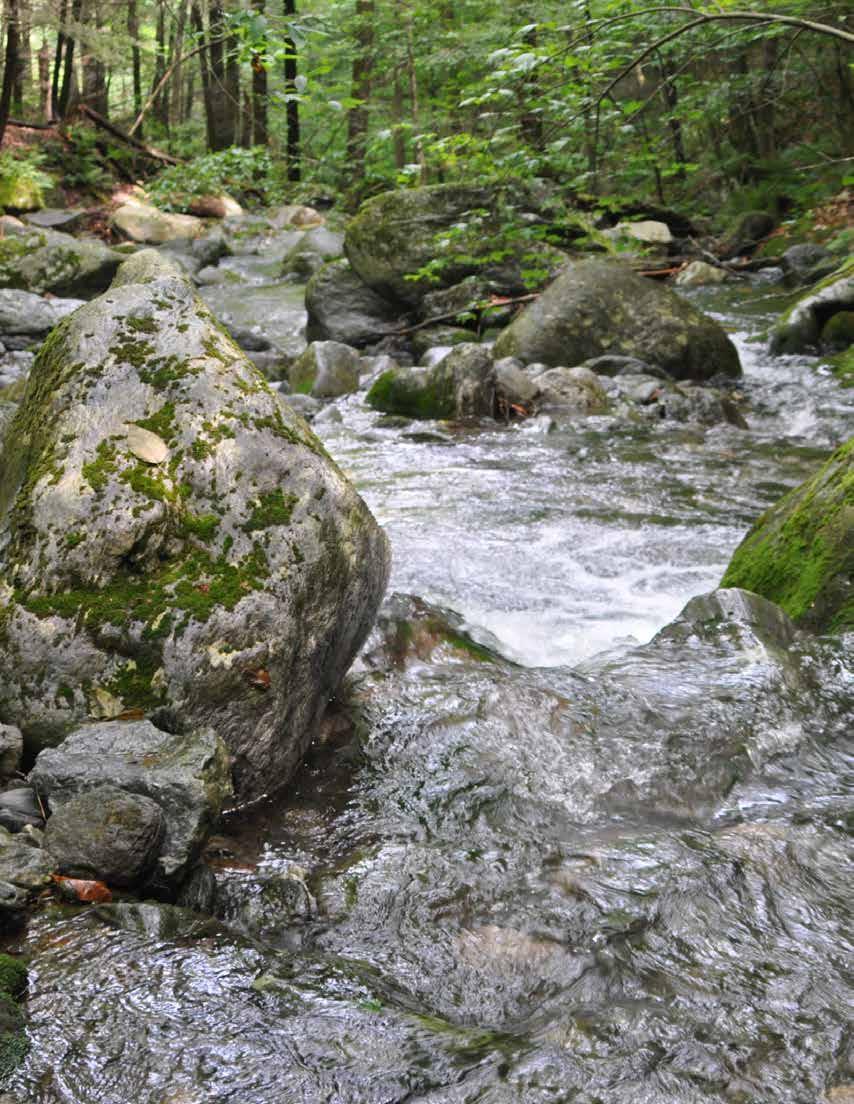
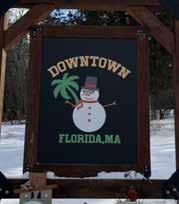
"WHERE THERE ARE NO PALM TREES BUT AN ABUNDANCE OF PINE TREES" (TOWN OF FLORIDA WEBSITE)
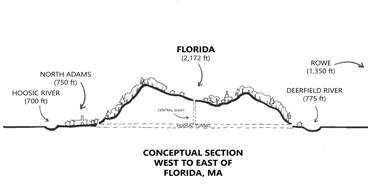
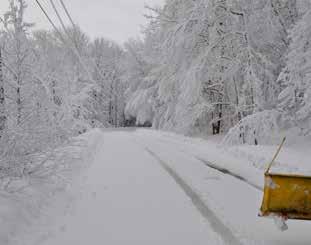
Florida is located atop the Hoosac Mountain Range, an extension of the Green Mountains down from Vermont which is part of the Appalachian range, and has steep and rugged terrain. Florida contains the villages of Drury, Florida, and Whitcomb Summit. Its highest point is Whitcomb Summit at 2,172’. Due to its high elevation, Florida is cooler and residents note that it receives more snow than much of the rest of the state.
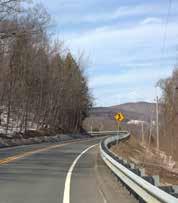
Route 2, a state highway, cuts through town and connects to North Adams in the west and Savoy to the southeast. The section of Route 2 that runs through Florida is a part of a scenic byway called the Mohawk Trail.
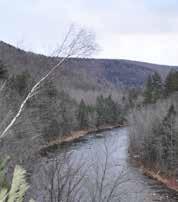
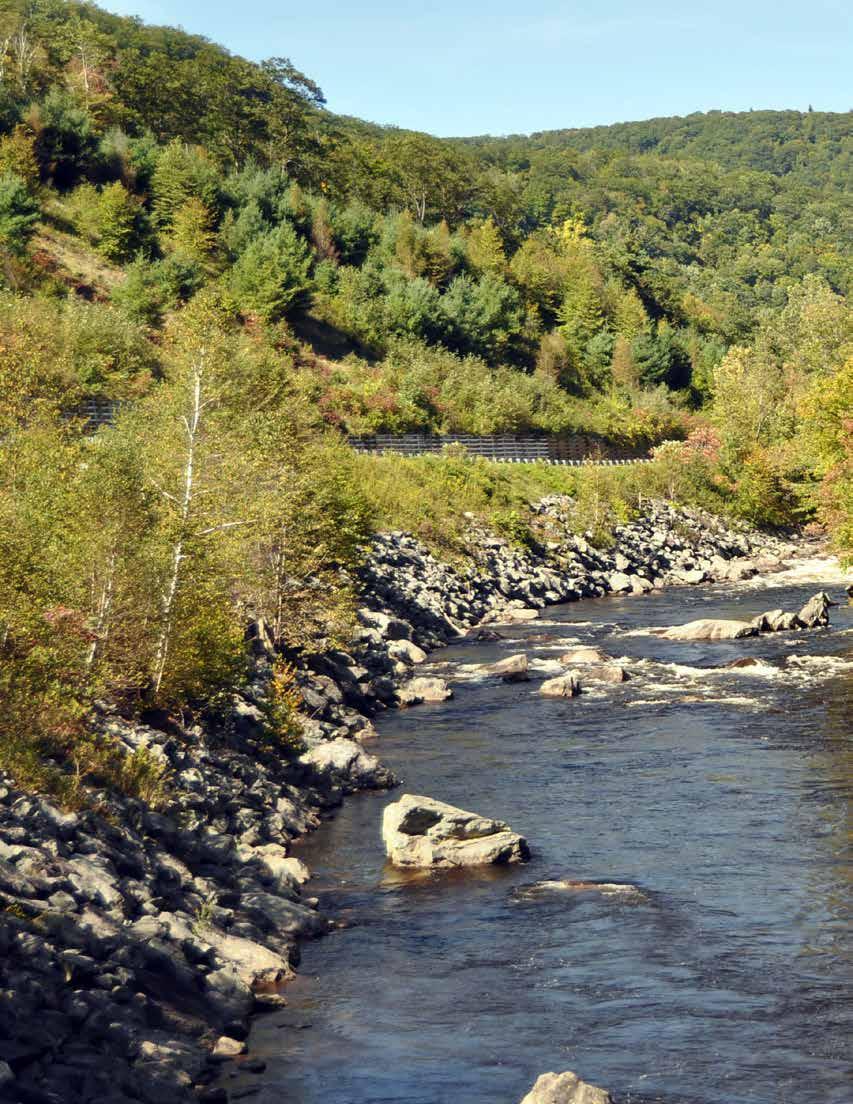
The Deerfield River makes up the eastern edge of Florida and the western edge of Rowe. The Deerfield is about 70 miles long and flows down from Vermont and eastwards where it meets the Connecticut River.
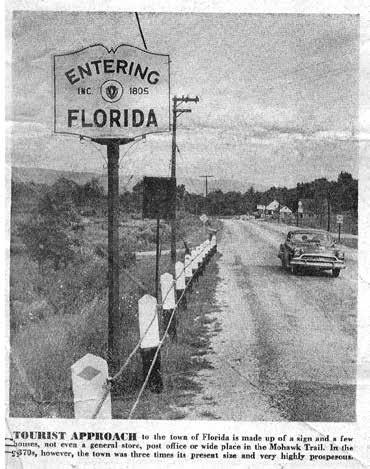
The 2023 census reports 770 residents (Florida community members report that currently, 660 people reside in town), forming a tightknit community. While Florida’s population has generally fallen within the range of 600 and 800, the construction of the Hoosac Tunnel during the 1860s led to a doubling of the population from 645 in 1860 to 1,322 in 1870 with new residents primarily residing along the Deerfield River. This burst in population was short-lived as by 1880 the population went down to 459 residents (Strahan).
Florida doesn’t have a defined town center. Rather, development is dispersed throughout the town along roads. The 813 structures in town include single-family residences, a few small businesses, and town services. The town services consist of the Town Hall, Abbott Memorial School, a Senior Center, a Highway Department, and a volunteer Fire Department. The majority of these municipal services are located along Route 2, aside from the middle school which is on a side road. Florida residents leave town for almost all other amenities including groceries, gas, post office, and medical services. High school students are bused to the neighboring North Adams.
In the event of a disaster, town services become the first response lines for the community, providing rescue, immediate shelter, water, community cohesion, and connection points to outside resources. The following are a few of Florida's town services.
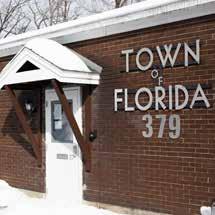
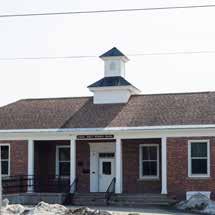
The Florida Town Hall is located on Route 2 adjacent to the Senior Center. Florida is governed by an open town meeting led by a board of selectmen and a town secretary. Florida is represented by the First Berkshire district (northern Berkshire County) in the Massachusetts House of Representatives, and in the Senate by Berkshire, Hampshire, and Franklin district. Florida’s Town Hall manages all governmental affairs and legal documentation for the town. The Town Hall Garage (attached to the Town Hall) is one of three emergency shelters in Florida, and is a temporary cooling shelter in the summer.
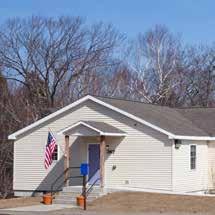
A Senior Center is located on Route 2 in the lot next to the Town Hall. It is open three days a week and provides programming for elders in Florida. The Senior Center also releases a monthly newsletter on the town website that is made possible by a grant from the Executive Office of Elder Affairs (EOEA). The newsletter is a combination of news, announcements, and playful elements such as word games and recipes. The Senior Center has a Council on Aging that manages the affairs of the center. The Senior Center is one of three emergency shelters in Florida, and is a temporary cooling shelter in the summer.
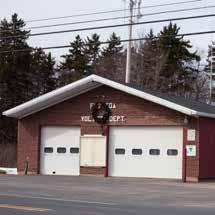
Florida’s Volunteer Fire Department, headquartered on Route 2, is the first response unit for all town emergencies, as ambulance/EMS are based in North Adams and police/law enforcement is handled by the Massachusetts State Police Cheshire Barracks. Massachusetts State Police representatives were part of the Core Team. Emergency backup fire stations have one pickup truck each, located on Church Road near Town Hall, and River Road in the valley (Fire Wiki). The Fire Department Chief was a member of the Core Team for the MVP/ HMP planning process and provided detailed insight on the existing fire and access concerns in Florida based on prior events and forecasted climatic changes. His suggestions are incorporated into the Infrastructural section of this report.
Abbott Memorial Middle School in Florida has classes from preschool to eighth grade. The school provides small class sizes, with specialists for STEAM, OT, PT, speech therapy, and reading intervention. Students from neighboring towns can apply to come to Abbott Memorial Middle School. The school is one of three emergency shelters in Florida, and is a temporary cooling shelter in the summer. Abbott Memorial is home to the Florida Public Library (FPL), which serves its community by providing a variety of materials and promotes reading to patrons of all ages (Abbott Memorial School). A resident described this library as a “small yet mighty” asset for the town.
A GLIMPSE

Built in 1861, the Florida Baptist Church, also known as “The Church on the Trail”, has had a small fluctuating attendance and has been a connection point for the community since the early establishment of the town (Strahan). Services also include a food pantry, secondary community center, and the town cemetery on its property.
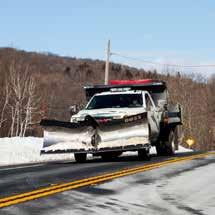
The Highway Department employs five people and is responsible for maintaining the roads in town throughout all of the seasons. The Highway Department Supervisor was a member of the Core Team for the MVP/HMP planning process and shared valuable information on the status of the roads and culverts in Florida.
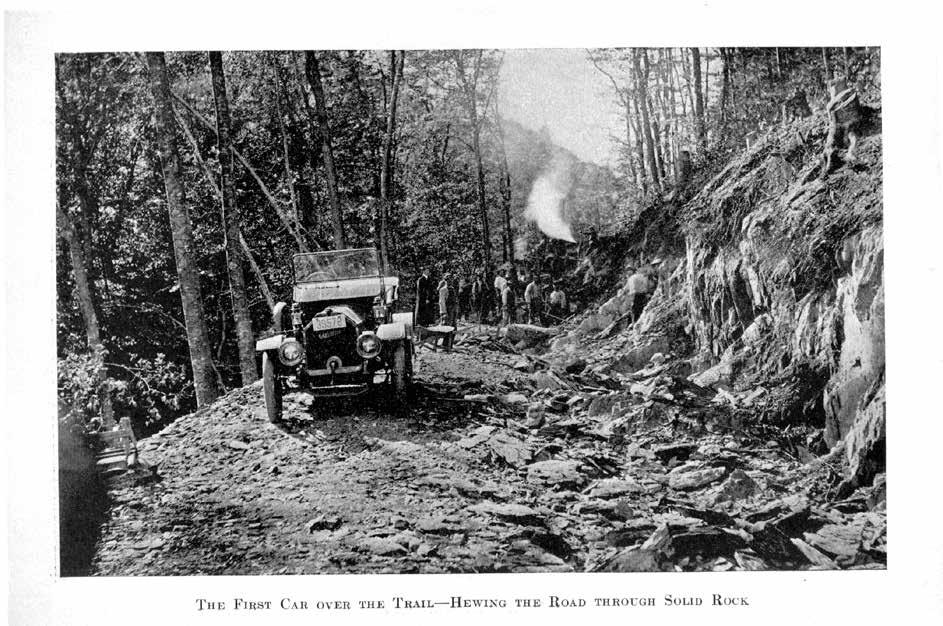
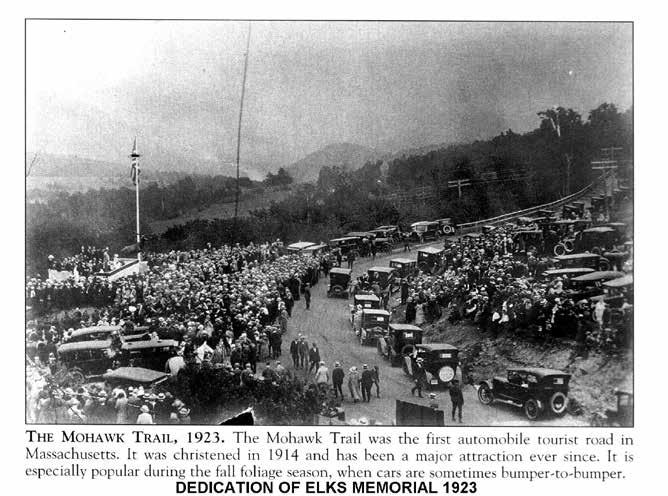
What is now known as a scenic byway called the Mohawk Trail passing through Florida, began as a 100-mile-long walking trail and trade route for native peoples. This footpath connected the Hudson, Hoosic, and Connecticut River Valleys. Sixty-three of those original one hundred miles are part of the scenic byway road (also called Route 2), which the Massachusetts Highway Department officially opened in 1914. Before the road became maintained year-round in the 1930s, residents used to shovel the snow by hand (The Berkshire Edge; FRCOG). It is not clear why the trail is called “Mohawk”, considering that this region is the ancestral lands of the Stockbridge-Munsee Mohican peoples, and the Mohawk tribal lands are farther to the northwest. Mohawk peoples may have been passersby on this trail.

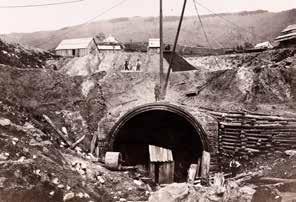
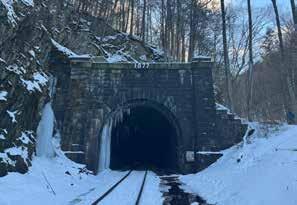
A five-mile-long train tunnel runs under the mountain that Florida sits upon. The tunnel’s construction began in 1850 and lasted for over twenty years. Almost two million tons of rock were moved to create this route under the mountain, and 195 lives were lost in the process. The construction of the Hoosac Tunnel provided a year-round connection between Boston and Albany (FRCOG), and it remains active today.
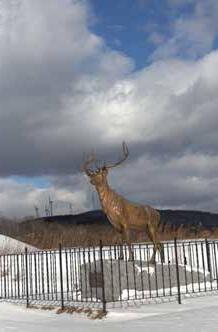
A ten-foot-tall bronze elk statue sits on Whitcomb Summit right on the side of Route 2/The Mohawk Trail. This majestic monument was installed by the Massachusetts Elks Association in 1923 as a dedication to veterans of World War I. The North Adams Transcript estimated that over 10,000 people gathered on that day in June 2023 to witness the unveiling of the elk (Jochem, A). To this day, the golden elk remains an attraction to folks who are passing through the region.
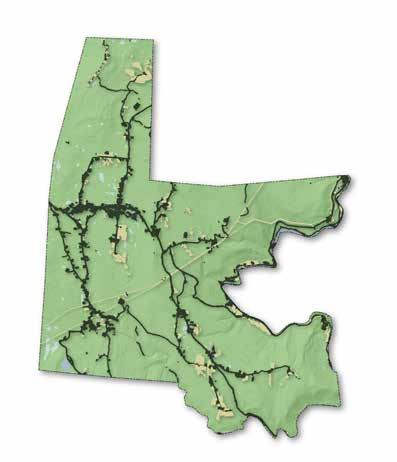
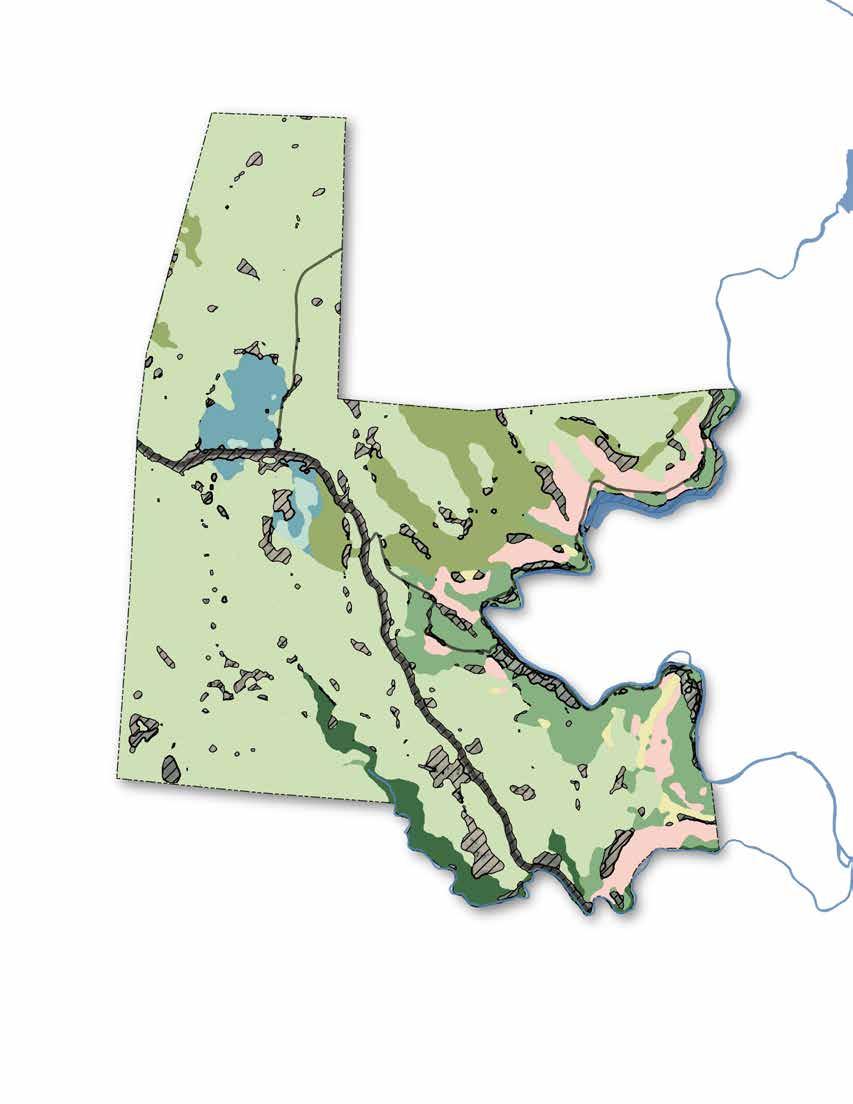
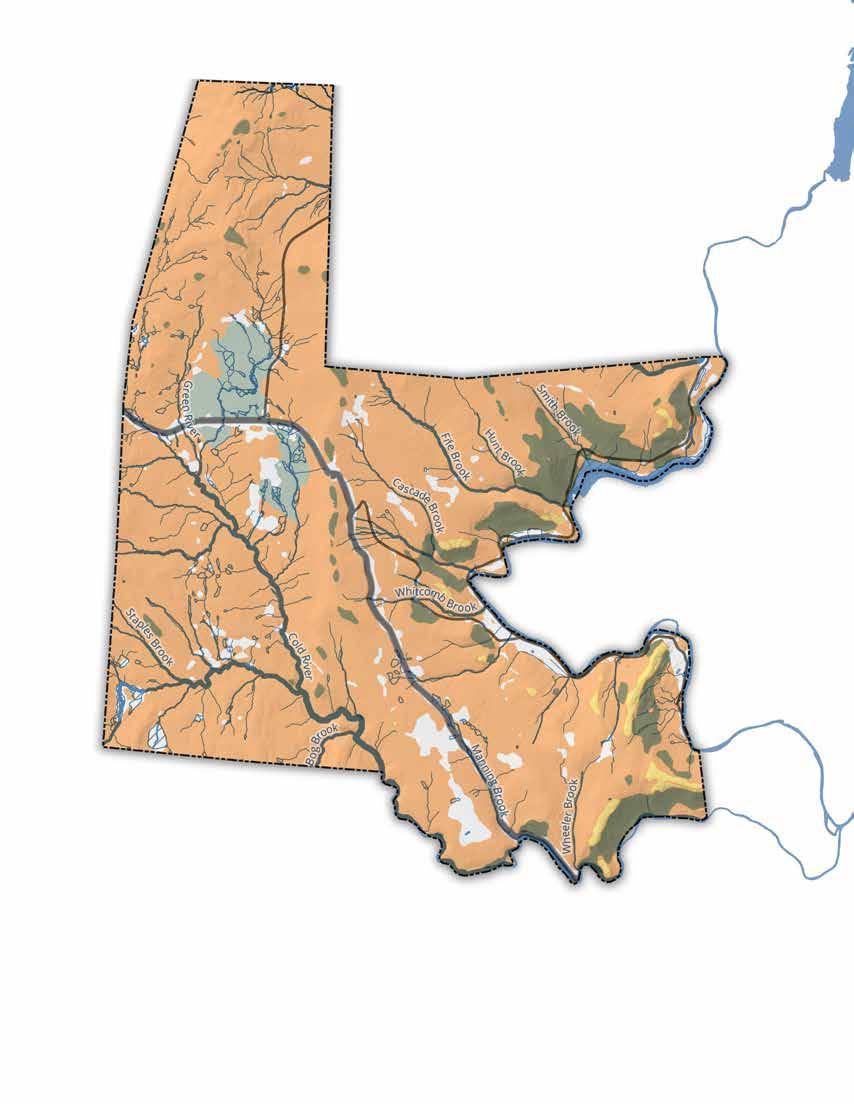
LAND COVER


Forest (89%)
Cleared land / grassland (5%)
Developed (3%)
Wetlands (2%)
Water (1%)
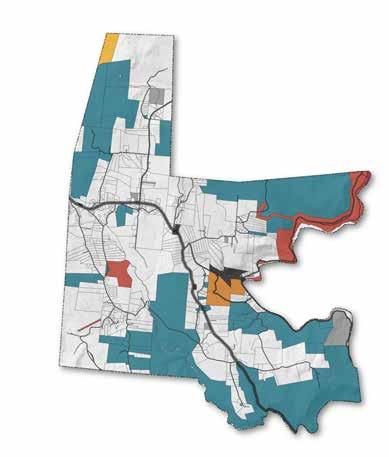
61 A Agriculture Commercial Industrial
61 B Recreation Multiple use
Tax Exempt Residential
The maps on the opposite page represent different aspects of land use in Florida. On the opposite page, "Land Cover" illustrates the actual material impact on the landscape of various human uses. For example, the "developed" areas mapped include residential, commercial, industrial, infrastructural, and agricultural development. "Tax Parcel Use Classification" illustrates the legal uses of each tax parcel. Those more detailed uses are broken down in the following paragraphs.
While the actual land cover affected by residential use is very low, the vast majority of the tax parcels in town are classified as residential property. Details about these properties are dealt with more thoroughly in subsequent sections. For example, the effect of structures on ecology and habitat is explained in the Environmental section, and the relationship of structures to larger town-wide infrastructure and hazards is dealt with in the Infrastructural section.
Commercial properties in town are extremely limited, with the two largest parcels operated by the Blue Vista Motor Lodge and Pan Am Southern LLC, which is associated with the Hoosac Tunnel. Other commercial ownerships are limited to Dobbert Recycling, and what appears to be an outof-business roadside store.
Industrial use in town is limited to facilities associated with the hydropower dams, power distribution, and ventilation for the Hoosac Tunnel.
While historically there appeared to be a significant amount of cleared land for agricultural purposes, functional agricultural land is limited to a few small hay fields off Oleson Road, and a small horse farm off River Road (Historic Aerials).
According to Tom Brule of Massachusetts DCR, forestry operations are minimal in Florida primarily due to lack of markets and the prevalence of preserved land, while Massachusetts imports around 90% of its timber products. Brule noted that timber operations should be incentivized. Because the town’s forests are unmanaged and growing into older, even-aged forest stands, Brule's position is that more active management, by the private and public sectors, could create more diverse uneven-aged forest stands. According to Brule, such uneven-aged stands are good for carbon sequestration, decreased blowdowns in heavy wind storms, and habitat for much wildlife.
At the same time, unmanaged stands are important for forest interior and other species which do not thrive in disturbance.
State Parks & Rec
Land Trust
Private
Chapter 61A
Chapter 61B

Conservation Restriction
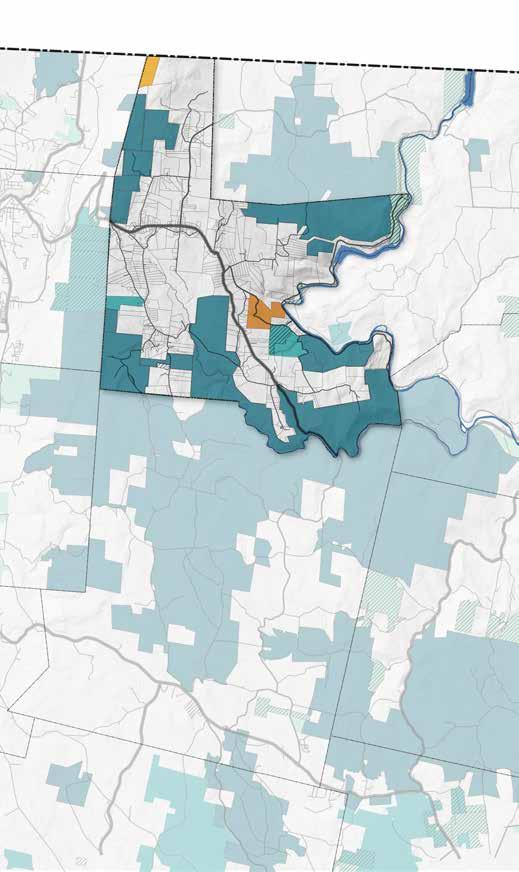
0 1 2 MILES
Approximately 5,200 acres or 33% of the total area of Florida is under permanent protection from development (Florida Community Development Plan 2003). The Conway team considers this protected open space an asset for resilience and hazard mitigation because of the ecosystem services provided, as addressed in subsequent chapters of this report.
This land is managed by multiple landholders: the State Department of Conservation and Recreation (DCR) manages Florida State Forest, Savoy State Forest, Monroe State Forest, and Mohawk Trail State Forest; the Berkshire Natural Resources Council manages the Hoosac Range Reserve; the Nature Conservancy stewards the Reed Brook Preserve; and Better Place Forests manages a green burial forest site in the southeast corner of Florida.
Other permanent protections include a conservation restriction on a parcel of land owned by Christodora Inc., which is the site of the Manice Education Center that offers programming for youth from New York Center; and Brookfield Power, which owns the Beaver Swamp (Fife) Dam along the Deerfield River, and manages the Zoar Gap, a boating launch point under a conservation restriction. There are no known Agricultural Preservation Restrictions on parcels in Florida.
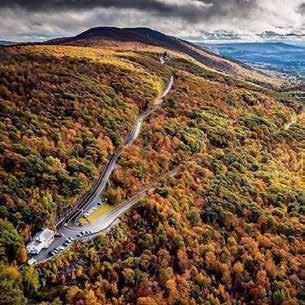
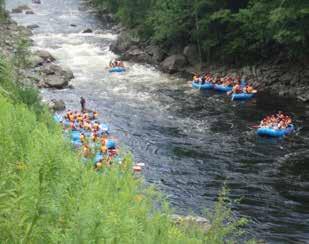
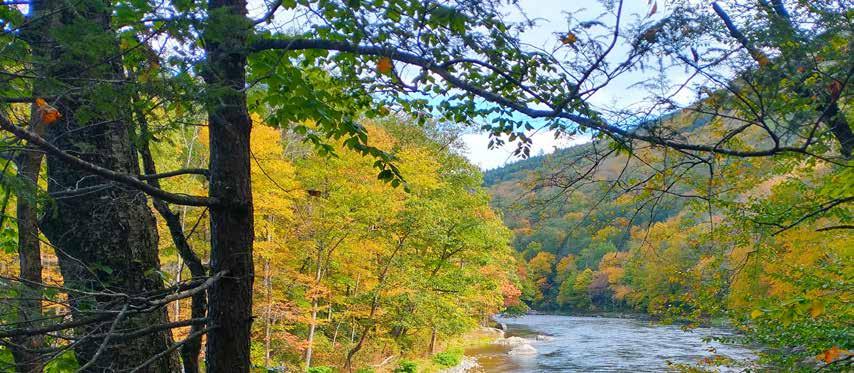
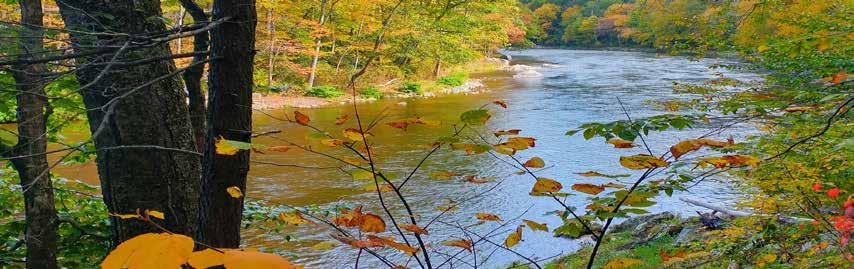
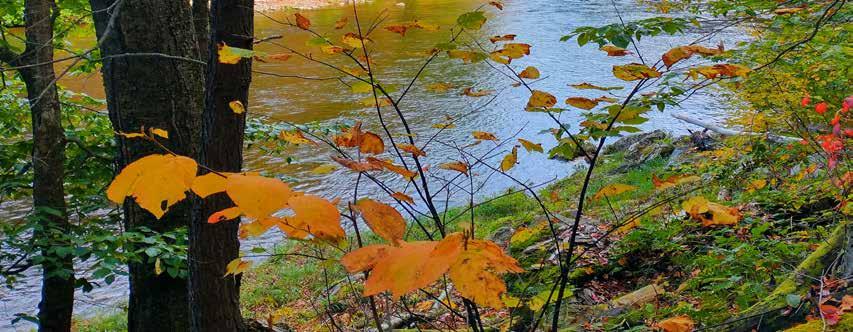
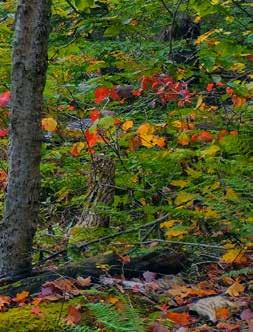
Florida’s beautiful terrain and protected forests offer many opportunities for recreational activities including hiking, swimming, fishing, boating, camping, snowshoeing, snowmobiling, and more. Fall foliage draws locals and tourists to the Berkshires and into Florida annually. Florida is also situated close to nearby ski mountains and other recreational sites in both the Berkshires and in Windham County, Vermont.
The Deerfield River is also a site of much recreation in Florida. From April to September, rafting and kayaking groups from companies based in neighboring towns launch into the Deerfield just below the Fife Dam. One of only two catch-andrelease fishing areas is located in Florida (Deerfield Fly Shop).
Seasonal tourists represent a large shift in the number of individuals within Florida, which should be considered in emergency management plans.
Chapter 61 is a Massachusetts state tax abatement program, which provides lowered property tax rates in return for the owner limiting the usage of the property to conservation, forestry, or agricultural purposes. The Chapter 61 program is broken down into three categories:
• Chapter 61 is for forestry purposes
• Chapter 61A is for agricultural purposes
• Chapter 61B is for open space and recreation purposes
Currently, only two parcels are enrolled in the Chapter 61 program: one Chapter 61A parcel in the northwestern corner of the town, and one Chapter 61B parcel on either side of Whitcomb Hill Road on the east side of town. The parcel on Whitcomb Hill Road is advantageous for resilience, as it is helping to protect steep land on either side of the road against erosion, landslides, and water damage, as explained later in this report. Chapter 61 offers temporary protection from development and also applies a right of first refusal: if a parcel enrolled in Chapter 61 goes up for sale and gets a market offer, the town has the first opportunity to purchase the property at the offer price.
A 2022 paper by Jazmin Scarlett on the “The Harmful Legacy of Colonialism in Natural Hazard Risk” points out that “past and present colonialism has played a critical role in the ongoing anthropogenic climate crises and its resulting exacerbation of existing natural hazards. It is worth noting how the colonization of indigenous lands in the United States and Australia has led to changes in vegetation type across landscapes and erasure of indigenous practices of controlled burning, which has led to an increase in both the number of and intensity of wildfires over the last decade. As such, our ability to mitigate the natural hazards stemming from climate change is hindered by some of the same processes that initiated it” (Scarlett). It is interesting to consider how risks and hazards posed to humans have increased as a result of colonial human activity.
THE RELATIONSHIP BETWEEN "NATURAL" SYSTEMS AND HUMAN USE IS ENTANGLED IN COMPLEX WAYS
Many natural processes that historically occurred in much of New England have been suppressed over the last few centuries due, in part, to colonialism and extractive capitalism. This has resulted in an increase in risks and hazards that impact human infrastructure and ways of life. Some examples include the following:
The Deerfield River is one of the most heavily dammed rivers in the country, with a dam almost every seven miles along its length (Deerfield Fly Shop). While harnessing the power of the water is a renewable energy source and may boost the local economy, it also suppresses the natural form of a river, impacts wildlife, and creates the potential for a hazardous situation if the dam were to breach.
Prescribed burns and cultural burning have historically been a part of indigenous land management to favor certain plant species (like oak and hickory) and to keep the understory clear for travel and hunting (Harvard Forest). Displacement and disenfranchisement of native peoples due to colonialism, along with modern day land management, has resulted in a century of suppressing wildfire (started by both natural causes and controlled burns). There are voices sharing the cultural and ecophysiological importance of prescribed burns to maintain certain fire-dependent species and ecosystems (Robertson, et al.).

Humans have historically settled by life-giving waterways; however, permanently developing next to rivers and wetlands can drastically alter waterways, reduce flood storage capacity, limit infiltration, and increase runoff (NEMO).
By the end of the nineteenth century, beavers were nearly extinct due to European colonizers' intensive and under-regulated trapping. Their population is on the rise, and they provide invaluable services of creating rich habitat for wildlife, helping to mitigate flooding and erosion, and conserving large amounts of water (National Parks Service).
When it comes to hazard mitigation for Florida, working with natural processes will cultivate the most resilience for the community. Projects that utilize nature-based solutions (NBS) to tackle such issues are strongly encouraged by the MVP program. “Naturebased solutions are adaptation measures focused on the protection, restoration, and/or management of ecological systems to safeguard public health, provide clean air and water, increase natural hazard resilience, and sequester carbon” (Mass.gov, A).

0 1 2 MILES
State Route 2, also known as the Mohawk Trail, is an important regional vehicular connection because it is the main route in the surrounding area that crosses over its steep and high-elevation terrain. Route 2, as it crosses Whitcomb Summit, is the highest elevation stretch of road in the state, and due to Florida’s relatively extreme winter weather and complex terrain, it can be a pinch point in the case of ice storm tree-fall, mudslides, or wash outs. Along with personal transportation, much shipping traffic comes over this highelevation road, including chemical trucks and other cargo transportation. According to state police, many trucks have accidentally careened off the road, spilling cargo into the landscape.
The rail line that passes deep below Florida through the Hoosac Tunnel is of regional importance. Other than the main line that passes through Pittsfield to the south, the next nearest main line to the south is over a hundred miles away along the south coast of Connecticut, and the next nearest main line to the north is 125 miles to the north through Burlington (OpenRailway).
According to the Stand.earth oil train route maps, in the northeast, the only rail line north of New York City carrying oil trains to the east coast of the United States is via the Hoosac Tunnel.
According to the state police, there have been several accidents in the Hoosac tunnel; it represents a pinch point in regional rail infrastructure.

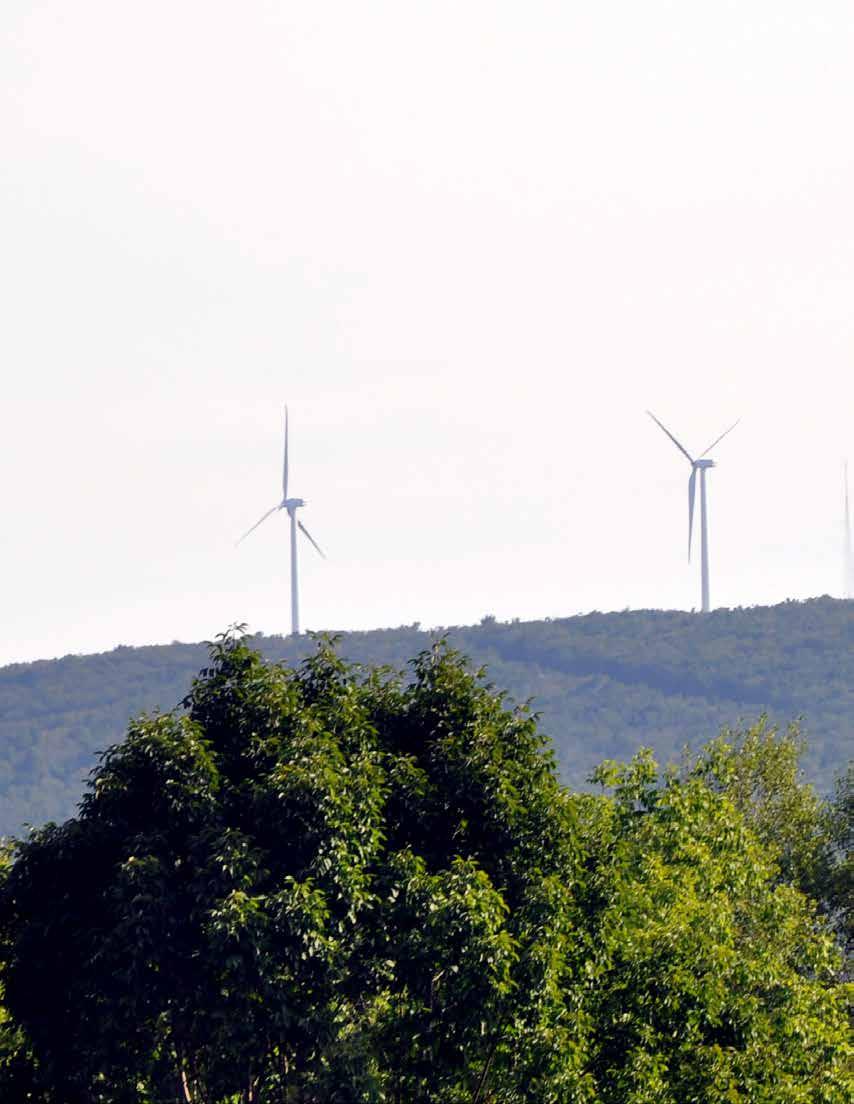
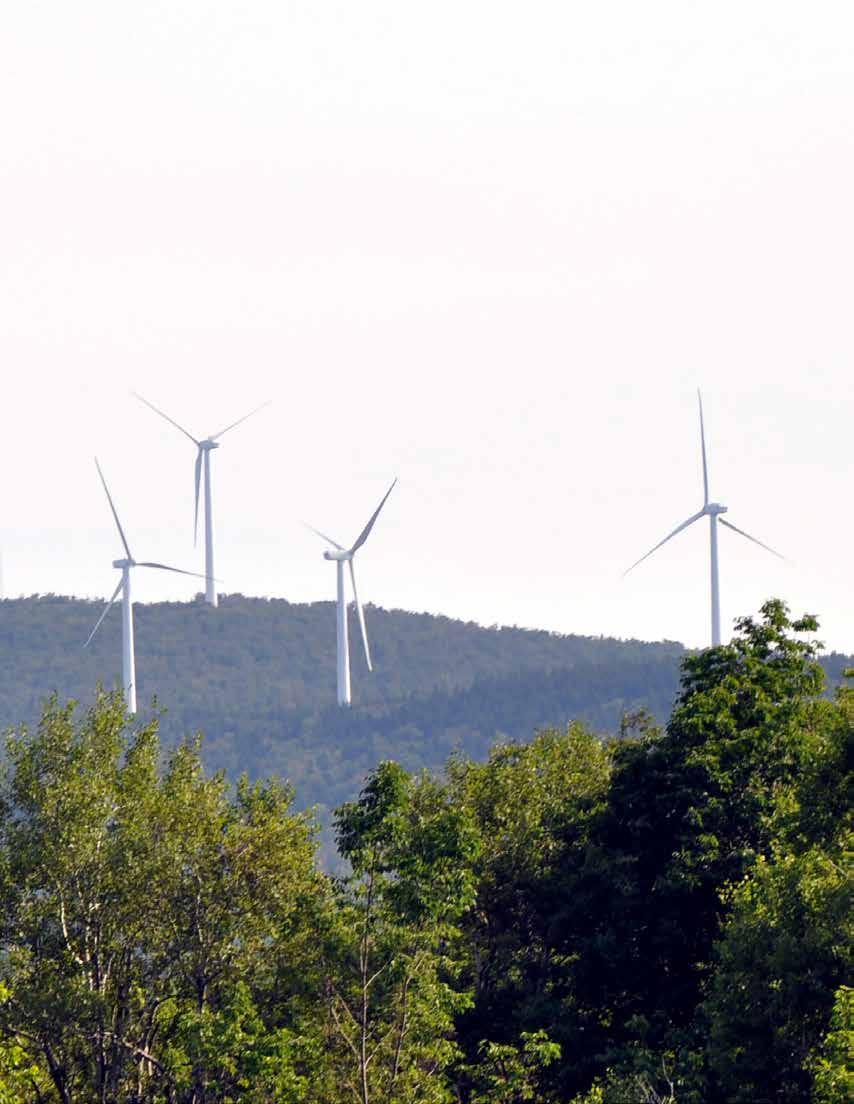
Florida contains multiple major renewable energy projects, including dams and wind farms. The Hoosac Wind Farm is located in the highelevation and windy northwestern portion of Florida. The project comprises nineteen turbines, and is the largest wind farm in Massachusetts. It produces 28.5 MW of electricity, which is enough to power approximately 10,000 homes per year (Wiki). According to the Town Administrator, the wind farm is located on a mix of private and town-owned land, and lease payments are provided to the landowners. The wind farm also produces substantial tax revenue for the town.
Florida’s Deerfield River Valley is also home to the Bear Swamp Dam, which is sometimes referred to as the Fife Dam. Dam infrastructure and hazards are addressed in more detail in the Infrastructural section of this report.
Connecting these renewable energy projects to regional power networks is a major bulk power transmission line operated by Western Massachusetts Electrical Co. The transmission line is situated within an approximately 180 foot wide linear clearing which runs from the southwest to the northeast of Florida.


ZONE 4A (-30 TO -25°F)
ZONE 5A (-20 TO -15°F)
ZONE 5B (-15 TO -10°F)


Weather patterns across the globe are shifting, creating unpredictable seasons and an increase in extreme weather events. In the Northeast these shifts include longer dry periods and increased frequency of high-intensity precipitation events. These shifts impact human health and destabilize ecosystems at a rate that makes adaptation difficult.
As of 2023, Florida is entirely within the USDA hardiness zone 5a (-20 to -15°F) (USDA). In 2012, Florida’s higher elevation points were within zone 5b (-20 to -15°F). Shifts in temperature patterns have caused species loss across the state and Appalachian mountain range. Species that require a specific temperature range, such as balsam fir, red spruce, bunchberry, and native wildflowers, are most susceptible to these changes (Moran).
If the plants gradually move higher up a mountain seeking cooler temperatures, "there will eventually be no more mountain to move up," Uli Lorimer, Director of Horticulture at the Native Plant Trust, shared.
The Berkshires' cold winters have historically slowed the spread of pests, pathogens, and invasive species through die off. Warmer winters equate to increased pest, pathogen, and invasive species pressure on local ecosystems.
Florida's high elevation and forested mountain peaks are part of a narrow corridor through the Appalachian mountains allowing for the plants and animals to migrate northward. Fragmentation of these ecosystems could inhibit species migration, resulting in ecosystems stressed by climate, pests, pathogens, invasive species, and subsequent existing species loss (WBUR).
Planning for species migration through assisted migration practices and increasing the boundaries of existing corridors has the dual influence of retaining species that require zone 5a temperatures within Massachusetts and preserving ecosystems services that mitigate the influence of climate change as further addressed in the ecological section of this report.

"Between 1990 and 2019, FEMA recorded 23 weather-related major disaster declarations in Massachusetts (versus 7 between 1960 and 1989). Winter storms have increased in intensity and frequency since 1950, and heavy downpours increased 71% from 1958 to 2010" (Mass.gov, B).
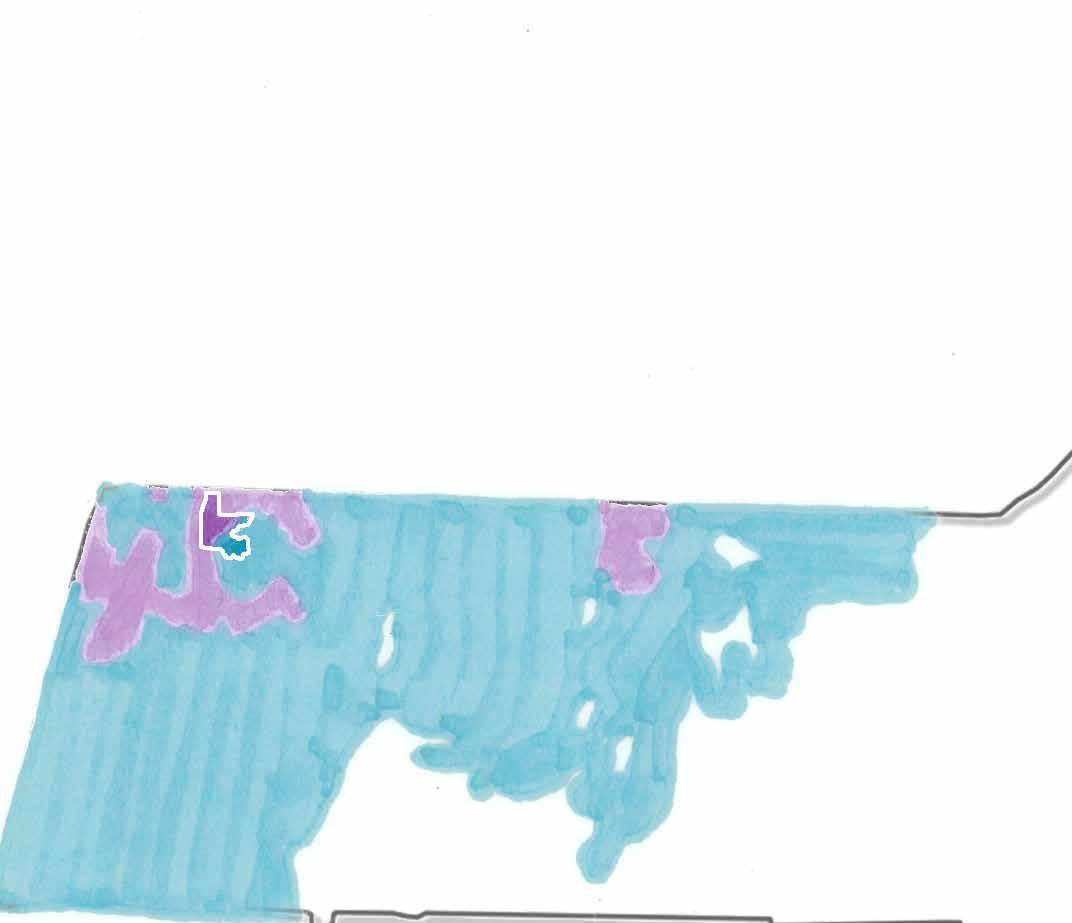
1948
1955
MINOR EVENTS
MAJOR EVENTS
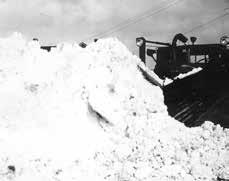
Over 16 days, more than 45" of snow fell on the Berkshires. The highest 24 hour snowfall reached 16" (Berkshire Eagle).

River at 20.17'
On September 21, 1938, the Great Hurricane caused the Deerfield River at Florida’s western border to crest at 20.17’. The National Weather Service marks the Deerfield River at flood stage at 10 feet in Charlemont (USGS). Flooding also occurred along the Cold River running through southwest Florida along the Mohawk Trail (Paulsen).
INCREASED FREQUENCY & IRREGULARITY OF EXTREME WEATHER EVENTS IN FLORIDA
1984 FLOOD
Deerfield River at 13.45'
1987 FLOOD
Deerfield River at 17.71'
F1 (73-112 mph)
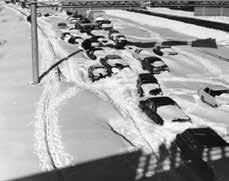
The Berkshires were hit with 11.5" of snow in 33 hours, while Boston received 27" and parts of Rhode Island received 40". The storm killed 54 people, destroyed 3,500 homes, and temporarily displaced 10,000 individuals to emergency shelters (Stafford).
Deerfield River at 12.26'
Deerfield River at 23.77'
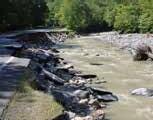
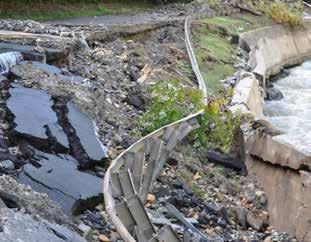
In 2011, hurricane Irene caused the Deerfield River to rise over 15 feet in a few hours and to crest at 23.77’ (Bent). Flooding along the Cold River caused landslides, rockslides, mudslides, and bridge damage resulting in $23 million of repairs to Route 2 and the closure of six miles for three months (Fanto) with continuing repairs for six months. Irene also caused $1 million of damage to town roads (AP).
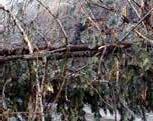
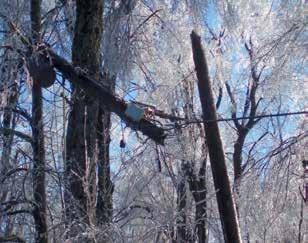
In 2008, high levels of mixed precipitation caused stream and river flooding across the Berkshires. Freezing rain and low temperatures left 0.5 - 1” of ice, causing downed trees and power lines, and leaving households without power for up to seven days (NOAA, B).

A much hotter Florida is predicted by the end of the century, though because of its geographical location, it may not experience significant heat waves (ResilientMass). One point of data the Conway team looked at is how many days per year are expected to rise above 90°F. While the current baseline mean between 1950 and 2013 is only 1 day, by the end of the century Florida could see between 16 and 58 days above 90°F.
Cold days are expected to decrease in frequency. The average temperature is expected to increase between 7.2 and 13.5°F. The number of cold days below 32°F is expected to decrease by between 55 and 96 days, and the number of cold days below 0°F is expected to decrease by between 13 and 17 days (ResilientMass Climate).
The most recent National Climate Assessment for the northeast states that “the frequency of heavy downpours is projected to continue to increase as the century progresses. Seasonal drought risk is also projected to increase in summer and fall as higher temperatures lead to greater evaporation and earlier winter and spring snowmelt” (GlobalChange 374).
According to ResilientMass, the Deerfield watershed should expect a substantial increase in the rainfall during large storms this century. For example, by 2090 it projects a 14 to 29% increase in rainfall during the largest storms (99th percentile), and an increase in maximum precipitation of 20 to 46% (ResilientMass Climate).
This projection may be too conservative, as even the highly conservative Intergovernmental Panel on Climate Change (IPCC) has much more aggressive projections (Scientific American). In the newest IPCC Assessment Report (Sixth), the writers look at the projected increases in the frequency of extreme precipitation events as well. In the eastern United States, they project a 4 to 7 times increase (that is 400 to 700% increase) in the frequency of 50-year precipitation events under a high end, 4°C, warming scenario, and a 2 to 3 times (200 to 300%) increase under a middle end, 2°C, warming scenario (IPCC).
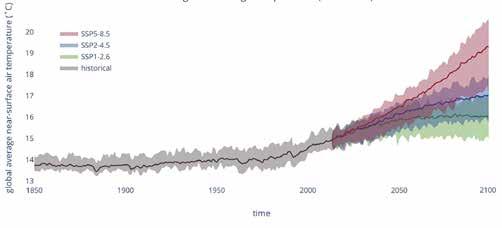
While the future is fundamentally uncertain, modern science has developed a robust and expansive scientific consensus to help humanity forecast and navigate the vast impacts that climate change will have in the future, and is having now. In the work of the Intergovernmental Panel on Climate Change, the international standard for climate projection, this uncertainty is dealt with by looking at scenarios, which are shown in the chart below. The high end scenario, shown in the chart as “SSP5-8.5 Fossil fuel development” represents a business-as-usual scenario where little significant action is taken to meaningfully reduce greenhouse gases in the atmosphere. The low end “SSP1-2.6 Sustainability” represents massive internationally coordinated efforts to reduce greenhouse gas emissions. The amount of warming the earth will likely see by 2100 depends on these future scenarios. The high end could see global average temperatures between 2.5 and 6.5°C higher than present day, whereas the low end scenario could see temperatures between 0 and 2°C. It should be noted that current progress aligns much closer to the high end projection (ClimateData).
The takeaways here are two-fold. First, these temperature numbers can feel abstract, but they are huge. Consider our bodies, where the difference between 98.6°F and 104°F is the difference between healthy and deathly ill. To put this into geological perspective, the amount of warming it took to reverse the last ice age was about 4.5 to 7.5°C. So in the high end scenario, we are looking at a range of warming that is similar to the warming that it took to melt a mile-thick sheet of ice in this region in recent geological history. While this cycle of ice ages and melts is typical over recent geological history, the current scale of humancaused warming above these historic levels is unprecedented not only in human history but in millions of years of geological history. Secondly, what we do as humans now to mitigate climate change has a massive impact on what hazards we will see in the future.
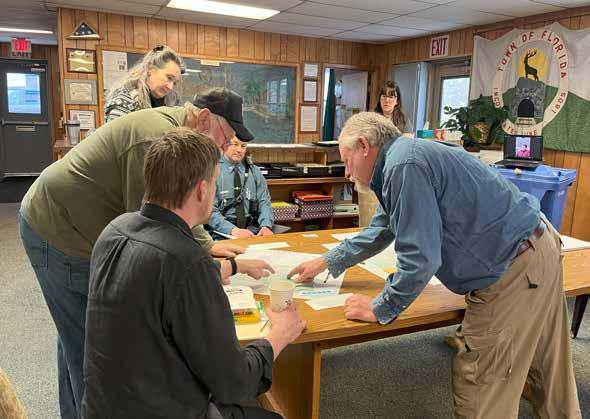
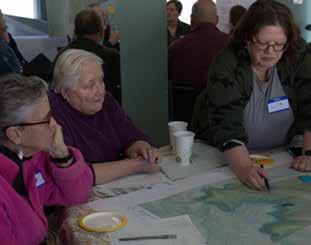
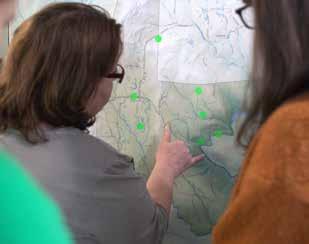
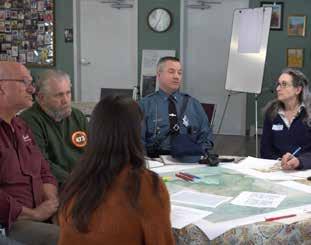
MEMBERS OF THE CORE TEAM ANNOTATE MAPS OF FLORIDA WITH HAZARDS & VULNERABILITIES
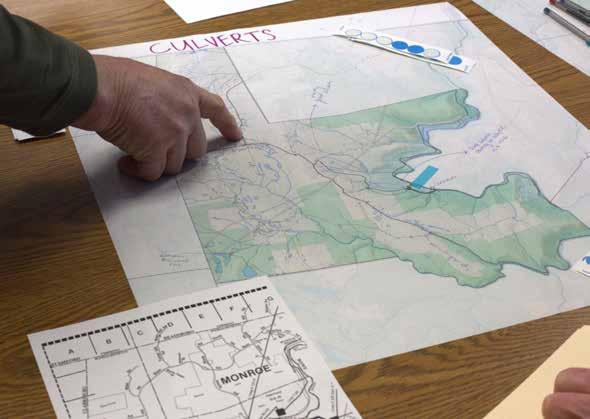
The Florida community’s perspective is critical for identifying hazards, vulnerabilities, and assets in the town of Florida. The Conway team participated in two Core Team meetings and one Community Resilience Building (CRB) Workshop facilitated by Conservation Works, LLC, in February and March 2025. The notes from these gatherings are summarized here.
On February 27, 2025, a Core Team Meeting was held at the Town Hall in Florida. Participants included the Town Administrator, members of the Selectboard, a representative from State Police, and a drop-in from the Highway Department Supervisor when he took a break from plowing the roads. The meeting was facilitated by Conservation Works, LLC, and was a starting point for identifying hazards and vulnerabilities in the Florida community. Specific historical events were shared in addition to concerns regarding potential hazards.
50 mph wind events that can take trees out (most dead trees have already been knocked down)
Landslide on Black Brook Road into Savoy (Hurricane Irene 2011)
Deerfield River didn't breach onto River Road (Hurricane Irene 2011)
Power was out 3-4 days (Hurricane Irene 2011)
Chemical trucks coming over the mountain Isolated in winter
Dead man ’ s curve at the hairpin turn
90 degree turn “dead man ’ s curve ” along the Florida to Savoy town line (dangerous for trucks)
Culverts at the top of Whitcomb Hill Road are in good shape but bottom half is in need of attention
Low-level radioactive waste stored to northeast of town
Expressed need for an emergency bypass for Route 2 if something were to happen in the middle (i e , to connect Route 2 in the middle to S County Road)
15 homes along River Road (2 across the bridge in Rowe with five people) could be vulnerable to river flooding
Tractor trailer crashed into Golden Eagle Restaurant
Electrical malfunction at Abbott Memorial School
Beaver clogging culverts in Tower Swamp in the southwest corner of Florida (on Central Shaft Road)
Lockdown at Abbott Memorial School in 2018, shelter-in-place calls
[Table Key: specific events are italicized; orange=hazards/vulnerabilites; blue=assets]
On March 15, 2025, ten community members gathered to share their experiences living in Florida. They shared their love for the town, its tight-knit community, and the beautiful forests and rivers for recreation. They also told stories of generations sharing the same land. In hopes of improving their mountain home, concerns were shared along with past experiences, current realities, and projected future climate impacts.
Often causes the power to go out
Concerns about there not being enough manpower to plow effectively (or is it an equipment issue?)
There has been an increase in weather alerts about high winds
Lots of blow downs of trees onto road (lots of dead and dying ash trees due to Emerald Ash Borer)
Impact on cell tower
There has been an increase in weather alerts about wildfire risk
Combination of wind, dead trees, and chance of wildfire escalates risk
Question of whether there are the resources to fight a wildfire in Florida
unsafe to cross Route 2 to get mail
Limited cell coverage in parts of town, particularly in large sections of the Deerfield River Valley
Wells along Route 2 are contaminated with salt used on the road Elderly folks/seniors
There isn’t potable water at the Senior Center, Town Hall and Fire Station
Lack of evacuation routes in the Deerfield River Valley as well as designated emergency shelters in the Valley
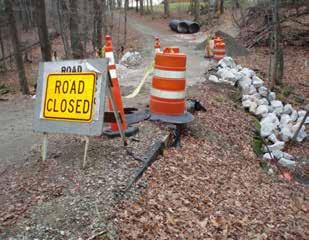
Roads vulnerable to damage from flooding, icing events, etc
Bridge to Rowe is not maintained anymore
Risks related to poorly maintained train tracks and possible derailment in/near Hoosac Tunnel (Visible erosion under tracks, scattered railroad ties)
Trucks carrying hazardous material on Route 2
Could the fire truck get down to the Deerfield River Valley in the winter if the roads are bad? Loss of power after storms
Question of whether the forests would benefit from controlled burns?
Whitcomb Bridge at Stone Bridge washed out after a big rain storm on Whitcomb Hill Road around 25 years ago
Concern of flooding in river valley Cell tower
Concern of rocks and soil coming down
Fencing only located along parts of River Road
Ice falling off the steep sides onto Route 2
Caused evacuations
Brooks/streams inundated (inadequate culverts)
Erosion
Landslide on Black Brook Road into Savoy on August 28, 2011
Too even-aged
Lack of timber product markets/sawmills
High elevation and cooler temps
Deerfield River and amount of forests and state forests
Recreational opportunities
Outdoor recreation offering some income
(though town expressed wish of there being more revenue from recreation)
Emergency shelters (Senior Center, Abbott Memorial School, Town Garage next to Town Hall) need to be organized and equipped better
Some residents don’t have access to transportation
Senior center doesn’t have a van/shuttle to pick up folks
Need for education about the average response time for state police and where they are coming from
Spread out community
Volunteer Fire Department (staff, training, responsiveness)
North Adams EMS & State Police
Neighbors and strong/supportive community and mutual aid
Town services (school, senior center, library ( tiny yet mighty )
Indigenous history
Potential relationship to partners in Florida (including Blue Vista Lodge)
potential actions generated by the community:
Assessing culvert size and distribution
Managing roadside trees
Clearcutting around power lines
Localized power/generators
Reverse 911 for vulnerable populations
Implement state CodeRED alert system
The following pages of this report focus on many of these environmental, infrastructural, and societal risks that have been identified by the Florida community.
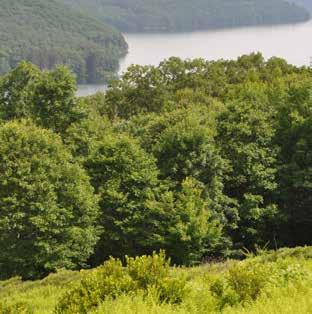
One of Florida’s many assets is that it remains very forested, with intact ecosystems—including wetlands—that support not only the Florida community but also a range of wildlife and plants. In the context of hazard mitigation, these ecosystems help to mitigate flooding and erosion that could otherwise cause greater damage to infrastructure, including roads and homes.
< 6 Feet 6-10 Feet > 10 Feet
The rugged terrain of Florida is a part of the Hoosac Range and Berkshire Hills, which are part of the Green Mountains and Appalachian Range. The Hoosac Range is made of phyllite, quartzite, and granitic bedrock (Stevens). The underlying bedrock is primarily acidic (Grow Native Massachusetts). To understand the formation of this range and the Deerfield River Valley, the long view of geologic time is needed.
The Appalachian Mountains were formed during collisions that occurred beginning in the early Paleozoic Era 500 million years ago. The compression and heat created during these mountainbuilding events formed the metamorphic and igneous rocks of the Hoosac Range where Florida sits. These uplands are harder and rockier than the softer sedimentary lowlands in the Deerfield River Valley farther to the southeast (Little).
Around 75,000 years ago, the Laurentide Ice Sheet was formed. It was miles thick and covered large portions of North America. The glacier reached New England about 25,000 years ago–its arrival and retreat 12,000 years ago shaped much of Massachusetts’ topography and had an impact on the landforms and constellation of streams and wetlands in Florida (History of Massachusetts).
The rocky uplands where Florida is located has a shallow depth to bedrock and exposed ledge in many parts. This contributes to low infiltration in the uplands and likely results in more runoff if not for root structures of the vegetation growing there. The areas with greater depth to bedrock typically correspond with wetlands, as well as areas that have historically been used for agriculture in Florida. The bedrock and soil depth also informs the plant communities that grow in Florida.
Almost 95% of Florida is vegetated and has a diverse array of ecosystems that vary depending on elevation, soil composition, and aspect. While there are many plant communities that make up Florida’s landscape, there are four general habitat types that represent the most dominant ecosystems. These habitat types have been indicated by The Nature Conservancy's "Northeast Habitat Cover Map" (The Nature Conservancy, A).
Laurentian-Acadian Northern Hardwood Forest
Laurentian-Acadian Red Oak-Northern Hardwood Forest
Appalachian Hemlock-Northern Hardwood Forest
Laurentian-Acadian Pine-Hemlock-Hardwood Forest
Acadian Low-Elevation Spruce-Fir-Hardwood Forest
Acadian Sub-Boreal Spruce Flat
Central Appalachian Dry Oak-Pine Forest
North-Central Appalachian Acidic Cliff and Talus

Of the forest types that make up Florida’s habitats, the most abundant one is a Laurentian-Acadian Northern Hardwood Forest dominated by sugar maple, American beech, and yellow birch. Depending on soil composition, aspect, and elevation, white ash, eastern hemlock, red maple, white pine, and red oak can also be found within this community. Generally in the Northeast, this forest community may be considered transitional between northern hardwood forests at higher elevations (and to the north), and the warmer Appalachian hemlock hardwoods and oak-pine forests at lower elevations (and to the south). For the analyses in this section, the Laurentian-Acadian Red Oak and Pine-Hemlock Northern Forests and Appalachian (Hemlock)-Northern Hardwood Forest have been grouped into this broader Northern Hardwood category.
In the higher elevations, there are small patches of Acadian Spruce-Fir-Hardwood Forests and Acadian Sub-Boreal Spruce flats, characteristic of cooler and wetter habitats that include balsam fir and red spruce primarily, along with yellow birch, paper birch, beech, and red or sugar maple. These habitats include both cold pockets and large areas of seasonally wet conifer swamps.
In the lower elevations on the east side of Florida are pockets of Central Appalachian Dry Oak-Pine Forests with oaks and pines that are characteristic of sunny and dry conditions. The vegetation is often patchy, with woodlands as well as open portions, or even sparse cover on dry rocky outcrops. This habitat overlaps with the Central Appalachian Pine-Oak Rocky Woodland.
This is a dry-sited, sparsely vegetated community growing in little to no soil on acidic bedrock and is subject to constant erosion. The vegetation is limited to mosses, lichens, herbs, and sparse trees and shrubs growing on bare rock or in soil pockets within crevices. Heath shrublands, birch, or spruce might be found growing in the shallow soil.


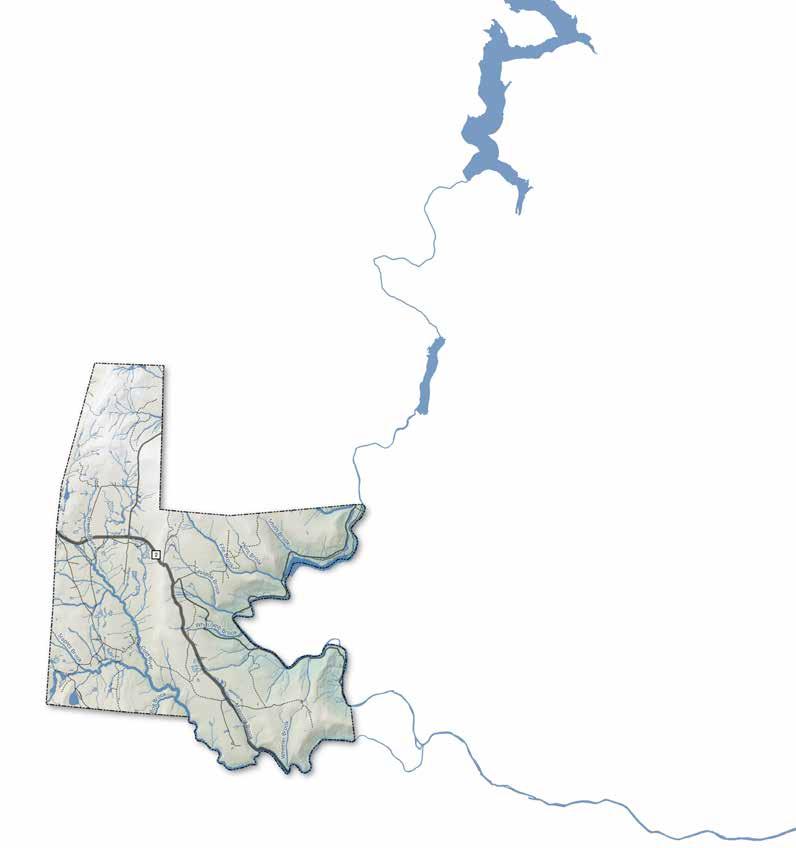
The vast majority of Florida is located in the Deerfield watershed aside from a small 1.3-square mile, high-elevation area in the northwest of Florida which is in the Hoosic watershed. That portion of Florida has no structures, significant roads, major streams, or wetlands, so this report focuses on the Deerfield watershed. The Deerfield watershed is a vast 655-square-mile area, containing 650 miles of rivers and streams and 49 lakes. The watershed is largely undeveloped, and home to less than 50,000 people. The Deerfield River was heavily manipulated beginning in the late 1700s, and now has almost 120 former mills and 30 historical dam sites blocking passage within the river. With this historical use came significant channel straightening which “further impacted hydrology and natural communities by causing unnaturally high flows, habitat degradation, flooding, erosion, and sedimentation” according to John Burk (Estuary).
The Deerfield River’s headwaters begin approximately 30 miles north of Florida in Stratton, Vermont, and the river flows down to the Connecticut River approximately 20 miles to the east of Florida. Many named small streams originate in Florida’s high elevation terrain, but the most notable is the Cold River, which originates in western Florida. Fed most notably by the Green River, Staples Brook, and Tower Brook, the Cold River meets the Deerfield just to the east of Florida in Charlemont.
Within Florida’s borders sit approximately 230 acres of wetlands, which are a critical aspect of Florida’s hydrology. Wetlands are vital ecosystems known as the “kidneys of the Earth.”
The 2022 DEP Integrated List of Waters shows only one instance of impaired water in Florida: the Deerfield River is categorized as 4C for the stretch along Florida's eastern border. This category means it is impaired for one or more designated uses but does not require the development of a Total Maximum Daily Load (TMDL). The impairment in this case is "Flow Regime Modification" (Integrated List GIS).
Tree canopies, branches, and other vegetation slow and store precipitation, which reduces the risk of flash flooding.
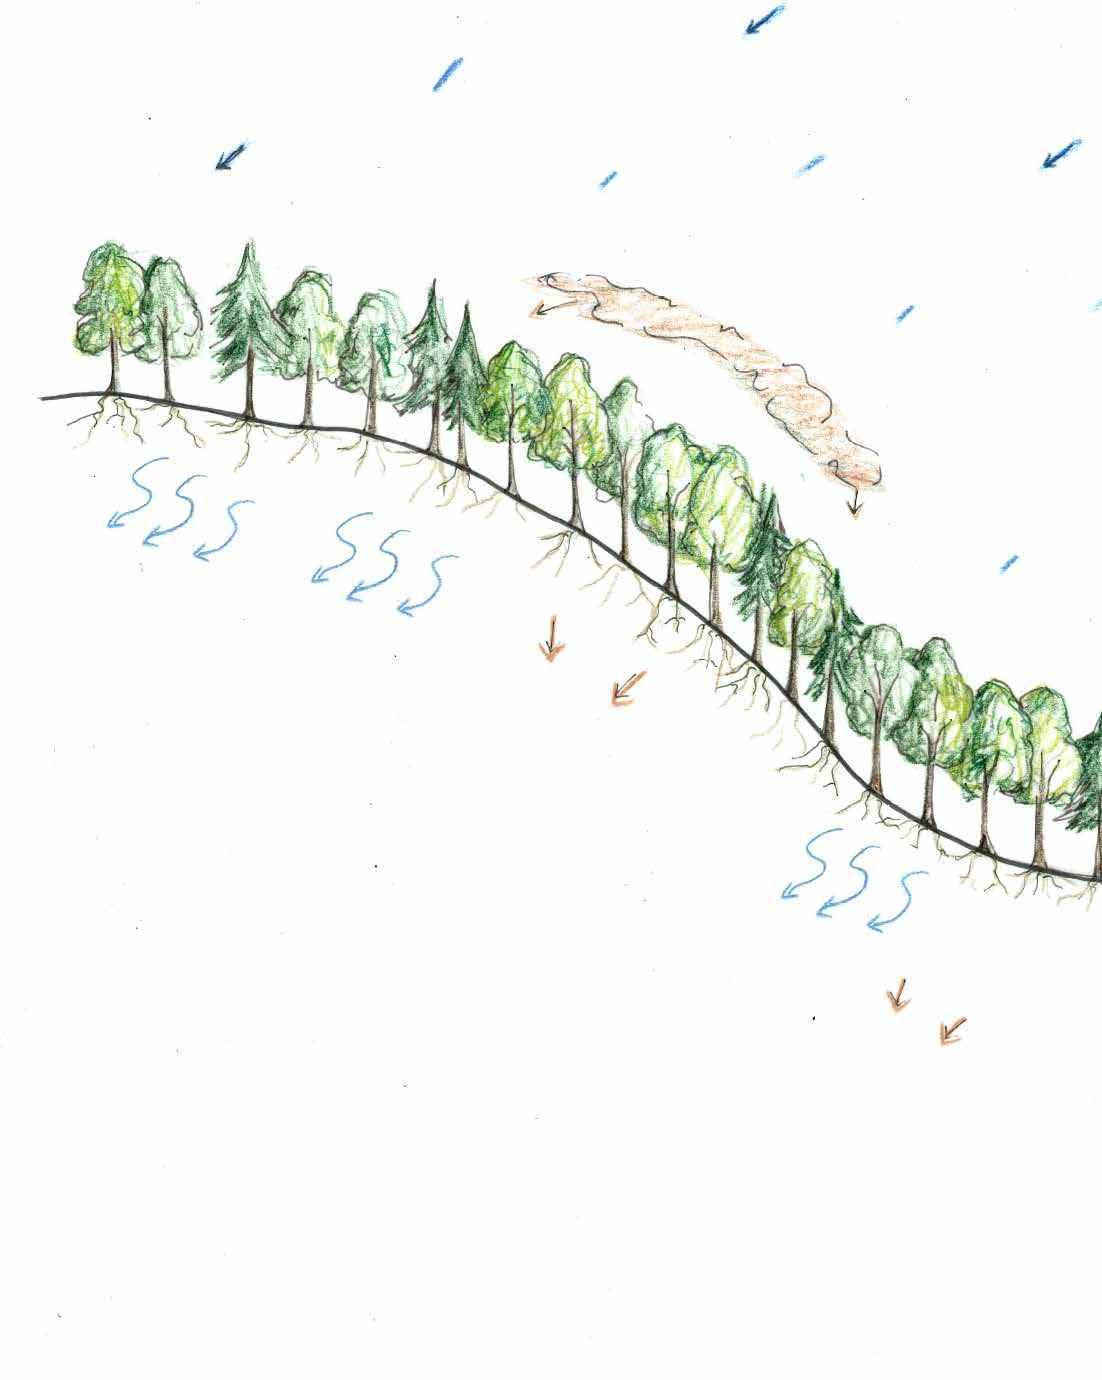
The organic matter in the forest floor, as well as the channels created by the roots, allow the water to infiltrate and absorb into the earth, thereby reducing stormwater runoff. Trees also take up water through evapotranspiration, which creates more water storage capacity in the soil.
Roots in forests and wetlands stabilize the soil, catch sediment, and reduce erosion.
Atmospheric carbon is fixed and sequestered in both forests and wetlands through the process of photosynthesis. Carbon is stored in the soil, the living vegetation, and dead plant matter.
Forests and wetlands offer many benefits, both seen and unseen. In the context of hazard mitigation, most notably they protect roads and homes from the impact of flooding and erosion (Opperman and Galloway; Snyder).
• Mitigate the impact of flooding and erosion
• Sequester carbon
• Help to filter and purify water
• Provide habitat and food to wildlife
• Offer public health benefits through recreation
• Filter pollutants
• Improve water quality
• Maintain surface water flow
• Recharge groundwater, mitigating the impacts of droughts
• Sequester large amounts of carbon
• Provide habitat to thousands of plants and animals (Monroe)
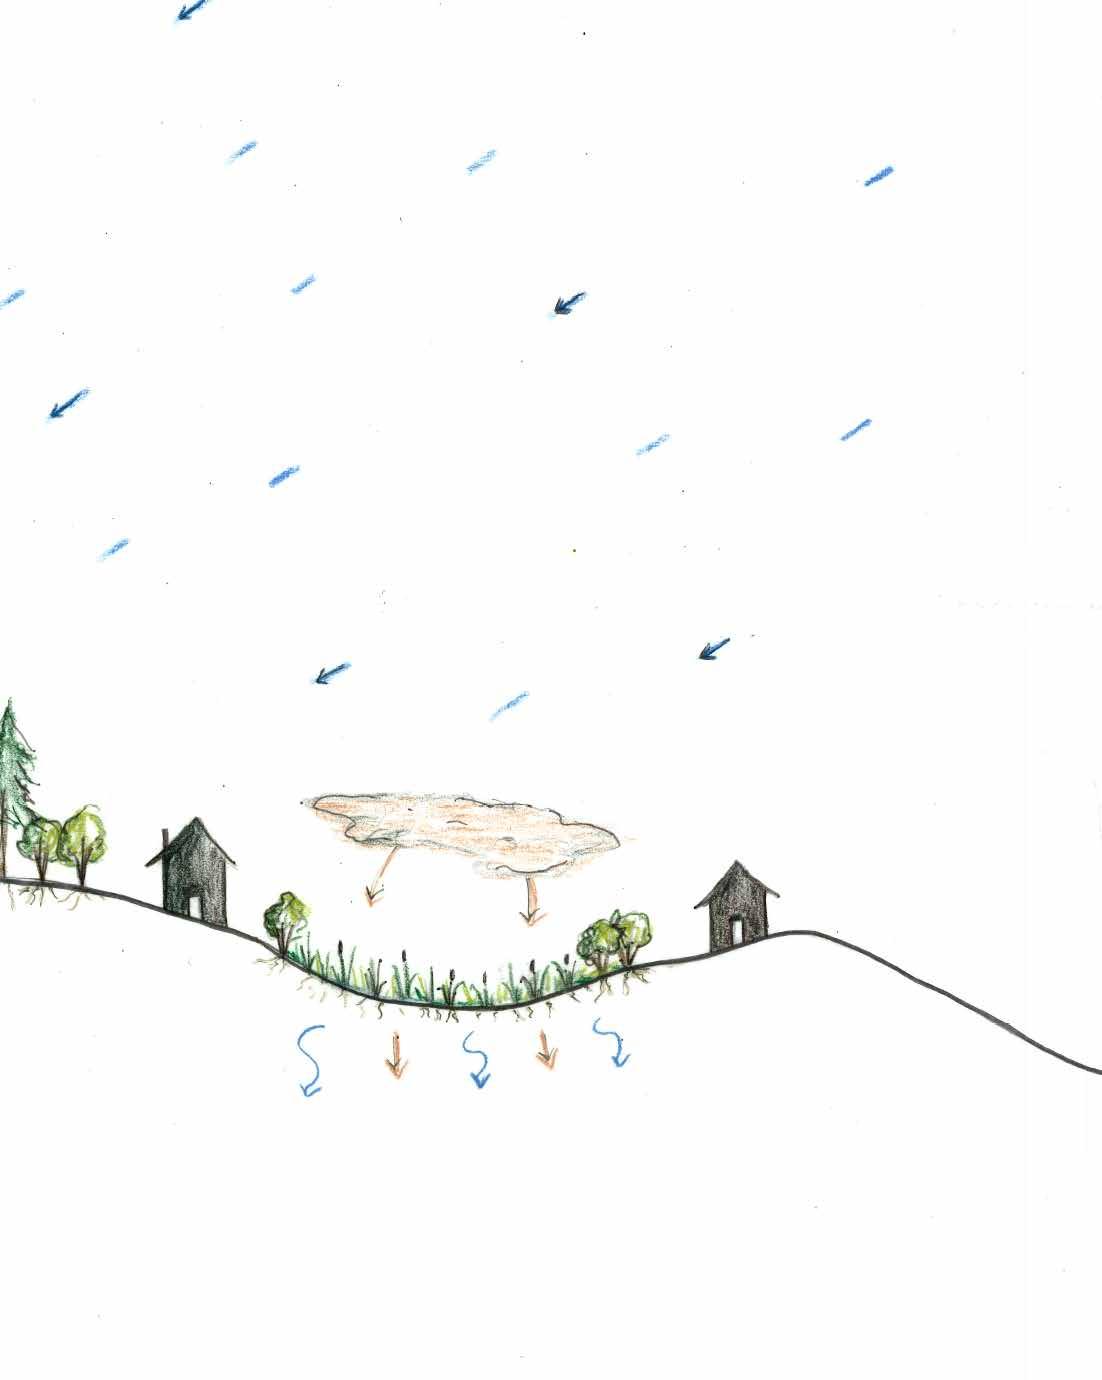
THE SPONGE EFFECT
Wetlands absorb water, which protects infrastructure by reducing flooding. Wetlands have what's called the sponge effect: one acre of wetlands can absorb one million gallons of stormwater, improving property protection by up to 20% (NOAA, A).
Core Forest Habitat (NHESP/TNC BioMap)
Critical Natural Landscape (NHESP/TNC BioMap)
Permanently Protected Open Space
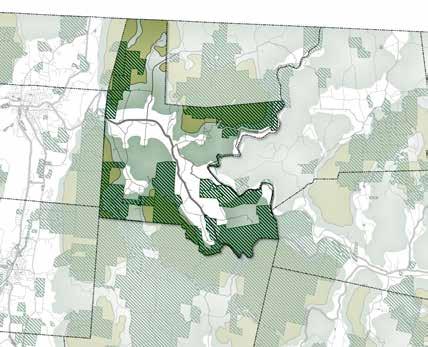
BioMap is a tool created by The Nature Conservancy and MassWildlife to help guide protection and stewardship of Massachusetts' land, waters, and biodiversity. BioMap contains many data layers, including:
• Core Habitat: "areas critical for the long-term persistence of resilient ecosystems...[Forest Core] includes the most intact forests of Massachusetts, least impacted by development and essential for animals and plants dependent on remote habitat" (MassGIS).
• Critical Natural Landscape: "large areas of intact and connected forest, wetland, river, and coastal habitat that sustain healthy populations of countless species. These landscape are minimally impacted by development which provides connectivity and resilience" (MassGIS).
There are both Core Habitat and Critical Natural Landscape areas in Florida (in addition to other data layers not represented here). These areas are significant as they are considered to be more resilient and adaptable in the face of climate change, which is predicted to cause plant/animal species loss and migration.
While much of these resilient habitats occur in currently protected lands, some BioMap Core Habitat and much of the Critical Landscape extend beyond protected areas. Conservation of, or regulation around, these habitats could help to preserve the resiliency of Florida’s ecosystems. Protecting adaptive ecosystems in Florida nurtures greater adaptability and sustainability for the plant species, wildlife, and, in turn, the residents of Florida, as the forests and wetlands are a major asset to the community and their infrastructure.
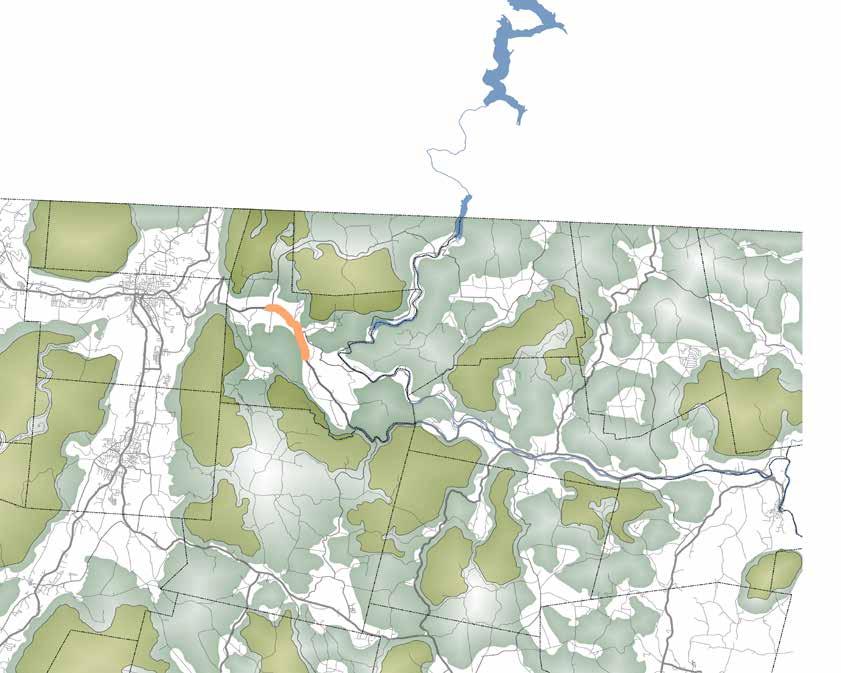
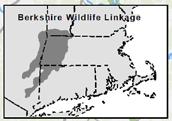
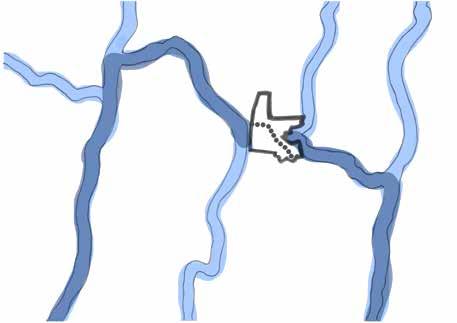
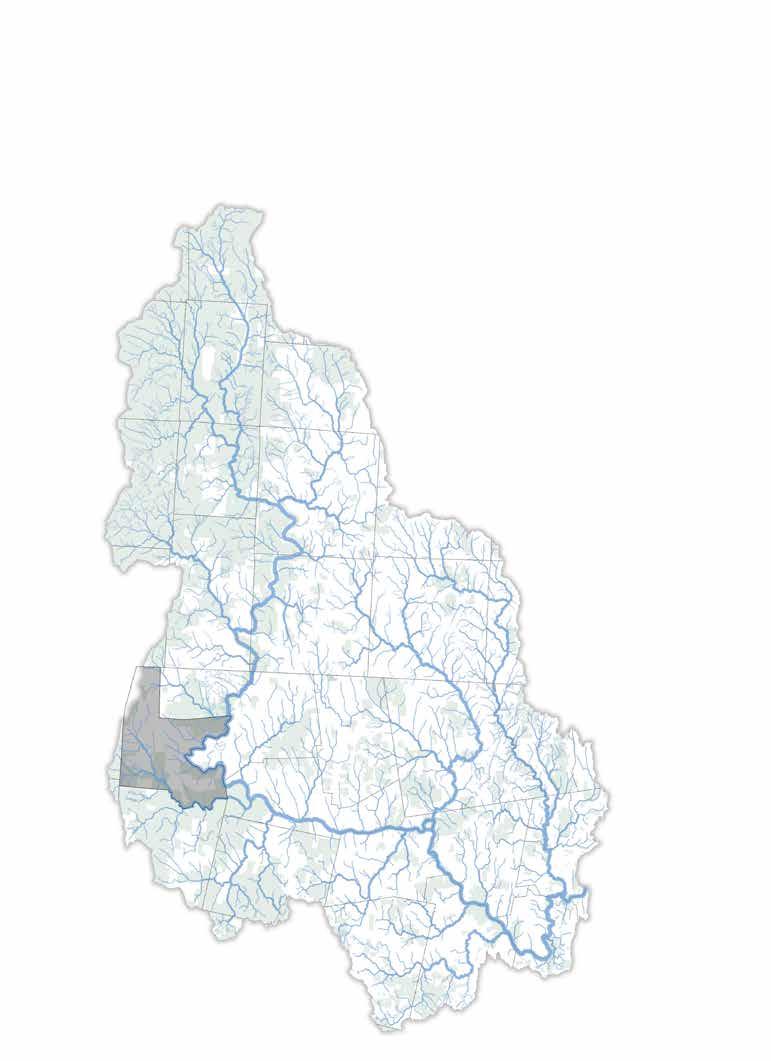
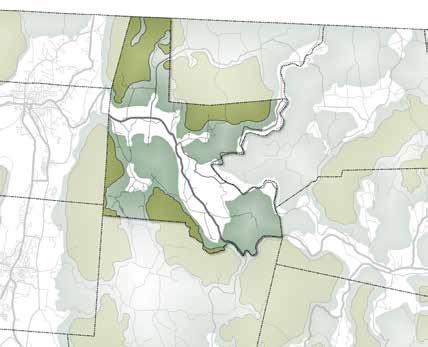
The resilient habitats in Florida also hold a place of regional importance as Florida exists within a larger swath of landscape that has been identified by the Nature Conservancy’s Staying Connected Initiative as the "Berkshire Wildlife Linkage" (see locus map above). The goal of this initiative is to "create a continuous path of protected land in natural cover across western Massachusetts to ensure safe wildlife road-crossings and movement in response to climate change, and to maintain the ability of the ecosystems to support humans by supplying clean drinking water and sequestering carbon" (Staying Connected Initiative).
The initiative writes how, through conservation and restoration of this wildlife corridor, “we can expect less property damage and injury due to animal-vehicle collisions, safer roads that withstand storms even as severe as Irene and Sandy, healthier wildlife populations that are able to move to adapt to climate change, and a higher quality of life for communities in the linkage that depend on nature for their livelihood” (Staying Connected Initiative). Using data on road sizes, traffic, and wildlife tracking, critical places are identified where actions such as land protection and changes to transportation infrastructure will provide the greatest benefit for wildlife connectivity.
Three specific areas in Florida have been identified as critical in supporting wildlife crossings over roads, and in turn, increase safety for humans as well. All three of them are priority connectivity areas between habitat nodes (circled above in umber). One includes a part of Route 2 that has been identified as a priority road segment that is a barrier to wildlife movement (drawn above in orange), where transportation strategies (e.g., wildlife under or overpasses) should be considered in order to benefit connectivity.
Forests and other ecosystems in Florida are experiencing direct and indirect impacts due to climate change. Mass Audubon’s guide for “Managing Forests for Climate Change in Massachusetts” outlines impacts on forests that are likely to increase due to a changing climate, including:
• Changing soil moisture patterns, with greater risk of drier soil conditions and drought, particularly later in the growing season. Drought conditions have been linked to the decline of oak and ash species in the Northeast. Increasingly warm and dry weather conditions may contribute to a greater potential for wildfire.
• Increasing occurrence and impact of insect pest and pathogen outbreaks; many pests are expanding their range due to warmer winters.
• Expansion of deer herbivory due to increased access to forage during winter months with less snow and warmer temperatures.
• Spreading of the range of introduced, non-native plant species that can crowd out native plants and reduce biodiversity.
• Increasing stress to northern tree species. Species such as red spruce, balsam fir, hemlock, and paper birch are projected to have reduced suitable habitat across Massachusetts due to rising temperatures and changing conditions. Meanwhile temperate or southern tree species are generally expected to move northward (Janowiak, et al.).
The Climate Change Tree Atlas is a tool that can help assess habitat suitability for individual tree species using climate models. This tool can be helpful in understanding the general trends projected for a species in a particular region and also incorporates local expertise to determine how a species might respond at a particular site.
The remainder of this section explores potential risks of wildfire and pests and pathogens on Florida’s ecosystems. Potential future development is discussed as well—while not a natural hazard, it does stand to have an impact on Florida’s landscape.
BEDROCK DEPTH
LESS THAN 18" (HIGHER) AND 36" (LOWER) FROM SURFACE
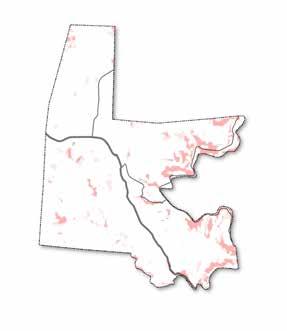
ASPECT
S/SW FACING (HIGHER) AND SE FACING (LOWER)
SLOPE (%)
GREATER THAN 25% (HIGHER), AND 15-25% (LOWER)
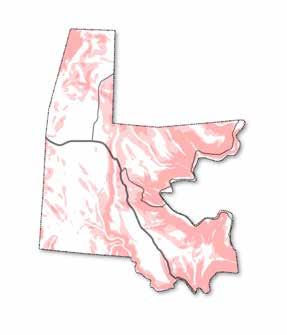
Higher Risk Lower Risk
Negligible Risk
0 1 4 MILES
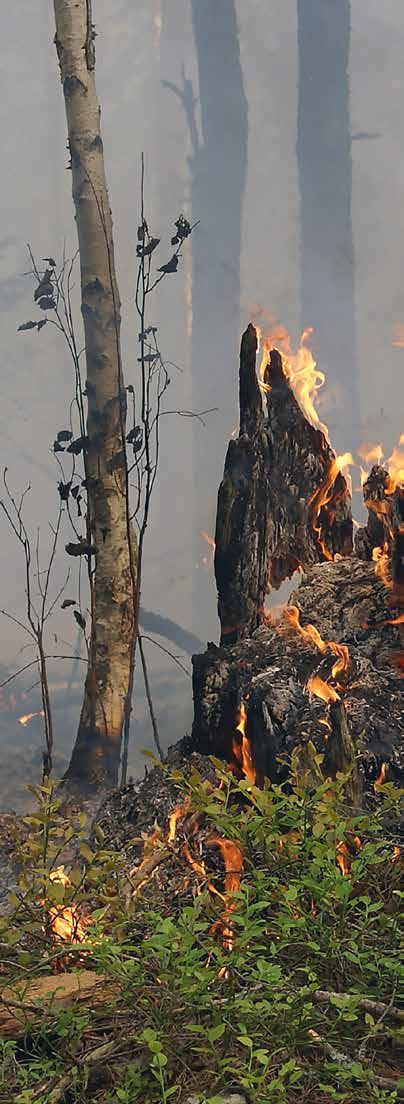
Given the inherent complexity of wildfire risk, interviews were conducted with ecologists Jesse Bellemare, Bill Patterson, and Tom Brule; all have boots-on-the-ground experience in this region. The consensus among them is that Florida is not currently at high risk for wildfire; however, with a changing climate, it is important to understand the factors affecting wildfire risk and how these map onto the ecosystems and landscape of Florida.
Wildfire is not inherently a negative force. Many habitats have coadapted with fire and rely on it for regeneration, and the suppression of fire in the short term can in certain scenarios increase the long-term damage of major fires. The complexity of producing a wildfire management plan is outside the scope of this report, so here the Conway team focuses on the relative likelihood of wildfires emerging from certain habitats, and not the management or damage potential of such fires.
There are many factors affecting wildfire risk, some of which are directly related to the habitat on the ground, and some of which are related to the climate and atmosphere. Because the current risk of wildfire is low, these risks are being assessed in the context of a climate in which drought and extreme heat are expected to be more common.
Atmospherically, the two most important factors are heat and drought, both of which remove moisture in the environment and make it more susceptible to fire. In the context of climate change, we can expect that both of these factors will increase.
One way to track risk is via the Keetch-Byram Drought Index (KBDI), compiled by the USDA. This index assesses wildfire risk by looking at the “net effect of evapotranspiration and precipitation in
producing cumulative moisture deficiency in deep duff and upper soil layers” (USFS, A). The KBDI is a means with which the town of Florida can monitor its wildfire risk.
The following are major factors affecting wildfire risk, which are shown in the context of Florida on the maps on this and the following pages:
• Vegetative cover: Certain plants have a long history of co-adaptation with fire, some making environments more prone to wildfire, while others have fire suppressive qualities.
• Wetness: Habitats that remain wet throughout the year are vastly less susceptible to wildfire, whereas dry environments are much more susceptible. A major factor influencing wetness is the distribution of water throughout the landscape because of its hydrology and wetland distribution. Florida's wetter areas will be less fire prone.
• Bedrock depth: Shallower depths to bedrock, especially those less than 18” deep, are less likely to retain sinks of moisture, are prone to dry more quickly, and therefore are more prone to fire.
• Aspect and insolation: Orientation to the sun also affects moisture levels. South- and southwest facing aspects tend to get the most sun and therefore are more prone to drying. North-facing aspects receive the least sun and therefore are more likely to stay moist, and therefore less prone to fire.
• Slope: Slope also plays a role in fire spread. Steeper slopes create conditions where fire can spread more rapidly as the flames lick upwards.
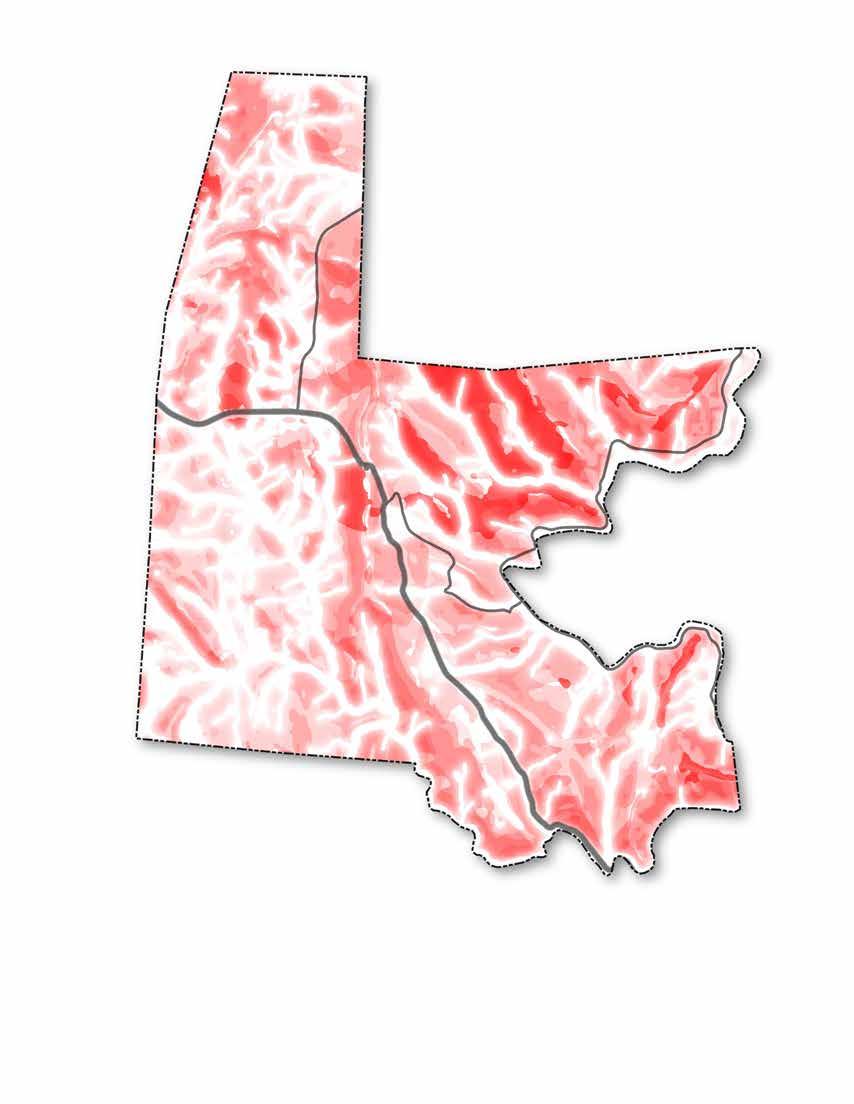
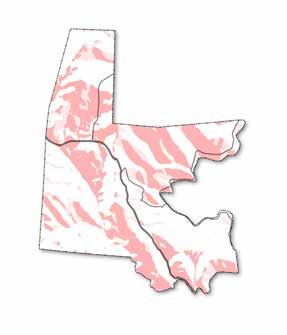
Bedrock depth, aspect, slope, vegetative cover, waterway buffers, and wetlands buffers
Higher Risk
Lower Risk
Negligible Risk
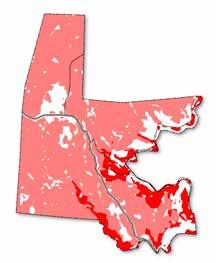
Hemlock are widely distributed as a major canopy tree throughout most areas of Florida, with more concentrations in the southeast. Hemlocks tend to grow in wetter areas less prone to fire. They also help to suppress fire because of their dense canopy, which tends to keep the forest floor moist, and their needles are not very flammable. As discussed in more detail below, however, hemlock is under significant threat from the hemlock woolly adelgid, which threatens to severely reduce hemlock populations in the coming decades. Broadly speaking, historically in the northeast when hemlock forests have died off, they’ve been replaced by oakpine-dominated forests, which are much more prone to fire. The die off of hemlock and potential replacement by more fire-prone forests in the coming decades may increase the risk of wildfire.
Spruce-fir forests are somewhat prone to fire but on longer time intervals than oaks: a stand with red spruce and balsam fir has a wildfire frequency of between 35 years to over 200 years (Brown and Smith). Red spruce is fairly well distributed throughout Florida, however, much of Florida’s black spruce and balsam fir are located in a wet region on the west side of town, which are less prone to fire due to their wet habitat.
Oak forests are Florida’s most wildfire prone forests. A stand with red oak has a wildfire frequency of less than 35 years up to 200 years (Brown and Smith). Oaks are fire adapted, meaning their bark is thick, their canopy is high, and they have an ability to resprout if they are top-killed. Because their leaves are thick and stay on the ground for some time, they are more prone to forest floor fires as well.
Vegetative cover, and its intersection with terrain attributes, plays a significant role in fire risk. Within the habitats of Florida, a few species stand out. While the Conway team does not have access to detailed information on the precise species composition in a given area, such as what would be provided by a forester’s cruise data, the general distribution information here was gleaned from the Nature Conservancy’s Habitat Guide (NatureConservancy).


Insects, bacteria, and fungi play numerous roles including pollination, food sources, soil health, decomposition, and balancing ecological systems and cycles. Organisms are identified as pests when they damage or interfere with desirable plants, impair ecosystem health, cause damage to infrastructure, or negatively impact the health of animals or humans (UCANR).
Shifting climates and the movement of plants, animals, bacteria, and fungi across the globe are introducing new pests and pathogens, causing short- and long-term damage to ecosystems. While the forests of Florida are one of its greatest assets and help provide a corridor of migration for plant and animal species as climates shift, these same forest corridors allow for the movement of invasive species, pests, and pathogens and put the existing ecosystems at risk of species and habitat loss.
In Massachusetts, the pests and pathogens with the potential to cause significant damage to ecosystems include hemlock woolly adelgid, emerald ash borer, Asian longhorn beetle, beech bark disease, beech leaf disease, and spongy moth. The following pages discuss the main ecosystems within Florida and the potential impacts of these pests on their stability. Regarding human health in connection to Florida's ecosystem, tick-borne diseases are gaining precedence (Gougherty and Davies).
This section describes the pests and pathogens that have the highest impact on ecosystems in Florida, how to identify them, and their lookalikes. Lyme disease is also discussed in relation to its growing influence on human health in Massachusetts.

(Source: DACF)
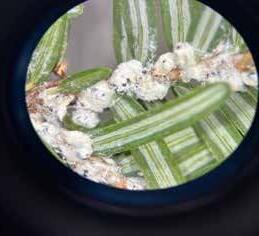
Hemlock woolly adelgid affects all species of hemlock but does not impact pine, spruce, fir, or other conifers. HWA is thriving in hemlock’s northeast native range, where shifting climates mean that consecutive days below -4°F are a rarity. The die-off of hemlock and loss of its dense canopy leads to increased populations of deciduous tree species (e.g., oak and pine) and a dryer forest floor. As mentioned in the wildfire section, this combination results in transforming a previously low-fire risk ecosystem into an ecosystem susceptible to fires.
Signs: Wool-like wax filament masses (approximately 1/16” to ⅛” in diameter) line the underside of hemlock needles as the insect matures. They are most easily seen in late fall to early summer on the newer growth of the tree. They spread from March to July.
Look-alikes: Spittlebug, spider egg sacs, oak skeletonizer, and scale insect floss.
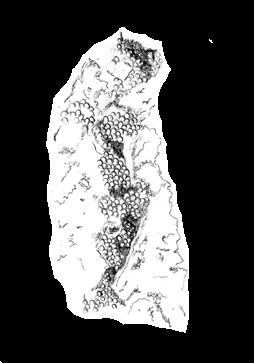
Emerald ash borers are metallic green wood-boring beetles as adults (½” long, ⅛” wide) with about ½” long off-white pupae. Their larvae can be 1” long and have a distinct ten-segmented abdomen. This woodboring beetle feeds on the phloem of ash trees (Fraxinus spp.). The larva girdles the tree’s tissue, killing the tree in as little as two years (Flower, et al.). Within eight to ten years of EAB establishment in an ecosystem, 99% of the ash trees are killed. Black ash has been declared endangered under the Federal Endangered Species Act as a result of EAB.
Signs: Ash impacted by EAB will show crown dieback and bark deformities such as vertical cracks and prolific shoots from the lower trunk, D-shaped exit holes, and yellowing foliage.
Look-alikes: Bronze birch borer, the metallic wood borer, and the two-lined chestnut borer (Vermont Invasives, C).
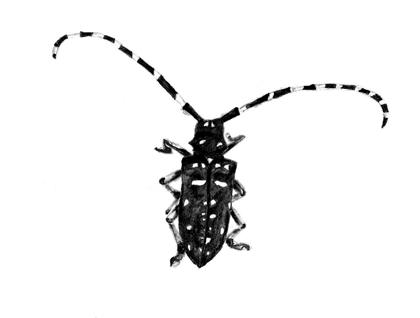
Asian longhorn beetles are approximately 1 to 1.5” long and have a shiny jet-black body with white spots, long black and white banded antennae, and bluetinted feet. Their off-white larvae are up to 2.5” long. They bore into trunks and branches of hardwood trees. While the adults will feed on the leaves of trees, this feeding causes little damage. Some species they impact include ash, birch, elm, golden raintree, sycamore, maple, horse chestnut, katsura, mimosa, mountain ash, poplar, and willow. As they are generalists, they have the potential to cause more damage than Dutch elm disease, chestnut blight, and spongy moths combined (Vermont Invasives, A; Mass.gov, A; USDA, C).
Signs: Adult beetles emerge from July to September leaving dime-sized exit holes that go deep into the tree. Egg-laying sites ooze sap or will heal over with a knotted scar, leaving sawdust or frass.
Look-alikes: white-spotted sawyer, western conifer seed bug, northeastern sawyer, eyed click beetle, and broad-necked root borer (MassNRC).
Beech bark disease consists of insects (e.g., Cryptococcus fagisuga [beech scale] and Xylococculus betulae) and fungi (Neonectria faginata and N. ditissima) causing aboveground mortality of beech. Air pollution and nutrient imbalances weaken the trees and intensify their risk of BBD. While beech trees have little timber value and the disease spreads slowly, the loss of beech in the canopy has put trees of high economic value that grow in their understory (e.g., sugar maple) at risk of mortality. Beech contributes biomass, biodiversity, erosion control, food, and habitat in a forest ecosystem (Cale).
Signs: Scale insects appear as "white wool" on the tree trunk. While the scale doesn’t typically kill the tree, over three to six years it weakens it, giving way to fungal infection. The infection causes yellowing of leaves, smaller variegated new leaves, and a reduced canopy. Cankers develop on the trunk that eventually girdle and kill the tree. In summer and fall, the fungus is seen as small red dots in a circle. Weakened trees are susceptible to breaking in heavy winds. In the Northeast, the mature trees see a mortality of 50% in ten years with an eventual loss of 90% (Vermont Invasives, B; Cale et al.).
Look-alikes: Lichen and beech blight aphid (Peterson).


Beech leaf disease is caused by the Litylenchus crenatae ssp. mccannii (LCM) nematode. The nematodes increase populations over the summer and by fall spread into new leaf buds, feed on the bud tissue causing them to dry and crack, and subsequently not leaf out in the spring (Norman). This results in branch and canopy loss. Post infection, saplings typically die within five years. The rate and breath of mortality is high once a stand is infected. The loss of canopy and the beech nut that is important to wildlife, and a key component of bear diets, is rippling through the ecosystem (USFS).
Signs: The distinguishing characteristic of BLD is dark green interveinal banding on new leaves in the spring caused by cellular damage to the leaf bud. As the infection increases, leaves develop a leathery texture and crinkle (Norman).
Look-Alikes: Beech leaf curl aphid, erineum patch, anthracnose, powdery mildew (Michigan Invasives).

(Sources: USDA, B; NYSDEC)
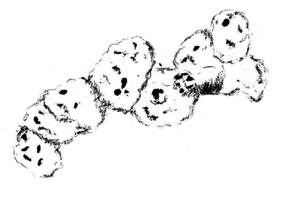
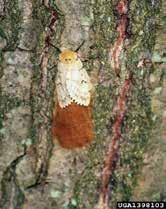
Spongy moths (Lymantria dispar dispar) (previously known as Gypsy Moth) have been present in the U.S. for over 100 years and feed on the leaves of over 300 tree and shrub species, leading to defoliation and sometimes plant mortality. Females lay eggs on outdoor surfaces, including tree trunks, outdoor toys, and furniture. The movement of these objects disperses the eggs. Drought conditions decrease the presence of fungi that mitigate spongy moth populations.
Signs: Egg masses about 1.5” in diameter are present in the late summer, winter, and spring and covered with yellowish hair. Caterpillars about 1.5 to 2.5” long are present in spring (black and hairy when young transitioning to mute yellow to grey with bristle-like hairs with an alternating pattern of five pairs of blue dots and six pairs of red dots). The adult moths are seen in the summer. Males have a 1.5” wingspan, and are brown with dark brown on their wings, while females are off-white and have a 2” wingspan with a jagged pattern on their wings that inhibits them from flying. Look for defoliation of hardwood trees and shrubs.
Look-alikes: Tent caterpillars have a white line with light blue and black spots on either side.

(Source: Mayo Clinic)
Lyme disease is an illness caused by a borrelia bacteria carried by ticks with 1,515 cases confirmed in Berkshire County from 2000 to 2020 (Tick Check). Tick habitat includes grassy, brushy, or wooded areas.

Typically the tick must be attached for 24 hours to spread the bacteria. Symptoms of lyme arise in stages that sometimes overlap or some stages may never present themselves.
Stage One (3 to 30 days)
A rash that is warm but is typically not painful or itchy. Potential signs of fever, headache, extreme tiredness, joint stiffness, muscle aches and pains, and swollen lymph nodes.
Stage Two (3 to 10 weeks)
Many rashes on other parts of the body, neck pain or stiffness, muscle weakness on one or both sides of the face, irregular heartbeats, pain that starts from the back and hips and spreads to the legs, pain, numbness, or weakness in the hands or feet, painful swelling around the eye or eyelid, and eye pain or vision loss.
Stage Three (2 to 12 months)
Arthritis in large joints, particularly the knees, pain, swelling, or stiffness that is long-lasting. General symptoms that come and go.
BY
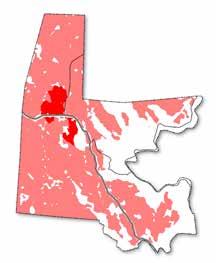
Northern Hardwood Forests

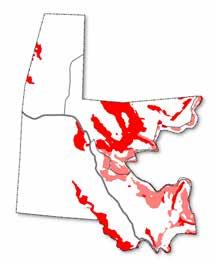
The northern hardwood forests are at the highest risk in Florida’s ecosystems as they contain a high number of species that could be impacted by hemlock woolly adelgid, beech bark disease, emerald ash borer, asian longhorn beetle, and spongy moth. This forest type makes up approximately 72% of Florida’s land. It provides corridors of unfractured forest systems allowing northern migration of plant and animal species as shifting climates reduce their southern habitats.
In Massachusetts, the spongy moth preferred food source is the foliage of oak trees and it has caused defoliation and tree loss across the state, including the northeast corner of Florida (Mass.gov, B). From 2015 to 2017, drought conditions decreased the fungi that were mitigating spongy month populations and led to 923,000 acres of defoliation across Massachusetts. Moist springs in the following years helped decrease the population to a current manageable level (Mass.gov, B). Asian longhorn beetles also feed on oak forests (Grimaldi).

Lingonberry is an evergreen shrub in the heath family that spongy months feed on (NYSDEC). Monitoring of heath shrublands for the presence of spongy moths will allow for early detection and may help prevent its spread or large-scale defoliation. Beech bark disease, beech leaf disease, and hemlock woolly adelgid are species specific and do not impact these ecosystems. There are no reports of Asian longhorn beetle impacting acidic cliff and talus ecosystems.
Spongy moths and Asian longhorn beetle tend to avoid firs and spruce (Cornell), and as hemlock woolly adelgid, beech bark disease, beech leaf disease, and emerald ash borer are host-specific insects the spruce-fir hardwood forests in Florida are not impacted by the more damaging pests and pathogens in the region. The white-spotted pine sawyer, a look-alike of the Asian longhorn beetle, feeds on firs and spruce, but is considered a minor pest and does not warrant the same response as Asian longhorn beetle (UVM).

Though it is a natural trajectory of a town’s growth, future development may be a risk to Florida’s intact ecosystems—and the services they provide the human residents—if it is done so haphazardly (e.g., involving clear-cutting and fragmenting woodlands). Approaching potential future development thoughtfully and with consideration towards the valuable forests and other ecosystems will support resilience for the Florida community in the long term. This thoughtful approach is in line with much of what the Florida community has expressed as desirable in visioning sessions that informed planning processes in the early 2000s.
The Berkshire Regional Planning Commission (BRPC) created a buildout analysis for Florida in 2000 to help the community think about where future growth could occur in town and what its impact might be. After taking into consideration current land use and physical development constraints, as well as the Agricultural/Residential zoning that requires a minimum lot size of one acre, almost 4,000 acres of developable land were identified in this process. The BRPC acknowledged that based on historical development trends within Florida, this maximum buildout scenario would be unlikely to happen. (Though it is challenging to predict development pressures–there is a housing shortage in Massachusetts now and the Northeast is anticipated to receive people migrating from other areas impacted by climate change.)
CONSIDERING
The buildout analysis helped to inform Florida’s Community Development Plan (CDP) in 2003, where one of the community vision statements was to “thoughtfully guide and manage growth to ensure Florida conserve its present natural resources, and preserve its traditional rural atmosphere and small town character that makes it a desirable place to live and work” (BRPC, 5).
The Open Space section of Florida’s CDP reported that 81% of residents who participated in a survey overwhelmingly supported a town effort to protect farms, forests, and other natural resources. Many of these participants expressed a desire to maintain open space in private hands in order to maintain a tax base, but were interested in alternatives to protect property from development such as conservation restrictions. The survey revealed that because so much land is already protected and therefore does not bring property taxes into the municipality, there was little public interest or support for further state acquistion of land. Flexibility in land protection, land use controls, and development scenarios was deemed to be desirable in order to maintain the potential for development in the future.
The community’s opinions expressed in the CDP from 2003 as well as the MVP Community Resilience Building Workshop in March 2025 reveal residents' appreciation of Florida’s natural resources and the wish to protect them and expand development thoughtfully. Too much flexibility around development could conflict with this vision of protecting natural resources and maintaining rural character in Florida.
THOUGHTFULLY
A common concern in many communities about protecting land, particularly as it relates to permanent protections, is that it will reduce the tax base. A study published in Conservation Biology in 2019 found that land conservation generally boosts local economies through a resulting increase in employment, particularly in rural areas (Sims et al.). This study also points to additional research that "suggests significant amenity value from protection: open spaces can result in 5 to 35% higher property sale prices (Thorsnes 2002; Earnhart 2006) and 13 to 14% greater parcel appreciation rates than regional averages (Lacy 1990). These results were found in the context of both public and private land conservation" (Sims et al., 7).
To this point, American Farmland Trust provides a methodology for a cost-of-services analysis that looks at revenues obtained from various land uses and the corresponding demands on municipal services. UMass Amherst has used this methodology in four Massachusetts communities (Great Barrington, Whately, Upton, and Haverhill) and has found that open space and commercial land uses have lower revenue-to-expense ratios than residential land uses. For example, the 2017 analysis for Whately showed that for every $1 of revenue brought in from residential land, $1.13 is spent providing services for that land—whereas for every $1 of revenue brought in from open space land or commercial/industrial land, only $0.46 and $0.56 is spent providing services for those lands, respectively (Murray and Catanzaro).
When it comes to resilience planning for Florida, it will be important to find a balance between identifying areas to develop if more housing is needed, while being sure to honor the community's wishes to have a low-impact on and protect the surrounding ecosystems.
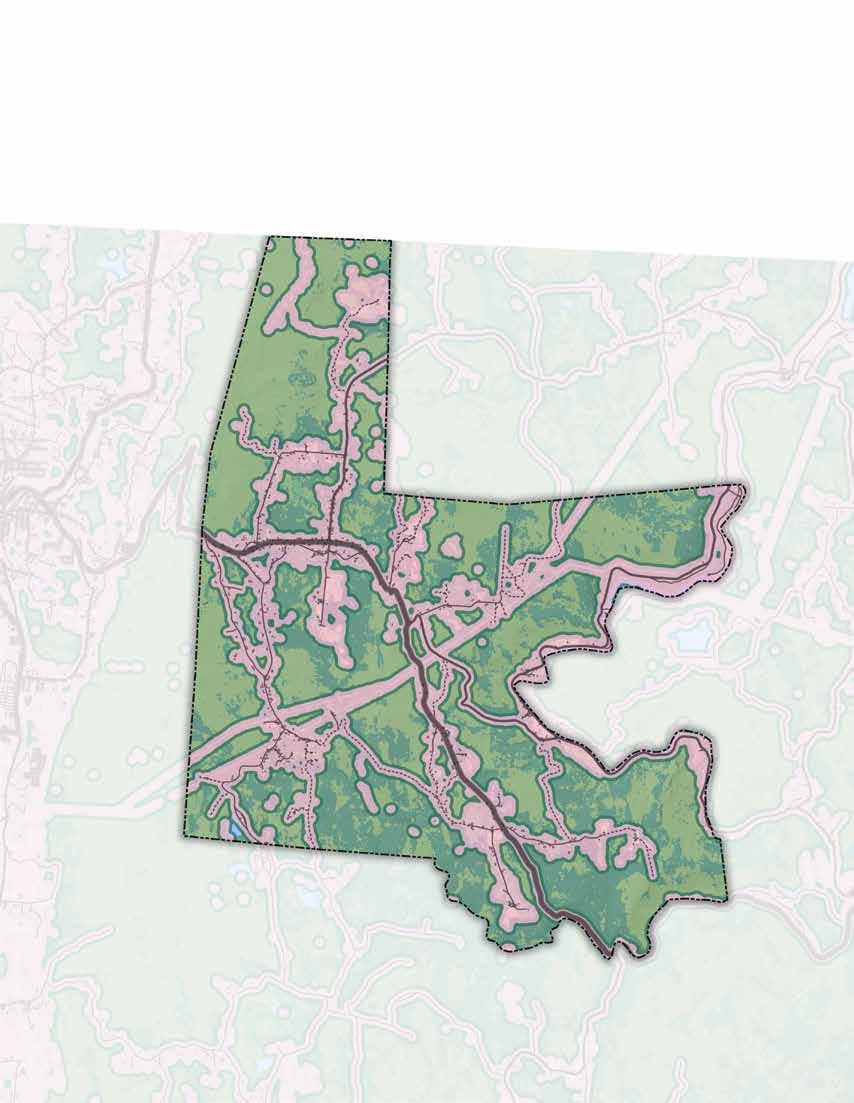
WHILE
"Forest fragmentation is the breaking of large, contiguous, forested areas into smaller pieces of forest; typically these pieces are separated by roads, agriculture, utility corridors, subdivisions, or other human development" (Northern Woodlands).
Currently in Florida, developed areas such as roads, homes and parking cover about 3% of the land area while forests cover almost 90%. While this contrast seems striking, it doesn't fully capture the effect that development has on forested areas. This wider effect is captured by the concept of "fragmentation", described in the callout above. Like humans, natural systems need to stay connected, and when they are isolated, they can become unhealthy. So for example, while a road may cover very little land area, it can break a forest into separate islands, and restrict movement of plants and animals between them. Also, depending on how homes are laid out, they can have very different effects of fragmentation. For example, homes that are on large parcels that are spread throughout the landscape have a much larger fragmenting effect than the same amount of homes that are closer together. Another effect that development has is called edge effect. When a habitat is disturbed, such as trees being cleared for a home, the effect of this disturbance doesn't end at the edge of the tree line. Because of the different land use types coming together, the edge effect brings new influence into the forest, such as predation, invasive species, and sunlight, which means that for a few hundred feet, the forest becomes a very different place, driving out species that rely on intact forest. This effect is illustrated on the map to the left, where all development and clearing has a 300 foot buffer, to show how human uses create smaller islands of forest.
300' Fragmentation Buffer around Developed Areas
Deciduous Forest
Evergreen Forest
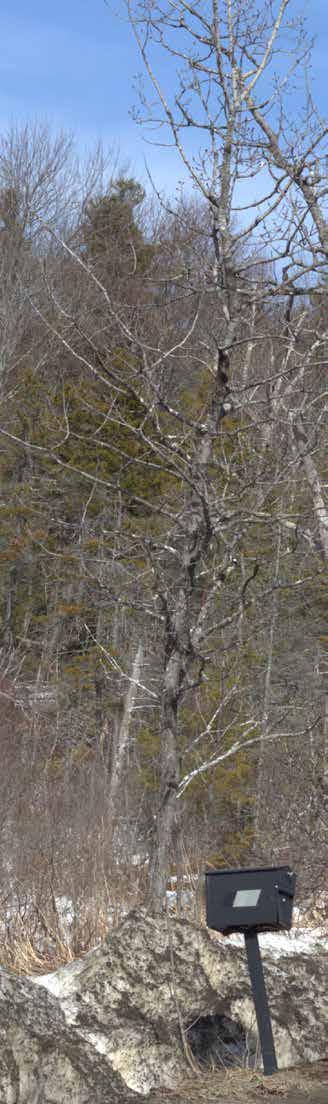
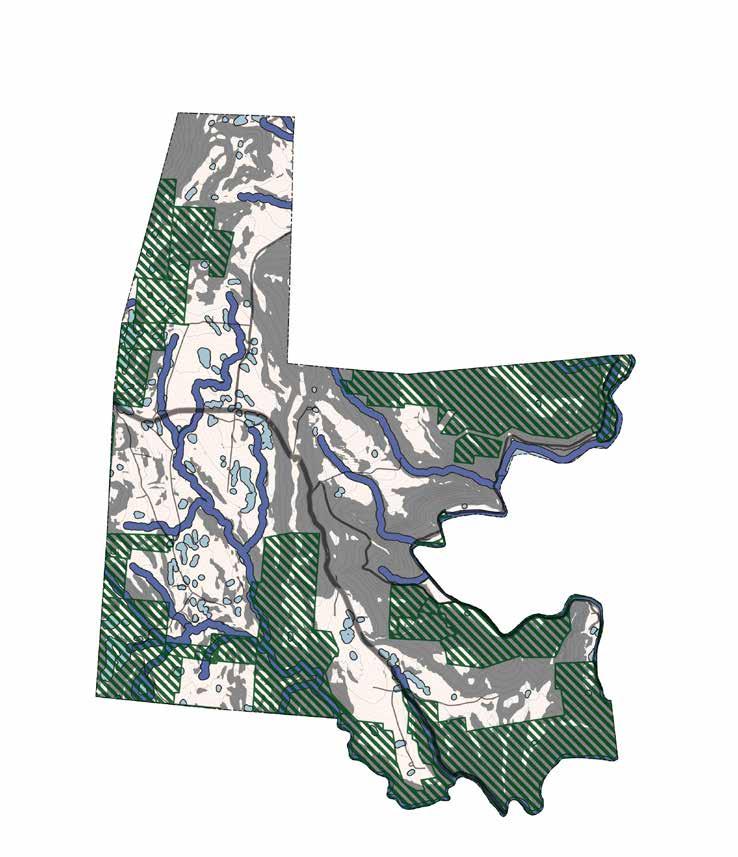
The following maps begin to take into consideration both physical and regulated constraints for development as well as ecological constraints. This is just the start of assessing which areas in Florida could accommodate future development and which should be prioritized for ecological protections.
This map illustrates areas in Florida that have existing development constraints, including permanently protected land, regulated waterways and wetlands with their 100-foot buffer, and perennial streams with their 200-foot riverfront area. Other physical limitations are represented as well, including slopes above 15%. All of Florida is zoned for Agricultural/Residential.
Permanently Protected Open Space
Wetlands 100-Foot Buffer
Perennial Streams 200-Foot Riverfront Area
Slope < 15%
Slope > 15%
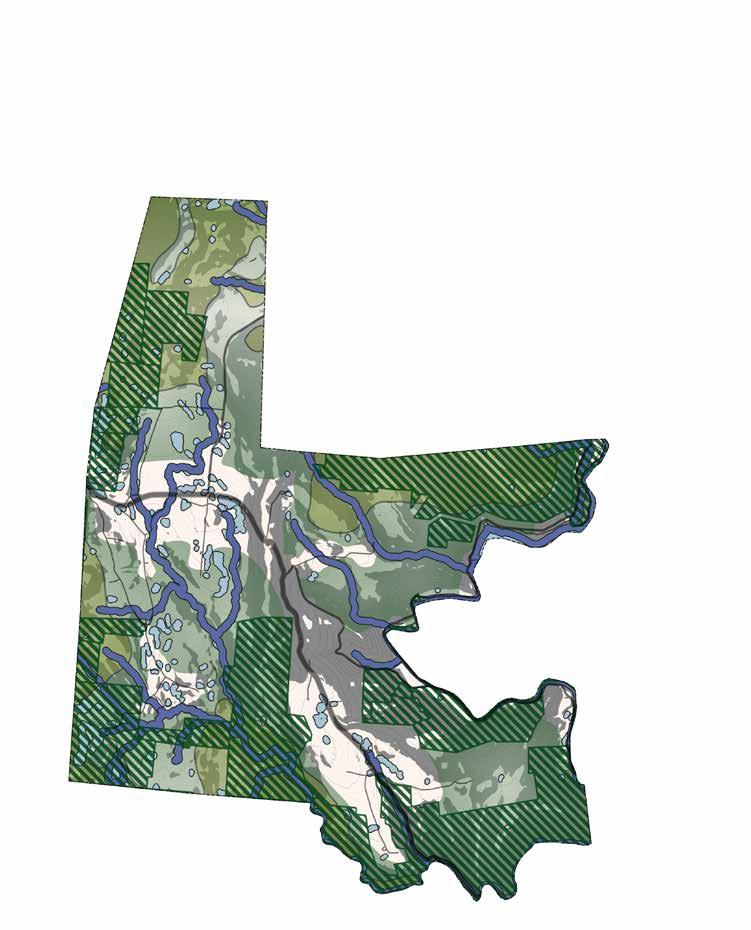
This map combines the existing development constraints with the BioMap Forest Core, BioMap Critical Natural Landscape, and the three priority connectivity areas between habitat nodes (circled in umber) highlighted by the Nature Conservancy for the Berkshire Wildlife Linkage. Protection of these ecosystems and critical wildlife corridor points should be considered moving forward. The spaces remaining include areas that are relatively flat and near to roads, which in some cases are both suitable for development.
DEVELOPMENT CONSTRAINTS WITH ECOLOGICALLY SENSITIVE AREAS
Permanently Protected Open Space
Wetlands 100-Foot Buffer
Perennial Streams 200-Foot Riverfront Area
Slope < 15%
Slope > 15%
Core Forest Habitat (NHESP/TNC BioMap)
Critical Natural Landscape (NHESP/TNC BioMap)

There are actions that can be taken to share information with the community about the risks and responses to the potential of wildfire and the spread of pests and pathogens. Ongoing communication with specialists may support the planning process.
Develop a plan to manage risk in potentially fireprone areas like the oak-dominated forests. The plan may include controlled burn regimens in fire-prone areas. Educate the community about risks and recommendations associated with wildfire.
Responses to pests and pathogens depend on seasonality, species, and level of existing and potential impact. General recommendations include education on pests and pathogens identification made available to residents; not moving firewood off site; and maintaining continued communication with regional DCR offices for early detection. A few speciesspecific recommendations on a site scale include:
• Hemlock Woolly Adelgid Response: Do not move hemlock firewood off site, monitor trees, and remove bird feeders near hemlocks from March to July as the HWA can be dispersed by contact with bird feathers and feet. Prune hemlocks in August or February to prevent overhang of branches on roads and trails. In partnership with DCR, trials of the biological control Sasajiscymnus tsugae, a beetle that feeds on HWA, may be appropriate (DACF).
• Emerald Ash Borer Response: (ISC) Control methods include mechanical control through selectively cutting infested trees and burning or burying the wood, or injecting pesticides into the tree—this method requires an annual application and has the best results when done before infestation (Mwangola). In partnership with DCR, trials of wasps (Tetrastichus planipennisi, Spathius galinae, and Oobius agrili) as biological controls may be appropriate (Duan).

• Asian Longhorn Beetle Response: Remove infested and nearby susceptible trees by chipping/burning to prevent the spread of ALB, and detect early as small populations can be eradicated (USDA, C).
• Beech Bark Disease Response: Beech scale can be removed using brushes, a blast of water, or direct application of insecticidal oils annually. Research is being done to propagate beech trees that are resistant to beech bark. Contact DCR to stay up to date on access to resistant varieties. Selective harvesting of diseased trees allows resistant or partially resistant trees a better chance at survival. In forests where BBD is not yet detected, remove unhealthy, aged, or rough-barked beech trees. When beech trees die or roots are disturbed, they produce young shoots, forming thickets on the forest floor that prevent the growth of understory species (e.g., maple or oak). Manage thickets by decreasing root disturbance, cutting, or applying localized herbicides (Kibbe).
• Beech Leaf Disease Response: Research is being done to find a forest scale treatment for BLD. Current studies for individual tree treatment include injecting thibendazole into the trunk. Application of potassium based fertilizers at the base of trees can strengthen the tree and increase its resistance to BLD. If the tree is highly infected these methods may not be effective (Norman).
• Spongy Moth Response: Inspect all outdoor items before moving them, and scrape egg masses into hot soapy water (USDA, B).
• Lyme Disease Response: An increase in deer population and a warming climate have increased tick populations across North America. Management methods may include increasing the deer hunting season or reducing the predator species hunting season (such as coyotes and bobcats). Provision of educational activities and resources to the community is encouraged.

There are a range of actions that can be taken to help reduce the loss of the valuable ecosystems in Florida, while also maintaining the rural character of the town and allowing for continued recreation in and appreciation of Florida’s landscapes.
As development occurs, Florida should ensure that intact and critical ecosystems are protected and preserved to the extent possible. The following actions could be taken by the Town and individual residents to conserve these ecosystems in either permanent or temporary ways.
On a municipal level:
• Consider subdivision regulations with provisions for open space and stormwater erosion control, as well as a wetlands protection bylaw to protect Florida’s rich biodiversity and to avoid the fragmentation of ecosystems. The Towns of Ashland, Bridgewater, Westborough, and Weston are some of the many municipalities that have passed wetland protection bylaws to further safeguard wetlands beyond state regulations.
• Consider zoning guidelines that include Natural Resource Protection Zoning (NRPZ) and Open Space Residential Development (OSRD). NRPZ and OSRD are local zoning techniques designed to connect land conservation and land development. They can take several forms, but typically involve compact patterns of development so "significant areas of land are left undeveloped and available for agriculture, forestry, recreation, watershed, or wildlife habitat" (MassWoods).
• Consider extending permanent protections of intact and critical ecosystems as outlined in the BioMap layers through acquisition or partnerships with land trusts.
• Define low-risk areas for future development via a town-wide Comprehensive Planning Process and identify methods for encouraging development in these defined areas instead of more ecologically sensitive locations.
On a resident/parcel level:
• Encourage education about and enrollment in landowner incentive programs such as Chapter 61-Forestry, 61A-Agriculture, and 61B-Open Space and Recreation that offer temporary protections of land. This program "offers landowners tax breaks in exchange for keeping land undeveloped and for providing valuable public services such as recreation, timber and food products, clean water, and wildlife habitat" (MassWoods).
• Encourage education and adoption of climate-smart forestry practices that integrate the tasks of managing a forest for carbon sequestration, climate change adaptation, and timber (MA Audubon).
• Encourage partnerships with local land trusts such as Mt. Grace, Franklin Land Trust, New England Forestry Foundation, and Northwest Woodlands Partnership to conserve land through sustainable stewardship.
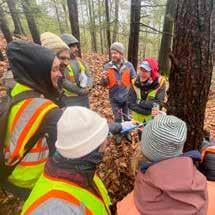

MVP ACTION GRANT: ROWE, MA AWARD: $164,450
An MVP Action Grant awarded to the neighboring Town of Rowe in 2023 focused on Community Driven Forest Climate Adaptation. The goal of this project was to "deliver climate-smart outcomes and build resilience through community engagement and forest stewardship planning. This was achieved via engaging Indigenous communities, initiating climate-smart Open Space Planning, hosting educational walks, and completing forest operational planning" (MassGov, D).
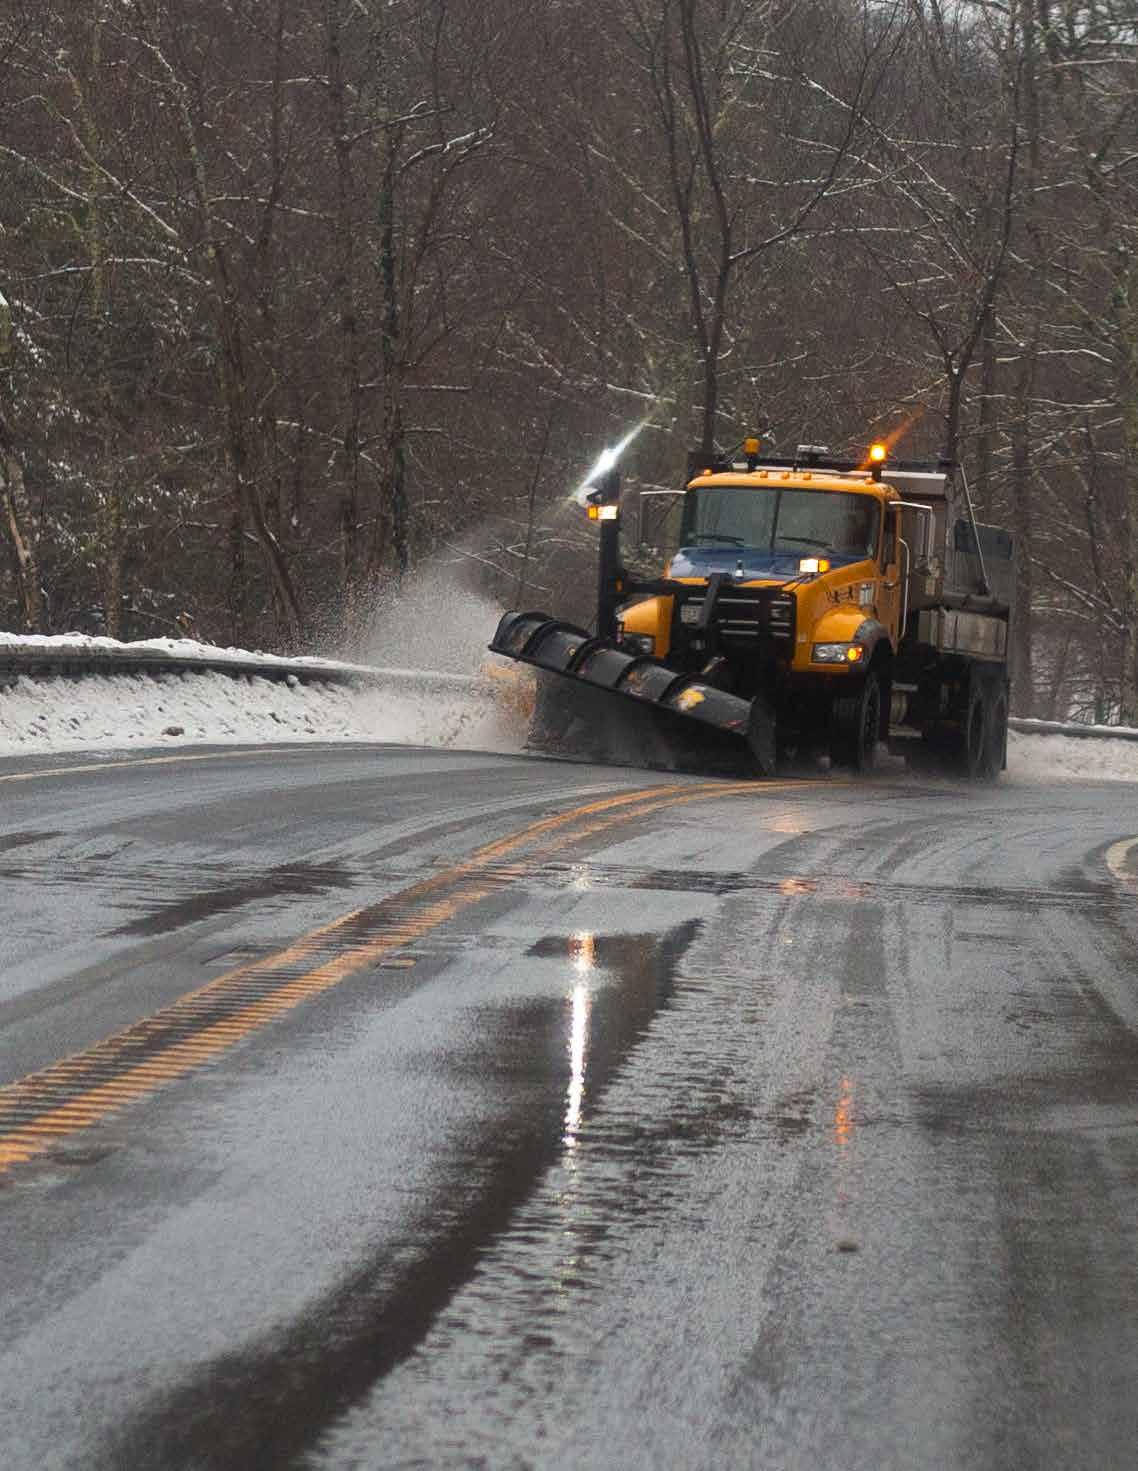
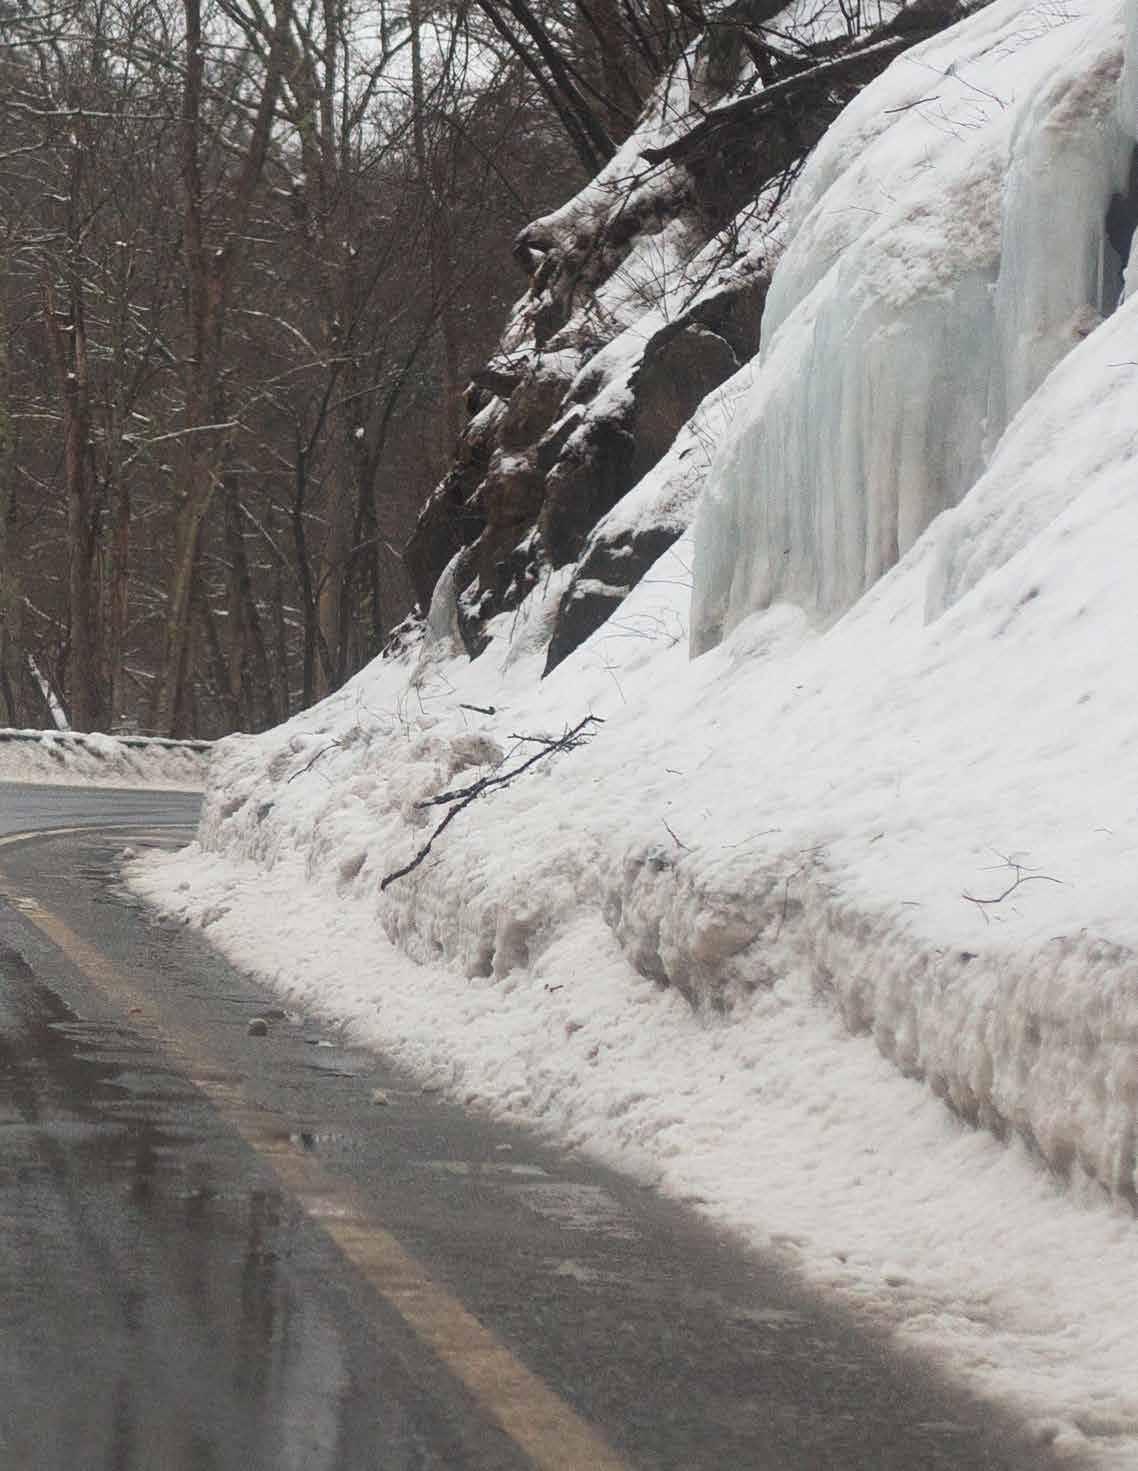
A combination of wind power from mountain peaks and hydropower from river valleys, snowmobile trails through the hills, and State Route 2 connecting the Hudson River Valley to the Connecticut River Valley make Florida's infrastructure a local and regional asset.
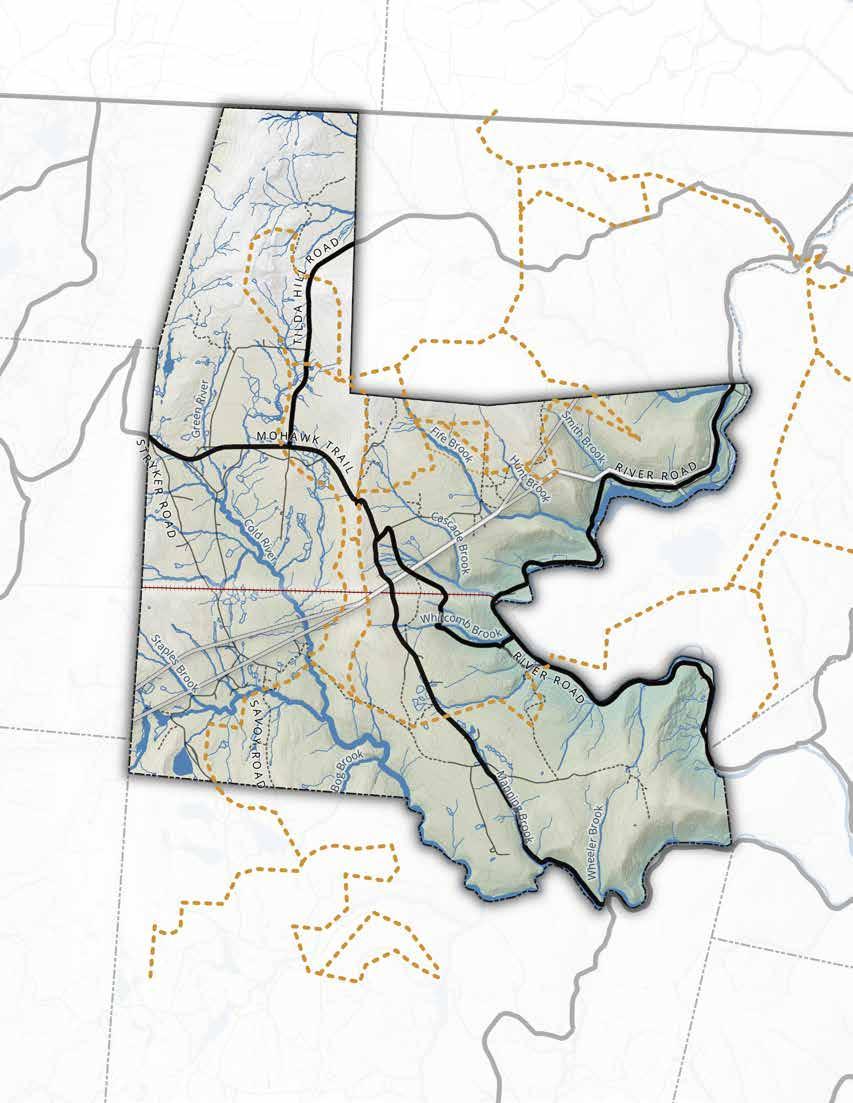
Paved and unpaved roads, and unpaved trails, through Florida allow local and regional transit. State Route 2, running diagonally through Florida, connects the Berkshires to eastern Massachusetts. Wind turbines sit upon the hilltops of the northwest forests. Structures, mostly single family houses and accessory buildings, are dispersed in patches throughout the uplands, wetlands, and valley with the main hub of town resources along Route 2. Florida's infrastructure, and the benefits and concerns of a lack of municipal water, sewer, and stormwater management throughout the town are discussed in the following pages.
State Route 2 is Florida’s main thoroughfare and is a primary route for goods transported into and out of New England. Tilda Hill Road connects Florida to Monroe and is designated in the Monroe MVP as their evacuation route in an emergency. Portions are unpaved (FRCOG). Tilda Hill Road transitions to Main Road upon entering Monroe. Main Road is connected to the River Road by Kingsley Hill Road, which (as of March 2025) is closed to the public and has remained under construction since 2015 (Schofield). Whitcomb Hill Road is the main entry and exit for the Deerfield River Valley. River Road runs the length of the Deerfield River through Florida and crosses the border into Vermont. North Florida Road is a secondary entry and exit point for Florida, used for local transit and in the event of road closure on Route 2.
A number of Florida residents use snowmobiles as a secondary or primary form of transportation during winter months, with over 50 miles of trails (primarily on private land and accessed by permission) connecting five surrounding towns and into Vermont. On trails within state property, four inches of packed snow is required before use of snowmobiles is allowed. These trails are maintained by 150 volunteers with the Florida Mountaineers Snowmobile Club servicing Florida and Monroe trails (SledMass). Hikers, skiers, and equestrians also make use of these trails within DCR state property. The Florida Mountaineers are connected to town radio communications and are available in the event of an emergency for search and rescue in coordination with emergency responders in winter conditions when areas are made inaccessible by emergency vehicles. While the volunteers work to ensure safe passage in varying weather conditions, some existing challenges include illegal use of trails causing trail closure and subsequent re-routing. Re-routing of a trail requires new permissions from property owners and takes time. According to a Florida Mountaineers volunteer, an aging demographic of snowmobilers in the state is limiting capacity to maintain trails.
On average, 90% of precipitation that touches hard surfaces runs off, with upper bounds of 96%. Hard surface runoff increases water temperatures and has added pollutants that can shock aquatic life and contaminate the soil and neighboring water bodies.
40-60% of preciptiation that touches lawn surfaces runs off and carries with it chemicals used in lawn maintenance.
5-25% of precipitation that touches a forest runs off. Thus, 75-95% is absorbed into the forest system, decreasing floods, and fire risk, and increasing groundwater storage.
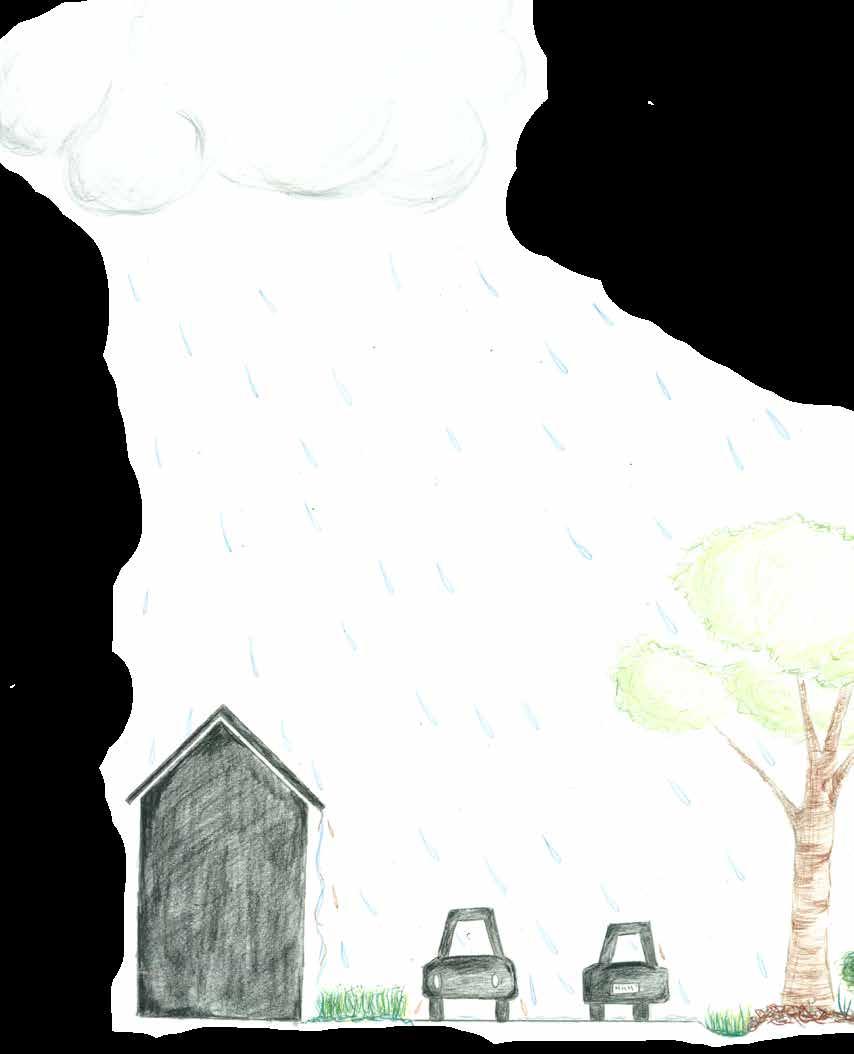
(source: Civil Web)

Stormwater is rain or melted snow runoff from streets, lawns, and other surfaces. It is the number one source of water pollution in the United States as it gathers debris, bacteria, and chemicals as it makes its way to waterbodies (Chelmsford, MA). Poorly managed stormwater can result in erosion and flooding. It is more economical to prevent pollution of water systems and erosion of soils than to respond retroactively to pollutants. Proper stormwater management can minimize interaction with chemicals and debris, filter runoff, and transform stormwater into an asset that sustains vegetation and replenishes local groundwater supply (Chelmsford, MA).
Florida’s land cover includes 3% hard surface, 5% lawn and low grasses, 89% forests, and 3% water and wetlands. As described above, the forest ecosystems of Florida are a natural sponge mitigating the effects of floods and other extreme weather events (e.g., ice storms and high wind). Currently, hard surface runoff throughout Florida flows to roadside swales and storm drains and then into nearby waterways untreated. Site observation revealed that some of Florida's roadside swales and storm drains lead directly into wetlands, causing the build-up of chemicals, salt, and sediment. Some wells along Route 2 are reported to be contaminated by salt, likely from stormwater washing off salted roads.
1 QT OF OIL CAN POLLUTE 250,000 GALLONS OF DRINKING WATER (Susquehanna)


Streams and rivers flow through Florida's hills and valleys. To manage the flow of vehicles across these waters, 141 culverts (including 42 on Route 2 that are managed by the state) and seven bridges have been built throughout Florida.
Culverts function as pinch points between natural systems and manmade structures. As rain and freeze events increase in size and frequency, along with increased sediment flow in the event of floods and fires, culvert failure increases (Steenbergen and Keller). An undersized culvert experiencing even an average rain event can fail. The repercussions of undersized culverts and culvert failures include damaged infrastructure (e.g., roads and neighboring houses or businesses), blocked vehicle passage in the event of an emergency, stream bank erosion, decreased water quality, and blocked passage for aquatic organisms. Even oversized culverts may cause problems if improperly installed. They may redirect natural stream flows, increasing erosion alongside stream banks and culvert edges (USFS). Road drainage changes over time due to erosion and sediment may lead to more or less water directed into a water body and through culverts (e.g., road drainage shifting from flowing to two culverts to one due to erosion shifting the road's grading). In this case, assessing and regrading an eroded road may decrease water volumes on individual culverts by dispersing runoff.
Bridges are typically designed for vehicle traffic 20 feet above an obstacle, cause more environmental
disturbance in the process of construction, and have higher costs than culverts (HPD, A). Culverts have various prefabricated designs and require more frequent assessment to prevent blockages and maintenance due to materials (VCG). Compared to pipe culverts, box and arch culverts improve water flow and movement of organisms under roads and paths while handling small vehicle traffic and environmental weathering (HPD, B). As the state maintains Route 2, Florida's is only responsible for the smaller watersheds that intersect local roads throughout town. These waterways will benefit from increased flow capacity and minimal disturbance, while the communities that depend on culverts along these waterways for safe access and egress will benefit from materials that can withstand the increased weathering caused by climate change.
Organisms in Massachusetts that require up- and downstream water movement include eastern brook trout, shad, herring, Atlantic salmon, American eel, mussels, turtles, and a variety of invertebrates and mammals. Runoff from roads reduces the quality of waterbodies by increasing water temperatures, and polluting waters with various chemicals including oils that decrease water oxygen (TNC, A). Roadside plants and water harvesting designs that slow, spread, and sink water assist in filtering contaminants from hard surface runoff before it enters water bodies. Improperly designed or blocked culverts will decrease oxygen levels, creating unhealthy conditions for numerous organisms. When properly designed, these culverts can act as wildlife corridors for large mammals, subsequently improving the safe passage of vehicles by decreasing vehicle and wildlife interactions (TNC, B).
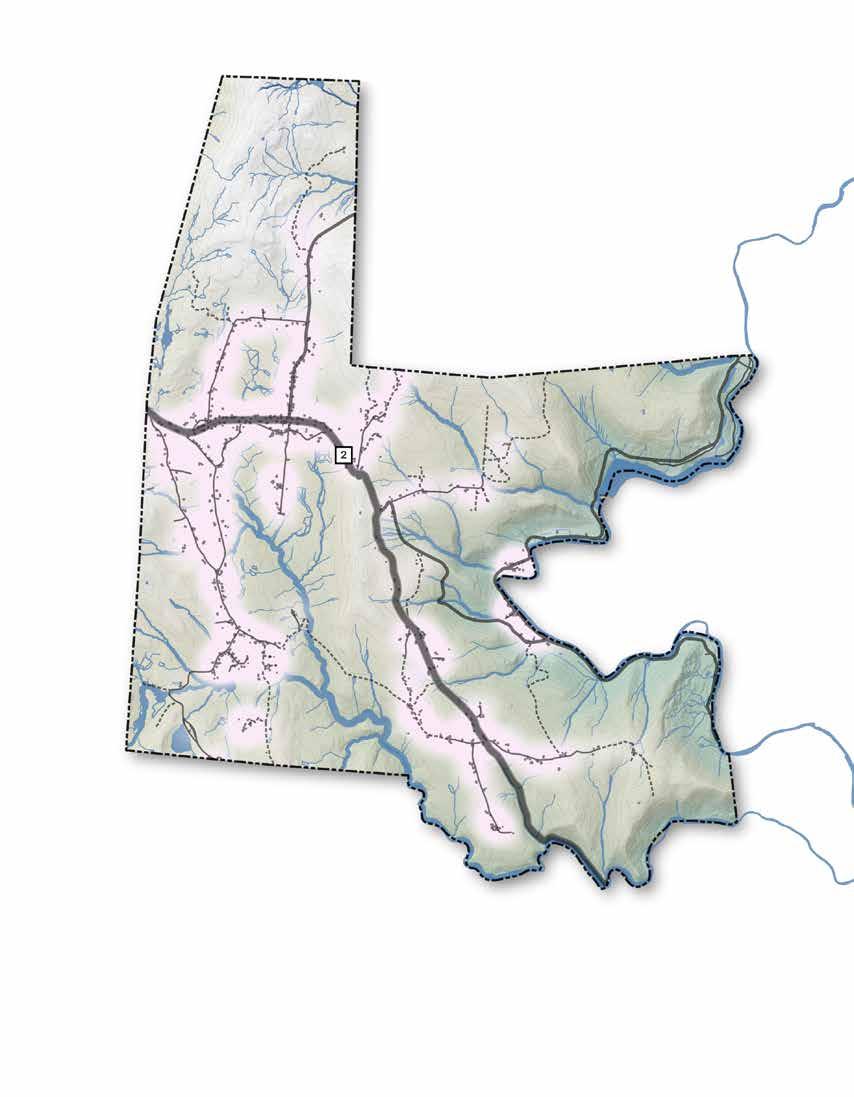

There are 813 structures (including accessory units) in Florida that are dispersed in a patchwork along Route 2, flatter upland areas, and along the Deerfield River Valley. The 2022 assessor data shows that structures throughout Florida vary in year built from 1800 to 2021 and are primarily residential (355) with 20 industrial, commercial, mixed-use, and nonresidential structures for a total of 375 taxed structures.
All housing and town facilities are on wells and septic as there is no municipal water or sewer within the town of Florida. According to the Core Team, the use of salt on roads has led to contamination of wells throughout the town, with those along Route 2 most heavily contaminated. The salinization levels of the groundwater supply have left multiple wells nonpotable. Facilities such as the Town Hall, Senior Center, and Fire Station, all critical to emergency response, do not have potable drinking water and rely on bottled water or filtration systems. The Senior Center and Town Hall water supply may also be contaminated due to leaching from the nearby unlined landfill that was capped in 2000 (MassDEP). In the event of an emergency, this would limit the
capacity of these facilities to act as shelters for an extended period. These waters also have higher than proposed limits of pre- and polyfluoroalkyl substances (PFAS). PFAS are chemicals that bioaccumulate in the environment and exposure to PFAS is linked to numerous negative human health effects (EWG).
Droughts in Massachusetts have become a growing concern in recent years, with Florida as no exception. At a level 2 drought as of March 2025, Florida, along with most of the state, has been in a drought since August of 2024 with a 8 to 13” annual precipitation deficit (Mass.gov, A). Droughts result in decreased groundwater supply, requiring restrictions on water usage as determined by the state. A prolonged drought can result in a dry well, sediment in the well, and non-potable water due to higher concentrations of minerals and contaminants (Mass.gov, A). When a well goes dry, it can require deepening the well or establishing on site storage to be filled by an outside supplier.
A lack of municipal water supply and sewer may deter development in Florida, subsequently assisting in preserving ecosystems, but limiting the capacity for growth if desired.
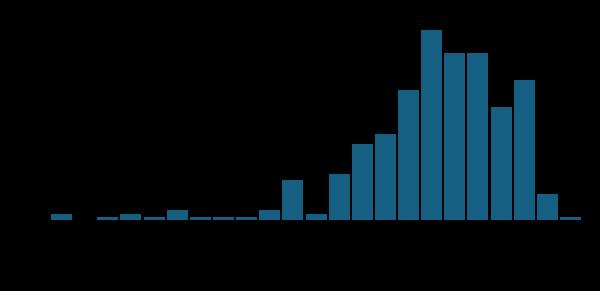
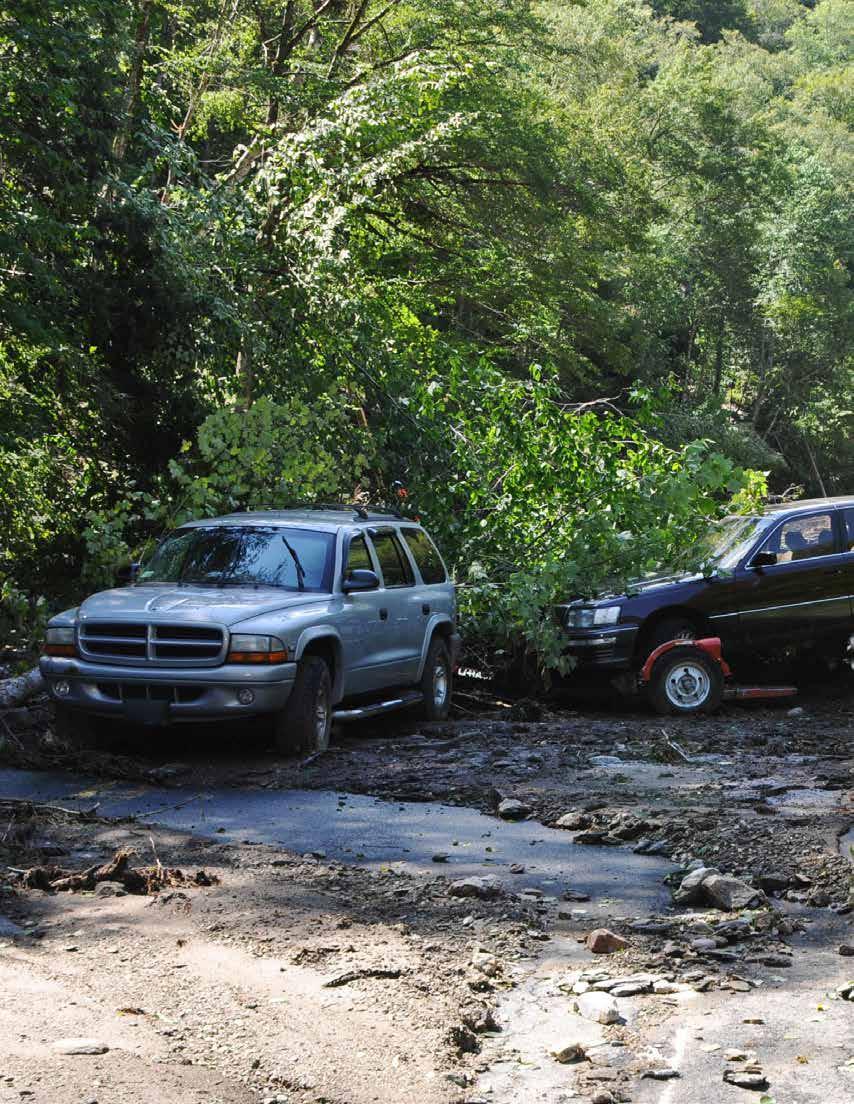

In the event of flooding, both primary and secondary road routes throughout Florida may be inundated, culverts may fail, and structures may experience flooding, resulting in demolition or decreased indoor air quality. The residual impact of floods on structures is found in mold and microbial growth that create poor indoor air quality, resulting in respiratory health impacts. These respiratory concerns disproportionality impact vulnerable populations such as children, the elderly, lower-income households, or those with pre-existing respiratory concerns (Pakdehi, et al.). Major flood events can cause the loss of power infrastructure (see Deerfield River Valley). Soil erosion, flowing debris, mudslides, and rockslides create secondary flooding threats (CISA).
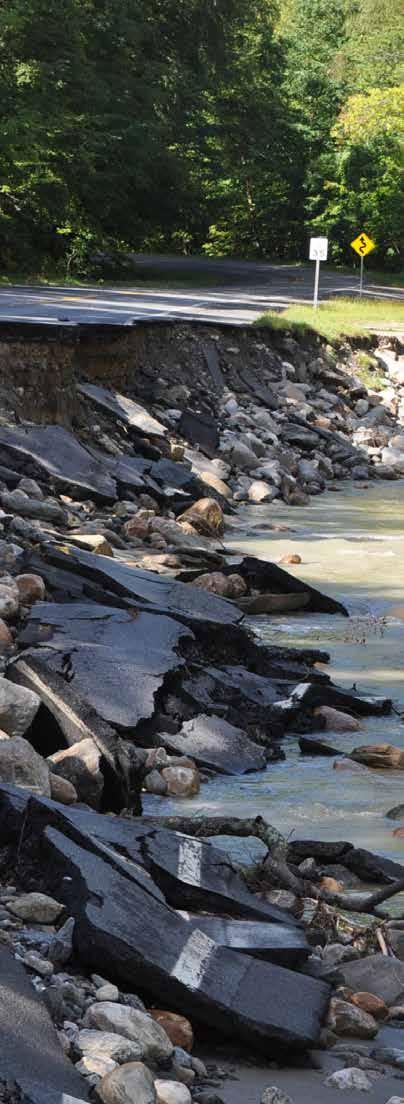

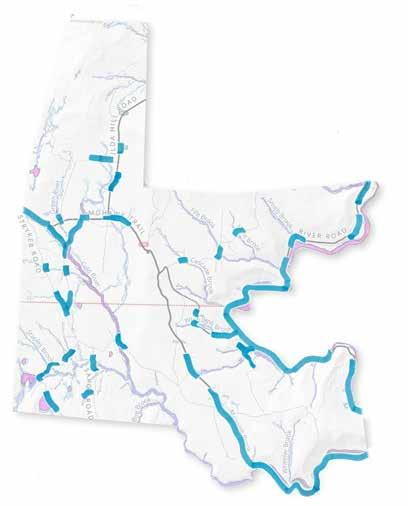
6" of rapid water can carry away a human

12" of rapid water can carry away a car
18-24" of rapid water can carry away large vehicles
"TURN AROUND DON'T DROWN" (source: NOAA, C)
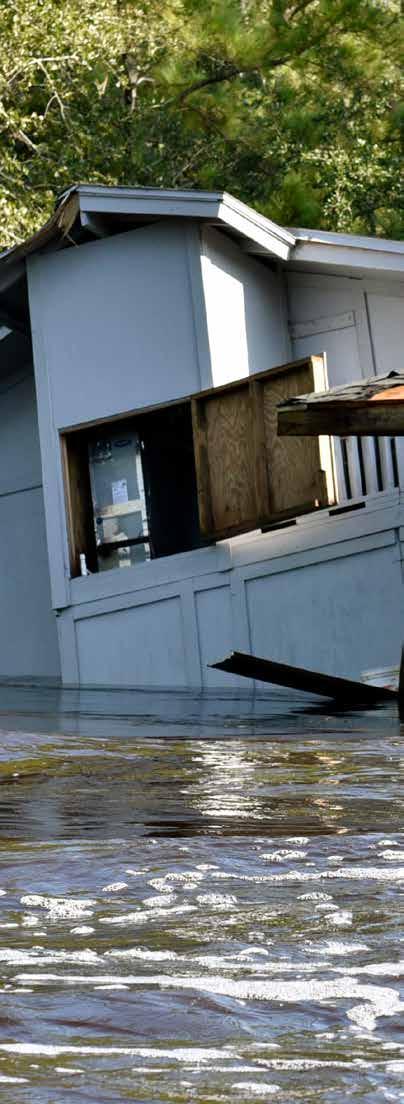
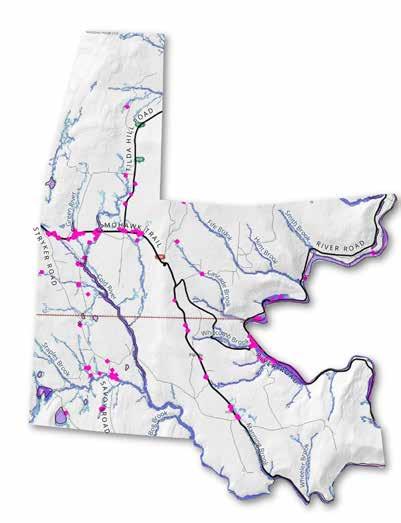
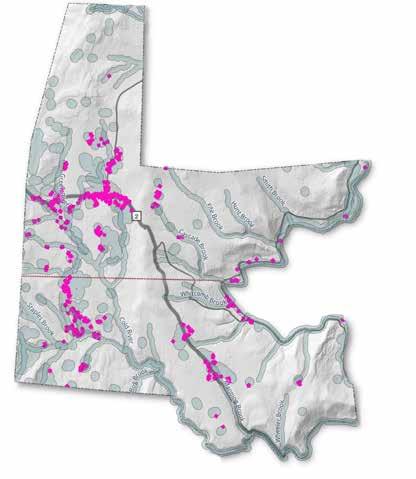
STRUCTURES IN STREAM & WETLAND BUFFERS
There are 122 structures within FEMA (100-year) Floodplains or First Street Floodplains, representing 15% of structures in Florida. Four of these are within wetlands, making them susceptible to regular seasonal rains. Six structures are within the FEMA (100-year) Floodplain projection, making them at risk to what have become 10 to 25 year rain events. There are 112 structures within the First Street flood projection maps. Collectively, these structures are at the greatest risk of disturbance in the event of heavy rain events or increased annual rainfall.
As flood events increase in frequency, so will the value of wetlands and stream riparian zones as they mitigate flood waters and help protect infrastructure from flooding. Regulated buffers exist to protect wetlands. In Florida, 61% of buildings are within these buffers. While wetlands are protected by the MA Wetlands Protection Act (WPA) and under the jurisdiction of the Conservation Commission, development that occurred prior to the WPA had limited restrictions (MACC).
In Florida, these wetlands alongside the forest system filter the groundwater that feeds into wells. Compared to undeveloped wetland buffers, developed ones have less filtration capacity, increased pollutants, and decreased plant diversity, which destabilizes the flood mitigation capacity of the wetlands (EPA). Under the WPA, permits are required for activities such as construction, grading, and land clearing, but exemptions and discretionary permits are allowed for maintenance of properties grandfathered in, and emergency projects (MACC). As Florida's primary hazard potential is flooding, and residents are solely reliant on wells for local drinking water supply, even discretionary permits and exemptions should be analyzed for the long term implications on the ecoystyems, water supply, and flood mitigation. Further protection of wetlands from development will maintain their water-holding and flood mitigation capabilities, mitigating the impacts of future flood events on existing structures. 0 1 2 MILES Floodplains Streams & Wetlands Buffer Structures
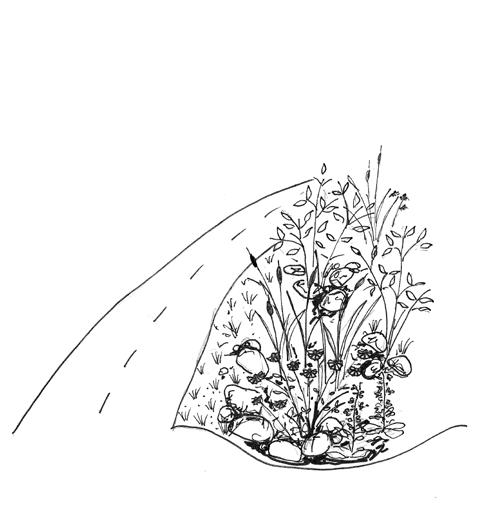
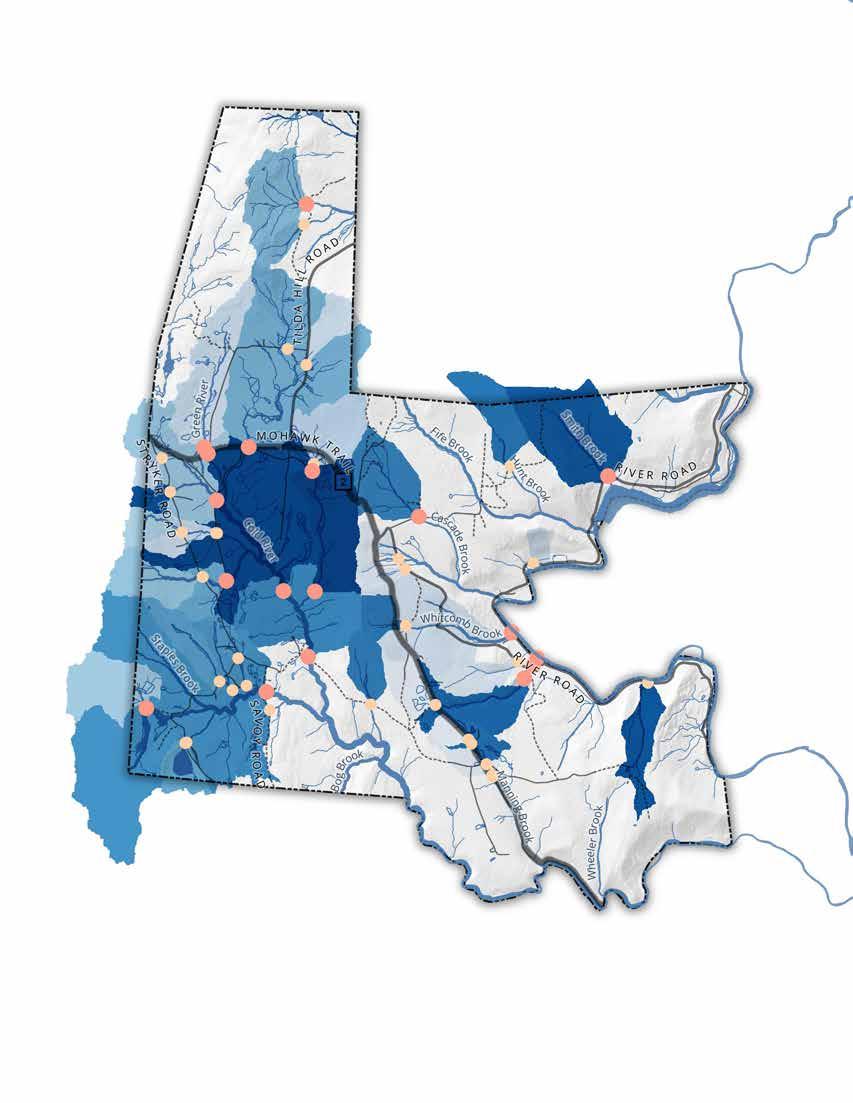
HIGH- & SECONDARY-PRIORITY CULVERTS & THEIR WATERSHEDS
(Shades of Blue) Culvert Watersheds
High-Priority Culverts
Secondary-Priority Culverts
The culvert map identifies 25 high-priority culverts that, based on a flow accumulation analysis connecting streams to the culverts they flow through, likely experience the highest water flow rate. If blocked due to debris or failure, these culverts would have the highest accumulation of water and subsequent flooding impact. The 36 secondary-priority culverts likely experience the second-highest accumulation of water flow. If impaired or undersized, high-priority and secondary-priority culverts are at the highest risk of failure, which would cause extensive damage to road infrastructure, waterbodies, and habitat. The community has identified past culvert failures and existing concerns with high priority given to Whitcomb Hill Road. Their experience aligns with the high-priority and secondary-priority culverts identified in the flow accumulation analysis. In 2011, during Hurricane Irene, Whitcomb Hill Road was flooded while emergency responders evacuated the residents in the valley.
The 42 culverts along Route 2 are managed by the state and in the event of a failure the Department of Transportation is the first point of contact. Preemptive discussions with the state should address highpriority culverts meeting updated standards for flow accumulation capacity and organism passage.
Culverts along the Cold River and Whitcomb Brook have the largest watersheds impacting the highest concentrations of structures. Construction within these watersheds, and subsequent ground cover loss, would increase groundwater accumulation and flow, putting further strain on existing culverts.
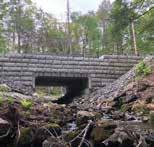
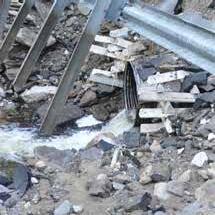
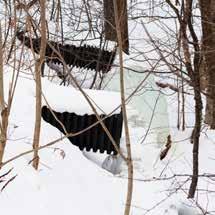
MVP ACTION GRANT: ASHFIELD, MA
AWARD: $548,000
An MVP Action Grant awarded to the town of Ashfield, MA in 2022 focused on Road Stream Crossing Ecological Improvements. The project included "replacing a deteriorated, perched and severely undersized 5-foot diameter CMP culvert with a 19- foot span by 4-foot rise precast concrete culvert. This project greatly increased flood capacity, climate resilience, and aquatic/ terrestrial wildlife passage" (MassGov).
PHOTO CREDIT: MASS MVP 2.0
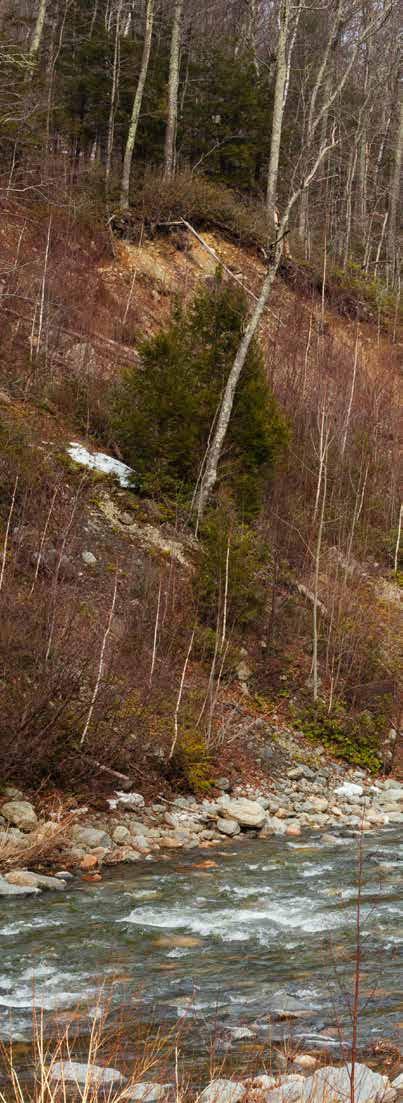
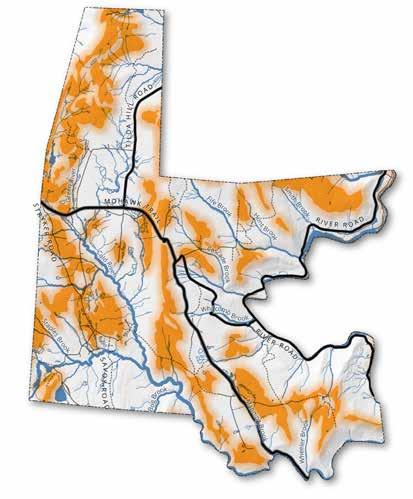
HIGH EROSION POTENTIAL SOILS
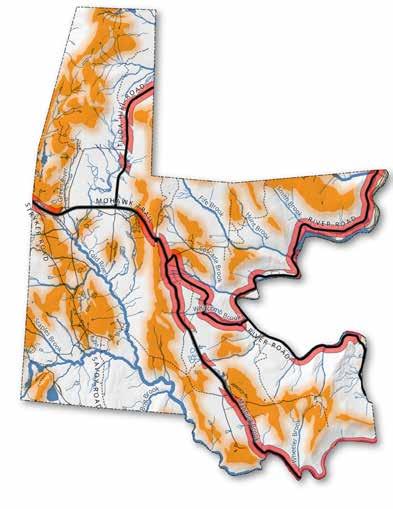
Erosion along roadways may contribute to the slow degradation of road infrastructure and to swift degradation in the event of heavy rains and landslides. Erosion due to species loss and subsequent heavy rains or deforestation uphill of infrastructure can cause sediment accumulation on roadways and surrounding structures. The Core Team and community members shared that Florida has experienced landslides and falling rocks where eroding soils overlap steep slopes along Route 2. At this time, there are minimal preventative measures, such as netting, to protect drivers from falling rocks.
Soils of high erosion potential were identified using the K Factor of Soils within the NRCS SSURGO-certified soils data for Massachusetts. A soil's K Factor is the susceptibility of its soil particles to detachment and movement by water. The SSURGO K Factor, Whole Soil data is adjusted for the effect of rock fragments in the soil as this can create a biased increase in the soils K Factor precentage. It is particularly important to adjust for rock fragments in areas of high elevation and steep slopes, such as the terrain of Florida (Yang). Areas where high erosion potential soils coincide with steep slopes ( > 9%) along roadsides indicate potential washout locations in extreme weather conditions or slow degradation from seasonal wind, water, and ice. Currently, land cover alongside Florida’s major roads is typically low non-native grasses, rocks, or forest edge. Younger trees can be found along rural roads within three to five feet of the road with the area closest to the road as uncovered soil or low growing grasses. Vegetation with deep root structures and adaptability to drought and flood conditions along roadsides help prevent erosion, protecting Florida's roads, while slowing and drawing rainwater into the soil, increasing groundwater supplies. The circled areas identify where high erosion, steep slopes, and community experience jointly identify concerns. In the event of a disaster, the three highlighted points are pinch points for the town that include their primary access and egress along Route 2 and Whitcomb Hill into and out of the valley. This could result in individuals trapped in the valley, or the route to the nearest medical facility in North Adams changing from a 12 to 15 minute drive to a 40 to 45 minute drive increasing the vulnerability of community members. The two western circles align closesly with areas The Nature Conservancy's identified as critical wildlife corridors (see Environmetal section).
High Erosion Potential
Steep Slopes within 500' Roadside Buffer
Paved Roads
Unpaved Roads 0 1 2 MILES
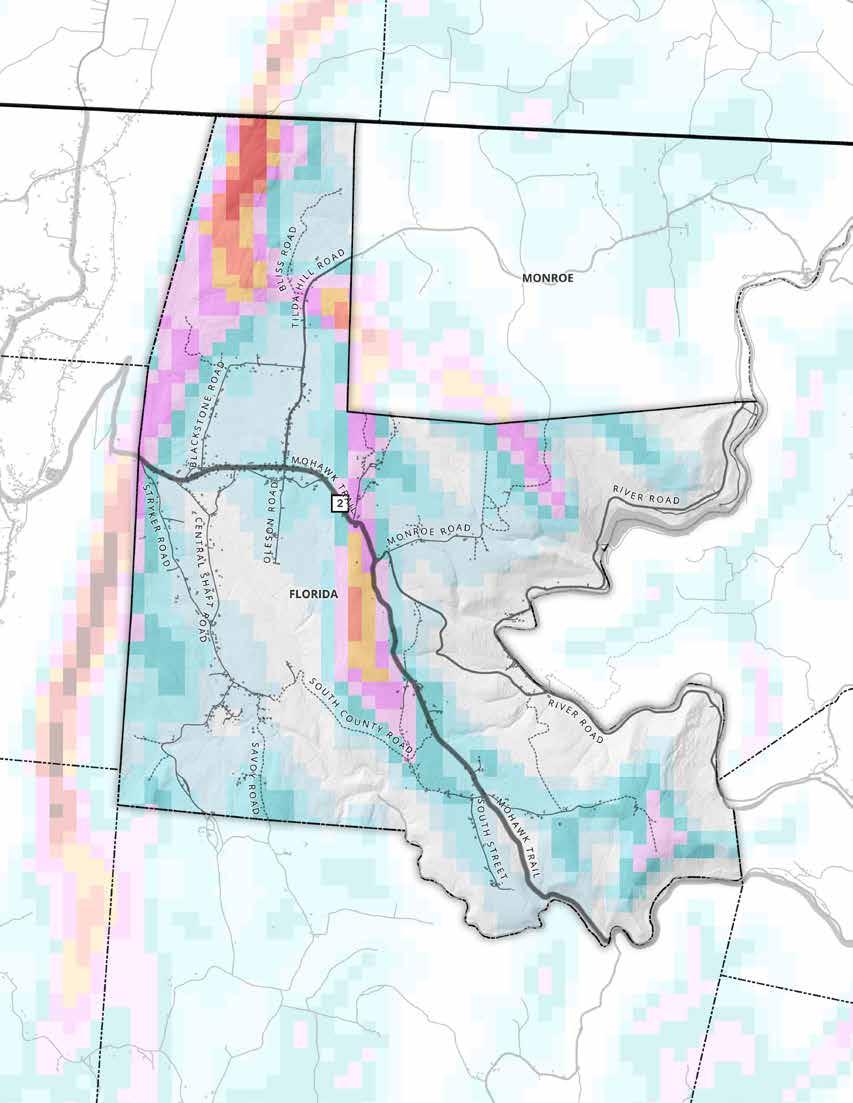
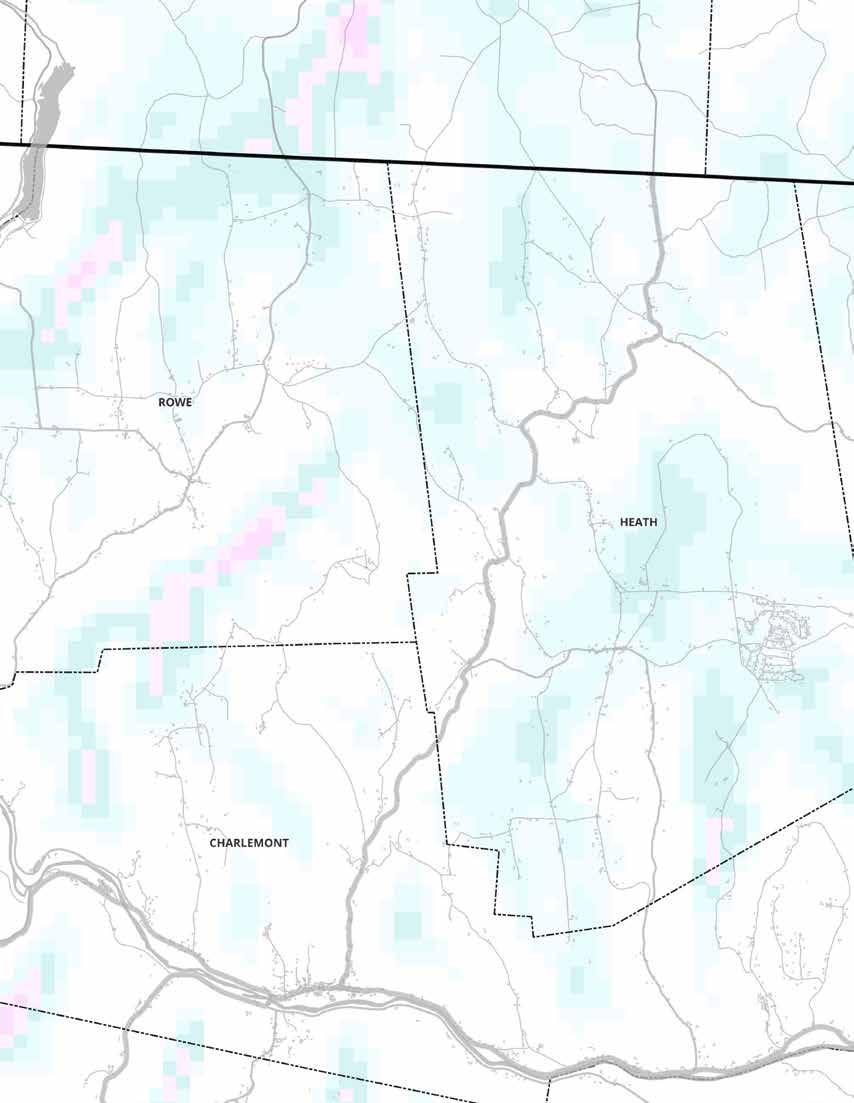
Florida experiences an annual average of 66 inches of snow and 155 days of nighttime temperatures below freezing, making Florida one of the snowiest and coldest places in Massachusetts (Best Places). Heavy snow and ice events lead to power outages due to downed power lines and trees, falling ice along steep slopes on Route 2, and extensive road maintenance. The abundant and repetitive freeze and thaw events have led to increased erosion, causing falling rock, landslides, eroded roadsides, and potholes. The Highway Department maintains the roads, but community members have expressed a decrease in maintenance of side roads or roads that are more challenging to access in icy conditions, such as Whitcomb Hill, potentially resulting from limited staff capacity. The extensive amount of salt used to maintain Route 2 has led to salination of waterways, soils, and groundwater supply, rendering multiple wells oversalinated (dangerous for those with salt limitation diets) and a few unpotable according to the Core Team. This salt is also corrosive to roads and vehicles and is toxic to wildlife. While a warming climate
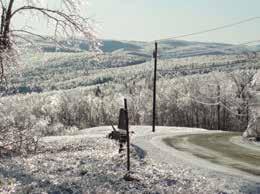
may entail a shortened winter season, winter storms have intensified and have become increasingly unpredictable since the 1950s (Mass.gov). In the event of power loss, emergency shelters are established at the school, Town Hall Garage, and Senior Center. At this time, there is no emergency shelter located in the valley (Coveragemap). In the event of power loss, vulnerable communities should be prioritized for connecting with temporary alternative dwellings or backup generators.
The Core Team and community members shared that prior extreme wind events in Florida have led to downed trees, power lines, and cell towers, blocked roads, and caused structural damage to homes and town facilities. In the event of downed trees along the River Road, residents have experienced being stranded due to a lack of alternative exit routes combined with a lack of cell service in the valley. The effects of increased tree loss due to a shifting climate, pests, and pathogens could further increase damage from high-intensity wind events in Florida.
The second turnpike in Massachusetts to operate included present-day Whitcomb Hill Road and was active from 17971833. This section of road was used as a connector between Boston and Albany (Catskill Archive).
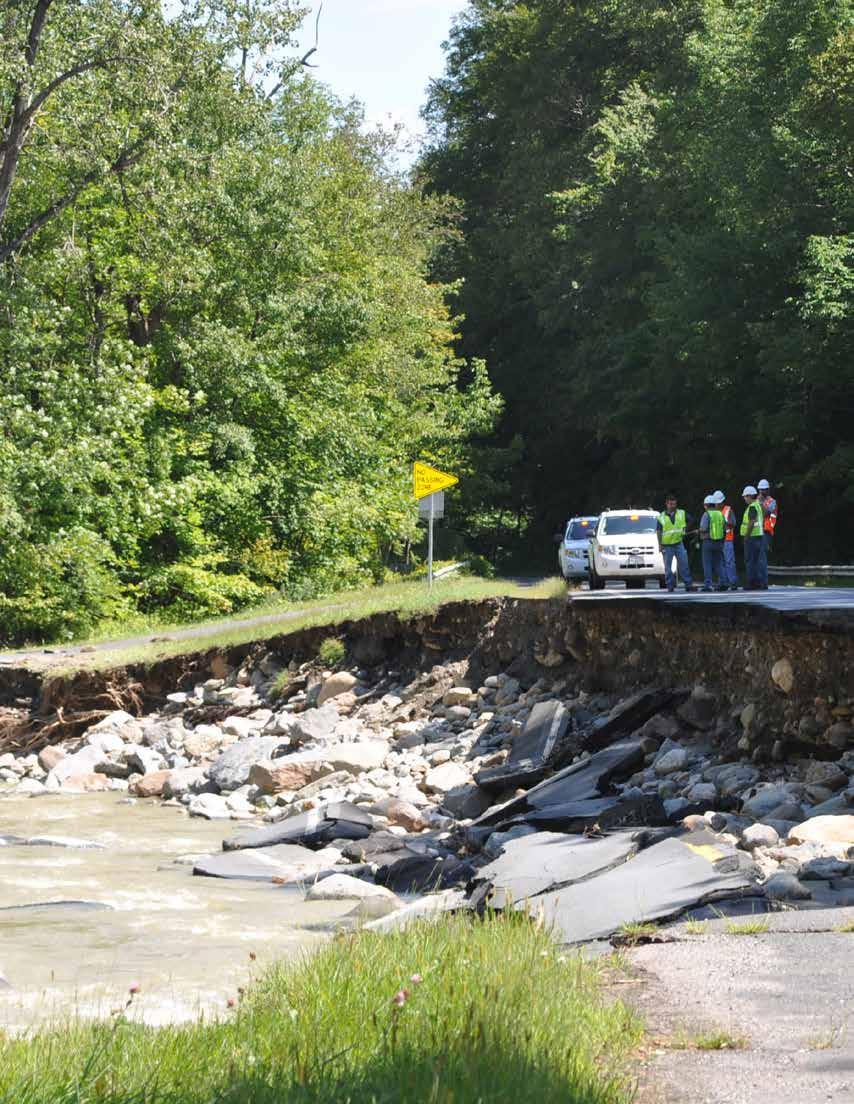

One community member reported that her family was living on Whitcomb Hill Road when it flooded during Hurricane Irene in August of 2011. The valley residents were planning for evacuation, and Whitcomb Hill Road—the main road out of the valley—was inundated. The roads were impassable by vehicles, so her niece was handed over the flooded section of the road with the support of community members, who were working in coordination with the volunteer Fire Department to evacuate residents from the valley. Heavy rains and soils at maximum water-holding capacity led to a false-alarm dam-breach evacuation. Multiple culvert failures, landslides, and rockslides led to $23 million in damages to Route 2 and $1 million in damages to local roads. Many local roads were closed for weeks and some for months, while Route 2 was closed for six months disrupting regional traffic and local commutes.
Another community member reported being trapped in their home for one and a half weeks due to the number of surrounding road closures. In order to access an open road, they crossed a neighbor's property with a four-wheeler. The residents then drove to a nearby town to acquire further supplies, as there remained much uncertainty as to when the roads around their home would reopen.
These experiences share the implications of vulnerable infrastructure, limited municipal and household preparedness, and the value of community cohesion to meet the residents' needs when municipal and state resources are at capacity.
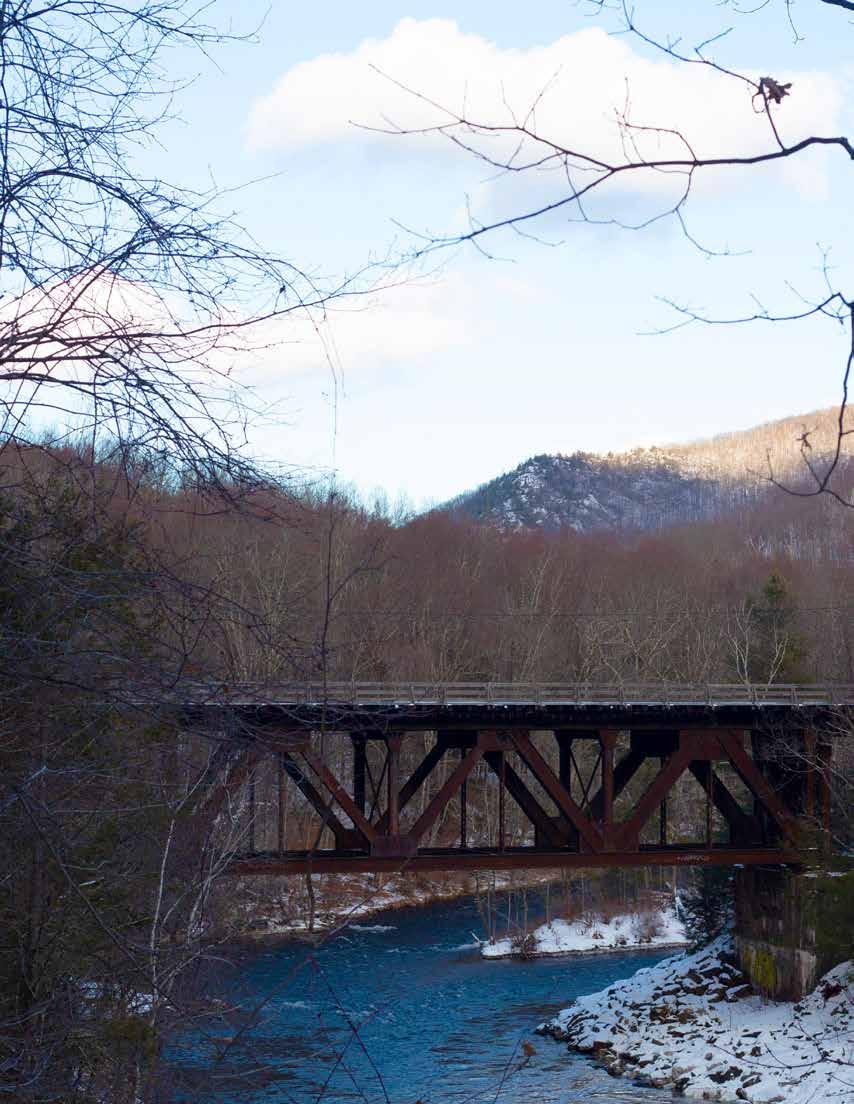

The Deerfield River Valley is located along the eastern boundary of Florida. It is characterized by a low and remote population, gorgeous rugged terrain, and exposure to various flooding and infrastructural risks.
DEERFIELD NO. 5 DAM SHERMAN DAM
FIFE DAM
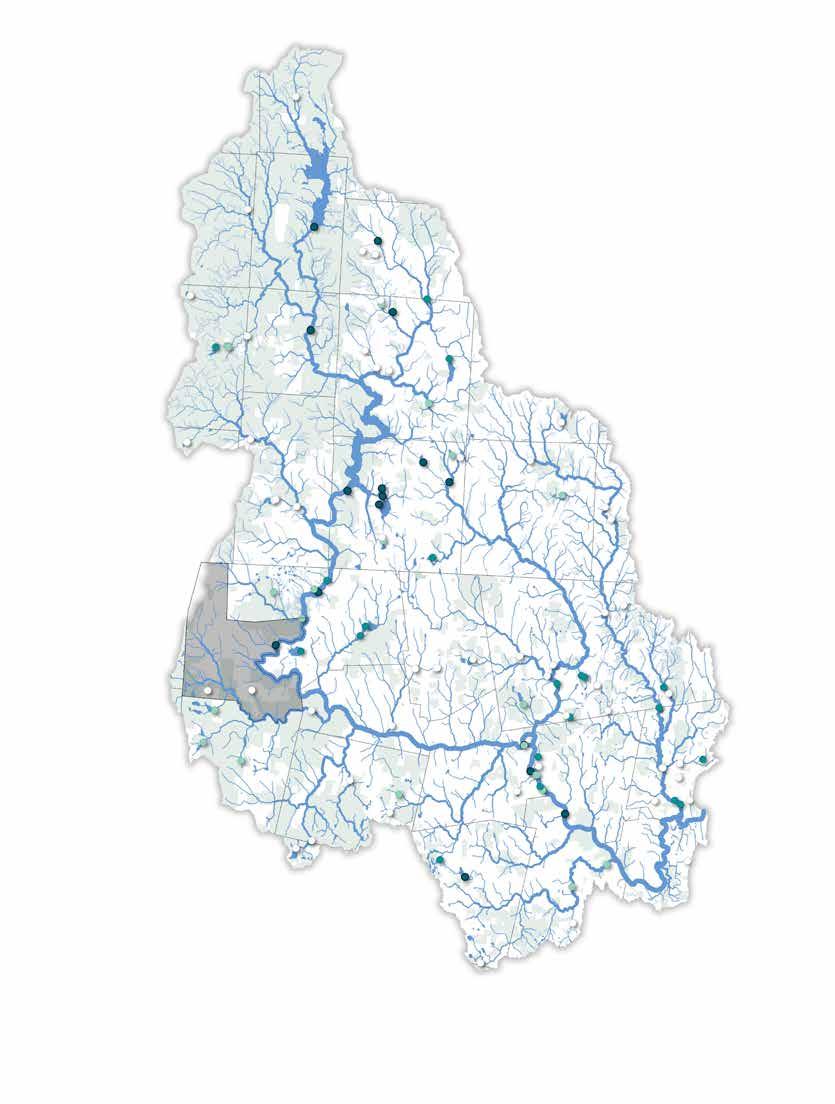
Space
High-hazard-potential
Significant-hazard-potential
Low-hazard-potential
Other
0 2 4 MILES
THE DEERFIELD RIVER & ITS WATERSHED IS HEAVILY IMPOUNDED WITH DAMS
The Deerfield River Valley makes up much of Florida’s eastern border, shared with the neighboring towns of Rowe and Charlemont to the southeast. The valley is part of the Deerfield River Watershed, which originates in southern Vermont, and drains into the Connecticut River to the southeast. There are several human-created dams upstream from the town's portion of the Deerfield River. Several are high-hazard-potential dams according to the U.S. Army Corps of Engineers. High-hazardpotential does not mean that they are structurally unsound, but in the case of failure, there would be a high cost to life and property. Starting upstream, the dams within 10 miles from Florida are as follows:
The Harriman Dam, in Windham County, Vermont, is a high-hazard-potential earthen dam built in 1923. The dam is capable of 41 megawatts of generation capacity (GR Harriman) and holds 144.7 million cubic meters of water (Wiki Harriman).
The Sherman Dam, in Rowe and Monroe, Massachusetts, is a "concrete earth" dam built in 1927. The dam is not rated as a high-hazard-potential dam. It is capable of 6 megawatts of generation capacity (GR Sherman) and holds 5,480 acre-feet of water (DOTW).
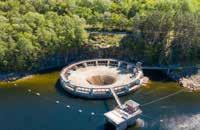
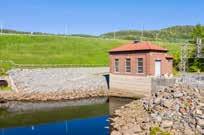
This dam, also in Rowe and Monroe, is a high-hazardpotential dam. It is capable of 14 megawatts of generation capacity (GR 5).
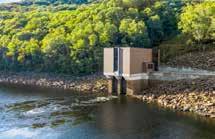
This dam, in Rowe and Florida, is a highhazard-potential dam completed in 1974. It is capable of 600 megawatts of generation capacity (Wiki Bear), and holds 1.7 billion gallons of water (Wiki List).
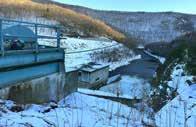
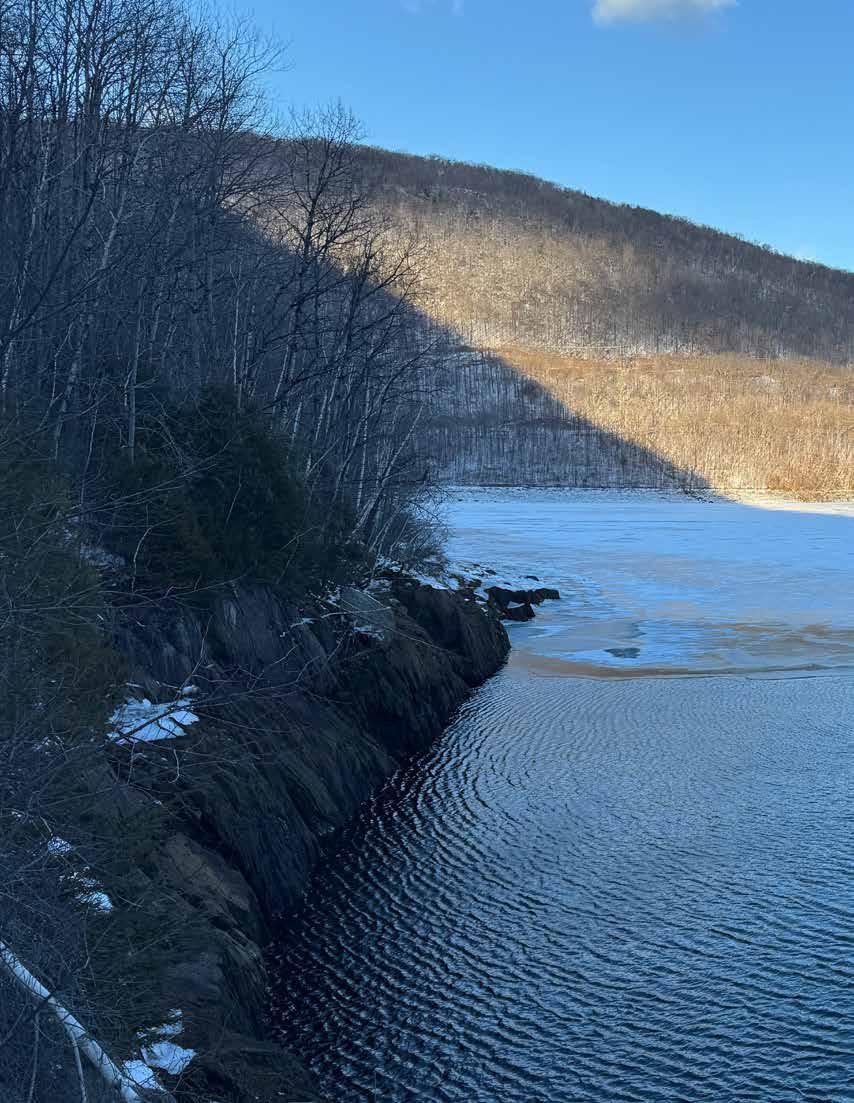
BEAR SWAMP DAM IMPOUNDMENT AREA
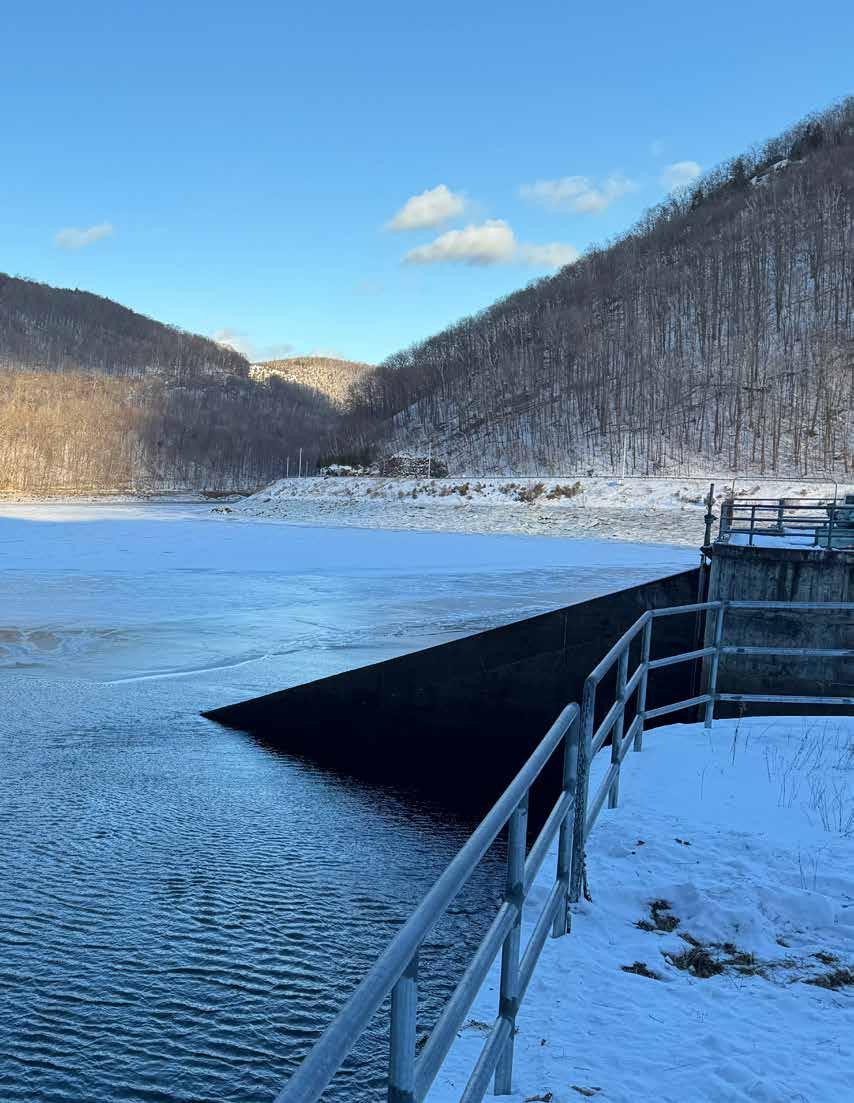

Waterways & bodies
Wetlands
Structures
Homes Railroad
EXISTING CONDITIONS IN THE VALLEY INCLUDE OTHER HUMANMADE RISKS, WHICH CO-ARISE WITH NATURAL RISKS SUCH AS EXTREME WEATHER & RAINFALL
Just next to the Sherman Dam, the Yankee Rowe Nuclear Power Plant operated from 1961 to 1991. Decommissioning of the site was completed in 2007 (Wiki Yankee), but the Department of Energy, which was contracted to begin removing waste from the site by 1998, has not removed any. Currently, spent nuclear fuel and associated waste is stored in 16 stainless steel and concrete casks, which are said to weigh approximately 200 tons each, at the former site (Yankee).
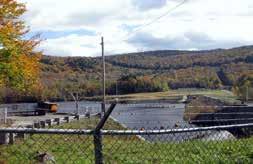
Oil trains are one of the many types of train cars that use the Hoosac Tunnel and the rail line along the Deerfield River in Florida and neighboring communities. They are trains carrying fossil fuel products, such as oil, crude oil, and ethanol, and are sometimes referred to as "bomb trains" because of their rare but deadly high profile explosions. According to Stand.earth, the only oil train rail line leading to the eastern coast of the United States north of New York City passes through the Hoosac Tunnel (Stand.earth). Train schedules and contents are not available online, but it appears it could be upward of 9 million gallons per week may come through the Hoosac Tunnel on a few trains (Berkshire Eagle).
Risks from oil trains include explosion and spillage, both of which, while rare, do happen. In one notorious explosion, in 2013 a crude oil train derailed and exploded in Lac Megantic, Quebec, leveling the town center and killing 47 people (Earth Justice). 25 million Americans live within the blast zones of oil train bearing rail lines. Spillage does happen as well. In a study period between 2013 and 2015, there were 21 oil train derailments, and almost 2 million gallons of oil were spilled (National Observer). A spill on or near the Deerfield River could
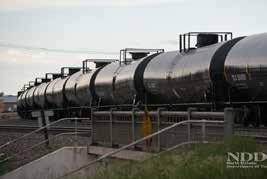
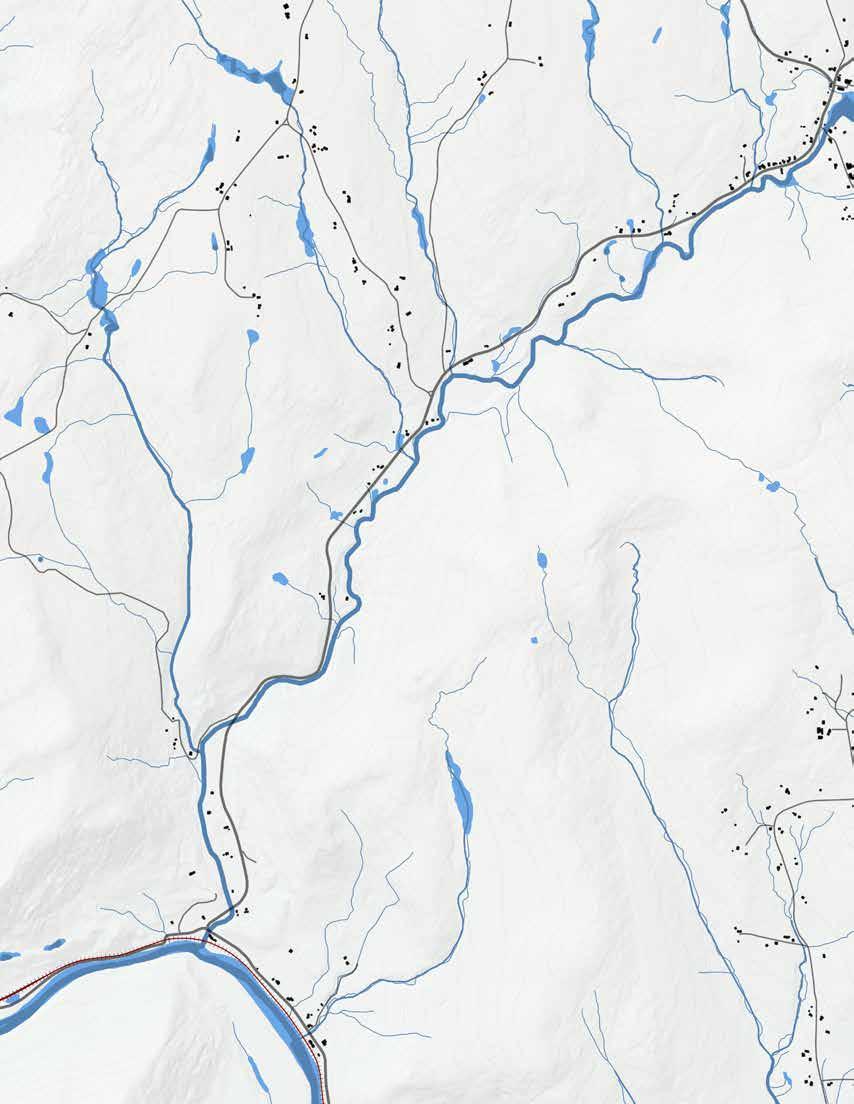
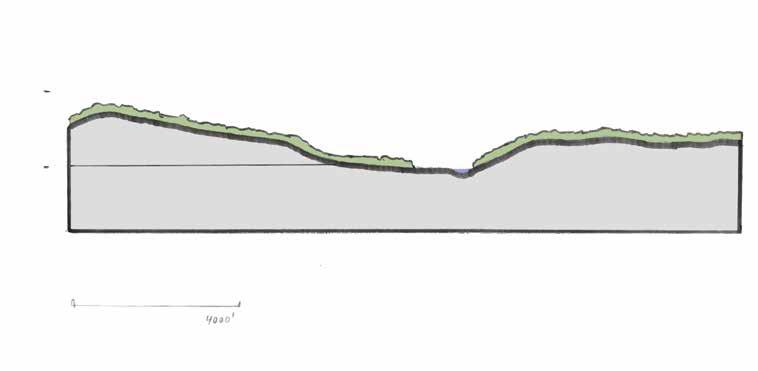
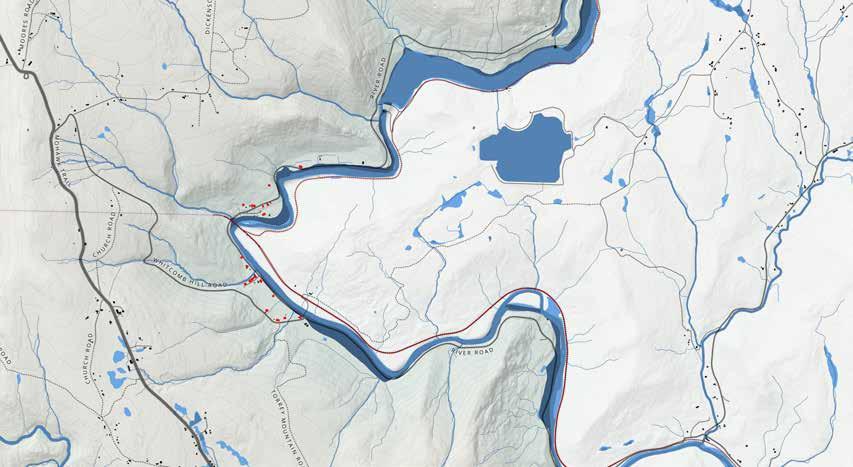
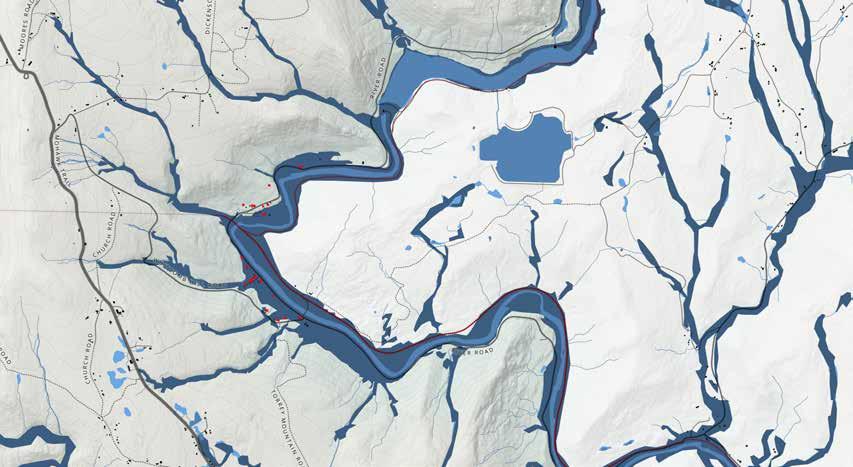
FIRST STREET FLOOD DATA
The first step in assessing flood potential in the Deerfield River Valley was to look at current flood-prone areas.
FEMA flood maps were assessed, however, the 500-year floodplains were not available. Further, the 100-year flood maps seemed to align only generally with the underlying topography, and do not appear to be a reliable assessment method. The FEMA projected flood rise appeared to be about a 30 to 40 foot rise from river elevation. To analyze the effect of this, the Conway team overlaid the FEMA flood maps over existing structures and roads. Based on this analysis, flooding as mapped by FEMA would not result in any flooding of homes and limited road flooding.
An alternative method for analyzing flood risk is using the First Street Risk Factor flood projections, which the Conway team traced into its GIS system. These projections were of a more substantial rise of about 40 to 50 feet in elevation and show inundation of approximately eleven homes and much of the road network in the valley. In addition to the Deerfield River flooding, these projections outline flood risk in the smaller streams feeding the Deerfield.
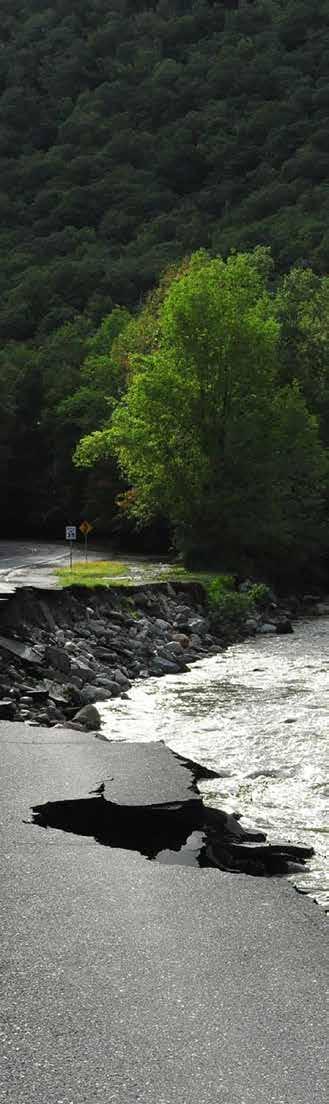
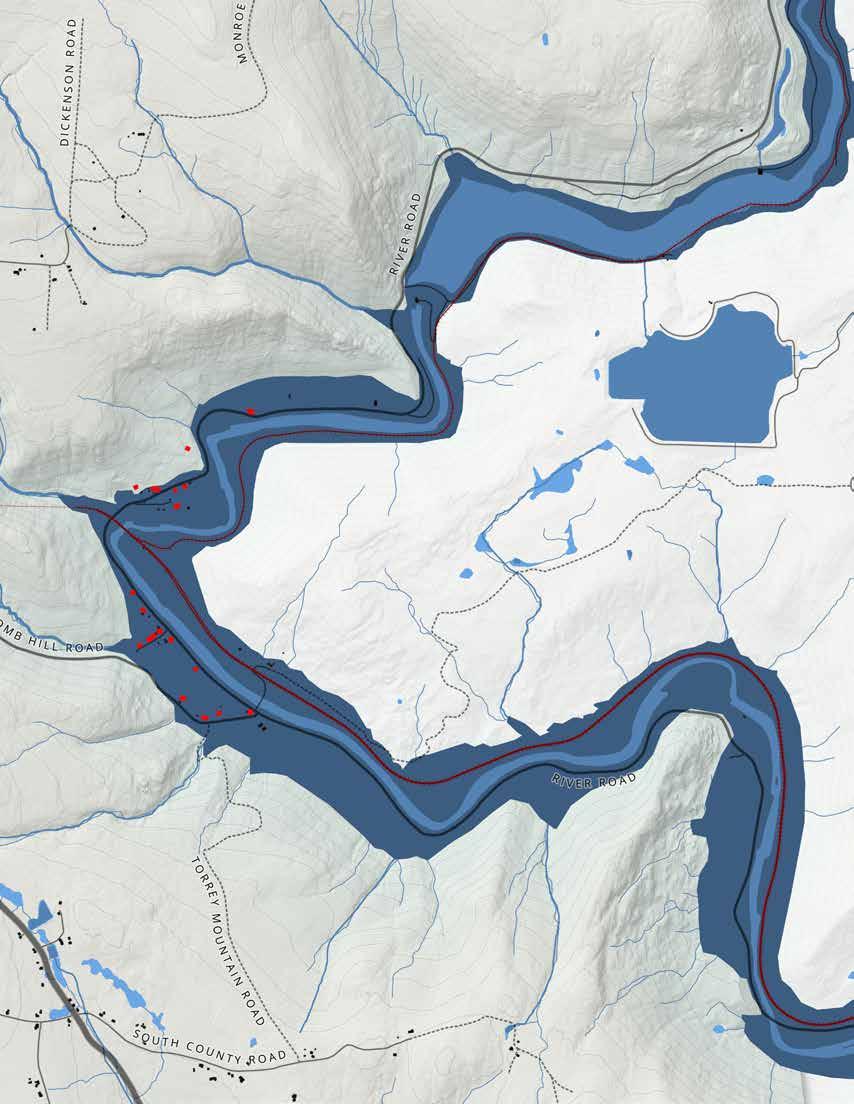
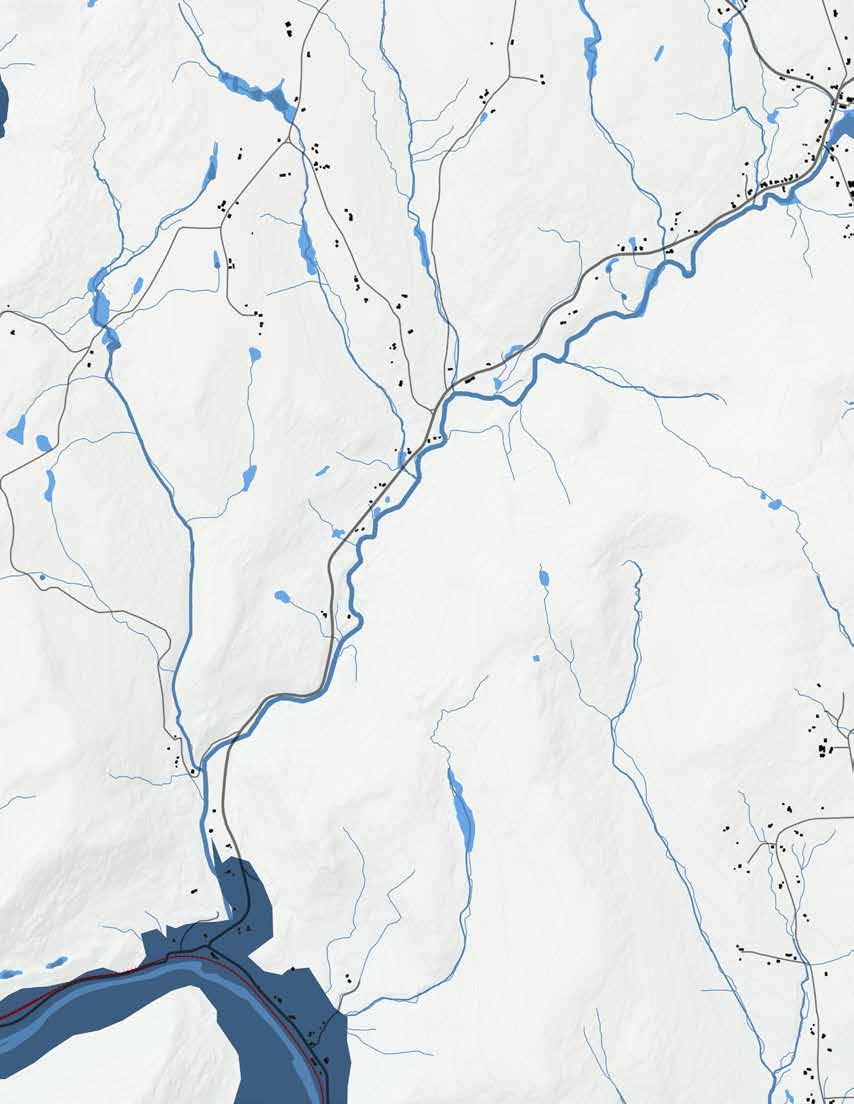
A DAM BREACH IS HIGHLY UNLIKELY, BUT IN THE EVENT OF A BREACH THE POTENTIAL LOSS OF LIFE & PROPERTY IS ENORMOUS
While it would be a low likelihood event, another risk to assess is what would happen in the unlikely event of a dam breach. To assess the possible impact of a dam breach, dam owners contract engineering firms to produce Flood Inundation Maps to assess the potential outfall of a breach. While the Conway team was not able to gain access to Inundation maps for all dams, Great River Hydro provided the inundation map for a potential Harriman Dam breach. The inundation data provided both Sunny Day Breach data and Probable Maximum Flood (PMF) data. A Sunny Day Breach refers to a hypothetical dam breach that might occur without the effect of any precipitation, whereas, as Probable Maximum Flood represents the largest possible flood that could potentially occur at a particular location (i.e., dam breach flooding plus flooding from extreme precipitation). Dam operators have some control in the case of extreme precipitation: they can drop water levels ahead of time to increase the buffering capacity of the dam and help avoid overtopping of the dam.
With the steep terrain flanking the river in this area, both these values were extremely close, so given that extreme weather would most likely precipitate a breach, the map opposite uses the PMF data.
Under a PMF breach of the Harriman Dam, the neighborhood downstream of the Bear Swamp Dam would experience an approximately 100-foot rise in water level within about 45 minutes of the dam breach. At these water levels, almost all the homes and roads in the valley would be inundated, posing a significant risk to life and property.
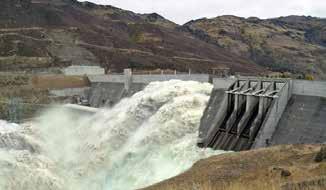
While it is not common, dam breaches do happen. Ninety-nine major dams have failed in US history, and more have failed in the last few decades than in the rest of US history (Stanford). Dam failures in the United states have killed between 3,432 and 3,736 people historically. Overtopping, due to flood waters rolling over the top of a dam, is by far the most common cause of dam failure, especially with earthen dams such as the Harriman (ASDS). With climate change increasing extreme precipitation events, this threat will increase. The photo above illustrates the failure of an unknown dam.
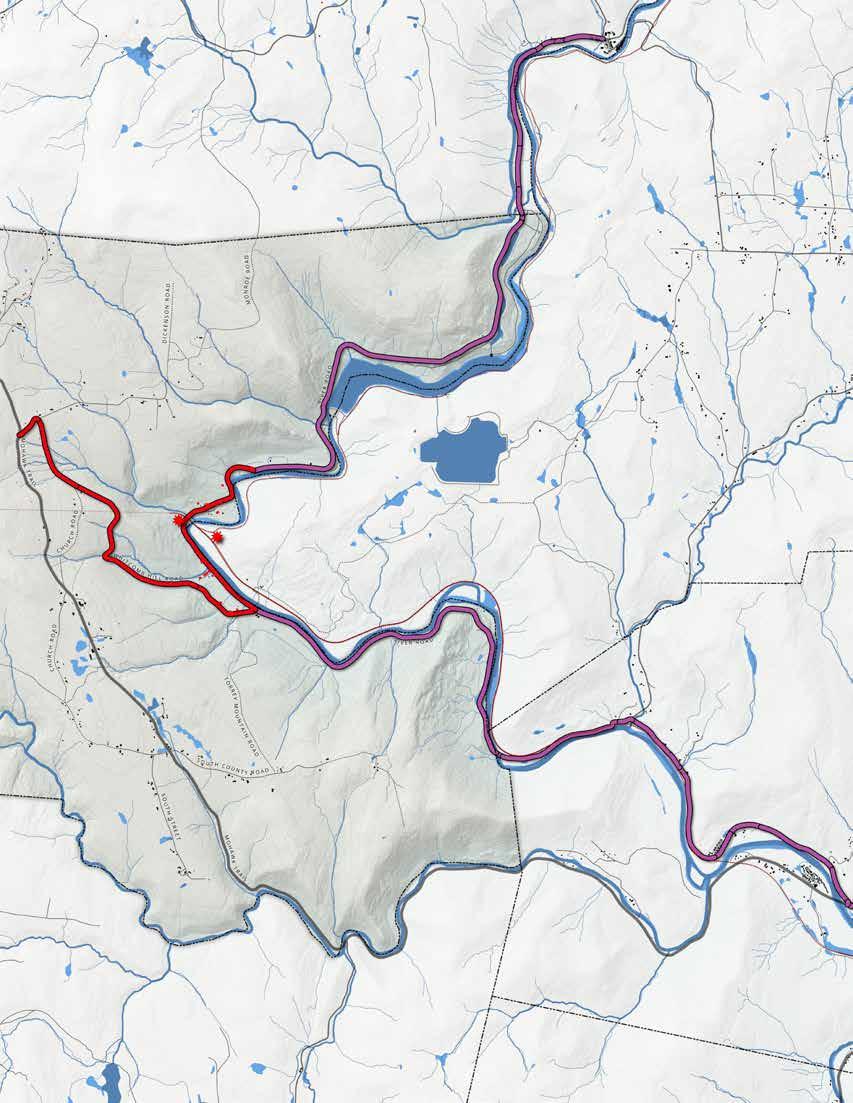
0 1 2 MILE
One of the vulnerabilities that was pointed out by the Florida Fire Chief is the lack of cellular service in the valley, which makes communication with residents in the event of a major disaster difficult. These coverages are shown for the major providers in the maps to the right (Coveragemap). Given the limited time between breach and flooding, fast communications would be critical to save lives. It appears that cell service is poor to nonexistent for all residents in the Deerfield River Valley.
Communication is important, but safe and secure evacuation routes are also necessary. In the case of minor gradual flooding or train-related accidents, River Road would serve as an ample vehicular evacuation route because it would not be compromised by higher flood levels. Evacuation along River Road would bring evacuees either north to Monroe or south to Charlemont. In the event of a dam breach or major flood, however, Whitcomb Hill Road is the only safe vehicular access out of the valley because it quickly raises in elevation above flood levels, and River Road would be compromised.
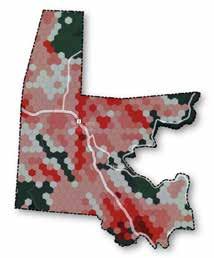
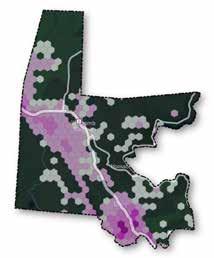

River Road Evacuation Route Potential Siren Location
Whitcomb Hill Road Evacuation Route
Waterways & Waterbodies
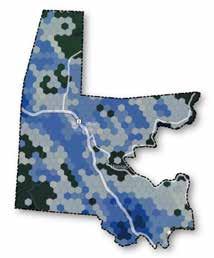

Florida’s roads and trails are vital for local and regional transit, while its communication systems and structures are critical for local climate resilience. A shifting climate and increased frequency of extreme weather events leave Florida's roads, communication systems, and structures vulnerable to localized and large-scale destruction. The following are opportunities to increase the resiliency of these systems.
• Distribute educational resources on disaster response and preparedness for households (see Societal section).
• Share information with residents about roof water catchment (on non-asphalt roofs) systems for household plumbing (when combined with a filtration system) or for backup greywater for bathing and cleaning in the event of an emergency.
• Facilitate household and neighbor resilience planning (e.g., a shared ATV or snowmobile) in the event of closed access to connecting roads(see section Crisis Response & Preparedness).

• Establish regional resource and management cooperation to help decrease the strain on Florida’s volunteer firefighters and increase seasonal personnel for the Highway Department.
• Limit development through local policy in forests and wetlands to preserve their flood mitigation and water-holding capacities and filtration of groundwater supply (further details in the Environmental recommendations section).
• Pursue alternatives to salt for road treatment. See for example the Drexel University research on alternative concretes that store thermal energy and release it in cold temperatures to de-ice the roads (Read).
• Provide further disaster response training for first responders living within Florida on emergency medical response and relief in the event of a crisis level disaster that could leave Florida disconnected from regional resources.
• Identify opportunities for roadside vegetated check dams to help slow the water runoff, filter pollutants, and prevent sediment and salt from flowing into streams and wetlands.
• Evaluate current structural integrity, sizing, and capacity of the identified high- and mediumpriority culverts. The U.S. Climate Resilience Toolkit - Precipitation Frequency Data Server can be used for assessments.
• Assess in person and map culverts that block upstream tributary access for wildlife. If highpriority or secondary-priority culverts are identified as blocking upstream access, consider starting with re-design of these culverts.
• Lead-ins to culverts can be designed to reduce the velocity of water flowing through culverts and allow for the passage of sediment. Implementing non-invasive natural methods to slow, spread, and sink water upstream, such as micro check dams using rocks, that retain passage for aquatic life, can decreases pressure on culverts. Well designed lead-outs of culverts reduce erosion through the dispersal of flowing water.
Optimum Stream Crossing Designs
(Source: UMASS)
• Culverts sized for 500-year rain events and suitable for flooding
• Open bottom arch or bridge span
• Minimum height of 6' and openness ratio greater than 0.75 in areas where wildlife passage is inhibited by high traffic, steep embankments, fencing, or other physical barriers
• Minimum Height of 4’ and openness ratio of .5 when road crossing is uninhibited
• The openness ratio is the cross-section area of a structure divided by the length of the structure when measured in meters. The openness ratio is
(height x width)/length
• Greater than 1.2 times the stream width to maintain dry banks on both sides at least 80% of the year for wildlife passage
• Water depth and velocity match conditions upstream and downstream
• Natural substrates for stream-dwelling organisms
• Establish an emergency shelter in the Deerfield River Valley.
• Create a comprehensive evacuation and disaster response plan
• Make improvements to communications systems, such as improved cell service, mesh network, or Starlink
• Install of a well-sited siren in the valley to alert of imminent disaster
• Limit further development in the high-risk areas of the valley
• Assess possible conservation or buyback options
•
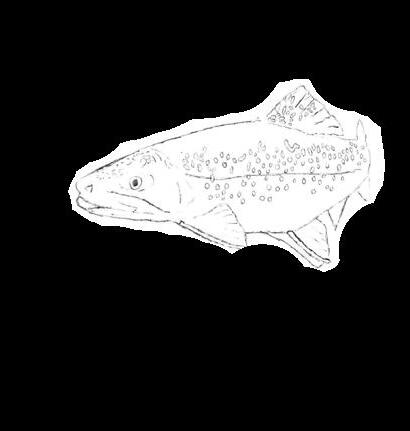
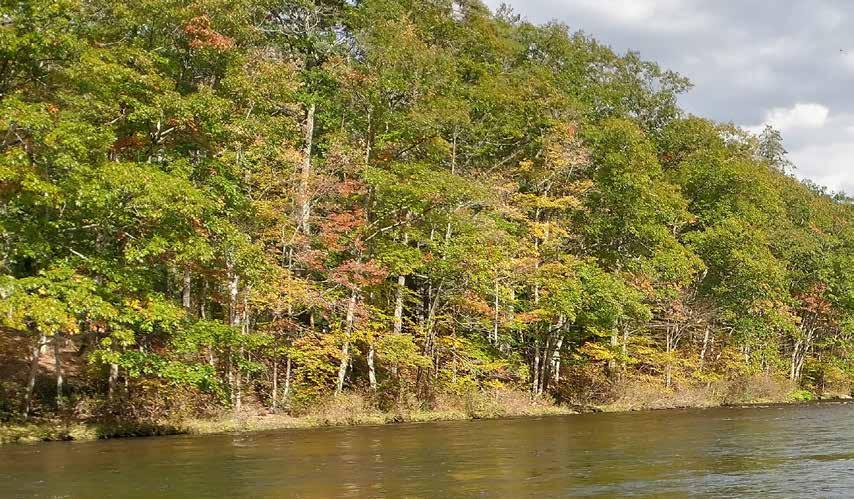
“Clean, healthy rivers are the lifeblood of our communities and are vital to our health, safety, and quality of life. Most Americans live within a mile of a river or stream, and much of our drinking water comes directly or indirectly from rivers and streams. Beyond providing all these useful services, rivers are also just plain fun. Rivers, streams, and their surrounding lands offer endless opportunities for swimming, fishing and boating, hiking, wildlife watching, and picnicking. Whether one is seeking exhilaration, solitude, or a much-needed break from the daily grind, there is a river out there beckoning us to come out and play.”
- A Guide to Sustainable River Recreation Management Planning, American Rivers
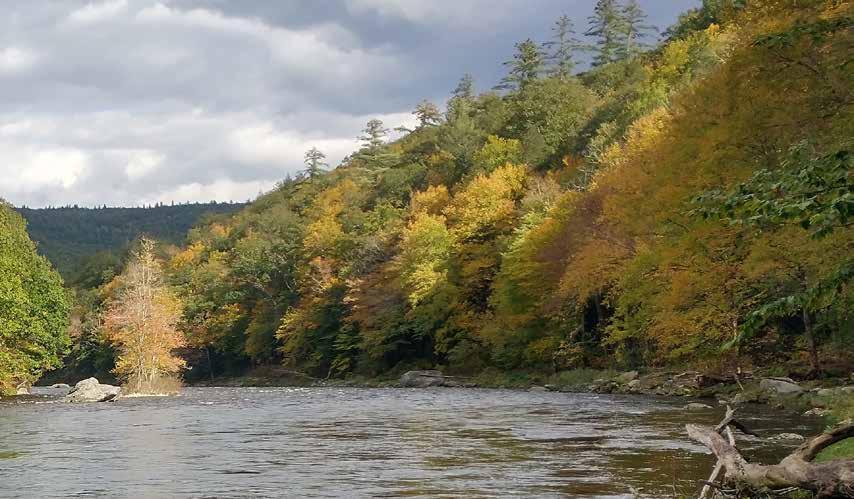
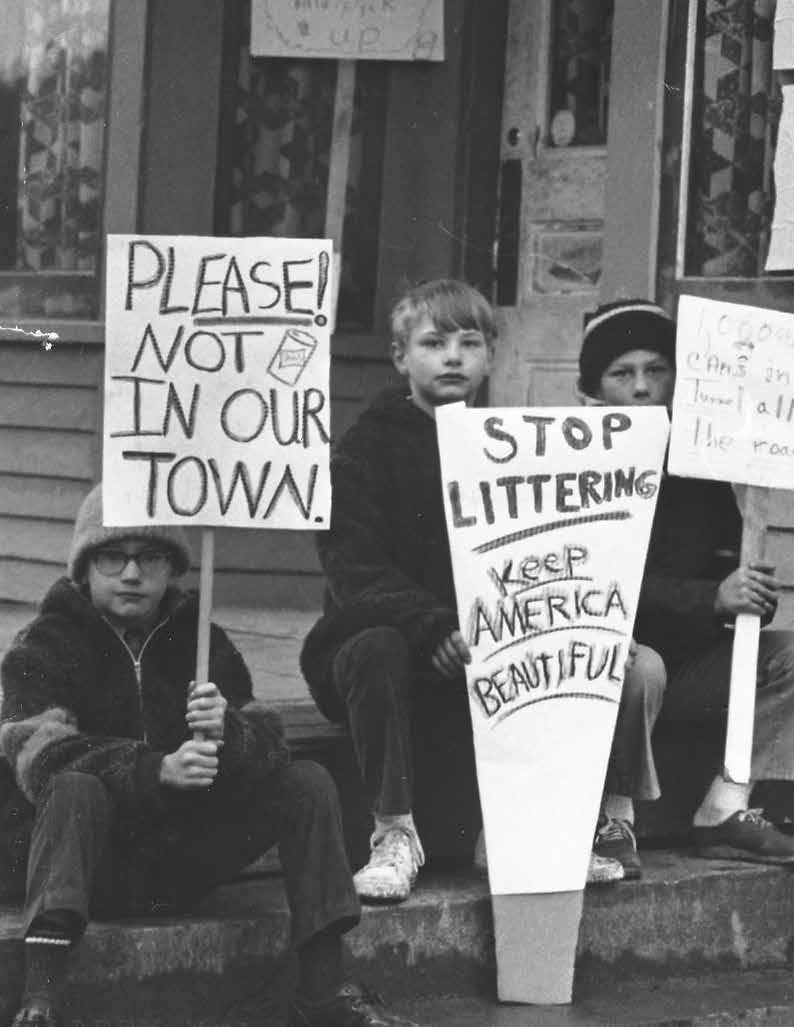
NEWMANS STORE 1973
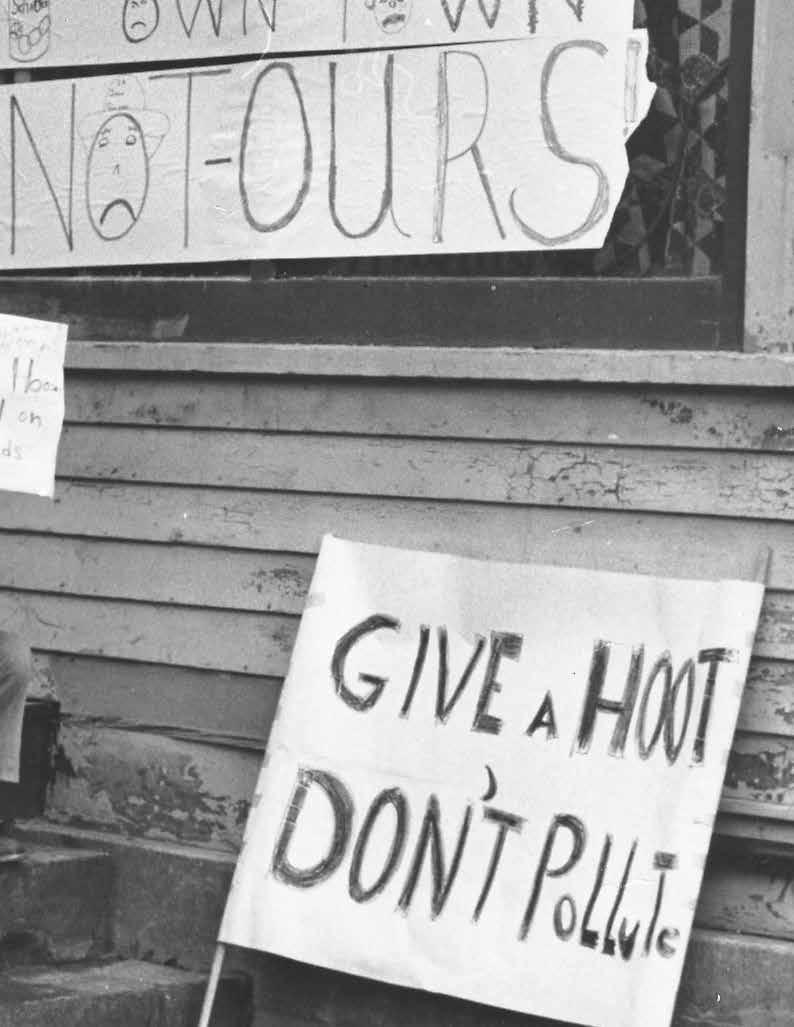
Florida is a small town with numerous community assets including volunteer groups that prioritize caring for the community from day to day and in the event of emergencies. While there are a number of vulnerable populations within Florida, there is an awareness amongst the community to look after one another. This communal orientation is an asset that, if appropriately resourced, could further benefit the surrounding towns with high-density, vulnerable communities in the face of slow-onset climate change and climate-related disasters.


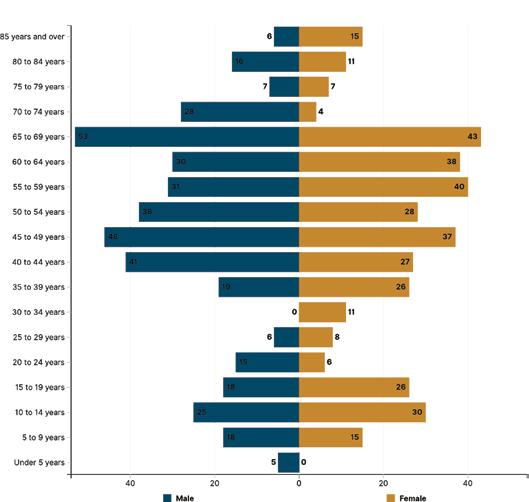
POPULATION PYRAMID: POPULATION BY AGE & SEX
(SOURCE: DATA.CENSUS.GOV)
Florida is a town of families that have called Florida home for generations with a few new community members moving in along the way. The population of Florida has fluctuated little in the past few decades, with an average between 600 and 750 and, as of the 2023 census, a population of 774.
In Florida, while the median household income is $90,078, 19% are considered lowincome households with under $50,000 (the next census bracket being $50,000-100,000 representing 41% of the population). Nearly a quarter (22.4%) of the population have a bachelor’s degree or higher, and 55.9% are employed. The 362 housing units (10% vacancy) in Florida vary significantly in age and style, with 90% as single household units. The 774 individuals represent 315 households, with an average household size of 2.5 individuals. As there are few businesses in Florida, most residents drive to North Adams or Pittsfield for work, with an average drive time of 28.4 minutes. There is minimal carpooling as 82% are driving alone (Census. gov; Census Reporter).


While Florida is not identified as an Environmental Justice community, there are vulnerable populations within Florida. Vulnerable populations include those at higher risk of climatic changes due to health or age and those that require added assistance in the event of an emergency. In Florida, these communities include 25% of the population over 65 (approximately 30% living alone), (ESRI), 131 individuals with disabilities, 15 households with English as a second language, and 23 households without access to transportation (Census Reporter). In the event of an emergency, these populations may require specialized transport, translation services, or alternative emergency alert systems for those who are visually impaired, deaf, or hard of hearing. According to community members, the Senior Center is currently without a transport vehicle, and a community member uses their personal vehicle to pick up residents that are without a vehicle. Resources such as Life Alert can provide secondary communication resources for individuals with mobility and language barriers.


75 to 100% Low Income
50 to 75% Low Income
25 to 50% Low Income
0 to 25% Low Income
Environmental Justice Communities, "Income"
Environmental Justice Communities, "Minority"
Hazardous Material Sites with Activity & Use Limitations
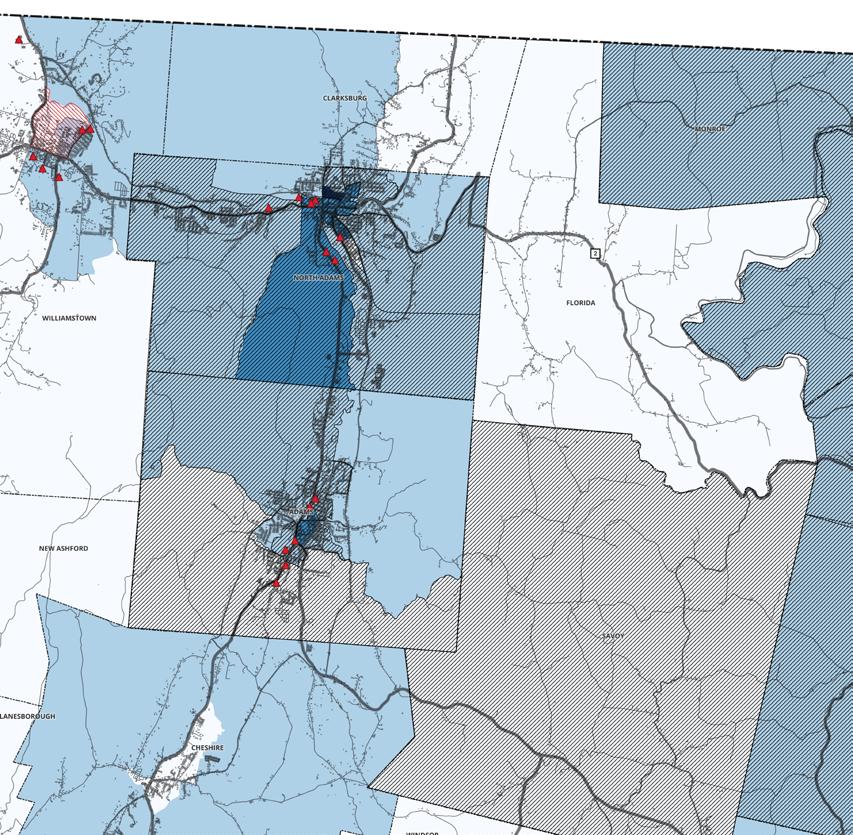
Environmental Justice (EJ) populations are designated by the Commonwealth as communities of low household income, minorities, households with a lack of English proficiency, racial minorities, or otherwise designated by the state. According to the state of Massachusetts, EJ communities are “most at risk of being unaware of or unable to participate in environmental decision-making or to gain access to state environmental resources or are especially vulnerable” (GEAR).
Seven towns bordering Florida (Monroe, Rowe, Charlemont, Savoy, Adams, North Adams, and Hawley) are designated by the state as EJ communities due to lower median income, with a small portion of Adams designated as a combination of minority, language isolation, and lower income. A community is defined as an income EJ population when 25% of the households have a median household income that is 65% or less of the state median household income (HHI). As of 2025, the median household income for Massachusetts is $89,645, making 65% $58,269 (WPR). On average, lower-income households are more susceptible to increased

heat, air pollution, and extreme weather resulting in higher frequency of environmentally induced diseases and health conditions (GEAR). Lower-income individuals often live in less climate-resilient housing, have difficulty paying energy bills, lack food security, and have limited access to transportation. Language isolation households are at higher risk of climate-induced health conditions, lack of access to alert systems, and healthcare. Minority populations are heavily impacted by systemic and social inequalities impacting their overall health and safety in the face of environmental factors (GEAR). In this analysis, sites of chemical and oil spills or threats have been included to identify the correlation between high density EJ populations around Florida and their proximity to areas of significate present or past environmental pollution.
As Florida plans for resiliency, building relationships with neighboring communities and emphasizing the voices of EJ populations can help to create equitable access to resources such as medical care, climate-resilient housing, communication systems, and emergency shelters for all community members.
An MVP Action Grant awarded to the town of Great Barrington, MA centered on Climate Action Resilience and Equity. The project included "engagement and trust-building with underrepresented populations, cultural competency and climate justice trainings for municipal officials, identification and prioritization of climate change adaptation/mitigation strategies which were tailored to the needs of those in the community most vulnerable to climate change impacts" (MassGov).
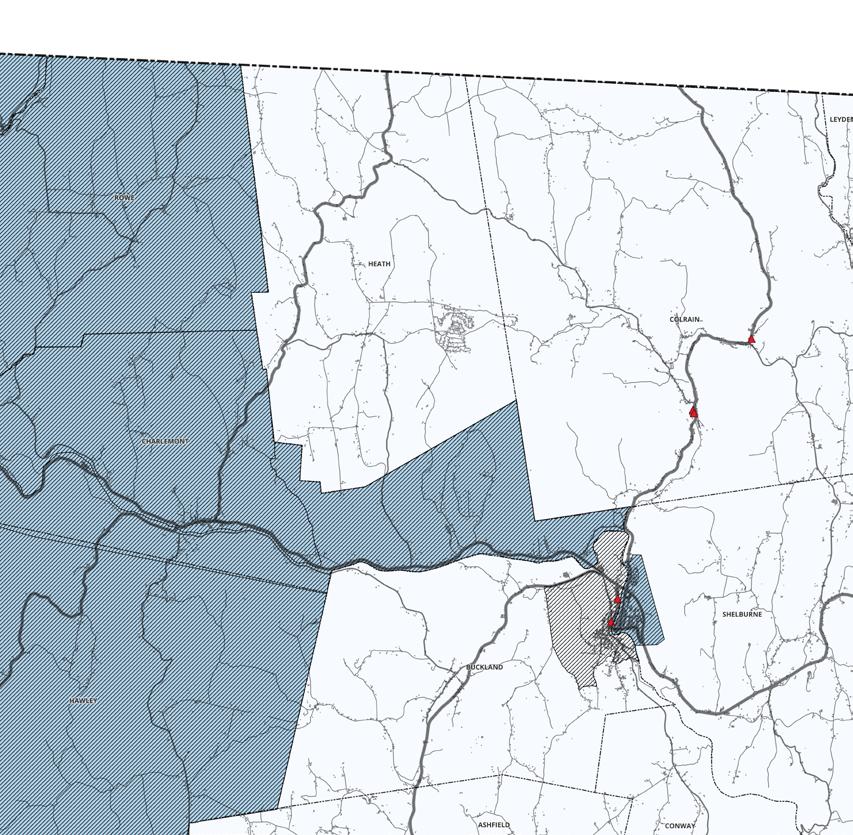
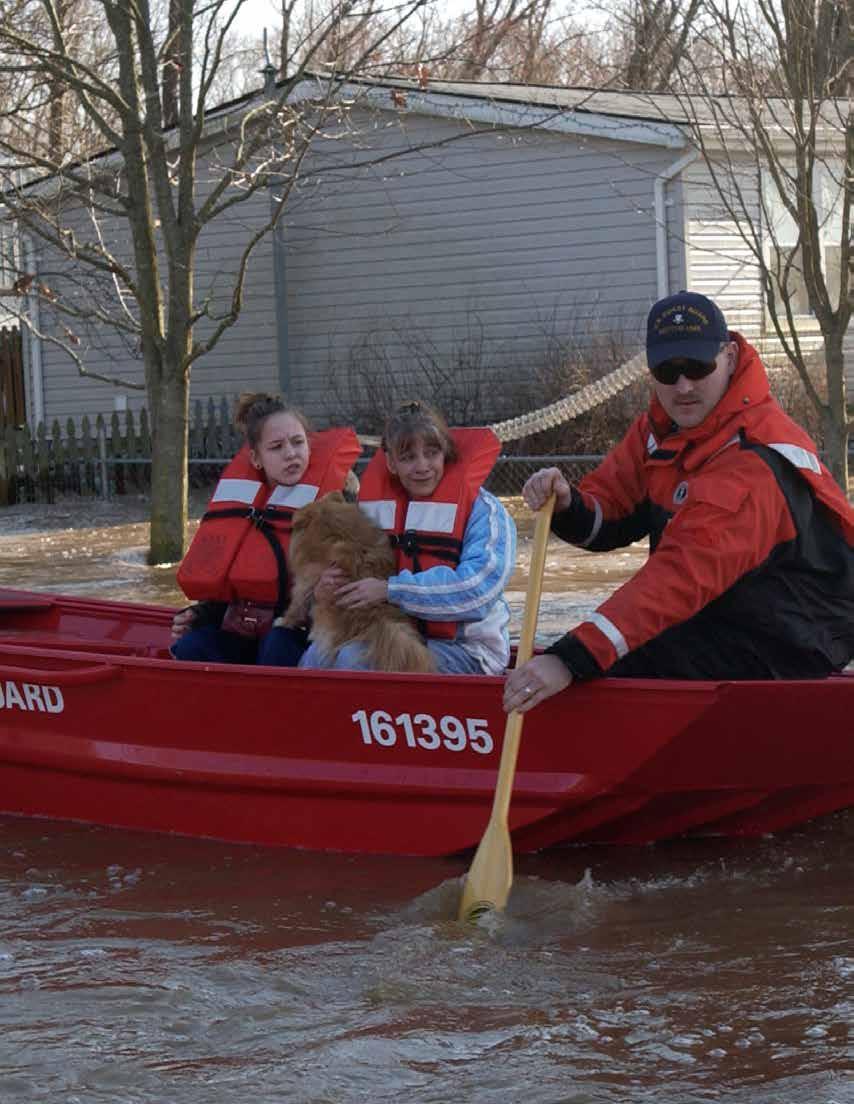

The World Bank predicts that 216 million people globally could move internally by 2050 as water becomes scarcer and agricultural livelihoods are threatened (World Bank). As climates shift, Florida will be impacted by slow-onset climate change and may be impacted by rapid climate-related disasters. Yet, its undeveloped nature, high elevation, water and forest resources, and mountains make it less susceptible to the industrial pollution, heat island effect, and extreme flooding or tornadoes that are impacting urban and low-land areas. Thus, Florida may act as a refuge for those in urban environments or rural lowlands.
To be a place of refuge for potential incoming and present Florida residents, the current dependency on neighboring towns for gas stations, medical facilities and ambulances, police services, groceries, and stores that would supply emergency supplies such as batteries or blankets needs to be lessened. In the event of a regional disaster, these facilities may be inundated by local need and limited in capacity to meet the needs of neighboring communities. Access to these facilities may also be limited due to blocked roads.
In emergencies, psychological needs can be overlooked. Everyone responds differently and has differing emotional capacities to meet their needs or the needs of others in the event of an emergency or larger scale disaster. Housing is scattered in Florida, creating the potential for isolated residents in the event of a disaster; local emergency responders are limited in capacity; and no known community members are trained in psychological aid. This could result in further negative health impacts or loss of life caused by climate-related disaster or even slow-onset climate change if residents are isolated for extended periods.
According to the World Bank, if national and local governments take initiative to mitigate climate change and adapt to existing conditions, climate-related internal migration could drop by up to 80%, which is 44 million people (Huang). Mitigating and adapting to climate change is not a task Florida can or should respond to independently. Collaboration with neighboring rural towns and cities increases the skills, resources, and capacity of each community in an effort towards regional resilience.
The previous sections looked at opportunities to mitigate local risk. This section considers ways the Florida government and residents can build resilience through planning and regional collaboration in mitigating and adapting to slow-onset climate change and responding to climate-related disasters.
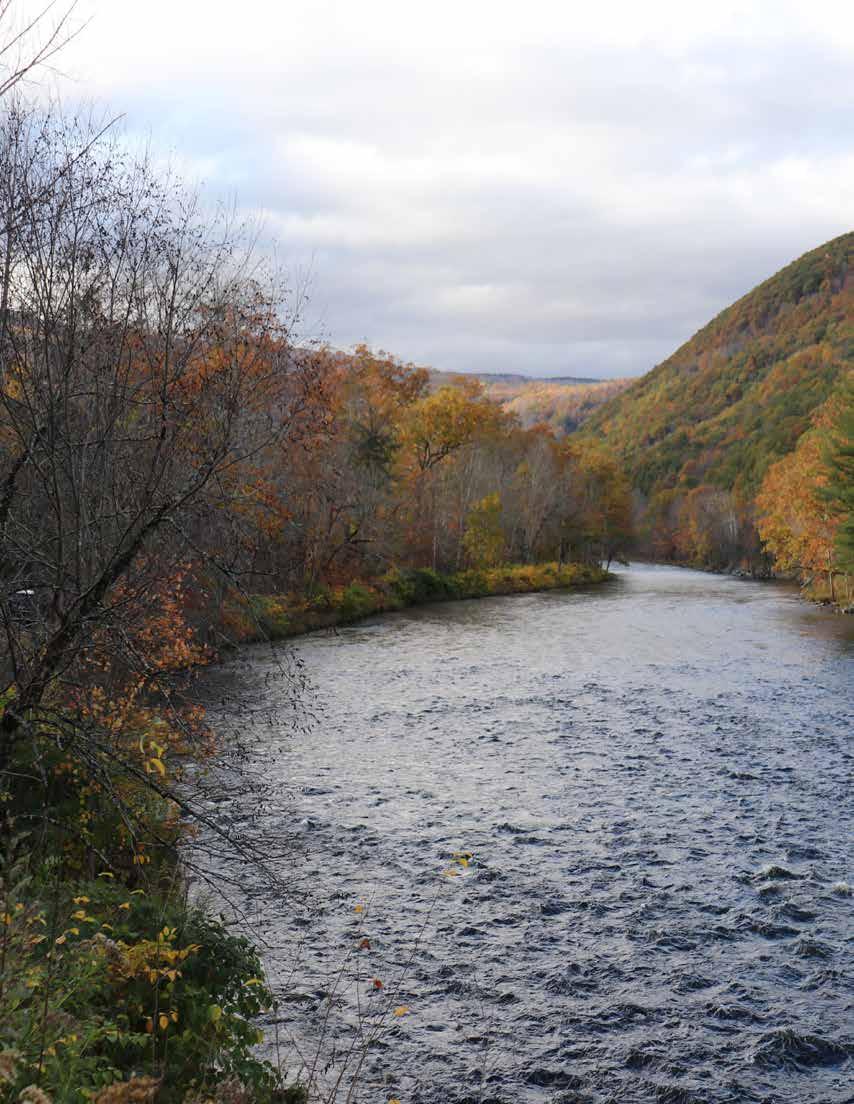
Climate migration, according to the Environmental Migration Portal, is the movement of individuals or communities due to sudden or gradual climate-related changes in the environment, which either temporarily or permanently requires their relocation (IOM). Most disaster-related displacement is short term, but migration related to slowonset climate change tends to be large-scale and permanent (Huang). Slow-onset climate change may lead to uninhabitable regions, endanger rural livelihoods, and create competition over resources in urban spaces. Individuals in areas impacted by slow-onset climate change may then migrate to receiving communities (Huang).
Florida’s high elevation and environmental conditions make it more resilient to slowonset climate impacts such as increased heat and air pollution. Increasingly common extreme weather events may mean that repeated short-term temporary relocation may lead to long-term migration. As nearby towns experience both slow-onset climate change and rapid climate disasters, Florida may act as a short- or long-term receiving community for migrating populations. The low-population density and limited existing businesses may further encourage migration to Florida as there is developable land, small business potential, and distance from pollution and the competition over resources that occurs in urban and crowded spaces.
Were Florida to establish a Comprehensive Plan in collaboration with neighboring towns, and in reference to the Berkshire County Hazard Mitigation Plan, the municipality would be more prepared for climate-related migration. In addition to outlining the town’s recommendations for future development, land use, and population growth, it would be beneficial to include the following in support of climate-related migration:
• Collaboration with other receiving communities for establishing best practices for rapid response. For example, expanding the capacity of town resources through housing codes that allow multi-family housing in single-family dwelling units, increased school capacity, mapped potential development that highlights areas where septic is viable, and identifying English-as-a-second-language helpers within the community.
• An increase in population can lead to higher taxes and may decrease affordable housing as the cost of building, owning, and renting rises. It is important to ensure equitable housing for existing and incoming vulnerable communities.
• Florida may become a receiving community and is also a community at risk of climate disasters. Bolstering the ecological functions of floodplains and wetlands through local zoning codes, land use policies, and restoration initiatives will help mitigate the impact of extreme events on individuals and infrastructure.
Community education around the value of wetlands can create local accountability around protecting wetlands from pollutants and dumping of waste.
• Buyout programs and other incentives should be considered for current residents living within floodplains.
• As development occurs and existing infrastructure requires maintenance, investment in sustainable and resilient upgrades will help mitigate climate impacts and prepare for population growth. In Florida, particular attention to electrical grids and off-grid power sources will help mitigate localized isolation concerns.
• In preparation for an increased population, incentives for private sector local investment and policies that support job creation that prioritizes local resource access (e.g., food, alternative fuel, clinics) will build local resilience for Florida and neighboring Environmental Justice communities.
Individuals typically move where they already know someone (New America). Residents should have conversations with friends and family that live outside of Florida to assess where they might go in the event of a natural disaster or emergency, and if their home might be a short or long term space of refuge.

(SOURCE: CRISIS RELIEF & RECOVERY)
The Rule of Threes, is a survival mnemonic device highlighting the order of response to emergency circumstances and threats to life.
3 SECONDS
In 3 seconds you can make a poor decision
• Pause and think

3 MINUTES
You can only last 3 minutes without air
• First aid kit (know what’s in it and know how to use it)
3 HOURS
You can survive for 3 hours outside of your normal temperature range
• Shelter
• Space blanket
• Fire Primary - lighter Alternative - matches Contingency - flint & steel Emergency - sticks
• Getting out of the sun or rain
• Knife
• Para-cord
• Tarp
3 DAYS


You can survive 3 days without water (Variable due to individual health and weather)
• Multiple options Water purification tablets
Water filter
Boiling water Filter with moss/sand/charcoal


In the event of climate disaster, staying at your place of residence may be the safest option. Households should be prepared with emergency radios in the event of power outages or isolation in order to receive emergency evacuation orders or in the event or their dwelling being rendered unsafe. See FEMA Planning Considerations: Evacuation and Shelter-in-Place guide for disaster-specific shelter-in-place responses.

3 WEEKS
You can survive 3 weeks without food
• Want to find people and civilization before that
• Knife
• Long life food: protein bars, honey, ration packs
3 MONTHS

You can survive 3 months without companionship

• Compass
• Whistle
• Head lamp


Waterproof Storage Bag
PRIORITY ITEMS
• Head lamp
• Knife
• Flint and steel
• Food and Water

Having pathways of communication (e.g., a list ordering individuals of contact for varying expertise, emergency radios, long range handheld radios, etc.) set in place and response strategies practiced may save lives and help reduce the damage caused by climate-related disasters. Hurricane Irene in 2011 was a look into both the assets and the limitations of the town's capacity to respond to climate-related disasters. While emergency shelters have been established in Florida, there is currently no detailed municipal disaster preparedness plan. As community volunteers consider the increased frequency of climate-related local emergencies and regional disasters, volunteers who assisted during Irene and other events such as the 1978 and 2008 snow storms have expressed a desire for simulation training to prepare for future disasters.
Establishing a municipal disaster preparedness plan that addresses social systems, resource access, an asset inventory, and a conflict analysis would facilitate a rapid response in the event of a disaster, saving hours of in-the-moment planning and coordination. Some key considerations include structures, evacuation routes, communication, medical resources, and political influences that may impact access to necessary resources. This plan should answer the questions: where do we go, what do we do, and who do we call.
• Crucial response plans should be visually represented (e.g., printed infographics or videos) and posted in community and government spaces. Local schools and community centers can use games to simulate these events and methods of response (Morrow)
• Establishing mutual trust and agreed upon resource and skill sharing with numerous community and national organizations as well as neighboring towns builds regional resilience through combined capacity.
• Informational videos distributed through local channels can address items such as household shelter-in-place planning, varying methods of water filtration, shelter locations throughout town, and evacuation strategies.
• See the "Build Your Go Bag, Get Home Bag, and Shelter Kit" free online training video by Crisis Relief and Recovery for details on blustering emergency shelters.
Consider investing in a training for emergency responders and volunteers that addresses climate disaster specific response strategies such as the "Real -World Crisis Management" training provided by Crisis Relief and Recovery. These trainings establish a Standard Operating Procedure for order of
communication and terminology. Then, participants practice those response strategies in disaster simulations. This includes items such as who will be responsible for setting up emergency centers, contacting neighboring town emergency response units, and updating local alert systems.
• Emergency responders should first take care of their families and then proceed to using their skills to help other community members (CRR).
• Training of community leaders and emergency responders should include Psychological First Aid (PFA). PFA is a supportive response to those with heightened distress due to an immediate or ongoing trauma to help calm an individual and connect them to medical, communal, or survival resources (CRR).
• Listening sessions that welcome neighboring environmental justice populations to assess if there is overlap of needs and opportunity for collaboration on solutions (e.g., further medical clinics or housing)
• Diversify emergency alert systems to address loss of communication networks and vulnerable populations (e.g., those who are hard of hearing or visually impaired).
• A mapping of households without transportation or with mobility disabilities should be accessible to emergency responders.
• Purchasing of a universally accessible vehicle for the Senior Center will help secure safe transit to emergency shelters for vulnerable community members.
• Supplementary supplies for water filtration that do not require electricity (such as Lifestraw or Berkey) at the Senior Center and Town Hall garage shelters can provide short term resilience in the event of an emergency until potable water is re-established at these facilities.
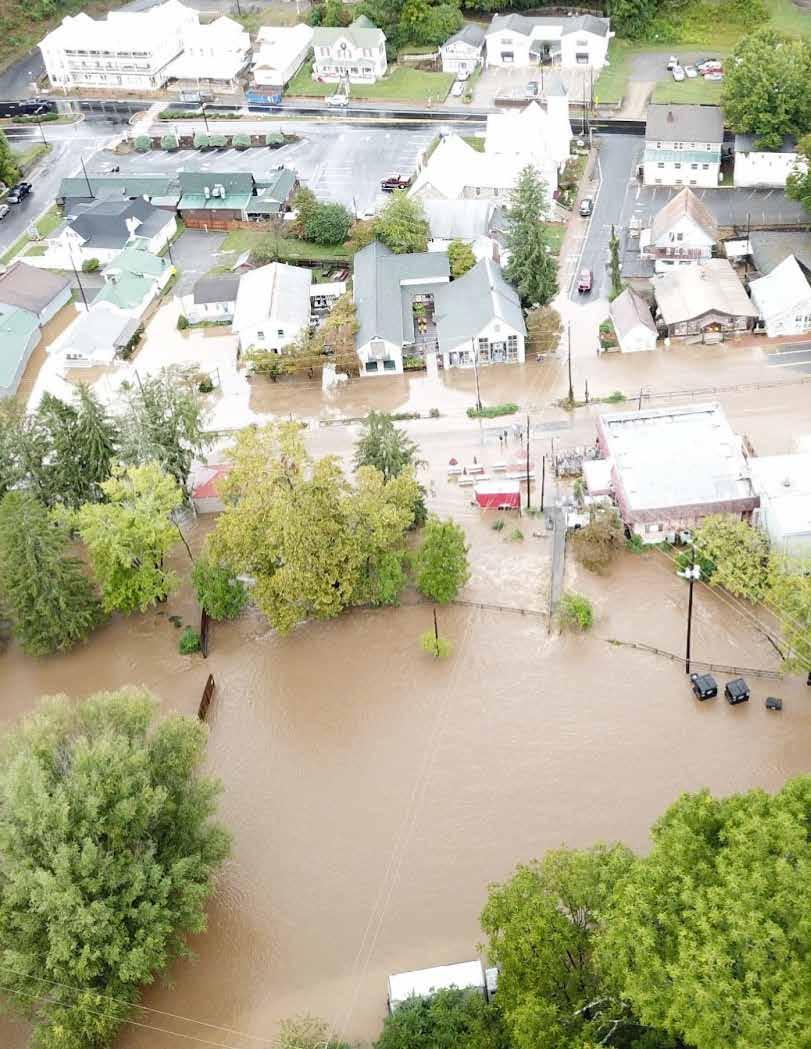
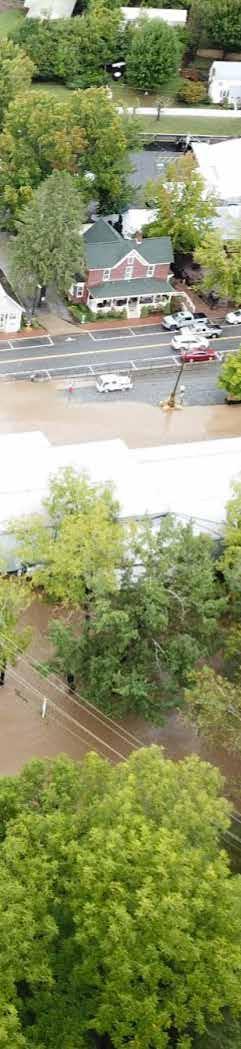
On September 26, 2024, Hurricane Helene hit Big Bend, North Carolina, with maximum sustained winds of 140 mph. In the subsequent 48 hours, between 12 and 20 inches of rain fell on western North Carolina, which triggered flooding, tornadoes, and the closure of over 400 roads (NOAA). It was the deadliest mainland hurricane since Katrina in 2005 with 249 deaths accounted for as of February 2025, (NOAA) and resulted in more than $59.6 billion in damages (CRR).
On September 28, 2024, community members gathered in Asheville’s Firestorm Books, while other parts of Asheville were under water. Community members recognized water and medical care as priorities. A free clinic was set up at a local bar, a hundred water stations were established, community members assisted with bucket flushing toilets for the elderly and disabled and with supply distribution to rural areas. In time, the bar established itself as a distribution hub, free store, and clinic with translation services. An advertised email address was established for requests to check on community members via volunteers traversing the debris to homes. “Ultimately, more than 2,600 volunteers checked on nearly 16,000 households in the span of a week” (Simonton).
While it took nearly two months for running water to return, local initiatives were the lifesource of the community in the interim as NGOs and the government trickled in. Mutual community aid continues to be North Carolina’s greatest resource on the road to recovery.
Located at the confluence of the French Broad and Swannanoa Rivers, Asheville is the most populated city in western North Carolina with the remaining towns dispersed throughout the mountains. During Helene, outside resources struggled to find pathways into western North Carolina due to road closures (Davis).
As a small mountain town at the confluence of the Cold and Deerfield rivers with one major State Road thoroughfare, Florida can learn from the communities of North Carolina the importance of preemptively bolstering emergency relief centers and power sources, diversifying pathways of communication for road closures and resource access, and dispersing educational materials for emergency response and preparedness for households and businesses.
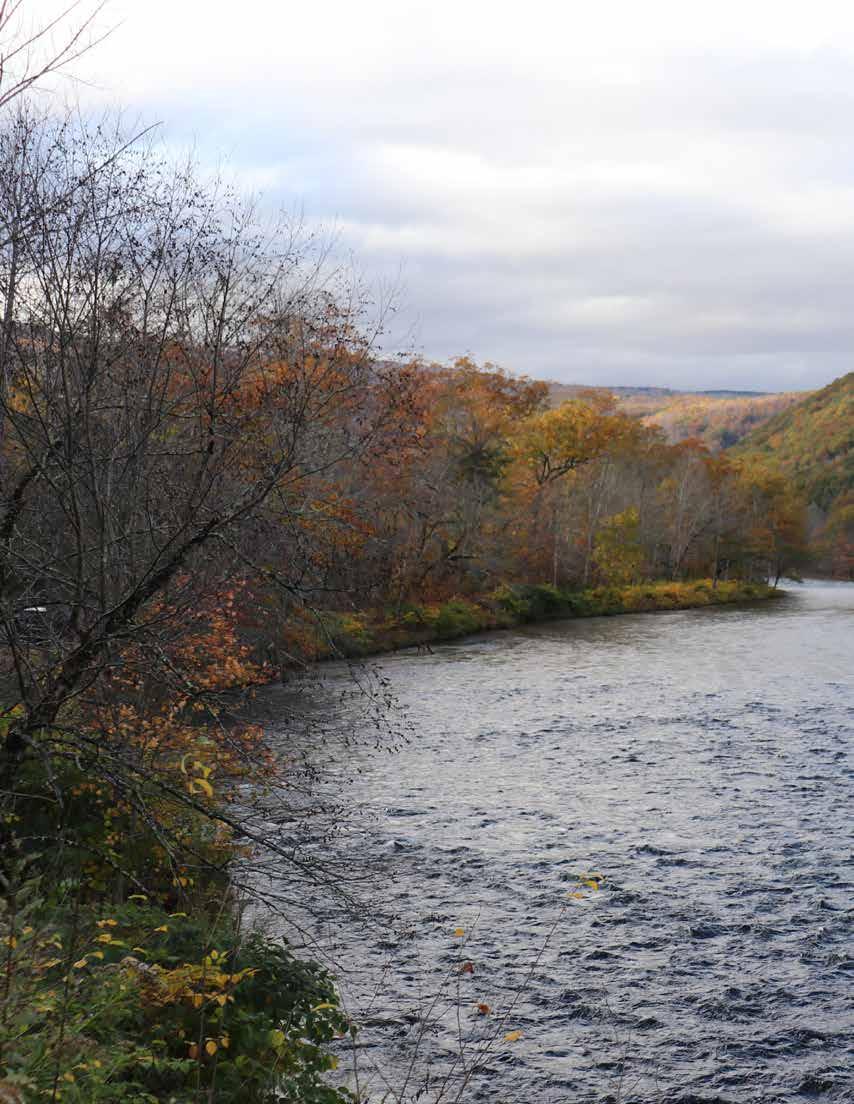
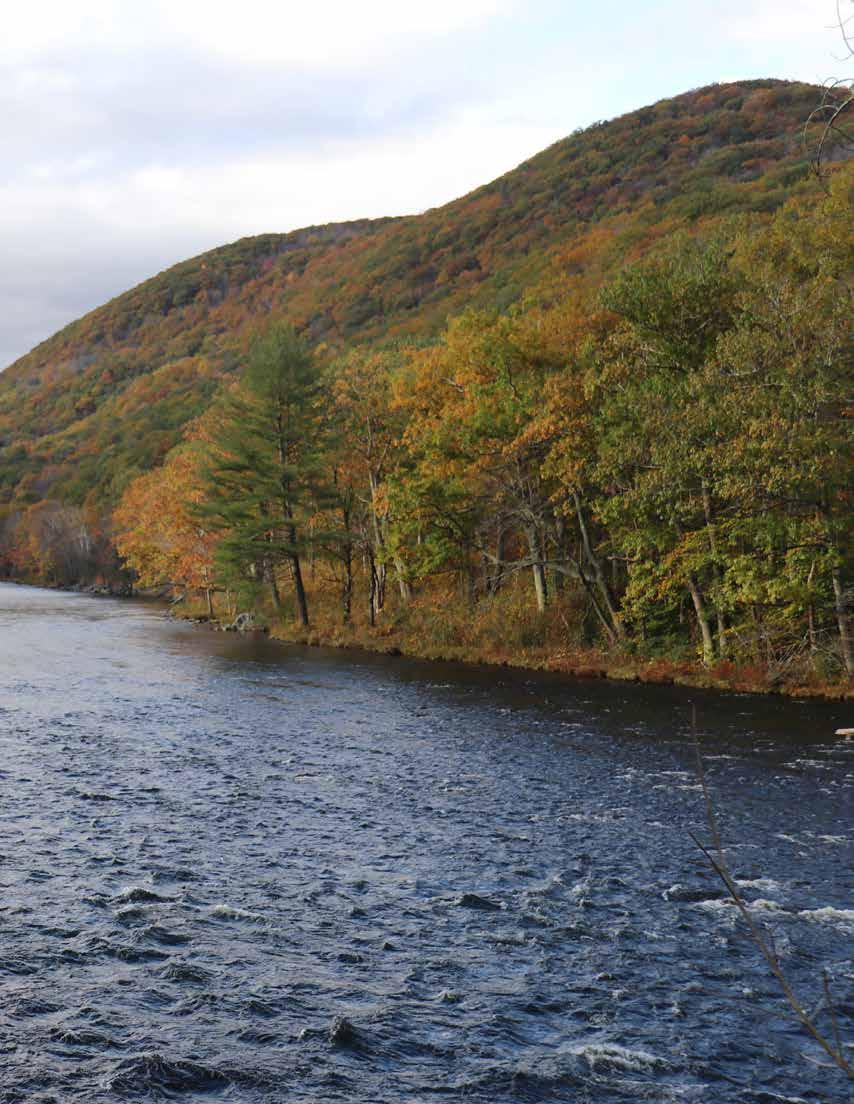
“I would say that there exist a thousand unbreakable links between each of us and everything else, and that our dignity and our chances are one. The farthest star and the mud at our feet are a family; and there is no decency or sense in honoring one thing, or a few things, and then closing the list. The pine tree, the leopard, the Platte River, and ourselves - we are at risk together, or we are on our way to a sustainable world together. We are each other's destiny.”
- Mary Oliver
Abbott Memorial School | https://www.abbottmemorial.org/o/am/page/ welcome. Accessed 19 Mar. 2025.
AP | Irene-Damaged Route 2 in Franklin County Nearly Fixed - Masslive. Com. https://www.masslive.com/news/2011/11/irene-damaged_route_2_ in_frank.html. Accessed 8 Mar. 2025.
Bent, Gardner C., et al. | “High-Water Marks from Tropical Storm Irene for Selected River Reaches in Northwestern Massachusetts, August 2011.” Data Series, 775, U.S. Geological Survey, 2013. pubs.usgs.gov, https://doi. org/10.3133/ds775.
Berkshire Eagle | 12 Winter Storms That Buried the Berkshires | Archives | Berkshireeagle.Com. https://www.berkshireeagle.com/archives/12-winterstorms-that-buried-the-berkshires/article_873fc490-aad2-56c3-94c40122e0cd52a6.html. Accessed 8 Apr. 2025.
Brule | Brule, Tom. Interview Regarding Forestry and Land Use in Florida MA. Phone, 19 Mar. 2025.
Burk, John | Deerfield River Estuary Magazine: For People Who Care about the Connecticut River. https://www.estuarymagazine.com/2021/09/ deerfield-river/. Accessed 16 Mar. 2025.
Catskill Archive | THE SECOND MASSACHUSETTS TURNPIKE -The Turnpikes of New England by Frederic J. Wood, 1917. https:// catskillarchive.com/rrextra/httpk2nd.Html. Accessed 19 Mar. 2025.
ClimateData | Understanding Shared Socio-Economic Pathways (SSPs) — ClimateData.Ca. https://climatedata.ca/resource/understanding-sharedsocio-economic-pathways-ssps/. Accessed 19 Mar. 2025.
Copernicus | Climate Projections Copernicus. https://climate.copernicus.eu/ climate-projections. Accessed 19 Mar. 2025.
Deerfield Fly Shop | Deerfield River Description. 6 Jan. 2015, https:// deerfieldflyshop.com/waters-we-fish/about-the-deerfield-river/.
Fanto, Clarence | “Tropical Storm Irene Five Years Later: ‘A Lot Worse than Anybody Thought.’” The Berkshire Eagle, 29 Aug. 2016, https://www. berkshireeagle.com/archives/tropical-storm-irene-five-years-later-a-lot-worsethan-anybody-thought/article_6eaf0cbd-a6d8-5915-b97e-33a1c9f438e9. html.
FEMA | Hazard Mitigation Planning | FEMA.Gov. https://www.fema.gov/ emergency-managers/risk-management/hazard-mitigation-planning. Accessed 18 Mar. 2025.
Fire Wiki | "Florida Volunteer Fire Department (Massachusetts)." Firefighting Wiki, 20 Mar. 2025, https://fire. fandom.com/wiki/Florida_Volunteer_Fire_Department_(Massachusetts).
FRCOG | “Mohawk Trail West Scenic Byway Corridor Management Plan (2002)” Franklin Regional County of Governments, 2002. https://frcog.org/wp-content/uploads/2014/05/MTPLAN.05-historic. final_.pdf
GlobalChange | Northeast National Climate Assessment. https://nca2014. globalchange.gov/report/regions/northeast. Accessed 19 Mar. 2025.
Grow Native Massachusetts | Ecoregions of Massachusetts https:// grownativemass.org/Our-Commonwealth/ecoregions. Accessed 19 Mar. 2025.
Harvard Forest | “Native Use of Fire – Incomplete Notes and Quotes” https://harvardforest.fas.harvard.edu/sites/default/files/5-NativeUseofFireNotesQuotes.pdf. Accessed 23 Mar. 2025.
Historic Aerials | NETRonline: Historic Aerials. https://www.historicaerials. com/. Accessed 27 Mar. 2025.
History of Massachusetts | “Geological History of Massachusetts.” History of Massachusetts Blog, 7 Oct. 2019, https://historyofmassachusetts.org/ geological-history-massachusetts/.
Hoang, Long | “Culverts and Climate.” TheWaterChannel, 3 Apr. 2024, https://thewaterchannel.tv/thewaterblog/culverts-and-climate/.
Huberdeau, Jennifer | “Waiting to Find out How Much Snow We’ll See This Weekend? Take a Look Back at These Legendary Berkshire Snowstorms.” The Berkshire Eagle, 28 Jan. 2022, https://www.berkshireeagle.com/history/ mysteries-from-the-morgue-legendary-snowstorms-to-hit-the-berkshires/ article_f3c38f6b-a8de-5184-b63e-8f54208fae79.html.
IPCC | Figure AR6 WG1 Climate Change 2021: The Physical Science Basis. https://www.ipcc.ch/report/ar6/wg1/figures/chapter-11/figure-11-7/. Accessed 19 Mar. 2025.
Jochem, Greta, A | “The Bronze Elk Statue on Whitcomb Summit in Florida Is Turning 100 This Weekend.” The Berkshire Eagle, 16 June 2023, https:// www.berkshireeagle.com/news/northern_berkshires/elk-on-mohawk-trailturns-100-elks-lodge-event-when-is-time-capsule-being-opened/article_ d9235fe6-0acc-11ee-882a-2b4cef895962.html. Accessed 19 Mar. 2025.
Jochem, Greta, B | “On Deerfield River, Going with the Flow These Days Means Testing Raging Waters” | Northern Berkshires | Berkshireeagle.Com. https://www.berkshireeagle.com/news/northern_berkshires/on-deerfieldriver-going-with-the-flow-these-days-means-testing-raging-waters/ article_378ea206-e40b-11eb-b59e-33aa3530335b.html. Accessed 16 Mar. 2025.
Little, Richard D. | “Deerfield River Valley Mysteries: How the Glacier Age and Other Geologic Events Shaped Historic Deerfield and Surroundings (Part 2).” Historic Deerfield, 14 May 2020, https://www.historic-deerfield. org/2020-5-7-deerfield-river-valley-mysteries-how-the-glacier-age-and-othergeologic-events-shaped-historic-deerfield-and-surroundings-part-2/.
MassGIS | MassGIS Data: 2016 Land Cover/Land Use | Mass.Gov. https:// www.mass.gov/info-details/massgis-data-2016-land-coverland-use. Accessed 19 Mar. 2025.
Mass.gov, A | MVP Nature-based Solutions (NBS) Toolkit https://www. mass.gov/doc/mvp-nature-based-solutions-toolkit/download. Accessed 19 Mar. 2025.
Mass.gov, B | Extreme Weather Events | Mass.Gov. https://www.mass.gov/ info-details/extreme-weather-events. Accessed 28 Mar. 2025.
Moran, Barbara | New Map of U.S. Plant Zones Shows a Warmer Massachusetts. 22 Nov. 2023, https://www.wbur.org/news/2023/11/22/ usda-plant-hardiness-zone-map-massachusetts.
National Parks Service | Shapers of a Continent - Gates Of The Arctic National Park & Preserve (U.S. National Park Service). https://www.nps.gov/ gaar/learn/nature/shapers-of-a-continent.htm. Accessed 23 Mar. 2025.
NEMO | “Impacts of Development on Waterways.” Nonpoint Education for Municipal Officials Center for Land Use Education and Research. University of Connecticut. https://media.nemo.uconn.edu/publications/fact_sheets/nemo_fact_ sheet_3_s.pdf. Accessed 23 March 2025.
NOAA, A | Global Climate Dashboard NOAA Climate.Gov. https://www. climate.gov/climatedashboard. Accessed 19 Mar. 2025.
NOAA, B | US Department of Commerce. Ice Storm December 11th-12th, 2008 - 10th Anniversary. National Weather Service, https://www.weather. gov/aly/IceStormDec2008. Accessed 8 Mar. 2025.
NOAA, C | Deerfield River at West Deerfield. https://water.noaa.gov/ gauges/wdem3. Accessed 26 Mar. 2025.
NOAA, D | PF Map: Contiguous US. https://hdsc.nws.noaa.gov/pfds/pfds_ map_cont.html?bkmrk=ma. Accessed 11 Mar. 2025.
NOAA, E | Storm Events Database - Search Results | National Centers for Environmental Information. https://www.ncdc.noaa.gov/stormevents/ listevents.
jsp?eventType=%28C%29+Flash+Flood&beginD ate_mm=01&beginDate_dd=01&beginDate_yyyy=1995&endDate_ mm=12&endDate_dd=31&endDate_
OpenRailway | OpenRailwayMap. https://www.openrailwaymap.org/. Accessed 19 Mar. 2025.
Owens, Carole | “CONNECTIONS: Walking to Florida along the Mohawk Trail.” The Berkshire Edge, 18 May 2021, https://theberkshireedge.com/ connections-walking-to-florida-along-the-mohawk-trail/.
Paulsen, Carl G. | HURRICANE FLOODS OF SEPTEMBER 1938.
Research Gate | “Hardiness Zone Map (USDA 2012).” https://www. researchgate.net/figure/Hardiness-zone-map-USDA-2012_fig2_337129170. Accessed 16 Mar. 2025.
ResilientMass | MA Climate Change Clearinghouse. https://resilient.mass. gov/mvp/. Accessed 18 Mar. 2025.
ResilientMass Climate | ResilientMass Climate Hub. https://resilientmamapcenter-mass-eoeea.hub.arcgis.com/. Accessed 19 Mar. 2025.
Robertson, Kevin M., et al. | “Introduction to Fire Ecology of the Northeast: Restoring Native and Cultural Ecosystems.”Journal of Sustainable Forestry, Oct. 2024. ResearchGate. https:/www.researchgate.net/ publication/286071639_Introduction_to_fire_ecology_of_the_Northeast_ Restoring_native_and_cultural_ecosystems.
Scarlett, Jazmin P. | “The Harmful Legacy of Colonialism in Natural Hazard
Risk.” Nature Communications, vol. 13, no. 1, Nov. 2022, p. 6945. www. nature.com, https://doi.org/10.1038/s41467-022-34792-7.
Scientific American | Climate Science Predictions Prove Too Conservative | Scientific American. https://www.scientificamerican.com/article/climatescience-predictions-prove-too-conservative/. Accessed 20 Mar. 2025.
Stafford, Scott | “Blizzard of 1978 Slammed Region Exactly 35 Years Ago.” The Berkshire Eagle, 8 Feb. 2013, https://www.berkshireeagle.com/news/ local/blizzard-of-1978-slammed-region-exactly-35-years-ago/ article_01779679-36d0-56b2-94fb-71adcd06cfb2.html.
Stand.earth | Do You Live in an Oil Train Blast Zone? - Stand.Earth. https:// stand.earth/resources/do-you-live-in-an-oil-train-blast-zone/. Accessed 19 Mar. 2025.
Stevens, Lauren R. | “The Hoosic Matters: A Brief History of the Hoosac Valley.” Williamstown Historic Museum, 2014. https://www. williamstownhistoricalmuseum.org/wp-content/uploads/2020/07/HoosicHistory_11_2014-1.pdf
Stockbridge-Munsee Mohicans | https://www.mohican.com/. Accessed 19 Mar. 2025.
Strahan, Derek | “Florida Baptist Church, Florida, Mass.” Lost New England, 21 Nov. 2021, https://lostnewengland.com/2021/11/ florida-baptist-church-florida-mass/.
Town of Florida Website | Town of Florida Official Website, https://www. townofflorida.org/. Accessed 10 Apr. 2025.
USA.com | Berkshire County, MA Natural Disasters and Weather Extremes - USA.ComTM. http://www.usa.com/berkshire-county-ma-natural-disastersextremes.htm#TornadoIndex. Accessed 8 Mar. 2025.
USDA | 2023 USDA Plant Hardiness Zone Map | USDA Plant Hardiness Zone Map. https://planthardiness.ars.usda.gov/. Accessed 16 Mar. 2025.
USGS | USGS WaterWatch -- Streamflow Conditions. https://waterwatch. usgs.gov/index.php?id=wwchart_ftc&site_no=01168500. Accessed 8 Mar. 2025.
Weather.gov | Ice Storm December 11th-12th, 2008 - 10th Anniversary. https://www.weather.gov/aly/IceStormDec2008. Accessed 8 Mar. 2025.
Wiki | Hoosac Wind Power Project - Wikipedia. https://en.wikipedia.org/ wiki/Hoosac_Wind_Power_Project. Accessed 27 Mar. 2025.
Wikimedia | 2012_USDA_Plant_Hardiness_Zone_Map_(USA).Jpg 10,800×7,200 Pixels. https://upload.wikimedia.org/wikipedia/ commons/5/58/2012_USDA_Plant_Hardiness_Zone_Map_%28USA%29. jpg. Accessed 16 Mar. 2025.
Wikipedia | “Hurricane Irene.” Wikipedia, 28 Jan. 2025. https://en. wikipedia.org/w/index.php?title=Hurricane_Irene&oldid=1272494664.
Brown, James K., and Jane Kapler Smith | Wildland Fire in Ecosystems: Effects of Fire on Flora. RMRS-GTR-42-V2, U.S. Department of Agriculture, Forest Service, Rocky Mountain Research Station, 2000, p. RMRS-GTR42-V2. DOI.org (Crossref), https://doi.org/10.2737/RMRS-GTR-42-V2.
BRPC | “Community Development Plan, Town of Florida, 2003” Berkshire Regional Planning Commission.
Cale, Jonathan A., et al. | “Beech Bark Disease in North America: Over a Century of Research Revisited.” Forest Ecology and Management, vol. 394, June 2017, pp. 86–103. ScienceDirect, https://doi.org/10.1016/j. foreco.2017.03.031.
Cornell | Spongy Moth | CALS. https://cals.cornell.edu/new-york-stateintegrated-pest-management/outreach-education/whats-bugging-you/ spongy-moth. Accessed 13 Mar. 2025.
Duan, J. | Progress toward Successful Biological Control of the Invasive Emerald Ash Borer in the United States.
Estuary | Deerfield River, Estuary Magazine: For People Who Care about the Connecticut River. https://www.estuarymagazine.com/2021/09/deerfieldriver/. Accessed 19 Mar. 2025.
Flower, Charles E., et al. | “Impacts of the Emerald Ash Borer (Agrilus Planipennis Fairmaire) Induced Ash (Fraxinus Spp.) Mortality on Forest Carbon Cycling and Successional Dynamics in the Eastern United States.” Biological Invasions. 15(4): 931-944., vol. 15, 2013, pp. 931–44. research.fs. usda.gov, https://doi.org/10.1007/s10530-012-0341-7.
GLAD | Global Forest Change. https://glad.earthengine.app/view/globalforest-change#bl=off;old=off;dl=1;lon=-72.16243531515393;lat=42.10218 2033146114;zoom=10; Accessed 14 Mar. 2025.
Gougherty, Andrew V., and Jonathan T. Davies. | “Towards a Phylogenetic Ecology of Plant Pests and Pathogens.” Philosophical Transactions of the Royal Society B, Nov. 2021. world, royalsocietypublishing.org, https://doi. org/10.1098/rstb.2020.0359.
Grimaldi, David | “What Trees Do Asian Longhorned Beetles Eat.” Entomology Blog, 15 Feb. 2024, https://blog.entomologist.net/which-treesare-consumed-by-asian-longhorned-beetles.html.
Integrated List | Integrated Lists of Waters & Related Reports | Mass.Gov. https://www.mass.gov/lists/integrated-lists-of-waters-related-reports. Accessed 19 Mar. 2025.
Integrated List GIS | MassGIS Data: MassDEP 2022 Integrated List of Waters (305(b)/303(d)) | Mass.Gov. https://www.mass.gov/info-details/ massgis-data-massdep-2022-integrated-list-of-waters-305b303d. Accessed 19 Mar. 2025.
Invasive Species Center | “Emerald Ash Borer - Profile.” Invasive Species Centre, https://www.invasivespeciescentre.ca/invasive-species/meet-thespecies/invasive-insects/emerald-ash-borer/. Accessed 12 Mar. 2025.
Janowiak, Maria, et al. | “ Managing Forests for Climate Change in Massachusetts.” Mass.Gov. https://www.mass.gov/doc/managing-forests-for-
climate-change-in-massachusetts-forester-guide/download.
Kibbe, Esther | Beech Bark Disease. https://ohioline.osu.edu/factsheet/ plpath-tree-09. Accessed 12 Mar. 2025.
MA Audubon | Climate-Smart Forestry Resources. https://www. massaudubon.org/our-work/resilient-lands/climate-smart-forestry-resources. Accessed 23 Mar. 2025.
DACF | Hemlock Woolly Adelgid Overview: Forest Health & Monitoring: Maine Forest Service: Maine DACF. https://www.maine.gov/dacf/mfs/ forest_health/insects/hemlock_woolly_adelgid_overview. htm#:~:text=Hemlock%20Woolly%20Adelgid%20 (Uh%2Ddell,extensive%20tree%20decline%20and%20mortality.Accessed 11 Mar. 2025.
FRCOG | Final-Monroe-2021-HMP. https://frcog.org/wp-content/ uploads/2018/04/Final-Monroe-2021-HMP.pdf. Accessed 18 Mar. 2025.
MassGIS | MassGIS Data: BioMap: The Future of Conservation | Mass.Gov. https://www.mass.gov/info-details/massgis-data-biomap-the-future-ofconservation. Accessed 19 Mar. 2025.
Mass.gov, A | Asian Longhorned Beetle in Massachusetts | Mass.Gov. https:// www.mass.gov/guides/asian-longhorned-beetle-in-massachusetts. Accessed 12 Mar. 2025.
Mass.gov, B | Spongy Moth in Massachusetts | Mass.Gov. https://www.mass. gov/guides/spongy-moth-in-massachusetts. Accessed 13 Mar. 2025.
Mass.gov, C | Lyme Disease | Mass.Gov. https://www.mass.gov/info-details/ lyme-disease. Accessed 27 Mar. 2025.
MassGov, D | Municipal Vulnerability Preparedness Program Action Grant Projects | Mass.Gov. https://www.mass.gov/info-details/municipalvulnerability-preparedness-program-action-grant-projects. Accessed 26 Mar. 2025.
MassWoods | “Natural Resource Protection Zoning.” MassWoods, UMassAmherst. https://masswoods.org/sites/masswoods.net/files/pdf-docppt/natural_resources_protection_zoning.pdf
Mass NRC | Massachusetts Introduced Pests Outreach Blog » Blog Archive » New “Asian Longhorned Beetle Look-Alikes” Mini-Poster Available. https://massnrc.org/pests/blog/?p=122. Accessed 12 Mar. 2025.
Mayo Clinic | “Lyme Disease - Symptoms and Causes.” Mayo Clinic, https:// www.mayoclinic.org/diseases-conditions/lyme-disease/symptoms-causes/ syc-20374651. Accessed 12 Mar. 2025.
Michigan Invasives | Beech Leaf Disease. https://www.michigan.gov/ invasives/id-report/disease/beech-leaf-disease. Accessed 16 Mar. 2025.
Murray, Helena and Paul Catanzaro | “Fiscal Impacts of Land Use in Massachusetts: Up-to date Cost of Community Services Analyses for 4 Massachusetts Communities.” UMass, 2019. https://masswoods.org/sites/ masswoods.org/files/pdf-doc-ppt/cost%20of%20community%20services%20 for%20four%20towns.pdf
Mwangola, Dorah M., et al. | “Associational Protection of Urban Ash Trees Treated with Systemic Insecticides against Emerald Ash Borer.” Frontiers in
Insect Science, vol. 3, Feb. 2023. Frontiers, https://doi.org/10.3389/ finsc.2023.990909.
The Nature Conservancy, A | Northeast Habitat Map. https://www.maps.tnc. org/nehabitatmap/. Accessed 19 Mar. 2025.
The Nature Conservancy, B | Terrestrial Habitat Guides. https:// conservationgateway.org/ConservationByGeography/NorthAmerica/ UnitedStates/edc/reportsdata/hg/terrestrial/Pages/default.aspx. Accessed 19 Mar. 2025.
NOAA, A | 5 Reasons Why We Love Wetlands | NOAA Fisheries. https:// www.fisheries.noaa.gov/feature-story/5-reasons-why-we-love-wetlands. Accessed 19 Mar. 2025.
NOAA, B | PF Map: Contiguous US. https://hdsc.nws.noaa.gov/pfds/pfds_ map_cont.html?bkmrk=ma. Accessed 15 Mar. 2025.
Norman, Calvin | Beech Leaf Disease. https://extension.psu.edu/beech-leafdisease. Accessed 26 Mar. 2025.
Northern Woodlands | What Is Forest Fragmentation and Why Is It A… | Autumn 2014 | Articles | Woods Whys. https://northernwoodlands.org/ articles/article/forest-fragmentation. Accessed 26 Mar. 2025.
NPS | Resilient Forests Initiative - Managing Invasive Plants & Pests (U.S. National Park Service). https://www.nps.gov/articles/000/managingresilient-forests-initiative-plants.htm. Accessed 13 Mar. 2025.
NYSDEC | Spongy Moth - NYSDEC. https://dec.ny.gov/nature/animalsfish-plants/insects-and-other-species/spongy-moth. Accessed 13 Mar. 2025.
Opperman, Jeffrey J., and Gerald E. Galloway | “Nature-Based Solutions for Managing Rising Flood Risk and Delivering Multiple Benefits.” One Earth, vol. 5, no. 5, May 2022, pp. 461–65. ScienceDirect, https://doi. org/10.1016/j.oneear.2022.04.012.
Peterson, Georgia | “Is It Beech Bark Disease?” MSU Extension, 11 Nov. 2016, https://www.canr.msu.edu/news/is_it_beech_bark_disease.
Tick Check | Reports of Lyme Disease in Berkshire County, Massachusetts. https://www.tickcheck.com/stats/county/massachusetts/berkshire-county/ lyme. Accessed 27 Mar. 2025.
Sims, Katharine R. E., et al. | “Assessing the Local Economic Impacts of Land Protection.” Conservation Biology, vol. 33, no. 5, Oct. 2019, pp. 1035–44. DOI.org (Crossref), https://doi.org/10.1111/cobi.13318.
Snyder, Michael | Woods Whys: Can Forests Prevent or Mitigate Floods? | Summer 2012 | Articles | Woods Whys. 19 June 2012, https:// northernwoodlands.org/articles/article/ can-forests-prevent-or-mitigate-floods.
Staying Connected Initiative | Staying Connected Initiative - Conserve, Restore, and Enhance., https://stayingconnectedinitiative.org/. Accessed 19 Mar. 2025.
UCANR | What Is Integrated Pest Management (IPM)? / UC Statewide IPM Program (UC IPM). https://ipm.ucanr.edu/what-isipm/#:~:text=Definition%20of%20IPM,-IPM%20is%20 an&text=What%20is%20a%20pest%3F,may%20be%20just%20a%20
nuisance.&gsc.tab=0. Accessed 15 Mar. 2025.
University of Wisconsin | “Favored Trees and Shrubs.” Spongy Moth in Wisconsin, https://fyi.extension.wisc.edu/spongymothinwisconsin/pestmanagement-2/favored-trees-and-shrubs/. Accessed 27 Mar. 2025.
UOM | “Sawyer Beetles - Home and Garden IPM from Cooperative Extension - University of Maine Cooperative Extension.” Home and Garden IPM from Cooperative Extension, https://extension.umaine.edu/home-andgarden-ipm/fact-sheets/common-name-listing/sawyer-beetles/. Accessed 13 Mar. 2025.
USDA, A | Questions and Answers: Biological Control for Emerald Ash Borer. Accessed 12 Mar. 2025.
USDA, B | Spongy Moth | Animal and Plant Health Inspection Service. https://www.aphis.usda.gov/plant-pests-diseases/spongy-moth. Accessed 13 Mar. 2025.
USDA, C | “Assessment & Applied Sciences.” US Forest Service, 12 Apr. 2022, https://www.fs.usda.gov/science-technology/forest-health-protection/ assessment-applied-sciences.
USFS, A | Keetch-Byram Drought Index (KBDI) – U.S. Forest Service | Drought.Gov. https://www.drought.gov/data-maps-tools/keetch-byramdrought-index. Accessed 19 Mar. 2025.
USFS, B | “Forest Health Protection.” US Forest Service, 12 Apr. 2022, https://www.fs.usda.gov/science-technology/forest-health-protection.
USFS, C | “Spongy Moth a Growing Forest Health Threat, Keeping Managers on Their Toes.” US Forest Service, 23 Jan. 2023, https://www.fs.usda.gov/ inside-fs/delivering-mission/sustain/ spongy-moth-growing-forest-health-threat-keeping-managers.
USFS, D | “Beech Leaf Disease: An Emerging Forest Threat in Eastern U.S.” US Forest Service, 15 Sept. 2023, https://www.fs.usda.gov/inside-fs/ delivering-mission/sustain/ beech-leaf-disease-emerging-forest-threat-eastern-us.
UVM | Asian Longhorned Beetle Public Identification. https://www.uvm. edu/albeetle/identification/. Accessed 13 Mar. 2025.
Vermont Invasives, A | Asian Longhorned Beetle | Vermont Invasives. https:// vtinvasives.org/invasive/asian-longhorned-beetle. Accessed 12 Mar. 2025.
Vermont Invasives, B | Beech Bark Disease | Vermont Invasives. https:// vtinvasives.org/invasive/beech-bark-disease. Accessed 26 Mar. 2025.
Vermont Invasives, C | Identify Emerald Ash Borer | Vermont Invasives. https://vtinvasives.org/land/emerald-ash-borer-vermont/identify-emeraldash-borer. Accessed 12 Mar. 2025.
ASDS | Dam Failures and Incidents | Association of State Dam Safety. https://damsafety.org/dam-failures. Accessed 24 Mar. 2025.
Berkshire Eagle | What Hazardous Materials Are Trains Carrying through the Berkshires? After the Recent Train Derailments, We Asked and This Is What We Found out ... | Local News | Berkshireeagle.Com. https://www. berkshireeagle.com/news/local/train-derailment-accidents-whats-in-trainsgoing-through-berkshire-county-mass/article_e37aed46-b9dd-11ed-8fa7a7a3f6151035.html. Accessed 19 Mar. 2025.
Best Places | Florida, MA Climate. https://www.bestplaces.net/climate/city/ massachusetts/florida. Accessed 20 Mar. 2025.
Chelmsford, MA | What Is Stormwater and Why Does It Matter? | Chelmsford, MA - Official Website. https://www.chelmsfordma.gov/513/ General-Stormwater-Information. Accessed 19 Mar. 2025.
CISA | Torrential Flooding https://www.cisa.gov/topics/criticalinfrastructure-security-and-resilience/extreme-weather/torrentialflooding#:~:text=Large%20floods%20can%20damage%20 roadways,threats%20made%20possible%20by%20increased. Accessed 9 Mar. 2025.
Civil Web | “Rational Method Runoff Coefficient - CivilWeb Drainage Design Spreadsheets.” CivilWeb Spreadsheets, https://civilweb-spreadsheets. com/drainage-design-spreadsheets/runoff-and-rainfall-intensity-calculatorspreadsheet/rational-method-runoff-coefficient/. Accessed 27 Mar. 2025.
Clarence Fanto | “Tropical Storm Irene Five Years Later: ‘A Lot Worse than Anybody Thought.’” The Berkshire Eagle, 29 Aug. 2016, https://www. berkshireeagle.com/archives/tropical-storm-irene-five-years-later-a-lot-worsethan-anybody-thought/article_6eaf0cbd-a6d8-5915-b97e-33a1c9f438e9. html.
Climate Central | After the Storm: Damp, Moldy Homes | Climate Central. https://www.climatecentral.org/climate-matters/after-the-storm-dampmoldy-homes-2023. Accessed 10 Mar. 2025.
Coveragemap | CoverageMap.Com | Crowdsourced Maps of Cellular Networks. https://coveragemap.com/. Accessed 28 Mar. 2025.
DOTW | Sherman Dam, Massachusetts, USA | Info & Map. https:// damsoftheworld.com/usa/massachusetts/sherman-dam. Accessed 19 Mar. 2025.
Earth Justice | What You Should Know About Liquefied Natural Gas and Rail Tanker Cars - Earthjustice. https://earthjustice.org/feature/liquefiednatural-gas-lng-by-rail-tanker-car. Accessed 19 Mar. 2025.
EPA | Threats to Wetlands. Accessed 3 Mar. 2029.
EWG | Interactive Map: PFAS Contamination Crisis: New Data Show 9,166 Sites in 50 States. http://www.ewg.org/interactive-maps/pfas_ contamination/map/. Accessed 28 Mar. 2025.
Fanto, Clarence | “Tropical Storm Irene Five Years Later: ‘A Lot Worse than Anybody Thought.’” The Berkshire Eagle, 29 Aug. 2016, https://www. berkshireeagle.com/archives/tropical-storm-irene-five-years-later-a-lot-worse-
than-anybody-thought/article_6eaf0cbd-a6d8-5915-b97e-33a1c9f438e9. html.
First Street | PR_The-Precipitation-Problem. https://assets.firststreet.org/ uploads/2023/06/PR_The-Precipitation-Problem.pdf. Accessed 7 Apr. 2025.
FRCOG | Final-Monroe-2021-HMP. https://frcog.org/wp-content/ uploads/2018/04/Final-Monroe-2021-HMP.pdf. Accessed 18 Mar. 2025.
GR 5 | Deerfield No. 5 Station - Great River Hydro. https://www. greatriverhydro.com/facilities-location/no-5-hydropower-station/. Accessed 19 Mar. 2025.
GR Harriman | Harriman Station - Great River Hydro. https://www. greatriverhydro.com/facilities-location/harriman-hydropower-station/. Accessed 19 Mar. 2025.
GR Sherman | Sherman Station - Great River Hydro. https://www. greatriverhydro.com/facilities-location/sherman-hydropower-station/. Accessed 19 Mar. 2025.
HPD, A | Culverts | Types of Culverts| Box Culverts | Pipe Culverts | Arch Culverts (Updated 2025). 30 Dec. 2020, https://www.hpdconsult.com/ types-of-culverts/.
HPD, B | What Is The Difference Between Bridge And Box Culvert? 18 Nov. 2019, https://www.hpdconsult.com/ what-is-the-difference-between-bridge-and-box-culvert/.
MACC | Wetlands Protection Act FAQ’s - Massachusetts Association of Conservation Commissions. https://www.maccweb.org/page/ ResWPAFAQS#:~:text=In%20their%20natural%20state%2C%20 wetlands,and%20trap%20sediment%20and%20debris.Accessed 10 Mar. 2025.
MassDEP | Inactlf. https://www.mass.gov/files/documents/2017/01/vt/ inactlf.pdf. Accessed 8 Apr. 2025.
MassGov, A | Drought Status | Mass.Gov. https://www.mass.gov/infodetails/drought-status. Accessed 19 Mar. 2025.
MassGov, B | Information for Private Well Owners During a Drought | Mass. Gov. https://www.mass.gov/info-details/information-for-private-wellowners-during-a-drought. Accessed 19 Mar. 2025.
MassGov, C | Municipal Vulnerability Preparedness Program Action Grant Projects | Mass.Gov. https://www.mass.gov/info-details/municipalvulnerability-preparedness-program-action-grant-projects. Accessed 26 Mar. 2025.
Morsy, Mohamed M., et al. | “Quantifying the Impact of Climate Change on Peak Stream Discharge for Watersheds of Varying Sizes in the Coastal Plain of Virginia.” Journal of Hydrologic Engineering, vol. 29, no. 3, June 2024, p. 04024012. DOI.org (Crossref), https://doi.org/10.1061/JHYEFF. HEENG-6114.
Murphy, Sara | “Six Months After Hurricane Helene, Child Care in N.C. Still Recovering.” Governing, 25 Mar. 2025, https://www.governing.com/policy/ six-months-after-hurricane-helene-child-care-in-n-c-still-recovering.
National Observer | The Scary Truth about “Bomb Trains” Moving through
Your Town | Canada’s National Observer: Climate News. https://www. nationalobserver.com/2016/07/04/news/flirting-disaster-scary-truth-aboutbomb-trains-moving-through-your-town. Accessed 19 Mar. 2025.
NOAA, A | PF Map: Contiguous US. https://hdsc.nws.noaa.gov/pfds/pfds_ map_cont.html?bkmrk=ma. Accessed 9 Mar. 2025.
NOAA, B | US Department of Commerce. Social Media: Flood Safety. NOAA’s National Weather Service, https://www.weather.gov/wrn/fall2017flood-sm. Accessed 23 Mar. 2025.
NOAA, C | Turn Around Don’t Drown®. NOAA’s National Weather Service, https://www.weather.gov/safety/flood-turn-around-dont-drown. Accessed 9 Mar. 2025.
Pakdehi, M., et al. | “Modeling the Latent Impacts of Extreme Floods on Indoor Mold Spores in Residential Buildings: Application of Machine Learning Algorithms.” Environment International, vol. 196, Feb. 2025, p. 109319. ScienceDirect, https://doi.org/10.1016/j.envint.2025.109319.
Papin, Philippe P., et al. | “A Climatology of Central American Gyres.” Monthly Weather Review, vol. 145, no. 5, May 2017, pp. 1983–2000. DOI. org (Crossref), https://doi.org/10.1175/MWR-D-16-0411.1.
Read, Zoë | Drexel University Researches Alternative to Road Salt - WHYY. https://whyy.org/articles/drexel-university-researchers-road-salt-alternativeself-heating-concrete/. Accessed 20 Mar. 2025.
Schofield | Greenfield Recorder. Roadwork, School Planning on Tap for West County Towns in 2025. 2 Jan. 2025, https://www.recorder.com/ Roadwork-school-planning-on-tap-for-West-Countytowns-in-2025-58567197.
Skibba, Ramin | Here’s Why FEMA’s Flood Maps Are so Terrible. https:// slate.com/technology/2017/09/heres-why-femas-flood-maps-are-so-terrible. html. Accessed 9 Mar. 2025.
SledMass | “Florida Mountaineers Snowmobile Club.” Snowmobile Association of Massachusetts, 29 June 2021, https://www.sledmass.com/ florida-mountaineers-snowmobile-club/.
Stand.earth | Do You Live in an Oil Train Blast Zone? - Stand.Earth. https:// stand.earth/resources/do-you-live-in-an-oil-train-blast-zone/. Accessed 19 Mar. 2025.
Stanford | Dam Failures in the U.S. | National Performance of Dams Program. https://npdp.stanford.edu/dam_failures_us. Accessed 24 Mar. 2025.
Steenberger and Keller | Frank van Steenbergen and Gordon Keller. “Culverts and Climate.” TheWaterChannel, 3 Apr. 2024, https://thewaterchannel.tv/ thewaterblog/culverts-and-climate/.
Stein, Josh | Open. https://www.osbm.nc.gov/hurricane-helene-recoveryfederal-request-feb-2025/open. Accessed 10 Mar. 2025.
Susquehanna | Steps to Prevent Stormwater Runoff Pollution | Susquehanna PA. https://www.susquehannatwp.com/stormwater-management/pages/ steps-prevent-stormwater-runoff-pollution. Accessed 23 Mar. 2025.
TNC, A | Culvert_newsletter_3. https://www.nature.org/media/ newhampshire/culvert_newsletter_3.pdf. Accessed 9 Mar. 2025.
TNC, B | “How Does the Bobcat Cross the Pike?” The Nature Conservancy, https://www.nature.org/en-us/about-us/where-we-work/united-states/ massachusetts/stories-in-massachusetts/mass-pike-wildlife-crossings/. Accessed 9 Mar. 2025.
UMASS | Guidelines_river_stream_crossings. https://www.umass.edu/ agriculture-food-environment/sites/ag.umass.edu/files/interest-topic-pdfs/ guidelines_river_stream_crossings.pdf. Accessed 28 Mar. 2025.
USFS | Culverts for Climate Resilience: Developing the CULVERT Tool. June 2024. research.fs.usda.gov, https://research.fs.usda.gov/srs/projects/ culvert-resilience-tool.
USFWS | Culvert Design Guidelines for Ecological Function | U.S. Fish & Wildlife Service. https://www.fws.gov/alaska-culvert-design-guidelines. Accessed 12 Mar. 2025.
USEPA | OW. Why Are Wetlands Important? 9 Apr. 2015, https://www.epa. gov/wetlands/why-are-wetlands-important.
VCG | “7 Benefits of Using Large Box Culverts in Modern Construction.” The Visual Communication Guy, 18 Dec. 2024, https:// thevisualcommunicationguy. com/2024/12/18/7-benefits-of-using-large-box-culverts-in-modernconstruction/.
Wiki Bear | Bear Swamp Hydroelectric Power Station - Wikipedia. https:// en.wikipedia.org/wiki/Bear_Swamp_Hydroelectric_Power_Station. Accessed 19 Mar. 2025.
Wiki Harriman | Harriman Dam - Wikipedia. https://en.wikipedia.org/wiki/ Harriman_Dam. Accessed 19 Mar. 2025.
Wiki List | List of Hydroelectric Power Stations in the United StatesWikipedia. https://en.wikipedia.org/wiki/List_of_hydroelectric_power_ stations_in_the_United_States. Accessed 19 Mar. 2025.
Wiki Yankee | Yankee Rowe Nuclear Power Station - Wikipedia. https://en. wikipedia.org/wiki/Yankee_Rowe_Nuclear_Power_Station. Accessed 19 Mar. 2025.
Yankee | Yankee Rowe — Fuel Storage. https://yankeerowe.com/fuelstorage/. Accessed 19 Mar. 2025.
Yang, Miaomiao, et al. | “Effects of Soil Rock Fragment Content on the USLE-K Factor Estimating and Its Influencing Factors.” International Soil and Water Conservation Research, vol. 11, no. 2, June 2023, pp. 263–75. ScienceDirect, https://doi.org/10.1016/j.iswcr.2022.07.003
Census.gov | Explore Census Data. https://data.census.gov/profile/Florida_ town,_Berkshire_County,_Massachusetts?g=060XX00US2500324120. Accessed 23 Mar. 2025.
Census Reporter | Florida Town, Berkshire County, MA - Profile DataCensus Reporter. https://censusreporter.org/profiles/06000US2500324120florida-town-berkshire-county-ma/. Accessed 23 Mar. 2025.
Crisis Relief and Recovery (CRR) | Basic Survival Kit. https://crrtraining. thinkific.com/courses/basic-survival-kit. Accessed 25 Mar. 2025.
CRR | Operation BLUE RIDGE Impact Report – Crisis Relief and Recovery. https://www.crisisreliefandrecovery.org/operation-blue-ridge-impact-report/. Accessed 25 Mar. 2025.
Davis, Molly | “Western North Carolina Roads Closed, Travel Nearly Impossible after Helene.” The Asheville Citizen Times, https://www.citizentimes.com/story/news/local/2024/09/29/what-roads-are-open-in-westernnc-asheville-road-closures-today/75440942007/. Accessed 27 Mar. 2025.
DHS | Planning Considerations: Evacuation and Shelter-in-Place - Guidance for State, Local, Tribal and Territorial Partners.
ESRI | Experience. https://experience.arcgis.com/experience/60e419d78cb5 493a91641ffa3c160dd6/page/GEAR-Maps?views=Community-LegendView. Accessed 23 Mar. 2025.
FEMA | Fema_shelter-in-Place_guidance. https://www.fema.gov/sites/ default/files/documents/fema_shelter-in-place_guidance.pdf. Accessed 24 Mar. 2025.
GEAR | Guide - GEAR. https://resilient.mass.gov/gear/Guide?guideId=1. Accessed 23 Mar. 2025.
Huang, Lawrence | “Climate Migration 101: An Explainer.” Migrationpolicy. Org, 14 Nov. 2023, https://www.migrationpolicy.org/article/ climate-migration-101-explainer.
IOM | Environmental Migration | IOM, UN Migration | Environmental Migration Portal. https://environmentalmigration.iom.int/environmentalmigration. Accessed 17 Mar. 2025.
MassGov | Municipal Vulnerability Preparedness Program Action Grant Projects | Mass.Gov. https://www.mass.gov/info-details/municipalvulnerability-preparedness-program-action-grant-projects. Accessed 26 Mar. 2025.
Morrow, Rosemary | It Doesn’t Have to Be like This | TEDxKatoomba. 2023. YouTube, https://www.youtube.com/watch?v=CEufG4u-IcA.
New America | Climate Migration’s Impact on Housing Security in the United States: Recommendations for Receiving Communities. http:// newamerica.org/future-land-housing/reports/climate-migrations-impact-onhousing-security/. Accessed 17 Mar. 2025.
NOAA | “Hurricane Helene: Record-Breaking Rainfall and Historic Flooding.” US Department of Commerce, NOAA’s National Weather Service, https://www.weather.gov/mrx/Hurricane_Helene. Accessed 25 Mar. 2025.
Simonton, Anna | The People in Charge Won’t Save Us From Climate Catastrophe. We’ll Need to Do It Ourselves. 5 Feb. 2025. www.thenation. com, https://www.thenation.com/?post_type=article&p=540269.
World Bank | Groundswell Report. https://www.worldbank.org/en/news/ press-release/2021/09/13/climate-change-could-force-216-million-peopleto-migrate-within-their-own-countries-by-2050. Accessed 8 Apr. 2025.
WPR | Median Household Income by State 2025. https:// worldpopulationreview.com/state-rankings/median-household-income-bystate. Accessed 23 Mar. 2025.