12. Projections for the m&e sector for 2021 and beyond The year 2020 was a rough year for the Manufacturing sector and the economy in general, amid COVID-19 lockdown regulations being implemented in March 2020. It is important to reiterate that the industry was under strain even before the pandemic hit. South African industrial base cannot be eroded any further. Fixed investment remains key to the revival of the sector. Yet South Africa’s level of Gross Fixed Investment to total GDP is been on average below 20% on average since 1994. To grow the industrial base of South Africa,
fixed investment share of GDP needs to move to levels above 40%, similar to other countries such as China at 42%. Government’s commitment to spur investment is commendable. This includes the R791.2 billion that is to spent on infrastructure projects over the next three fiscal years.
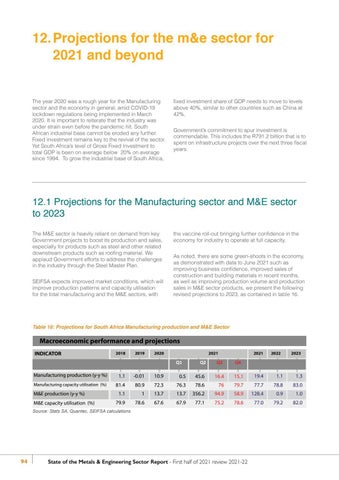
12.1 Projections for the Manufacturing sector and M&E sector to 2023 The M&E sector is heavily reliant on demand from key Government projects to boost its production and sales, especially for products such as steel and other related downstream products such as roofing material. We applaud Government efforts to address the challenges in the industry through the Steel Master Plan. SEIFSA expects improved market conditions, which will improve production patterns and capacity utilisation for the total manufacturing and the M&E sectors, with
the vaccine roll-out bringing further confidence in the economy for industry to operate at full capacity. As noted, there are some green-shoots in the economy, as demonstrated with data to June 2021 such as improving business confidence, improved sales of construction and building materials in recent months, as well as improving production volume and production sales in M&E sector products, we present the following revised projections to 2023, as contained in table 16.
Table 16: Projections for South Africa Manufacturing production and M&E Sector
Macroeconomic performance and projections INDICATOR
2018
2019
2020
2021
Q1
2021
Q2
Q3
Q4
2023
Manufacturing production (y-y %)
1.1
-0.01
10.9
0.5
45.6
16.4
15.1
19.4
1.1
1.3
Manufacturing capacity utilisation (%)
81.4
80.9
72.3
76.3
78.6
76
79.7
77.7
78.8
83.0
1.1
1
13.7
13.7
356.2
94.9
58.9
128.4
0.9
1.0
79.9
78.6
67.6
67.9
77.1
75.2
78.6
77.0
79.2
82.0
M&E production (y-y %) M&E capacity utilisation (%)
Source: Stats SA, Quantec, SEIFSA calculations
94
2022
State of the Metals & Engineering Sector Report - First half of 2021 review 2021-22


