13 minute read
1. Global economic overview – major economies


The global economy is expected to rebound in 2021 on expansive fiscal and monetary stances and the vaccine rollout. However, fast-spreading COVID-19 variants will lead to stop-start restrictions in some countries, weighing on activity. Potential vaccineresistant strains of the virus, supply constraints and US-China tensions pose downside risks. Global inflation is also expected to increase in 2021— particularly in developed economies—amid sizable stimulus, higher commodity prices, supply bottlenecks and recovering economic activity. However, inflation should decline in some developing economies amid reduced currency pressures and ongoing economic slack.
In the US, GDP growth accelerated to 6.5% in seasonally adjusted annualised rate terms in the second quarter of 2021, from 6.3% in the first quarter, although this figure considerably undershot market expectations.
Advertisement
Private consumption roared ahead with 11.8% growth in the second quarter, which was above the first quarter’s 11.4% expansion, driven by the return of Americans to restaurants and other in-person activities. However, public spending went into reverse, contracting 1.5% in second quarter of 2021 against 4.2% in first quarter of 2021. Meanwhile, fixed investment growth slowed, with only a 3.0% rise in the second quarter, marking the worst result since second quarter of 2020 against a first quarter 13.0% growth rate. This was likely due in part to supply bottlenecks, particularly in the construction sector, with a sharp fall in inventories of goods being testament to such difficulties. Economic activity in the eurozone is forecast to grow by 1.3% in the second quarter, before accelerating to 2.9% in the third, on the back of continued easing of containment measures and the resumption of social activities. Growth momentum in the fourth quarter is forecast to ease but to remain solid at 1.3%.
In 2022, the eurozone economy is expected to expand by 4.3%. According to the EU commission, some member states will see their economic output return to their precrisis levels already by the third quarter of 2021, but others will have to wait longer.
Among the largest member states, Poland is expected to have returned to pre-crisis levels of output in the second quarter of 2021 and Germany and the Netherlands in the third quarter, while Spain and Italy will do so one year after, in the third quarter of 2023.
Exports of goods and services bounced back, growing 6.0% in second quarter of 2021 against -2.9% in the first quarter. Conversely, growth in imports of goods and services slowed to 7.8% in the quarter versus first quarter 9.3% growth rate.
In Euro Area,detailed national accounts data revealed ththe two main reasons for the revision are that activity in the first quarter of the 2021 exceeded expectations and the improved health situation prompted a swifter easing of pandemic restrictions in the second quarter. Private consumption and investment are expected to be the main drivers of growth, supported by employment that is expected to move in tandem with economic activity. The swift reopening underway in the EU member states is bringing back spending opportunities earlier than previously expected. Strong growth in the EU’s main trading partners should also benefit goods exports. Furthermore, despite remaining constraints to international tourism, there is evidence of a revival in intraEU tourist activity, which should further benefit from the new EU Digital COVID Certificate.
Rising energy and commodity prices, production bottlenecks, as well as strong demand at home and abroad are expected to put upward pressure on consumer prices in 2021. The European Commission has revised its inflation forecasts to 1.9% in 2021, from 1.7% in the Spring forecasts and to 1.4% in 2022 from 1.3%. Although prices pressures in 2022 should moderate gradually as production constraints are resolved with supply and demand converging.
The economies in Euro Area have been able to reopen faster than expected thanks to an effective containment strategy and progress with vaccinations. Gross domestic product in the 19-member eurozone is expected to grow by 4.6% in 2021, according to IMF July 2021 projections. Uncertainty and risks surrounding the growth outlook are high, but remain balanced overall. The risks posed by the spread of COVID-19 variants underscore the importance of further increasing the pace of vaccinations.

In China, GDP growth lost momentum in the second quarter, falling to 7.9% year-on-year from 18.3% in the first quarter. The slowdown was influenced by the base effect growing less favourable, although underlying momentum—as indicated by comparing the quarters of 2021 to the same period in 2019—improved, with growth in second quarter of 2021 relative to second quarter of 2019 speeding up to 5.5% from 5.0% in first quarter of 2021. This shows the economy is still growing more sluggishly than its pre-COVID levels.
Adjusting for base effects, momentum in the secondary sector was broadly stable, likely weighed on by chip shortages affecting vehicle production, while the tertiary and primary sectors gained steam. In particular, consumer spending dynamics appeared to improve in second quarter of 2021, as demonstrated by faster growth in retail sales compared to the same period in 2019. Activity appeared to fluctuate during the quarter: After a weak set of data in May for indicators such as industrial output, fixed investment and retail sales, the figures for June were more positive than markets were expecting, suggesting a stronger end to the quarter.
On a seasonally-adjusted quarter-on-quarter basis, economic growth gathered pace, accelerating to 1.3% in second quarter of 2021, compared to the previous period’s 0.4% increase. According to the IMF, annual growth rates are expected to continue to moderate in the second half of the year on a less favourable base effect, and as consumption in developed markets pivots from goods to services, tempering China’s export sector. Moreover, downside risks to the economy are gathering, as higher raw material prices hurt firms’ profit margins and government restrictions on the property sector and efforts to reduce carbon emissions dampen activity.
Meanwhile in Africa, Sub-Saharan Africa’s GDP is seen increasing in 2021, supported by the gradual removal of restrictions. Pent-up foreign demand and recovering commodity prices are set to boost exports. That said, downside risks remain, including strained public finances and social unrest in several countries. The spread of the Delta strain and a slow vaccine drive cloud the outlook further.
Regional inflation dropped to a preliminary 13.0% in June, from May’s 13.5%, amid easing price pressures in Cote d’Ivoire, Nigeria and Zimbabwe, and declining consumer prices in Rwanda. Although inflation is seen dropping from last year as pandemic-induced supply chain disruptions fade, upside risks stem from higher price pressures for food and transport.
Table 4 below provides a summary of the IMF’s 2021 GDP projections for major economies.
Table 1: IMF GDP growth rates as of July 2021
IMF GDP GROWTH RATES
Region/country 2019 2020 2021 2022
Percentage Actual Projections
World 2.8 -3.2
6.0 4.9 Advanced economies 1.7 -4.6 5.60 4.4 United States 2.2 -3.5 7.0 4.9 Euro area 1.3 -6.5 4.6 4.3 United Kingdom 1.5 -9.8 7.0 4.8 Japan 0.7 -4.7 2.8 3.0 Emerging and 3.7 -2.1 6.3 5.2 Developing countries China 6.1 2.3 8.1 5.7 India 4.2 -7.3 9.5 8.5 Brazil 1.1 -4.1 5.3 1.9 Russia 1.3 -3.0 4.4 3.1 Sub-Saharan Africa 3.2 -1.8 3.4 4.1 Nigeria 2.2 -1.8 2.5 2.6 South Africa 0.2 -7.0 4.0 2.2
The above view on the global economy suggests that the global economy should rebound in 2021. However, more needs to be done to drive more COVID-19 vaccinations in developing and emerging economies.
1.2 Commodity prices
Commodity prices have influenced trends in manufacturing production over the years. The year 2020 will be remembered for the global COVID-19 pandemic, which put industrial and global trade activities on hold due to strict lockdown measures that Governments worldwide implemented mostly from March 2020. This led to a significant drop in commodity prices, especially in March and April 2020. In the first six month of 2021 to June, commodity prices have improved drastically for instance in the case of the five commodities being monitored by SEIFSA in the figure 1, prices across have increased by an average of 29% between January 2021 to June 2021 amid return to industrial activity global thus driving demand especially from countries such as China.
Figure 1: Global commodities prices- 2015 to 2021 June

Source: World Bank
1.2.1 Nickel
Nickel started the year trading at US$17,344, following an uncertain 2020 that saw the metal fall in Q1, but bounce back by the end of the year. Speculation surrounding demand for electric vehicle (EV) batteries drove prices last year, with many analysts agreeing that the metal’s valuation was not reflecting market fundamentals. So far in 2021, nickel’s story has been volatile. Prices hit their lowest point in early March at US$15,907 — just a few days after hitting their highest level of the period in late February at US$19,689. The nickel price tanked in early March after Tsingshan’s announcement that it would convert nickel pig iron (NPI) into nickel matte to serve the battery sector.
Further explaining the news and its impact on the sector which raised concern that potentially a substantial amount of the country’s vast NPI industry could adapt to satisfy demand for both the stainless steel and battery sectors. Nickel continued to perform in a choppy fashion throughout the first half and ended the six-month period

trading above US$18,000. This was due to strong demand from the stainless steel and battery sectors. The narrative for strong nickel demand from batteries amid President (Joe) Biden’s USA Green New Deal for an economic recovery, and general tightness in the nickel market, has also helped to support prices.
1.2.2 Steel prices
Much has happened in recent weeks in the steel and the stainless-steel commodities and finished product markets. Prices soared higher to record levels across the globe – particularly China, fuelled by speculation in the futures markets. China’s steel output hit an all-time high in April pushing production figures for the quarter up 15.6%. Mills ramped up to 90% capacity levels despite China’s government targeting to reduce industry capacity by 5% in 2021 to cut carbon emissions and stem increasing commodity prices.
In order to meet these targets and despite increasing demand and high prices the State Council had ordered steelmakers in Tangshan in North China’s Hebei province to cut output by 3050%. To put this directive in perspective, Tangshan produced 144 million tonnes of steel last year (~50% flat rolled products), accounting for 13.5% of China’s total output, 45% more than produced by the world’s second largest steelmaker, India. The production cuts in Tangshan instead pushed up Chinese domestic steel prices through March, April and May – as China’s businesses battled for supply to meet continuing growth in the construction, infrastructure and manufacturing sectors.
As a further measure to shore up domestic supply, slow the growth of carbon emissions and secure more steel resources domestically – China removed its’ 13% export tax rebate for 146 steel products and cut tariffs for ferrous / semi-finished steel imports effective 1st May 2021. This move resulted in a 13% increase in Asia-Pacific market prices.
Though China accounts for 30% of global manufacturing and 50% of steel product manufacturing, surging steel prices are a global story. Producers outside of China are scrambling to keep pace. Earlier this month, ArcelorMittal lifted its steel prices for the 12th time since November, taking a tonne of Hot Rolled Coil (HRC) in Europe to €1050 – up by more than 80%.
With USA HRC prices now $1,815 USD/T (up over 200% in 12 months) and trending higher, they remain attractive export markets for Chinese mills.
1.2.3 Iron ore prices
When the COVID-19 pandemic first hit, appetite for raw materials nosedived. As demand fell, so did commodity prices. At first, the cost of metals, such as copper and zinc, plummeted. The value of agricultural raw materials, like cotton and rubber, also fell sharply. And in a world first, oil recorded negative prices. But for other commodities, 2020 marked the beginning of a spectacular ascent, with prices rising to levels not seen for years. As the best-performing major commodity of 2020, iron ore prices became red hot, hitting a record high of US$229.50 a tonne in May 2021.
In recent months of 2021, the price of iron ore has wobbled as China’s State Council vowed to strengthen its management of commodity supply and demand. But despite setbacks, the value of iron ore has continued to climb, increasing by 103.25% in the last year. The reasons for this dramatic rise are several. As an essential steelmaking ingredient, iron ore continues to play a crucial role in the construction of skyscrapers, bridges, and motorways. It also serves as a critical component in manufacturing goods such as cars, fridges, and mobile telephones. With the roll-out of vaccines across the world’s largest economies stimulating growth, demand for stell from infrastructure projects and manufacturing has begun to recover. In turn, this increased demand has led iron ore prices to soar.
The surge in iron ore prices has been particularly underpinned by increased demand in China – by far the largest importer and consumer of iron ore globally. Indeed, China requires more than 1 billion tonnes of steel each year to feed its long-standing infrastructure and building boom. Returning to prepandemic growth rates at the end of 2020, China’s appetite for iron ore skyrocketed, with data released in May showing imports grew 43% in April year on year.
1.2.4 Copper prices
Copper prices reached an all-time high of $10,512 per metric ton on 9th of May 2021, marking a 130% growth since March 22, 2020. The consensus forecast from three leading sources (IMF, World Bank, and the Australian Government) for 2021 is $8,357. The average year-to-date price as of May 20 was $8,915, which means the forecasts do not reflect an expectation of further increases over the second half of the year.
The copper price growth over the course of the past year was driven primarily by the high demand from China, the top copper consumer, as well as growing optimism about the overall economic recovery in view of COVID-19 vaccine rollouts. The demand for copper is expected to rise further amid rising concerns about low copper inventories.
Copper is the most widely used metal in energy generation, transmission infrastructure, and energy storage. It is the next most used metal after aluminum and steel in the construction, telecommunications, transportation, and automobile manufacturing sectors. In the first six months of 2021 to June, Copper prices averaged US$9 091.67 /mt.
1.2.5 Aluminium prices
Aluminum futures traded near $2,600 a tonne, the highest since June 2011 on higher demand and tight supply as China suppresses smelting to reduce pollution and meet green targets. Aluminum producers in Yunnan province were told to reduce power consumption and smelter Yunnan Shenho is set to miss its 2021 output target due to the power cuts. Adding to the bullish tonne, China’s state reserves administration announced it will sell 90,000 tonnes of aluminum, less than the market expected following 50,000 tonnes sales on July 5th. Global aluminum consumption this year is seen rising 8% on the back of climate change investment.


As can be seen in Figure 2, the global JP Morgan Manufacturing PMI plunged to a lowest level in April 2020 of 39.6, reflecting the impact of hard COVID-19 lockdown restrictions on industrial activity globally. Thus, production levels also declined across the global M&E sector amid low demand conditions. As lockdown measures were being relaxed, industrial activity returned, with the PMI moving into expansionary territory of industrial activity.
In the first six months of 2021 to June, global PMI averaged 55 index level. Global PMI improved from 53.6 in January 2021 to June 55.5 index level.
Figure 2: Global manufacturing PMI Index in to June 2021
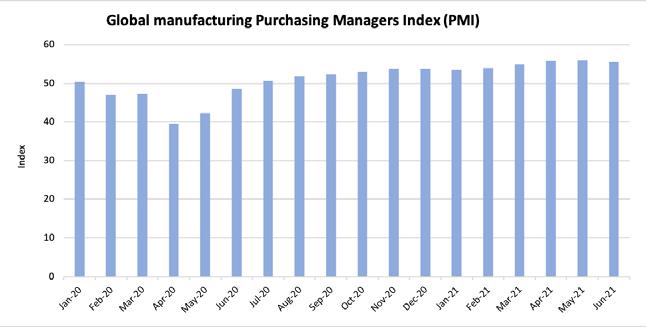
Source: HIS Markit