9 minute read
5. Employment trends in the Metals and Engineering Sector


5. Employment trends in the
Metals and Engineering Sector
Advertisement
The most recent unemployment rate of 34.4% reflects the devastating impact of the COVID-19 lockdown on employment and overall productivity across the economy.
According to Stats SA, the manufacturing sector, of which the M&E industry is a part, was one of the biggest contributors to the jobs bloodbath, with 83 000 jobs shed between the first quarter and second quarter of 2021. Stats SA It is important to note that job creation should be consolidated effort by both the Government and the private sector. Investment-driven economic recovery is crucial to preserving jobs. Therefore, the Government needs to focus on creating an enabling and business friendly environment, including providing policy certainty..
5.1 Employment in the Manufacturing Sector
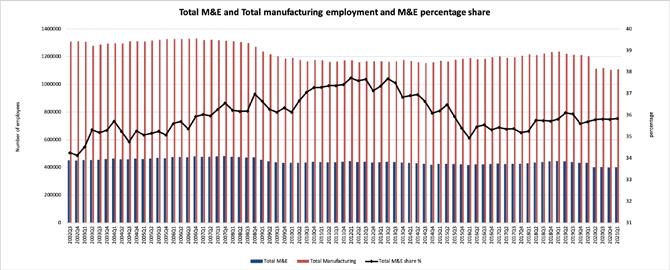
Within the manufacturing sector, from the period 2002 third quarter to 2020 quarter three, total employment has declined from 1.3 million to 1.1 million as depicted in figure 41. During the same period, total employment within the M&E sector also declined from 448 532 to 402 760, thus representing a decline of 10%. Total employment within the M&E sector represents 35.9% of the total employment in the manufacturing sector as of the third quarter of 2020. Between 2010 quarter one and 2012 quarter three, the share of M&E employment in total manufacturing was on the surge, reaching the highest level of 37.7%. Thereafter, this share dropped drastically to 34.9% in 2016 quarter one, its lowest level in the last five years to 2020, as major subsectors in the M&E sector experienced job shedding amid low production and demand.
In 2020, total manufacturing employment dropped from 1 203 743 in the first quarter to reach 1 104805 in the fourth quarter of 2020, with 98 938 jobs being lost in the year. Within the M&E sector, jobs dropped from 429 617 to 395 555, thus 34 062 jobs lost during the same period.
Figure 41: Total M&E and total manufacturing employment and M&E percentage share
Source: Quantec
5.2 Employment trends in the Metals and Engineering Sector
According to figure 42, during the period 2002 quarter three and 2020 quarter three, total employment in the rubber products sub-sector declined from 16 816 to 11 546, while that in the plastic products sub-sector also declined from 49 012 to 44 932. Within the plastic products sub-sector, massive job shedding took place from 2007 quarter four to 2010 quarter two, with 8 421 jobs being lost in the sub-sector, whilst within the rubber products sub-sector 4 016 jobs were lost between 2008 quarter three to 2010 quarter one.
The rubber products sub-sector lost 1 239 jobs between the first quarter of 2020 and the fourth quarter of 2020, whilst in the plastic products sub-sector 2 819 jobs were lost in the same period. In first quarter of 2021 compared to first quarter of 2020, rubber products sub-sectors lost 1 240 jobs whilst the plastic products sub-sector lost 3 006 jobs.
Figure 42: Rubber and Plastic Products Employment Trends

Source: Quantec
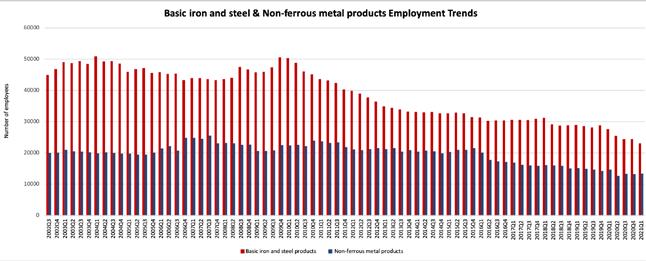
According to figure 43, during the period 2002 quarter three and 2020 quarter three, total employment in the basic iron and steel products sub-sector declined from 44 761 to 26 726, while that in the non-ferrous metal products sub-sector declined 19 897 to 13 215.
Within the basic iron and steel products sub-sector, massive job shedding took place from 2004 quarter one to 2006 quarter four, with 7 618 jobs being lost in the sub-sector, whilst within the non-ferrous metal products sub-sector 4 900 jobs were lost between 2007 quarter three and 2009 quarter two.
The basic iron and steel products sub-sector lost 3 270 jobs between the first quarter of 2020 and the fourth quarter of 2020, whilst in the non-ferrous metal products sub-sector 1 440 jobs were lost in the same period. In first quarter of 2021 compared to first quarter of 2020, basic iron and steel products sub-sectors lost 4 559 jobs whilst the non-ferrous metal products subsector lost 1 311 jobs.
Source: Quantec
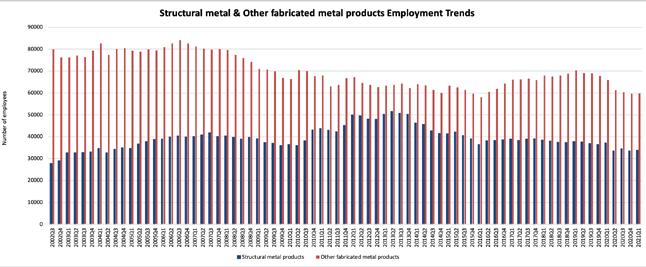
According to figure 44, during the period 2002 quarter three and 2020 quarter three, total employment in the structural metal products sub-sector increased from 27 836 to 34 518, while that in the other fabricated metal products sub-sector declined from 79 950 to 60 482.
Within the structural metal products sub-sector, massive job increases occurred between quarter two of 2010 and quarter two of 2013, with 15 649 jobs added into the sub-sector, even though thereafter the sub-sector started to shed jobs. Within the other fabricated metal products sub-sector, as many as 17 882 jobs were lost between 2006 quarter three and 2010 quarter one.
The structural metal products sub-sector lost 3 620 jobs between the first quarter of 2020 and the fourth quarter of 2020, whilst in the other fabricated metal products sub-sector 6 304 jobs were lost in the same period. In first quarter of 2021 compared to first quarter of 2020, structural metal products subsectors lost 3 418 jobs whilst the other fabricated metal products sub-sector lost 6 125 jobs.
Figure 44: Structural metal & Other fabricated metal products Employment Trends
Source: Quantec
According to figure 45, between quarter three of 2002 and quarter three of 2020, total employment in the General-purpose machinery sub-sector increased from 31 618 to 44 006, while that in the special purpose machinery products sub-sector increased from 49 218 to 63 127.
Within the General-purpose machinery products sub-sector, massive job increases occurred between quarter three of 2002 and quarter four of 2006, with 13 054 jobs added. Within the special purpose machinery products sub-sector, a high number of 12 133 jobs were added between 2002 quarter four to 2007 quarter two.
The General-purpose machinery metal products sub-sector lost 4 228 jobs between the first quarter of 2020 and the fourth quarter of 2020, whilst in the other special purpose machinery sub-sector 2 737 jobs were lost in the same period. In first quarter of 2021 compared to first quarter of 2020, General purpose machinery products sub-sectors lost 3 908 jobs whilst the special purpose machinery products sub-sector lost 2 683 jobs.
Figure 45: General purpose machinery & Special purpose machinery Employment Trends

Source: Quantec
According to figure 46, during the period 2002 quarter three and 2020 quarter three, total employment in the household appliances sub-sector declined from 6 752 to 5 692, while that in the electrical machinery products sub-sector increased marginally from 37 440 to 37 571.
Within the household appliances products sub-sector, massive job losses occurred between quarter three of 2005 and the first quarter of 2007, with 1 416 jobs lost. Within the electrical machinery products sub-sector, a high number of 7 750 jobs were added between 2009 quarter three to 2011 quarter four.
The household appliances products sub-sector gained 271 jobs between in the first quarter of 2020 and the fourth quarter of 2020, whilst in the electrical machinery sub-sector 2 890 jobs were lost in the same period. In first quarter of 2021 compared to first quarter of 2020, household appliances products subsectors gained 176 jobs whilst the electrical machinery products sub-sector lost 2 652 jobs.

Source: Quantec
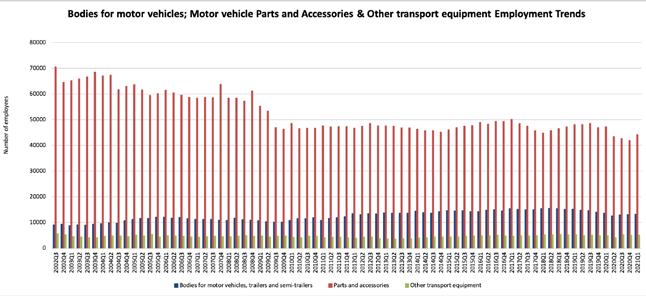
According to figure 47, between quarter three of 2002 and quarter three of 2020 total employment in the bodies for motor vehicles, trailers and semitrailers sub-sector increased from 9 076 to 13 048 and declined from 70 520 to 42 688 in the motor vehicle parts and accessories products sub-sector. In the other transport equipment sub-sector, employment declined marginally from 5 636 to 5 209.
Within the bodies for motor vehicles, trailers and semitrailers sub-sector, massive job increases occurred between quarter three of 2009 and quarter one of 2013, with 3 679 jobs added. Within the Parts and accessories for motor vehicles products sub-sector, a high number of 22 221 jobs were lost between 2003 quarter four and 2009 quarter four. The other transport equipment sub-sector experienced a massive job loss between 2010 quarter three and 2013 quarter one, with 1 140 jobs being lost.
The bodies for motor vehicles, trailers and semi-trailers sub-sector products sub-sector lost 547 jobs, motor vehicle parts and accessories sub-sector lost 5 290 jobs and other transport equipment sub-sector gained 151 jobs, thus between the first quarter of 2020 and the fourth quarter of 2020. In first quarter of 2021 compared to first quarter of 2020, bodies for motor vehicles, trailers and semi-trailers sub-sector lost 395 jobs whilst the motor vehicle parts and accessories sub-sector and the other transport equipment subsector lost 2 986 jobs and gained 76 jobs respectively.
Figure 47: Bodies for motor vehicles, motor vehicle parts and accessories, and other transport equipment
Employment Trends
5.3 Conclusion
A general conclusion that can be drawn from the above trends in employment for all M&E sub-sectors, in comparison with the previous sections on production trends, that during the times of a high pick-up in production trends, employment in the sub-sectors was also either high or increasing. This trend also correlates well with the time the country had a massive injection of infrastructure projects related to the 2010 Soccer World Cup, energy, roads, and the Gautrain, among others. As the projects were being completed, employment creation was also subdued, with similar trends depicted in production patterns, especially for the key infrastructure-related input supplying sub-sectors such as basic iron and steel products.
It is also clear that the manufacturing sector faced massive job losses over a longer period. In the short run, the COVID-19 lockdown restrictions put a dent on both the manufacturing sector and the M&E sub-sectors, with almost 100 000 jobs and 35 00 jobs lost respectively in 2020 alone. In the first quarter of 2021,
Employment in the overall Manufacturing sector has declined over the years to date. Overall total manufacturing employment contribution to the economy has declined from 17% in 2002 to 11.5% in first quarter of 2021.
Total employment in the key 13 subsectors increased by 2031 jobs between fourth quarter of 2020 and first quarter of 2021, representing a 0.5% increase. This reflects improved economic conditions, as we also saw productions patterns improving, under a more relaxed lockdown restriction. However, year on year, total employment in the M&E sector declined by 8%, from 429 617 in the first quarter of 2020 to 397 586 in the first quarter of 2021. In first quarter of 2021, total M&E employment improved by 2 031 from the fourth quarter of 2020, while total employment for entire Manufacturing sector improved by 4 431 in the same period.