RESPONSE TO RFP | AMAZON HQ2 | 43
1.16 0.69
0.91 1.11 1.35 1.23
$24,600 $42,100 $62,400 $31,000 $28,900 $38,300 $32,500 $33,100 $32,900
226 163 737 154 212 1,593 127 922
$46,400
$36,100
3,516 271 154 49 48 232
Metal-Refining Furnace Operators and Tenders
Pourers and Casters, Metal
Model Makers, Metal and Plastic
Patternmakers, Metal and Plastic
Foundry Mold and Coremakers Molding, Coremaking, and Casting Machine Setters, Operators, and Tenders, Metal and Plastic Multiple Machine Tool Setters, Operators, and Tenders, Metal and Plastic Tool and Die Makers
$40,800 $39,400
201 401 2,184 723 2,076 400 883 87 71
Metal Workers and Plastic Workers, All Other
Prepress Technician and Workers
Printing Press Operators
Print Binding and Finishing Workers
Laundry and Dry-Cleaning Workers
Pressers, Textile, Garment, and Related Materials
Sewing Machine Operators
Shoe and Leather Workers and Repairers
Shoe Machine Operators and Tenders
$27,300
$27,900
$25,500
$20,100
$21,800
$32,800
$36,000
$35,400
93
0.68
$46,300 $29,900
58 375
1.28
$41,800
236
2.38
0.90
0.65
0.95
1.05
1.52
1.38
1.30
0.97
0.98
1.16
0.68
$32,000
303
1.52 0.78
$39,400
$57,600
1,007
0.87
1.32
2.08
1.47
0.80
2.03
1.71
0.99
1.22
2,817
934
Welders, Cutters, Solderers, and Brazers Welding, Soldering, and Brazing Machine Setters, Operators, and Tenders Heat Treating Equipment Setters, Operators, and Tenders, Metal and Plastic Layout Workers, Metal and Plastic Plating and Coating Machine Setters, Operators, and Tenders, Metal and Plastic Tool Grinders, Filers, and Sharpeners
$32,700 $38,000
1,738
$45,700
$51,000
$31,100
$43,000
$38,400 $42,000
382 202
0.81
0.82
1.12
0.53
0.61
0.85
1,498
Food Processing Workers, All Other Computer-Controlled Machine Tool Operators, Metal and Plastic Computer Numerically Controlled Machine Tool Programmers, Metal and Plastic Extruding and Drawing Machine Setters, Operators, and Tenders, Metal and Plastic Forging Machine Setters, Operators, and Tenders, Metal and Plastic Rolling Machine Setters, Operators, and Tenders, Metal and Plastic Cutting, Punching, and Press Machine Setters, Operators, and Tenders, Metal and Plastic Drilling and Boring Machine Tool Setters, Operators, and Tenders, Metal and Plastic Grinding, Lapping, Polishing, and Buffing Machine Tool Setters, Operators, and Tenders, Metal and Plastic Lathe and Turning Machine Tool Setters, Operators, and Tenders, Metal and Plastic Milling and Planing Machine Setters, Operators, and Tenders, Metal and Plastic Machinists
$22,700
$30,500
207
LOCATION QUOTIENT
1,173
AVG. ANNUAL WAGES5
Food Cooking Machine Operators and Tenders
EMPL
Food Batchmakers
TITLE
CURRENT PAST 4 QUARTERS
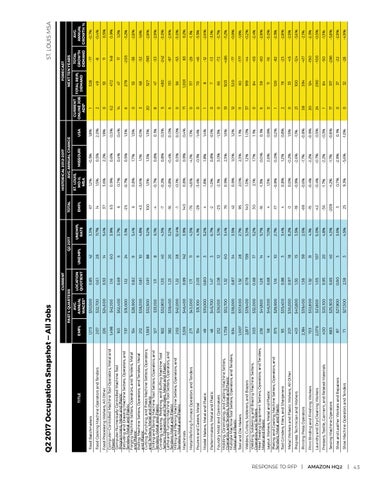
Q2 2017 Occupation Snapshot — All Jobs
3
3
40
20
107
31
59
15
18
3
10
4
14
17
159
28
34
60
12
3
3
6
11
142
28
20
40
8
88
10
9
24
6
60
14
28
42
UNEMPL
4.5%
3.6%
4.3%
4.8%
5.0%
4.1%
2.6%
3.5%
8.2%
3.4%
2.7%
7.0%
5.7%
5.2%
5.3%
2.7%
3.5%
3.4%
5.1%
6.7%
5.2%
4.1%
4.3%
3.9%
12.4%
5.2%
4.3%
6.1%
5.2%
4.8%
5.4%
3.1%
3.7%
3.9%
5.4%
11.7%
3.3%
UNEMPL RATE
Q2 2017
25
3
-209
-36
-42
-15
-69
-19
0
4
-17
4
-16
30
140
95
42
76
-25
-2
4
-29
-76
140
-1
-16
-7
-4
100
-43
6
-25
6
65
37
14
67
EMPL
TOTAL
9.3%
0.7%
-4.2%
-1.7%
-0.4%
-0.4%
-0.6%
-0.9%
0.0%
0.8%
-0.9%
1.3%
-1.3%
2.1%
1.0%
2.0%
0.9%
0.9%
-2.1%
-1.0%
1.8%
-3.4%
-4.8%
0.8%
-0.1%
-0.8%
-0.2%
-0.7%
1.3%
-3.6%
0.8%
-0.7%
0.7%
0.9%
3.6%
1.5%
1.2%
ST. LOUIS, MO-IL MSA
-5.6%
-2.9%
-1.7%
-2.2%
-0.7%
-2.2%
-1.7%
-2.6%
-0.2%
1.2%
0.0%
2.6%
0.0%
1.7%
1.2%
2.3%
1.0%
2.3%
3.0%
0.8%
1.9%
-0.1%
-4.1%
0.9%
0.3%
-0.4%
0.8%
0.8%
1.3%
1.1%
1.7%
0.5%
0.4%
0.6%
2.2%
0.5%
-0.5%
MISSOURI 1.8%
USA
-1.0%
0.1%
-0.8%
-0.3%
0.5%
-0.9%
-0.8%
-1.1%
1.5%
0.8%
0.2%
0.9%
0.1%
1.1%
1.0%
1.1%
1.2%
1.6%
-1.3%
-0.1%
1.4%
-1.4%
-1.1%
0.4%
0.0%
0.0%
0.3%
0.1%
1.3%
-0.1%
1.5%
1.3%
0.4%
0.3%
1.9%
2.0%
AVG ANNUAL CHANGE
HISTORICAL 2012–2017
FORECAST
0
0
17
1
24
20
38
21
0
2
1
0
32
37
317
84
290
124
394
100
33
19
120
11
84 39
6
919
60
320
503
66
7
8
70
117
1,001
56
151
480
47
327
68
53
279
47
472
53
49
328
0
37
11
12
51
0
0
1
0
0
71
0
6
5
8
20
3
0
6
14
62
0
2
1
CURRENT TOTAL REPL ONLINE JOB DEMAND ADS6
-28
-22
-286
-50
-100
-150
-417
-124
-45
-23
-82
-16
-60
-65
-44
-177
-77
-486
-72
-13
-12
-46
-29
83
-53
-97
-242
-33
-393
-32
-38
-203
17
148
11
-8
-77
TOTAL GROWTH DEMAND
NEXT TEN YEARS
-4.9%
-2.9%
-3.8%
-1.3%
-0.5%
-2.3%
-2.1%
-3.6%
-2.5%
-2.8%
-2.5%
-3.0%
-2.9%
-2.4%
-0.2%
-1.9%
-0.9%
-3.2%
-3.7%
-3.1%
-2.6%
-3.5%
-1.1%
0.2%
-3.0%
-2.9%
-3.0%
-2.9%
-2.8%
-1.6%
-2.8%
-3.2%
1.0%
0.9%
0.5%
-0.4%
-0.7%
AVG. ANNUAL GROWTH %
ST. LOUIS MSA