
left blank
This page intentionally
Table of Contents City of Healdsburg 2023 LHMP i Table of Contents Acronyms................................................................................................................................................ v Section 1. Introduction ............................................................................................................. 1-1 1.1 Scope and Purpose 1-1 1.2 Authority 1-2 1.2.1 Federal ........................................................................................................................... 1-2 1.2.2 State ............................................................................................................................... 1-2 1.2.3 Plan Use and Organization ............................................................................................. 1-2 Section 2. Community Profile ................................................................................................... 2-1 2.1 History 2-1 2.2 Geography ................................................................................................................................. 2-1 2.3 Population and Housing ............................................................................................................. 2-3 2.4 Land Use and Development Trends ........................................................................................... 2-4 2.4.1 Future Growth 2-6 2.5 Changes in Development 2-7 Section 3. Planning Process ...................................................................................................... 3-1 3.1 Organize Resources ................................................................................................................... 3-2 3.1.1 LHMP Planning Team ..................................................................................................... 3-2 3.1.2 Review and Incorporate Existing Information ............................................................... 3-3 3.2 Community Engagement Strategy 3-4 3.3 Assess Risks 3-7 3.3.1 Identify/Profile Hazards ................................................................................................. 3-7 3.3.2 Assess Vulnerabilities ..................................................................................................... 3-7 3.4 Develop Mitigation Strategy ...................................................................................................... 3-7 3.4.1 Develop Capabilities Assessment 3-7 3.4.2 Identify Goals 3-7 3.4.3 Identify Mitigation Actions ............................................................................................ 3-7 3.5 Develop the Plan ........................................................................................................................ 3-8 Section 4. Hazard Assessment .................................................................................................. 4-1 4.1 Hazard Identification 4-2 4.2 Hazard Profiles 4-3
Table of Contents ii City of Healdsburg 2023 LHMP 4.2.1 Drought .......................................................................................................................... 4-3 4.2.2 Earthquake 4-7 4.2.3 Flooding 4-17 4.2.4 Landslide 4-25 4.2.5 PSPS.............................................................................................................................. 4-30 4.2.6 Severe Weather ........................................................................................................... 4-37 4.2.7 Wildfire 4-43 Section 5. Vulnerability Assessment ......................................................................................... 5-1 5.1 Methodology 5-1 5.2 Hazard-Specific Vulnerability ..................................................................................................... 5-8 5.2.1 Drought .......................................................................................................................... 5-8 5.2.2 Earthquake ................................................................................................................... 5-10 5.2.3 Flooding 5-14 5.2.4 Landslide 5-17 5.2.5 PSPS.............................................................................................................................. 5-19 5.2.6 Severe Weather ........................................................................................................... 5-21 5.2.7 Wildfire ........................................................................................................................ 5-21 Section 6. Capability Assessment .............................................................................................. 6-1 6.1 Regulatory Mitigation Capabilities 6-1 6.2 Human/Technical Capabilities 6-2 6.3 Fiscal Capabilities ....................................................................................................................... 6-4 6.3.1 State and Federal Funding Resources............................................................................ 6-5 Section 7. Mitigation Strategy .................................................................................................. 7-1 7.1 Hazard Mitigation Goals 7-1 7.2 Review of the 2018 Mitigation Action Plan ............................................................................... 7-1 7.3 2023 Mitigation Actions............................................................................................................. 7-6 7.3.1 Identification and Prioritization of Mitigation Actions .................................................. 7-6 Section 8. Plan Implementation and Maintenance .................................................................... 8-1 8.1 Plan Adoption 8-1 8.2 Monitoring, Evaluating, and Updating the LHMP 8-1 8.3 Incorporation into Existing Planning Mechanisms .................................................................... 8-3 8.4 Continued Public Involvement................................................................................................... 8-4
Appendices
Appendix A, Planning Process Documents
Appendix B, Public Outreach
Appendix C, Hazard and Vulnerability Figures
Appendix D, Plan Maintenance Forms
Appendix E, Adoption Resolution
Appendix F, FEMA Plan Review Tool
Table of Contents City of Healdsburg 2023 LHMP iii Section 9. References ............................................................................................................... 9-1
This page intentionally left blank
Table of Contents iv City of Healdsburg 2023 LHMP
Acronyms
AB Assembly Bill
ABAG Association of Bay Area Governments
AFG Assistance to Firefighters Grant
BMD Best Management Practices
Cal OES California Governor’s Office of Emergency Services
CalFire California Department of Forestry and Fire Protection
Caltrans California Department of Transportation
CDBG Community Development Block Grant
CFR Code of Federal Regulations
CGS California Geological Survey
CIP Capital Improvement Plan
CWPP Community Wildfire Protection Plan
DMA 2000 Disaster Mitigation Act of 2000
DRI Disaster Recovery Initiative
EMPG Emergency Management Performance Grants
EO Executive Order
FEMA Federal Emergency Management Agency
FHSZ Fire Hazard Severity Zones
FIRM Flood Insurance Rate Map
FMA Flood Mitigation Assistance
FRA Federal Responsibility Area
GIS Geographic Information Systems
HCD California Department of Housing and Community Development
HMGP Hazard Mitigation Grant Program
HSGP Homeland Security Grant Program
IRWM Integrated Regional Water Management
LAFCO Local Agency Formation Commission
LHMP Local Hazard Mitigation Plan
Acronyms City of Healdsburg 2023 LHMP v
Acronyms
LID Low Impact Development
LRA Local Responsibility Area
MMI Modified Mercalli Intensity
MMS Moment Magnitude Scale
NFIP National Flood Insurance Program
PDAs Priority Development Areas
PDM Pre-Disaster Mitigation
RHNA Regional Housing Need allocation
RL repetitive loss
SRA State Responsibility Area
SWGP Storm Water Grant Program
SWRP Storm Water Resource Plan
the Stafford Act Robert T. Stafford Disaster Relief and Emergency Act
UCERF3 third Uniform California Earthquake Rupture Forecast
USC United States Code
USGS US Geological Survey
WUI wildland-urban interface
vi City of Healdsburg 2023 LHMP
Section 1. Introduction
Natural disasters can cause significant damage to property and infrastructure, as well as loss of life. These damages and losses can take a toll economically, psychologically, and financially on communities in the response and recovery processes. The City of Healdsburg (the City) Local Hazard Mitigation Plan (LHMP) is an effort undertaken by the City to mitigate the effects of natural hazards and plan for resiliency in the future that respects the character and needs of the people who live and work in Healdsburg.
The City’s 2023 LHMP is written to address the local mitigation planning requirements of the Disaster Mitigation Act of 2000 (DMA 2000) for the City of Healdsburg. The 2023 LHMP supersedes the 2018 LHMP. The 2023 and 2018 LHMP have been developed as stand-alone plans The 2011 LHMP was developed as an Annex to region-wide multi-jurisdictional hazard mitigation plans (HMPs) prepared by the Association of Bay Area Governments (ABAG).
This section introduces hazard mitigation planning and describes the various sections and appendices of the 2023 LHMP.
1.1 Scope and Purpose
There are five phases of emergency management, as illustrated in Figure 1.1
• Response: Taking action to save lives, limit injury, and prevent further damage of infrastructure in a disaster.
• Recovery: Returning actions to normal conditions directly following a disaster.
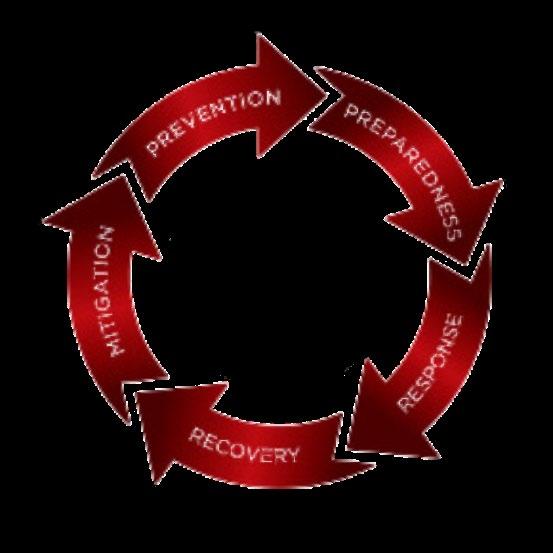
• Mitigation: Reducing loss of life and property damage by lessening the impact of future disasters.
• Prevention: Preventing hazards from occurring.
• Preparedness: Preparing to save lives and critical infrastructure and to help response and rescue operations in and directly following a disaster.
This plan focuses on the mitigation component of the cycle. Hazard mitigation plays an important role in reducing the impacts of disasters by identifying effective and feasible actions to reduce the risks posed by potential hazards. Hazard mitigation is defined by the Federal Emergency Management Agency (FEMA) as “any sustained action taken to reduce or eliminate long-term risk to human life and property from a hazard event.” As such, hazard mitigation is any work that minimizes the impacts of any type of hazard event before it occurs. A hazard event cannot be prevented from occurring, but the impact it will have on our communities can be reduced. Looking at results of 23 years of federally funded mitigation grants, the National Institute of Building Science completed a study to assess future savings from mitigation activities. The study found that on average, each dollar spent on mitigation saves society an average of $6 in avoided future losses in addition to saving lives and preventing injuries, evidence that mitigation activities are highly cost-effective (National Institute 2019).
Section 1 Introduction City of Healdsburg 2023 LHMP 1-1
Figure 1.1
This plan develops mitigation actions to strengthen community resilience, which helps ensure coordinated and consistent hazard mitigation activities across the city. The City has developed the 2023 LHMP to be consistent with current standards and regulations, ensuring that the understanding of hazards facing its communities reflects the best available science and current conditions. This plan is also consistent with FEMA requirements, and the mitigation measures included in the plan are grounded in best practices and available resources.
1.2 Authority
1.2.1 Federal
The federal Robert T. Stafford Disaster Relief and Emergency Act (the Stafford Act), as amended by DMA 2000 and supported by various pieces of regulation, directs hazard mitigation planning activities such as this plan. The Stafford Act requires state, local, and tribal governments that wish to be eligible for federal hazard mitigation grant funds to submit a HMP that outlines the processes for identifying the natural and man-made hazards, risks, and vulnerabilities of the jurisdiction (United States Code [USC] Title 42, Section 5156[a]). FEMA has promulgated the Code of Federal Regulations (CFR) Title 44, Part 201 to carry out the hazard mitigation planning requirements in the Stafford Act. These regulations direct the planning process, plan content, and FEMA approval for HMPs. The City of Healdsburg is subject to many kinds of hazards; thus, access to these federal grant funds is vital.
This LHMP complies with the Stafford Act and DMA 2000, along with the appropriate sections of CFR Title 44, including Part 201 (Regulation Checklist boxes illustrating the various hazard mitigation requirements are found throughout this plan; accompanied by the text/data supporting the regulations).
1.2.2 State
The State of California passed Assembly Bill (AB) 2140 in 2006, enacting California Government Code Sections 8685.9 and 65302.6. These sections concern federal requirements mandating that jurisdictions have a valid HMP to be eligible for certain grants. Specifically, Section 8685.9 limits the State of California to paying no more than 75 percent of disaster relief funds not covered by FEMA to a local community, unless the affected community (1) has a valid HMP that is consistent with DMA 2000 and (2) has adopted the HMP as part of its general plan. If this is the case, the State may pay for more than 75 percent of the disaster relief funds not covered by FEMA. Section 65302.6 authorizes local communities to adopt HMPs as part of their safety element or a comparable section of their general plan.
1.2.3 Plan Use and Organization
Information in this plan will be used to help guide and coordinate mitigation activities and decisions for City land use policies in the future. Proactive mitigation planning will help reduce the cost of disaster response and recovery to communities and their residents by protecting critical community facilities, reducing liability exposure, and minimizing overall community impacts and disruptions. With the memory of the impacts from past hazard events, the City of Healdsburg is committed to reducing future impacts from similar hazard events and maintaining eligibility for mitigation-related federal funding.
Objectives of the LHMP include the following:
Section 1 Introduction 1-2 City of Healdsburg 2023 LHMP
• Establish and foster a basis for coordination and collaboration among City departments, and other key stakeholders.
• Work in conjunction with other local planning efforts, including the City’s General Plan.
• Increase community awareness and empowerment.
• Meet the requirements of federal assistance grant programs, including FEMA’s Hazard Mitigation Grant Program (HMGP) and Pre-Disaster Mitigation (PDM) funding.
• Reduce the risk of loss and damage from hazard events, especially repetitive loss and damage.
• Coordinate hazard mitigation planning activities between City departments and in concert with resource management, land use planning, and emergency operation activities.
The LHMP is organized into nine sections to reflect the logical progression of activities undertaken to develop the plan and includes all relevant documentation required to meet the necessary criteria for FEMA approval. Each section is briefly described below.
• Section 1, Introduction, describes the background and purpose of the plan.
• Section 2, Community Profile, describes the city’s history and general background of the community, historical trends for population and housing, and trends in land use and development.
• Section 3, Planning Process, describes the 2023 LHMP planning process, as well as the meetings and outreach activities undertaken to engage the Planning Team members and the public.
• Section 4, Hazard Assessment, identifies, describes, and prioritizes the hazards that threaten Healdsburg. This chapter discusses past events, risks of future events, and the effects of future conditions for each type of hazard.
• Section 5, Vulnerability Assessment, describes the risks posed by each hazard type to city residents, particularly those who are more likely to be socially vulnerable, and to critical facilities.
• Section 6, Capability Assessment, identifies and evaluates the legal and regulatory, human and technical, and financial resources available to accomplish mitigation.
• Section 7, Mitigation Strategy, identifies mitigation goals, assesses the City’s capabilities to implement mitigation actions, and identifies and prioritizes mitigation actions.
• Section 8, Plan Implementation and Maintenance, discusses plan adoption and implementation, as well as the process to monitor, evaluate, and update the plan.
• Section 9, References
• Appendices
Appendix A, Planning Process Documents
Appendix B, Public Outreach
Appendix C, Hazard and Vulnerability Figures
Appendix D, Plan Maintenance Forms
Appendix E, Adoption Resolution
Appendix F, FEMA Plan Review Tool
Section 1 Introduction City of Healdsburg 2023 LHMP 1-3
Section 1 Introduction 1-4 City of Healdsburg 2023 LHMP
This page intentionally left blank
Section 2. Community Profile
The Community Profile provides a general history and background of the community, historical trends for population and housing, and trends in land use and development.
2.1 History
The area that now comprises Healdsburg was originally inhabited by Native Americans the Southern Pomo and Wappo tribes in the Dry Creek and Alexander Valleys, respectively. Their population once numbered close to 10,000 before it was decimated by smallpox epidemics and hostility from Mexican people who came to the area and later by secondary Euro-American settlement in the 1850s. Those who survived were displaced to missions or rancherias (Healdsburg, City of 2015).
The territory that is now Healdsburg was claimed in 1841 by Captain Henry Fitch, brother-in-law of Governor Mariano Vallejo, as part of Fitch’s 48,880-acre Sotoyome Rancho. In 1851, would-be gold seeker Harmon Heald, a native of Ohio, built a cabin on the west side of the well-traveled path between San Francisco and the northern mines (now Healdsburg Avenue). Heald built a small general store and opened a post office in the store in 1854, around which a small settlement grew. In 1857, Heald hired a surveyor to lay out a central plaza with streets and 85 lots, and a town was born, populated by 300 (non-native) residents (Healdsburg Museum & Historical Society 2018). In 1867, Healdsburg was incorporated as a city.
In 1871, the railroad opened new markets for farm produce and established Healdsburg as a prosperous agricultural district. By the 1880s, the major regional revenue besides tourism was derived from grapes, lumber, and hops. The bottom dropped out of Healdsburg’s flourishing wine industry with passage of the Volstead Act in 1919 and Prohibition. During the 1920s, most of Healdsburg’s vineyards were pulled up and replanted with fruit trees, especially French prunes, Imperial prunes, and apples. By 1930, prunes were the most important industry in Healdsburg and remained the largest cash crop until the 1970s when many orchards were removed, with the land again planted with vineyards (Healdsburg Museum & Historical Society 2018).
2.2 Geography
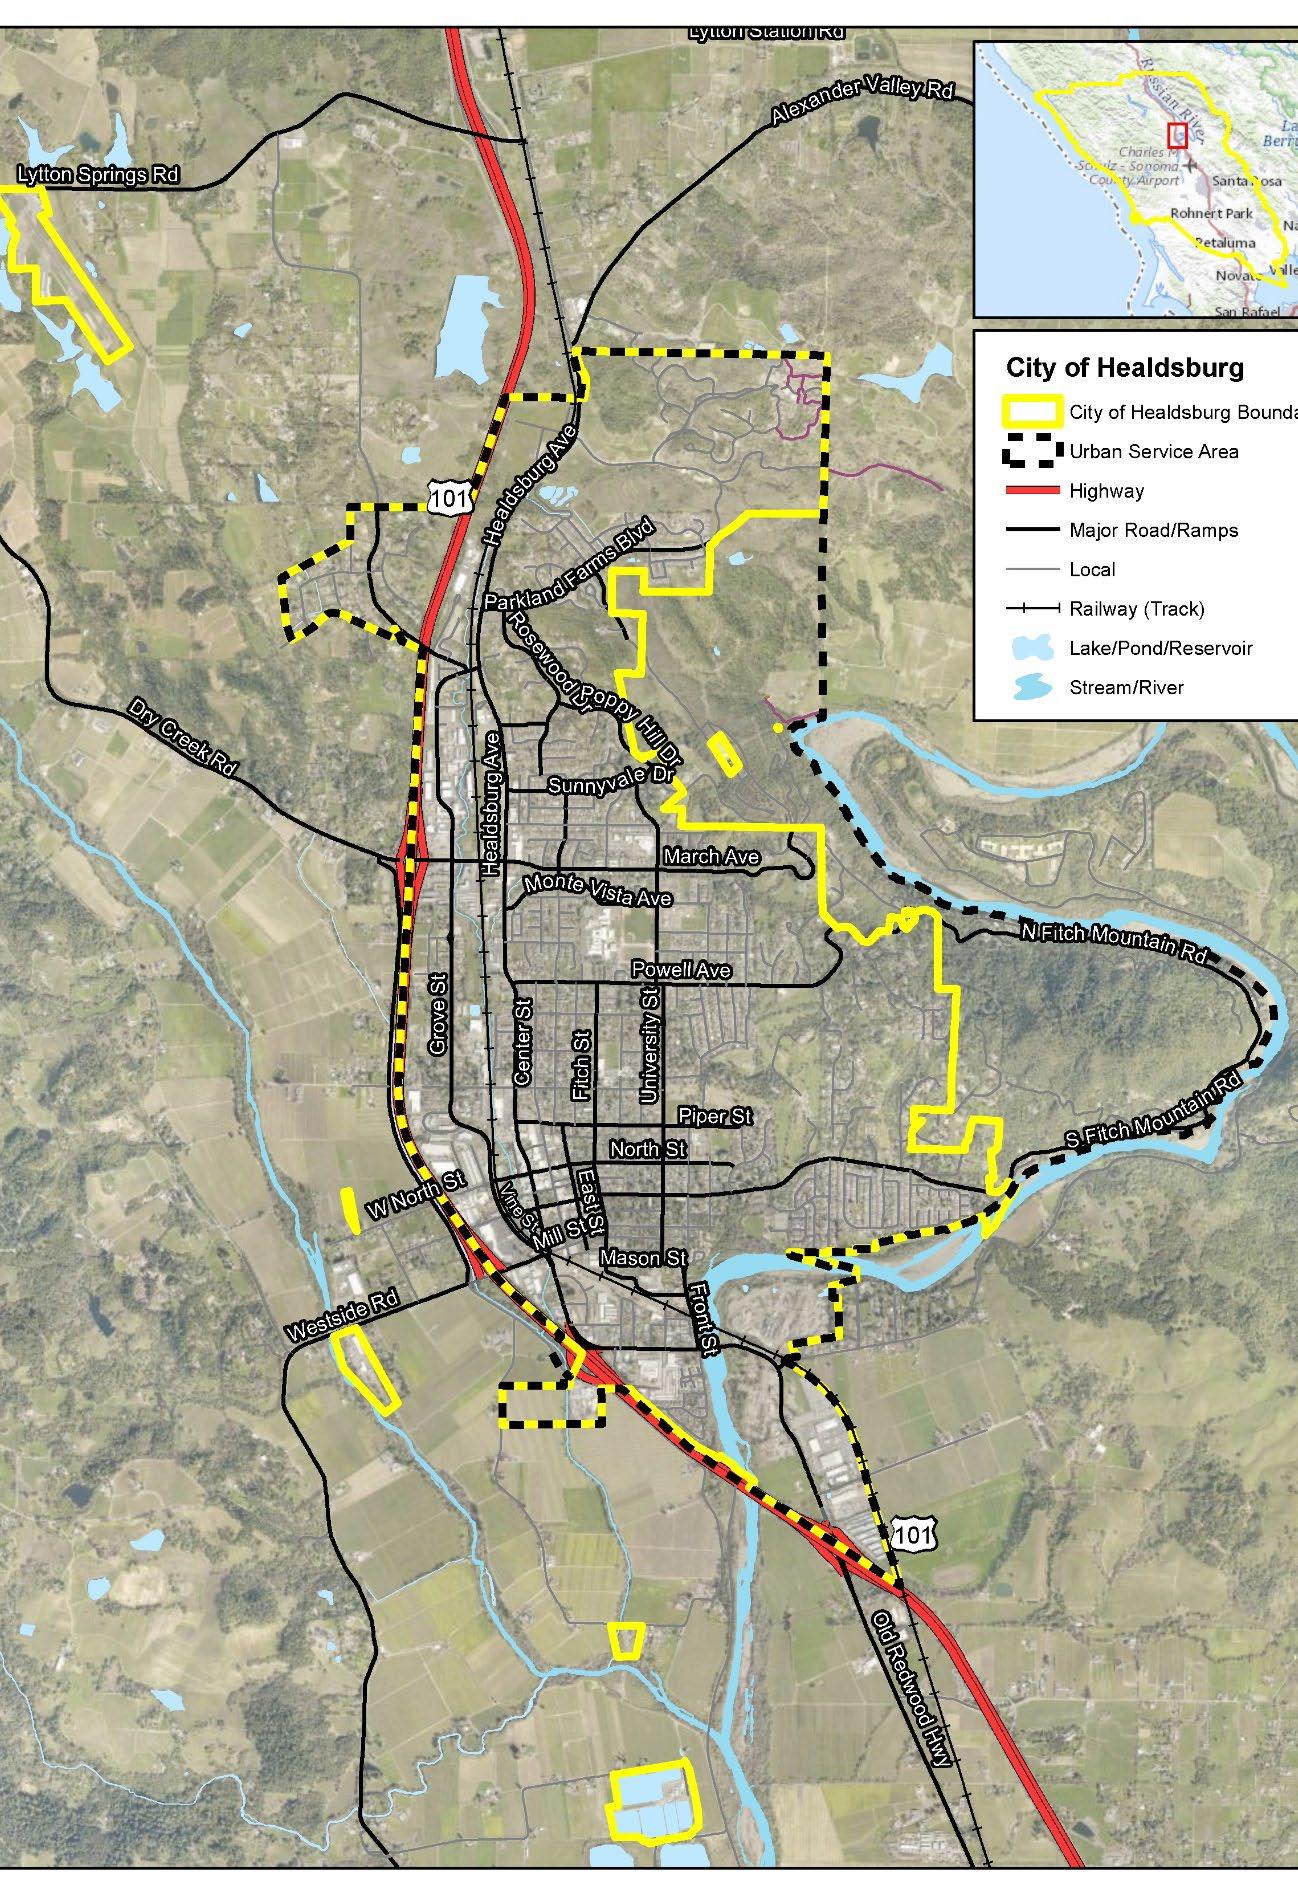
Healdsburg is in Sonoma County, situated in an inland valley defined principally by US Highway 101, the Russian River, surrounding agricultural lands, and mountains to the east and west. US Highway 101 is the principal coastal route between San Francisco and the Oregon border. The Russian River flows through Healdsburg on its way to the Pacific Ocean, approximately 20 miles to the west. The city lies at the intersection of three rich agricultural valleys Russian River Valley, Dry Creek Valley, and Alexander Valley and is at an elevation of between 100 and 430 feet above sea level. East and west beyond the agricultural lands rise subsystems of the Coastal Mountain Range. As of 2009, the Healdsburg city limits contain 4.42 square miles (Healdsburg, City of, 2018). Figure 2.1 illustrates the city’s location
Section 2 Community Profile City of Healdsburg 2023 LHMP 2-1
Section 2 Community Profile 2-2 City of Healdsburg 2023 LHMP
Figure 2.1: City of Healdsburg Location Map
Healdsburg’s city limits include more than 100 acres of noncontiguous, City-owned land. These properties contain several critical facilities, including the Healdsburg Municipal Airport, Corporation Yard, and Water Reclamation Facility.
The Sonoma County General Plan limits urban development in unincorporated areas by establishing Urban Service Boundaries, which designate geographic areas planned for a full range of public services and infrastructure, such as sewer, water, roads, and police and fire protection. Healdsburg’s Urban Service Area coincides with an Urban Growth Boundary adopted by City voters and a Sphere of Influence determined by Sonoma Local Agency Formation Commission (LAFCO). The Urban Service Area includes more than 1,000 acres located outside the incorporated city, including the Fitch Mountain area. Bounded by the City to the west and the Russian River to the north, east, and south, this portion of unincorporated Sonoma County includes low-density residential development on the flanks of the mountain. The higher portions of the mountain remain open space that is permanently protected by a conservation easement.
2.3 Population and Housing
According to the 2020 Census, the population of Healdsburg was estimated to be 11,340 Table 2-1 shows changes in population and households between the three most recent US Censuses.
The data illustrates that while Healdsburg’s population continues to grow, the rate at which the city is growing has reduced significantly, from 13.2 percent growth in 2000 to 5.0 percent growth in 2010 to less than 1 percent growth in 2020 A large factor in the City’s population growth during the 1990s was the annexation of land, known as “Area A,” to the north (Sonoma LAFCO 2006). Nevertheless, the reduction in growth after 2000 reflects similar trends seen in Sonoma County and across the entire state.
Table 2-1: Population and Household Changes
Section 2 Community Profile City of Healdsburg 2023 LHMP 2-3
Healdsburg Sonoma County California Population 2020 11,340 488,863 39,538,223 2010 11,254 483,878 37,253,956 2000 10,722 458,614 33,871,648 Growth (2010-2020) 0.8% 1.0% 5.8% Growth (2000–2010) 5.0% 5.5% 10.0% Growth (1990–2000) 13.2% 18.1% 13.8% Households 2020 4,626 188,841 13,217,586 2010 4,378 185,825 12,577,498 2000 3,968 172,403 11,502,870 Average Household Size 2020 2.46 2.56 2.92 2010 2.56 2.55 2.90 2000 2.69 2.60 2.87
Sources: Healdsburg, City of. 2015 , US Census Bureau. 2021
A household is defined as a person or group of persons living in a housing unit. According to the 2020 Census, there were 4,626 households in Healdsburg and the average household size was 2.46 Most residents live in single-family housing or mobile homes. Table 2--2 shows the composition of the housing stock in 2000, 2010, and 2016, and the percentage change over time
2.4 Land Use and Development Trends
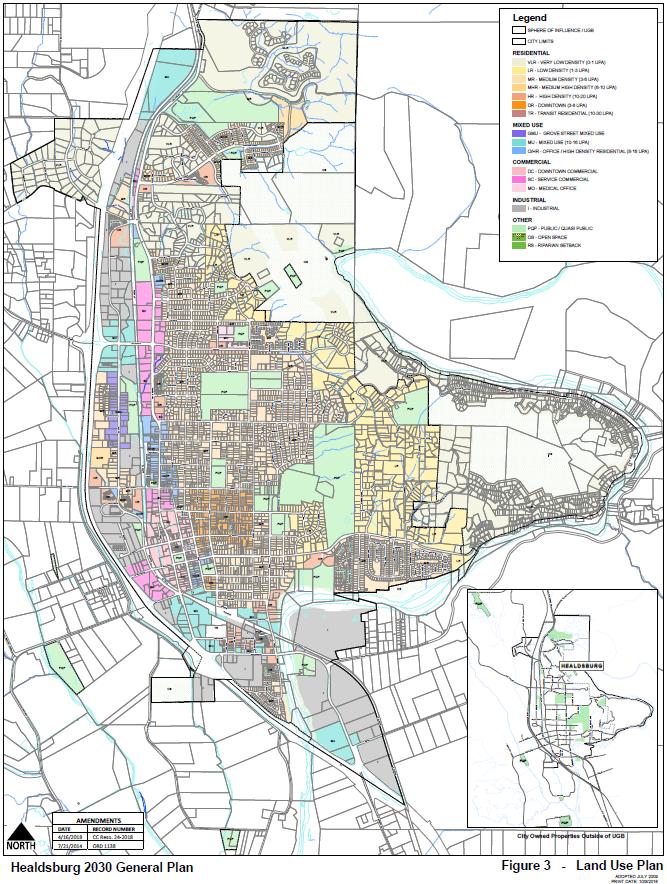
Table 2-3 shows the various land uses and their acreage within the Planning Area in 2004. According to the 2030 General Plan, approximately 68 percent of the city’s land was developed in 2004. The Planning Area, which includes the entire Sphere of Influence/Urban Service Area contains a significant amount of vacant or underdeveloped acreage, including approximately 492.13 acres in the northern part of the Planning Area (Areas A, B, and C). Areas B and C, however, include 158.87 acres that the Sonoma County Agricultural and Open Space District owns or controls through conservation easements that prohibit development. Therefore, the northern Planning Area has a total of about 333.26 acres that remains potentially developable. The Grove Street area (Area G) also contains a relatively significant amount of land that is vacant or underdeveloped. Although within the Urban Growth Boundary, Fitch Mountain (Area K) is not expected to accommodate growth due to infrastructure and environmental constraints.
Table 2-3: Land Uses within Healdsburg Planning Area (2004)
Source: Healdsburg, City of. 2015.
Current land uses, as identified in the 2030 General Plan, are illustrated in Figure 2.2
Section 2
Profile 2-4 City of Healdsburg 2023 LHMP
Community
2000 2010 2016 Unit Type Number Percentage Number Percentage Number Percentage Single-Family 3,257 78.4 3,761 79.5 4,008 79 2–4 Units 423 10.2 475 10.1 640 12.7 5–9 Units 156 3.8 162 3.4 82 1.4 10+ Units 218 5.3 262 5.5 272 5.4 Mobile Home & Other 98 2.4 69 1.5 73 1.5 Totals 4,152 100 4,729 100 5,075 100 Source: US Census Bureau.
Table 2-2: Healdsburg Housing Units, 2000, 2010, 2016
2022
General Plan Land Use Designation Total Acreage Developed Acres Vacant Acres Agricultural 16.69 16.69 0 Residential 1,733.04 1,351.22 381.82 Commercial 204.67 181.25 23.42 Mixed Uses 16.91 16.91 0 Light Industrial 124.37 113.25 11.12 Heavy Industrial 203.26 130.92 72.34 Institutional (Public & Semi-Public) 342.12 342.12 0 Open Space 432.75 n/a n/a
Section 2 Community Profile City of Healdsburg 2023 LHMP 2-5
Figure 2.2: City of Healdsburg Land Use Plan
2.4.1 Future Growth
In the Bay Area, a long-range plan titled Plan Bay Area has been developed that looks ahead to 2040. Plan Bay Area is a state-mandated, integrated long-range transportation, land use, and housing plan that will support a growing economy, provide more housing and transportation choices, and reduce transportation-related pollution in the nine-county San Francisco Bay Area (Plan Bay Area 2018.). Two concepts directly affect growth in a community: the Regional Housing Need allocation (RHNA) and the Plan Bay Area Priority Development Areas (PDAs).
The California Department of Housing and Community Development (HCD) identifies the total housing need for the San Francisco Bay Area for eight-year periods (the current period being from 2023 to 2031). ABAG then develops a methodology to distribute the need to local governments. The RHNA for Healdsburg and the entirety of Sonoma County is illustrated in Table 2-4; housing allocations are divided into four different income categories.
PDAs are areas where growth and development will be focused. Plan Bay Area identifies nearly 200 PDAs; these existing neighborhoods are served by public transit and have been identified as appropriate for additional compact development. There are no PDAs in Healdsburg.
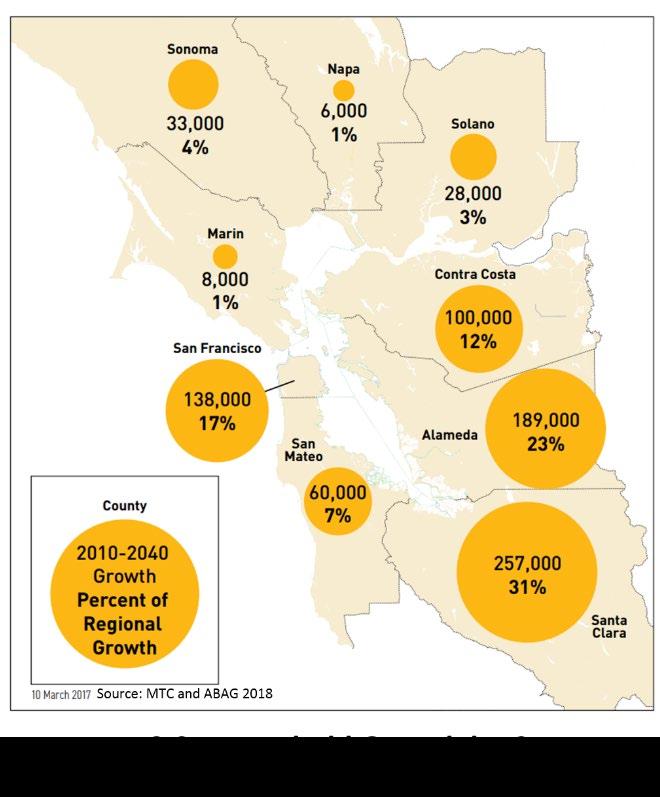
Plan Bay Area concentrates growth in the “Big 3 Cities” of San Jose, San Francisco, and Oakland, as well as in east and west Bayside corridors along the region’s core transit network. As illustrated in Figure 2.3, 83 percent of all growth will occur in four counties (Santa Clara, Alameda, San Francisco, and Contra Costa), while the remaining five counties will see modest growth over the next 24 years. Four percent of the Bay Area’s growth will occur in Sonoma County.
The growth for Healdsburg set forth in Plan Bay Area is consistent with past growth patterns and current land use policies.
Section 2 Community Profile 2-6 City of Healdsburg 2023 LHMP
Very Low 0–50% Low 51–80% Moderate 81–120% Above Moderate 120%+ Total City of Healdsburg 190 109 49 128 476 Sonoma County Total 3,999 2,302 2,302 5,959 14,562 Bay Area Region Total 114,442 65,892 72,712 188,130 441,176
Table 2-4: Regional Housing Need Allocation 2023-2031 by Income Category
Source: ABAG 2022
2.5 Changes in Development
The local hazard mitigation planning requirement for changes in development is as follows:
Regulation Checklist – 44 CFR 201.6 Local Mitigation Plans
Element D: Plan Review, Evaluation, and Implementation
D1. Was the plan revised to reflect changes in development? (Requirement §201.6(d)(3))
Since the 2011 LHMP, Healdsburg has experienced development and growth, but the general development trend that existed when the 2011 LHMP was developed is still relevant: The City will continue to focus inward with infill development and redevelopment of underutilized sites. New development will be compact and efficient to make the best use of remaining land. With this growth, an increased number of people are vulnerable to various hazards, but the recent development has not changed the city’s landscape; therefore, no new hazard areas, such as floodplains, have been added to Healdsburg. Additionally, the City is implementing mitigation measures for new developments and their construction. For example, water mains that cross fault lines are equipped for emergency connection, and curbs under construction at the new roundabout as part of the Central Healdsburg Avenue Plan have porous concrete. As such, development that has occurred since the last plan has not significantly affected the vulnerabilities of Healdsburg.
Section 2 Community Profile City of Healdsburg 2023 LHMP 2-7
Section 2 Community Profile 2-8 City of Healdsburg 2023 LHMP
This page intentionally left blank
Section 3. Planning Process
The local hazard mitigation planning requirement to document the planning process is as follows:
Regulation Checklist – 44 CFR 201.6 Local Mitigation Plans
Element A: Planning Process
A1. Does the plan document the planning process, including how it was prepared and who was involved in the process? (Requirement §201.6(c)(1))
For the development of the LHMP, a planning process was created based on the various federal guidance documents and regulations. As shown in Figure 3.1, the LHMP planning process included organizing resources, assessing risk, developing the mitigation strategy, and developing the plan (including drafting, reviewing and revising, and adopting and submitting the plan). Documents that further illustrate the planning process are provided in Appendix A.

Section 3 Planning Process City of Healdsburg 2023 LHMP 3-1
Figure 3.1: Hazard Mitigation Planning Process
3.1 Organize Resources
The planning process began by organizing resources, which included establishing a planning team and identifying stakeholders, collecting and analyzing relevant plans, and developing a community engagement strategy.
3.1.1 LHMP Planning Team
At the core of the LHMP planning process is the LHMP Planning Team, which served as the backbone of the LHMP planning process. Team members provided data for the plan, made key decisions to guide the development of the plan, and served as liaisons to their departments. The membership of the 2018 LHMP Planning Team was used as a starting point for the 2023 LHMP Planning Team. The 2023 LHMP Planning Team includes staff from a variety of City departments, as shown in Table 3-1
Table 3-1: LHMP Planning Team
Planning Team Member
Title
Kelsey Carreiro Emergency Manager
Raina Allen
Allison Mattioli
Matt Jenkins
Jason Boaz
Lance Macdonald
Andrew Sturmfels
Ellen McDowell
Tyler Kettmann
Curt Bates
Terry Crowley
Adam McKenna
Public Information Officer
Administrative Analyst II
Police Chief
Fire Chief
Fire Marshal
Assistant City Manager
Senior Planner
Central Services Manager
Principal Engineer
Utility Director
IT Manager
The Planning Team met throughout the development of the 2023 LHMP. Meetings were conducted in person; follow-up activities were conducted on the phone or via email. The LHMP Planning Team met three times between March 2023 and May 2023, addressing the following items:
• Meeting 1 – March 27, 2023: Summarize the project purpose and process, identify hazards, introduce capability assessment, discuss community outreach strategies
• Meeting 2 – April 24, 2023: Introduce/review hazard assessment, revisit capability assessment, identify critical facilities
• Meeting 3 – May 22, 2023: Review updated hazard maps, discuss community workshop format and outreach, introduce and discuss the mitigation strategy
3-2 City of Healdsburg 2023 LHMP
Section 3 Planning Process
Meeting documentation, including agendas, PowerPoint presentations, sign-in sheets, and other relevant handouts, are provided in Appendix A
3.1.2 Review and Incorporate Existing Information
The local hazard mitigation planning requirement for review and incorporation of existing information, and the requirement to revise the plan based on current priorities are as follows:
Regulation Checklist – 44 CFR 201.6 Local Mitigation Plans
Element A: Planning Process
A4. Does the plan describe the review and incorporation of existing plans, studies, reports, and technical information? (Requirement §201.6(b)(3))
Regulation Checklist – 44 CFR 201.6 Local Mitigation Plans
Element D: Plan Review, Evaluation, and Implementation
D3. Was the plan revised to reflect changes in priorities? (Requirement §201.6(d)(3))
The LHMP Planning Team reviewed and assessed existing plans, studies, and data available from local, state, and federal sources. Key documents reviewed as part of the LHMP planning process and how they were incorporated are shown in Table 3-2; a complete list of resources is found in Section 9. Additionally, at the beginning of the plan update process, the 2018 LHMP was reviewed and recommendations for updates were provided. These are described in the subsection “LHMP Review and Recommendations” below.
Table 3.-2: Existing Plans, Studies, Reports, and Other Technical Data/Information Document/Data
2023 State of California Hazard Mitigation Plan
Healdsburg 2030 General Plan Background Report and Policy Documents, 2015
2021 Sonoma County Multijurisdictional Hazard Mitigation Plan
Foss Creek Flood Control Study (West Yost Associates)
City of Healdsburg Geographic Information Systems (GIS) data
Disaster Mitigation Act
2023 FEMA Local Hazard Mitigation Planning Policy Guide
City of Healdsburg 2020-2025 Strategic Plan
Disaster declaration information and hazard descriptions
Hazard identification, historical hazard and location information
Historical hazard and location information
Historic flooding mapping and event data
Mapping data for hazards and demographics
Current federal legislation for hazard mitigation planning
Updated guidance on hazard mitigation planning
Strategic initiatives and goals for Healdsburg
Section 3 Planning Process City of Healdsburg 2023 LHMP 3-3
Use
The following local regulations, codes, ordinances, and plans were reviewed to develop complementary and mutually supportive goals, objectives, and mitigation strategies that are consistent across local and regional planning and regulatory mechanisms:
• General plans (land use, housing, safety, and open space elements)
• Building codes
• Zoning and subdivision ordinances
• NFIP flood damage prevention ordinances
• Stormwater management plans
• Emergency management and response plans
• Land use and open space plans
• Climate action plans
• Community wildfire protection plans
LHMPReviewandRecommendations
This 2023 LHMP is the fourth iteration of the plan. The LHMP was originally developed as part of the 2005 ABAG Multi-Jurisdictional Hazard Mitigation Plan. An Annex specific to the City of Healdsburg was adopted in 2007, and a second version was developed in 2011. The City’s first stand-alone plan was developed in 2018 and was used as the basis for the 2023 LHMP. Areas identified for updated included:
• Hazards will be analyzed to determine if any are no longer applicable or if there are new hazards identified within the City of Healdsburg
• Vulnerability to specific hazards will be updated for individual critical facilities.
• The capability assessment will be updated.
• Mitigation actions will be updated and newly identified mitigation actions will be added
• A severe weather hazard profile will be added.
3.2 Community Engagement Strategy
The local hazard mitigation planning requirements for public involvement are as follows:
Regulation Checklist – 44 CFR 201.6 Local Mitigation Plans
Element A: Planning Process
A2. Does the plan document an opportunity for neighboring communities, local and regional agencies involved in hazard mitigation activities, agencies that have the authority to regulate development as well as other interests to be involved in the planning process? (Requirement §201.6(b)(2))
A3. Does the plan document how the public was involved in the planning process during the drafting stage? (Requirement §201.6(b)(1))
The community engagement strategy included an initial media release, an online hazards questionnaire, a community workshop and availability of the draft plan for review and comment. Each aspect of the engagement strategy is described in more detail below, and associated documentation is included in
3-4 City of Healdsburg 2023 LHMP
Section 3 Planning Process
Appendix B. The community engagement strategy was drafted at the commencement of the plan and was modified as needed throughout the plan development process.
Media Release
A media release was distributed announcing the project. It described the purpose of the project and provided points of contact for anyone who wanted to participate in the planning process or wanted more information about the project. The media release was distributed via email and social media by the City’s Public Information Officer in April 2023. A copy of the press release, as well as screenshots of the social media posts are included in Appendix B.
StakeholderOutreach
Development of the 2023 LHMP was discussed at the weekly Sonoma County Emergency Operational Area Coordination Call. This meeting is hosted by Sonoma County Department of Emergency Management and composed of representatives from each of the cities, various county departments, state agencies, special districts, utilities, and disaster response and recovery related agencies. The group meets weekly to discuss and coordinate emergency management, preparedness, training and disaster recovery-related issues. The project was announced at the weekly meeting held on April 10th, 2023. The LHMP Planning Team Lead, Kelsey Carreiro, described the purpose of the project and provided points of contact for anyone who wanted to participate in the planning process or wanted more information about the project. A link to the online hazard questionnaire was provided as well as an invitation to the Community Workshop. The project was discussed again at the Sonoma County Emergency Operational Area Coordination Call held on June 26th, 2023, when the public review draft of the 2023 LHMP was ready and a link was provided. Representatives from the Operational Area were invited to review the draft plan and provide comments to the LHMP Planning Team.
Additionally, the following agencies and cities were notified through email of the plan’s availability for review and comment: American Red Cross; California Department of Forestry and Fire Protection (CalFire); Cal OES; California Army National Guard; California Department of Transportation (Caltrans); California Highway Patrol (CHP); Catholic Charities of Santa Rosa; Golden Gate Transportation District; Pacific Gas & Electric; Redwood Empire Food Bank; Redwood Empire Schools' Insurance Group; Rincon Valley and Windsor Fire Protection Districts; Santa Rosa Junior College; Sonoma State University; Sonoma Valley Fire & Rescue Authority; Sonoma-Marin Area Rail Transit (SMART); The Sea Ranch Association; US Coast Guard; the Cities of Cloverdale, Cotati, Petaluma, Rohnert Park, and Santa Rosa; and the County of Sonoma. A copy of the email announcing availability of the public review draft is found in Appendix B .
HazardQuestionnaire
A questionnaire was developed for the public to provide feedback on their concerns about natural and human-caused hazards. The online questionnaire was advertised on the City’s website, Facebook, Instagram, and Nextdoor Hard copies were available at the community workshop for immediate completion. The hazard questionnaire was available in both English and Spanish. A copy of the questionnaire is included in Appendix B, as well as an analysis of the 69 responses received
Key takeaways from the questionnaire responses are that:
Section 3 Planning Process City of Healdsburg 2023 LHMP 3-5
• The LHMP Planning Team and the community are in agreement in terms of hazards of concern and hazards experienced. The community identified the following hazards as their top concerns: wildfire, drought, earthquake, flooding, and extreme heat/cold. The community did not note any hazards of concern that the LHMP Planning Team had not discussed.
• 95 percent of community members who replied to the questionnaire have signed up to receive City community alerts.
• Community members stated that utility bills and mail, the City’s website, social media, newspapers, and public meetings are the most effective ways to disseminate information. The City is providing information/outreach in the desired mediums. While newspapers are not as commonly used to provide information, the City regularly uses the other four mediums to reach community members.
• 99 percent of community members are implementing at least one mitigation method within their own household. The vast majority have implemented multiple mitigation actions across multiple hazards. It could be deduced that this level of awareness and personal responsibility indicates that public education and outreach is an effective approach to reducing risk in Healdsburg.
As these responses were in line with the LHMP Planning Team’s current thinking, the responses did not alter the planning process. Rather, the responses reinforced that the LHMP Planning Team has the correct approach and priorities in mind.
CommunityWorkshop
A community workshop was held on June 7th, 2023. The workshop was open-house style and lasted for two hours, from 5 to 7 p.m. It was advertised that a short formal presentation would occur 15 minutes after the hour at 5:15 and 6:15 p m. LHMP Planning Team members attended the community workshop to answer questions and interact with the public.
The community workshop included:
• Large-scale hazard maps for the public to view.
• A map where community members were asked to write down their concerns and to identify location-specific concerns as well as general concerns.
• Handouts on mitigation planning, mitigation and preparedness activities that can be completed by an individual, and complementary planning efforts being undertaken by the City.
• Hard copies of the hazard questionnaire, as well as flyers advertising the questionnaire with the link to the online version.
Documentation of outreach for the workshop and of the workshop itself is provided in Appendix B
PublicReviewDraftPlan
At the beginning of June, the Public Review Draft Plan was posted to the City’s website. Availability of the draft was advertised on the home page of the City’s website as well as on Facebook, Instagram, and Nextdoor. Also, as previously described, various neighboring communities, and local and regional agencies were directly notified when the Public Review Draft became available. Documentation of the availability of the Public Review Draft is included in Appendix B.
Section 3 Planning Process 3-6 City of Healdsburg 2023 LHMP
3.3 Assess Risks
In accordance with FEMA requirements, this step of the LHMP planning process identified and prioritized the natural hazards affecting Healdsburg and assessed the vulnerability from the identified hazards. Results from this phase in the LHMP planning process formed the foundation for the subsequent identification of appropriate mitigation actions for reducing risk and losses in the city. This component of the LHMP planning process is detailed in Sections 4 and 5.
3.3.1 Identify/Profile Hazards
Based on a review of past hazards as well as a review of the existing plans, reports, and other technical studies/data/information, the Planning Team determined whether the hazards from the previous plan were still valid and identified new hazards that could affect Healdsburg. The P lanning Team decided to profile the following hazards: drought, earthquake (including liquefaction), flooding (including dam failure), landslide, and wildfire (including high winds). Additionally, it was decided that discussions of future conditions would be incorporated into each hazard profile. Further details about the hazard identification process are found in Section 4.1; each hazard is profiled in Section 4.2.
3.3.2 Assess Vulnerabilities
Hazard profiling exposes the unique characteristics of individual hazards and begins the process of determining which areas in Healdsburg are vulnerable to specific hazard events. The vulnerability assessment included a GIS overlaying method for all geographically defined hazards. Using this methodology, an analysis identified the critical facilities, population, and residential buildings that might be impacted by the hazards. Detailed information on each hazard vulnerability assessment is provided in Section 5.
3.4 Develop Mitigation Strategy
The LHMP is the explicit strategy that provides the blueprint for hazard mitigation planning to better protect people and property in the city from the effects of future natural hazard events. Developing the mitigation strategy involved developing a capabilities assessment, identifying goals, and finally identifying and prioritizing mitigation actions. This step of the LHMP planning process is detailed in Sections 6 and 7.
3.4.1 Develop Capabilities Assessment
A capabilities assessment is a comprehensive review of all the various mitigation capabilities and tools currently available to the City of Healdsburg to implement the mitigation actions prescribed in the LHMP. The LHMP Planning Team identified legal and regulatory, human and technical, and financial capabilities, as detailed in Section 6.
3.4.2 Identify Goals
Mitigation goals are general guidelines that explain what the community wants to achieve in terms of hazard loss and prevention. The LHMP Planning Team began by reviewing the goal from the existing LHMP and decided that, with a minor tweak, the goal would still be relevant and appropriate for the 2023 LHMP.
3.4.3 Identify Mitigation Actions
The LHMP Planning Team and the LHMP Planning Team worked together to identify and develop a mitigation action plan. The mitigation action plan is the City’s road map for the next five years, illustrating
Section 3 Planning Process City of Healdsburg 2023 LHMP 3-7
the priority mitigation actions the City would like to implement in the near future. Section 7 details the approach to review of the existing mitigation actions, identification and prioritization of new mitigation actions, and creation of the implementation strategy.
3.5 Develop the Plan
All information, data, and associated narratives from the previous tasks were incorporated into the 2023 LHMP. There will be four versions of the plan:
• The first draft will be an administrative draft, distributed to the LHMP Planning Team for their review and comment.
• Comments received from the LHMP Planning Team will be incorporated into the plan and a public review draft will be developed. This second draft will be available for public review and comment.
• All comments received by the public will be compiled and addressed; the 2023 LHMP will be revised as appropriate. This third version of the plan is the courtesy review draft, which will be sent to Cal OES and FEMA for their review and comment.
• The final version of the plan will have addressed any comments received by Cal OES and FEMA. This final 2023 LHMP will be presented to the City Council for adoption.
Section 3 Planning Process 3-8 City of Healdsburg 2023 LHMP
Section 3 Planning Process City of Healdsburg 2023 LHMP 3-9
This page intentionally left blank
Section 4. Hazard Assessment
The local hazard mitigation planning requirements for hazard profiles are as follows:
Regulation Checklist – 44 CFR 201.6 Local Mitigation Plans
Element B: Hazard Identification and Risk Assessment
B1. Does the plan include a description of the type, location, and extent of all natural hazards that can affect each jurisdiction? (Requirement §201.6(c)(2)(i))
B2. Does the plan include information on previous occurrences of hazard events and on the probability of future hazard events for each jurisdiction? (Requirement §201.6(c)(2)(i))
Section 4 Hazard Assessment City of Healdsburg 2023 LHMP 4-1
Table 4-1: Hazard History and Hazards in Various Planning Documents
Future Condition Considerations will be discussed for each hazard.
* 1950–Present, Declarations for Sonoma County not just Healdsburg.
a. Flood: 9 federally declared flood disasters, 3 additional incidents that were not federally declared.
b. Freeze: 1 federally declared freeze disaster, 1 additional incident that was not federally declared.
c. Wildfire: 11 federally declared wildfire disasters, 3 additional incidents that were not federally declared
The hazard assessment identifies and describes the hazards that threaten Healdsburg.
4.1 Hazard Identification
To aid in the process of identifying hazards, the LHMP Planning Team considered the hazards included in the previous version of the City’s LHMP, looked at associated HMPs, reviewed other relevant planning documents, and considered hazard history to determine the natural hazards with the potential to affect the city. Table 4-1 provides a crosswalk of hazards considered and the final determination by the LHMP Planning Team.
Section 4 Hazard Assessment 4-2 City
2023
of Healdsburg
LHMP
Hazard State of CA HMP (2023) Sonoma County HMP (2021) Healdsburg General Plan (2030) 2018 Healdsburg LHMP Disaster Declaration* (# of events) Include in 2023 Healdsburg LHMP? Avalanche X No (no history) Coastal Flooding, Erosion, and Sea Level Rise X No (city is landlocked) Dam Failure X X X Yes (flood sub-hazard) Drought X X X (1) Yes Earthquake (including liquefaction) X X X X Yes Extreme Heat X Yes (severe weather sub-hazard) Flood X X X X X (12a) Yes Freeze X X (2b) Yes (severe weather sub-hazard) Landslide X X X X Yes Levee Failure X No (no levees) PSPS X Yes Severe Weather X X Yes Tsunami X No (city is landlocked) Volcano X No (low concern) Wildfire X X X X X (14c) Yes
Based on the above analysis, the Planning Team determined that all of the hazards identified in the 2018 LHMP should be included in the 2023 LHMP. In addition, it was decided that the hazards of severe weather and PSPS should be added in the 2023 LHMP. Future condition considerations will be discussed for each hazard profiled.
As such, the following seven hazards are profiled in the 2023 LHMP:
• Drought
• Earthquake (including liquefaction)
• Flooding (including dam failure)
• Landslide
• PSPS
• Severe Weather
• Wildfire
4.2 Hazard Profiles
For each hazard, a profile has been established describing the hazard in general, as well as details specific to Healdsburg. The hazard profiles discuss the following topics: hazard description, strength/magnitude, past occurrences, location, warning time, secondary hazards, vulnerability, frequency and probability of future occurrence, and future condition considerations.
The hazards are discussed in alphabetical order; the order does not signify the level of risk. Hazard maps are included within the hazard profiles, but larger and higher resolution versions of these maps can be found in Appendix C
4.2.1 Drought HazardDescription
A drought is a long-term water shortage caused by an extended period with little to no precipitation that can lead to a decline in available water supplies. Droughts may cause increases in water rates or additional restrictions on water use. In severe cases, communities may not have enough available water to meet basic needs. Drought conditions can significantly harm agricultural operations, particularly in areas that grow water-intensive crops. Planted landscapes may become drought-stressed, causing them to become weak or die from lack of water. If drought conditions are severe enough, the lack of water may pose a human health risk.
Droughts also have several indirect impacts. The lack of precipitation can cause soil to harden and become less permeable so that when precipitation does eventually occur, the soil cannot absorb water as easily, potentially leading to increased flooding. Drier soil may become decompressed, increasing its susceptibility to sliding and eroding. Droughts may dry out wildland vegetation, potentially increasing the risk of fire. Water-stressed plants may also be more vulnerable to disease or pests.
Unlike most other hazards, droughts develop over a long period of time. It often takes multiple dry years to cause drought conditions, and these conditions may persist for years. They are usually a region-wide
Section 4 Hazard Assessment City of Healdsburg 2023 LHMP 4-3
hazard, and at times may extend statewide or cover multiple states. However, the specific impacts of a drought can depend on local conditions, including water supply systems, soil types, and land uses. As a result, two communities under similar drought conditions may experience different impacts. Droughts may also have a significant impact on communities not directly in the affected area. For example, if a community relies on imported water that travels a great distance, the community may be substantially impacted if a drought occurs at the source of the imported water, even if precipitation levels in the community itself are normal. Similarly, communities may be facing local drought conditions, but impacts may be minor if the community’s water comes from a distant unaffected area.
Strength/Magnitude
There are multiple ways to measure the severity of different drought conditions. The US Drought Monitor Classification Scheme, shown in Table 4-2, combines many of these systems into a single index. D1 is the least intense level and D4 the most intense. Drought is defined as a moisture deficit bad enough to have social, environmental, or economic effects. D0 areas are not in drought but are experiencing abnormally dry conditions that could turn into drought or are recovering from drought but are not yet back to normal.
Table 4-2: US Drought Monitor Classification Scheme
Category Description
Possible Impacts
D0 Abnormally dry Slower growth of crops and pastures compared to normal activities.
D1 Moderate drought Some damage to crops and pastures. Streams, reservoirs, or wells low. Some water shortages may be developing or imminent.
D2 Severe drought Likely crop and pasture losses. Water shortages are common, leading to restrictions.
D3 Extreme drought Major crop and pasture losses. Widespread water shortages.
D4 Exceptional drought Exceptional and widespread crop and pasture losses. Emergency shortages develop.
Source: US Drought Monitor, 2018
Past Occurrences
Droughts are a common feature of the climate in much of California, and many of the state’s native plants and animals have evolved strategies to survive during drought conditions. The state also has an extensive water supply network that helps to reduce the impacts of droughts with the assistance of large storage reservoirs and pipes that can move water from regions with available supplies to drought-affected areas, although this system primarily benefits the urban areas of California.
Historic droughts in California occurred from 1976 to 1977, 1986 to 1992, 2007 to 2009, and 2011 to 2017. During the statewide drought of 1976 to 1977, four Bay Area counties (Contra Costa, Napa, San Mateo, and Marin) were among those where a state disaster was declared. Marin, Solano, and Sonoma counties were affected in the 1986–92 drought, which caused $1.7 billion in crop losses nationwide (Cal OES 2013, as cited by ABAG 2017).
The most recent drought in California lasted from 2019 to 2023 and was declared a state of emergency by Governor Gavin Newsom on April 21, 2021. Initially, it covered the Russian River Watershed of Sonoma and Mendocino counties, but Governor Newsom expanded it statewide October 19, 2021 (California
Section 4 Hazard Assessment 4-4 City of Healdsburg 2023 LHMP
Drought Action 2023). Locally, Sonoma County proclaimed an emergency for drought, the Proclamation of Local Emergency Due to Drought Conditions in the Sonoma County Operational Area. The proclamation was first adopted in April 2021, and the County extended the emergency proclamation through the beginning of 2023. This proclamation was in response to an intensification of the state’s ongoing drought and was guided by mandatory state emergency conservation regulations issued to all water providers in California. The proclamation applied to the entire Sonoma County Operational Area, including all special districts and incorporated cities (including Healdsburg).
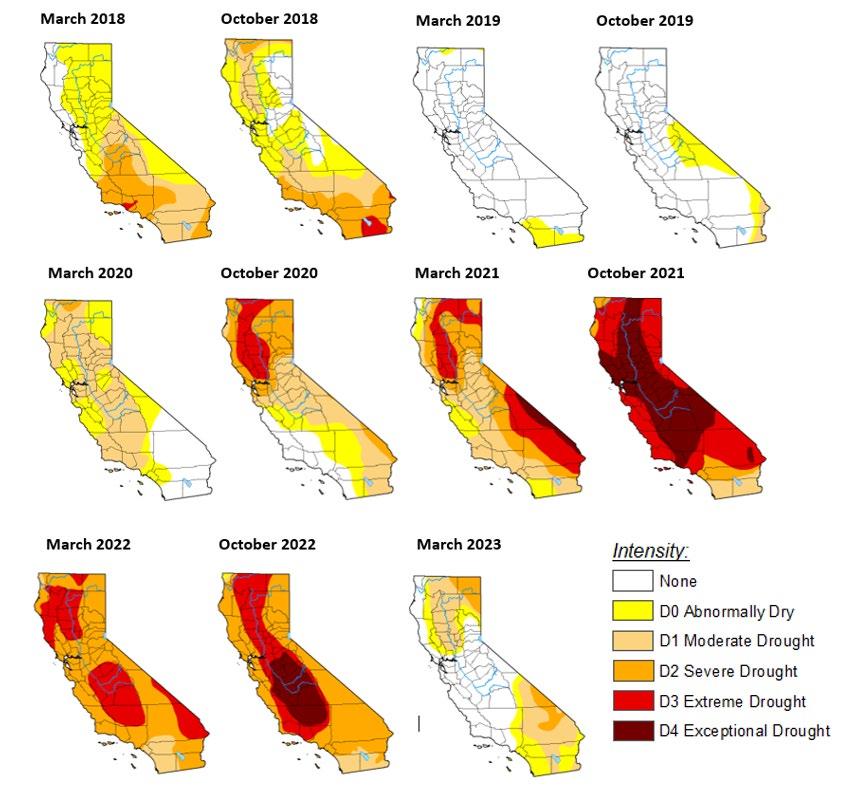
The US Drought Monitor placed nearly all of Sonoma County in the most severe category, D4 (Exceptional Drought), for most of the latter half of 2021, from late July through early December. Figure 4.1 offers snapshots of US Drought Monitor classifications for Sonoma County at the start of California’s rainy season in October and the end of the rainy season in March for each year since 2018. The progression demonstrates how the area affected by the more severe categories spread and receded over the course of the drought. At the end of 2022 and start of 2023, California experienced nine atmospheric rivers over three weeks. The state experienced a flood emergency while still in an active drought emergency. By June 2023, 95% of California was no longer in any drought category, including Healdsburg.
Section 4 Hazard Assessment City of Healdsburg 2023 LHMP 4-5
Location
Droughts are regional by nature, so occurrences of drought that occur in Healdsburg will likely affect the entire city. No one part of the city is at more or less risk of drought conditions, although some areas may be impacted more than others depending on individual water needs and accessibility.
WarningTime
Predicting drought depends on the ability to forecast precipitation and temperature. Only generalized warning can take place due to the numerous variables that scientists have not pieced together well enough to make accurate and precise predictions.
Section 4 Hazard Assessment 4-6 City of Healdsburg 2023 LHMP
Figure 4.1: Drought History for Sonoma County 2018–2023
(See Appendix C for a larger and higher resolution map)
Determination of when drought begins is based on impacts on water users and assessments of available water supply, including water stored in reservoirs or groundwater basins. Different water agencies have different criteria for defining drought. Some issue drought watch or drought warning announcements.
SecondaryHazards
The secondary hazard most associated with drought is wildfire. A prolonged lack of precipitation dries out vegetation, which becomes increasingly susceptible to ignition as the duration of the drought extends. In addition, lack of sufficient water resources can stress trees and other vegetation, making them more vulnerable to infestation from pests, which in turn, can make them more vulnerable to ignition. Millions of board feet of timber have been lost, and in many cases, erosion occurred, which caused serious damage to aquatic life, irrigation, and power production by heavy silting of streams, reservoirs, and rivers.
Frequency/ProbabilityofFutureOccurrence
As noted above, droughts are a regular feature in California. They are almost certain to continue to occur in the future, with varying severity and duration. Healdsburg sources water locally from three well fields: two located along the Russian River and one located on Dry Creek (Healdsburg 2015). Because drought is an expected occurrence in California and Sonoma County, it is highly likely Healdsburg will have future periods of drought.
Since the US Drought Monitor began producing data in 2000, there have been 338 weeks when at least half of Sonoma County was classified as experiencing severe to exceptional drought based on US Drought Monitor categories, or about 29 percent of the time. A more established drought classification system, the Palmer Drought Severity Index, shows that California’s North Coast Drainage climate division (which includes Healdsburg) has experienced periods of severe or extreme drought on six occasions since 1970, or every eight years on average. Such frequencies are likely to increase in the future, as discussed below.
FutureConditionConsiderations
The climate of California has been drier and warmer than in previous decades, and this trend is expected to continue in the state as a whole, according to the most recent climate data. It is likely that drought conditions will become more frequent and more severe as a result. These drier conditions will also alter the timing of water supply availability, potentially impacting Healdsburg if local water sources are affected. A reduction in the overall regional water supply due to reduced precipitation would only exacerbate the local effects of drought. A reduction in snowpack in the mountainous regions of California would also limit options for the City to supplement local water supply with external sources. Ongoing drought not only would reduce local water supply but would also stress regional supplies and constrict the availability of statewide water sources.
4.2.2 Earthquake HazardDescription
The category of seismic hazards includes three different but related hazard types fault rupture, ground shaking, and liquefaction all of which are consequences of earthquakes. Earthquakes themselves are caused by the movement of large pieces of the earth’s crust, called tectonic plates. As the tectonic plates move against each other, they can become stuck together, causing stress between the plates to build up
Section 4 Hazard Assessment City of Healdsburg 2023 LHMP 4-7
until it eventually overcomes the friction holding them together. When this happens, the stress is released and the plates suddenly slip past each other, creating the shaking that is called an earthquake.
Earthquakes occur along boundaries called fault lines. These fault lines may be the actual border between plates, but they may also be borders between two sections of a single plate, created by the repeated process of accumulated and released stress. California sits on the boundary between the Pacific and North American tectonic plates. The motion between these plates occurs primarily on the faults of the Eastern California Shear Zone and the San Andreas fault system, which includes the Healdsburg-Rodgers Creek fault that passes through the eastern and northern areas of the city, as well as the San Andreas fault, 19 miles to the west, and the Maacama fault, 4 miles to the east. Fault rupture is the actual movement of the ground’s surface along a fault line when an earthquake occurs. This movement may be vertical, horizontal, or both, depending on the type of fault. Damage from fault rupture is limited to the area of the fault boundary itself, although depending on the amount of movement along the fault, the damage may be severe. Some earthquakes, known as “blind thrust earthquakes,” occur without causing visible surface rupture, although they may still cause substantial damage. The 1994 Northridge Earthquake, one of the most damaging in California history, was a blind thrust earthquake.
GroundShaking
Ground shaking is generally the most damaging of seismic hazards and is the specific hazard most commonly associated with earthquakes. The severity of ground shaking is affected by local geology, but in general it will be most severe closest to the site of the earthquake and decrease with distance. Ground shaking may occur in an up-and-down, side-to-side, or rolling motion, depending on the type of seismic waves produced by the earthquake.
Liquefaction
Liquefaction occurs when loosely packed sand or silt is saturated with water and then shaken hard enough for it to temporarily behave like a fluid. This causes the soil to lose its strength, which may in turn damage structures built on or in it in a variety of ways. Liquefaction risk depends primarily on the height of the groundwater table and the composition of the soil.
Strength/Magnitude
Ground shaking is measured using either the moment magnitude scale (MMS, denoted as Mw or simply M) or the Modified Mercalli Intensity (MMI) Scale. The MMS is a replacement for the Richter scale, which is still often referred to but is no longer actively used, as the Richter scale is not reliable when measuring large earthquakes (USGS 2023). The weakest earthquakes measured by the MMS start at 1.0, with the numbers increasing with the strength of the earthquake. The strongest recorded earthquake, which struck Chile in 1960, measured 9.5 on the MMS (USGS 2023). Like the Richter scale, the MMS is a logarithmic scale, meaning the difference in strength between two earthquakes is much larger than the difference in their measurements. For example, a M6.0 earthquake is 1,000 times stronger than a M4.0 earthquake and about 1.4 times as strong as a M5.9 event.
The MMI Scale is based on the damage caused by the earthquake and how it is perceived, rather than an actual measurement. When comparing multiple earthquakes, one event may have a higher Mercalli rating than another even if it released less energy and thus was measured lower on the MMS. The MMI scale
Section 4 Hazard Assessment 4-8 City of Healdsburg 2023 LHMP
ranges from I (instrumental, rarely felt by people) to XII (catastrophic, total damage and lines of sight are distorted). Table 4-3 shows a general comparison between the MMS and the MMI Scale. Note that there is some overlap toward the higher end of the Mercalli ratings, with certain intensities produced by multiple ranges of magnitude measurements.
1.0 to 3.0
I Not felt except by very few people under especially favorable conditions.
II Weak: Felt only by a few persons at rest, especially on upper floors of buildings.
3.0 to 3.9
III Weak: Felt quite noticeably by persons indoors, especially on upper floors of buildings. Many people do not recognize it as an earthquake. Standing motor cars may rock slightly. Vibrations are similar to the passing of a truck. Duration estimated.
IV Light: Felt indoors by many, outdoors by few during the day. At night, some awakened. Dishes, windows, doors disturbed; walls make cracking sound. Sensation like heavy truck striking building. Standing motor cars rocked noticeably.
V Moderate: Felt by nearly everyone; many awakened. Some dishes and windows broken. Unstable objects overturned. Pendulum clocks may stop.
VI Strong: Felt by all, many frightened. Some heavy furniture moved; a few instances of fallen plaster. Damage slight. 6.0 to 6.9
VIII Severe: Damage slight in specially designed structures; considerable damage in ordinary substantial buildings with partial collapse. Damage great in poorly built structures. Fall of chimneys, factory stacks, columns, monuments, walls. Heavy furniture overturned.
IX Violent: Damage considerable in specially designed structures; well-designed frame structures thrown out of plumb. Damage is great in substantial buildings, with partial collapse. Buildings shifted off foundations.
VII Very Strong: Damage negligible in buildings of good design and construction; slight to moderate in well-built ordinary structures; considerable damage in poorly built or badly designed structures; some chimneys broken. 7.0 and greater
X Extreme: Some well-built wooden structures are destroyed; most masonry and frame structures are destroyed with foundations. Rails bent.
XI Extreme: Few, if any (masonry) structures remain standing. Bridges destroyed. Rails bent greatly.
XII Extreme: Damage total. Lines of sight and level are distorted. Objects thrown into the air.
Source: USGS 2023a
Section 4 Hazard Assessment City of Healdsburg 2023 LHMP 4-9
Magnitude (MMS) Modified Mercalli Intensity (MMI) Scale Intensity Description
Table 4-3: Comparison of MMS and MMI Scale
4.0 to 4.9
5.9
5.0 to
Past Occurrences
Earthquakes in California are a frequent occurrence, and smaller earthquakes often do not cause damage or disruption. There have been a few significant earthquakes in the region, though several happened prior to 1900 when documentation was less reliable. Table 4-4 lists significant earthquakes that have occurred since 1868 in the Healdsburg region.
According to the City’s General Plan, the only reported case of liquefaction in Healdsburg was during the 1906 San Francisco earthquake, when there was evidence of lateral spreading and sand boils along the banks of the Russian River.
The city is in a seismically active region, and all of Healdsburg is at risk of one or more seismic hazards. Table 4-5 shows faults in proximity to Healdsburg, along with their distance from the city and maximum moment magnitude.
4
4-10 City of Healdsburg 2023 LHMP
Section
Hazard Assessment
Earthquake Name Year Fault Location Damage in Healdsburg Magnitude MMI Scale –Healdsburg Hayward 1868 Southern Hayward East Bay Moderate Unknown V–VI Winters 1892 Unknown Central Valley Minor to moderate Unknown V Santa Rosa 1893 Unknown 8 miles east of Santa Rosa Minor Unknown V Mare Island 1898 Rodgers Creek Mare Island Moderate M6.3 V–VI Great San Francisco 1906 San Andreas Near San Francisco Extensive M7.9 VII–IX Santa Rosa 1969 Rodgers Creek Northern Santa Rosa Minor M5.6 and M5.7 VI Loma Prieta 1989 Near San Andreas Near Santa Cruz Slight M7.1 V South Napa 2014 West Napa Fault Near Napa None M6.0 IV
USGS 2023c
Table 4-4: Earthquakes Felt in Healdsburg
Source:
Location
qew
Source: Healdsburg, City of, 2015.
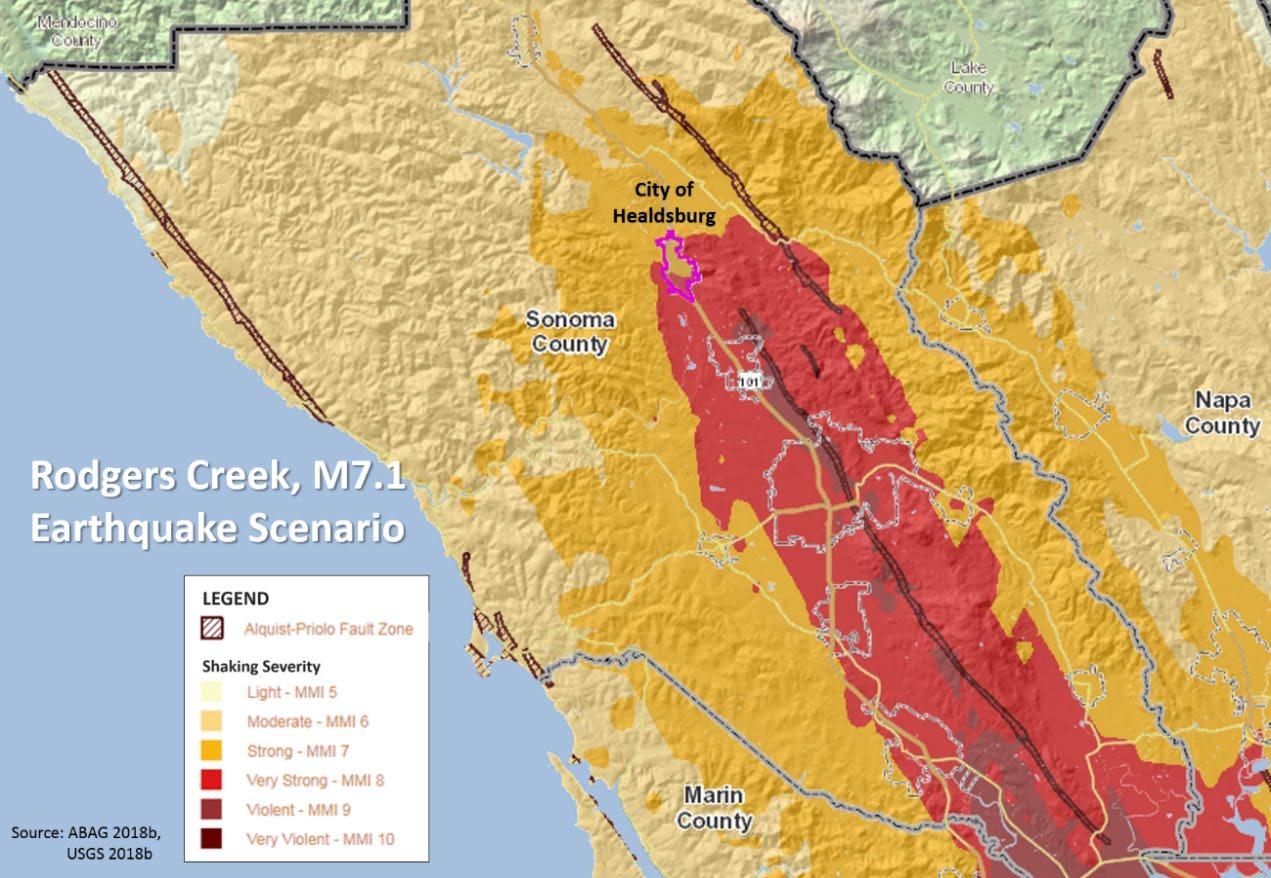
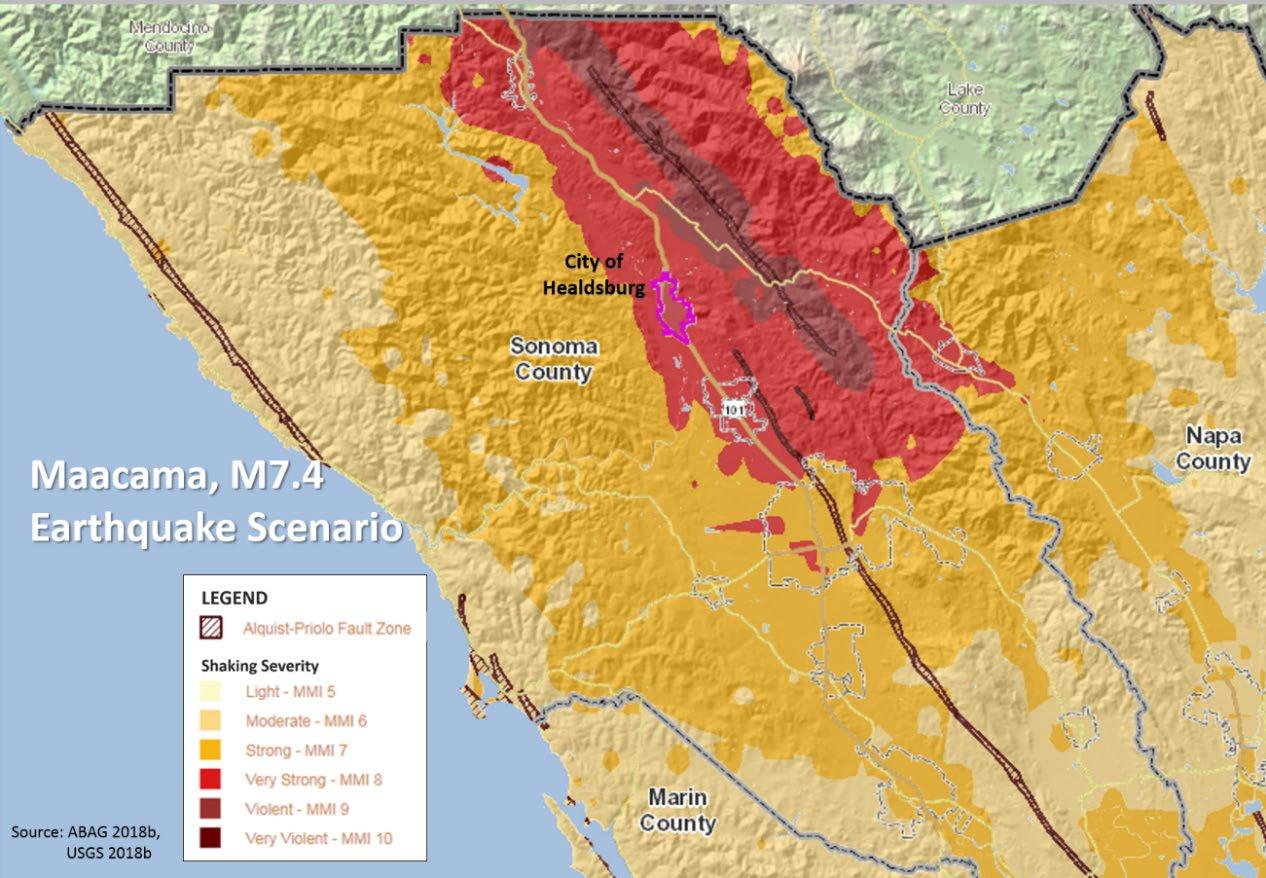
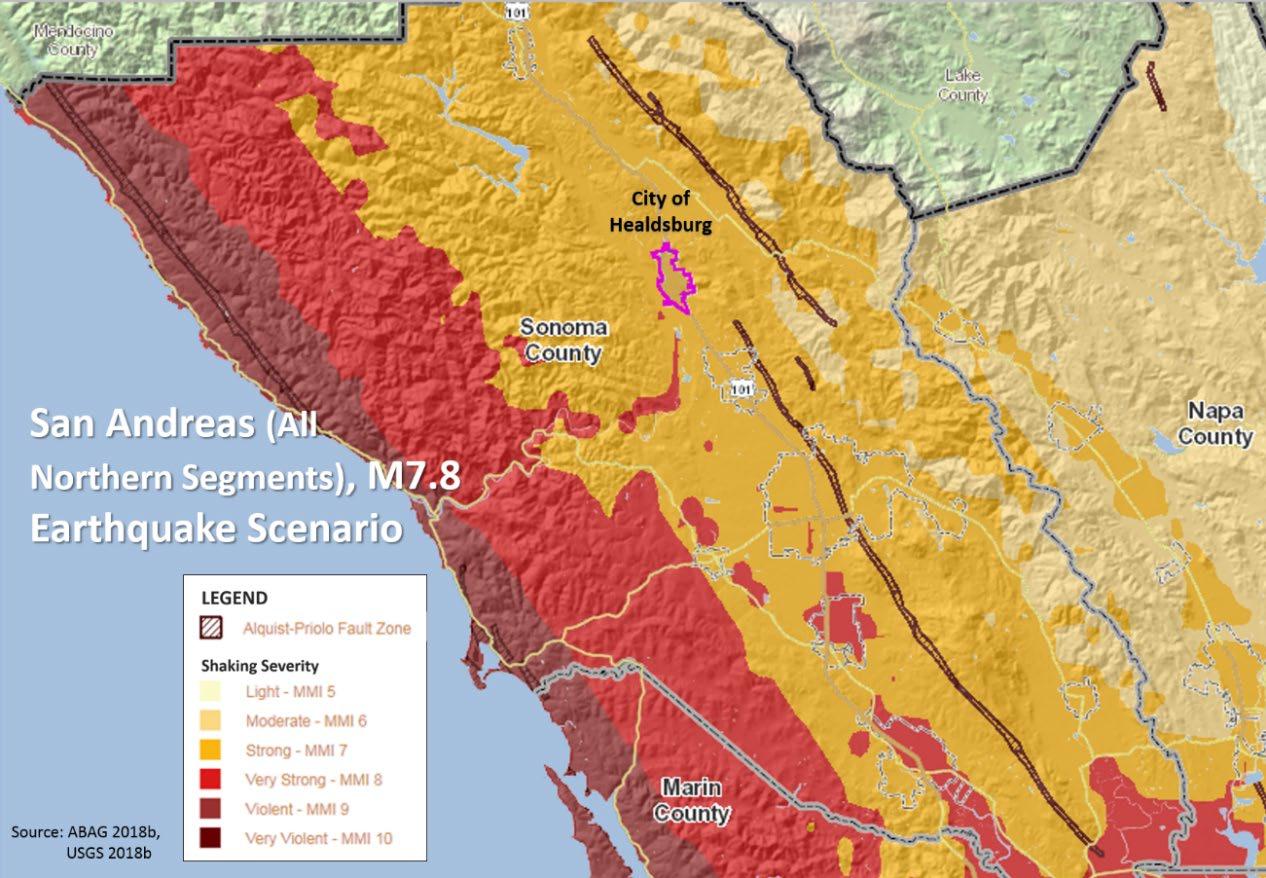
Scenario-specific ShakeMaps for the Rodgers Creek, Maacama, and San Andreas faults are illustrated in Figures 4.2 through 4.4. These maps illustrate the expected level of ground shaking based on a specific event. Although it has not been mapped as part of California’s Alquist-Priolo Earthquake Fault Zoning Act (which regulates areas at risk of fault rupture), a stepover from the Rodgers Creek fault extends through the city. Sometimes identified as the Healdsburg fault, it follows the hills on the city’s eastern boundary before passing through the Saggio Hills Planning Area.
Section 4 Hazard Assessment City of Healdsburg 2023 LHMP 4-11
Fault Distance and Direction from Healdsburg Maximum Moment Magnitude Healdsburg-Rodgers Creek Crosses portions of Healdsburg 7.0 Maacama 4.5 miles north 6.9 San Andreas 19 miles west 7.9 Hunting Creek 29 miles northeast 6.9 West Napa 28 miles southeast 6.5 Concord-Green Valley 40 miles east 6.9 Cordelia 43 miles southeast 6.7 Hayward 46 miles southeast 7.1 San Gregorio 52 miles south 7.3
Table 4-5: Fault Parameters
Figure 4.2: Rodgers Creek Fault ShakeMap
Section 4 Hazard Assessment 4-12 City of Healdsburg 2023 LHMP
Figure 4.3: Maacama Fault ShakeMap
Figure 4.4: San Andreas (All Northern Segments) Fault ShakeMap
Figure 4.5 shows faults that have been active within the last 1.6 million years, including those in Healdsburg and the surrounding county, as well as the epicenters of earthquakes since 1973 that measured at least M3.5. The map indicates a cluster of earthquakes near The Geysers, a geothermal field about 14 miles northeast of Healdsburg. These earthquakes are frequent but relatively weak, associated with human actions at the Calpine Corporation’s power plant as opposed to fault activity. Geologists do not believe that the field is capable of producing a strong, destructive earthquake (USGS 2023).
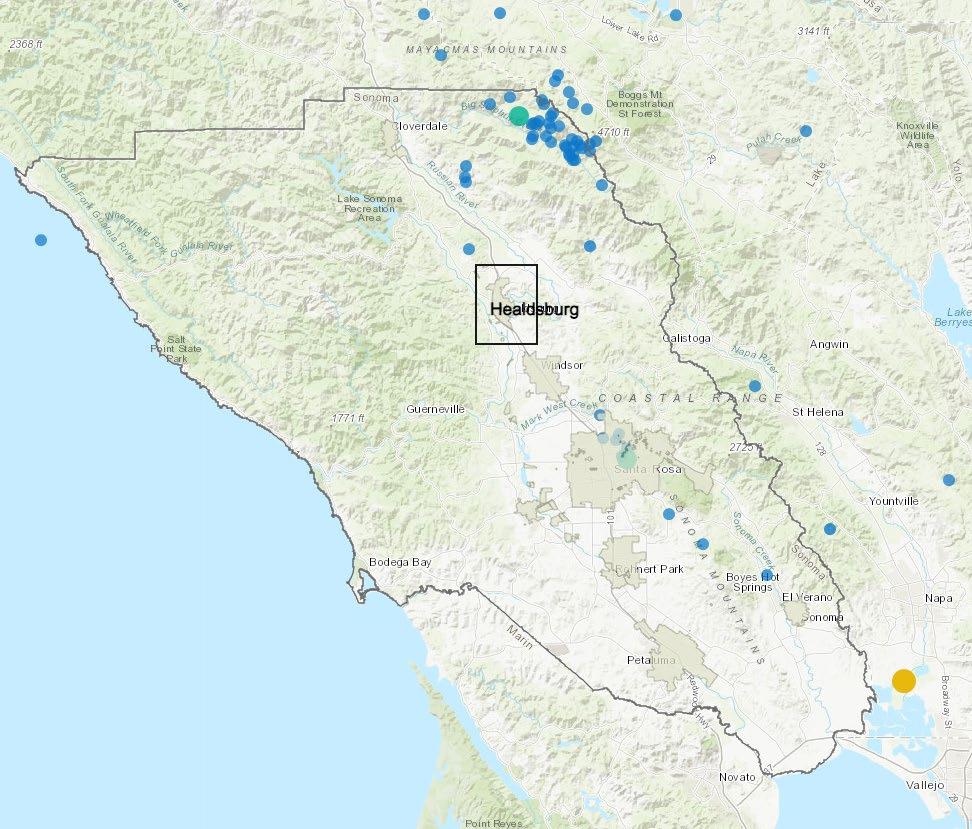
Figure 4.5: Historic Earthquake Activity in Sonoma County
(See Appendix C for a larger and higher resolution map)
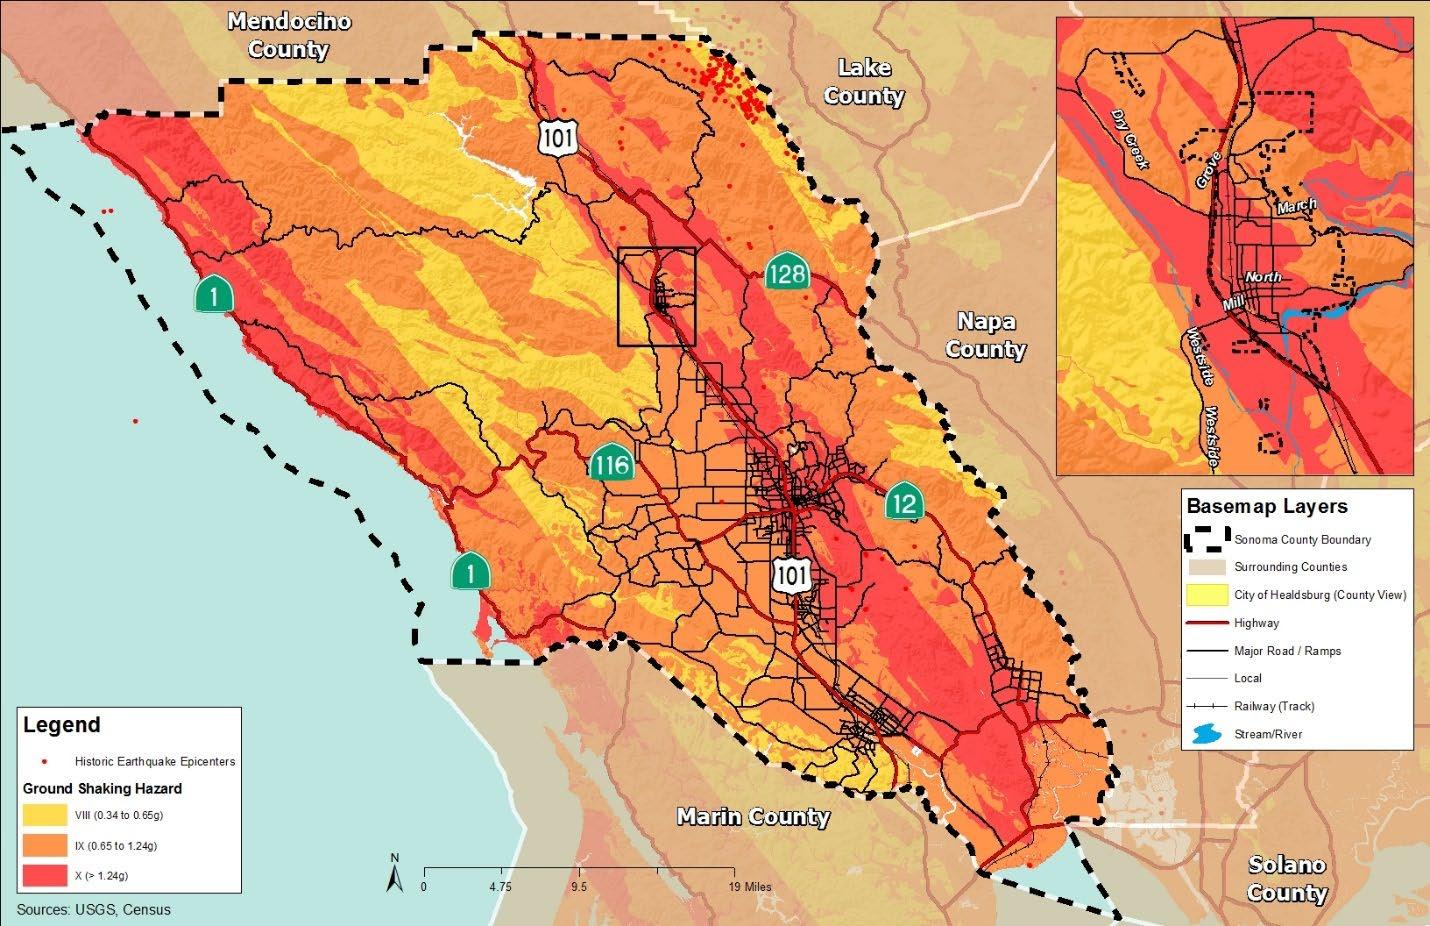
Healdsburg’s seismic risk comes primarily from regional faults in the area. US Geological Survey (USGS) studies show that these faults are capable of producing earthquakes with a peak ground acceleration equivalent to a g-force of 0.65 or greater throughout much of Sonoma County, including the entirety of Healdsburg. Two MMI categories of ground shaking are present in Healdsburg, Category IX described as violent shaking and Category X described as extreme shaking. Figure 4.6 shows which areas are susceptible to different levels of ground shaking.

Section 4 Hazard Assessment City of Healdsburg 2023 LHMP 4-13
Different from the scenario specific ShakeMaps above, Figure 4.6 illustrates the overall shaking potential or the overall susceptibility. This map takes into account potential shaking on all major faults and incorporates that information into a single map, with the goal of illustrating the maximum level of shaking anticipated from any earthquake event. As described by the California Geological Survey (CGS), earthquake shaking potential is calculated considering historic earthquakes, slip rates on major faults and deformation throughout the region, and the potential for amplification of seismic waves by near-surface geologic materials. The complete analysis is called a Probabilistic Seismic Hazard Analysis. The resulting earthquake shaking potential is used in developing building code design values, estimating future earthquake losses, and prioritizing earthquake retrofit (Branum, Chen, Peterson & Wills 2016).
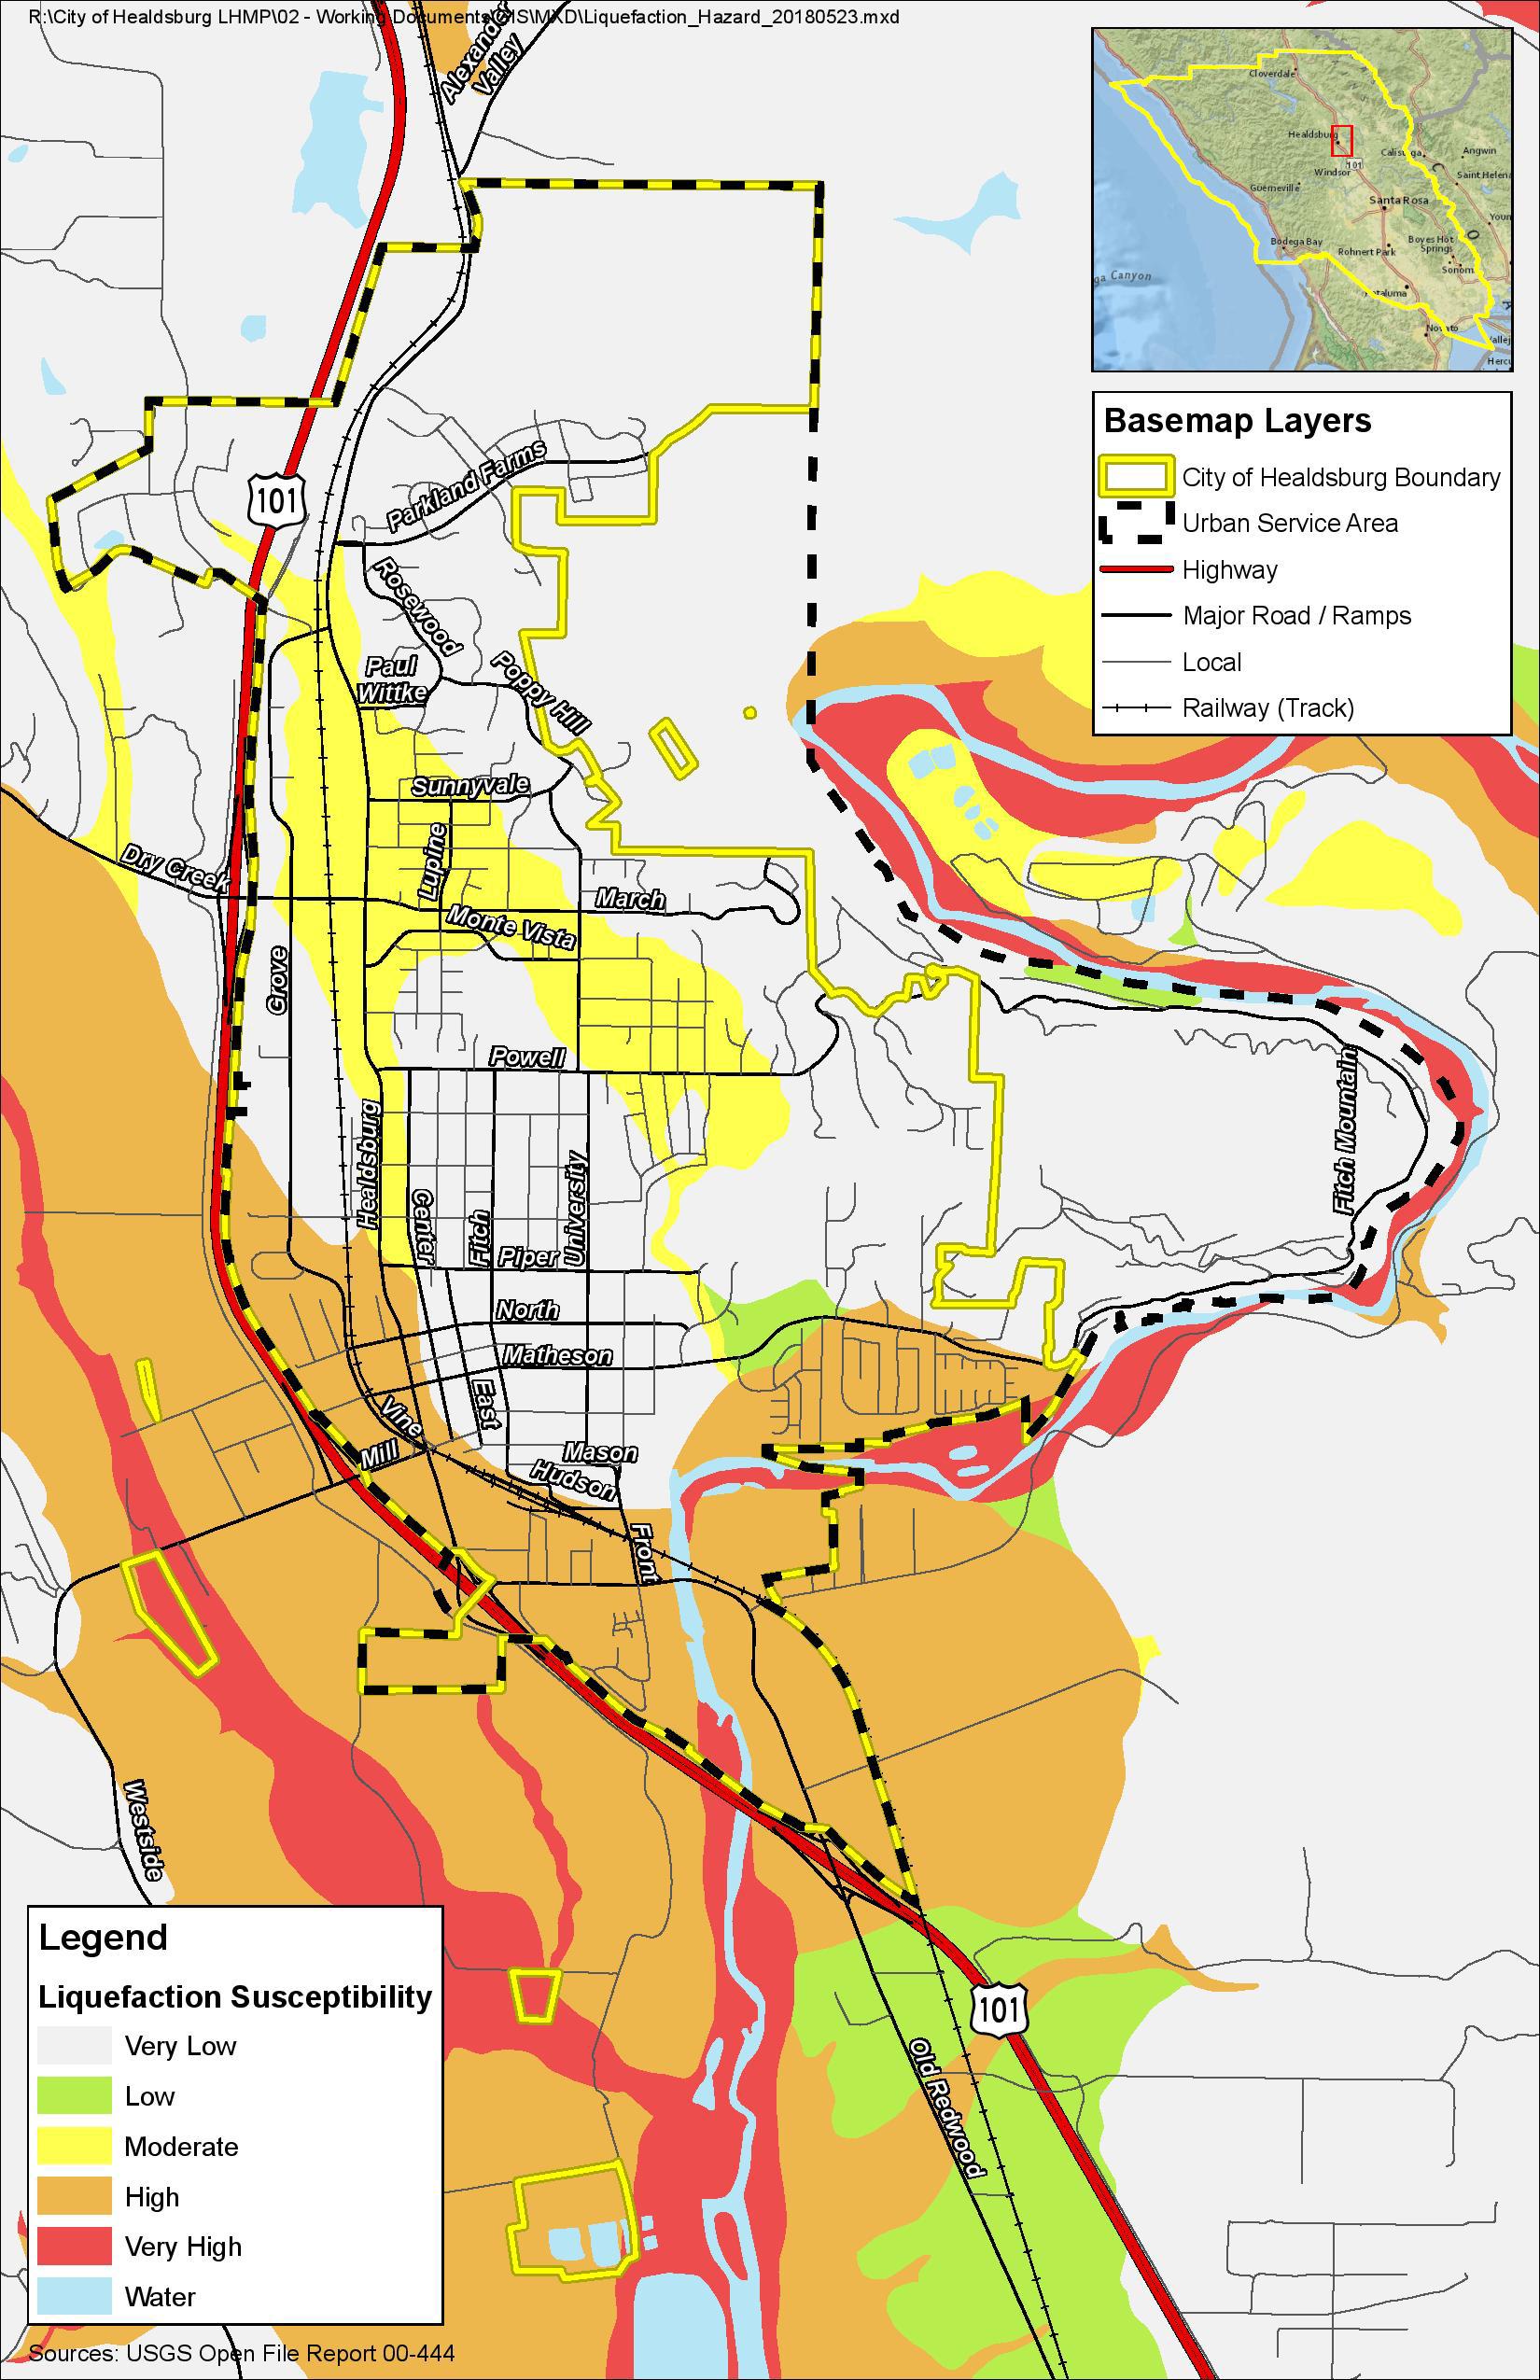
Most of Healdsburg has a very low to moderate susceptibility to liquefaction, although there are areas of high susceptibility along the city’s southern edge that includes portions of downtown west of Center Street and residential subdivisions on the north bank of the Russian River. Figure 4.7 shows liquefaction hazard areas in the city.
4
4-14 City of Healdsburg 2023 LHMP
Section
Hazard Assessment
Figure 4.6: Susceptibility to Ground Shaking in Sonoma County (See Appendix C for a larger and higher resolution map)
Section 4 Hazard Assessment City of Healdsburg 2023 LHMP 4-15
Figure 4.7: Liquefaction Susceptibility in Healdsburg (See Appendix C for a larger and higher resolution map)
WarningTime
There is no current reliable way to predict the day or month that an earthquake will occur at any given location. Research is being done with warning systems that detect the lower energy compressional waves (P waves) that precede the secondary waves (S waves) experienced as an earthquake. Earthquake early warning systems may provide a few seconds’ or minutes’ notice that a major earthquake is about to occur. The warning time is very short, but it could allow for someone to get under a desk, pause hazardous or high-risk work, or initiate protective automated systems in structures or critical infrastructure.
SecondaryHazards
Earthquakes can cause landslides, often as a result of loss of cohesion in clay-rich soils. Earthen dams and levees are highly susceptible to seismic events, and the impacts of their eventual failures can be considered secondary risk exposure to earthquakes. Additionally, fires can result from gas lines or power lines that are broken or downed during the earthquake. It may be difficult to control a fire, particularly if the water lines feeding fire hydrants are also broken.
Frequency/ProbabilityofFutureOccurrence
Seismologists do not know when a large earthquake will hit the region again but do know that one will occur. The city’s location on and near numerous faults, including several capable of causing significant earthquakes, means that Healdsburg will continue to face threats from earthquakes and related hazards.
The third Uniform California Earthquake Rupture Forecast (UCERF3), developed in 2014 by the Working Group on California Earthquake Probabilities and led by the USGS, provides estimates of the magnitude, location, and likelihood of fault rupture for more than 2,600 fault segments throughout the state, including two segments of the Rodgers Creek fault that passes through Healdsburg. The forecast for these segments indicates a 5.5 to 6.9 percent chance that a M6.7 earthquake will occur within the next 30 years.
Table 4-6 lists faults in Sonoma County included in UCERF3, showing the range of probabilities for earthquakes of varying magnitude occurring on a fault segment within the next 30 years.
Figure 4.8 illustrates the probability forecasts of the three faults of greatest concern (Rodgers Creek, Maacama, and San Andreas-Northern Coast) for M>6.7, M>7.5 and M>8.0 earthquakes A single probability is not provided for an entire fault; rather, the probability varies depending on the location on the fault in question. To illustrate the range in probabilities for each fault, three points on each fault have been chosen, points that represent the lowest and highest probabilities as well as a mid-range probability.
Section 4 Hazard Assessment 4-16 City of Healdsburg 2023 LHMP
M6.7 M7.0 M7.5 Fault Min. Max. Avg. Min. Max. Avg. Min. Max. Avg. Bennett Valley 0.01% 1.75% 0.27% 0.01% 1.25% 0.2% 0.01% 0.55% 0.1% Hayward 7.18% 19.97% 13.06% 5.79% 17.31% 11.12% 0.33% 7.64% 3.54% Maacama 4.78% 16.19% 9.09% 4.19% 14.42% 8.32% 0.01% 7.58% 1.86% Rodgers CreekHealdsburg 1.31% 14.92% 6.93% 0.72% 12.5% 6.02% 0.04% 5.88% 2.31% San Andreas (North Coast) .12% 18.85% 6.76% 0.11% 18.2% 6.64% 0.1% 16.93% 6.35%
Table 4-6: UCERF3 30-Year Earthquake Probabilities by Fault
Source: WGCEP 2021
Faults not identified in the forecast are still capable of causing significant earthquakes. Depending on the magnitude and location of the earthquake, Healdsburg could be affected by earthquakes originating in all parts of the Bay Area.

FutureConditionConsiderations
The likelihood, size, and severity of seismic events are not expected to be directly impacted by any changes in future climate conditions. It is possible that anticipated changes to precipitation levels and storm intensity may affect groundwater aquifer levels, which could expand or contract areas of potential liquefaction in the Planning Area.
4.2.3 Flooding
HazardDescription
Flooding occurs when normally dry land is partially or completely inundated and can occur for a number of reasons. The water levels in bodies such as streams, rivers, lakes, and reservoirs can exceed the water body’s banks due to heavy rainfall or snowmelt, causing water to overflow into nearby areas. Heavy precipitation can overwhelm the ability of soil to absorb water or of local storm drains to carry it away, causing water to build up on the surface. Flooding may also occur from infrastructure failure, such as a burst water tank or dam failure.
Dam failure occurs when a dam structure or its foundation is damaged to such a degree that the dam partially or completely loses its ability to hold back water. When this happens, some or all of the water impounded by the dam is suddenly released, causing a very fast-moving flood downstream of the dam.
Section 4 Hazard Assessment City of Healdsburg 2023 LHMP 4-17
Figure 4.8: UCERF3 30-Year M6.7 Earthquake Probabilities (Source: WGCEP 2021)
Like other flash floods, dam failures can cause widespread injury or loss of life, extensive property damage, and displacement of a large number of people in the flood’s path. If the failed dam is part of a water supply network, a dam failure may also cause local and regional disruption to water service if there is no sufficient alternative supply.
Dams can fail for a number of reasons. Seismic or geologic hazards, such as earthquake shaking or a landslide, may damage the dam or its foundations, causing it to weaken to the point of failure. During intense rainfalls, the dam itself or the surrounding rock can erode sufficiently to cause a failure. Additionally, the dam itself may be poorly sited, designed, or maintained, and so may collapse independent of any other hazard event. At times, these factors can work together, such as if a design flaw in a dam causes the floodwaters from an intense rainfall to erode parts of the dam and lead to a failure. Regardless of the type of flood, a flood event can damage buildings and infrastructure either by debris carried along in the water or by the pressure of the water itself. Floods can weaken foundations and wash away soil, increasing the risk of damage or destruction. According to California’s Multi-Hazard Mitigation Plan, floods are the second most common disaster type in California, second only to fires (CNRA and Cal OES 2020).
Strength/Magnitude
Flood severity is often described in years, such as a 100-year event. This does not mean that such an event will occur just once every 100 years. Rather, the term indicates a 1-in-100 probability, or that there is a 1 percent risk of such an event in any given year. Similarly, a 500-year flood indicates the risk of such an event is 1-in-500, or 0.2 percent, in any given year.
The magnitude of a flood may also be expressed in terms of the water’s depth. A 2017 flood control study prepared for the City of Healdsburg by West Yost Associates estimated flood depths along Foss Creek, the city’s primary source of flood risk. Using historic rainfall totals logged by the National Oceanic and Atmospheric Administration, along with locally collected hydrologic and hydraulic modeling, the study generated a flooding scenario that would result from a storm with a 1 percent chance of occurring in any given year. Based on existing conditions in the city, the report estimated that such a flood would produce 1.0 to 4.3 feet of flooding at eight locations, with an average depth of 2.3 feet.
Past Occurrences
The most recent flooding in Healdsburg occurred between February 24-March 1, 2019. This flood had a peak discharge of 67,300 cubic feet per second recorded and the flood reached a gauge height of 26.84 feet at Healdsburg The majority of the flooding was in the Rivers Bend neighborhood with some flooding occurring downtown from Foss Creek. The city’s water reclamation facility also flooded causing significant damage to the facility and its contents.
A December 2014 flood originating from Foss Creek was Healdsburg’s most significant event. Following a series of storms, more than 8 inches of rain fell in a 24-hour period on December 10 and 11, flooding about 78 acres in the downtown area. The City identified 178 residential buildings and 143 commercial buildings that were affected, with roughly two dozen businesses suffering interior water damage. Total damage was estimated at $1.5 million.
Section 4
4-18 City of Healdsburg 2023 LHMP
Hazard Assessment
Sonoma County has experienced significant flooding on the Russian River on at least seven occasions since 1955. Of these, only the three most severe events caused flooding in Healdsburg. In those cases, inundated areas were centered on the bend in the river upstream of the Healdsburg Avenue bridge near Badger Park. The largest flood in recent history occurred between February 14 and 18, 1986, when a peak discharge of 102,000 cubic feet per second was recorded and the flood reached a gauge height of 48.6 feet at Guerneville. Heavy rains fell from December 26, 2005, to January 3, 2006, and the Russian River rose above flood stage at all USGS gaging stations in Sonoma County. At Guerneville, the river crested at 41.6 feet. The rainfall measured in the City of Santa Rosa during this storm was near record-setting at 17.6 inches. The President declared this flood a major disaster, and more than 100 roadways were blocked due to flooding or landslides.
Areas that flooded during February 1986, December 2005–January 2006, December 2014, and FebruaryMarch 2019 events are shown in Figure 4.9.
Section 4 Hazard Assessment City of Healdsburg 2023 LHMP 4-19

Section 4 Hazard Assessment 4-20 City of Healdsburg 2023 LHMP
Figure 4.9: Historic Flooding in Healdsburg (See Appendix C for a larger and higher resolution map)
The city has never experienced flooding caused by a dam failure, nor have there been any significant dam failures elsewhere in Sonoma County. The near-catastrophic failure of the spillway of the Oroville Dam in Butte County, about 100 miles northeast of Healdsburg, in 2017 posed no direct threat to the city but serves as a reminder of the ongoing risk presented by dams.
Location
The Russian River and Foss Creek are the dominant flooding hazards for Healdsburg, with Foss Creek causing most of the flooding in the city.
FEMA produces Flood Insurance Rate Map (FIRM) panels that identify which areas would be affected by flood events with a 1 percent and 0.2 percent chance of happening in any given year. FEMA revised its flood maps for the Healdsburg area in 2006. In addition, Healdsburg’s Public Works Department submitted an application for a Letter of Map Revision that modified the floodway for Foss Creek from where it crosses Grove Street to where it crosses US Highway 101; these revisions became effective in 2010. Figure 4.10 shows the location of flood hazard zones based on current FEMA data.
Section 4 Hazard Assessment City of Healdsburg 2023 LHMP 4-21
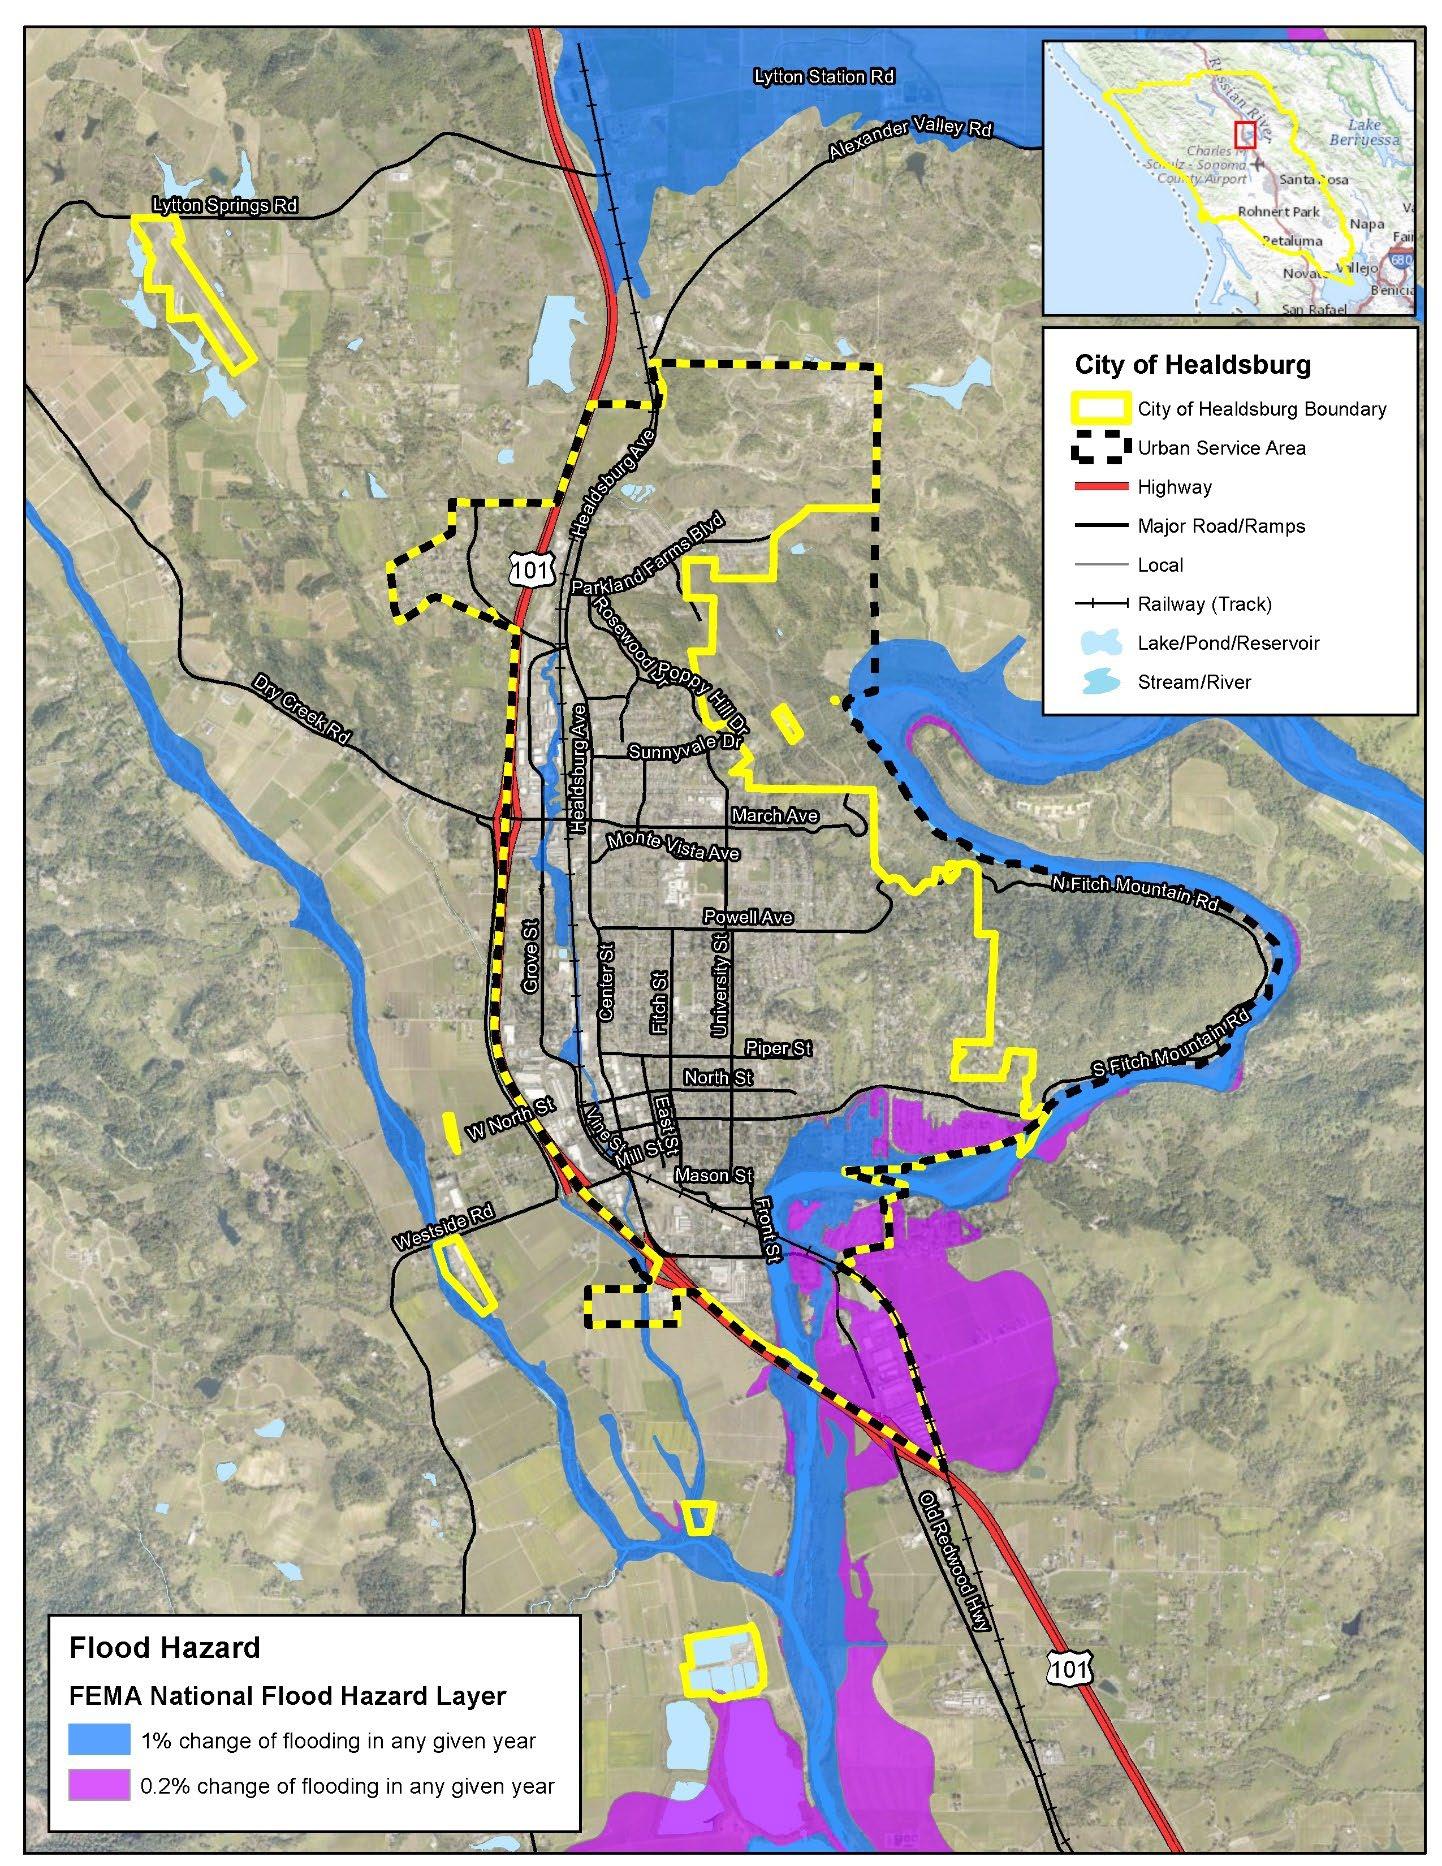
Section 4 Hazard Assessment 4-22 City of Healdsburg 2023 LHMP
Figure 4.10: Flood Hazard Zones for Healdsburg (See Appendix C for a larger and higher resolution map)
RussianRiver
The Russian River extends 110 miles and drains approximately 1,500 square miles in Mendocino and Sonoma counties into the Pacific Ocean. The river defines part of the eastern boundary of Healdsburg’s Urban Service Area. After rounding Fitch Mountain, the river crosses the city’s southern tip. FEMA’s flood maps show much of this area has at least a 0.2 percent annual chance of flooding, with a 1 percent annual chance for parts of Badger Park and the Rio Vista Estates subdivision. All or portions of approximately 100 homes and a few nonresidential properties within the city limits are included in the river’s 1 percent annual chance flood hazard zone. To maintain participation in the National Flood Insurance Program (NFIP), the City updated its floodplain regulations to bring the City’s floodplain management ordinance into conformance with the current federal regulations and adopted the new flood hazard map.
FossCreek
The other important surface water in the city is Foss Creek, which has its origins at the northeastern-most corner of the city’s Urban Service Area and empties into the Russian River. Most of the area within the city limits and over half of the Urban Service Area falls within the drainage area of Foss Creek. A portion of the Urban Service Area to the north of the city limits drains to Alexander Valley, and the balance of the Urban Service Area drains to the Russian River. Foss Creek runs north–south through town, roughly paralleling the Northwestern Pacific Railroad tracks, and flows first through a detention basin near the northern city limits (75 acre-feet capacity) and to a second detention basin (off-stream) south of Dry Creek Road (49 acre-feet capacity), then runs south in channels and conduits, leaving the city through double concrete boxes under US Highway 101 near Exchange Avenue and Healdsburg Avenue. The northern detention basin, located north of the Parkland Farms subdivision, was sized to accommodate anticipated development in the Foss Creek watershed portion of the city’s northern Planning Area. The detention basin accepts increases in storm runoff from development and detains the peak storm flows, thereby reducing downstream flooding. The detention basin is designed with upper and lower sections so that the lower area nearest the creek has 3:1 banks, fills first, and functions as a riparian habitat and wetland. During a peak storm, an infrequent event, the upper portion of the detention basin fills as stormwater backs in from the lower area. This area is designed with a gradual 6:1 slope and rectangular shape to be available for secondary use as a recreational area. The detention capacity for the basin was calculated for housing densities higher than have actually been approved, resulting in a substantial factor of safety Therefore, no other major flood control or off-site storm drain improvements are anticipated to be required for further development in the northern Planning Area. This was the basis of the flood map amendment the City filed with FEMA, reflecting a significant reduction in the flood hazard areas for Foss Creek as a result of the detention basins’ construction.
The 2014 flood, however, inundated areas outside the revised hazard areas shown on FEMA flood maps, even as the detention basins functioned as intended. The Foss Creek Flood Control Study by West Yost Associates found the storm that produced the flood was less than a 1 percent annual chance event, with approximately a 1-in-67 chance of occurring in any given year. The study further estimated that a rainstorm with a 1-in-100 annual probability would flood much of southwestern Healdsburg and the downtown area, as shown in Figure 4.10. All this suggests that the hazard posed by Foss Creek may not be limited to the Special Flood Hazard Area shown on FIRM panels, and properties that do not fall within the regulatory 1 percent annual chance floodplain may still be at risk of flooding.
Section 4 Hazard Assessment City of Healdsburg 2023 LHMP 4-23
DamFailureInundation
Flood control for the lower Russian River is provided primarily by Warm Springs Dam. It is located on Dry Creek, a tributary of the Russian River, approximately 10 miles northwest of the city. Lake Sonoma was created by the dam and has a storage capacity of 381,000 acre-feet and a total surface area of 3,600 acres. Warm Springs Dam is located on a medium-sized fault but was designed to absorb the maximum expected displacement and ground shaking from any fault in the region. Failure of this dam could inundate most of the city, to an elevation of 230 feet.
Coyote Dam is an earthen dam on the East Fork of the Russian River above Ukiah (north and upstream of the city, in Mendocino County) and is part of a system that provides water to Mendocino, Sonoma, and Marin counties. The dam provides storage capacity of 122,500 acre-feet at Lake Mendocino. Failure of this dam could inundate the southern portion of the city with water traveling down the Russian River.
WarningTime
Due to the sequential pattern of meteorological conditions needed to cause serious flooding, it is unusual for a flood to occur without warning. Warning times for floods can be between 24 and 48 hours. Flash flooding can be less predictable, but potential hazard areas can be warned in advanced of potential flash flooding danger. Flash flooding is infrequent in the planning area.
As major storm systems approach, the National Weather Service, in coordination with the California Department of Water Resources, monitors weather conditions and real-time precipitation and river stage data; forecasts the amount and timing of expected precipitation; and issues official river forecasts and hydrologic statements. Updated a minimum of twice daily, these river forecasts are available as both text products and as graphical river guidance plots, which provide river stage information for each official forecast point for the next five days following the forecast issuance. As storm events continue with streams and rivers rising to threatening levels, these forecasts may be updated more frequently if needed.
SecondaryHazards
The most problematic secondary hazard for flooding is bank erosion. In many cases the threat and effects of erosion are worse than actual flooding. This is especially true on the upper courses of rivers where there are steep gradients. Floodwaters in these reaches may pass quickly and without much damage, but scour the banks, edging properties closer to the floodplain or causing them to fall in. Flooding is also responsible for hazards such as landslides when high flows over-saturate soils on steep slopes, causing them to fail. Hazardous materials spills are also a secondary hazard of flooding if storage tanks rupture and spill into streams, rivers or drainage sewers.
Frequency/ProbabilityofFutureOccurrence
Areas illustrated in blue in Figure 4.10 have a 1 percent chance of flooding in any given year. There is a 0.2 percent chance that a flood will occur in any given year in the floodplain areas shown in purple. Some flooding may occur annually, but it may not be as severe as a 1 percent annual chance event, and it may not occur within the identified 1 percent annual chance floodplain. Significant, widespread flooding is most likely to occur when heavy rains fall over already saturated ground.
The risk of flooding can increase significantly in areas that have been burned by wildfire. Fires alter terrain and ground conditions, eliminating vegetation that can absorb rainfall. Flooding is also often more severe,
Section 4 Hazard Assessment 4-24 City of Healdsburg 2023 LHMP
as ash and debris left from the fire can contribute to mudflows. It can take up to five years before vegetation is restored. See the Wildfire section (Section 4.2.5) for information on areas at risk of wildfire.
The lack of any previous dam failure events in Sonoma County makes it difficult to make a precise prediction about future probability. A 2018 independent forensic report on the Oroville Dam incident identified systemic failures in dam safety regulations and industry practices and suggested that dam owners may be overconfident in their assessments (IFT 2018). Still, with only two actual failures among California’s 1,500 dams in the last 90 years and none since 1963, future occurrences can still be regarded as extremely unlikely.
FutureConditionConsiderations
There is some evidence that frequent intense storms, known as atmospheric river events, could increase in the coming decades. Statewide, some studies suggest that more years will have an increased number of atmospheric river events and that the largest of these atmospheric river events will be more intense than they have been historically (Dettinger 2011). In general, Northern California is expected to see more frequent atmospheric river events, potentially up to twice as many by 2100 as the region currently does, while Southern California is expected to see the same number of atmospheric river events but with each individual storm an average of 10 to 20 percent more intense. However, the specific impacts on the Healdsburg region are not yet known (Oskin 2014).
As noted in the Drought section, dry conditions cause soil to harden, making it less absorbent to precipitation and increasing the risk of flooding, particularly at the beginning of the rainy season. Since drought conditions are expected to increase also, there is a greater risk of flooding from drought-induced changes in soil characteristics. These impacts may already be felt; in July 2015, Lieutenant Governor Gavin Newsom, acting temporarily as governor, issued a disaster proclamation for large parts of Southern California due to flooding and related hazards as a result of severe storms. In the proclamation, Newsom noted the drought’s impact of drying out soil and increasing the risk of flash floods (Office of the Governor 2015).
4.2.4 Landslide
HazardDescription
Landslides occur when the soils of a slope, such as a hillside or mountain, become unstable. When this happens, the soil slides down toward the base of the slope, damaging or destroying structures built on the moving soil or in its path. While landslides are often thought of as fast-moving events, some landslides may happen slowly over a long period of time.
The types of materials that compose a slope and the steepness of the slope help determine the overall risk that a landslide may occur. Soil stability and time also contribute to the risk of rockfall, which is of particular risk along roadways and trails where a path or highway has been cut into a hillside, exaggerating the angle of repose and increasing the likelihood of rockfalls.
Landslides may be triggered by other hazard events. The shaking of an earthquake or the loss of soil stability as a result of earthquake-induced liquefaction can cause the soil to slide. Alternatively, precipitation can result in saturated soil and a loss of stability, or flowing water may erode the base of a
Section 4 Hazard Assessment City of Healdsburg 2023 LHMP 4-25
slope. The risk of a landslide is often exacerbated in areas recently burned by wildfire, as the fire burns vegetation that can absorb water and hold back soil. Without the vegetation to stabilize a slope and prevent runoff, sediment and debris are more susceptible to sliding.
Landslide hazards in Healdsburg are common, and generally occur as a result of heavy rainfall. Large earthquakes and improper grading or drainage practices can also cause landslides.
Within Healdsburg, many of the swales or ravines that occupy the steep hill slopes may be capable of generating debris flows. Debris flows are most likely to originate on slopes underlain by sandstone or Glen Ellen sediments. Areas underlain by mudstone of the Great Valley Sequence are generally characterized by earthflows or slumps and are considered less likely to generate debris flows (Healdsburg 2015).
Strength/Magnitude
As defined in a CGS Special Report for Sonoma County, five categories of stability, based on terrain and geology, have been established to help the County understand landslide susceptibility. The slope categories are shown in Table 4-7
Table 4-7: Categories of Stability
Risk Category Description
Most stable/lowest risk
A Areas of greatest relative stability due to low slope inclination predominantly less than 15%.
Bf Locally level areas within hilly terrain; may be underlain or bounded by unstable or potentially unstable rock materials.
B Areas of relatively stable rock and soil units, on slopes greater than 15%, containing few landslides.
Least stable/highest risk
C Areas of relatively unstable rock and soil units, on slopes greater than 15%, containing abundant landslides.
Landslide Areas of lowest relative slope stability. Failure and downslope movement of rock and soil have occurred or may have occurred.
Source: Huffman, Armstrong 1980
Notable landslide events are often described in terms of the volume of soil that moved or the depth of debris. Landslides that occurred in the Bay Area during the 1997–98 El Niño rainstorms, for example, ranged from 25 cubic meters to 13 million cubic meters (Godt 1999).
Past Occurrences
The Healdsburg General Plan Background Report identified 36 smaller landslides in Healdsburg along the northwestern to southeastern stretch of the city, and a larger landslide in the central portion of the eastern city boundary. These landslides are mainly slow-moving or earthflow landslides that are confined to the soil mantle and shallow, weathered bedrock. They represent identified; ongoing hazard areas as opposed to the location of specific events that caused damage.
The most notable example of damaging landslides in Sonoma County occurred during the 1997–98 El Niño rainstorms. Approximately 300 landslides were documented in 10 Bay Area counties. In Sonoma County,
Section 4
Assessment 4-26 City of Healdsburg 2023 LHMP
Hazard
the USGS recorded seven major landslides that caused a total of $21 million in damages (Godt 1999). While not among the most damaging, two of the seven were centered on Fitch Mountain near Healdsburg (Ramsey & Godt 1999). In one case, a small slide on the north side of the mountain liquefied at the toe the lower margin of displaced soil and moved down onto North Fitch Mountain Road near two homes (DOC 2023). The worst of the Sonoma County landslides occurred in the unincorporated community of Rio Nido near Guerneville, where debris flows on January 6–7, 1998, forced the evacuation of 140 homes, three of which were destroyed and dozens more damaged.
During the week of March 21, 2011, heavy rainfall caused a landslide near Burgundy Road in the portion of northern Healdsburg west of US Highway 101. The slide damaged the city’s water system, which in turn damaged the road and adjacent properties. The City Council declared a local emergency on September 19, 2011, and paid $500,000 to regrade the hill, install reinforcements and erosion control measures, and repair water and sewer mains and the road (Healdsburg, City of 2013).
More recently, the December 11, 2014, rainstorm that flooded downtown Healdsburg also caused part of a hillside to fail at a vineyard on West Dry Creek Road about 5 miles northwest of the city. The debris flow caused a large amount of soil to reach a tributary that feeds Dry Creek (Callahan 2016).
Location
The area most susceptible to landslides trends from the northwestern part of Healdsburg to the southeastern part, along the hills that define the city’s eastern edge. Much of this area also has mapped landslide deposits, which identifies higher risk of future landslides. The population in this area is less dense, but the area contains enough housing to pose a risk to life and property.
In addition to Burgundy Road and North Fitch Mountain Road locations, there is an active slide in the Parkland Farms area.
The Healdsburg General Plan Background Report maps areas of landslide risk based on CGS’s slope categorization. Virtually all the hillside areas are mapped as Zone C, areas with moderate to high landslide risk. Figure 4.11 shows the location of slope hazard zones in the city.
Section 4 Hazard Assessment City of Healdsburg 2023 LHMP 4-27

Section 4 Hazard Assessment 4-28 City of Healdsburg 2023 LHMP
Figure 4.11: Healdsburg Landslide Hazard Zones
(See Appendix C for a larger and higher resolution map)
WarningTime
The velocity of landslides ranges from a slow creep of inches per year to many feet per second, depending on slope angle, material and water content. Some methods used to monitor landslides can provide an idea of the type of movement and the amount of time prior to failure. It is also possible to determine what areas are at risk during general time periods. Assessing the geology, vegetation and amount of predicted precipitation for an area can help in these predictions. However, there is no practical warning system for individual landslides. The current standard operating procedure is to monitor situations on a case-by-case basis and respond after the event has occurred.
Generally accepted warning signs for landslide activity include the following:
• Springs, seeps, or saturated ground in areas that have not typically been wet before
• New cracks or unusual bulges in the ground, street pavements or sidewalks
• Soil moving away from foundations
• Ancillary structures such as decks and patios tilting and/or moving relative to the main house
• Tilting or cracking of concrete floors and foundations
• Broken water lines and other underground utilities
• Leaning telephone poles, trees, retaining walls or fences
• Offset fence lines
• Sunken or down-dropped road beds
• Rapid increase in creek water levels, possibly accompanied by increased turbidity (soil content)
• Sudden decrease in creek water levels though rain is still falling or just recently stopped
• Sticking doors and windows, and visible open spaces indicating jambs and frames out of plumb
• A faint rumbling sound that increases in volume as the landslide nears
• Unusual sounds, such as trees cracking or boulders knocking together.
SecondaryHazards
Mass movements are not generally known to result in secondary hazards. A landslide that blocks a river or stream does have the potential to cause flooding.
Frequency/ProbabilityofFutureOccurrence
Because of Healdsburg’s topography, future landslides will most likely occur during periods of heavy rain. Just two damaging landslides have occurred within Healdsburg’s Urban Service Area in the last 20 years, both during the same winter storms. Road closures due to mud flows may occur more frequently, particularly during El Niño years, which have occurred in 7 of the last 20 winter seasons. The probability of a geologic hazard occurring in any given area is unknown, although landslide risks are likely to remain highest in the areas identified as having a high susceptibility. The geologic conditions in the county that have been responsible for past landslide events are not expected to change.
FutureConditionConsiderations
The expected increase in the frequency and/or intensity of storms that will affect California could make moisture-related landslides more common. The increase in average temperature and periods of drought may also cause soil to become less cohesive, making soil more unstable and potentially increasing landslide risk.
Section 4 Hazard Assessment City of Healdsburg 2023 LHMP 4-29
4.2.5 PSPS
HazardDescription
In 2012, the California Public Utilities Commission (CPUC) ruled that the California Public Utility Code gives electric utilities the authority to shut off electric power to protect public safety, since power supply systems have the potential to ignite wildfires (California Public Utilities Commission 2022a). Electric utility infrastructure has historically been responsible for less than 10 percent of reported wildfires. However, fires attributed to power lines consist of roughly half of the most destructive fires in California history (California Public Utilities Commission 2022a).
A public safety power shutoff (PSPS) is an event in which a major electric power provider (e.g., PG&E, SDG&E, or Southern California Edison) temporarily shuts off electrical power to an elected area to prevent power lines from sparking wildfires and threatening human lives. Utilities usually undertake these during hot, dry days with sustained winds or strong gusts. The duration of a shutoff event is tied directly to the weather that triggers it; the shutoff typically ends within 24 hours after the weather conditions have subsided. However, PSPS events may extend beyond the 24-hour timeframe, depending on conditions (Pacific Gas & Electric n.d.).
Electrical systems may also be disrupted or degraded for other reasons including production failure, network management failure (rotating outages), infrastructure failure (ex. transmission line failure), attack, or impacts from other hazards (Ex. earthquake, wildfire). These are usually no-notice (or “unintentional”) incidents limited to specific geographic regions. While PSPS incidents are most similar to the Cal OES classification of an “unplanned” disruption, these outages may simultaneously affect large regions of Northern California.
Strength/Magnitude
A PSPS can impact the health and well-being of the community. Residents may experience heat illnesses and have food spoil when air conditioning and refrigeration systems cannot function due to the power loss. Other impacts include food losses due to no refrigeration, which can lead to cascading effects on those who cannot afford to restock their food; food service/restaurant industry (supply loss, spoilage, etc.); and disruption to lifelines and infrastructure.
An extended outage may prove very challenging for people with disabilities and those with access and/ or functional needs who rely on medical equipment requiring electricity and have limited or no battery backup. Local police and fire dispatch centers may receive many calls for assistance from people at home with these types of needs. Power outages are especially difficult for people with respiratory conditions and/or chronic health problems. Hospitals may see a surge in the number of patients with chronic respiratory illnesses exacerbated by excessive heat and loss of air conditioning. Loss of power may severely compound the effects of other simultaneous hazards including wildfire and extreme heat. PSPS may directly or indirectly threaten public safety in several areas:
Personal Safety
1. Individuals with medical conditions that are dependent on electricity to power medical equipment, provide mobility, maintain temperature, or refrigerate medicines. Local agencies may make use of three
Section 4 Hazard Assessment 4-30 City of Healdsburg 2023 LHMP
databases that could assist in identifying individuals that may be dependent on electricity for these issues: The PG&E Medical Baseline Program, the County In-Home Supportive Services, and the federal Medicare emPOWER map.
2. Skilled Nursing Facilities (SNFs) and other congregate care institutions such as board and care facilities could also be impacted. In California, long-term care and skilled nursing facilities are required to have allhazards emergency plans and working generators to provide power for essential patient treatment needs. However, these emergency power systems are not always reliable and failure could create sudden significant demands on the EMS system.
3. Although not expected, loss of power in hospitals will result in reduced services including advance imagery and cancellation of elective and non-urgent surgeries. Delays may cause patient health to deteriorate. Hospitals may see an increase in emergency room visits from those seeking support for medical devices.
4. Seniors, newborns, and other individuals may be challenged by lack of air conditioning. Home healthcare providers may be unable to provide services to all clients. Existing medical conditions may be exacerbated due to a) delays in receiving aid or resources, b) loss of temperature management systems, or c) the relocation of individuals.
5. Loss of traffic management systems and traffic signal lights may result in additional collisions and injuries.
6. Health and safety hazards may develop from improper food storage/handling, loss of remote health monitoring systems, and unsafe operation of generators (fire, burns, and carbon monoxide).
7. Acute and long-term behavioral health challenges may increase due to individual and community stress, trauma, uncertainty, and economic losses.
Public Safety Systems
1. 9-1-1. Loss of power in homes and businesses may prevent residents from using their VoIP and cordless phones to call 9-1-1. Similarly, loss of power will also eliminate use of most cell phone towers once the tower batteries run down. Plain Old Telephone Service (POTS) phones (i.e., copper lines) may continue to work. Communication providers who offer end-user access to the public switched telephone network to provide access to 9-1-1 are not required to provide access to 9-1-1 during a power outage or PSPS incident. 28 If residents are able to call via other means, automatic addressing may not be available increasing the potential for incorrect addressing and loss of local Records Management System (RMS) data.
2. Public Warning systems. Local public safety agencies may be unable to deliver warning messages in impacted areas due to loss of cell towers and failure of broadband wireless data, VoIP, and cable systems. This will significantly diminish or eliminate the effectiveness of the SoCoAlert, WEA, and EAS systems.
3. Public Safety Communications. Public safety radio antenna sites have 8 hours of battery backup and are on emergency generator power. Most sites can run generators at load for 96 hours before needing to be
Section 4 Hazard Assessment City of Healdsburg 2023 LHMP 4-31
re-fueled. However, voice and data applications that depend on commercial broadband wireless may not be available in a prolonged outage.
4. Degradation of first responder capabilities. Approximately 65% of fire stations have emergency power. Departments/districts may be challenged in maintaining and surging communications, equipment and staff.
5. Backup electrical generators have a failure rate of between 3% and 20% due to improper configuration, automatic transfer switch (ATS) failure, mechanical failure, overheating, or oil/fuel issues.
6. Public Safety Answering Points (PSAPs). During both the warning and outage phases, PSAPs will potentially experience a significant increase in calls for services due to medical emergencies, rescues, those seeking services such as additional oxygen supplies as well as actual/perceived security concerns including potential alarm responses. Additionally, many callers will be seeking information about the status of the outage and/or red flag warning or asking for public safety agencies to check on the welfare of their family members.
Infrastructure
1. Wireless broadband voice and data systems. For California providers, 88% of cell sites have emergency power backup and 80% have four or greater hours. The California Public Utilities Commission (CPUC) recently required wireless providers to maintain 72-hours backup power for their systems in Tier 2 and Tier 3 High Fire Threat Districts – this requirement goes into effect in 2021. The major providers have reported that they have rapidly deployable resources including mobile generators and refueling which could support systems in a sustained outage if the number of sites requiring power does not exceed this capacity.
2. Cable/fiber systems may also lose power. Most residents will lose power to home routers and home satellite systems thereby losing access to the internet, VoIP phones, and EAS. Similar to wireless broadband, new CPUC requirements for 72 hours of backup power for wireline broadband providers are to take effect in 2022. Internet Service Providers (ISPs) may continue to function using backup power.
3. Loss of fuel production/distribution. Very few gasoline stations have generator power to continue dispensing. A large regional outage could also disrupt production and distribution. Some government fueling facilities may also not be equipped with generators. There is one Compressed Natural Gas (CNG) fueling station in the County, which would also lose the ability to serve customers. In prolonged incidents, local governments may be asked to provide fuel to allied stakeholders including private sector ambulances, critical commodities haulers, and mutual aid resources.
4. Potable water systems. Sonoma Water expects to maintain the ability to provide wholesale water supplies using backup power and pumping systems. However, smaller retail systems may lose the ability to maintain adequate water pressure and/or supply resulting in turbidity and potential compromised water quality. This may require issuing notices to boil water or conserve water in some areas.
5. Cooling Centers. There will be challenges for opening cooling centers, as most facilities do not incorporate HVAC in emergency power circuits. Most traditional informal cooling facilities (malls, libraries,
Section 4 Hazard Assessment 4-32 City of Healdsburg 2023 LHMP
movie theatres, etc.) do not have emergency power and will close. County government has no public assembly buildings with capacity to operate HVAC under emergency power.
6. Wastewater systems. Most systems have emergency power for lift stations. However, there may be isolated losses in capabilities to pump and/or treat sewage in some areas – some spills may result in extended outages.
Transportation
1. Roads and highways may lose power to traffic signals and traffic metering/sensors. Most traffic signals will default to flashing red when on battery backup power – generally limited to 8 hours. A few key intersections may have generator backup power. Some traffic signals will go totally dark. Residents may seek power, cooling, food, or other services with friends or commercial centers in unaffected areas, thereby creating congestion on roads no longer served by operating signals.
3. The County airport may have to suspend commercial operations. While the Control Tower is equipped with an emergency generator, the terminal is not. The CalFire Air Attack Base is equipped with a generator.
4. Residents, businesses, and government agencies may be unable to recharge electric vehicles.
Business Community
1. Notification by PG&E of a potential PSPS may encourage residents to stock up on key supplies similar to what occurs during a hurricane warning. Areas may see shortages in batteries, bottled water, and long lines at gas stations
2. The use of emergency generators in retail establishments varies widely. Most supermarkets have some generator power but will not be able to maintain refrigerators or freezers. Pharmacies generally do not have emergency power.
3. Loss of power will generally prevent electronic Point-of-Sale (POS) transactions. Some systems can operate on battery and then save transactions for later transmission when power is restored. Some merchants may use backup systems such as mobile devices. Most ATMs have some short-term battery power.
4. Widespread loss of power may impact regional warehouse, distribution, and delivery systems including just-in-time services for critical facilities (ex. hospital pharmacies). Small and large businesses across all sectors could see cancelled and diminished tourist bookings, disrupted production schedules, an interrupted supply chain, lost inventory, refunds. This could also reduce sales tax and Transitory Occupancy Tax (TOT) revenue. PSPS incidents generally occur during the County’s major tourist season (July-November).
5. Losses could continue long-term as “Continued news coverage of the possibility of PSPS incidents may lead to a reduction of future bookings from business and leisure travel, meetings, events and wedding segments regardless of the actual occurrence of an outage”.
Section 4 Hazard Assessment City of Healdsburg 2023 LHMP 4-33
6. Most hotels do not have emergency power. If they do, it may only support emergency lighting, refrigeration, and/or limited business systems. These facilities may be forced to close. Thus, hotels may be unable to support residents seeking relief from an extended power outage or to serve as shelters in the event of evacuations. This may also limit their ability to serve as alternate worksites for impacted businesses and governments.
7. Closure of commercial retail spaces and movie theaters would prevent access by residents seeking relief from high heat.
Other
1. Food storage/preparation. A lack of refrigeration, degraded potable water, and/or lack of hot water for sanitation may increase the risk for food-borne illness in personal residences and in food service facilities. Food service facilities must close if they cannot maintain food safety standards.
2. Schools. Each school district will assess the potential or actual impact of PSPS on their operations and safety. Schools will select the appropriate response measure depending on the time of day and year, including alternate curriculum, early dismissal, reunification and release procedures, and/or cancellation of classes for the next day(s). School closures could significantly disrupt the social fabric of our communities, limit the ability of parents and care providers to go to work, and impact other schoolaffiliated functions such as nutrition programs.
3. Other organizations including childcare centers, congregate care facilities, social organizations, and libraries may be forced to close.
4. Although improvements have been made, areas actually impacted by PSPS outages may differ from those forecasted.
Past Occurrences
During the October 2019 Kincade Fire, PG&E de-energized the City of Healdsburg’s transmission source creating a citywide power outage. This outage lasted for four-days and impeded fire-fighting efforts due to a lack of utility power at several critical facilities. PG&E has communicated with the City of Healdsburg that the City’s transmission source may be directly or indirectly affected by future PSPS events causing citywide power outages. PG&E’s most recent forecast for this level of event is one in every ten years.
Other areas surrounding Healdsburg continue to experience PSPS events on an annual and seasonal basis. During the strongest of wind events wide areas of Sonoma County, including areas within the City of Healdsburg are placed on alert for the potential of PSPS events. While rare for the City, there are still overhead powerlines within the wildland urban interface (WUI) and the City may choose to de-energize these lines ahead of high-wind and low-humidity weather events.
Location
PSPS events often target wild land areas with high wildfire risk, but they can impact a much wider region. The targeted area is the area at risk due to weather conditions. Given the long, connected nature of power supply systems, a shutoff event targeted to a small at-risk zone can affect power to larger areas beyond.
Section 4 Hazard Assessment 4-34 City of Healdsburg 2023 LHMP
As an example of potentially affected areas, Figure 4.12 shows the PSPS areas mapped by PG&E for its system statewide.
WarningTime
Forecasts of weather conditions such as red flag warnings, low humidity, and high winds can provide some warning of potential upcoming PSPS events. However, since PSPS events can impact areas beyond where the fire-risk weather conditions are being observed, due to the grid nature of electrical power distribution systems, some locations without forecast fire-risk conditions may still be vulnerable to an imminent PSPS.
Prior to a PSPS, electric utilities are required to notify customers who may be affected:
• Outages likely - Customers notified up to two days prior to shut off if the customer may be affected by a shutoff.
• Outages required - Customers notified one to four hours before shutoff and can be notified at any time.
Many utilities offer notification services through text or email, but the sign-up process for these notifications tends to be voluntary and typically targets customers/clients rather than all consumers.
Advanced warning times from electric providers to government agencies may vary depending on weather and environmental conditions. In advance of a PSPS event, the electric provider usually notifies the emergency management agency for the local operational area. That agency in turn notifies local jurisdictions and public safety providers. Some jurisdictions choose to notify residents, and some electric providers provide information on websites among other places.
SecondaryHazards
PSPS events can cause disruption of communications, water, and gas lines. These secondary hazards can lead to closures of retail businesses, grocery stores, gas stations, banks, and other services. Food spoilage and water contamination are other secondary hazards associated with PSPS events. The inability to use electrical medical devices and assistive technology during a PSPS event can also be a secondary hazard requiring mitigation by the City of Healdsburg.
Frequency/ProbabilityofFutureOccurrence
PSPS alerts continue to be based on weather and environmental conditions and are expected to continue into the foreseeable future. The probability of future PSPS occurrences is likely. These events are most likely to occur during summer months with high temperatures, increased wind speeds, drier conditions, and low humidity.
California’s 33 reported PSPS events between 2013 and 2019 represent an average of almost five events per year. The State is expected to continue to experience multiple PSPS events each year. Per information provided by PG&E, the City of Healdsburg is expected to experience a citywide PSPS less than once every 10 years.
Section 4 Hazard Assessment City of Healdsburg 2023 LHMP 4-35
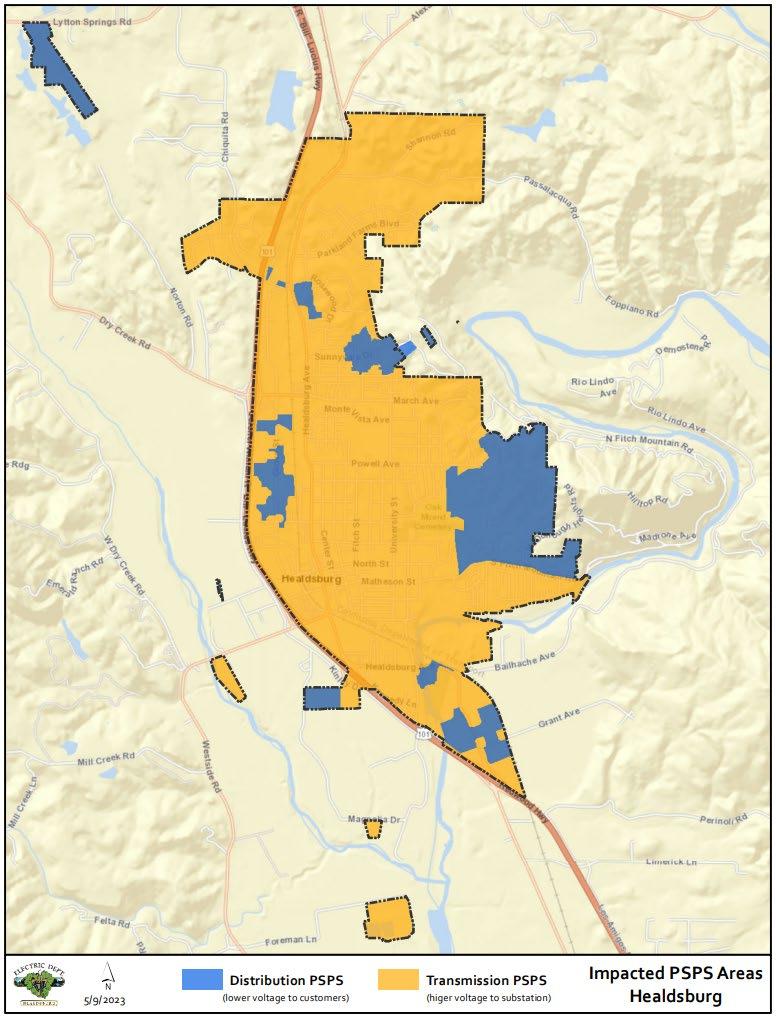
Section 4 Hazard Assessment 4-36 City of Healdsburg 2023 LHMP
Figure 4.12: Healdsburg PSPS Potential Outage Zones (See Appendix C for a larger and higher resolution map)
FutureConditionConsiderations
Conditions for wildfire are expected to become more common in the future as the climate changes. This will likely increase the probability of PSPS events each year.
4.2.6 Severe Weather HazardDescription
Severe weather describes a variety of events that are beyond or near the ends of the range of observed weather patterns and behavior. This weather can include extreme rainfall events, heat waves, storms, unusually cold temperatures, and wind events.
A storm disaster is generally defined as a violent atmospheric disturbance occurring over land and/or water and is distinguished by its strength, characteristics, and the scale of the resulting damage. Storms can represent a major potential threat to the state’s population because of their frequency, the size of areas devastated and the population affected, and the scale of the potential resulting damage. Storms in California also have historically caused flooding, mudflows, landslides, electrical outages, and other impacts (NOAA 2023).
There are different types of storms including thunderstorms and winter storms, both of which can produce hazardous conditions. Thunderstorms can produce damaging winds, tornadoes, large hail, flooding and flash flooding. Winter storms can include freezing rain, sleet, heavy snow, and strong winds.
Severe thunderstorms are officially defined as storms that are capable of producing large hail (inch or larger) and/or wind gusts over 58 miles per hour (NOAA 2009). Hail this size can damage property such as plants, roofs, and vehicles. Wind this strong is able to break off large branches, knock over trees, or cause structural damage to trees. Thunderstorms also produce tornadoes and dangerous lightning; heavy rain can cause flash flooding.
A freeze is when the surface air temperature is expected to be 32 degrees or below over a widespread area for a climatologically significant period of time. Use of the term is usually restricted to advective situations or to occasions when wind or other conditions prevent frost. "Killing" may be used during the growing season when the temperature is expected to be low enough for a sufficient duration to kill all but the hardiest herbaceous crops (NOAA 2009) Sometimes a freeze warning will be issued during the growing season when surface temperatures are expected to drop below freezing over a large area for an extended period of time, regardless of whether or not frost develops.
Strong winds are defined as sustained wind speeds of 40 mph or greater lasting for 1 hour or longer, or winds of 58 mph or greater for any duration (NOAA 2009). Strong winds can be an isolated hazard or part of a larger storm.
Excessive heat occurs from a combination of high temperatures (significantly above normal) and high humidities. At certain levels, the human body cannot maintain proper internal temperatures and may experience heat stroke (NOAA 2009). The "Heat Index" is a measure of the effect of the combined elements on the body. A heat wave is a period of abnormally and uncomfortably hot and unusually humid weather. Typically, a heat wave lasts two or more days.
Section 4 Hazard Assessment City of Healdsburg 2023 LHMP 4-37
Strength/Magnitude
Past Occurrences
In the past five years, from 6/1/2018 to 6/1/2023, the NOAA Storm Events Database has reported 198 severe weather events described as excessive heat, frost/freeze, hail, heavy rain, high wind, strong wind, or thunderstorm wind (NOAA 2023).
One of the most recent significant events was in January 2023 when a strong atmospheric river combined with a bomb cyclone led to widespread heavy rain, damaging wind gusts, and high surf across the Bay Area and Central Coast that resulted in one death in Occidental from a downed redwood tree.
Section 4 Hazard Assessment 4-38 City of Healdsburg 2023 LHMP
Event Type Start Date Deaths Injuries Property Damage Frost/Freeze 1/21/2023 0 0 0 Strong Wind 1/14/2023 0 0 0 Strong Wind 1/4/2023 0 0 0 High Wind 12/27/2022 0 0 0 Strong Wind 9/18/2022 0 0 0 Strong Wind 9/18/2022 0 0 0 Strong Wind 5/2/2022 0 0 0 Strong Wind 4/11/2022 0 0 10000 Strong Wind 3/4/2022 0 0 0 High Wind 1/22/2022 0 0 0 Strong Wind 12/13/2021 0 0 0 Strong Wind 11/9/2021 0 0 0 Excessive Heat 7/10/2021 0 0 0 Strong Wind 6/7/2021 0 0 0 Strong Wind 6/7/2021 1 0 0 Strong Wind 5/20/2021 0 0 0 Strong Wind 5/19/2021 0 0 0 Strong Wind 5/19/2021 0 0 0 Strong Wind 5/19/2021 0 0 0 Strong Wind 3/30/2021 0 0 0 Strong Wind 3/15/2021 0 0 0 Hail 3/10/2021 0 0 0 Strong Wind 2/24/2021 0 0 0 Strong Wind 2/24/2021 0 0 0 Frost/Freeze 2/23/2021 0 0 0 Strong Wind 1/27/2021 0 0 0 Strong Wind 1/27/2021 0 0 0 Strong Wind 1/27/2021 0 0 0 Strong Wind 1/27/2021 0 0 0 Frost/Freeze 1/26/2021 0 0 0
Table 4-8: Severe Weather in the Sonoma County, North Bay Interior Valleys and Mountains
Section 4 Hazard Assessment City of Healdsburg 2023 LHMP 4-39 Frost/Freeze 1/26/2021 1 0 0 Strong Wind 1/26/2021 0 0 0 Strong Wind 1/26/2021 0 0 0 Strong Wind 1/26/2021 0 0 0 High Wind 1/26/2021 0 0 0 Strong Wind 1/26/2021 0 0 0 Strong Wind 1/25/2021 0 0 0 Strong Wind 1/24/2021 0 0 0 Strong Wind 1/19/2021 0 0 0 Strong Wind 1/19/2021 0 0 0 High Wind 1/19/2021 1 0 0 Strong Wind 1/18/2021 0 0 0 Strong Wind 1/18/2021 0 0 0 High Wind 1/18/2021 0 0 0 Strong Wind 1/18/2021 0 0 0 Strong Wind 1/18/2021 0 0 0 Strong Wind 12/7/2020 0 0 0 Strong Wind 12/7/2020 0 0 0 Strong Wind 12/7/2020 0 0 0 Strong Wind 12/7/2020 0 0 0 Strong Wind 12/7/2020 0 0 0 Strong Wind 12/7/2020 0 0 0 Frost/Freeze 11/10/2020 0 0 0 Frost/Freeze 11/10/2020 0 0 0 Strong Wind 11/8/2020 0 0 0 Strong Wind 11/8/2020 0 0 0 Strong Wind 11/8/2020 0 0 0 Strong Wind 11/7/2020 0 0 0 Strong Wind 11/6/2020 0 0 0 Strong Wind 11/6/2020 0 0 0 Strong Wind 11/6/2020 0 0 0 Strong Wind 11/6/2020 0 0 0 Strong Wind 11/6/2020 0 4 0 Strong Wind 11/6/2020 0 0 0 Strong Wind 11/6/2020 0 0 1000 Strong Wind 11/6/2020 0 0 0 Strong Wind 10/26/2020 0 0 0 Strong Wind 10/26/2020 0 0 0 Strong Wind 10/26/2020 0 0 0 Strong Wind 10/25/2020 0 0 0 High Wind 10/25/2020 0 0 3000 High Wind 10/25/2020 0 0 0 High Wind 10/25/2020 0 0 0 Strong Wind 10/25/2020 0 0 0
Section 4 Hazard Assessment 4-40 City of Healdsburg 2023 LHMP Strong Wind 10/25/2020 0 0 0 Strong Wind 10/14/2020 0 0 0 Strong Wind 9/27/2020 0 0 0 Strong Wind 9/8/2020 0 0 0 Strong Wind 9/8/2020 0 0 0 Excessive Heat 9/7/2020 0 0 0 Excessive Heat 9/7/2020 0 0 0 Excessive Heat 9/6/2020 0 0 0 Hail 8/17/2020 0 0 0 Thunderstorm Wind 8/16/2020 0 0 0 Strong Wind 6/5/2020 0 0 0 Strong Wind 6/5/2020 0 0 0 Strong Wind 4/5/2020 0 0 0 Strong Wind 4/5/2020 0 0 0 Hail 3/25/2020 0 0 0 Hail 3/25/2020 0 0 0 Hail 3/25/2020 0 0 0 Hail 3/25/2020 0 0 0 Strong Wind 3/2/2020 0 0 0 Strong Wind 3/1/2020 0 0 0 High Wind 3/1/2020 0 0 0 Strong Wind 2/10/2020 0 0 0 Strong Wind 2/9/2020 0 0 0 Strong Wind 2/9/2020 0 0 0 Strong Wind 2/9/2020 0 0 0 Strong Wind 2/2/2020 0 0 0 Strong Wind 12/7/2019 0 0 0 Strong Wind 12/6/2019 0 0 0 Strong Wind 12/6/2019 0 0 0 Strong Wind 12/1/2019 0 0 0 High Wind 12/1/2019 0 0 0 High Wind 12/1/2019 0 0 0 Strong Wind 12/1/2019 0 0 0 Strong Wind 11/30/2019 0 0 0 Strong Wind 11/30/2019 0 0 0 Frost/Freeze 11/29/2019 0 0 0 Frost/Freeze 11/29/2019 0 0 0 Frost/Freeze 11/28/2019 0 0 0 Frost/Freeze 11/28/2019 0 0 0 High Wind 11/26/2019 0 0 0 High Wind 11/26/2019 0 0 0 Strong Wind 11/26/2019 0 0 0 High Wind 11/26/2019 0 0 0 Strong Wind 11/26/2019 0 0 0
Section 4 Hazard Assessment City of Healdsburg 2023 LHMP 4-41 Strong Wind 11/26/2019 0 0 0 Frost/Freeze 10/31/2019 0 0 0 Frost/Freeze 10/31/2019 0 0 0 High Wind 10/29/2019 0 0 0 High Wind 10/29/2019 0 0 0 Strong Wind 10/29/2019 0 0 0 High Wind 10/27/2019 0 0 0 Strong Wind 10/27/2019 0 0 0 High Wind 10/27/2019 0 0 0 High Wind 10/27/2019 0 0 0 Strong Wind 10/27/2019 0 0 0 High Wind 10/23/2019 0 0 0 Strong Wind 10/23/2019 0 0 0 High Wind 10/23/2019 0 0 0 Strong Wind 10/9/2019 0 0 0 Strong Wind 5/16/2019 0 0 0 Strong Wind 5/16/2019 0 0 0 Strong Wind 4/16/2019 0 0 0 Strong Wind 3/5/2019 0 0 0 High Wind 2/26/2019 0 0 0 Strong Wind 2/26/2019 0 0 0 Strong Wind 2/25/2019 0 0 0 Strong Wind 2/25/2019 0 0 0 Strong Wind 2/25/2019 0 0 0 Strong Wind 2/25/2019 0 0 0 High Wind 2/25/2019 0 0 0 Strong Wind 2/25/2019 0 0 0 Hail 2/15/2019 0 0 0 Hail 2/15/2019 0 0 0 High Wind 2/14/2019 0 0 0 High Wind 2/14/2019 0 0 0 Strong Wind 2/14/2019 0 0 0 Strong Wind 2/14/2019 0 0 0 Strong Wind 2/14/2019 0 0 0 Strong Wind 2/13/2019 0 0 0 Strong Wind 2/13/2019 0 0 0 Strong Wind 2/13/2019 0 0 0 Strong Wind 2/13/2019 0 0 0 Strong Wind 2/2/2019 0 0 0 High Wind 1/16/2019 0 0 0 High Wind 1/16/2019 0 0 0 Strong Wind 1/16/2019 0 0 0 High Wind 1/16/2019 0 0 0 High Wind 1/16/2019 0 0 0
None of these weather event types have a clearly defined extent or location. Therefore, no quantitative, geospatial analysis is available to support exposure or vulnerability analysis; the analyses for this hazard are qualitative.
Section 4 Hazard Assessment 4-42 City of Healdsburg 2023 LHMP Heavy Rain 1/16/2019 0 0 0 High Wind 1/16/2019 0 0 0 High Wind 1/16/2019 0 0 0 High Wind 1/16/2019 0 0 0 High Wind 1/16/2019 0 0 0 Strong Wind 1/16/2019 0 0 0 Strong Wind 1/16/2019 0 0 0 Strong Wind 1/16/2019 0 0 0 High Wind 1/16/2019 0 0 0 High Wind 1/16/2019 0 0 0 Strong Wind 1/16/2019 0 0 0 Strong Wind 1/9/2019 0 0 0 High Wind 1/9/2019 0 0 0 Strong Wind 1/8/2019 0 0 0 High Wind 1/8/2019 0 0 0 Strong Wind 1/6/2019 0 0 0 Strong Wind 1/6/2019 0 0 0 Strong Wind 1/6/2019 0 0 0 Strong Wind 1/5/2019 0 0 0 Strong Wind 1/5/2019 0 0 0 Strong Wind 1/1/2019 0 0 0 Strong Wind 12/31/2018 0 0 0 Strong Wind 12/31/2018 0 0 0 Strong Wind 12/31/2018 0 0 0 Strong Wind 12/28/2018 0 0 0 Strong Wind 11/29/2018 0 0 0 Strong Wind 11/29/2018 0 0 0 Strong Wind 11/29/2018 0 0 0 Strong Wind 11/29/2018 0 0 0 High Wind 11/28/2018 0 0 0 High Wind 11/28/2018 0 0 0 Strong Wind 11/22/2018 0 0 0 Strong Wind 11/22/2018 0 0 0 Strong Wind 10/14/2018 1 0 0 Strong Wind 10/14/2018 0 0 10 High Wind 10/6/2018 0 5 0 Source: NOAA, 2023
Location
WarningTime
Meteorologists can often predict the likelihood of a severe weather event. This can give several days of warning time. However, meteorologists cannot predict the exact time of onset or severity of a storm. Some storms may come on quickly, with only a few hours of warning time.
SecondaryHazards
Major riverine or urban flooding can result from heavy rain. Rain falling on saturated soils on slopes or on areas recently burned by wildfire may lead to landslides. Lightning during thunderstorms presents a risk of starting a wildfire. Extreme heat can contribute to fire-prone dry vegetation.
Frequency/ProbabilityofFutureOccurrence
Table 4-8 lists 75 storm, wind, or heat severe weather events in the Sonoma County since 2000 that caused death, injury or property damage. This amounts to a little more than three damaging severe weather events every year on average. The probability of a severe weather event impacting Healdsburg is high.
FutureConditionConsiderations
Severe weather events are expected to increase in Healdsburg over the coming decades. Statewide, some studies suggest that more years will have an increased number of severe weather events and that the largest of these events will be more intense than they have been historically. In general, Northern California is expected to see more frequent severe weather events, potentially up to twice as many by 2100 as the region currently does, while Southern California is expected to see the same number of events but with each individual storm an average of 10 to 20 percent more intense. However, the specific impacts on the Healdsburg region are not yet known
4.2.7 Wildfire HazardDescription
The term wildfire refers to any conflagration that starts in a rural, sparsely populated or largely undeveloped area. In many parts of the world, wildfires form part of the ecosystem and often burn at a safe distance from areas of human settlement. Under dry conditions and when fanned by strong winds, however, fires can spread into heavily populated areas, causing major damage to property. Buildings may be set alight by radiant heat, contact with the flames, or flying embers. Smoke can also cause property damage and health concerns, and indirect losses can result from business interruption.
A complex interplay of natural anthropogenic factors influences the extent and magnitude of wildfires. Most wildfires are sparked by human activity and expand due to factors such as the type and dryness of vegetation, slope, wind, and other climatic components such as temperatures and precipitation. Wind plays a significant factor in the spread of fire, and the strong, dry Santa Ana and foehn winds significantly increase the risk and severity of wildfire (Sonoma County 2017). Recent issues with Sudden Oak Death, a forest disease caused by a fungus-like organism that has been responsible for the death of thousands of oaks and tanoaks in California’s coastal areas, has increased the amount of dead and dry vegetation that can serve as tinder for a wildfire. Drought also can increase the likelihood and magnitude of wildfires. The complicated nature of wildfire spread makes it difficult to predict; even if hazard zones can be clearly identified, fires can cause significant losses in unexpected locations under unique circumstances.
Section 4 Hazard Assessment City of Healdsburg 2023 LHMP 4-43
In December 2022, the City of Healdsburg adopted a Community Wildfire Protection Plan (CWPP) as an annex to this plan. A CWPP is a plan developed in the collaborative framework established by the Wildland Fire Leadership Council and agreed to by land management agencies managing land in the vicinity of the planning area (USDA 2023). A CWPP also identifies and prioritizes areas for hazardous fuel reduction treatments and recommends the types and methods of treatment that will protect one or more at-risk communities and essential infrastructure and recommends measures to reduce structural ignitability throughout the at-risk community. CWPP also identified a home out approach to create defensible space and prevent home-to-home ignition from a wildfire conflagration.
Strength/Magnitude
CalFire gauges wildfires in terms of the number of acres burned. On average, wildfires in Sonoma County since the 1960s have burned about 34,000 acres each, and as much as 363,220 acres. The median fire is the 2017 Tubbs Fire, which burned 36, 807 acres.
Past Occurrences
Wildfires have occurred regularly in the Bay Area region, with documented fires going back to the 1960s. CalFire 2023 reports large wildfires as having occurred in 1961, 1962, 1964, 1965, 1970, 1981, 1985, 1988, 1991, 2008, 2017, 2019, and 2020.
The 2017 fire season was the worst in California’s history and included major, highly destructive fires in Sonoma and Napa counties. These included the Pocket Fire to the north of Healdsburg and the Tubbs Fire to the south and east. The Tubbs Fire is the most destructive wildfire in modern state history, claiming 36,432 acres of land, 5,300 structures, and 22 lives. Within hours of its ignition, the fire swept out of the mountainous areas north of Santa Rosa and into densely populated city neighborhoods. The Pocket Fire burned 17,357 acres of mostly undeveloped land in the Geyserville area, destroying only a few structures. These fires burned in concert with the Nuns and Atlas fires farther to the south, all of which started on October 8 and 9, 2017, spurred by high winds and recent drought conditions that caused the fires to spread quickly and unpredictably (Cal Fire 2018). While none of these fires reached Healdsburg, the Tubbs and Pocket fire perimeters both were less than 6 miles from the city’s border. On October 11, 2017, city officials advised residents of Fitch Mountain and along Bailhache and Rio Lindo avenues to be prepared to evacuate if necessary. No official evacuation orders were issued, but some residents did leave their homes as a precaution. The Healdsburg Community Center served as an emergency shelter for those displaced by the fires, registering 195 evacuees by the second day (Avants 2017)
Prior to the Sonoma and Napa County fires, the 1991 fire in the Oakland-Berkeley Hills was the largest urban wildland fire in the Bay Area and resulted in $1.7 billion in losses. In the fire, 3,354 single -family dwellings and 456 apartments were destroyed, while 25 people were killed and 150 people were injured (ABAG 2017).
The Kincade Fire, an unparalleled wildfire that started in the late hours of October 23, 2019, was a significant event in Sonoma County, California. Originating in The Geysers region, just northeast of Geyserville, the fire rapidly engulfed an expansive area of 77,758 acres, propelled by the extreme wind conditions at the time. Over 90,000 structures fell under threat, prompting widespread evacuations throughout the county, affecting communities including Geyserville, Healdsburg, Windsor, and Santa
Section 4
4-44 City of Healdsburg 2023 LHMP
Hazard Assessment
Rosa. The severity of the fire led to evacuation warnings and orders extending to parts of Lake County. At its peak, the Kincade Fire became the most extensive wildfire in the 2019 California wildfire season, and the largest recorded in Sonoma County before being surpassed by the LNU Lightning Complex fires in 2020. The cause of the fire was traced back to the failure of a 230,000-volt transmission line near the point of origin. The fallout saw power being cut off to millions of residents and widespread property damage, leading to massive disruptions in communication and power infrastructure in the region. Despite the challenges, the tireless efforts of the fire management teams led to the full containment of the fire by November 6, 2019.
The LNU Lightning Complex Fire, which broke out in the summer of 2020, was a destructive ensemble of wildfires across several counties in Northern California, with one of its constituent fires being the infamous Walbridge Fire. The Walbridge Fire, ignited by a series of intense lightning storms, originated west of Healdsburg in Sonoma County and swiftly spread across vast swathes of land, menacing both residential and natural environments. Due to an extreme combination of high temperatures, dry conditions, and gusty winds, the fire escalated at a rapid pace, posing serious challenges to containment efforts. The flames seared through an expansive terrain, leaving a trail of devastated structures and prompting widespread evacuation orders in threatened communities. The severe environmental toll of the fire was further reflected in the extensive damage to the region's ecological systems, particularly impacting the local wildlife. Amidst its devastation, the Walbridge Fire underscored the increasingly concerning impact of climate change on the frequency and intensity of wildfires in California.
Hundreds of fires have burned in Sonoma County since the 1960s, including those listed in Table 4-8 and shown in Figure 4.12. Historically, major fires have not significantly impacted Healdsburg, but they could in the future.
Table 4-9: Historic Sonoma County Fires
Section 4 Hazard Assessment City of Healdsburg 2023 LHMP 4-45
Year Name Acres Burned Structures Burned 1964 Hanley 52,700 108 1964 Nuns Canyon 10,400 27 1965 Knight’s Valley 6,000 0 1965 Pocket Ranch 4,000 0 1965 Austin Creek 7,000 0 1972 Bradford 1,760 4 1978 Creighton Ridge 11,405 64 1988 Cloverdale 1,833 100 1988 Geysers 9,000 7 1996 Porter Creek 300 0 1996 Cavedale 2,100 0 1999 Geyser Road 1,300 0 2000 Berryessa 5,731 15 2004 Geysers 12,000 6 2008 85 322 0
Table 4-9: Historic Sonoma County Fires
Section 4 Hazard Assessment 4-46 City of Healdsburg 2023 LHMP
Year Name Acres Burned Structures Burned 2008 Pine 989 0 2013 McCabe 3,505 1 2015 Valley 76,067 1,955 2017 Tubbs 36,807 5,643 2017 Nuns 54,382 1,355 2017 Pocket 17,357 6 2019 Kincade 77,758 374 2020 LNU (Walbridge) 363,220 1,491 2020 Glass 67,484 661 Source: CalFire, 2023
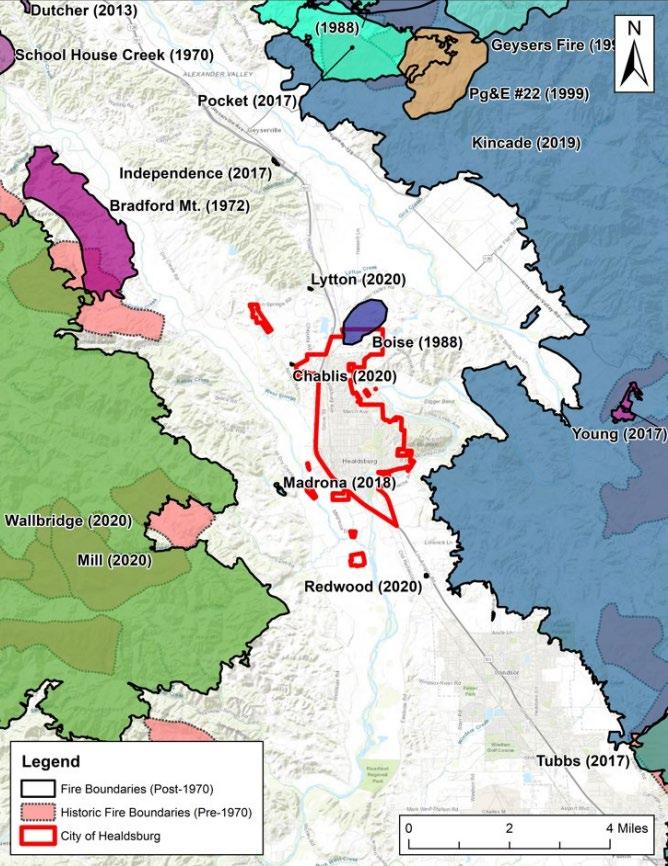
Section 4 Hazard Assessment City of Healdsburg 2023 LHMP 4-47
Figure 4-13: Historic Fire Perimeters in the Healdsburg Vicinity
(See Appendix C for a larger and higher resolution map)
Fire-prone areas in California are divided into three categories: Federal Responsibility Areas (FRAs), State Responsibility Areas (SRAs), and Local Responsibility Areas (LRAs). FRAs are lands where federal agencies are responsible for preventing and fighting fires, and include lands protected by the US Forest Service, the US Department of Agriculture, and the Department of the Interior (including the National Park Service, the Bureau of Land Management, and the Bureau of Indian Affairs). SRAs are areas where CalFire is responsible for fire prevention and firefighting, while local agencies have responsibilities in the LRAs. The LRA for the Healdsburg region is shown in Figure 4.14.
CalFire is required by state law to map areas of significant fire hazards based on fuels, terrain, weather, and other relevant factors. These zones, referred to as Fire Hazard Severity Zones (FHSZ), influence how people construct buildings and protect property to reduce risk associated with wildland fires. Determining fire hazard severity has two key components: probability of burning and expected fire behavior. The factors considered in determining hazard are how often an area will burn, and when it does burn, what characteristics might lead to buildings being ignited? Based on these factors, each area is categorized as a Moderate, High, or Very High FHSZ. The classification system is intended to provide a broad stroke understanding of the level of wildfire hazard across the state and may not always reflect hazard from highly localized and fine-grained factors.
Figure 4.14 shows the FHSZs for both the SRA and LRA in the Healdsburg area. The area around Healdsburg is generally classified as either moderate or high fire hazard, with the high fire hazard areas on the eastern side encompassing much of Fitch Mountain and the wooded and brush-covered ridges. Although these are the areas of greatest concern, the rest of the city could be affected by the spread of fire into urban areas, high winds and mountainous terrain that make firefighting difficult, and the resulting particulate matter causing health concerns in the region. Areas of wildland-urban interface (WUI) are particularly vulnerable because fire can easily spread from the wildland area to the urban, putting property and lives at risk.
Section 4 Hazard Assessment 4-48 City of Healdsburg 2023 LHMP
Location
Figure 4.14: Healdsburg Fire Hazard Severity Zones and Areas of Responsibility
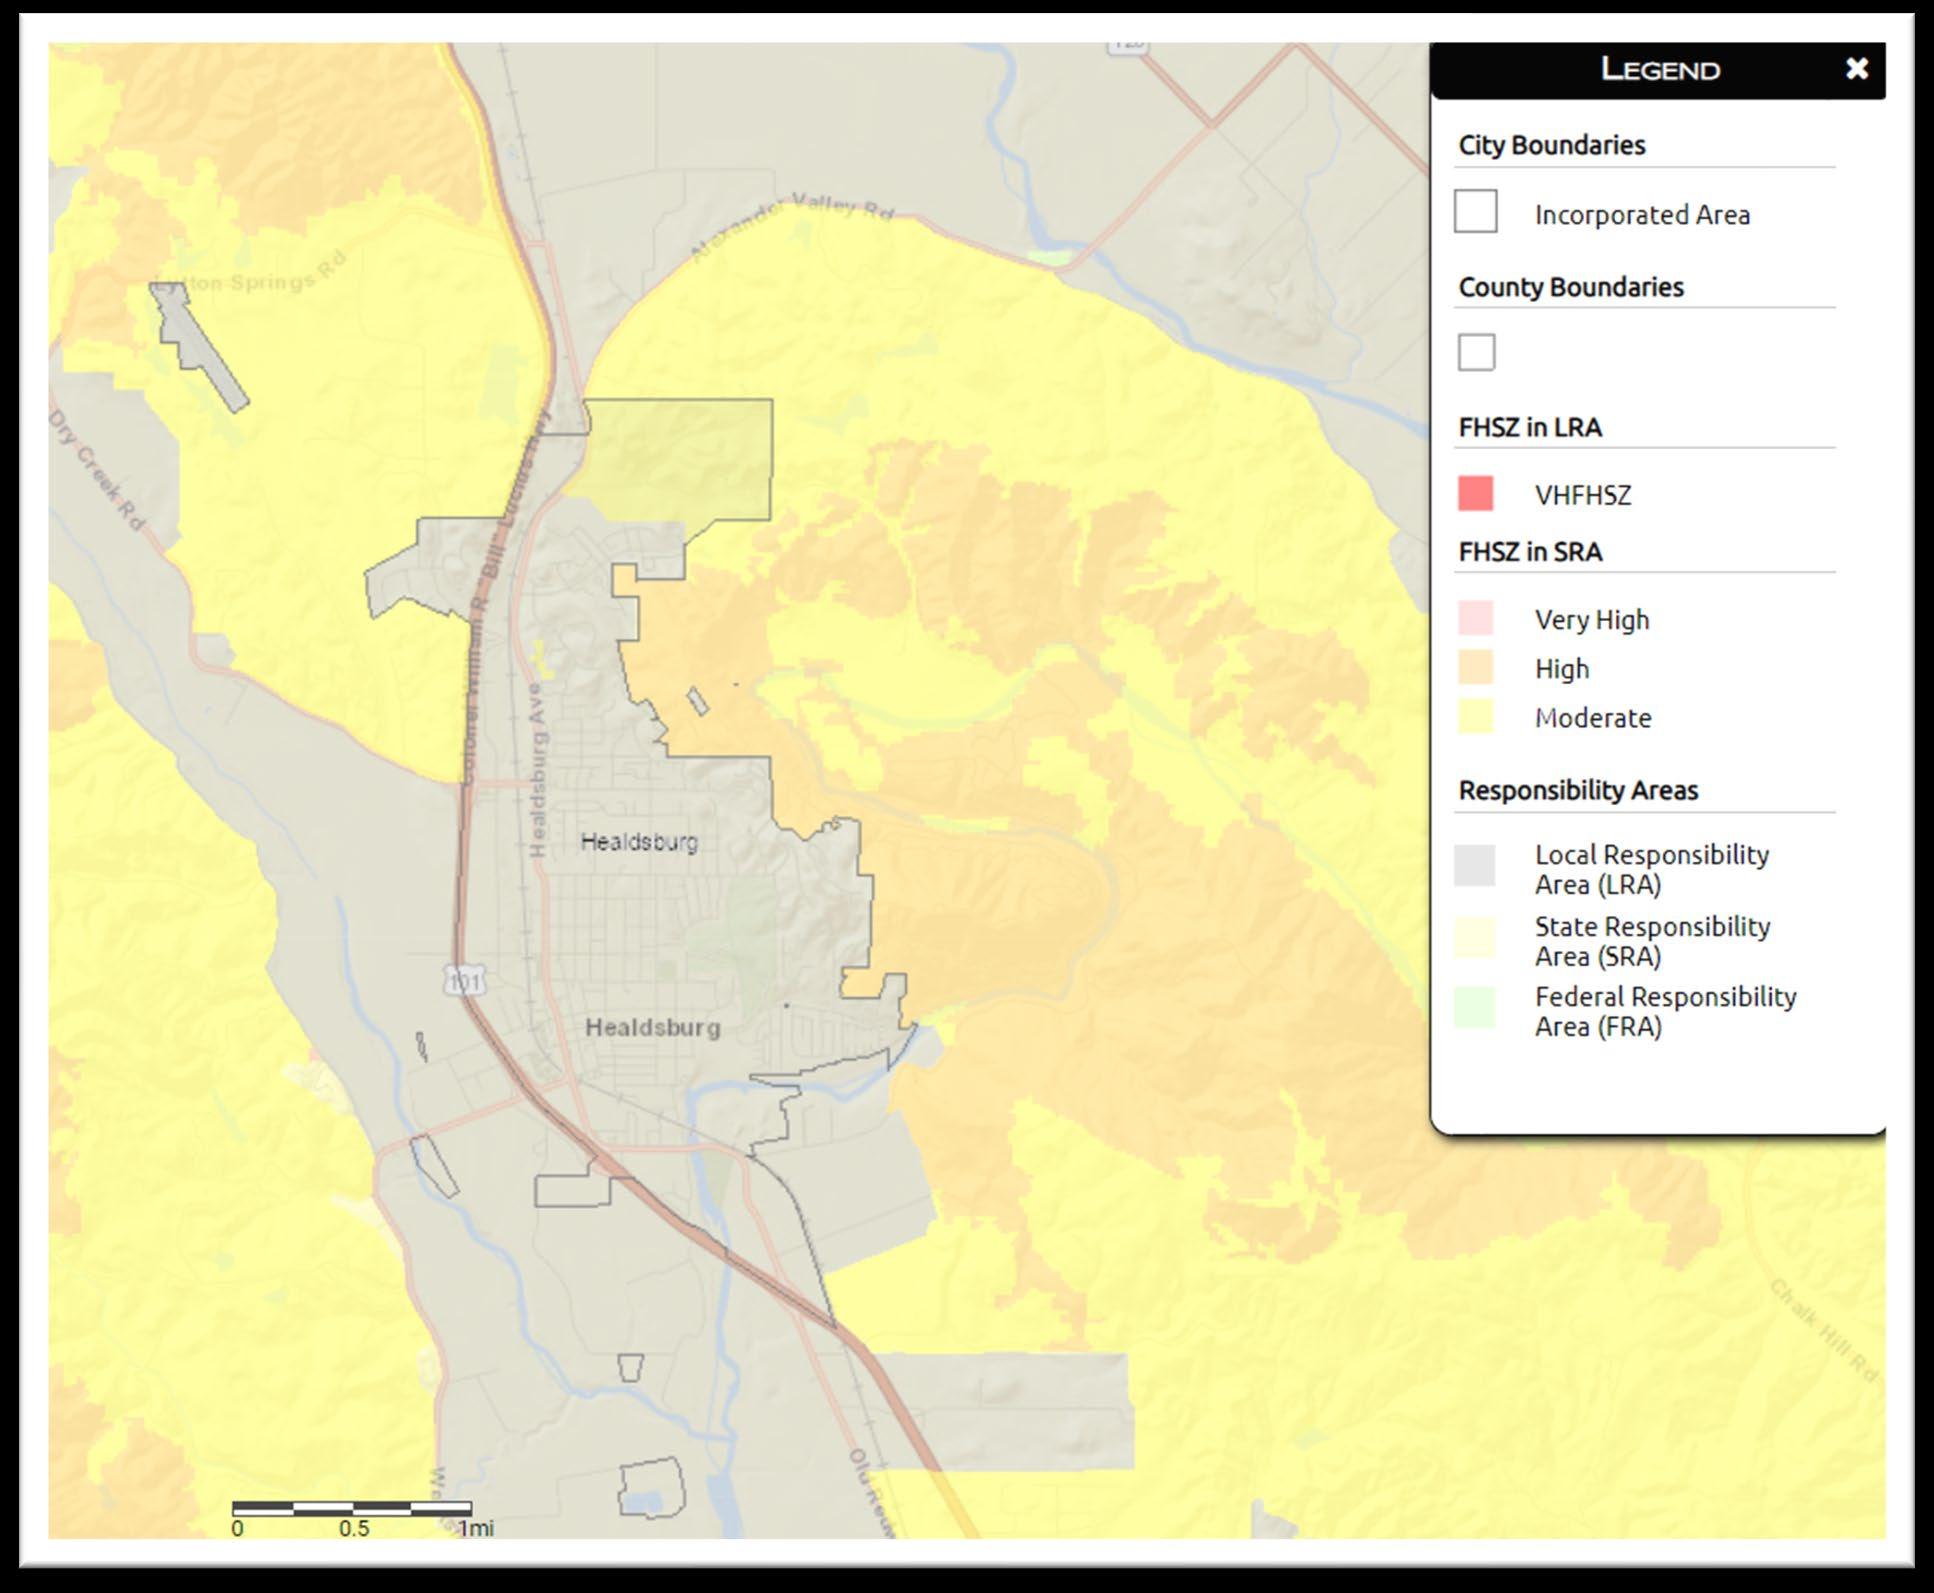
(See Appendix C for a larger and higher resolution map)
WarningTime
Warning time for wildfires in regions like Sonoma County, California, varies greatly and is contingent upon numerous factors, with a notable influence being weather conditions. Sometimes, meteorological forecasts provide early indicators of potential 'red flag' conditions such as high temperatures, low humidity, and strong winds, offering residents and firefighters a precious lead time to prepare. However, fast-spreading wind-driven wildfires can ignite and spread with very little advanced warning. These rapidly evolving situations can catch communities off guard, offering limited evacuation time and complicating firefighting efforts. Therefore, constant preparedness is vital for residents in these areas. This readiness involves creating and maintaining defensible spaces around homes, planning evacuation routes, and staying updated on local fire conditions. In the face of the unpredictable nature of wildfires, such preparedness can significantly enhance community resilience and safety
SecondaryHazards
Wildfires not only pose immediate threats through the flames themselves but also give rise to a number of secondary hazards that continue to endanger life and property even after the fire has passed. Downed
Section 4 Hazard Assessment City of Healdsburg 2023 LHMP 4-49
power lines are one such hazard; they can be hidden amongst debris and cause electrocution risks. Hazard trees, weakened or killed by the fire, may collapse unexpectedly, posing a risk to both people and structures. Similarly, structures partially damaged by the fire may be structurally unsound and prone to collapse, representing another dangerous situation. Additionally, access roads might be blocked by fallen debris or damaged infrastructure, impeding evacuation and emergency response efforts. Beyond these immediate post-fire risks, other secondary hazards include landslides and soil erosion, due to the destruction of vegetation that normally stabilizes the soil. Furthermore, ash and fire-retardant chemicals can contaminate water supplies, presenting longer-term environmental and health hazards. Therefore, proper mitigation and clean-up measures are vital to ensure safety after a wildfire event.
Frequency/ProbabilityofFutureOccurrence
Fires are a common feature in California and the Healdsburg area. In the last 25 years, one in every three fire seasons has involved a major wildfire in Sonoma County. In addition, development in rural and suburban areas along Healdsburg’s WUI is expected to increase with population growth, which increases the risk of wildfire damage. Increased development in the area can also lead to more fires caused by human activity, including faulty or downed utility lines. It is therefore assumed that wildfires will continue to occur and pose a risk to people and assets in Healdsburg, and possibly increase in frequency and magnitude.
FutureConditionConsiderations
Future fire risk modeling analyzes two primary variables: fuel availability and flammability. In California, the change in fire risk is a result of two climate factors. First, fire risk can increase due to a densely forested ecosystem as a result of higher temperatures, less snowpack, and earlier springs. Second, fire risk can decrease when formerly dry climates experience substantial vegetation growth after a year of above average precipitation. This type of ecosystem will be dominated by grass and low-density shrubs, resulting in a potential for reduced risk due to decreased availability of fuel.
Although the northern Bay Area will not be impacted by future climate conditions as severely as other parts of California, as precipitation lessens and average temperatures warm, wildfires will have an easier time igniting and spreading. This has already become apparent in the recent trend of larger and more frequent fires that have occurred in the western region, most likely due to hotter, longer, and drier summers. An anticipated increase in droughts will reduce moisture in vegetation, making it easier to ignite, and reduce the water available for combatting fires when they occur.
Section 4 Hazard Assessment 4-50 City of Healdsburg 2023 LHMP
Section 4 Hazard Assessment City of Healdsburg 2023 LHMP 4-51
This page intentionally left blank
Section 5. Vulnerability Assessment
The vulnerability assessment provides an explicit representation of what a community stands to lose in a disaster. This is useful for City staff and other decision-makers who will need to balance the costs of mitigation against the potential harm to residents and damage to property. The assessment provides comparable measurements of community exposure to natural hazard and helps determine which hazards and/or what areas of the City to focus on or prioritize when improving resiliency. Based on possible assets at risk, hazard mitigation resources can be directed where need be, in part, through a vulnerability assessment and information found in the hazard profiles in Section 4.2
The vulnerability assessment is developed using quantitative and qualitative information for each hazard. Through an exposure analysis, quantitative data is developed for each hazard. An exposure analysis quantifies the assets at risk for particular hazards. Qualitative data has been developed and presented in this section for hazards without measurable data. Rather than quantities of assets at risk, qualitative data provides a description of how the hazard could affect the region.
5.1 Methodology
A vulnerability assessment was conducted for each of the hazards profiled in Section 4.2 Vulnerability can be quantified in instances where there is a known hazard area, such as a mapped floodplain or high fire hazard area. Geospatial analysis can be conducted if a natural hazard has a particular spatial footprint that can be overlaid against the locations of people, residential buildings, and critical facilities. In Healdsburg, earthquakes, flooding, liquefaction (as a sub-hazard to earthquake), landslide, and wildfire have known geographic extents and corresponding spatial information about each hazard.
The hazard of drought is the only hazard in this plan that is not associated with a specific mapped area. The vulnerability and potential impacts from profiled hazards that do not have specific mapped areas or the data to support additional vulnerability analyses are discussed in more general terms.
Critical facilities are described as assets that are essential for people and a community to function, including public utilities such as lift stations. The LHMP Planning Team compiled a list of 46 critical facilities as shown in Table 5-1 and Figure 5.1
A critical facility spatial database was developed to translate critical facilities information into georeferenced points. 1 Critical facility points were overlaid with the spatial hazard layers to develop a list of “at-risk” critical facilities. The City critical facilities that intersect with natural hazards are referred to as facilities with hazard “exposure.” The exposure analysis for individual critical facilities is illustrated in Table 5-2 (results summarized by hazard are provided in the subsequent section).
Population data is derived from the US Census Bureau’s 2012-2016 5-Year American Community Survey (2012-2016 ACS), utilizing census block groups. Residential building data is derived from City of Healdsburg and Sonoma County GIS files detailing land use designations, zoning, building footprints, and tax
1 To georeference something means to define its existence in physical space; that is, establishing its location in terms of map projections or coordinate systems. The term is used both when establishing the relation between raster or vector images and coordinates, and when determining the spatial location of other geographical features.
Section 5 Vulnerability Assessment City of Healdsburg 2018 LHMP 5-1
Section 5
Vulnerability Assessment
information. Then, a combination of spatial overlay and proportional analysis was used to determine the number of people and residential buildings in areas where hazards are likely to occur. Maps illustrating the population density and residential building density data used are found in Appendix C.
Critical Facility Type
Alliance Medical Center
Badger Electrical Substation
Cadoul Reservoir
Chablis Lift Station
City Hall
Corporation Yard
Data Center Infrastructure
Dry Creek Well Field
Electric Distribution System
Fire Station
Fire Substation
Fitch Mountain Well Field
Gauntlett Communications Tower
Gauntlett Well Field
Gauntlett Well Field Control Station
Gauntlett/Fitch Water Treatment Plant
Gauntlett/Iverson Reservoirs
Health/Hospital
Electric Utility
Water Utility
Wastewater Utility
Government
Government
Government
Water Utility
Electric Utility
Police/Fire
Police/Fire
Water Utility
Police/Fire
Water Utility
Water Utility
Water Utility
Water Utility
Healdsburg Avenue Bridge Bridge
Healdsburg Community Center
Healdsburg District Hospital
Healdsburg Municipal Airport
Hendricks Lift Station
Heron Drive Lift Station
Highway 101 Bridge
Kennedy Lift Station
Kinley Drive Lift Station
Magnolia Drive Lift Station
McDonough Pump Station
Network/Telecom Infrastructure
North Detention Basin
North Street Pressure Reducing Station
Orangewood Lift Station
Orchard Lift Station
Panorama Pressure Reducing Station
Community
Health/Hospital
Airport
Wastewater Utility
Wastewater Utility
Bridge
Wastewater Utility
Wastewater Utility
Wastewater Utility
Water Utility
Government
Stormwater
Water Utility
Wastewater Utility
Wastewater Utility
Water Utility
5-2 City of Healdsburg 2018 LHMP
Table 5-1: Healdsburg Critical Facilities by Type
Table 5-1: Healdsburg Critical Facilities by Type
Critical Facility
Panorama Water Facilities
Passalacqua Pump Station
Type
Water Utility
Water Utility
Police Station Police/Fire
Recycled Water Bridge Bridge
Revel/Hidden Acres Pressure Reducing Station Water Utility
Senior Center Community
South Detention Basin
Fitch Well Field Control Building
Sunset Reservoir
Tayman Park Water Facilities
Villa Pressure Reducing Station
Water Reclamation Facility
Water Distribution System
Wastewater Collection System
Winding Creek Lift Station
Stormwater
Water Utility
Water Utility
Water Utility
Water Utility
Wastewater Utility
Water Utility
Wastewater Utility
Wastewater Utility
Section 5
City of Healdsburg 2018 LHMP 5-3
Vulnerability Assessment
Section 5 Vulnerability Assessment
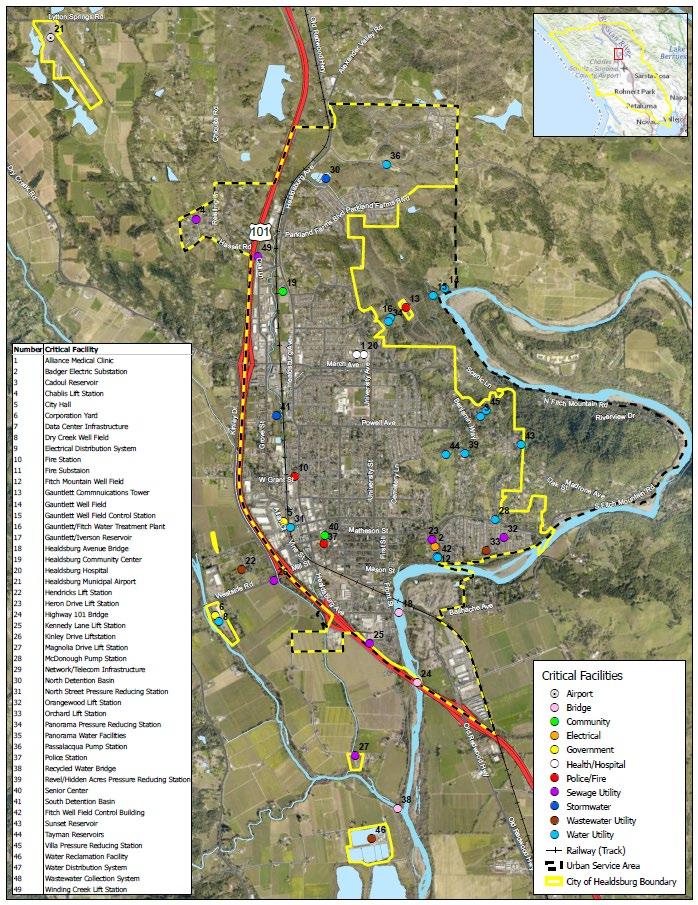
5-4
City of Healdsburg 2018 LHMP
Figure 5.1: City of Healdsburg Critical Facilities
(See Appendix C for a larger and higher resolution map)
Vulnerability
City of Healdsburg 2018 LHMP 5-5
Section 5
Assessment
Map # Critical Facility Type EQ: IX, Violent EQ: X, Extreme LQ: Mod LQ: High LQ: Very High Flood: 1% Flood: 0.2% LS: Slight to Mod LS: Mod to High Wildfire: Mod Wildfire: High 1 Alliance Medical Center Health/Hospital X X X 2 Badger Electrical Substation Electrical X X X X 3 Cadoul Reservoir Water Utility X X X 4 Chablis Lift Station Sewage Utility X X 5 City Hall Government X X 6 Corporation Yard Government X X X 7 Data Center Infrastructure Government 8 Dry Creek Well Field Water Utility X X X 9 Electrical Distribution System Electrical X X X X X X X X X X X 10 Fire Station Police/Fire X X 11 Fire Substation Police/Fire 12 Fitch Mountain Well Field Water Utility X X X 13 Gauntlett Communications Tower Police/Fire X X X 14 Gauntlett Well Field Water Utility X X X X X 15 Gauntlett Well Field Control Station Water Utility X X X 16 Gauntlett/Fitch Water Treatment Plant Water Utility X X X 17 Gauntlett/Iverson Reservoirs Water Utility X X X 18 Healdsburg Avenue Bridge Bridge 19 Healdsburg Community Center Community X X X 20 Healdsburg District Hospital Health/Hospital X X 21 Healdsburg Municipal Airport Airport X X 22 Hendricks Lift Station Wastewater Utility X X 23 Heron Drive Lift Station Wastewater Utility X X X
Table 5-2: Exposure Analysis Results for Critical Facilities in Healdsburg
Section 5
Vulnerability Assessment
5-6 City of Healdsburg 2018 LHMP
Map # Critical Facility Type EQ: IX, Violent EQ: X, Extreme LQ: Mod LQ: High LQ: Very High Flood: 1% Flood: 0.2% LS: Slight to Mod LS: Mod to High Wildfire: Mod Wildfire: High 24 Highway 101 Bridge Bridge 25 Kennedy Lift Station Wastewater Utility X X 26 Kinley Drive Lift Station Wastewater Utility X X 27 Magnolia Drive Lift Station Sewage Utility X X X 28 McDonough Pump Station Water Utility X X X X 29 Network/Telecom Infrastructure Government 30 North Detention Basin Stormwater X X 31 North Street Pressure Reducing Station Water Utility X X 32 Orangewood Lift Station Wastewater Utility X X X X 33 Orchard Lift Station Wastewater Utility X X X 34 Panorama Pressure Reducing Station Water Utility X X X 35 Panorama Water Facilities Water Utility X X X 36 Passalacqua Pump Station Water Utility 37 Police Station Police/Fire X 38 Recycled Water Bridge Bridge 39 Revel/Hidden Acres Pressure Reducing Station Water Utility X X X 40 Senior Center Community X 41 South Detention Basin Stormwater X X 42 Fitch Well Field Control Building Water Utility X X X 43 Sunset Reservoir Water Utility X X X 44 Tayman Park Water Facilities Water Utility X X X 45 Villa Pressure Reducing Station Water Utility X X X 46 Water Reclamation Facility Wastewater Utility X X X X X X
Table 5-2: Exposure Analysis Results for Critical Facilities in Healdsburg
*Note: No critical facilities located in Alquist-Priolo Fault Rupture Zones or Very High Fire Hazard Zones
Section 5
City of Healdsburg 2018 LHMP 5-7
Vulnerability Assessment
Map # Critical Facility Type EQ: IX, Violent EQ: X, Extreme LQ: Mod LQ: High LQ: Very High Flood: 1% Flood: 0.2% LS: Slight to Mod LS: Mod to High Wildfire: Mod Wildfire: High 47 Water Distribution System Water Utility X X X X X X X X 48 Wastewater Collection System Wastewater Utility X X X X X X X X X X 49 Winding Creek Lift Station Wastewater Utility X X X X X X X X X EQ – Earthquake LQ – Liquefaction LS – Landslide
Table 5-2: Exposure Analysis Results for Critical Facilities in Healdsburg
Vulnerability Assessment
5.2 Hazard-Specific Vulnerability
The local hazard mitigation planning requirement to describe hazard impact and overall vulnerability is as follows:
Regulation Checklist – 44 CFR 201.6 Local Mitigation Plans
Element B: Hazard Identification and Risk Assessment
B3. Is there a description of each identified hazard’s impact on the community as well as an overall summary of the community’s vulnerability? (Requirement §201.6(c)(2)(ii))
This section summarizes the possible impacts and quantifies, where data permits, the city’s vulnerability to each of the hazards identified in Section 4.0 Tables 5-3 through 5-17 illustrate the total exposure analysis by hazard. The exposure analysis details the number and percentage of critical facilities, residential units, and population. For residential units, the total value and total square footage of exposed units is also included.
5.2.1 Drought
Drought should not be viewed as merely a physical phenomenon or natural event. Its impacts on society result from the interplay between a natural event (less precipitation than expected) and the demand humans place on the water supply.
Due to the lack of defined geographical boundaries, the vulnerability assessment for drought differs from other natural hazards discussed earlier. The impacts of drought can be categorized as economic, environmental, or social The incidence of forest and range fires increases substantially during extended droughts, which in turn places humans and critical facilities at higher levels of risk.
Drought vulnerability is primarily measured by its potential impact on sectors of the city’s economy and natural resources. Healdsburg is known as a wine and culinary epicenter. Fortunately, as discussed in a report to the City Council, Healdsburg’s economy is relatively balanced, and the city does not depend on tourism to support its economy (Eyler 2018). According to the report, over 57 percent of jobs are not related to wineries (Eyler 2018). While the city’s economy may be impacted by the presence of a drought, the impact will not be as severe as assumptions based on conventional wisdom
Potential impacts to the economy include the following:
• Decreased municipal and industrial water supply
• Loss of recreation/tourism
Drought may lead to significant direct costs, due to such factors as increased pumping because of lower groundwater levels, investment in infrastructure to compensate for reduced yields and developing alternative water sources. Social impacts mainly involve public safety, health, conflicts between water users, reduced quality of life, and inequities in the distribution of impacts and disaster relief.
Vulnerability
The entire population of Healdsburg is vulnerable to drought events. Drought can affect people’s health and safety, including health problems related to low water flows, poor water quality, or dust. Droughts
Section 5
5-8 City of Healdsburg 2023 LHMP
can also lead to loss of human life. Other possible impacts include recreational risks; effects on air quality; diminished living conditions related to energy, air quality, and hygiene; compromised food and nutrition; and increased incidence of illness and disease (Centers for Disease Control and Prevention, 2012).
No structures will be directly affected by drought conditions, though some structures may become vulnerable to wildfires, which are more likely following years of drought. Droughts can have significant impacts on other types of property such as landscaped areas and economically important natural resources. Drought causes the most significant economic impacts on industries that use water or depend on water for their business, most notably agriculture and related sectors. In addition to losses in yields in crop and livestock production, drought is associated with increased insect infestations, plant diseases, and wind erosion. Drought can lead to other losses because so many sectors are affected - losses that include reduced income for farmers and reduced business for retailers and others who provide goods and services to farmers. This leads to unemployment, increased credit risk for financial institutions, capital shortfalls, and loss of tax revenue. Prices for food, energy, and other products may also increase as supplies decrease.
Critical facilities in Healdsburg will continue to be operational during a drought. Critical facility features such as landscaping may not be maintained due to limited water resources, but the risk to critical facility core functions is low.
Drought generally does not affect groundwater sources as quickly as surface water supplies, but groundwater supplies generally take longer to recover. Reduced precipitation during a drought means that groundwater supplies are not replenished at a normal rate. This can lead to a reduction in groundwater levels and problems such as reduced pumping capacity or wells going dry. Shallow wells are more susceptible than deep wells. Reduced replenishment of groundwater affects streams, especially during the summer when there is little or no precipitation. Reduced groundwater levels mean that even less water will enter streams when stream flows are lowest. Where stream flows are reduced, development that relies on surface water may seek to establish new groundwater wells, which could further increase groundwater depletion.
Other environmental losses from drought are associated with damage to plants, animals, wildlife habitat, and air and water quality; forest and range fires; degradation of landscape quality; loss of biodiversity; and soil erosion. Some of the effects are short-term and conditions quickly return to normal following the end of the drought. Other environmental effects linger for some time or may even become permanent. Although environmental losses are difficult to quantify, growing public awareness and concern for environmental quality has forced public officials to focus greater attention and resources on these effects. The following are potential impacts of drought:
• Wildlife habitat may be degraded through the loss of wetlands and vegetation. The degradation of landscape quality, including increased soil erosion, may lead to a more permanent loss of biological productivity.
• Drought conditions greatly increase the likelihood of wildfires, a major threat to timber resources, structures, and other property.
• Shortage of water supply can have significant economic impacts.
Section 5 Vulnerability Assessment City of Healdsburg 2023 LHMP 5-9
Vulnerability Assessment
• Drought conditions often are associated with harmful algal blooms specifically cyanobacteria that can cause severe illness and death in mammals.
5.2.2 Earthquake
Major impacts from earthquakes are primarily casualties and damage to infrastructure occurring from ground movement along a particular fault. The degree of infrastructure damage depends on the magnitude; focal depth; distance from fault; duration of shaking; type of surface deposits; presence of high groundwater; topography; and the design, type, and quality of infrastructure construction.
Healdsburg is not located within the Alquist-Priolo Earthquake Fault Zone. However, the city is in a seismically active region, and all of Healdsburg is at risk of one or more seismic hazards. All of Healdsburg, including all critical facilities, residential building units, and population, fall within areas with the potential for either a violent or extreme level of ground shaking. Tables 5-3 through 5-5 illustrate the summary of impacts from an earthquake on the city.
Liquefaction is a secondary hazard that can occur from earthquakes. Liquefaction susceptibility is five categories: very low, low, moderate, high, and very high. For this exposure analysis, the focus was on the top three most vulnerable categories. Tables 5-6 through 5-8 summarize impacts from liquefaction in the categories of moderate, high, and very high susceptibility on Healdsburg.
Earthquakes pose numerous risks to critical facilities and infrastructure. Risks, or the harm or losses, that are likely to result from exposure to earthquakes and liquefaction include:
• Fire from broken gas lines and power lines
• Flooding from broken dams
• Casualties (fatalities and injuries) from falling debris or secondary hazards
• Utility outages
• Economic losses for repair and replacement of critical facilities, roads, buildings, etc.
• Indirect economic losses, such as income lost during the downtime that results from damage to private property or public infrastructure
• Roads or railroads that are blocked or damaged can prevent access throughout the area and can isolate residents and emergency service providers needing to reach vulnerable populations or to make repairs
Section 5
5-10 City of Healdsburg 2023 LHMP
Category # of Critical Facilities: Violent Shaking Percentage of Total # of Critical Facilities: Extreme Shaking Percentage of Total Airport 1 100.00% 0 0.00% Bridge 0 0.00% 3 100.00% Community 0 0.00% 2 100.00%
Table 5-3: Earthquake Exposure Analysis Summary – Critical Facilities
Section 5
City of Healdsburg 2023 LHMP 5-11 Electrical 0 0.00% 1 100.00% Government 0 0.00% 2 100.00% Health/Hospital 2 100.00% 0 0.00% Police/Fire 1 33.33% 2 66.67% Sewage Utility 1 14.29% 6 85.71% Stormwater 1 50.00% 1 50.00% Wastewater Utility 0 0.00% 3 100.00% Water Utility 10 66.67% 5 33.33% TOTAL 16 39.02% 25 60.98%
Vulnerability Assessment
Structure Number Percentage of Total Total Value Total Square Feet Healdsburg IX, Violent Shaking Single-Family Dwellings 1160 26.11% $458,858,338 2,481,551 Planned Unit Development 166 30.79% $43,696,367 246,166 Multi-Family Dwellings 38 9.35% $136,032,071 116,028 Mixed Use 5 0.17% $4,800,580 27,343 Other 0 0.00% $0 0 Total 1,369 25.27% $643,387,356 2,871,088 X, Extreme Shaking Single-Family Dwellings 3282 73.88% $805,735,821 4,464,161 Planned Unit Development 373 69.20% $86,826,126 471,579 Multi-Family Dwellings 368 90.64% $126,446,792 915,185 Mixed Use 24 82.76% $5,944,906 37,591 Other 0 0.00% $0 0 Total 4,047 74.72% $1,024,953,645 5,888,516 Unincorporated County within Healdsburg Urban Service Area IX, Violent Shaking Single-Family Dwellings 304 73.79% $63,395,874 338,781 Multi-Family Dwellings 18 78.26% $3,636,383 23,422 Other 2 100.00% $1,065,246 3,668 Total 324 74.14% $68,097,503 365,871 X, Extreme Shaking Single-Family Dwellings 109 26.46% $17,769,339 104,405 Multi-Family Dwellings 5 21.74% $429,289 4,988 Other 0 0.00% $0 0
Table 5-4: Earthquake Exposure Analysis Summary – Residential Structures
Section 5 Vulnerability Assessment
Note: Estimates based on assumption of equal distribution of population across Census Block Groups
5-12 City of Healdsburg 2023 LHMP
Structure Number Percentage of Total Total Value Total Square Feet Total 114 26.09% $18,198,628 109,393
Jurisdiction Number: IX, Violent Shaking Percentage of Total Number: X, Extreme Shaking Percentage of Total City of Healdsburg 4,192 37.49% 6,991 62.51% Unincorporated County within Healdsburg Urban Service Area 801 93.31% 57 6.69%
Table 5-4: Earthquake Exposure Analysis Summary – Residential Structures
Table 5-5: Earthquake Exposure Analysis Summary – Population
Category Number: Moderate Percentage of Total Number: High Percentage of Total Number: Very High Percentage of Total Airport 0 0.00% 0 0.00% 0 0.00% Bridge 0 0.00% 0 0.00% 0 0.00% Community 1 11.11% 1 11.11% 0 0.00% Electrical 0 0.00% 1 100.00% 0 0.00% Government 2 0.00% 1 50.00% 1 50.00% Health/Hospital 0 50.00% 0 0.00% 0 0.00% Police/Fire 1 33.33% 0 0.00% 0 0.00% Sewage Utility 6 0.00% 7 77.78% 1 11.11% Wastewater Utility 3 0.00% 0 0.00% 0 0.00% Stormwater 1 0.00% 4 25.00% 1 6.25% Water Utility 4 6.67% 14 31.11% 3 6.67 TOTAL 18 43.90% 28 68.29% 6 14.63%
Table 5-6: Liquefaction Exposure Analysis Summary – Critical Facilities
Structure Number Percentage of Total Total Value Total Square Feet Healdsburg Moderate Single-Family Dwellings 1296 29.18% $295,833,363 2,020,268 Planned Unit Development 260 48.24% $59,258,193 341,742
Table 5-7: Liquefaction Exposure Analysis Summary – Residential Structures
Note: Estimates based on assumption of equal distribution of population across Census Block Groups
Environmental problems as a result of an earthquake can be numerous. Secondary hazards will likely have some of the most damaging effects on the environment. Earthquake-induced landslides can significantly
Section 5 Vulnerability Assessment City of Healdsburg 2023 LHMP 5-13
Structure Number Percentage of Total Total Value Total Square Feet Multi-Family Dwellings 79 19.46% $47,546,912 436,515 Mixed Use 12 41.38% $3,742,132 19,501 Other 0 0.00% $0 0 Total 1647 30.41% $406,380,600 2818026 High Single-Family Dwellings 6 0.14% $1,731,331 12,326 Planned Unit Development 0 0.00% $0 0 Multi-Family Dwellings 0 0.00% $0 0 Mixed Use 0 0.00% $0 0 Other 0 0.00% $0 0 Total 6 0.11% $1,731,331 12,326 Unincorporated County within Healdsburg Urban Service Area Moderate Single-Family Dwellings 15 3.64% 2668236 16981 Multi-Family Dwellings 3 13.04% 51623 1812 Other 0 0.00% 0 0 Total 18 4.12% 2719859 18793 High Single-Family Dwellings 20 4.85% 4184254 28957 Multi-Family Dwellings 0 0.00% 0 0 Other 0 0.00% 0 0 Total 9 2.06% 4184254 28957 * Numbers may not add up due to rounding
Table 5-7: Liquefaction Exposure Analysis Summary – Residential Structures
Jurisdiction Number: Moderate Percentage of Total Number: High Percentage of Total Number: Very High Percentage of Total City of Healdsburg 3,894 34.82% 35 0.31% 55 0.50% Unincorporated County within Healdsburg Urban Service Area 15 1.75% 14 1.63% 11.42 1.33%
Table 5-8: Liquefaction Exposure Analysis Summary – Population
Vulnerability Assessment
damage surrounding habitat. It is also possible for streams to be rerouted after an earthquake. Rerouting can change the water quality, possibly damaging habitat and feeding areas. Streams fed by groundwater wells can dry up because of changes in underlying geology.
5.2.3 Flooding
Flooding occurs on a semi-regular basis, both within the FEMA-identified floodplains and in other localized areas. For this exposure analysis, the flood zones from FEMA’s Digital FIRM were used in coordination with City asset data. Per the exposure analysis, 20 percent of the city’s critical facilities, about 8 percent of residential structures, and about 9 percent of the city’s population are in a flood zone (residential structures and population from the unincorporated county within Healdsburg’s Urban Service Area are also illustrated). Tables 5-9 through 5-11 illustrate the summary of impacts from flooding on Healdsburg for two floodplains: the 1% annual chance and 0.2% annual chance.
Flooding poses numerous risks to critical facilities and infrastructure. Risks, or the harm or losses, that are likely to result from exposure to flooding include:
• Roads or railroads that are blocked or damaged can prevent access throughout the area and can isolate residents and emergency service providers needing to reach vulnerable populations or to make repairs
• Bridges washed out or blocked by floods or debris from floods can cause isolation
• Creek or river floodwaters can back up drainage systems, causing localized flooding
• Floodwaters can get into drinking water supplies, causing contamination
• Sewer systems can back up, causing waste to spill into homes, neighborhoods, rivers, and streams
• Underground utilities can be damaged
Section
5
5-14 City of Healdsburg 2023 LHMP
Category Number: 1% Flood Percentage of Total Number: 0.2% Flood Percentage of Total Airport 0 0.00% 0 0.00% Bridge 3 100.00% 0 0.00% Community 0 0.00% 0 0.00% Electrical 1 100.00% 0 0.00% Government 0 0.00% 0 0.00% Health/Hospital 0 0.00% 0 0.00% Police/Fire 0 0.00% 0 0.00% Sewage Utility 2 28.57% 1 14.29% Wastewater Utility 0 0.00% 1 50.00% Stormwater 1 33.33% 0 0.00% Water Utility 3 20.00% 0 0.00% TOTAL 10 24.39% 2 4.88%
Table 5-9: Flood Exposure Analysis Summary – Critical Facilities
Note: Estimates based on assumption of equal distribution of population across Census Block Groups
Section 5
City of Healdsburg 2023 LHMP 5-15
Structure Number Percentage of Total Total Value Total Square Feet Healdsburg 1% Annual Chance of Flood Single-Family Dwellings 78 1.76% $21,223,752 115,863 Planned Unit Development 103 19.11% $24,359,705 154,538 Multi-Family Dwellings 20 4.93% $26,320,514 284,918 Mixed Use 2 6.90% 546823 2194 Other 0 0.00% 0 0 Total 203 3.75% $72,450,794 557,513 0.2% Annual Chance of Flood Single-Family Dwellings 34 0.77% $6,756,032 47,410 Planned Unit Development 317 58.81% $79,738,418 508,199 Multi-Family Dwellings 5 1.23% 4870402 39393 Mixed Use 0 0.00% 0 0 Other 0 0.00% $0 0 Total 356 6.57% $91,364,852 595,002 Unincorporated County within Healdsburg Urban Service Area 1% Annual Chance of Flood Single-Family Dwellings 76 18.45% $14,173,425 84,328 Multi-Family Dwellings 11 47.83% $1,339,758 10,795 Other 0 0.00% $0 0 Total 87 19.91% $15,513,183 95,123 0.2% Annual Chance of Flood Single-Family Dwellings 11 2.67% $2,537,697 13,481 Multi-Family Dwellings 0 0.00% 0 0 Other 0 0.00% 0 0 Total 11 2.52% $2,537,697 13,481
Vulnerability Assessment
Table 5-10: Flood Exposure Analysis Summary – Residential Structures
Community Name Number: 1% Flood Percentage of Total Number: 0.2% Flood Percentage of Total City of Healdsburg 674 6.03% 671 6.00% Unincorporated County within Healdsburg Urban Service Area 23 2.67% 1 0.14%
Table 5-11: Flood Exposure Analysis Summary – Population
NationalFloodInsuranceProgram
The local hazard mitigation planning requirement to address NFIP structures and NFIP participation are as follows:
Regulation Checklist – 44 CFR 201.6 Local Mitigation Plans
Element B: Hazard Identification and Risk Assessment
B4. Does the plan address NFIP insured structures within the jurisdiction that have been repetitively damaged by floods? (Requirement §201.6(c)(2)(ii))
Regulation Checklist – 44 CFR 201.6 Local Mitigation Plans
Element C: Mitigation Strategy
C2. Does the plan address the jurisdiction’s participation in the NFIP and continued compliance with NFIP requirements, as appropriate? (Requirement §201.6(c)(3)(ii))
The NFIP, managed by FEMA, enables homeowners, business owners, and renters in participating communities to purchase federally backed flood insurance. Participating communities agree to adopt and enforce floodplain management ordinances to reduce future flood damage (Benefits.gov. 2023).
The City of Healdsburg has participated in the NFIP since 1980; the City’s participation is illustrated in Table 5-12. The current effective map date is from 2008. Since then, the Healdsburg Public Works Department submitted an application for a Letter of Map Revision that modified the floodway for Foss Creek from where it crosses Grove Street to where it crosses US Highway 101; the revisions became effective in 2010.
5-16 City of Healdsburg 2023 LHMP
Section 5 Vulnerability Assessment
Table 5-12: National Flood Insurance Participation Summary
City of Healdsburg
Date Jointed/Initial FIRM Identified March 4, 1980
Current Effective Map Date December 2, 2008
Community Rating System Not a Participant
NFIP Compliance
• City continues to require all new development and substantial property improvement to comply with the City Municipal Code and FEMA regulations that regulate development in the designated 100-year floodplain and encourages buffer/setback area from waterways.
• City implements the NFIP requirements pursuant to Chapter 17.28 of the Healdsburg Municipal Code.
Note: Number of repetitive and severe repetitive loss properties is as of March 2021
Repetitive loss (RL) properties are insured properties that have incurred two or more flood losses greater than $1,000 within any 10-year period. A subset of these properties is designated severe repetitive loss (SRL) properties; these are insured properties that have incurred four or more flood-related losses of at least $5,000 each, or at least two separate claims with the cumulative amount of the building payments exceeding the value of the structures on the property. At least two claims under each of these scenarios must have occurred within any 10-year period. As illustrated above, Healdsburg has RL properties, including one SRL properties.
5.2.4 Landslide
The landslide risk in Healdsburg is largely in the hillier northern and eastern parts of the community. Because of Healdsburg’s topography, landslides will most likely occur during periods of heavy rain. Landslide hazard zones have been divided into three categories: A, B, and C. Category A is the Most Stable Zone, B is the Marginally Stable Zone, and C is the Least Stable Zone. For this exposure analysis, the top two categories were the focus. Per the analysis, about 30 percent of the city’s critical facilities, 25 percent of residential structures, and 17 percent of the population are in a slight to high landslide zone (residential structures and population from the unincorporated county within Healdsburg’s Urban Service Area are also illustrated). Tables 5-13 through 5-15 summarize the impacts from landslides in the categories of marginally and least stable zones in Healdsburg.
Landslides pose numerous risks to critical facilities and infrastructure. Risks, or the harm or losses, that are likely to result from exposure to landslide include:
• Blocked and/or damaged roads
• Casualties (fatalities and injuries)
Section 5
City of Healdsburg 2023 LHMP 5-17
Vulnerability Assessment
Repetitive Losses (RL) Number Total Payout Number of RL Properties (inc. One Severe RL property listed below) 8 $358,237.47 Number of Severe RL Properties 1 $58,901.12
Section 5
Vulnerability Assessment
• Damage to utility distribution lines
• Economic losses for repair and replacement of critical facilities, roads, buildings, etc.
• Damaged vegetation (debris flows often uproot trees and wipe out vegetation in their path)
• Impacts to river ecosystems (soil, debris, and rocks sliding downhill can end up in rivers and affect their natural flow)
5-18
2023 LHMP
City of Healdsburg
Category Number: Slight to Moderate Percentage of Total Number: Moderate to High Percentage of Total Airport 0 0.00% 0 0.00% Bridge 0 0.00% 0 0.00% Community 1 50.00% 2 100.00% Electrical 0 0.00% 0 0.00% Government 0 0.00% 0 0.00% Health/Hospital 2 100.00% 0 0.00% Police/Fire 1 33.33% 0 0.00% Sewage Utility 2 28.57% 0 0.00% Stormwater 0 0.00% 0 0.00% Wastewater Utility 0 0.00% 0 0.00% Water Utility 2 13.33% 8 53.33% TOTAL 8 19.51% 10 24.39%
Table 5-13: Landslide Exposure Analysis Summary – Critical Facilities
Structure Number Percentage of Total Total Value Total Square Feet Healdsburg Slight to Moderate Single-Family Dwellings 4154 93.52% $1,131,057,091 6,284,964 Planned Unit Development 505 93.69% $129,019,826 706,199 Multi-Family Dwellings 405 99.75% $134,247,559 990,165 Mixed Use 30 103.45% 16547990 105982 Other 0 0.00% $0 0 Total 5094 94.05% $1,410,872,466 8087310 Moderate to High Single-Family Dwellings 279 6.28% $128,316,287 640,772 Planned Unit Development 11 2.04% 1502667 9086 Multi-Family Dwellings 0 0.00% 0 0 Mixed Use 0 0.00% 0 0
Table 5-14: Landslide Exposure Analysis Summary – Residential Structures
* Numbers may not add up due to rounding
Note: Estimates based on assumption of equal distribution of population across Census Block Groups
5.2.5 PSPS
People with medical conditions requiring electrical devices are the most vulnerable to the effects of a PSPS event. Critical facilities without generators are the most vulnerable to the effects of a PSPS event. Tables 5-16 through 5-18 illustrate the summary of impacts from PSPS on Healdsburg from distribution lines and transmission lines.
Section 5 Vulnerability Assessment City of Healdsburg 2023 LHMP 5-19
Structure Number Percentage of Total Total Value Total Square Feet Other 0 0.00% $0 0 Total 290 5.35% $129,818,954 649,858 Unincorporated County within Healdsburg Urban Service Area Slight to Moderate Single-Family Dwellings 238 57.77% $41,123,714 247,205 Multi-Family Dwellings 22 95.65% 3737579 25930 Other 0 0.00% $0 0 Total 260 59.50% $44,861,293 273135 Moderate to High Single-Family Dwellings 174 42.23% $40,041,499 195,981 Multi-Family Dwellings 1 4.35% 328093 2480 Other 1 50.00% $1,065,246 3,668 Total 176 40.27% $41,434,838 202,129
Table 5-14: Landslide Exposure Analysis Summary – Residential Structures
Jurisdiction Number: Slight to Moderate Percentage of Total Number: Moderate to High Percentage of Total City of Healdsburg 9,844 88.02% 1339 11.98% Unincorporated County within Healdsburg Urban Service Area 584 67.93% 275 32.06%
Table 5-15: Landslide Exposure Analysis Summary – Population
Category Number: Slight to Moderate Percentage of Total Number: Moderate to High Percentage of Total Airport 1 100.00% 0 0.00%
Table 5-16: PSPS Exposure Analysis Summary – Critical Facilities
Vulnerability Assessment
Section 5
5-20 City of Healdsburg 2023 LHMP Bridge 2 66.67% 0 0.00% Community 0 0.00% 2 100.00% Electrical 0 0.00% 1 100.00% Government 0 0.00% 1 50.00% Health/Hospital 0 0.00% 2 100.00% Police/Fire 0 0.00% 3 100.00% Sewage Utility 0 0.00% 5 71.43% Wastewater Utility 0 0.00% 1 50.00% Stormwater 1 33.33% 1 33.33% Water Utility 6 40.00% 8 53.33% TOTAL 10 24.39% 24 58.54%
Structure Number Percentage of Total Total Value Total Square Feet Healdsburg Slight to Moderate Single-Family Dwellings 3864 86.99% $1,064,041,092 5,878,111 Planned Unit Development 538 99.81% $130,339,379 715,769 Multi-Family Dwellings 385 94.83% $134,983,845 964,565 Mixed Use 29 100.00% 10745486 64934 Other 0 0.00% $0 0 Total 4816 88.92% $1,340,109,802 7623379 Moderate to High Single-Family Dwellings 578 13.01% $200,553,067 1,067,601 Planned Unit Development 1 0.19% 5066218 1976 Multi-Family Dwellings 21 5.17% 183114 66648 Mixed Use 0 0.00% 0 0 Other 0 0.00% $0 0 Total 600 11.08% $205,802,399 1,136,225 Unincorporated County within Healdsburg Urban Service Area Slight to Moderate Single-Family Dwellings 5 1.21% $1,920,449 10,063 Multi-Family Dwellings 0 0.00% 0 0 Other 0 0.00% $0 0 Total 5 1.14% $1,920,449 10063 Moderate to High Single-Family Dwellings 25 6.07% $10,866,466 43,153 Multi-Family Dwellings 0 0.00% 0 0
Table 5-17: PSPS Exposure Analysis Summary – Residential Structures
Note: Estimates based on assumption of equal distribution of population across Census Block Groups
5.2.6 Severe Weather
Due to the large areas affected by severe weather, all critical facilities, residential structures, and population of Healdsburg are exposed. Unhoused persons will be the most vulnerable to severe weather.
5.2.7 Wildfire
The risk to residents and property from wildfire is of significant concern. Wildfire danger is a major threat across the forested, fuel-rich area. High fuel loads in the wooded areas, along with geographical and topographical features, create the potential for both natural- and human-caused fires that can result in loss of life and property damage. These factors, combined with natural weather conditions common to the area, including periods of drought, low relative humidity, and significant winds, can result in frequent and sometimes catastrophic fires. Any fire, once ignited, has the potential to quickly become large and out of control.
Wildfire severity is categorized into three zones: moderate, high, and very high. Healdsburg has no areas located in the very high severity zone; therefore, this exposure analysis focuses on the moderate and high FHSZs. Per the analysis, over 50 percent of the city’s critical facilities, about 30 percent of residential structures, and almost 25 percent of the population are in a wildfire severity zone (residential structures and population from the unincorporated county within Healdsburg’s Urban Service Area are also illustrated). Tables 5-19 through 5-21 summarize the impacts from wildfire in Healdsburg.
Wildfire poses numerous risks to critical facilities and infrastructure. Risks, or the harm or losses, that are likely to result from exposure to wildfire include:
• Casualties (fatalities and injuries)
• Utility outages
Section 5 Vulnerability Assessment City of Healdsburg 2023 LHMP 5-21
Structure Number Percentage of Total Total Value Total Square Feet Other 2 100.00% $1,065,246 3,668 Total 27 6.18% $11,931,712 46,821 * Numbers may not add up due to rounding
Table 5-17: PSPS Exposure Analysis Summary – Residential Structures
Jurisdiction Number: Slight to Moderate Percentage of Total Number: Moderate to High Percentage of Total City of Healdsburg 1,419 13.90% 296 2.90% Unincorporated County within Healdsburg Urban Service Area 594 75.60% 130 16.60%
Table 5-18: PSPS Exposure Analysis Summary – Population
Section 5
Vulnerability Assessment
• Economic losses for repair and replacement of critical facilities, roads, buildings, etc.
• Indirect economic losses, such as income lost during the downtime that results from damage to private property or public infrastructure.
• Loss of natural and cultural resources
• Smoke and air pollution
• Creation of more favorable conditions for other hazards such as flooding, landslides, and erosion during the subsequent rainy season
Note: No critical facilities are located in the Very High FHSZ
5-22 City of Healdsburg 2023 LHMP
Category Number: Moderate Percentage of Total Number: High Percentage of Total Airport 0 0.00% 0 0.00% Bridge 0 0.00% 0 0.00% Community 0 0.00% 0 0.00% Electrical 0 0.00% 0 0.00% Government 0 0.00% 0 0.00% Health/Hospital 0 0.00% 0 0.00% Police/Fire 0 0.00% 0 0.00% Sewage Utility 0 0.00% 0 0.00% Wastewater Utility 0 0.00% 0 0.00% Stormwater 0 0.00% 0 0.00% Water Utility 1 6.67% 4 26.67% TOTAL 1 2.44% 4 9.76%
Table 5-19: Wildfire Vulnerability Summary – Critical Facilities
Structure Number Percentage of Total Total Value Total Square Feet Healdsburg Moderate Single-Family Dwellings 127 2.86% $55,638,715 255,085 Planned Unit Development 30 5.57% $3,962,379 21,162 Multi-Family Dwellings 0 0.00% $0 0 Mixed Use 0 0.00% 0 0 Other 0 0.00% $0 0 Total 157 2.90% $59,601,094 276,247
Table 5-20: Wildfire Vulnerability Summary – Residential Structures
Note: Estimates based on assumption of equal distribution of population across Census Block Groups
Section 5 Vulnerability Assessment City of Healdsburg 2023 LHMP 5-23
Structure Number Percentage of Total Total Value Total Square Feet High Single-Family Dwellings 141 3.17% $72,763,571 363,227 Planned Unit Development 18 3.34% $5,439,946 30,575 Multi-Family Dwellings 0 0.00% $0 0 Mixed Use 0 0.00% 0 0 Other 0 0.00% $0 0 Total 159 0.15% $78,203,517 393,802 Unincorporated County within Healdsburg Urban Service Area Moderate Single-Family Dwellings 33 8.01% $5,686,115 35,253 Multi-Family Dwellings 4 17.39% 145125 2940 Other 0 0.00% 0 0 Total 37 8.47% $5,831,240 38,193 High Single-Family Dwellings 412 100.00% $81,165,213 443,186 Multi-Family Dwellings 23 100.00% $4,065,672 28,410 Other 2 100.00% $1,065,246 3,668 Total 437 100.00% $86,296,131 475,264
Table 5-20: Wildfire Vulnerability Summary – Residential Structures
Jurisdiction Number: Moderate Percentage of Total Number: to High Percentage of Total City of Healdsburg 1,069 9.56% 10 0.09% Unincorporated County within Healdsburg Urban Service Area 47 5.43% 795 92.52%
Table 5-21: Wildfire Vulnerability Summary – Population
Section 6. Capability Assessment
The local hazard mitigation planning requirement to document existing capabilities is as follows:
Regulation Checklist – 44 CFR 201.6 Local Mitigation Plans
Element C. Mitigation Strategy
C1. Does the plan document each jurisdiction’s existing authorities, policies, programs and resources and its ability to expand on and improve these existing policies and programs? (Requirement §201.6(c)(3))
The capability assessment identifies and evaluates the legal and regulatory, human and technical, and financial resources available to accomplish mitigation. Completing the capability assessment is a helpful exercise to clearly illustrate the capabilities that currently exist, which helps to assess and prioritize potential mitigation actions. Mitigation actions should push to expand on a community’s resiliency, but the actions need to be grounded in something achievable; the capability assessment is necessary to evaluate the feasibility of proposed mitigation actions based on local capabilities. Conducting the capability assessment will also help identify gaps in capabilities and resources and will provide an opportunity to start discussing how current capabilities can be improved and expanded.
6.1 Regulatory Mitigation Capabilities
The City of Healdsburg has several plans and programs in place that guide the City’s mitigation of development in hazard-prone areas. Table 6-1 lists planning and land management tools typically used by local jurisdictions to implement hazard mitigation activities and indicates those that are in place in Healdsburg.
Table 6-1: Legal/Regulatory Capabilities
Section 6 Capability Assessment City of Healdsburg 2023 LHMP 6-1
Legal/Regulatory Tool (Ordinances, Codes, Plans) Yes/No Comments General Plan Yes Addressed hazards and affects development in hazard areas. Comprehensive/Master Plan Yes Healdsburg has specific Master Plans. Capital Improvements Plan Yes Addressed hazards and affects development in hazard areas. Zoning Ordinance Yes Addressed hazards and affects development in hazard areas. Subdivision Ordinance Yes Addressed hazards and affects development in hazard areas. Floodplain Ordinance Yes Addressed hazards and affects development in hazard areas. Growth Management Ordinance Yes Building Code Yes Version: CBC 2022 Addressed hazards and affects development in hazard areas.
Section 6 Capability Assessment
Table
Legal/Regulatory Capabilities
Are there gaps in your capabilities/resources? How can your legal/regulatory capabilities be expanded and improved to further reduce risk?
• Develop an economic development plan. Assessment done in 2006.
6.2 Human/Technical Capabilities
Table 6-2 identifies the City personnel responsible for or who have skills for activities related to mitigation.
6-2 City of Healdsburg 2018 LHMP
Legal/Regulatory Tool (Ordinances, Codes, Plans) Yes/No Comments Fire Department ISO Rating Yes Rating: 2 (due for evaluation) Erosion or Sediment Control Program Yes Addressed hazards and affects development in hazard areas. Transportation Plan Yes City of Healdsburg Community Wildfire Protection Plan (CWPP) Yes Adopted as
December 2022. Neighboring CWPPs Yes Sonoma County, Fitch Mountain, Mill Creek and Cloverdale all have current CWPPs. Storm Water Management Program Yes Addressed hazards and affects development in hazard areas. Site Plan Review Requirements Yes Addressed hazards and affects development in hazard areas for new builds and extensive remodels. Capital Improvements Plan Yes Addressed hazards and affects development in hazard areas. Economic Development Plan No Local Emergency Operation Plan Yes New EOP published 2021. Flood Insurance Study or other engineering study for streams Yes Addressed hazards and affects development in hazard areas. Elevation Certificates Yes Addressed hazards and affects development in hazard areas. California Vegetation Treatment Plan (Cal-VTP) Yes Healdsburg Ridge Open Space
Preserves. Vegetation Management/Weed Abatement Ordinance Yes Done
6-1:
an Annex to this document in
and Fitch Mountain
annually by resolution. Documents from fire department, follows Government Code
Table 6-2: Human/Technical Capabilities
Section 6 Capability Assessment City of Healdsburg 2023 LHMP 6-3
Human/Technical Resources Yes/No Department/Position & Comments Planning Commission Yes Mitigation Planning Committee Yes Framework for LHMP Planning Team to continue meeting on regular basis will be outlined in plan maintenance section Maintenance programs to reduce risk (e.g., tree trimming, clearing drainage systems) Yes Parks, Public Works, California Conservation Corps: tree maintenance, stormwater inlet cleaning (understaffed), Foss Creek cleaning Mutual aid agreements Yes With communities around Healdsburg, with their public works departments Hazard data and information Yes Planning and Building, Public Works, IT Grant writing Yes Fire, Public Works Within Public Works, have staff with the ability, but not staff dedicated to grant writing HAZUS analysis No Planner/Engineer with knowledge of land development/land management practices Yes Planning and Building Engineer/Professional trained in construction practices related to building and/or infrastructure Yes Planning and Building Planner/Engineer/Scientist with an understanding of natural hazards Yes Planning and Building Personnel skilled in GIS Yes Utility and IT Departments Full-time building official Yes Planning and Building Floodplain Manager Yes Public Works Emergency Manager Yes Police Department Public Information Officer Yes City Manager’s Office, as well as Public Safety Officials GIS Data (hazard areas, critical facilities, building footprints, land use, links to assessor’s data) Yes Planning and Building Warning Systems/Services (Reverse 911, cable override, outdoor warning signals) Yes Nixle, subscription-based Fire Marshal Yes Fire Department Predevelopment Meetings Yes Twice weekly meetings for new development on any scale, with all departments that will be reviewing plans in attendance
Table 6-2: Human/Technical Capabilities
Human/Technical Resources Yes/No
Department/Position & Comments
Are there gaps in your capabilities/resources? How can your human/technical capabilities be expanded and improved to further reduce risk?
• Train or hire a staff member with knowledge of HAZUS.
• Desire for another fire inspector.
• Recent additions:
Hired back a Utility Conservation Analyst
Hired an Emergency Manager.
Completed the Foss Creek Flood Control Study, which is the primary source of flood threat within the city.
Flood Gauge for Foss Creek was installed and is operational.
6.3 Fiscal Capabilities
This section identifies the financial tools or resources that the City could potentially use to help fund mitigation activities. These include City-specific capabilities (Table 6-3), as well as state and federal resources (Table 6-4). It is important to note that funding can also be sourced from participating agencies/organizations that collaborate with the County in the implementation of mitigation actions.
Table 6-3: Financial Capabilities
Are there gaps in your capabilities/resources? How can your fiscal capabilities be expanded and improved to further reduce risk?
• Unless it’s an emergency situation, new expenditures in excess of $50,000 require approval from City Council.
6-4 City of Healdsburg 2018 LHMP
Section 6 Capability Assessment
Financial Resources Accessible/ Eligible to Use (Y/N) Purpose and Comments Capital improvements project funding Yes Authority to levy taxes for specific purposes Yes Subject to Prop 218 Fees for water, sewer, gas, or electric services Yes Impact fees for new development Yes Includes fire impact fees Stormwater utility fee Yes Really minimal, subject to new state law classifying stormwater as Utility for Prop 218 purposes Incur debt through general obligation bonds Yes Currently paying off bonds (and good credit rating) Incur debt through special tax bonds Yes Other federal funding programs Yes State funding programs Yes
6.3.1 State and Federal Funding Resources
Table 6-4 lists potential funding programs and resources provided by state and federal agencies/programs the City can tap into for hazard mitigation activities. Please note that the information listed below is not exhaustive.
Agency Potential Programs/Grants
Department of Homeland Security – Federal Emergency Management Agency
• Homeland Security Grant Program (HSGP)
• Emergency Management Performance Grants (EMPG) Program
• Transit Security Grant Program
• Assistance to Firefighters Grant (AFG) Program
• HMGP (gain eligibility by having a FEMA-approved HMP)
• PDM Grant Program (gain eligibility by having a FEMA-approved HMP)
• Flood Mitigation Assistance (FMA) Program (gain eligibility by having a FEMA-approved HMP)
US Department of Housing and Urban Development
US Department of the Interior
Community Development Block Grant (CDBG) Program
• Coastal Impact Assistance Program
• USGS Research and Data Collection
• WaterSMART Grants
US Department of Defense – US Air Force Training Requirements Funding
US Department of Health and Human Services Grants for Public Health Emergency Preparedness
US Department of Commerce Coastal Resilience Networks
California Governor’s Office of Emergency Services
• Regional Catastrophic Preparedness Grant Program
• Interoperable Emergency Communications Center Grant Program
• Proposition 1B Grant
• Citizens Corps Program
• Metropolitan Medical Response System Program
• Earthquake and Tsunami Grants Program
California Department of Housing and Community Development Disaster Recovery Initiative (DRI)
California Department of Forestry and Fire Protection
California Department of Water Resources
Western States WUI Fire Assistance Grant
Integrated Regional Water Management (IRWM) Grant Programs
State Water Resources Control Board Storm Water Grant Program (SWGP) – Proposition 1
California Coastal Conservancy Proposition 1 Grants
California Department of Fish and Wildlife Watershed Restoration Grant Program
Section 6 Capability Assessment City of Healdsburg 2023 LHMP 6-5
Table 6-4: Potential Funding Programs/Grants from State and Federal Agencies
6-6 City of Healdsburg 2018 LHMP
Section 6 Capability Assessment
This page intentionally left blank
Section 7. Mitigation Strategy
The intent of the mitigation strategy is to provide the City of Healdsburg with the tools that will serve as guiding principles for future hazard mitigation policy and project administration. The development of the mitigation strategy includes the creation of a mitigation action plan, which involves a prioritization process for selected mitigation actions. The mitigation action plan represents the key outcomes of the LHMP planning process.
7.1 Hazard Mitigation Goals
The local hazard mitigation planning requirement to establish goals is as follows:
Regulation Checklist – 44 CFR 201.6 Local Mitigation Plans
Element C: Mitigation Strategy
C3. Does the plan include goals to reduce/avoid long-term vulnerabilities to the identified hazards? (Requirement §201.6(c)(3)(i))
Goals are broad policy statements representing the City’s desire for long-term hazard mitigation results. The LHMP Planning Team first looked at the goal in the current LHMP, which is a general goal that addresses all hazards covered in the plan. The group considered developing more goals and having hazardspecific goals, but the LHMP Planning Team determined that the preference was a single general goal. The Planning Team also noted that the goal from the current LHMP does not contradict the Guiding Principles in the current General Plan.
The LHMP Planning Team decided to keep the mitigation goal from the current plan:
To maintain and enhance a disaster-resistant community by reducing the potential for loss of life, property damage, and environmental degradation from natural disasters, while accelerating economic recovery from those disasters.
7.2 Review of the 2018 Mitigation Action Plan
The local hazard mitigation planning requirement for reviewing the previous LHMP’s mitigation action plan is as follows:
Regulation Checklist – 44 CFR 201.6 Local Mitigation Plans
Element D: Plan Review, Evaluation, and Implementation
D2. Was the plan revised to reflect progress in local mitigation efforts? (Requirement §201.6(d)(3))
During the 2023 LHMP planning process, the 2018 mitigation action plan was reviewed to determine which mitigation actions had been completed, deleted, deferred, or are ongoing. Mitigation actions are activities, measures, and/or projects that help achieve the goals of a mitigation plan. The results of this review, shown in Table 7-1, illustrate the progress in the City’s local mitigation efforts over the five-year period, under the guidance of the 2018 LHMP. Recent mitigation activities that were not specifically called out in the 2018 LHMP have also been included in the table to create a more comprehensive list of the City’s mitigation efforts.
Section 7 Mitigation Strategy City of Healdsburg 2023 LHMP 7-1
Mitigation Strategy
Table 7-1: Status of 2018 LHMP Mitigation Actions and Other Recent Mitigation
Include “areas subject to high ground shaking, earthquakeinduced ground failure, and surface fault rupture” in the list of criteria used for determining a replacement schedule for pipelines.
Where active faults are found based on geologic investigations, public water mains will include additional valves and fire hydrants placed on each side of the fault, which in the event of pipeline rupture will allow the rupture to be isolated limiting water loss and damage. Temporary water lines can then be run overland to “shunt” water between fire hydrants and thereby maintain service for domestic water and fire protection. Design of sewer mains will include a manhole on each side of the fault, which in the event of pipeline rupture, would allow the pipelines nearest to the break to be plugged from inside the manholes and prevent or minimize the spread of environment damage, and also allow installing a temporary “bypass” between these manholes using portable pump s so that sewer service can continue during the emergency.
Public Works Department Start date unknown, from at least 2009–Ongoing
Complete (federally funded, addressed seismic retrofitting)
Retrofit or replace critical lifeline infrastructure.
Healdsburg Bridge seismic retrofits
The City is currently in the process of rehabilitating the 90year-old Healdsburg Avenue Bridge over the Russian River. This rehabilitation will include protection against scours resulting from high flood flows and seismic activities. In addition to mitigation of these hazards, the functioning of the bridge is critical for evacuation in case of severe flooding, dam failure, or any disaster that might close US Highway 101 over the Russian River.
Public Works Department 2014–15
Section 7
7-2 City of Healdsburg 2018 LHMP
Status
Ongoing, Completed, or No Action) Project/Program Name Description Responsible Agency Year(s)
Current
(Current,
Completed and
(program has been initiated, but is ongoing) Equip water mains crossing fault lines for emergency connection
Table 7-1: Status of 2018 LHMP Mitigation Actions and Other Recent Mitigation
(Current, Ongoing, Completed, or No Action) Project/Program Name
No Action
(City does not have ability to enforce, but access to information has improved. More information available on website since 2011, but no active outreach to real estate agents)
On-going
Work more effectively with real estate agents regarding hazard disclosures
Assist in ensuring adequate hazard disclosure by working with real estate agents to improve enforcement of real estate disclosure requirements for residential properties with regard to seven official natural hazard zones: (1) Special Flood Hazard Areas (designated by FEMA), (2) Areas of Potential Flooding from dam failure inundation, (3) Very High Fire Hazard Severity Zones, (4) Wildland Fire Zones, (5) Earthquake Fault Zones (designated under the AlquistPriolo Earthquake Fault Zoning Act), and the (6) Liquefaction and (7) Landslide Hazard Zones (designated under the Seismic Hazard Mapping Act).
In Progress Encourage health care facilities to develop disaster mitigation plans
In Progress-Construction to begin in 2024
Encourage ancillary facilities, medical offices, pharmacies, free or specialty clinics, etc. facility operators to develop disaster mitigation plans.
Completed and Current (program has been initiated, but is ongoing)
Construction of a Healdsburg Fire Department substation
This new substation will be an alternate station should the main station be impacted by flooding. Regarding the area of geology and soils, the environmental impact report for the project identified five mitigation measures to be implemented during the construction process.
Water Conservation Program Lawns that are removed and replaced and maintained with low-water-use plantings, permeable landscape surfaces (mulch, decorated rock, stone pavers, or similar), gardens, trees, shrubs, and/or decorative outdoor landscape elements are eligible for a one-time cash rebate.
Section 7 Mitigation Strategy City of Healdsburg 2023 LHMP 7-3
Status
Description Responsible Agency Year(s)
Planning and Building Department N/A
Fire
2024
Department
Planning and
Department 2007–current
Building
Utility
Department 2014–ongoing
Section 7
Mitigation Strategy
Status
(Current, Ongoing, Completed, or No Action)
Completed and Current (program has been initiated, but is ongoing)
Table 7-1: Status of 2018 LHMP Mitigation Actions and Other Recent Mitigation
Energy efficiency rebates
Energy efficiency rebates for items such as:
• Heat pumps
• Air conditioners and evaporative coolers
• Duct sealing and weatherization.
• AC and heat pump tune-ups
• Replacement of appliances: electric water heater, dishwasher, and clothes washer
Utility Department 2014–ongoing
Completed and Current (program has been initiated, but is ongoing)
Water conservation Education and Outreach
The City has offered a variety of water conservation workshops, such as:
• Welcome to Greywater 101
• 2010 Urban Water Management Plan
• Home-scale Greywater
• Inspect and Evaluate Your Irrigation System
• State Mandated Water Restrictions and You
• Basics of Drought Tolerant Landscaping
• Setting a Landscape Water Budget
• Practical Solutions to Create a Water-Wise Home Series: Water Conservation 101 Indoor Solutions
Harvest the Rain and Slow the Flow
Utility Department 2015–ongoing
Completed and Current (program has been initiated, but is ongoing)
Free water-saving items Free water-saving items:
• A variety of water savings items such as low-flow shower heads and faucet aerators.
• Other conservation programs exist with sufficient funding.
Utility Department 2014–ongoing
7-4 City of Healdsburg 2018 LHMP
Responsible Agency Year(s)
Project/Program Name Description
Status
Completed and Current (program has been initiated, and is ongoing)
Completed and Current (program has been initiated, but is ongoing)
Table 7-1: Status of 2018 LHMP Mitigation Actions and Other Recent Mitigation
Free energy audits & education City offers free energy audits for commercial electric customers and education for residential customers.
Weed Abatement The Fire Department conducts annual inspections. Residents are asked to abate high weeds, trim up limbs at least 6 feet off the ground, and remove ladder fuels.
Current Russian River Watershed Association Storm Water Resource Plan (SWRP)
An active participant in the development of the SWRP, one of 11 local entities represented. The main goals of the SWRP are to identify and prioritize stormwater and dry weather runoff capture projects and other multi-benefit projects that advance stormwater goals in the Russian River watershed. (Healdsburg submitted 17 projects during the planning process, 13 projects made the list of prioritized projects (51 total “prioritized” projects), including 12 of Top 20 ranked projects.)
Complete
Storage Tank for Sunset Pressure Zone Install a storage tank for the Sunset pressure zone to increase the capacity and flow for fighting fires in this vulnerable area.
Section 7
Strategy City of Healdsburg 2023 LHMP 7-5
Mitigation
Description Responsible Agency Year(s)
(Current, Ongoing, Completed, or No Action) Project/Program Name
Utility
Start date unknown–Ongoing
Department
Fire Department Ongoing
Public
Department 2017–18
Works
Public
Works Department 2021-2022
7.3 2023 Mitigation Actions
With the results of the hazard risk assessment finalized, the mitigation goal established, and capabilities assessed, the City then set out to identify mitigation actions that would reduce the impacts of the focused natural hazards.
FEMA identifies four categories of mitigation actions. Understanding these categories helps communities to realize the full breadth of mitigation and develop a comprehensive mitigation strategy. FEMA’s four hazard mitigation categories are described below.
• Local Plans and Regulations: Government administrative or regulatory actions (authorities, policies, or codes) or processes that influence the way land and buildings are developed and built.
• Structure and Infrastructure Projects: Actions that involve modifying or removing existing buildings or infrastructure to protect them from a hazard. Mitigation projects intended to lessen the impact of a hazard by using structures to modify the environment.
• Natural Systems Protection: Actions that, in addition to minimizing hazard damage/losses, also preserve or restore the functions of natural systems.
• Education and Awareness Programs: Actions to inform and educate citizens, elected/public officials, and property owners about potential risks from hazards and potential ways to mitigate them.
7.3.1 Identification and Prioritization of Mitigation Actions
The local hazard mitigation planning requirements to develop a mitigation action plan, and the requirement to revise the plan based upon current priorities are as follows:
Regulation Checklist – 44 CFR 201.6 Local Mitigation Plans
Element C: Mitigation Strategy
C4. Does the plan identify and analyze a comprehensive range of specific mitigation actions and projects for each jurisdiction being considered to reduce the effects of hazards, with emphasis on new and existing buildings and infrastructure? (Requirement §201.6(c)(3)(ii))
C5. Does the plan contain an action plan that describes how the actions identified will be prioritized (including cost benefit review), implemented, and administered by each jurisdiction? (Requirement §201.6(c)(3)(iv)); (Requirement §201.6(c)(3)(iii))
Regulation Checklist – 44 CFR 201.6 Local Mitigation Plans
Element D: Plan Review, Evaluation, and Implementation
D3. Was the plan revised to reflect changes in priorities? (Requirement §201.6(d)(3))
The LHMP Planning Team worked with the LHMP Planning Team to review and assess existing plans and studies
Development of the mitigation action plan occurred in three general steps:
Section 7
Strategy 7-6 City of Healdsburg 2018 LHMP
Mitigation
1. Establish a list of potential mitigation actions.
2. Discuss the pros and cons of each potential mitigation action
3. Identify the priority mitigation actions and provide additional details for each.
The LHMP Planning Team began the process of developing the mitigation action plan by identifying a list of potential mitigation actions. Potential actions are actions that are feasible and will benefit the City, but may not be priority actions for the five-year planning period.
As shown in Table 7-2, for each potential mitigation action, the following information is listed: description, hazard(s) addressed, mitigation category, and type of development affected by the action.
Section 7 Mitigation Strategy City of Healdsburg 2023 LHMP 7-7
Section 7
Mitigation Strategy
Table 7-2: Potential Mitigation Actions
1 Integrate the hazard analysis and mitigation strategy into the General Plan’s Safety Element.
2 Have a booth at the annual Safety Fair to provide outreach and education about what residents can do in their own homes. Coordinate this effort with social media outreach.
3 Make energy efficiency a priority through building code improvements, retrofitting City facilities with energyefficient lighting, and urging employees to conserve energy and save money
4 Restore and protect the ability of natural ecosystems to capture and store carbon.
5 Develop a water conservation outreach program that focuses on recycled water.
6 Install earthquake sensors that can automatically open vehicle bay doors at Police and Fire stations.
7 Seismically retrofit or upgrade seismically deficient government facilities and pre-identified shelter facilities.
8 Develop and implement plans to increase building owners’ general knowledge of and appreciation for the value of seismic upgrading of their buildings’ structural and nonstructural elements.
9 Develop an outreach program to talk to the public about earthquake risk and mitigation activities that can be completed in homes, schools, and businesses.
7-8 City of Healdsburg 2018 LHMP
No. Description Hazard Mitigation Category New or Existing Construction Affected?
All Local Plans and Regulations Not Applicable
All Education and Awareness Existing Construction
Climate
Local Plans and Regulations Existing Construction
Change
Climate
Natural
New and
Construction
Change
Systems Protection
Existing
Drought Education and Awareness Not Applicable
Earthquake Structure and Infrastructure Not Applicable
Structure and Infrastructure Existing Construction
Earthquake
Local
Existing Construction
Earthquake
Plans and Regulations, Education and Awareness
Education
Existing Construction
Earthquake
and Awareness
Table 7-2: Potential Mitigation Actions No.
10 Remove storm drains from backyards and relocate to streets. This is also an opportunity to increase stormwater capacity; ensure that relocation of storm drains also increases overall capacity.
11 Reinforce roads/bridges from flooding through protection activities, including elevating the roads/bridges and installing/widening culverts beneath the roads/bridges or upgrading storm drains.
12 Acquire, relocate, or elevate residential structures, in particular those that have been identified as Repetitive Loss properties, within the 100-year floodplain.
13 Acquire, relocate, or elevate critical facilities within the 100-year floodplain (such as the Fire Station).
Flooding
Flooding
Flooding
Flooding
Flooding
and Infrastructure, Natural Systems Protection
Flooding
and Infrastructure
Winds
High Winds Structure and Infrastructure Existing Construction
Section 7 Mitigation Strategy City of Healdsburg 2023 LHMP 7-9
Description Hazard Mitigation Category New or Existing Construction Affected?
Structure
Existing Construction
and Infrastructure
Structure and Infrastructure Existing Construction
Structure and Infrastructure Existing Construction
Construction
Structure and Infrastructure Existing
Structure
New
14 Encourage the use of Low Impact Development (LID) Best Management Practices (BMPs) to reduce stormwater runoff and increase groundwater recharge. Construction
and Existing
Education and Awareness Not Applicable
15 Develop a Healdsburg-specific outreach strategy to utilize the materials being developed through the Russian River Watershed Association as part of the Storm Water Resource Plan (SWRP) currently in development.
Structure
Existing Construction
16 Raise utilities or other mechanical devices above expected flood levels. Flooding
Local
and
Not Applicable
17 Establish standards for all utilities regarding tree pruning around lines. High
Plans
Regulations
18 Underground power lines whenever they are relocated, such as during efforts to move power lines that travel through back yards.
Section 7
Mitigation Strategy
Table 7-2: Potential Mitigation Actions
19 Implement landslide stabilization and/or protection measures into the North Fitch Mountain Slide Repair. Stabilization measures include grading the unstable portion of the slope to a lower gradient, construction of rock buttresses and retaining walls, and drainage improvements. Protection measures include containment and/or diversion of the moving debris, such as walls, berms, ditches, and catchment basins.
20 Implement post-fire debris flow hillslope and channel treatments, such as seeding, mulching, check dams, and debris racks, as needed.
21 Encourage the use of non-combustible materials (e.g., stone, brick, and stucco) in new construction and the use of fire-resistant roofing and materials in remodels, upgrades, and new construction.
22 Implement an outreach program that educates residents on mitigation actions they can take at their homes such as removing dead or dry leaves and combustibles from roofs, decks, eaves, porches, and yards; and creating a defensible spaces or buffer zones around their houses.
23 Install a storage tank for the Sunset pressure zone to increase the capacity and flow for fighting fires in this vulnerable area.
24 When replacing water lines, put in laterals for sprinklers to residential buildings (already included for commercial, industrial, and new construction, but not for existing residential buildings).
Landslide Structure and Infrastructure, Natural Systems Protection New and Existing Construction
Post-Fire Debris Flow Natural Systems Protection New and Existing Construction
Wildfire Local Plans and Regulations New and Existing Construction
Wildfire Education and Awareness Existing Construction
Wildfire Structure and Infrastructure New and Existing Construction
Wildfire Structure and Infrastructure Existing Construction
7-10 City of Healdsburg 2018 LHMP
Description Hazard Mitigation Category New or Existing Construction Affected?
No.
Table 7-2: Potential Mitigation Actions
25 Implement storm water runoff reduction projects to reduce the impacts of flooding.
Section 7 Mitigation Strategy City of Healdsburg 2023 LHMP 7-11
No. Description Hazard Mitigation Category New or Existing Construction Affected?
Flooding Structure and Infrastructure New and Existing Construction
After the list of potential mitigation actions was developed, the LHMP Planning Team was asked to consider the pros and cons of each action. Then, through a group discussion, the list of actions was narrowed down to a set of priority mitigation actions. While considering the pros and cons of the actions and during the priority action discussion, the group was asked to consider the following questions:
• Does the action: Solve the problem? Address multiple hazards? Offer benefits that equal or exceed costs (is there a cost benefit)? Implement a goal, policy, or project identified in the General Plan or Capital Improvement Plan?
• Can the action: Be implemented with existing funds? Be implemented by existing state or federal grant programs? Be completed within the five-year life cycle of the HMP?
• Will the action: Be implemented with currently available technologies? Be accepted by the community? Be supported by community leaders (is there political support)? Adversely affect segments of the population or neighborhoods? Require a change in local ordinances or zoning laws? Result in positive or neutral impact on the environment? Comply with all local, state, and federal environmental laws and regulations?
• Is there: Sufficient staffing to undertake the project? Existing authority to undertake the project? An example of a similar project being successful? A champion for the project?
To further support the prioritization process, the Planning Team considered HMA program requirements (Table 7-3), as these projects have the greatest chance of leading to enhanced project scoping and the lowest probability of HMA funding delays.
The format of this approach to prioritization differs from the previous plan, but similar concepts are covered. The previous plan determined prioritization on economic cost-benefit analysis, technical and administrative feasibility, political acceptability, social appropriateness, legality, and the action not being harmful to the environment or the community’s heritage. All of these criteria are addressed in the questions above and the HMA Program Requirements below.
Mitigation actions not selected as priority actions may be considered at a later date for implementation if the priority actions have been completed or deferred, as additional funding sources become available, or if the goals and objectives of the LHMP shift.
7-3:
Requirement Description
Mitigation Planning
Technical Feasibility and Effectiveness
Floodplain Management and Protection of Wetlands
Links the existing mitigation plan, particularly the vulnerability analysis and capability assessment, to project scoping.
Conforms with accepted engineering practices, established codes, standards, modeling techniques, or best practices. Effective mitigation measures funded under HMA should provide a long-term or permanent solution.
Conforms to 44 CFR Part 9, which incorporates the requirements of Executive Order (EO) 11988 (Floodplain Management) and EO 11990 (Protection of Wetlands).
Section 7
Strategy 7-12 City of Healdsburg 2018 LHMP
Mitigation
Table
Priority Mitigation Action Criteria (HMA Program Requirements)
Table 7-3: Priority Mitigation Action Criteria (HMA Program Requirements)
Requirement Description
Environmental Planning and Historic Review and Compliance
Complies with all environmental and historic preservation (EHP) laws and with 44 CFR Part 10.
Cost Effectiveness Is cost-effective or in the interest of the National Flood Insurance Fund. Cost Review Is reasonable in costs compared to the probable benefits.
General Program Requirements Is an eligible activity, including: property acquisition and structure demolition; property demolition and structure relocation; structure elevation; mitigation reconstruction; dry floodproofing of historic residential structures; dry floodproofing of nonresidential structures; minor localized flood reduction projects; structural retrofitting of existing buildings; nonstructural retrofitting of existing buildings and facilities; infrastructure retrofit; soil stabilization; wildfire mitigation; post-disaster code enforcement.
Source: FEMA 2015
Once priority actions were chosen, additional details were included for each action: the facility to be mitigated (if known and/or applicable), potential funding source, department or agency lead, and time frame. The final prioritized list of actions is the 2023 Mitigation Action Plan, as shown in Table 7-4
Section 7 Mitigation Strategy City of Healdsburg 2023 LHMP 7-13
Section 7
Mitigation Strategy
1 Integrate the hazard analysis and mitigation strategy into the General Plan’s Safety Element.
2 Have a booth at the annual Safety Fair to provide outreach and education about what residents can do in their own homes. Coordinate this effort with social media outreach.
3 Develop a water conservation outreach program that focuses on recycled water.
4 Develop and implement plans to increase building owners’ general knowledge of and appreciation for the value of seismic upgrading of their buildings’ structural and nonstructural elements.
5 The City is interested in removing storm drains from backyards and relocating the storm drains to streets. This is also an opportunity to increase stormwater capacity; ensure that relocation of storm drains also increases overall capacity.
6 Acquire, relocate, or elevate critical facilities within high hazard areas (specify severity for each hazard)
Table 7-4: 2023 Mitigation Action Plan
7-14 City of Healdsburg 2018 LHMP
No. Description Hazard Mitigation Category New or Existing Construction Affected? Facility to Be Mitigated (if known and/or applicable) Potential Funding Source Department or Agency Lead Time Frame (0–5 Years)
All Local Plans and Regulations Not Applicable Not Applicable General Fund Planning & Building Department 2 Years
All Education and Awareness Existing Construction Not Applicable General Fund Fire Department 1 Year, Annually Thereafter
Drought Education and Awareness Not Applicable Not Applicable General Fund, WaterSMART Grants Department of Public Utilities 3 Years
Earthquake Local Plans and Regulations, Education and Awareness Existing Construction Not Applicable Hazard Mitigation Grant Program (HMGP) Planning & Building Department 3–5 Years
Flooding Structure and Infrastructure Existing Construction Housing with storm drains in their back yards Community Development Block Grant (CDBG) Program Public Works Department 5 Years
All Structure and Infrastructure Existing Construction Fire Station HMGP Public Works Department 5 Years
7 Comply with Low Impact Development (LID) Best Management Practices (BMPs) to reduce stormwater runoff and increase groundwater recharge.
8 Develop a Healdsburg-specific outreach strategy to utilize the materials being developed through the Russian River Watershed Association on the indevelopment Storm Water Resource Plan (SWRP).
9 Underground power lines when possible, to reduce the risk of utility caused wildfire. Prioritize undergrounding in WUI and other areas with high vegetative fuels.
10 Develop utility scale microgrids to mitigate the impacts of PSPS events, heatwaves that limit supply from the electric grid and provide redundant power systems for critical public facilities.
11 Funding for Cal vegetation treatment plan
Table 7-4: 2023 Mitigation Action Plan
City of Healdsburg 2023 LHMP 7-15
Section 7 Mitigation Strategy
No. Description Hazard Mitigation Category New or Existing Construction Affected? Facility to Be Mitigated (if known and/or applicable) Potential Funding Source Department or Agency Lead Time Frame (0–5 Years)
Flooding Structure and Infrastructure, Natural Systems Protection New and Existing Construction Not Applicable General Fund Public Works Department Ongoing
Flooding Education and Awareness Not Applicable Not Applicable General Fund Department of Public Utilities Ongoing
High Winds low humidity Structure and Infrastructure Existing Construction replaced with modern designs to lower
CDBG Program Utilities Department Ongoing
risk.
PSPS, Excessive Heat, Power Outages Structure and Infrastructure New construction at existing facilities State and Federal Grant Funding Utilities Department 5 years
Not Applicable State and Federal Grant Funding Fire Department Ongoing
Wildfire Natural Systems Protection
Mitigation Strategy
Table 7-4: 2023 Mitigation Action Plan
include grading the unstable portion of the slope to a lower gradient, construction of rock buttresses and retaining walls, and drainage improvements. Protection measures include containment and/or diversion of the moving debris, such as walls, berms, ditches, and catchment basins.
Section 7
7-16 City of Healdsburg 2018 LHMP
No. Description Hazard Mitigation Category New or Existing Construction Affected? Facility to Be Mitigated (if known and/or applicable) Potential Funding Source Department or Agency Lead Time Frame (0–5 Years) 12 Wastewater infiltration and inflow reductions to mitigate overwhelming the sewer collection system during rain events. Rain and Flooding Structure and Infrastructure Existing construction State and Federal Funding Department of Public Works 5 years 13 Fire Station Flooding Mitigation Flooding Structure and Infrastructure New and Existing Construction State and Federal Funding Fire Department 2-3 years 14 Tower being overloaded with equipment High Winds Structure and Infrastructure Existing construction State and federal funding Public Works Department 5 years 15 Implement landslide stabilization and/or protection measures
the North Fitch Mountain Slide
Fitch Mountain Open Space Preserve. Stabilization measures
Landslide Structure and Infrastructure, Natural Systems Protection New and Existing Construction North Fitch Mountain landslide HMGP Public Works Department 3–5 Years
into
Repair to include
16 Implement an outreach program that educates residents on mitigation actions they can take at their homes such as removing dead or dry leaves and combustibles from roofs, decks, eaves, porches, and yards; and creating a defensible spaces or buffer zones around their houses as outlined in the Healdsburg CWPP Annex.
18 When replacing water lines, put in laterals for sprinklers to residential buildings (already included for commercial, industrial and new construction, but not for existing residential buildings).
19 Implement storm water runoff reduction projects to reduce the impacts of flooding.
Table 7-4: 2023 Mitigation Action Plan
Section 7
City of Healdsburg 2023 LHMP 7-17
Mitigation Strategy
No.
Hazard Mitigation Category New or Existing Construction Affected? Facility to Be Mitigated (if known and/or applicable) Potential Funding Source Department or Agency Lead Time Frame (0–5 Years)
Description
Wildfire Education and Awareness Existing Construction Not Applicable HMGP Fire Department 1 Year, Ongoing
Wildfire Structure and Infrastructure Existing Construction Existing Residential Buildings General Fund, CDBG Program Public Works Department 1 Year, Ongoing
Flooding
and Infrastructure New and Existing Construction Not Applicable HMGP, Prop 1 Public Works Department 5 Years
Structure
Section 8. Plan Implementation and Maintenance
Because this plan is a living document, it is important that it becomes a tool in the City’s resources to ensure minimal damage in the event of a natural disaster. This section discusses plan adoption and the processes for monitoring, evaluating, and updating the LHMP to ensure the plan remains relevant and continues to address the changing environment in Healdsburg. In addition, this section describes the incorporation of the LHMP into existing City of Healdsburg planning mechanisms, as well as how the City will continue to engage the public.
The local hazard mitigation planning requirements for monitoring, evaluating, and updating the LHMP are as follows:
Regulation Checklist – 44 CFR 201.6 Local Mitigation Plans
Element A: Planning Process
A6. Is there a description of the method and schedule for keeping the plan current (monitoring, evaluating, and updating the mitigation plan within a 5-year cycle? (Requirement § 201.6(c)(4)(i))
8.1 Plan Adoption
To comply with DMA 2000, the City of Healdsburg will officially adopt the 2023 City of Healdsburg LHMP within one year of receiving FEMA “approval pending adoption” status. The adoption of the LHMP recognizes the City’s commitment to reducing the impacts of natural hazards in Healdsburg. The adoption resolution is presented in Appendix E
8.2 Monitoring, Evaluating, and Updating the LHMP
Led by the Emergency Manager, the LHMP Planning Team will meet annually to officially monitor and evaluate the plan. Forms have been developed to facilitate monitoring and evaluating the plan. A summary of the annual meeting will be posted on the City’s website for public viewing.
• Monitoring: The Mitigation Project Progress Report form (Appendix D) will be used to monitor/track each of the mitigation actions included in the 2023 Mitigation Action Plan (and any additional actions that may be added). The LHMP Planning Team is looking into converting this Microsoft Word form into an Excel worksheet that will be housed on a shared drive for regular access by Planning Team members. At a minimum, the form will be updated annually as a progress report for discussion at the annual LHMP Planning Team meeting. This form discusses the status of the mitigation project, including any changes made to the project, identifies implementation problems, and describes appropriate strategies to overcome them.
• Evaluating: Evaluation of the 2023 LHMP will look at the overall effectiveness of the plan to analyze if the plan goal is being met and if the goal is still relevant, if progress is being made, and if there have been any changes in the community that would necessitate an informal update or an amendment to the plan. The Annual Review Questionnaire form (Appendix D) will be used to evaluate the plan. At a minimum, the form will be updated annually for discussion at the annual LHMP Planning Team meeting; should a disaster occur, the Emergency Manager will determine if an evaluation should occur prior to the scheduled annual evaluation.
Section 8 Plan Implementation and Maintenance City of Healdsburg 2023 LHMP 8-1
Section 8
Plan Implementation and Maintenance
• Updating: The LHMP will be updated every five years, as required by DMA 2000. After the third year, the LHMP Planning Team will look into funding/grants for the plan update. After the fourth year, the LHMP Planning Team will begin updating the plan. The plan update process will follow a similar planning process that was used to develop the 2023 LHMP. Future updates to the LHMP will account for any new hazard vulnerabilities, special circumstances, or new information that becomes available. Issues that arise during monitoring and evaluating the LHMP, which require changes to the risk assessment, mitigation strategy, and other components of the LHMP, will be incorporated into the next update of the City of Healdsburg LHMP in 2028.
The plan maintenance process is summarized in Table 8-1
Table 8-1: Plan Monitoring, Evaluation, and Updating Process Monitor Evaluate Update
By Whom Emergency Manager has primary responsibility to call meetings and delegate responsibilities as necessary.
Emergency Manager has primary responsibility to call meetings and delegate responsibilities as necessary.
When Annual meeting along with evaluation. Annual meeting along with monitoring.
Emergency Manager has primary responsibility to call meetings and delegate responsibilities as necessary.
• Every 5 years
• Begin investigating funding/grants following third annual monitoring/ evaluation meeting.
• Begin updating plan following fourth annual monitoring/evaluation meeting.
How
• Responsible agency to monitor mitigation action process regularly. Progress Report form to be updated at least annually.
• LHMP Planning Team will reconvene to discuss/review Mitigation Project Progress Report form
• Summary of the annual meeting to be posted on the City’s website.
• Annual Review Questionnaire form to be completed at least annually by each LHMP Planning Team member.
• LHMP Planning Team will reconvene to discuss/review Annual Review Questionnaire forms.
• Summary of the annual meeting to be posted on the City’s website
• Develop scope of work
• Investigate and apply for funding/budget cost.
• Review/revise plan accounting for:
‒ new hazard vulnerabilities
‒ special circumstances
‒ new information
‒ new priorities
‒ issues from monitoring/ evaluation
‒ progress in mitigation efforts
8-2 City of Healdsburg 2023 LHMP
8.3 Incorporation into Existing Planning Mechanisms
The local hazard mitigation planning requirement for integrating the LHMP into other planning mechanisms is as follows:
Regulation Checklist – 44 CFR 201.6 Local Mitigation Plans
Element C: Mitigation Strategy
C6. Does the Plan describe a process by which local governments will integrate the requirements of the mitigation plan into other planning mechanisms, such as comprehensive or capital improvement plans, when appropriate? (Requirement § 201.6(c)(4)(ii))
Another important implementation mechanism is to incorporate the recommendations and underlying principles of the LHMP into other community plans and mechanisms, such as comprehensive planning, capital improvement budgeting, economic goals and incentives, and regional plans. Mitigation is most successful when it is incorporated within the day-to-day functions and priorities of government and development. Thus, the integration of a variety of City administrative departments into the LHMP Planning Team provides an opportunity for constant and pervasive efforts to network, identify, and highlight mitigation activities and opportunities at all levels of government, through the monitoring of agendas, attendance at meetings, and distribution of memos. This collaborative effort is also important in the monitoring of funding opportunities that can be leveraged to implement the mitigation actions.
Based on the comprehensive nature of the LHMP, the LHMP Planning Team believes that this document will be highly useful when updating existing and developing new planning mechanisms in the City. Specific documents that have been identified for incorporating elements of the LHMP include:
• Building/Development Codes and Ordinances: The 2023 LHMP will provide information to enable the City to make decisions on appropriate building/development codes and ordinances. Appropriate building codes and ordinances can increase Healdsburg’s resilience following natural disasters.
• Emergency Operation Plan: The 2023 LHMP will provide information on risk and vulnerability that will be extremely important to consider and incorporate into the City’s emergency management plans including the Emergency Operations Plan. Probability and vulnerability can direct emergency management and response efforts and can influence public outreach efforts around emergency preparedness.
• General Plan: The 2023 LHMP will provide information that can be incorporated into the Land Use and the Safety sections of the plan during the next General Plan update. Specific risk and vulnerability information from the LHMP can help to identify areas where development should not take place.
• CWPP: The 2023 LHMP highlights wildfire areas of concern in the city. Suitable mitigation actions contained in the LHMP can be included in future updates of the City of Healdsburg CWPP and the Fitch Mountain CWPP.
• Capital Improvement Plan (CIP): Projects identified in the 2023 LHMP can be included in the annual CIP.
Section 8 Plan Implementation and Maintenance City of Healdsburg 2023 LHMP 8-3
8.4 Continued Public Involvement
As occurred during the development of the 2023 LHMP, the LHMP Planning Team will involve the public during the monitoring, evaluating and updating processes. A downloadable copy of the 2023 LHMP and any proposed changes or updates will be posted on the City’s website, and a point of contact will be provided to which people can direct their comments or concerns. Following the annual monitoring/evaluating meeting, a summary of the meeting will be posted to the City’s website for public viewing.
As noted above, the LHMP Planning Team will continue to oversee implementation, examine the annual review questionnaires and project progress reports, modify the implementation strategy and process as needed, and update the LHMP as required. The LHMP Planning Team will also look for opportunities to raise community awareness about the 2023 LHMP and the hazards that affect the city. This effort could include attendance and provision of materials at City-sponsored events, public mailings, and social media posts (such as Facebook, Twitter, and Nextdoor). Per the responses from the Hazard Questionnaire, the preferred methods for the public to receive information are City Manager’s Biweekly Update, City’s website, social media, and utility bills. Any public comments received regarding the 2023 LHMP will be collected by the LHMP Planning Team, addressed as needed, and considered during future LHMP updates.
8-4 City of Healdsburg 2023 LHMP
Section 8 Plan Implementation and Maintenance
Section 9. References
ABAG (Association of Bay Area Governments). 2022. “Final Regional Housing Needs Allocation (RHNA) Plan, San Francisco Bay Area 2023-2031.” Final RHNA Methodology Report 20232031_update_11-22.pdf (ca.gov)https://abag.ca.gov/files/ABAG_Final_RHNA_Publication.pdf
ABAG (Association of Bay Area Governments). 2017. San Francisco Bay Area Risk Profile 2017. http://resilience.abag.ca.gov/wpcontent/documents/mitigation_adaptation/RiskProfile_4_26_2017_optimized.pdf
Avants, Maggie. 2017. “Healdsburg Issues Fire Evacuation Advisory.” Patch.
https://patch.com/california/healdsburg/healdsburg-issues-fire-evacuation-advisory.
Benefits.gov. 2023. “National Flood Insurance Program (NFIP).” https://www.benefits.gov/benefit/435.
Branum, D., Chen, R., Petersen, M. and Wills, C. 2016. “Earthquake Shaking Potential for California.” CGS (California Geological Survey), USGS.
https://www.conservation.ca.gov/cgs/Documents/Publications/Map-Sheets/MS_048.pdf.
Cal OES (California Office of Emergency Services). 2018. “California State Hazard Mitigation Plan.” Hazard Mitigation Planning | California Governor's Office of Emergency Services.
CalFire. 2023. “Incidents.” https://www.fire.ca.gov/incidents.
California Drought Action. 2023. “State Drought Response.” https://drought.ca.gov/state-droughtresponse/#:~:text=On%20April%2021%2C%202021%2C%20Governor%20Newsom%20proclaime d%20a,Russian%20River%20Watershed%20of%20Sonoma%20and%20Mendocino%20counties.
Callahan, Mary. 2016. “Sonoma County vineyard manager fined for landslide near Dry Creek.” The Press Democrat.http://www.pressdemocrat.com/news/5175098-181/sonoma-county-vineyardmanager-fined?sba=AAS
CNRA and Cal OES (California Natural Resources Agency and California Office of Emergency Services). 2020. California Climate Adaptation Planning Guide. https://www.caloes.ca.gov/wpcontent/uploads/Hazard-Mitigation/Documents/CA-Adaptation-Planning-Guide-FINAL-June2020-Accessible.pdf
Dettinger, M. 2011. ‘‘Climate Change, Atmospheric Rivers, and Floods in California A Multimodal Analysis of Storm Frequency and Magnitude Changes.’’ Journal of the American Water Resources Association 47 (3).
DOC (California Department of Conservation). 2023. “California 1998 Landslide Response Inventory.” https://www.conservation.ca.gov/cgs/documents/landslides/landslide-response-inventory1998-a11y.pdf.
Section 9 References City of Healdsburg 2023 LHMP 9-1
References
Eyler, PHD, Robert. 2018. "Healdsburg's Economy: Context and Balance." Economic Forensics & Analytics. https://www.ci.healdsburg.ca.us/DocumentCenter/View/8403/Eyler-Healdsburg0319182 revised.
FEMA (Federal Emergency Management Agency). 2023. Create a Hazard Mitigation Plan. https://www.fema.gov/emergency-managers/risk-management/hazard-mitigationplanning/create-hazard-plan.
Godt, Jonathan W. 1999. “Maps showing locations of damaging landslides caused by El Niño rainstorms, winter season 1997-98, San Francisco Bay region, California.” USGS.
https://pubs.usgs.gov/mf/1999/mf-2325/.
Healdsburg, City of. 2009. Healdsburg 2030 General Plan.
https://www.ci.healdsburg.ca.us/354/General-Plan.
Healdsburg, City of. 2013. “City Council/Redevelopment Successor Agency (RSA) Regular Meeting Agenda October 7, 2013.”
http://www.ci.healdsburg.ca.us/AgendaCenter/ViewFile/Agenda/10072013-388?packet=true.
Healdsburg, City of. 2015. Water Quality Report.
https://www.ci.healdsburg.ca.us/DocumentCenter/View/6435/2015-Water-Quality-Report
Healdsburg, City of. 2017. Foss Creek Flood Control Study.
Healdsburg, City of. 2018. “Demographics.”
https://www.ci.healdsburg.ca.us/408/Demographics
Healdsburg Museum & Historical Society. 2018. “Healdsburg History.”
https://www.healdsburgmuseum.org/healdsburg-history/
Holley, Ray. 2018. “ANALYSIS: Survey says … life is good.” The Healdsburg Tribune.
https://www.healdsburgtribune.com/analysis-survey-says-life-is-good/.
Huffman, M.E., Armstrong, C.F., 1980. Geology for Planning in Sonoma County. California Geological Survey. https://archive.org/details/geologyforplanni120huff/page/14/mode/2up.
IFT (Independent Forensic Team). 2018. Independent Forensic Team Report, Orville Dam Spillway Incident.
https://damsafety.org/sites/default/files/files/Independent%20Forensic%20Team%20Report%2 0Final%2001-05-18.pdf.
MTC (Metropolitan Transportation Commission) and ABAG. 2019. Plan Bay Area 2040, Final Plan. http://2040.planbayarea.org/files/2020-02/Final_Plan_Bay_Area_2040.pdf
National Institute of Building Science. 2019. Natural Hazard Mitigation Saves: 2019 Report. Natural Hazard Mitigation Saves: 2019 Report | National Institute of Building Sciences (nibs.org)
9
Section
9-2 City of Healdsburg 2023 LHMP
NOAA (National Oceanic and Atmospheric Administration). 2023. “Storm Events Database.”
https://www.ncdc.noaa.gov/stormevents/
NOAA. 2009. “Glossary.” https://w1.weather.gov/glossary/
Oskin, M, et al. 2014. Relationship of Channel steepness to channel incision rate from a titled and progressively exposed unconformity surface. Journal of Geophysical Research.
Plan Bay Area.2018. “Frequently Asked Questions.” https://www.planbayarea.org/2040-plan/quickfacts/faq-page#n3126
Ramsey, David W. and Godt, Jonathan W. 1999. “Map Showing Locations of Damaging Landslides in Sonoma County, California, Resulting From 1997-98 El Niño Rainstorms.” USGS.
https://pubs.usgs.gov/mf/1999/mf-2325-f/.
RRWA (Russian River Watershed Association). 2018. Storm Water Resources Plan.
http://www.rrwatershed.org/project/stormwater-resource-plan
Santa Rosa, City of. 2016. City of Santa Rosa Local Hazard Mitigation Plan.
Sonoma County. 2021. 2021 Sonoma County Multi-Jurisdictional Hazard Mitigation Plan
https://permitsonoma.org/longrangeplans/adoptedlong-rangeplans/hazardmitigation.
Sonoma LAFCO (Local Agency Formation Commission). 2006. City of Healdsburg Municipal Service Review.
https://sonomalafco.org/Microsites/Local%20Agency%20Formation%20Commission/Document s/Pre-2022/Reports/Final_Municipal-Service-Reviews_healdsburg.pdf.
US Census Bureau. 2023. “US Quick Facts.” https://www.census.gov/quickfacts/US?.
US Department of Agriculture (USDA). 2023. “What is a Community Wildfire Protection Plan?”
https://ask.usda.gov/s/article/What-is-a-Community-Wildfire-Protection-Plan
US Drought Monitor. 2018. “Map Archive.” https://droughtmonitor.unl.edu/Maps/MapArchive.aspx.
USGS (United States Geological Society). 2023. ‘‘Moment Magnitude, Richter Scale.’’
https://www.usgs.gov/faqs/moment-magnitude-richter-scale-what-are-different-magnitudescales-and-why-are-there-so-many.
USGS. 2023. ‘‘Earthquake Lists, Maps, and Statistics.’’
https://earthquake.usgs.gov/earthquakes/search/
USGS. 2023a. “Magnitude/Intensity Comparison.”
https://www.nrc.gov/docs/ML1821/ML18214A882.pdf
USGS. 2023b. “Scenario Catalogs.” https://earthquake.usgs.gov/scenarios/catalog/.
Section 9 References City of Healdsburg 2023 LHMP 9-3
References
USGS. 2023c. “Search Earthquake Catalog.” https://earthquake.usgs.gov/earthquakes/search/.
USGS. 2023d. “Why are there so many earthquakes in the Geysers area in Northern California?”
https://www.usgs.gov/faqs/why-are-there-so-many-earthquakes-geysers-area-northerncalifornia?qt-news_science_products=0#qt-news_science_products.
WGCEP (Working Group on California Earthquake Probabilities). 2021. “The Third California Earthquake Rupture Forecast (UCERF3). http://www.wgcep.org/UCERF3
Section 9
9-4 City of Healdsburg 2023 LHMP
This page intentionally left blank
Appendix A Planning Process Documents
From: Kelsey Carreiro
Subject: Local Hazard Mitigation Plan 5-year Review
Date: Thursday, March 2, 2023 12:04:00 PM
Will you be on the LHMP Planning Team? (View/vote in browser)
Good afternoon,
Our Local Hazard Mitigation Plan (LHMP) is due for its 5-year review by January 2024. To begin this process, we need to establish a planning team to conduct the plan review process. The LHMP can be found at "S:\EOC\Published Plans\LHMP Final Signed January 2019.pdf" if you are unfamiliar with the plan. Please use the poll to answer if you will be on the Planning Team or if you need to delegate this duty to someone with the knowledge and authority to review and make decisions regarding the information within this plan. If you plan to delegate, please send me the name of the person you are delegating this responsibility to.
Here is a brief summary of each section of the plan:
Plan Sections
Section 1, Introduction, describes the background and purpose of the plan.
Section 2, Community Profile, describes the city’s history and general background of the community, historical trends for population and housing, and trends in land use and development.
Section 3, Planning Process, describes the 2018 LHMP planning process, as well as the meetings and outreach activities undertaken to engage the Planning Team members and the public.
Section 4, Hazard Assessment, identifies, describes, and prioritizes the hazards that threaten Healdsburg. This chapter discusses past events, risks of future events, and the effects of future conditions for each type of hazard.
Section 5, Vulnerability Assessment, describes the risks posed by each hazard type to city residents, particularly those who are more likely to be socially vulnerable, and to critical facilities.
Section 6, Capability Assessment, identifies and evaluates the legal and regulatory, human and technical, and financial resources available to accomplish mitigation.
Section 7, Mitigation Strategy, identifies mitigation goals, assesses the City’s capabilities to implement mitigation actions, and identifies and prioritizes mitigation actions.
Section 8, Plan Implementation and Maintenance, discusses plan adoption and implementation, as well as the process to monitor, evaluate, and update the plan.
Section 9, References Appendices
Appendix A, Planning Process Documents
Appendix B, Public Outreach
To: Andrew J Sturmfels; Raina Allan; Allison Mattioli; Matt Jenkins; Luis Rodriguez; Jason Boaz; Lance Macdonald; Larry Zimmer; Curt Bates; Terry Crowley; Clay Thistle; Mark Themig; Tyler Kettmann; Adam McKenna; Scott Duiven
Appendix C, Hazard and Vulnerability Figures
Appendix D, Plan Maintenance Forms
Appendix E, Adoption Resolution
Appendix F, FEMA Plan Review Tool
Thank you,
KELSEY CARREIRO | Emergency Manager
City of Healdsburg | Police Department
238 Center Street, Healdsburg, CA 95448
Office: (707) 431-3372 | Cell: (707) 955-6362
Healdsburg Emergency Management
City of Healdsburg
2023 Local Hazard Mitigation Plan Update
Meeting #1 Minutes
Meeting Time & Location:
Meeting #1 was held on March 27th, 2023, from 10:30am to 11:30am in the Emergency Operations Center at 238 Center Street in Healdsburg, CA.
Attendance:
Planning Team Member
Kelsey Carreiro
Allison Mattioli
Matt Jenkins
Title
Emergency Manager
Administrative Analyst II
Police Chief
Jason Boaz Fire Chief
Lance Macdonald
Andrew Sturmfels
Terry Crowley
Ellen McDowell
Tyler Kettmann
Fire Marshal
Assistant City Manager
Utility Director
Senior Planner
Central Services Manager
Curt Bates Principal Engineer
Adam McKenna
Meeting Agenda:
IT Manager
Introduction of the LHMP and the planning process
Timeline of the 2023 LHMP Update
LHMP documents, supporting plans, and additional resources
Community Outreach Strategy
Hazard Identification
Capabilities Assessment
Expectations and Assignments
Meeting Minutes:
The following PowerPoint slideshow was presented by Kelsey Carreiro to the LHMP Planning Team. The meeting was an open forum format to encourage participation and comments from all LHMP Planning Team members. Discussion points and comments are documented below each slide
1
2023 Local Hazard Mitigation Plan Update
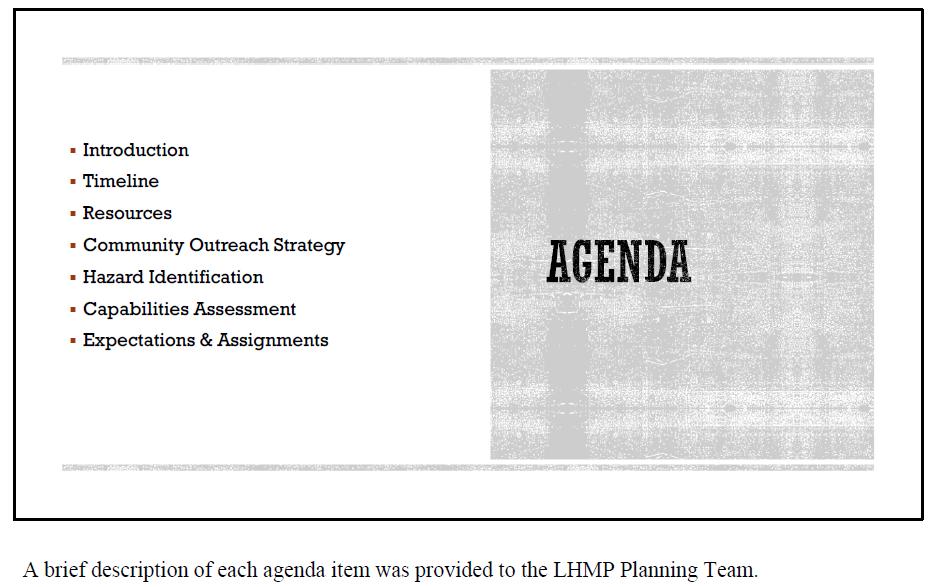
Meeting #1 Minutes
City of Healdsburg
2
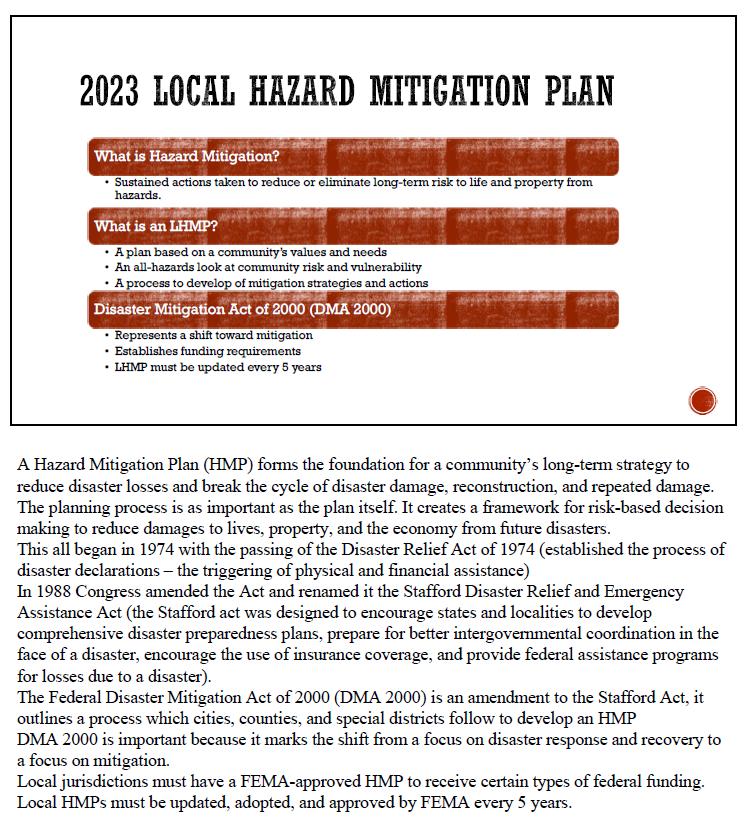
City of Healdsburg
3
2023 Local Hazard Mitigation Plan Update Meeting #1 Minutes
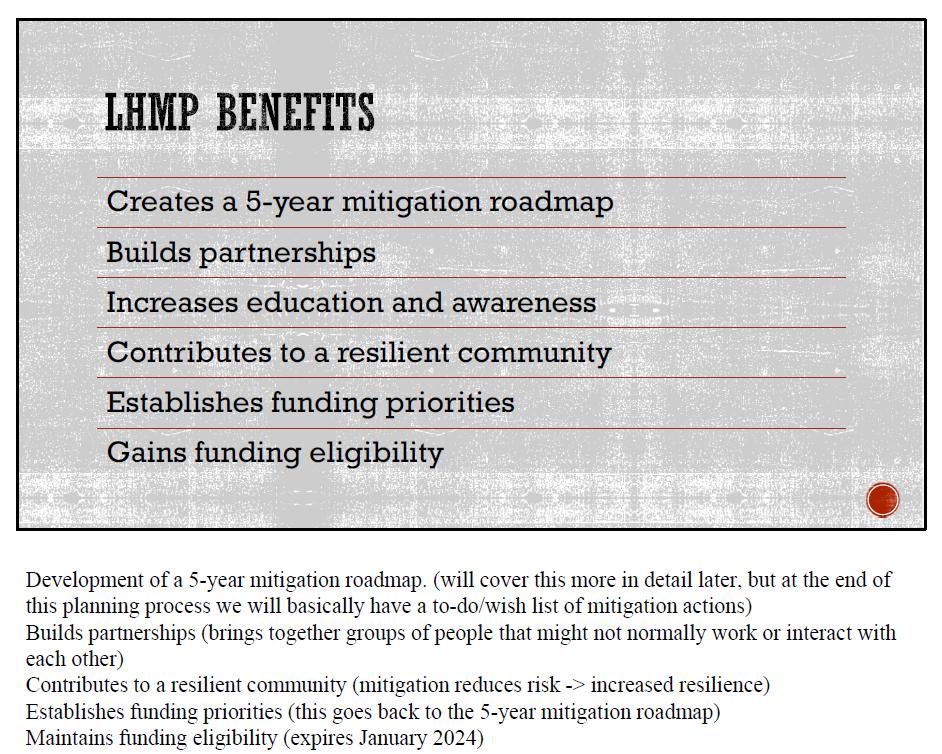
City
4
of Healdsburg 2023 Local Hazard Mitigation Plan Update Meeting #1 Minutes
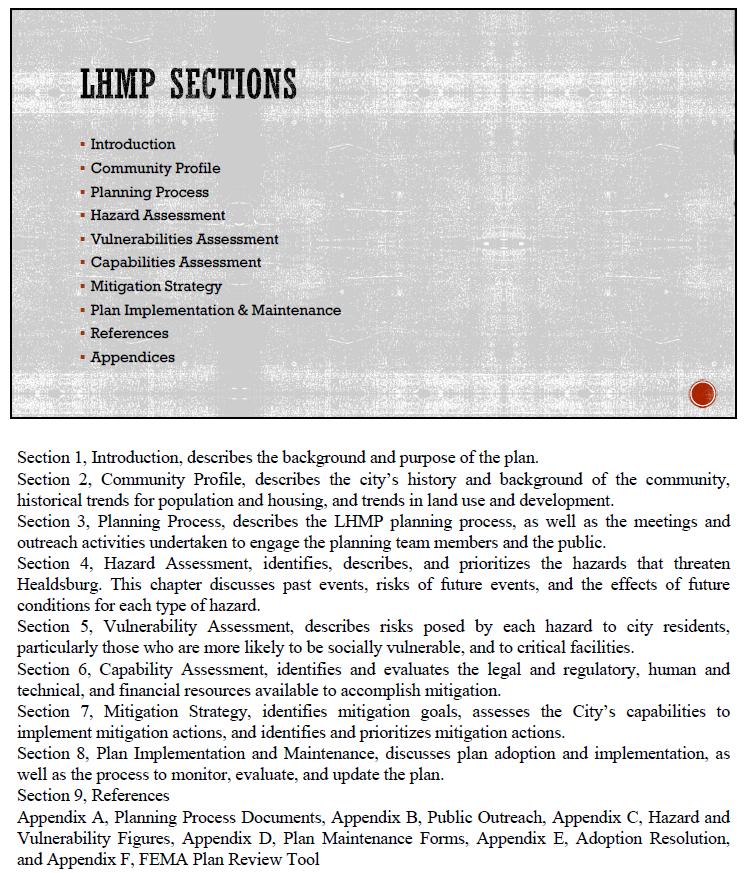
City
5
of Healdsburg 2023 Local Hazard Mitigation Plan Update Meeting #1 Minutes
2023 Local Hazard Mitigation Plan Update
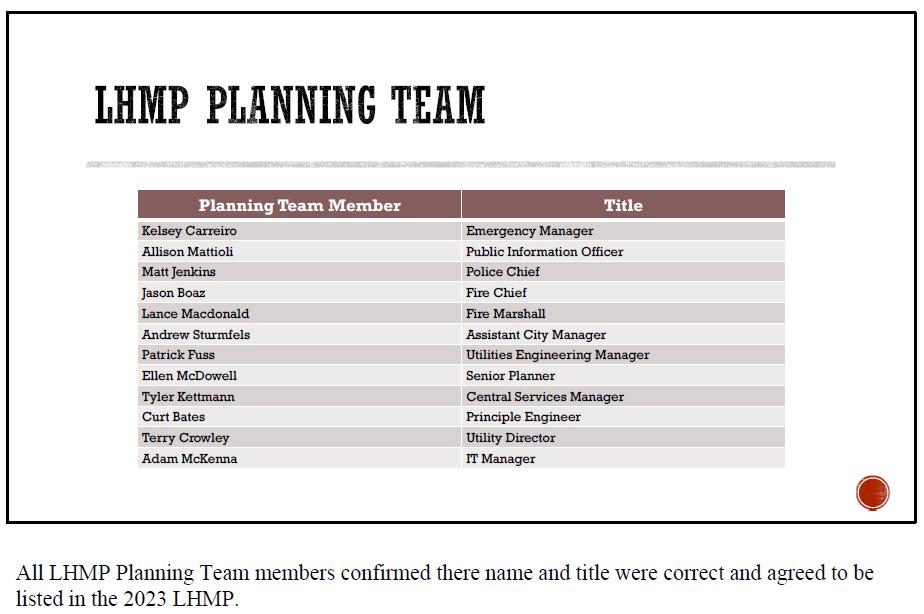
Meeting #1 Minutes
City of Healdsburg
6
2023 Local Hazard Mitigation Plan Update
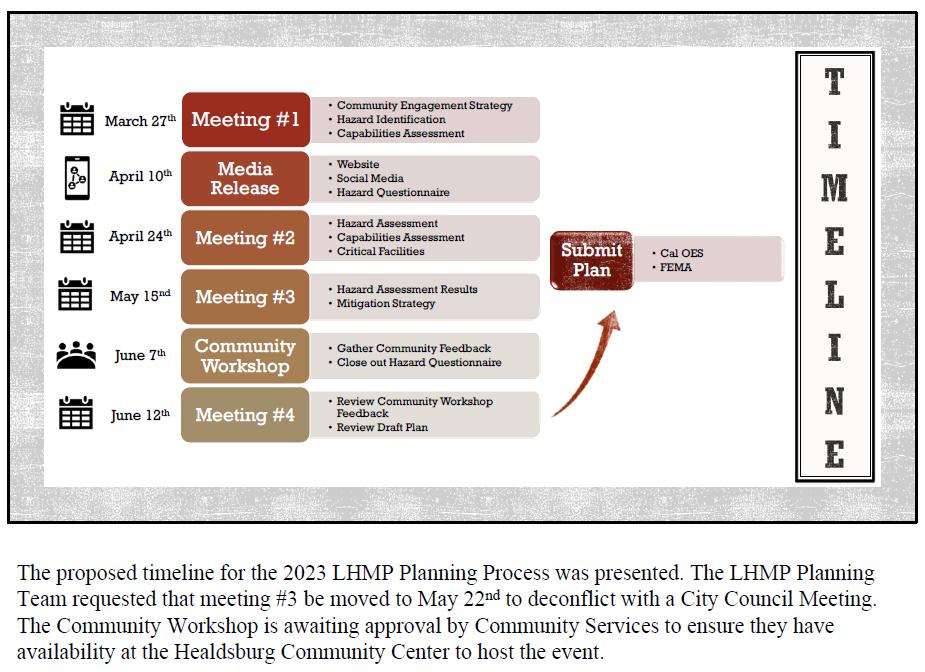
Meeting #1 Minutes
City of Healdsburg
7
2023 Local Hazard Mitigation Plan Update
Meeting #1 Minutes
City of Healdsburg
8
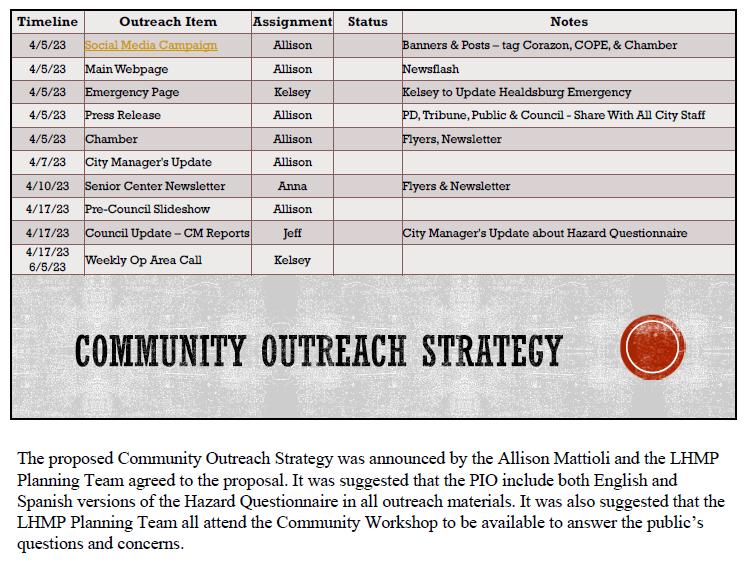
City of Healdsburg
9
2023 Local Hazard Mitigation Plan Update Meeting #1 Minutes
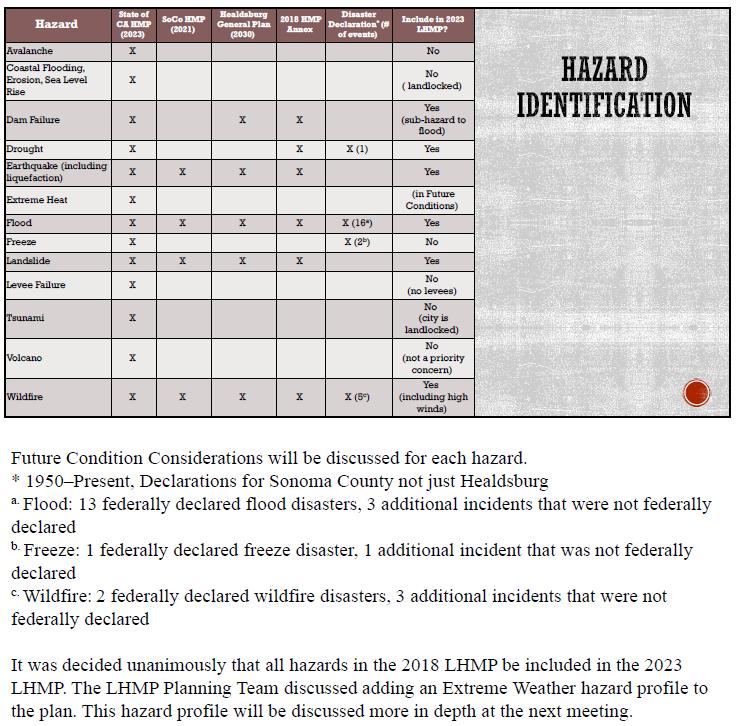
City of Healdsburg
10
2023 Local Hazard Mitigation Plan Update Meeting #1 Minutes
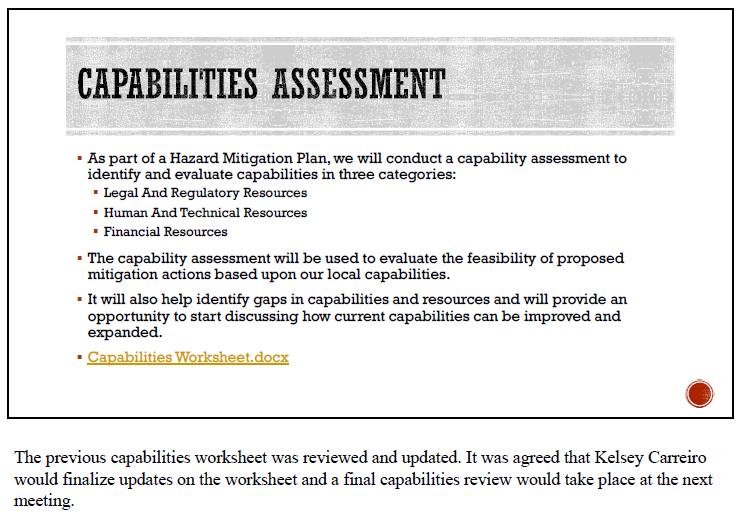
City of Healdsburg
11
2023 Local Hazard Mitigation Plan Update Meeting #1 Minutes
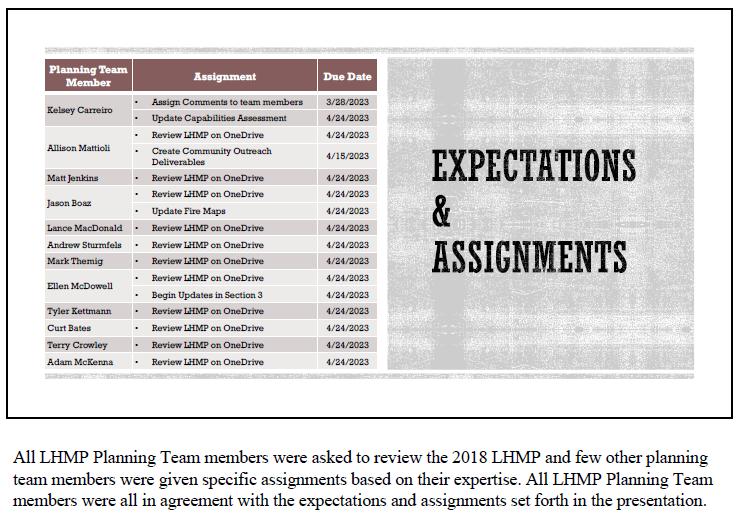
City of Healdsburg
12
2023 Local Hazard Mitigation Plan Update Meeting #1 Minutes
City of Healdsburg
13
2023 Local Hazard Mitigation Plan Update Meeting #1 Minutes
City of Healdsburg
2023 Local Hazard Mitigation Plan Update
Meeting #1 Minutes
Action Items:
All LHMP Planning team members will review the 2018 LHMP prior to meeting #2 on April 24th, 2023.
Kelsey Carreiro will add all comments and assignments into the “2023 LHMP Working Copy” by March 28th, 2023, at 4:00pm.
Kelsey Carreiro will complete Meeting #1 Minutes and send to the LHMP Planning Team for approval by March 30th, 2023, at 4:00pm.
Kelsey Carreiro will submit a Room Rental Request to Healdsburg Community Services by March 30th, 2023 at 4:00pm.
Kelsey Carreiro will provide verbiage to Allison Mattioli for all community outreach materials by April 3rd, 2023, at 4:00pm.
Allison Mattioli will create community outreach deliverables by April 5th, 2023, at 5:00pm.
Jason Boaz will provide updated Wildfire Hazard Maps to the LHMP Planning Team prior to meeting #2 on April 24th, 2023.
Ellen McDowell will begin updates on Section 2 of the “2023 LHMP Working Copy” prior to meeting #2 on April 24th, 2023.
Future Meetings Scheduled:
Meeting #2 will be held on April 24th, 2023, from 1:30pm to 3:00pm at the Emergency Operations Center at 238 Center St in Healdsburg, California.
Meeting #3 will be held on May 22nd, 2023, from 2:00pm to 3:30pm at the Emergency Operations Center at 238 Center St in Healdsburg, California.
Meeting #4 will be held on June 12th, 2023, from 1:00pm to 3:00pm at the Emergency Operations Center at 238 Center St in Healdsburg, California.
14
City of Healdsburg
2023 Local Hazard Mitigation Plan Update
Meeting #2 Minutes
Meeting Time & Location:
Meeting #2 was held on April 24th, 2023, from 1:30pm to 3:00pm in the Emergency Operations Center at 238 Center Street in Healdsburg, CA.
Attendance:
Planning Team Member
Kelsey Carreiro
Title
Emergency Manager
Matt Jenkins Police Chief
Andrew Sturmfels
Terry Crowley
Curt Bates
Allison Mattioli
Ellen McDowell
Tyler Kettman
Adam McKenna
Lance Macdonald
Meeting Agenda:
Assistant City Manager
Utility Director
Principle Engineer
Administrative Analyst II
Senior Planner
Central Services Manager
IT Manager
Fire Marshal
• Review final draft of the Capability Assessment
• Review Hazard Assessment
• Identify Critical Facilities
• Discuss Appendices
• Assignments
Meeting Minutes:
The following PowerPoint slideshow was presented by Kelsey Carreiro to the LHMP Planning Team. The meeting was an open forum format to encourage participation and comments from all LHMP Planning Team members. Discussion points and comments are documented below each slide.
1
2023 Local Hazard Mitigation Plan Update
Meeting #2 Minutes
City of Healdsburg
2023 Local Hazard Mitigation Plan Update
Meeting #2 Minutes
City of Healdsburg
3
2023 Local Hazard Mitigation Plan Update
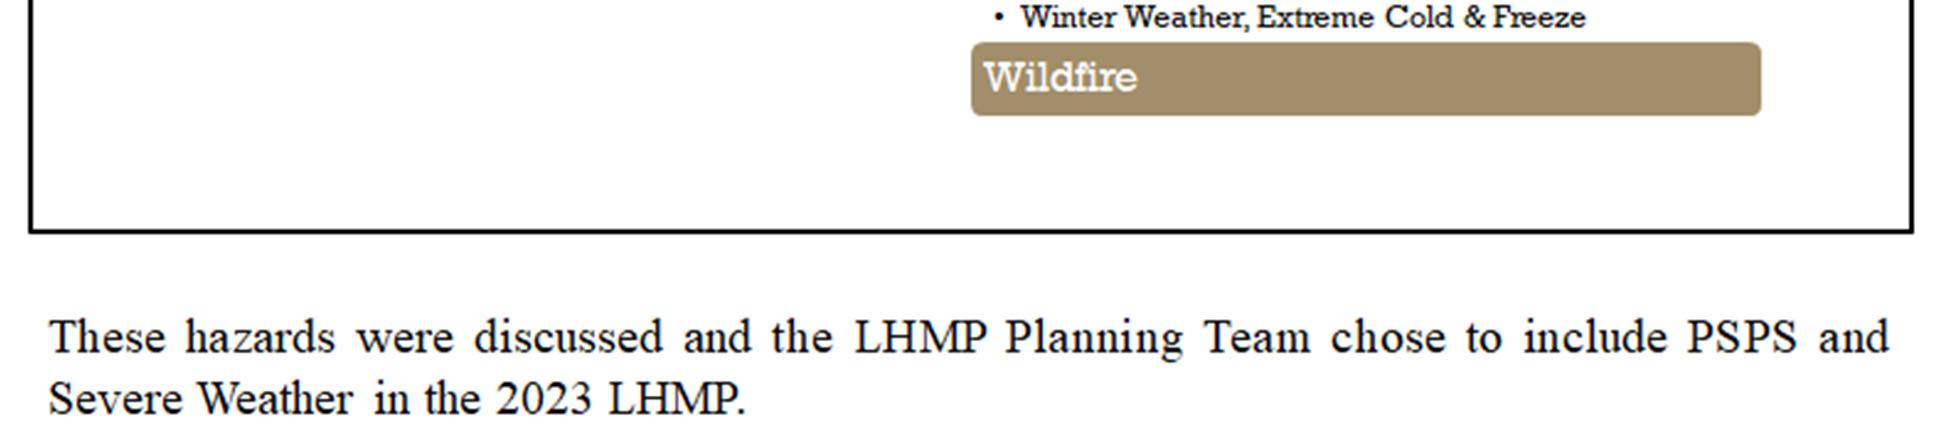
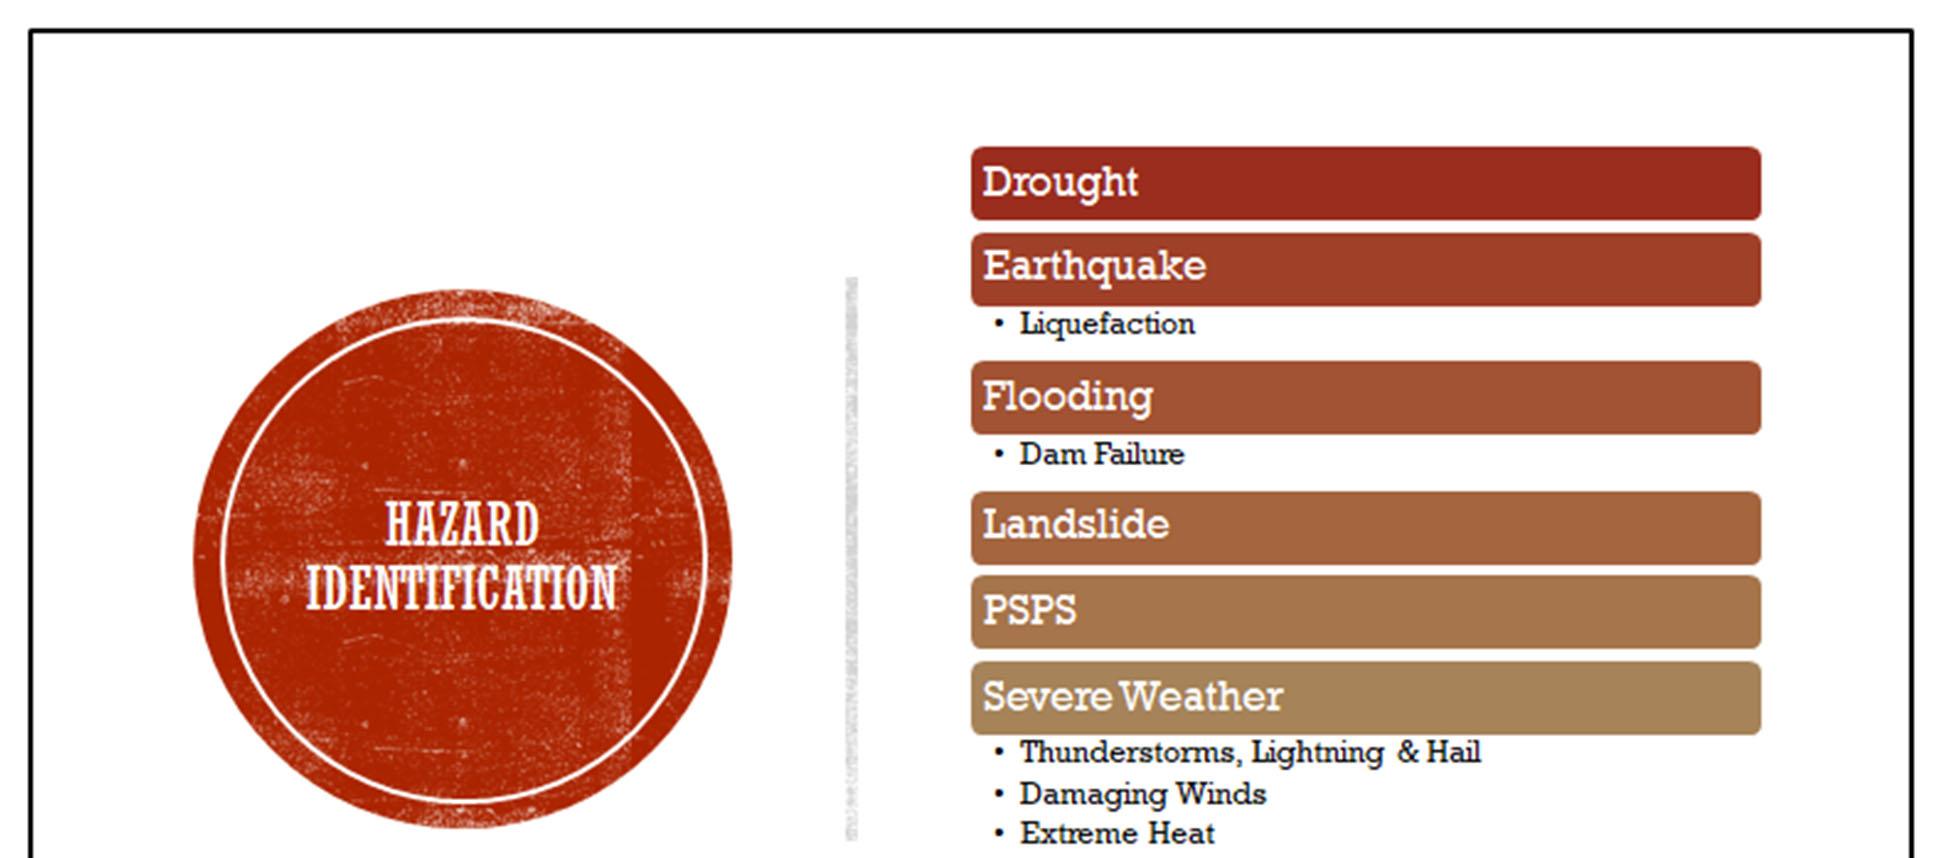
Meeting #2 Minutes
City of Healdsburg
4
2023 Local Hazard Mitigation Plan Update
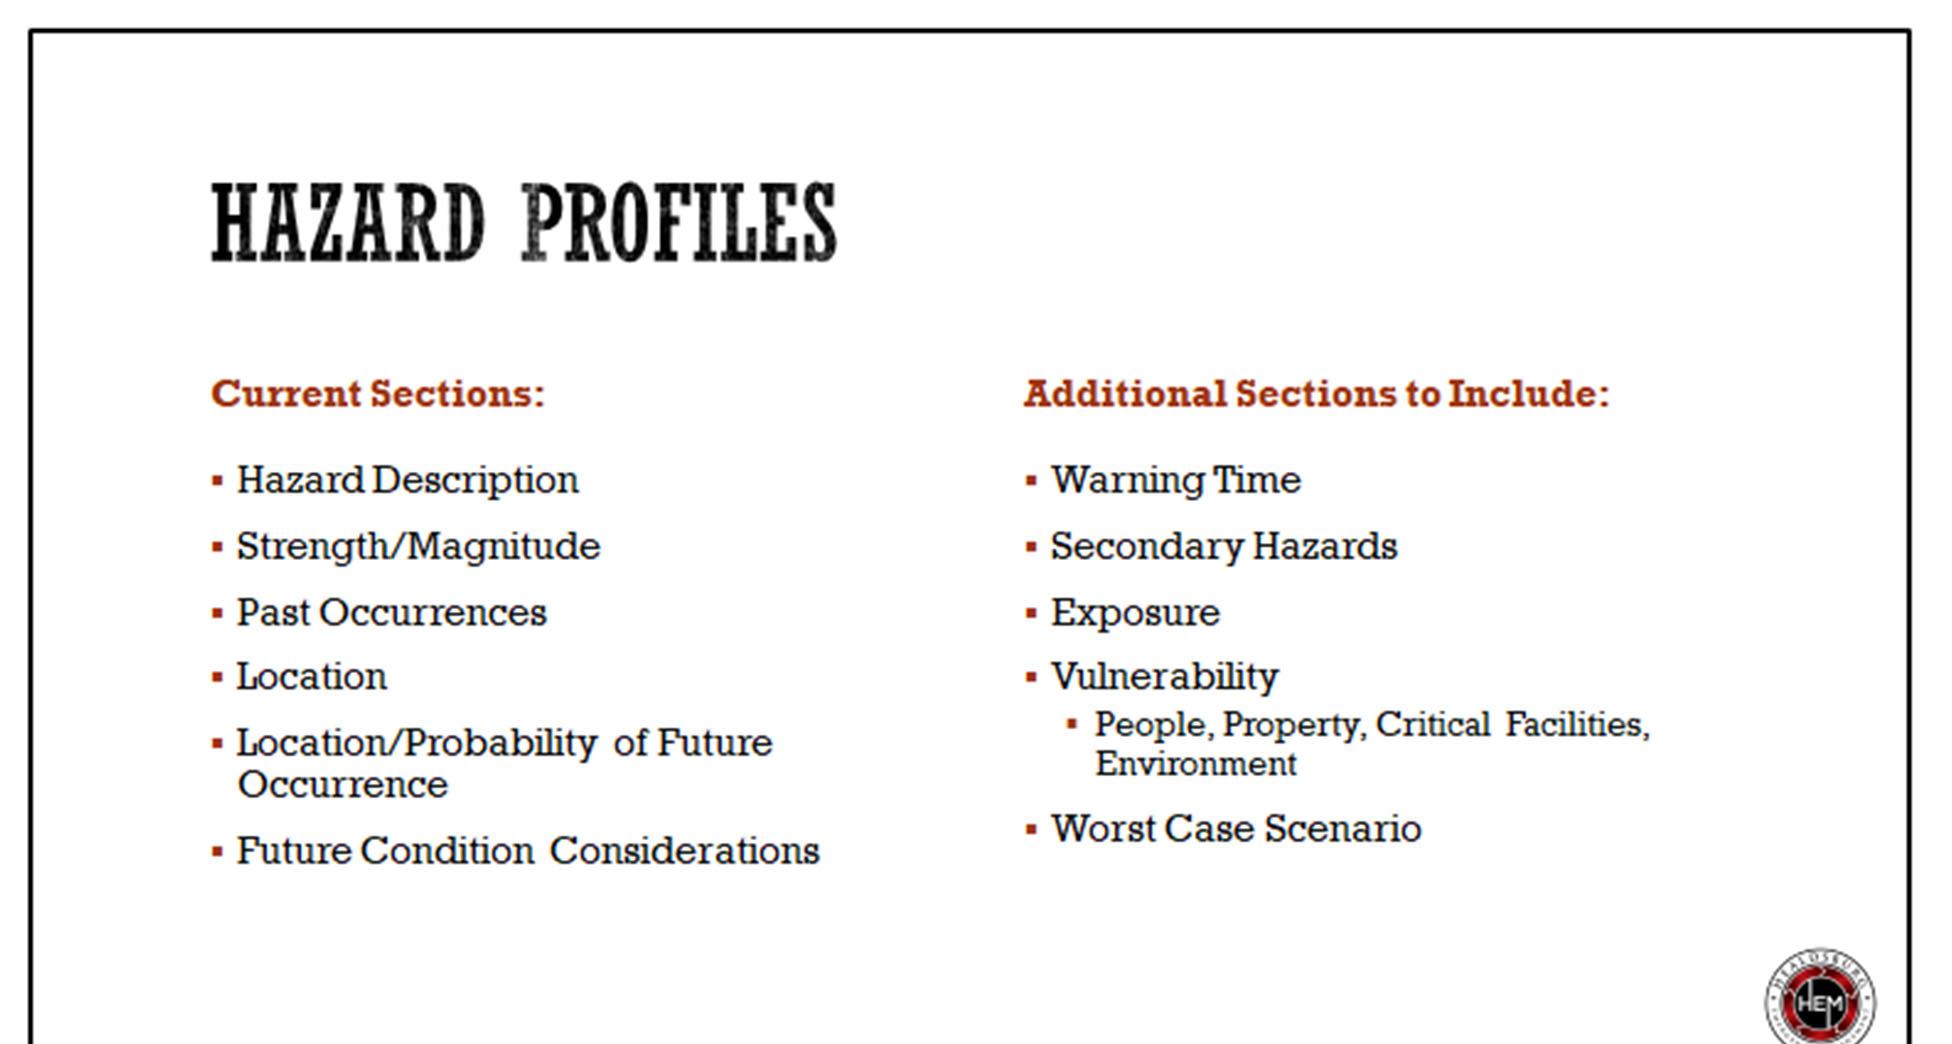
Meeting #2 Minutes
City of Healdsburg
5
2023 Local Hazard Mitigation Plan Update
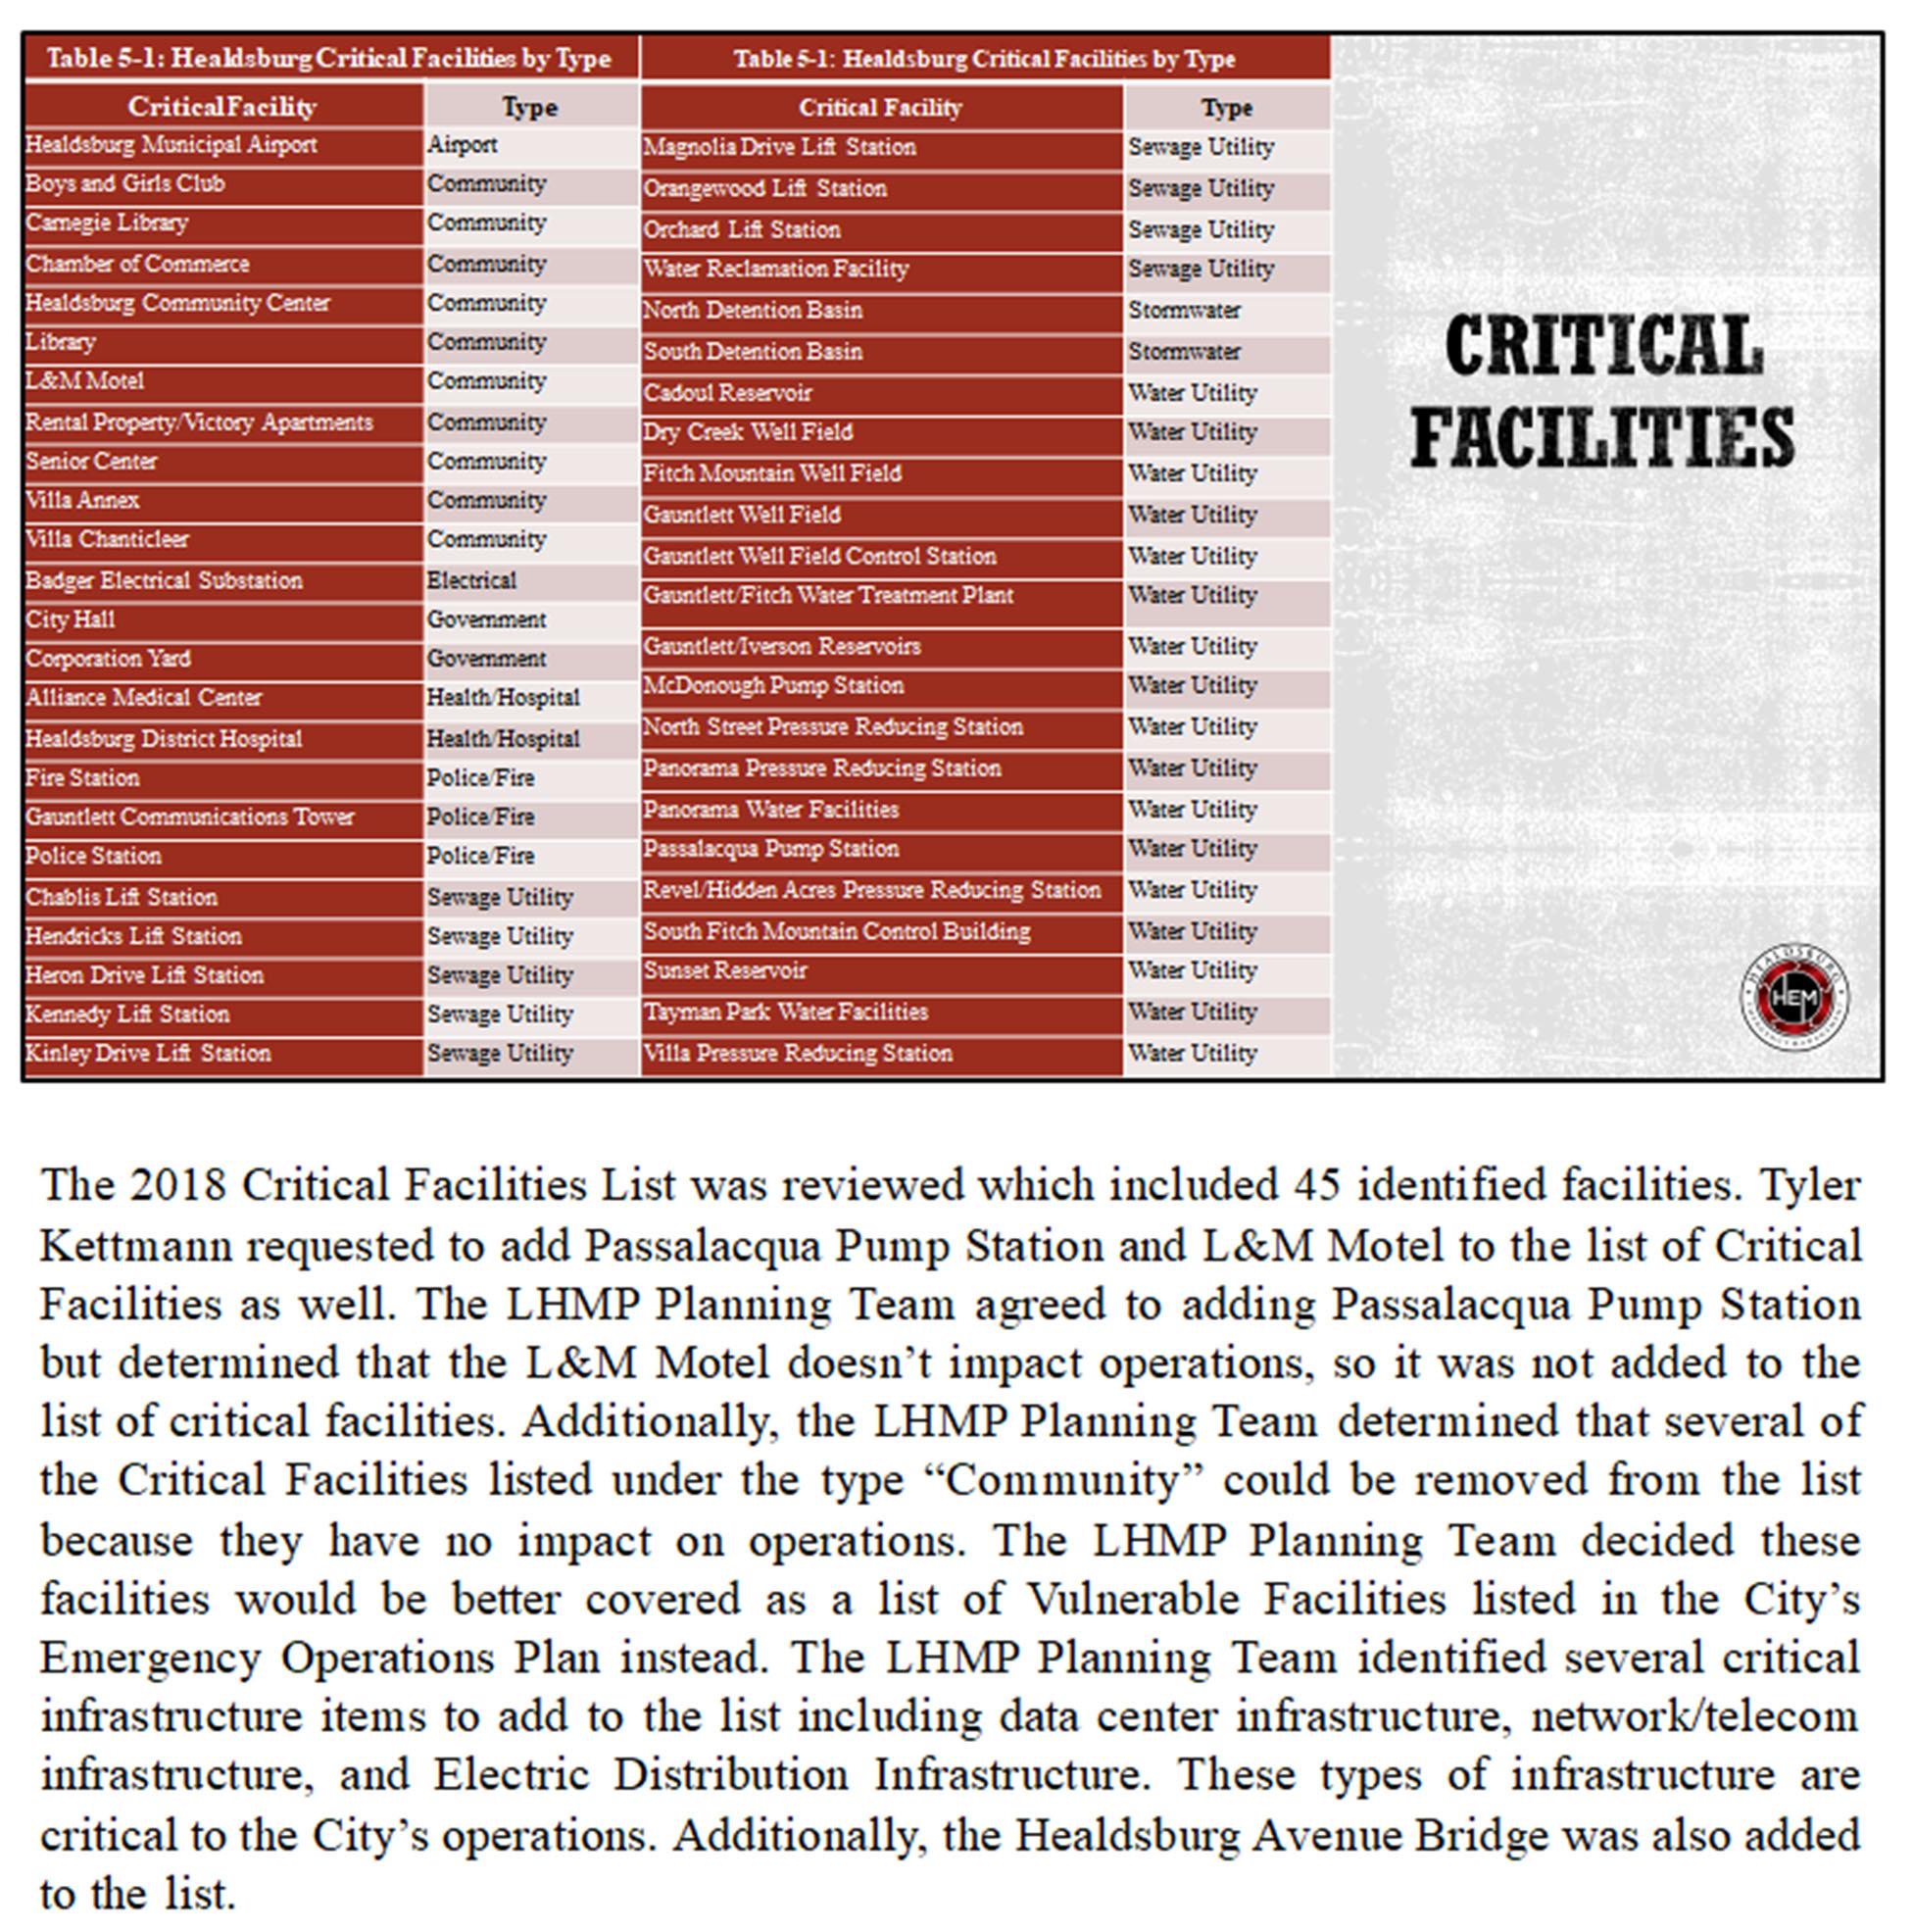
Meeting #2 Minutes
City of Healdsburg
6
2023 Local Hazard Mitigation Plan Update
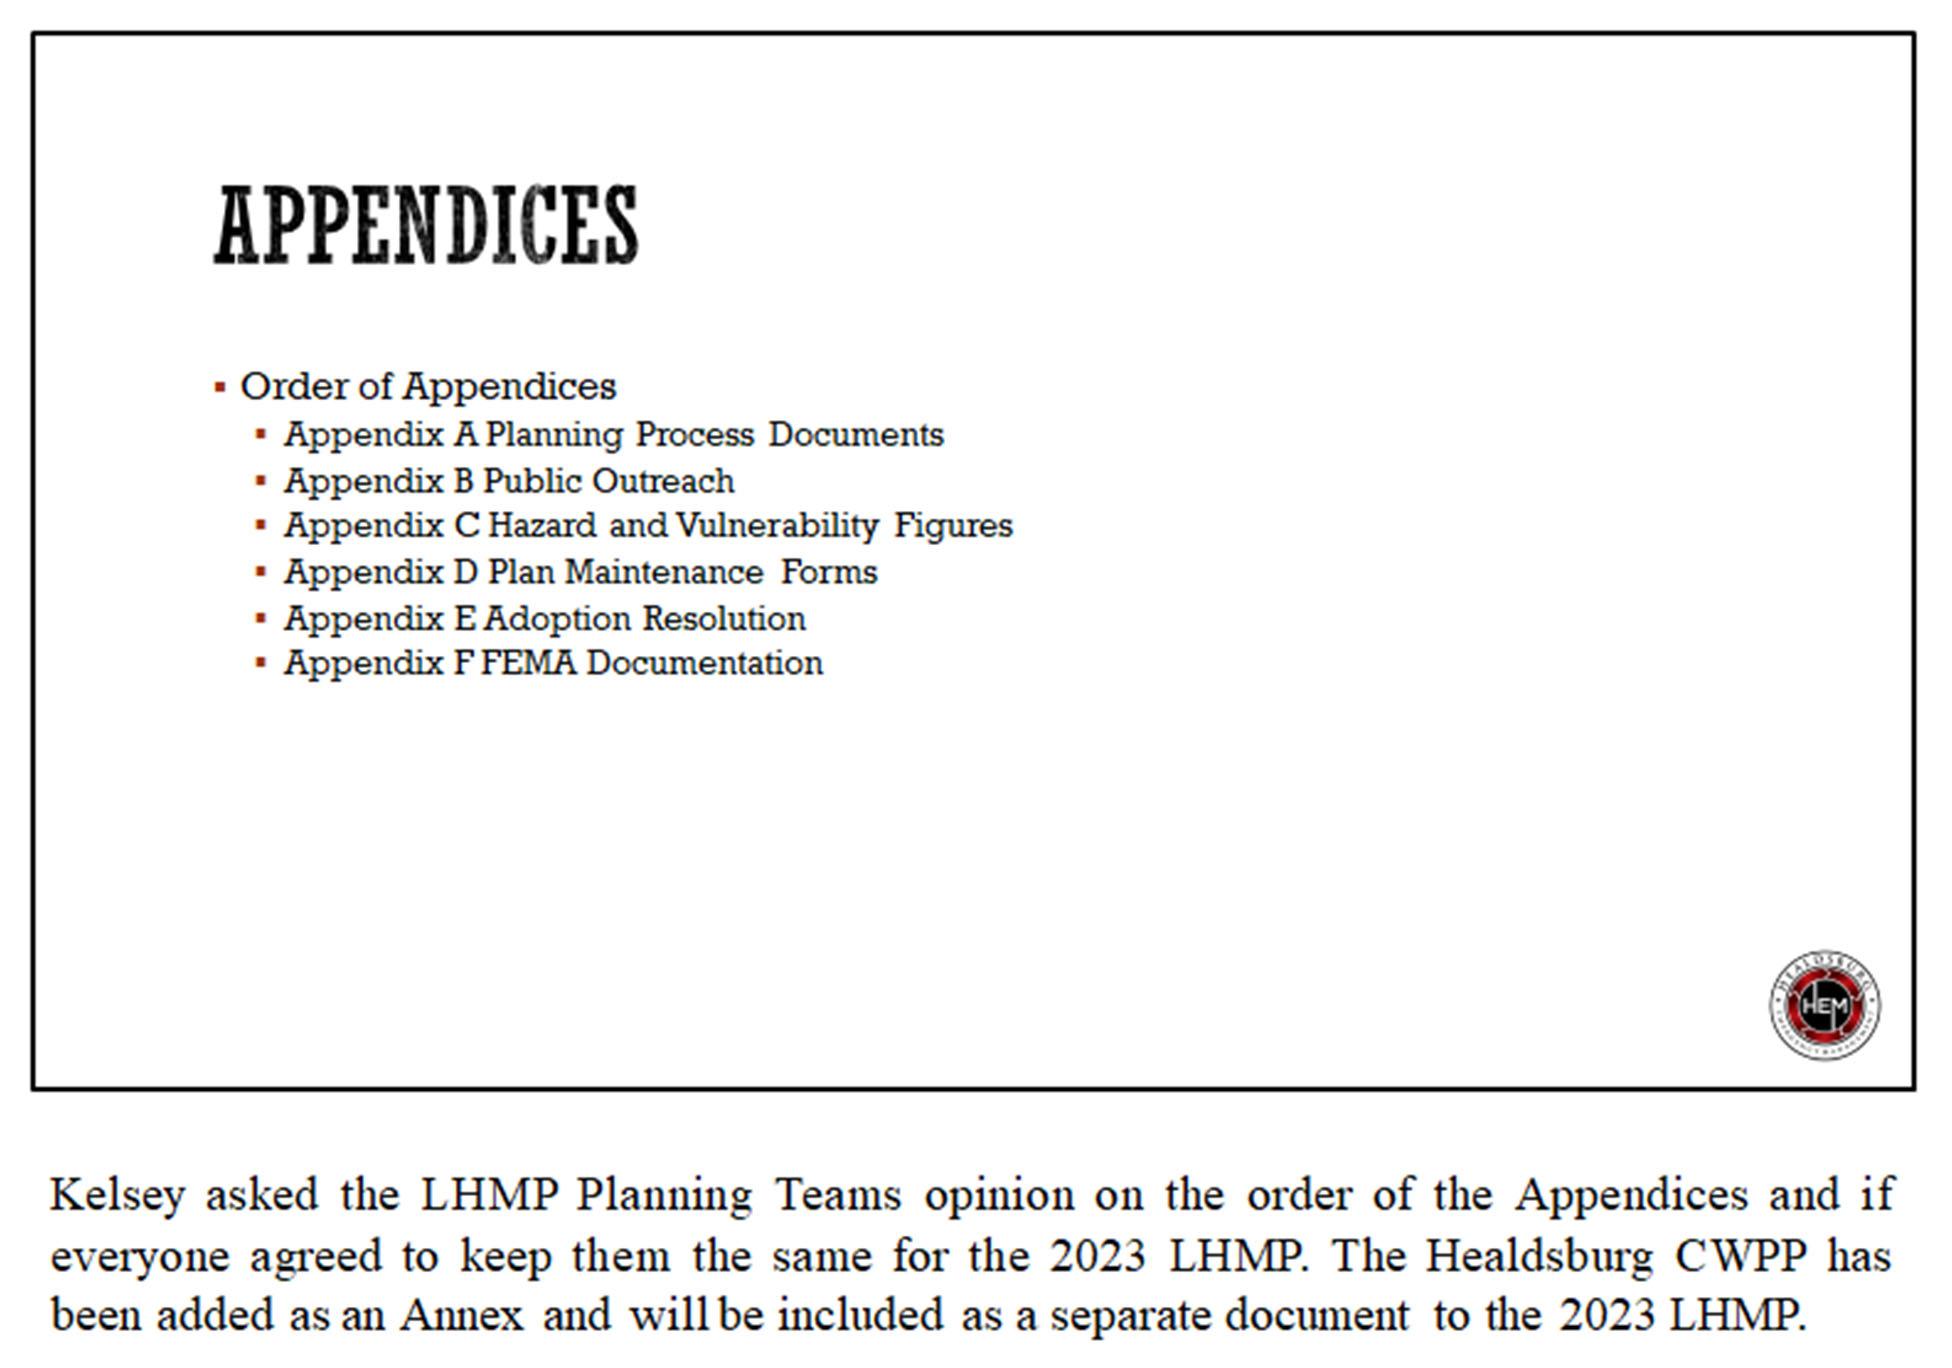
Meeting #2 Minutes
City of Healdsburg
7
2023 Local Hazard Mitigation Plan Update
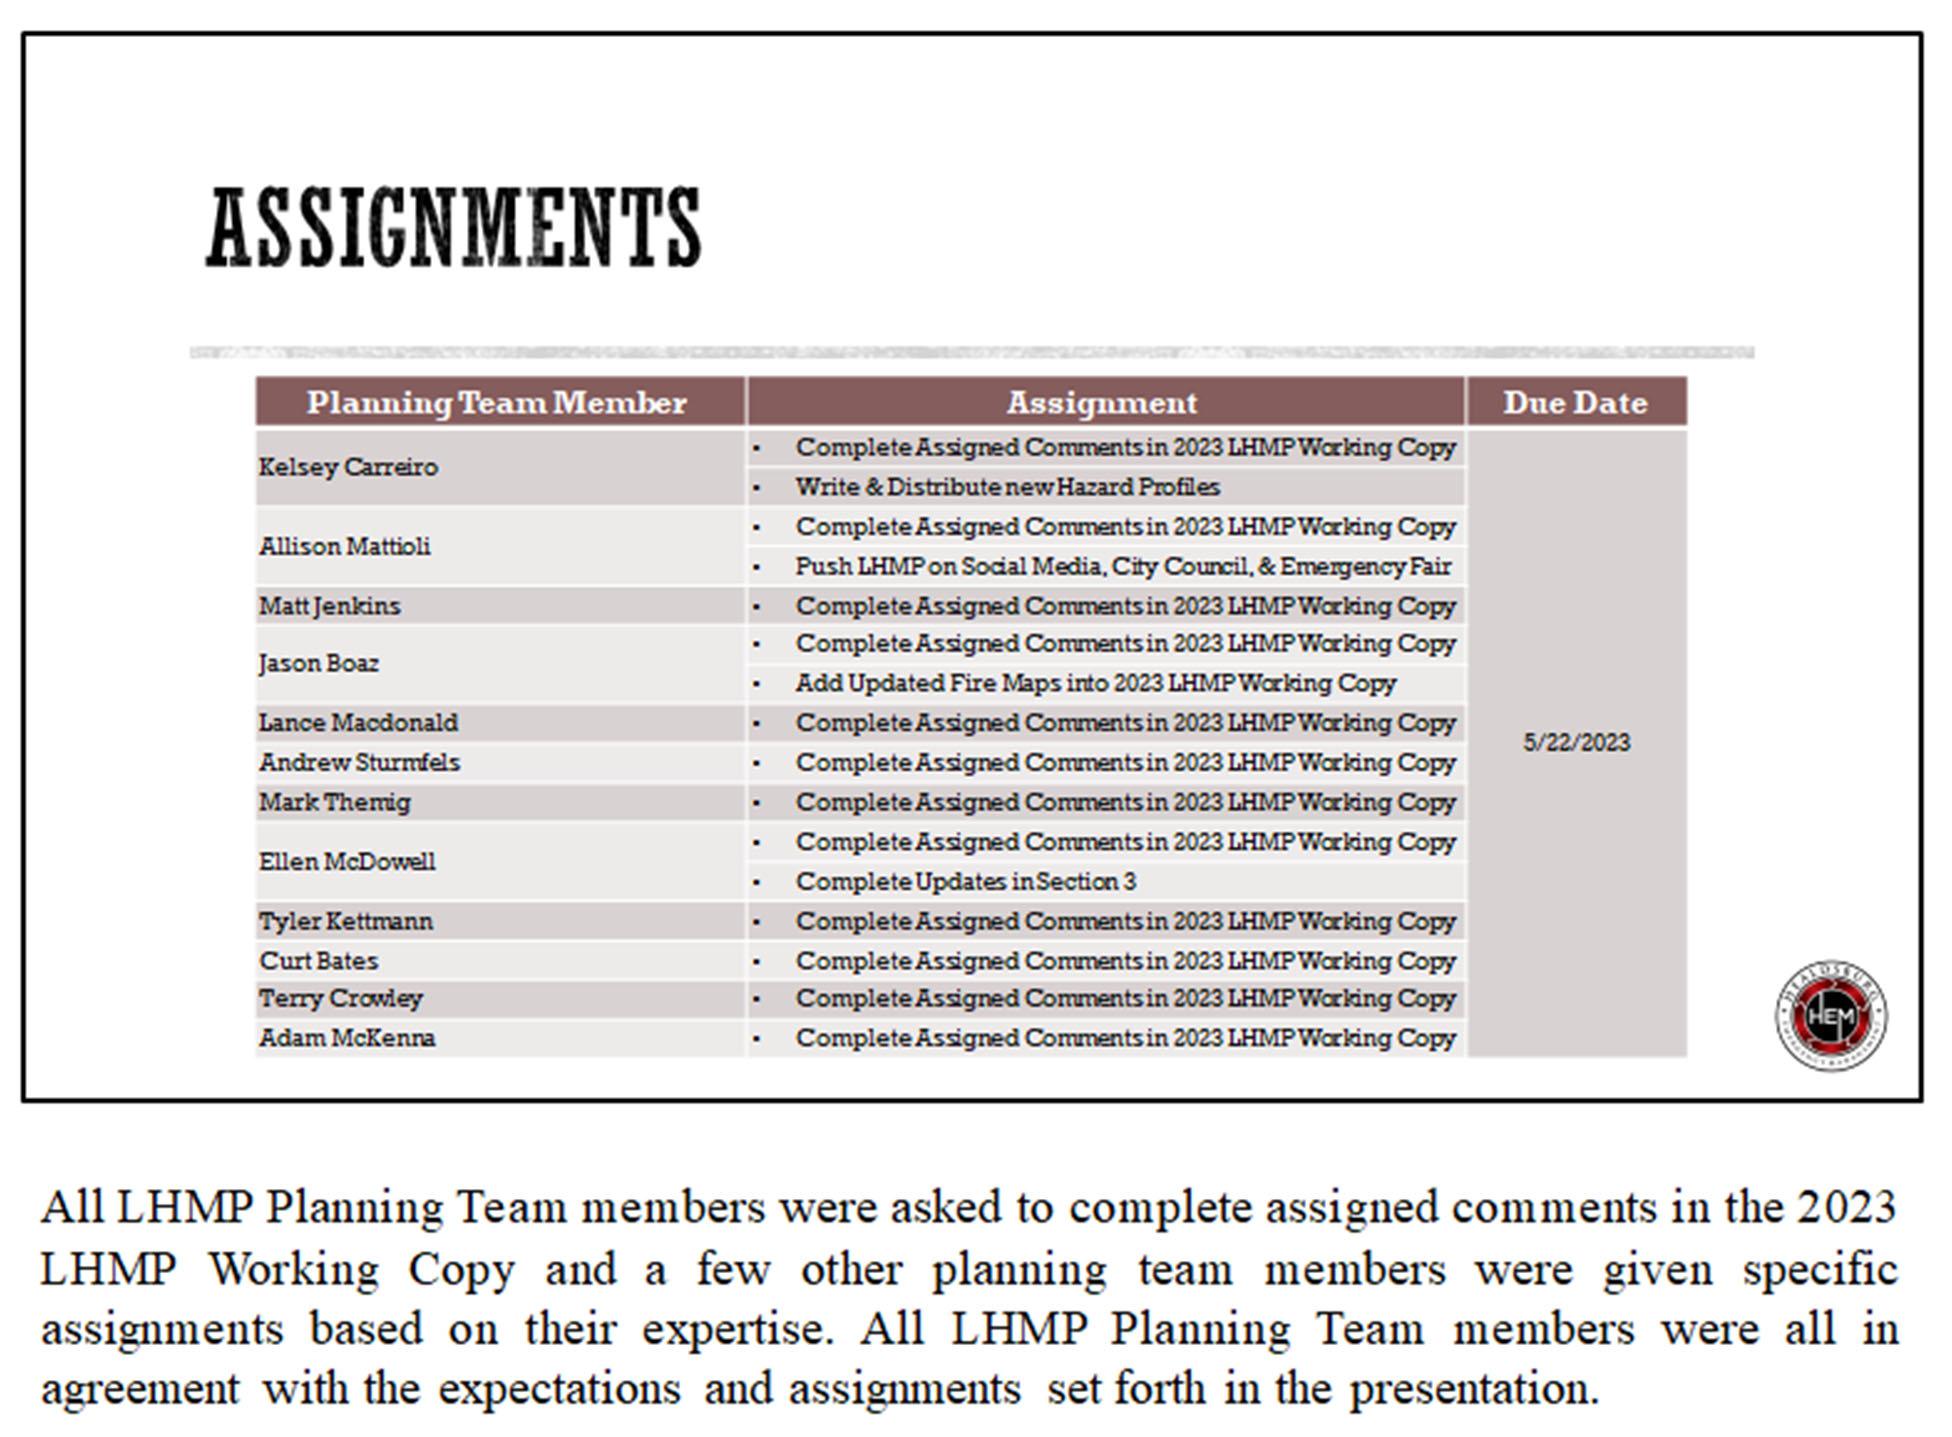
Meeting #2 Minutes
City of Healdsburg
8
2023 Local Hazard Mitigation Plan Update

Meeting #2 Minutes

City of Healdsburg
9
City of Healdsburg
2023 Local Hazard Mitigation Plan Update
Meeting #2 Minutes
Action Items:
All LHMP Planning team members will complete all assigned comments in the “2023 LHMP Working Copy” prior to meeting #3 on May 22nd, 2023.
Kelsey Carreiro will complete Meeting #2 Minutes and send to the LHMP Planning Team for approval by May 30th, 2023, at 4:00pm.
Kelsey Carreiro will write hazard profiles for PSPS and Severe Weather for LHMP Planning Team review by meeting #3 on May 22nd, 2023.
Kelsey Carreiro will attend the upcoming Emergency Preparedness Expo in Healdsburg on May 6th, 2023, to advertise the LHMP Update including the Hazard Survey and Community Workshop.
Allison Mattioli will continue social media outreach biweekly for the LHMP Update.
Lance Macdonald will update the Wildfire hazard profile meeting #3 on May 22nd, 2023.
Ellen McDowell will finish updates on Section 2 of the “2023 LHMP Working Copy” prior to meeting #3 on May 22nd, 2023.
Future Meetings Scheduled:
Meeting #3 will be held on May 22nd, 2023, from 2:00pm to 3:30pm at the Emergency Operations Center at 238 Center St in Healdsburg, California.
Meeting #4 will be held on June 12th, 2023, from 1:00pm to 3:00pm at the Emergency Operations Center at 238 Center St in Healdsburg, California.
10
City of Healdsburg
2023 Local Hazard Mitigation Plan Update
Meeting #3 Minutes
Meeting Time & Location:
Meeting #3 was held on May 22nd, 2023, from 2:00pm to 3:30pm in the Emergency Operations Center at 238 Center Street in Healdsburg, CA.
Attendance:
Planning Team Member
Kelsey Carreiro
Matt Jenkins
Terry Crowley
Curt Bates
Allison Mattioli
Ellen McDowell
Tyler Kettman
Adam McKenna
Lance Macdonald
Meeting Agenda:
• LHMP Status Update
• Hazard Profiles
• Mitigation Goal
• 2018 Mitigation Action Plan
• Potential Mitigation Actions
• 2023 Mitigation Action Plan
• Community Workshop
• Assignments
Meeting Minutes:
Emergency Manager
Police Chief
Utility Director
Principle Engineer
Title
Administrative Analyst II
Senior Planner
Central Services Manager
IT Manager
Fire Marshal
The following PowerPoint slideshow was presented by Kelsey Carreiro to the LHMP Planning Team. The meeting was an open forum format to encourage participation and comments from all LHMP Planning Team members. Discussion points and comments are documented below each slide.
1
2023 Local Hazard Mitigation Plan Update
Meeting #3 Minutes
City of Healdsburg
2
2023 Local Hazard Mitigation Plan Update
Meeting #3 Minutes
City of Healdsburg
3
2023 Local Hazard Mitigation Plan Update
Meeting #3 Minutes
City of Healdsburg
4
2023 Local Hazard Mitigation Plan Update
Meeting #3 Minutes
City of Healdsburg
5
2023 Local Hazard Mitigation Plan Update
Meeting #3 Minutes
City of Healdsburg
6
Meeting #3 Minutes
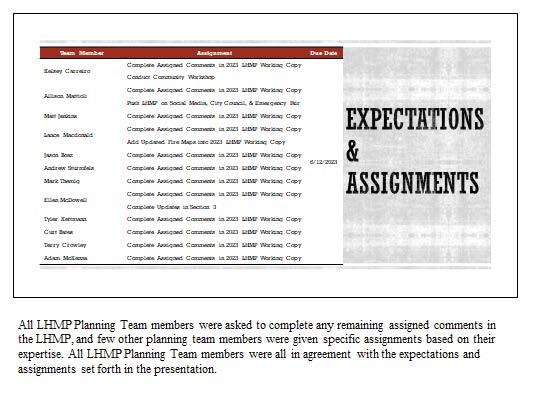
City of Healdsburg 2023 Local Hazard Mitigation Plan Update
7
2023 Local Hazard Mitigation Plan Update
Meeting #3 Minutes
City of Healdsburg
8
City of Healdsburg
2023 Local Hazard Mitigation Plan Update
Meeting #3 Minutes
Action Items:
• All LHMP Planning team members will complete all assigned comments in the “2023 LHMP Working Copy” prior to meeting #4 on June 12th, 2023.
• Kelsey Carreiro will complete Meeting #3 Minutes and send to the LHMP Planning Team for approval by May 30th , 2023, at 4:00pm.
• Kelsey Carreiro, Matt Jenkins, Lance MacDonald, Curt Bates, and Ellen McDowell will conduct the Community Workshop on June 7th, 2023 from 5:00 to 7:00pm at the Healdsburg Community Center.
• Allison Mattioli will continue social media outreach biweekly for the LHMP Update.
Future Meetings Scheduled:
• Meeting #4 will be held on June 12th, 2023, from 1:00pm to 3:00pm at the Emergency Operations Center at 238 Center St in Healdsburg, California.
9
This page intentionally left blank
Appendix B Public Outreach
Sonoma County Operational Area Weekly Situational Briefing
Neighboring Jurisdictions Outreach
Kelsey Carreiro, Healdsburg Emergency Manager, made the following announcement during the Sonoma County Operational Area Weekly Situational Briefing held on April 17th at 10:00am:
Good morning, I have a quick announcement for the group:
The City of Healdsburg has launched an effort to update our Local Hazard Mitigation Plan.
The LHMP update process will review the hazards the City is susceptible to and identify mitigation actions that can be implemented to reduce vulnerability and damage from these risks.
The planning process is scheduled through September 2023.
There are a few opportunities for public comments on the plan throughout the process. Currently, we have a hazard survey available online and we will be holding a community workshop on June 7th from 5:00-7:00pm at the Healdsburg Community Center.
If you are interested in attending planning team meetings or being provided with updates on our plan development process, please let me know.
More information on the 2023 LHMP Update can be found at healdsburgemergency.org. I will drop the link in the comments for anyone interested in learning more or filling out the hazard survey.
Thank you!
The following 53 members of the Operational Area were present during this briefing:
1

2
3

CityManager’sUpdatesentoutonApril7th,2023toallcitystaffandcommunitysubscribers:
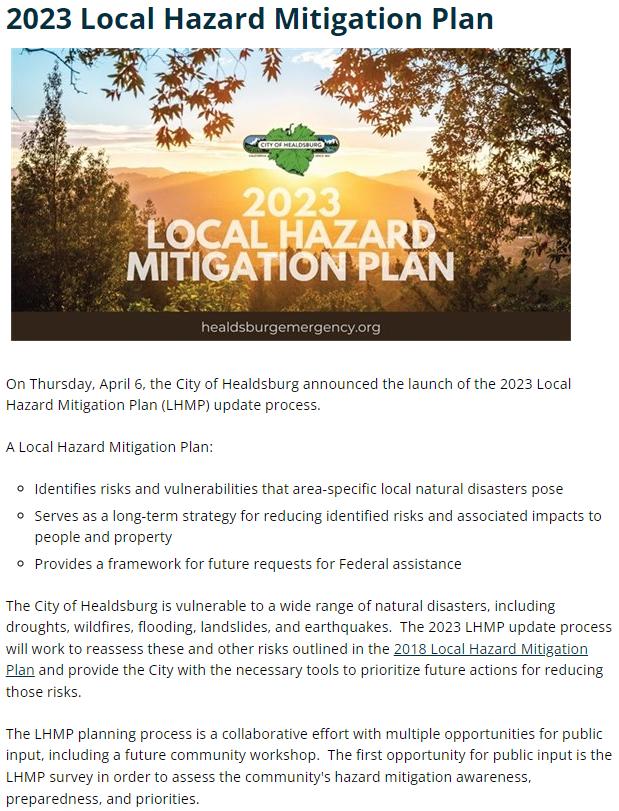
NewsflashpostedtoCitywebsiteonApril7th,2023:
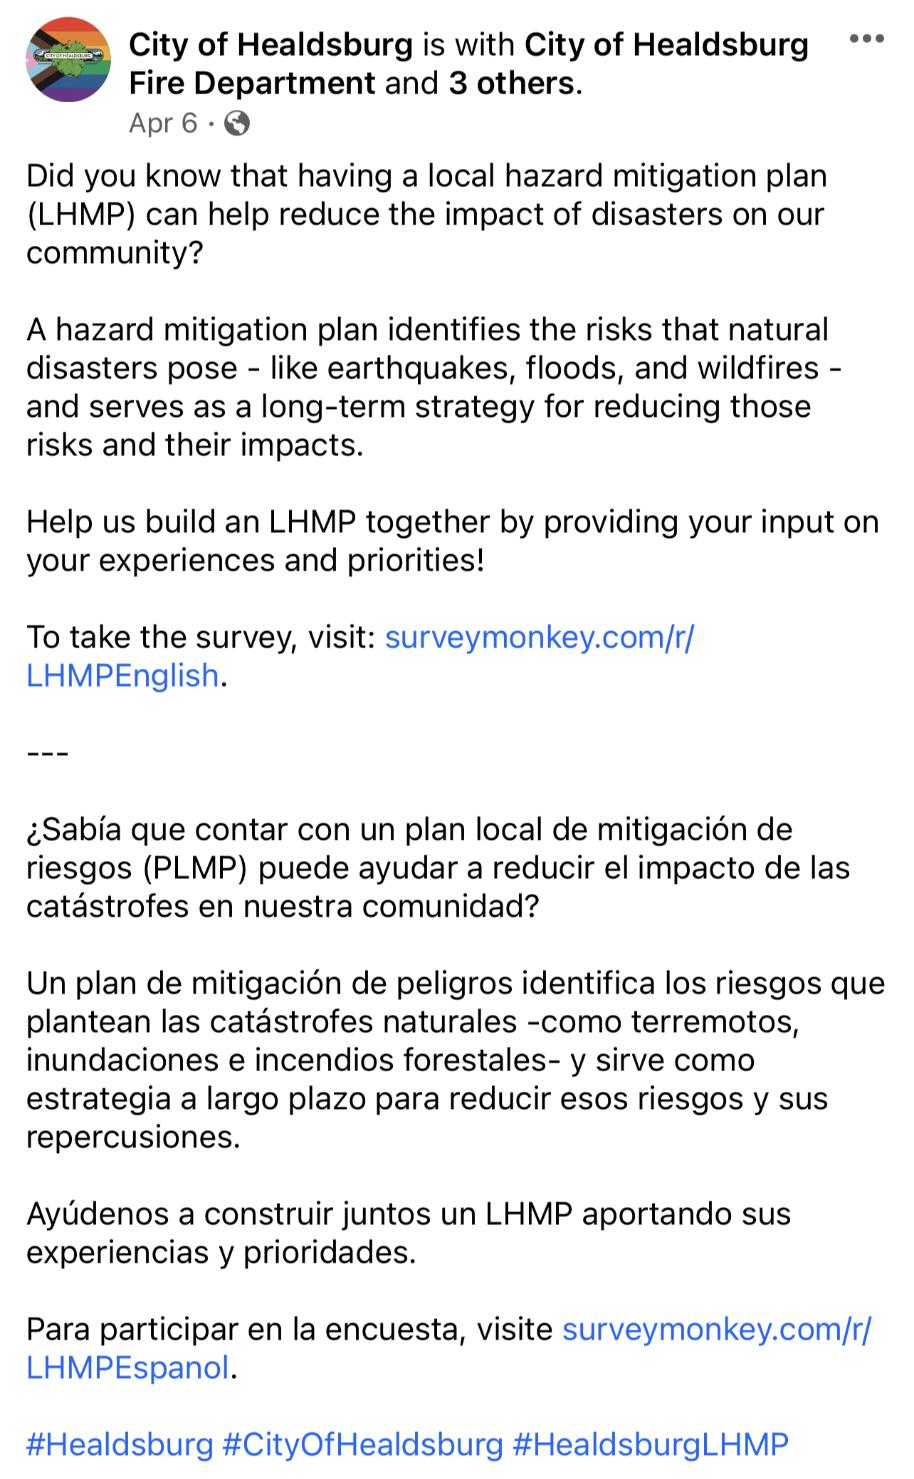
AllFacebookpostsfromApril6thtoJune11th,2023:
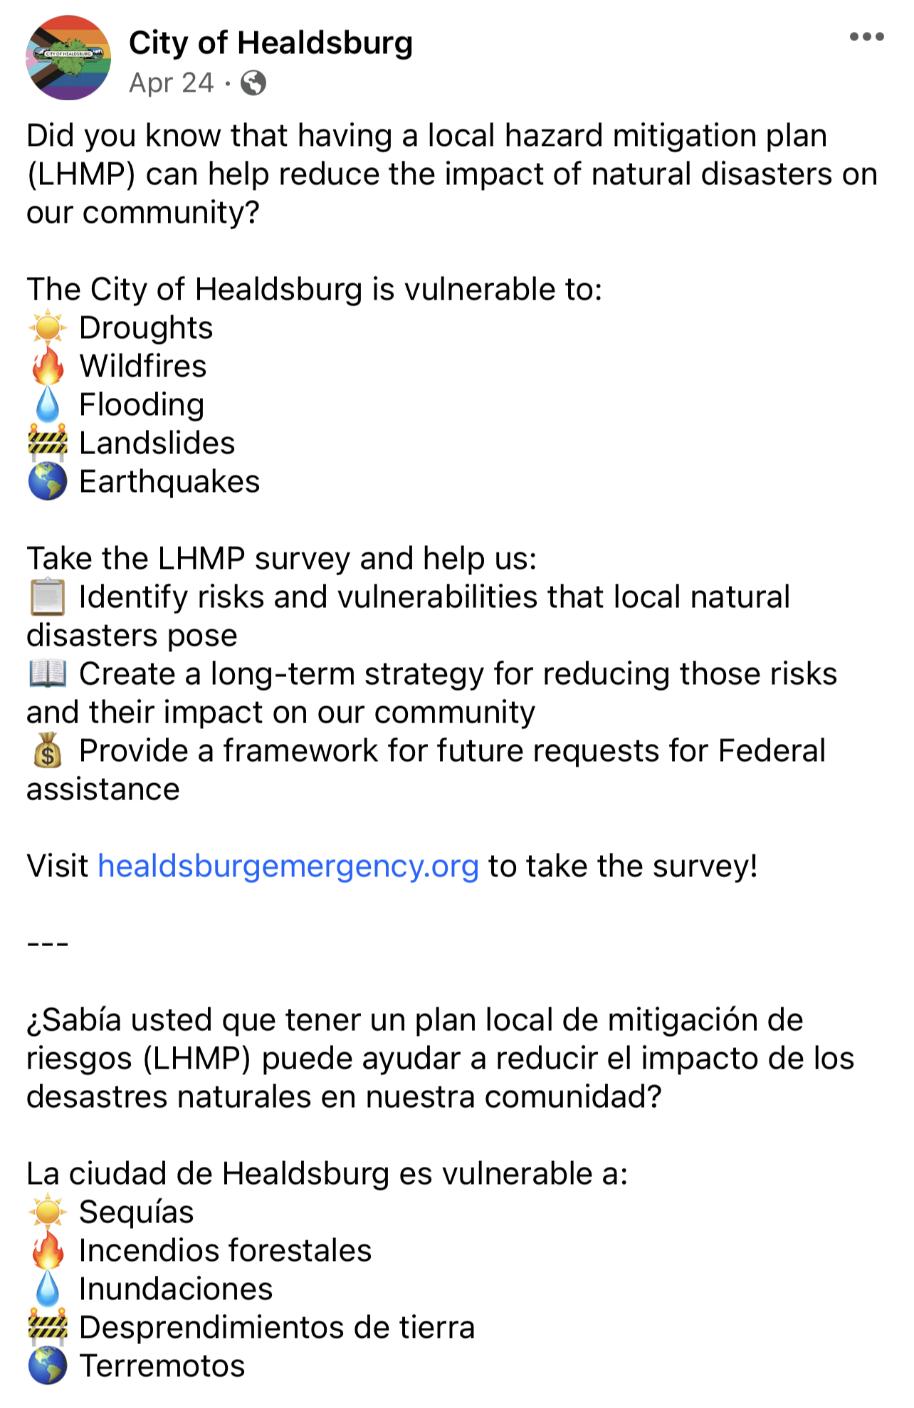
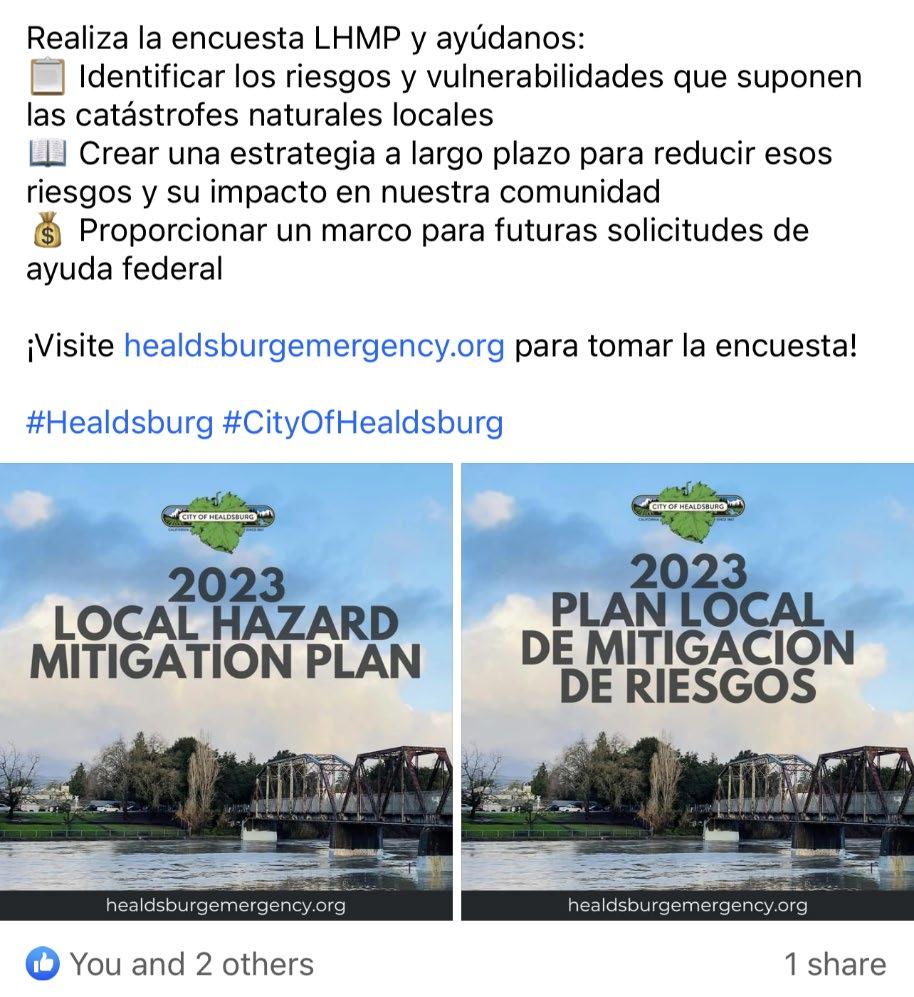
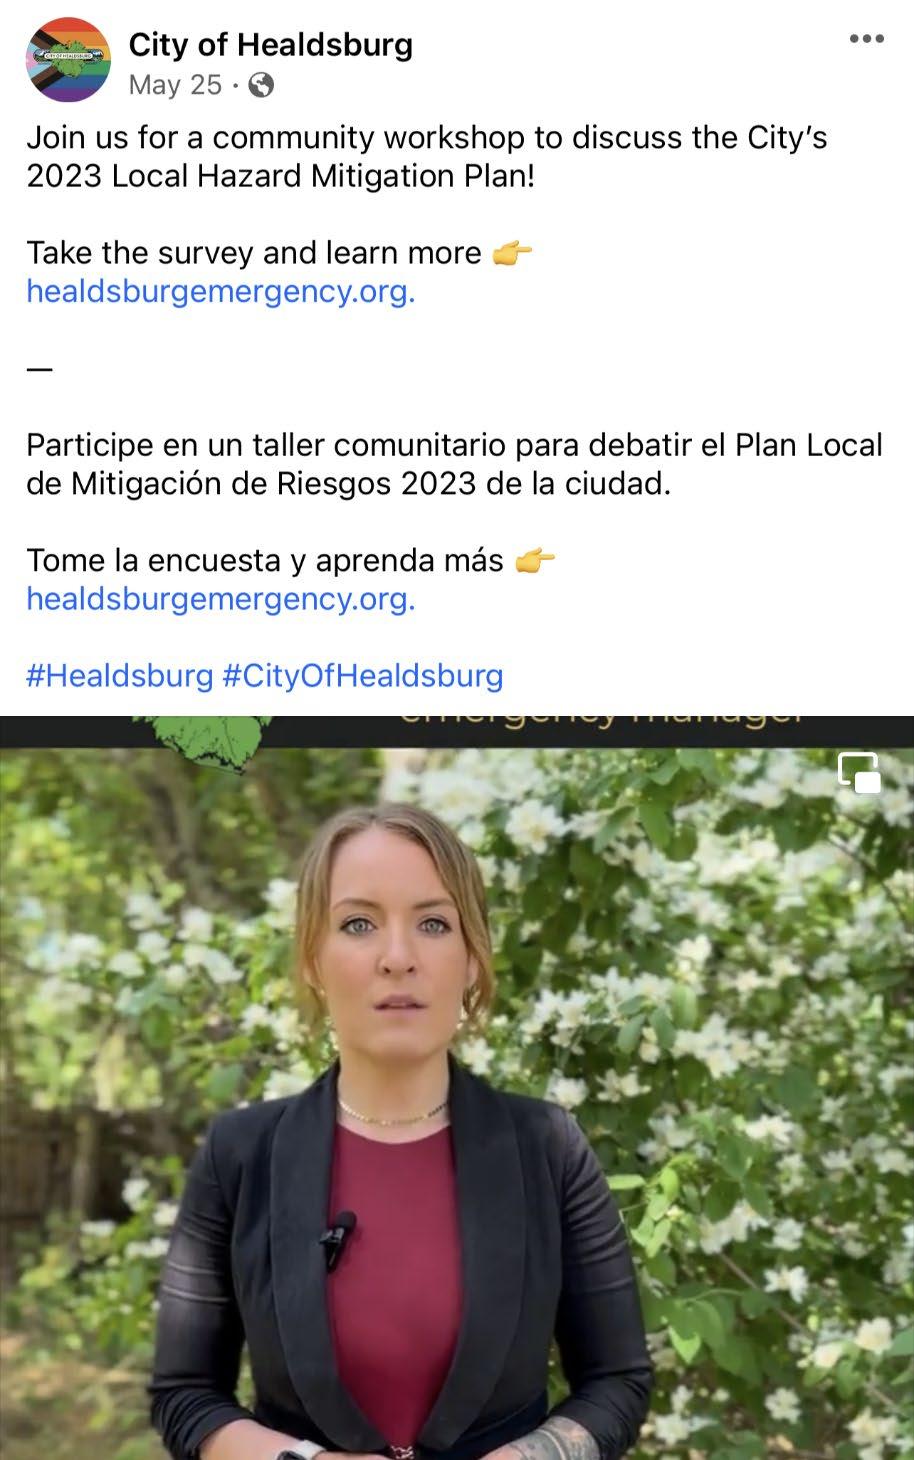

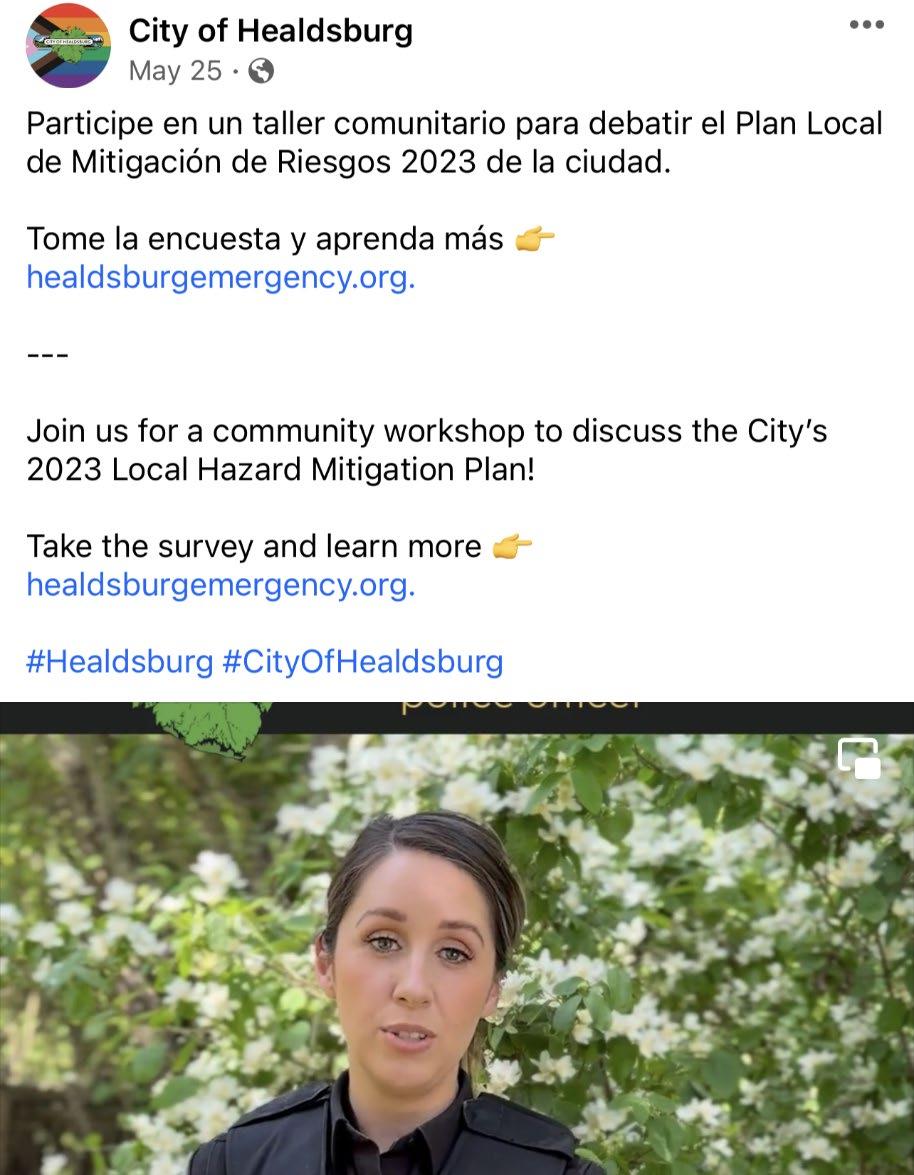

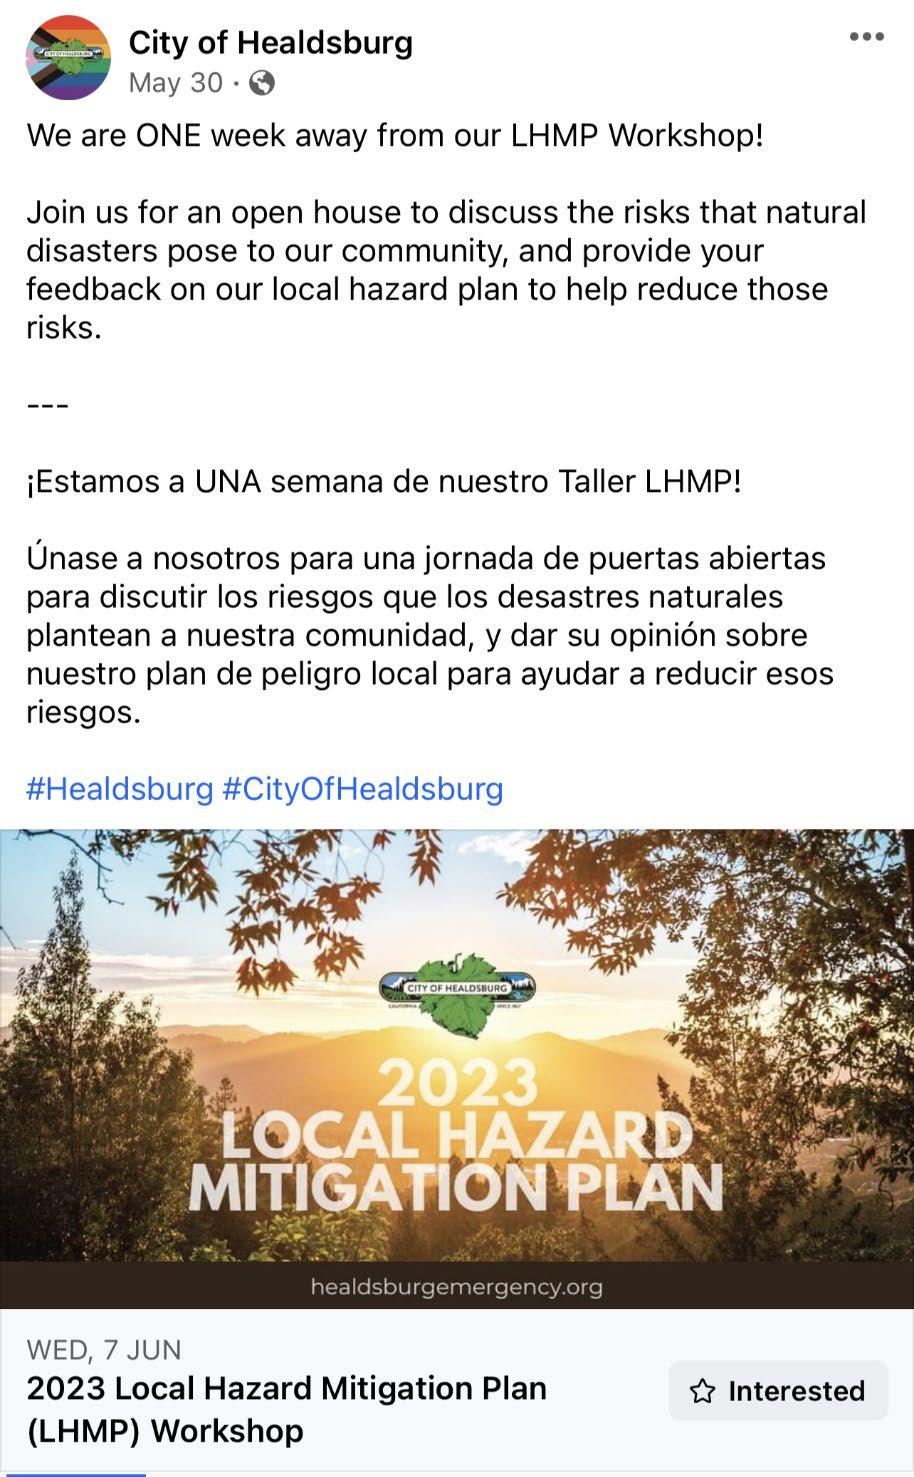
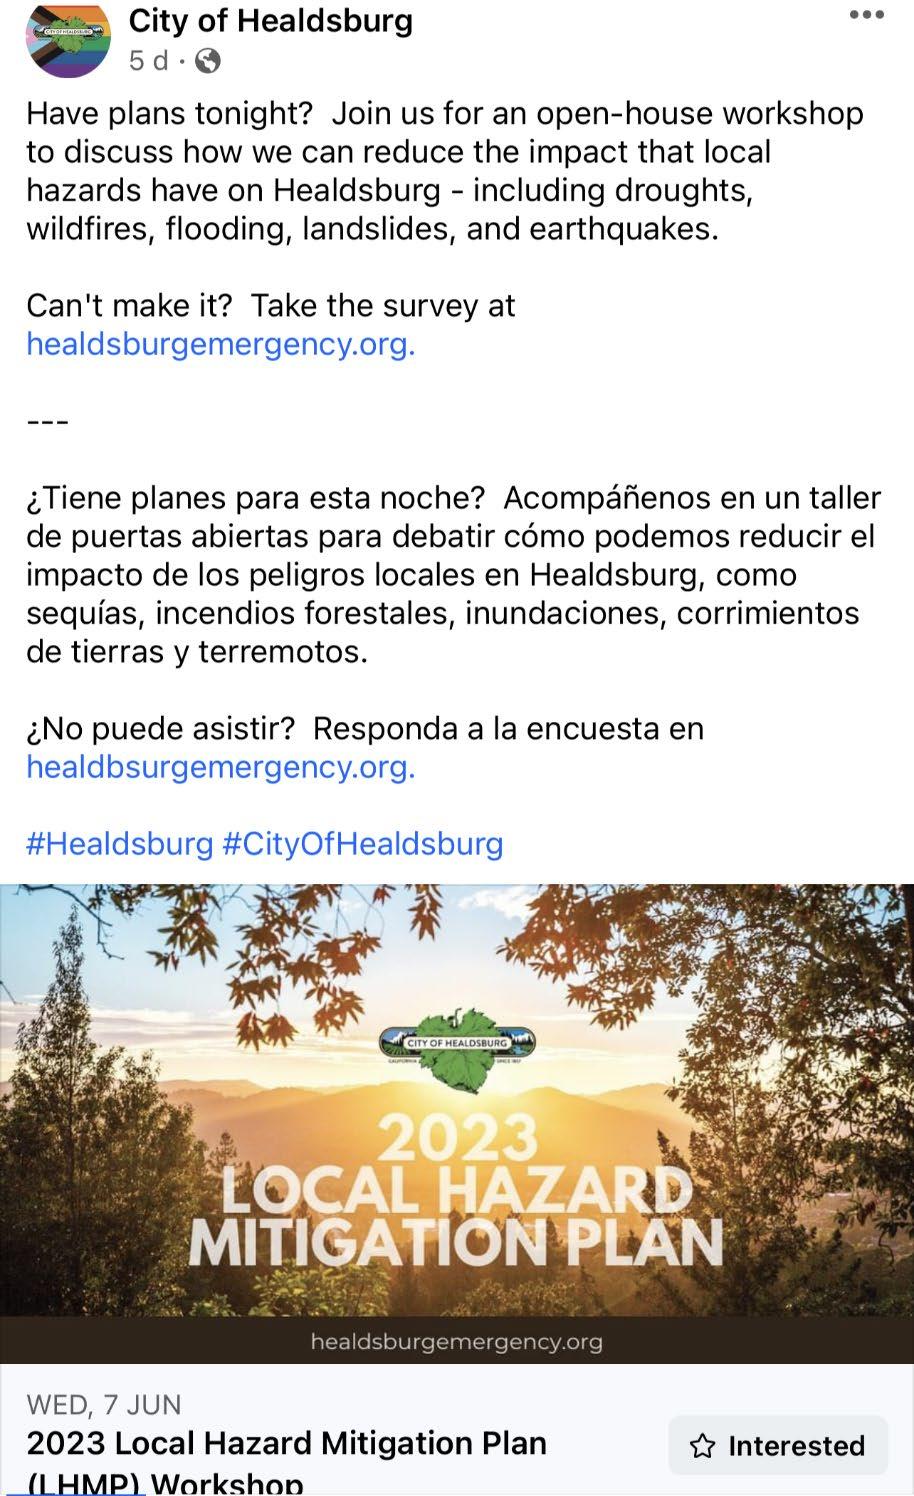
AllInstagrampostsfromApril6th toJune11th,2023:
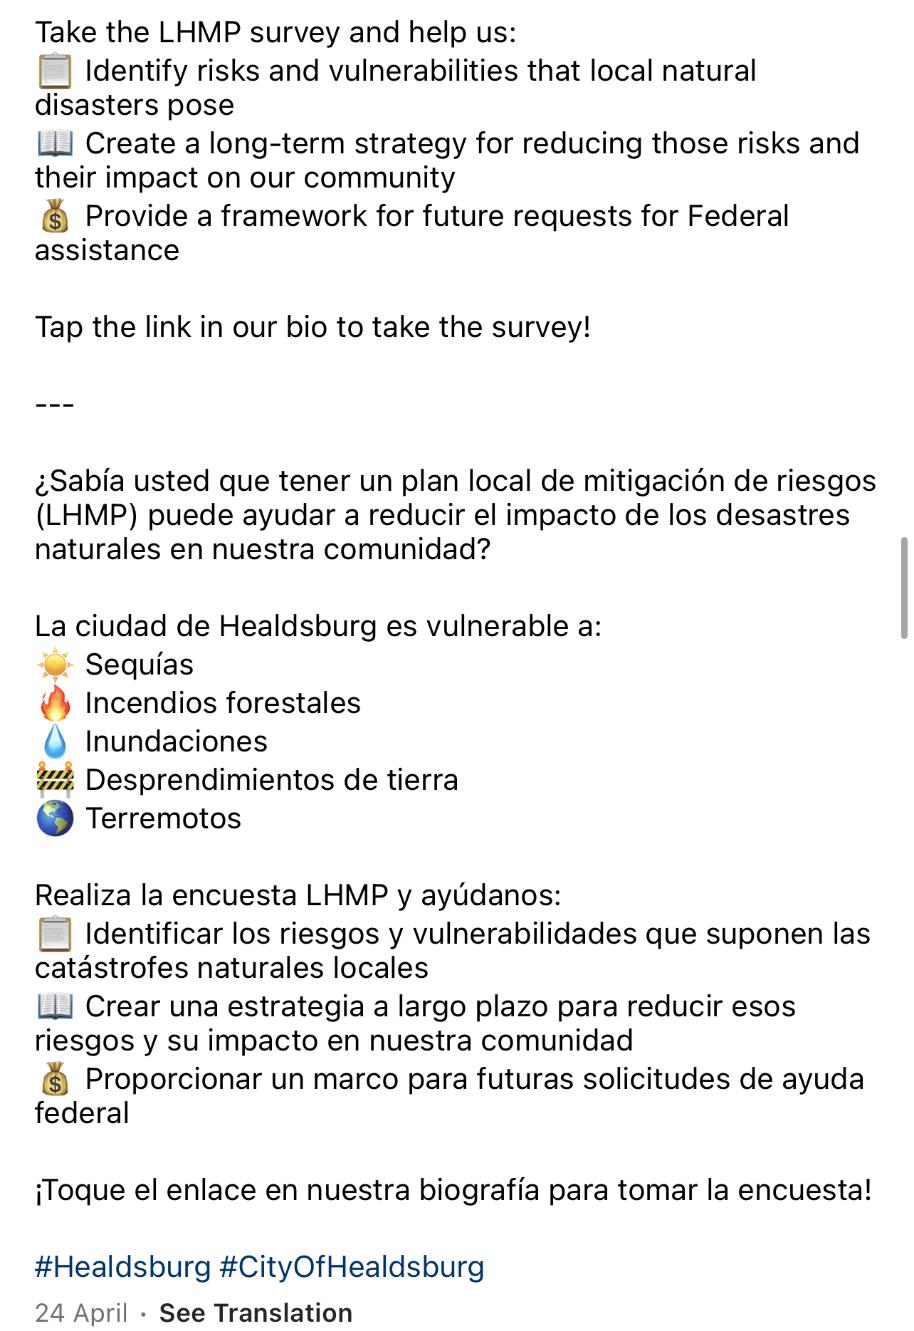
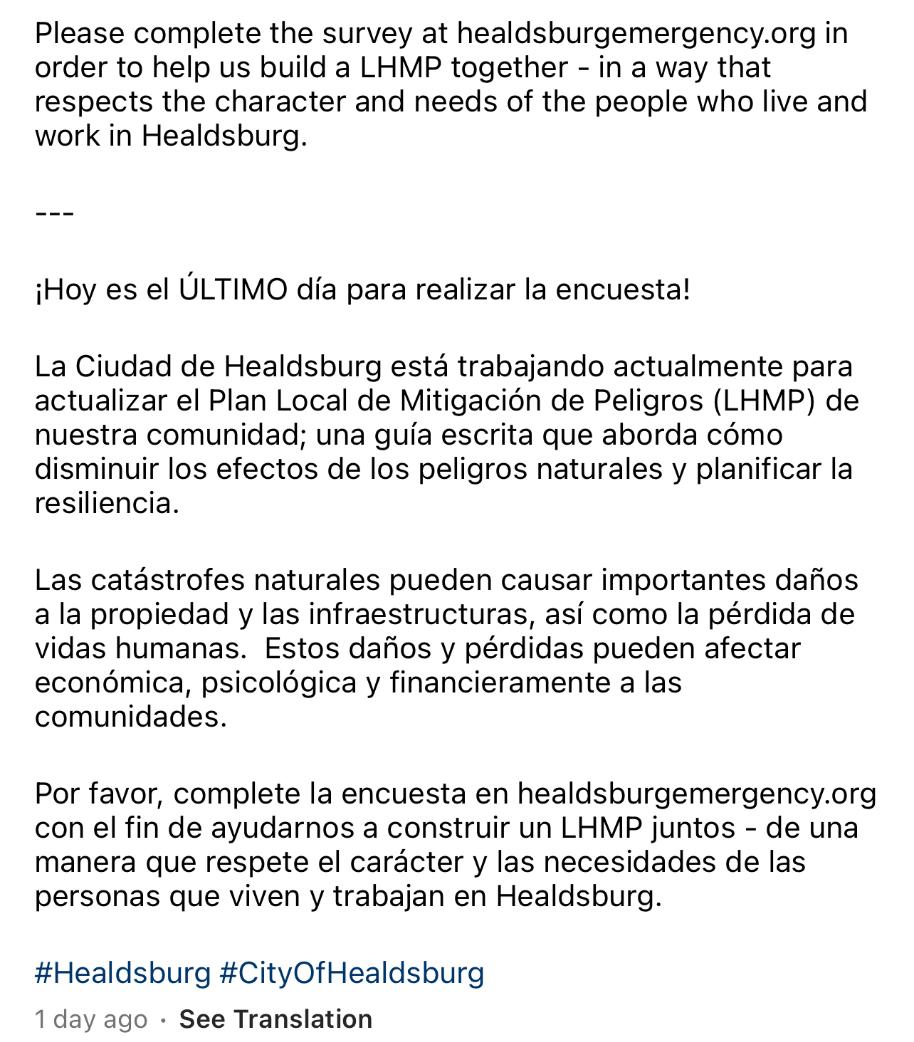
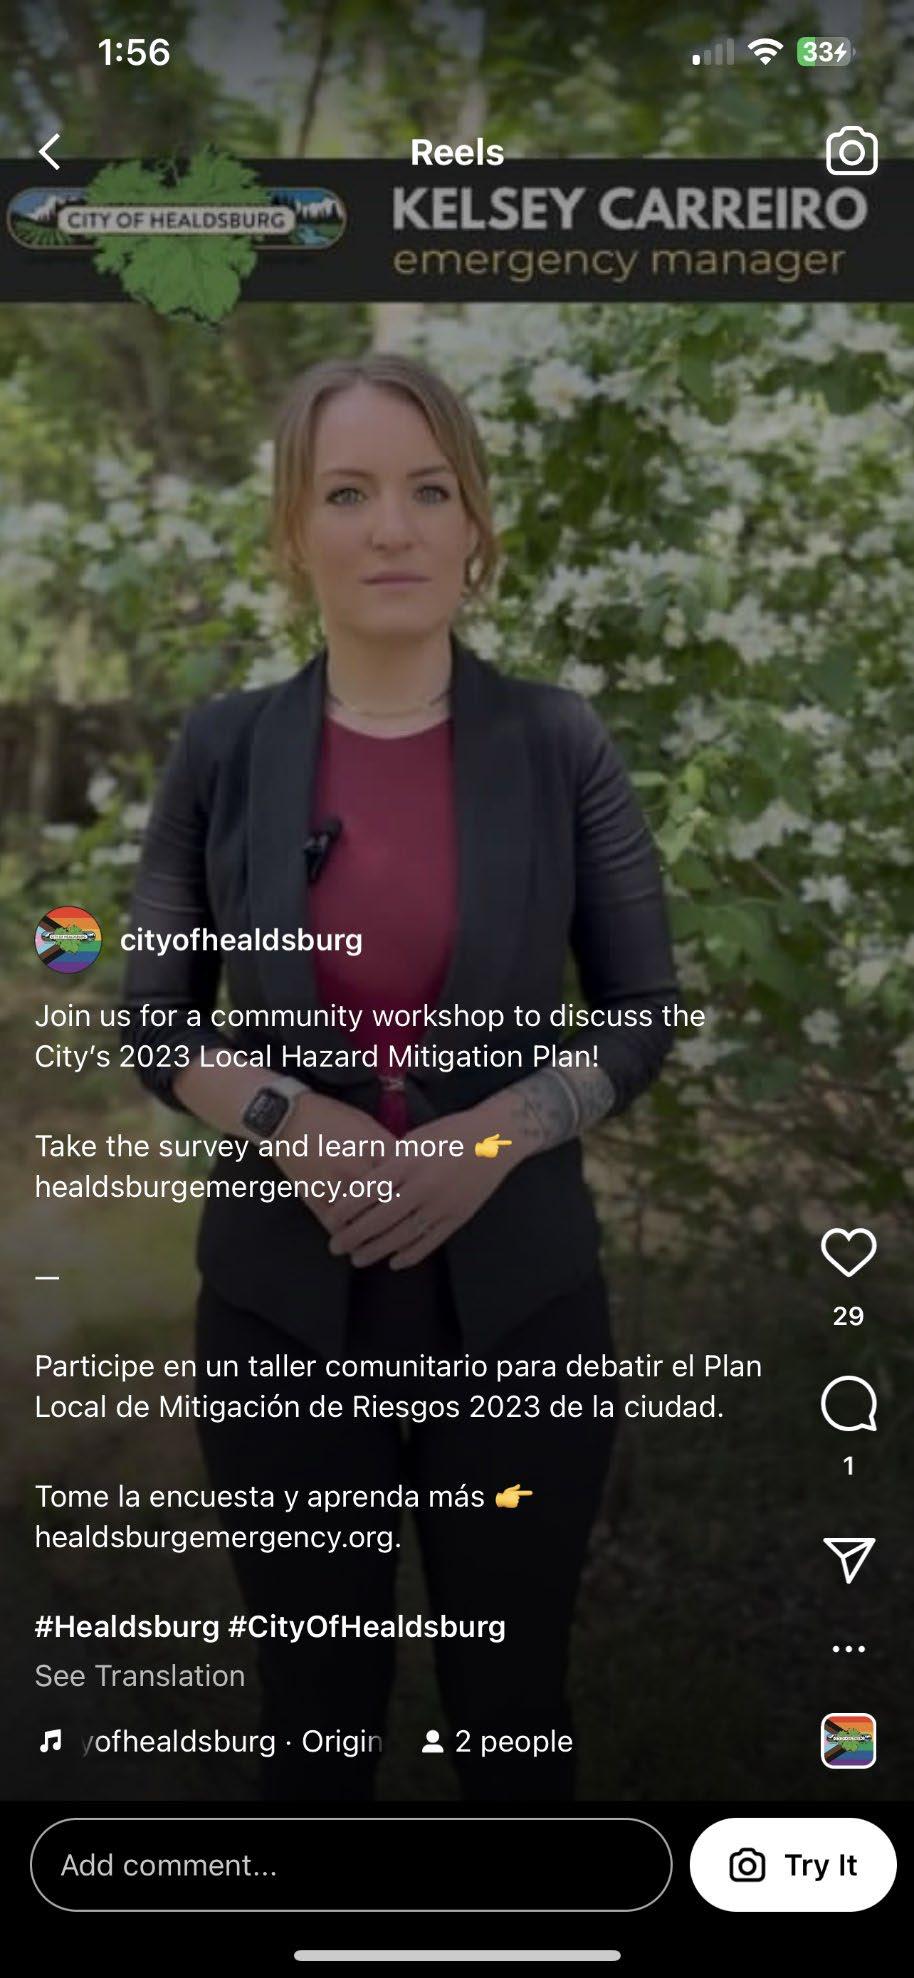
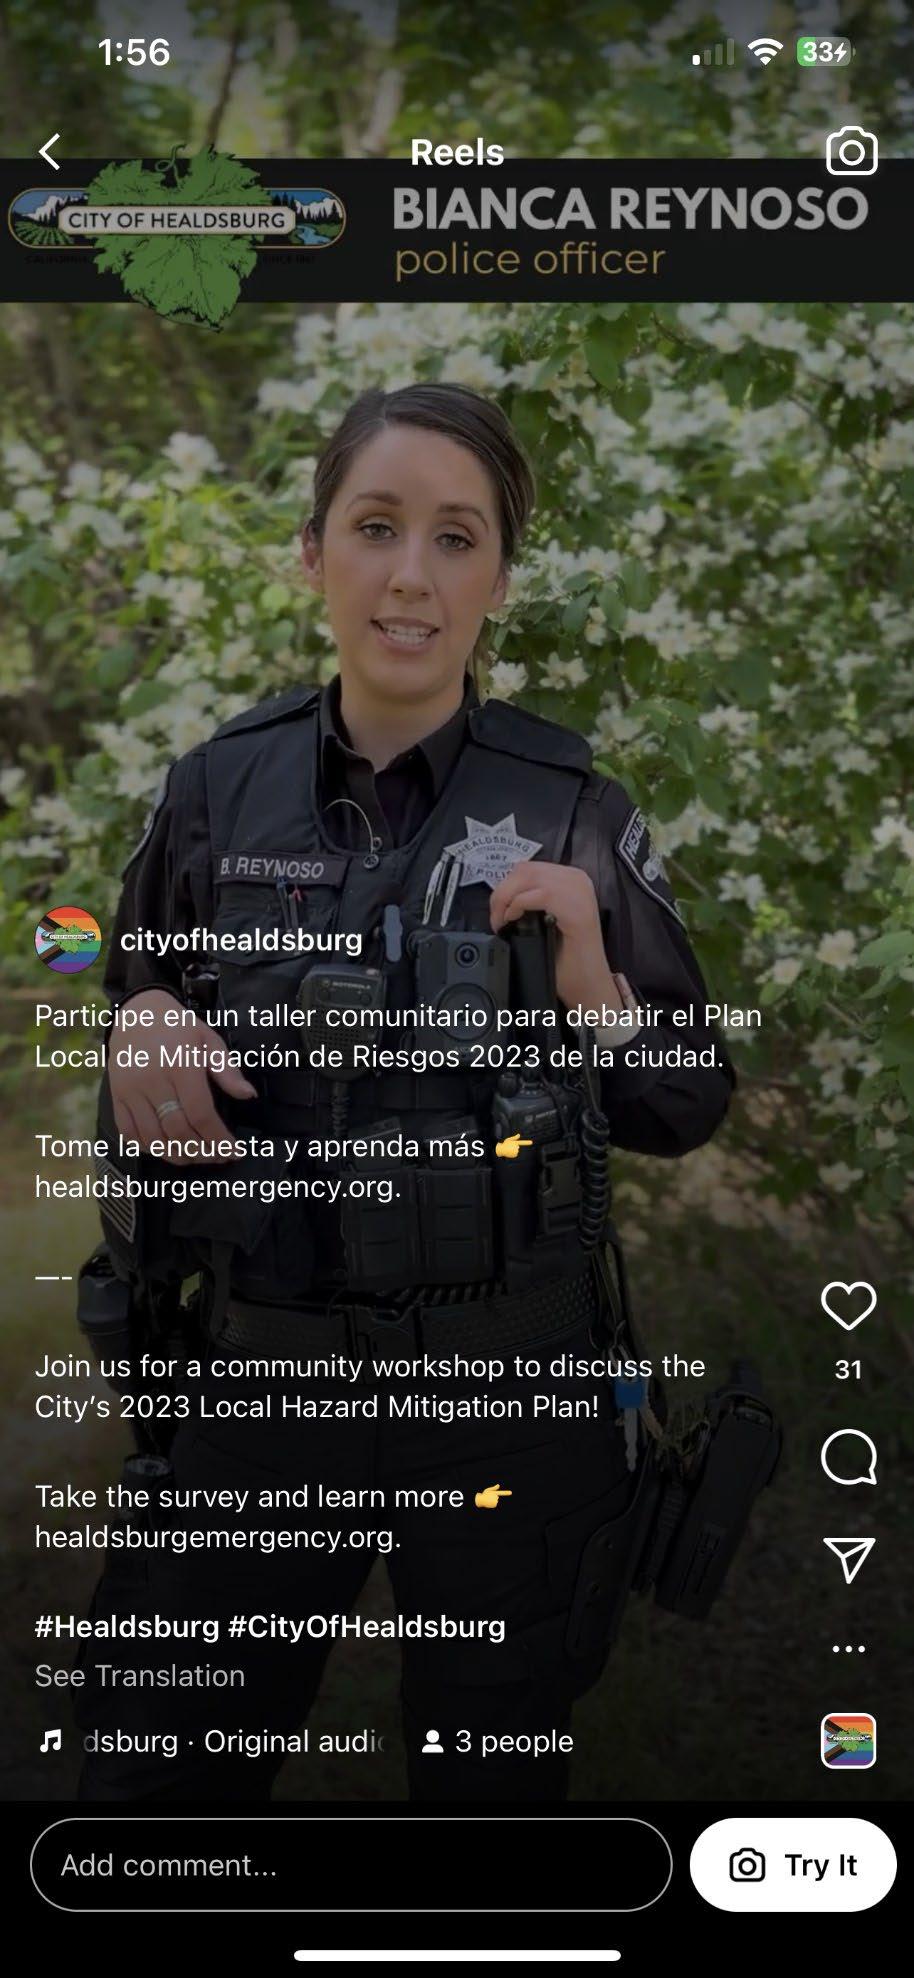
HazardQues�onnaireQues�onSummaries:
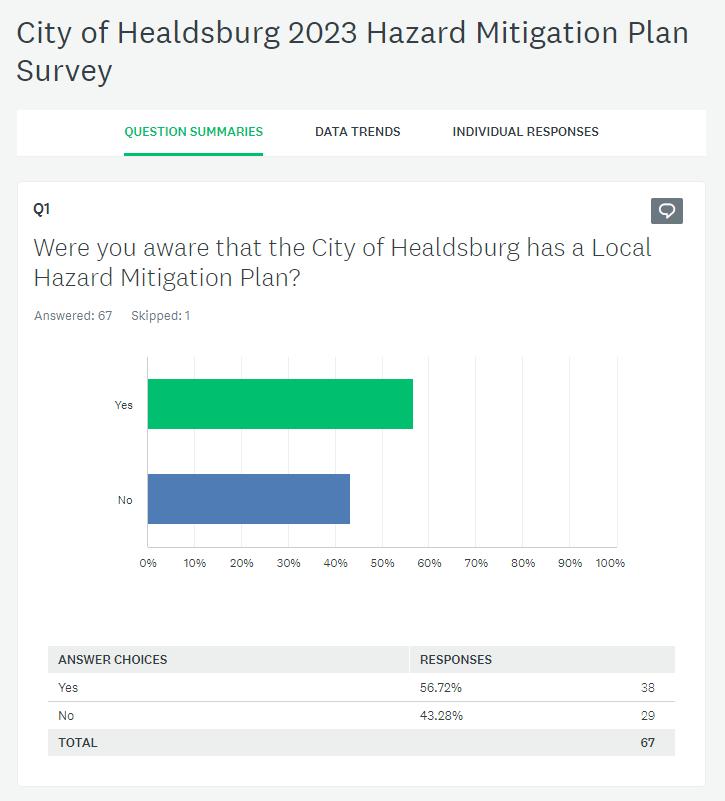
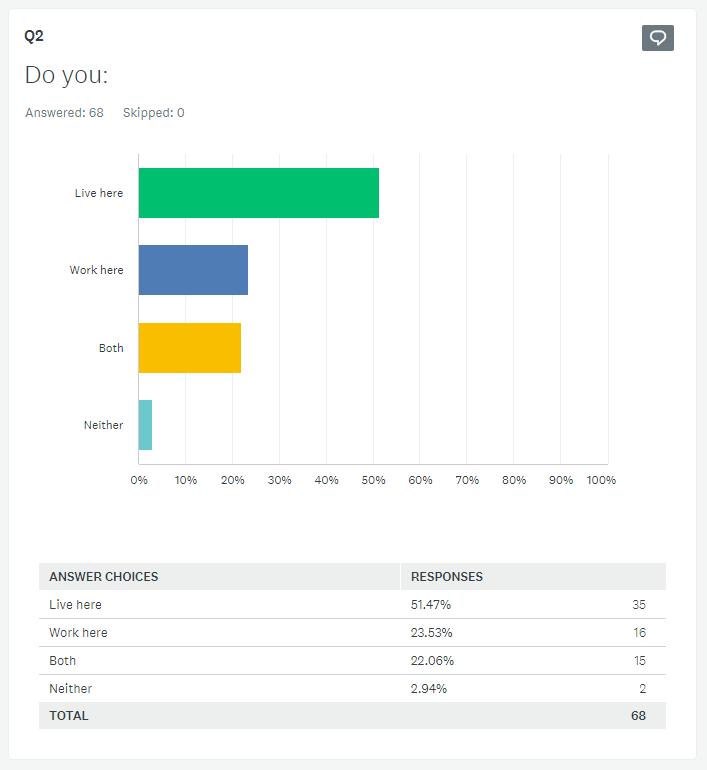
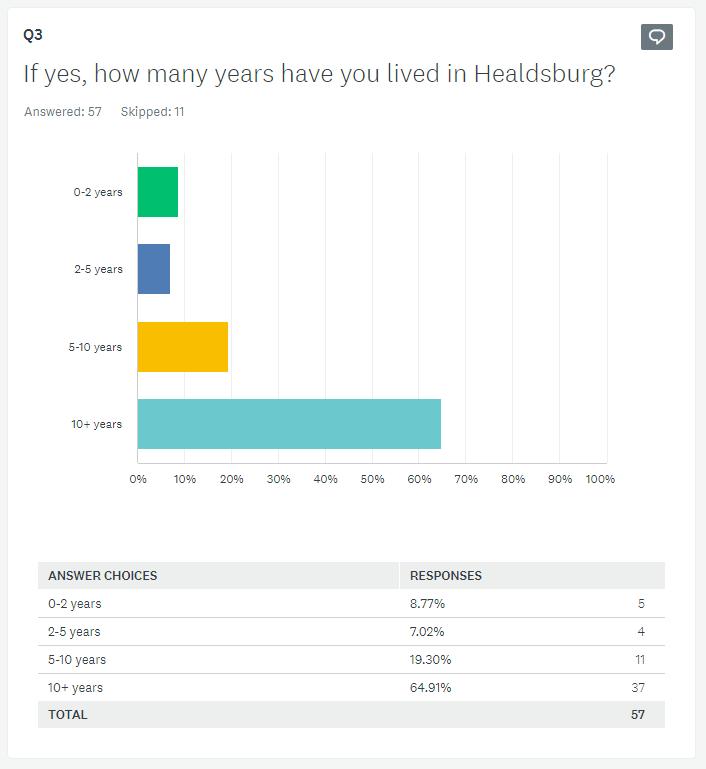
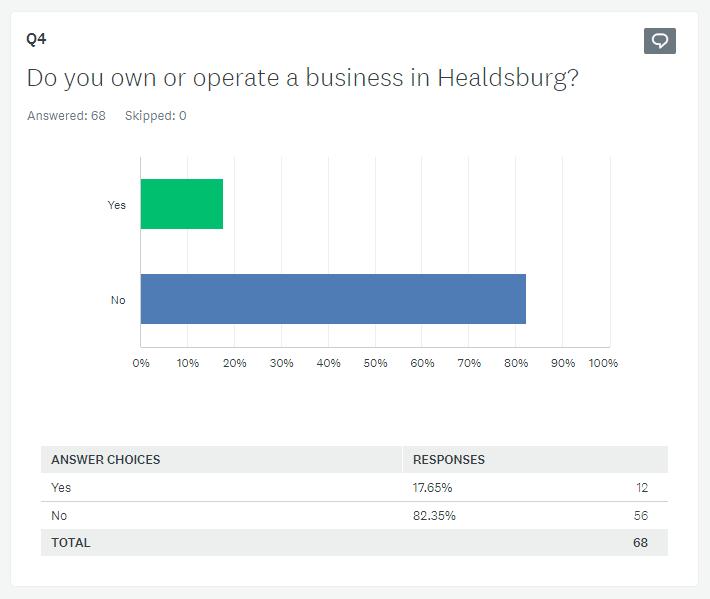
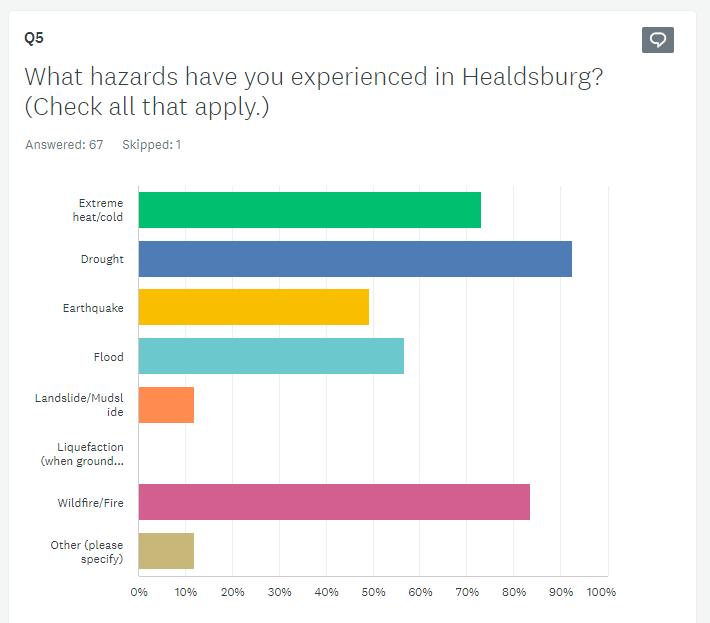
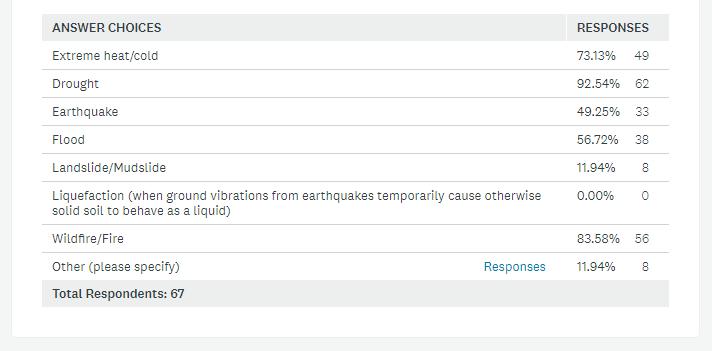
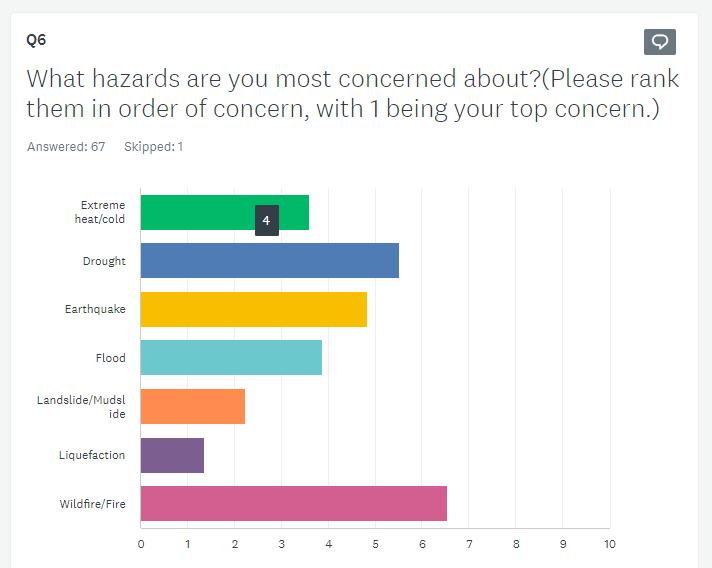
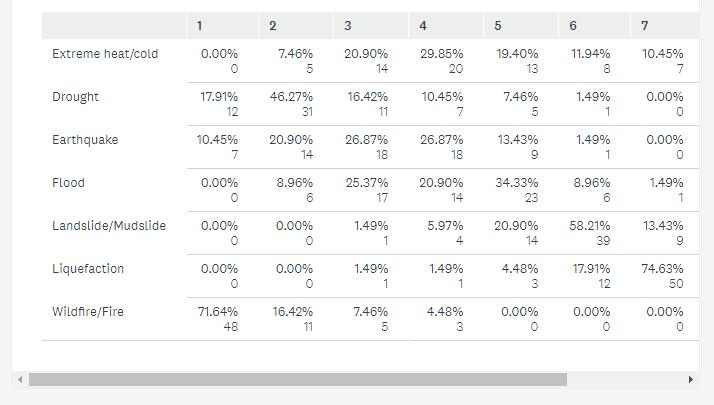
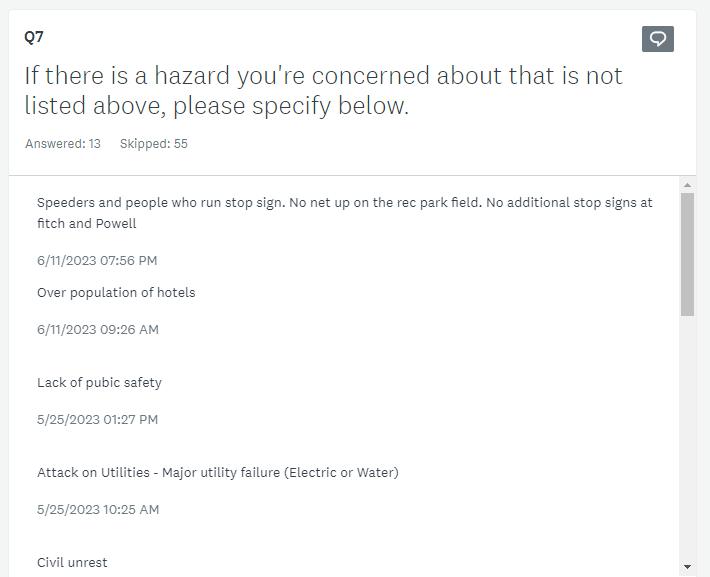
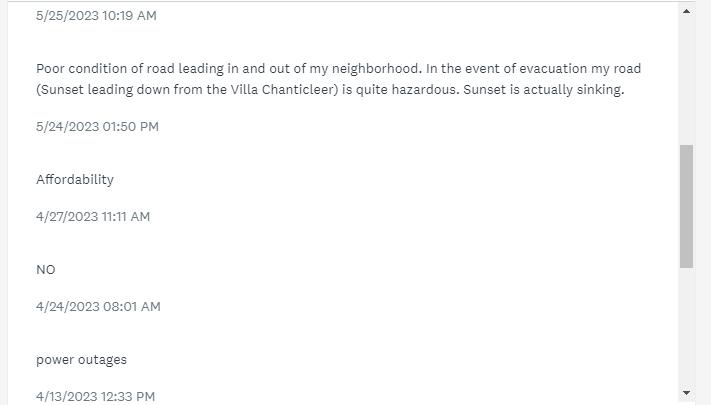
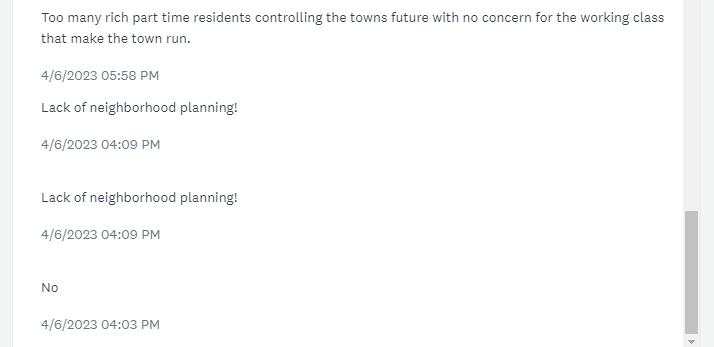
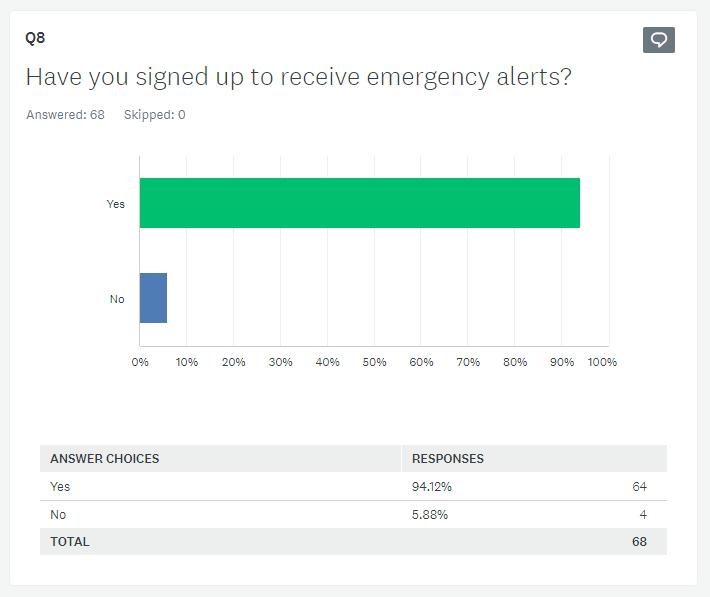
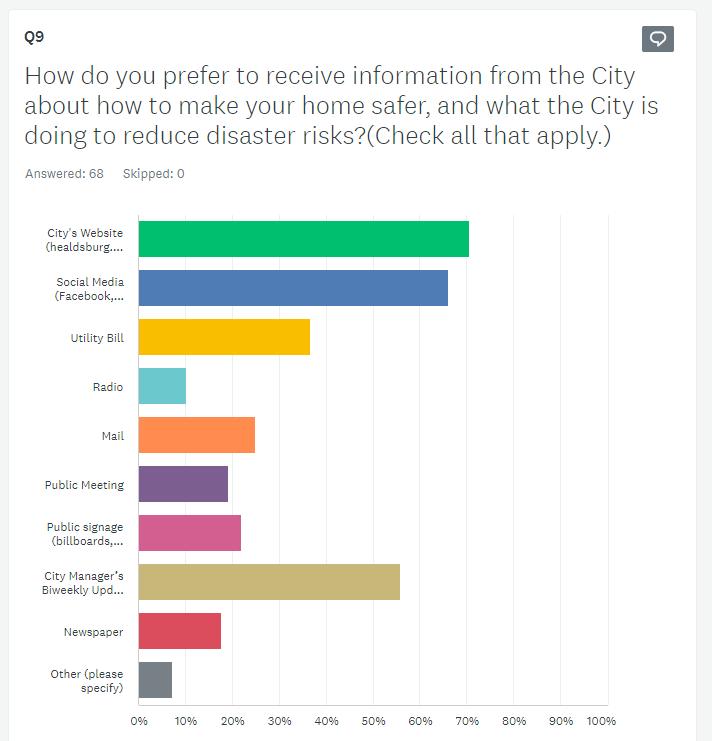
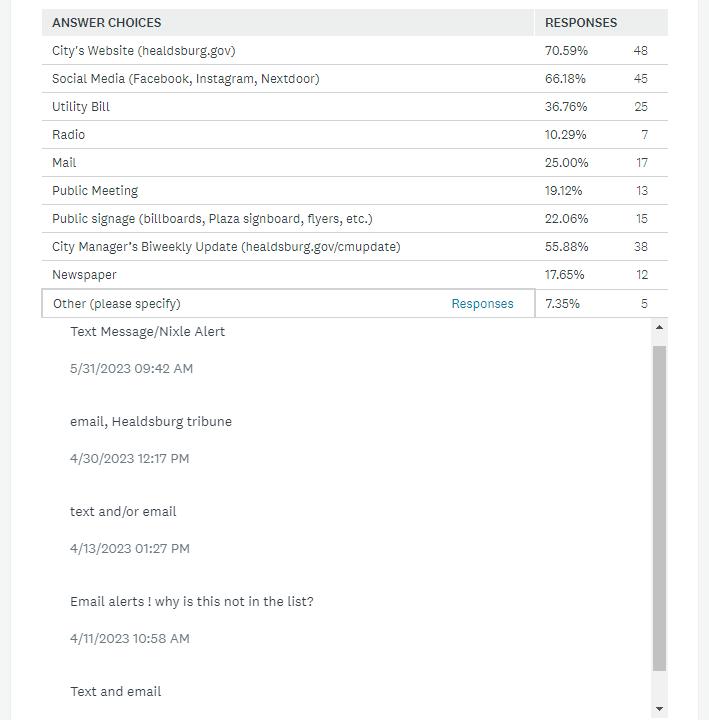
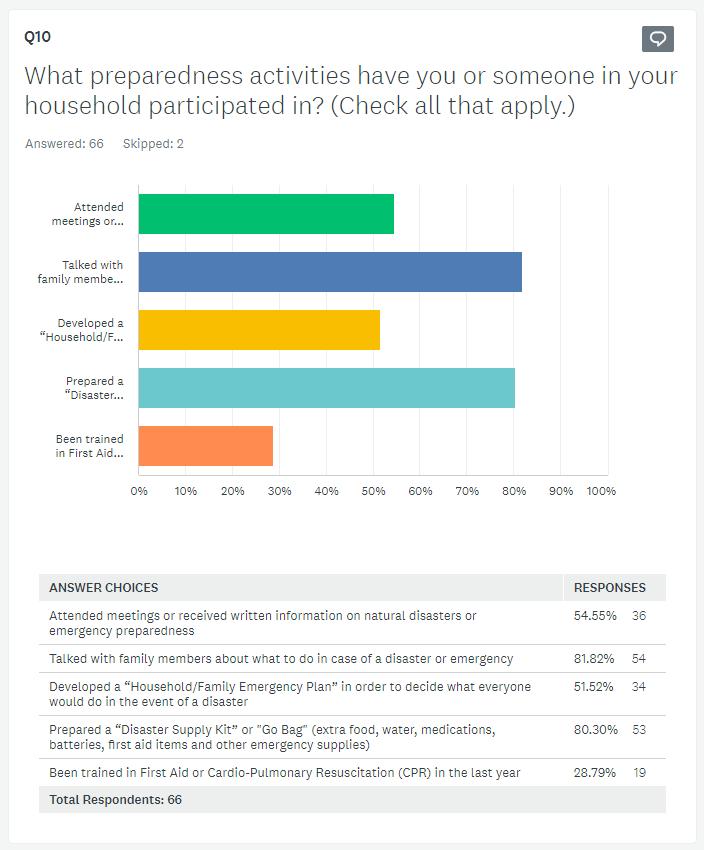
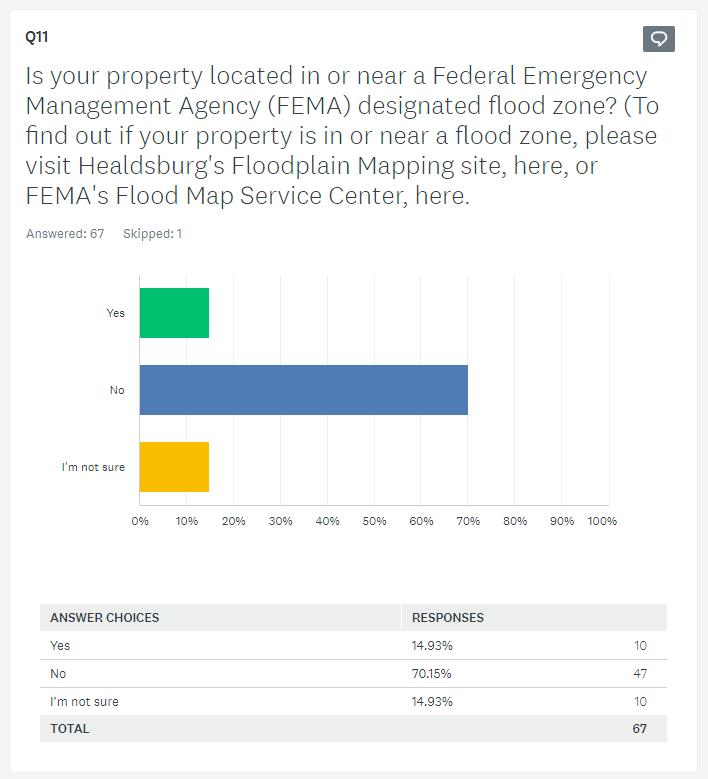
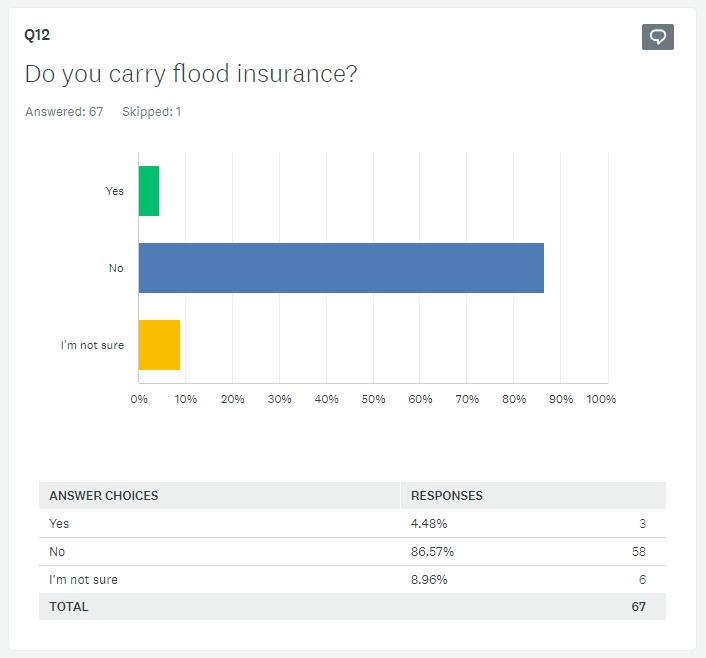
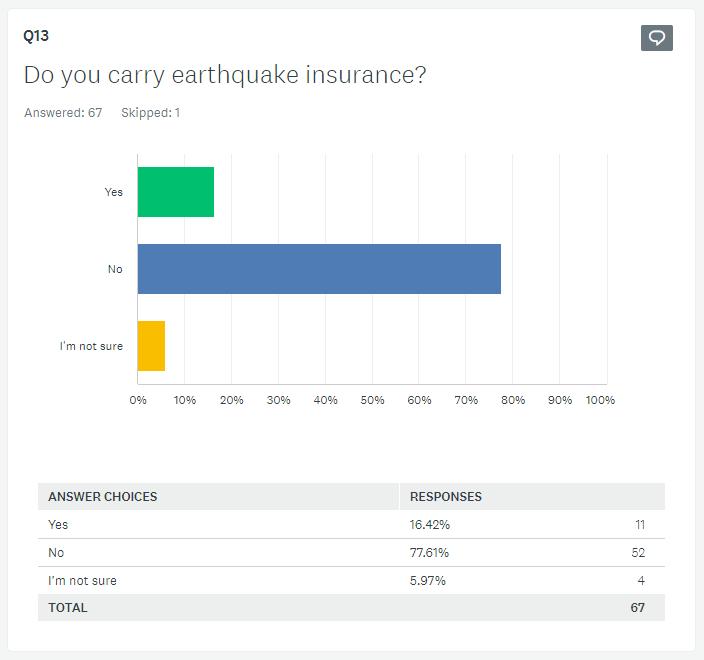
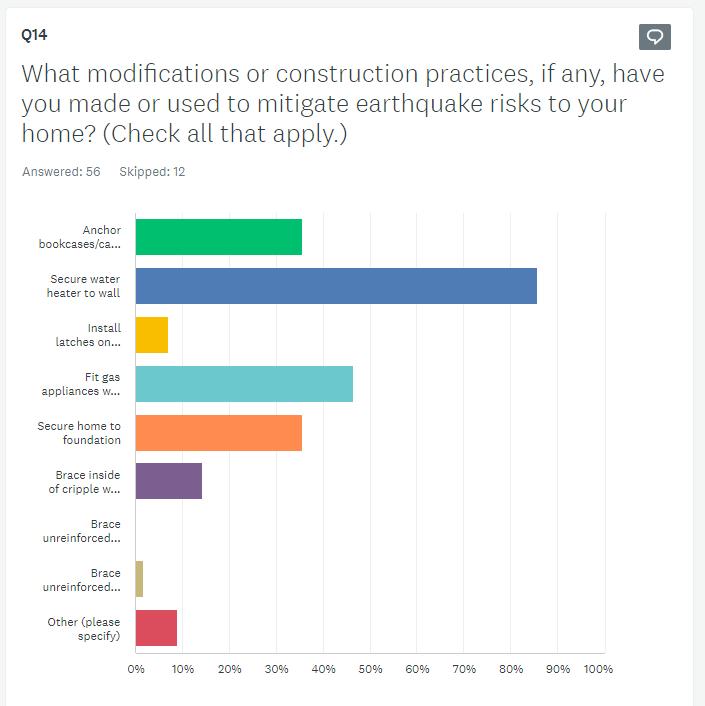
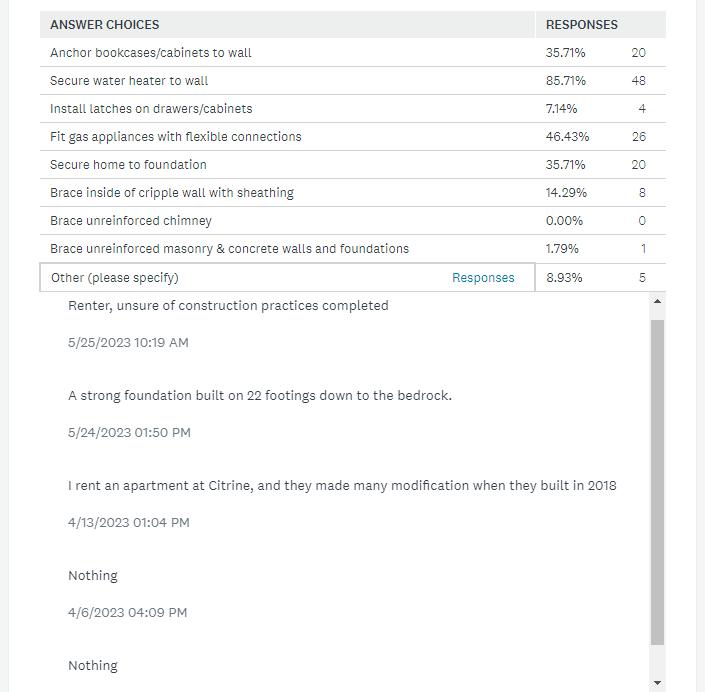
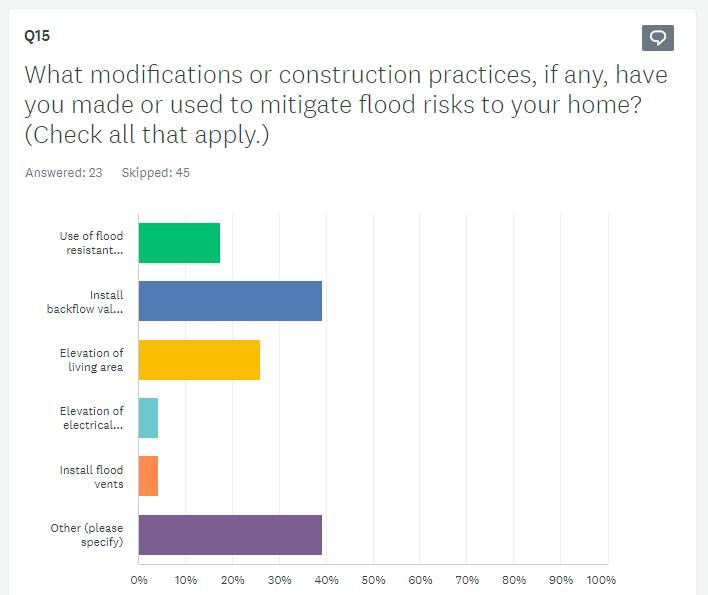
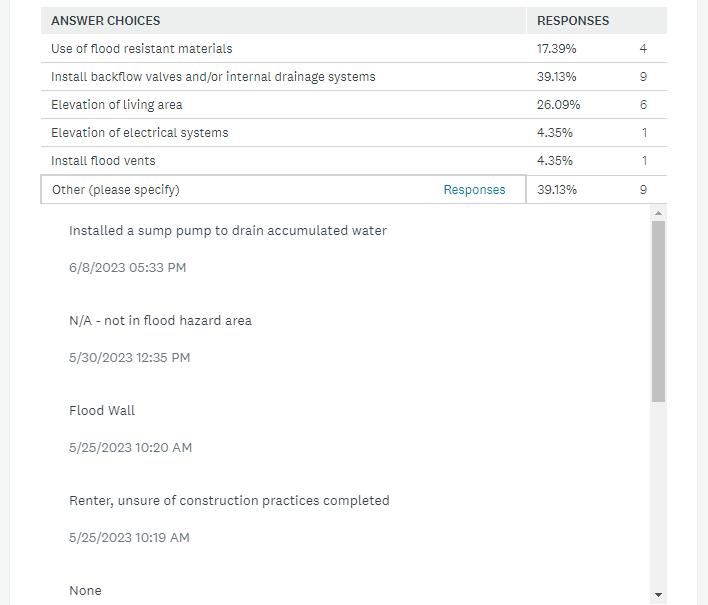
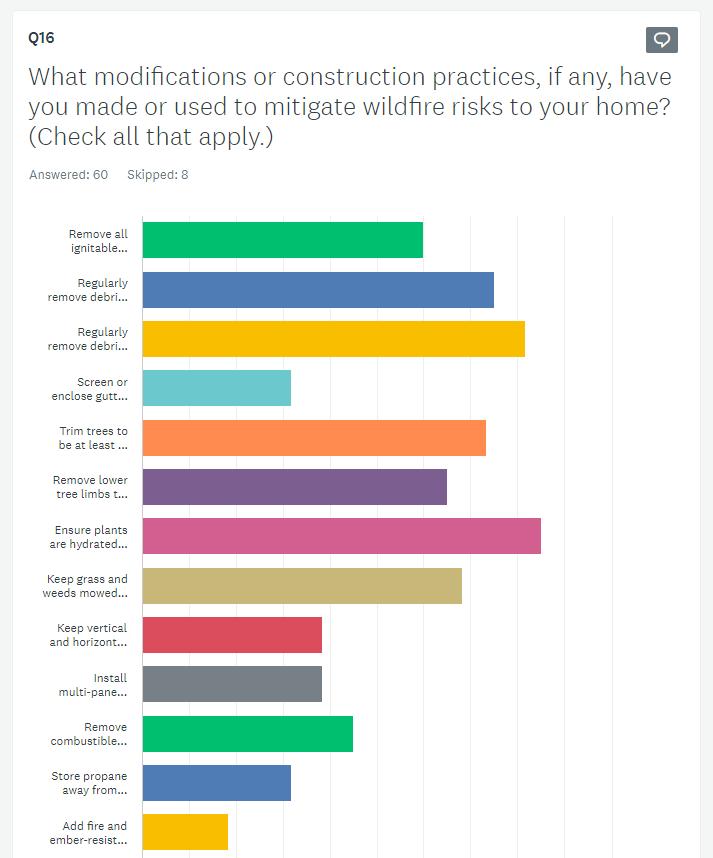
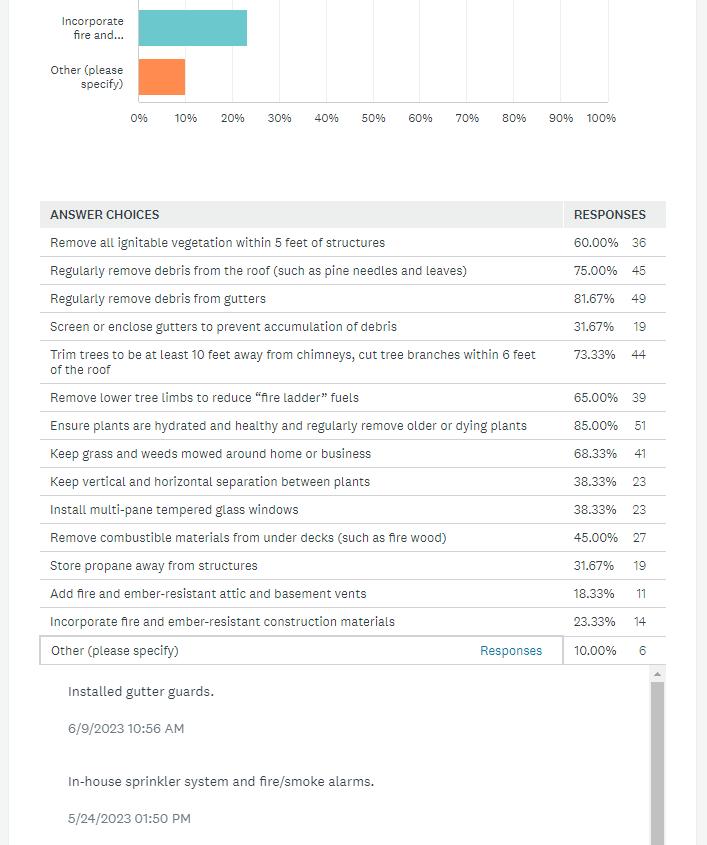
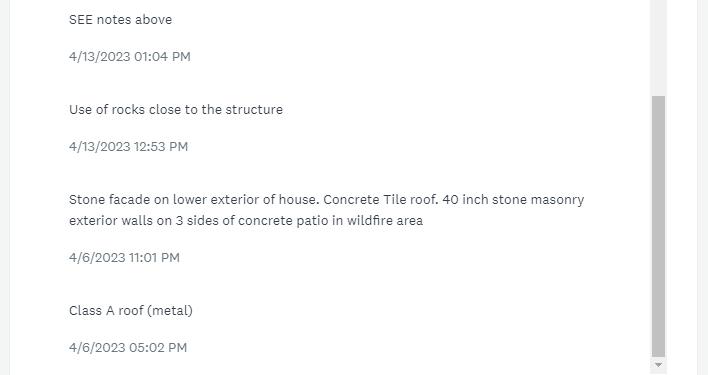
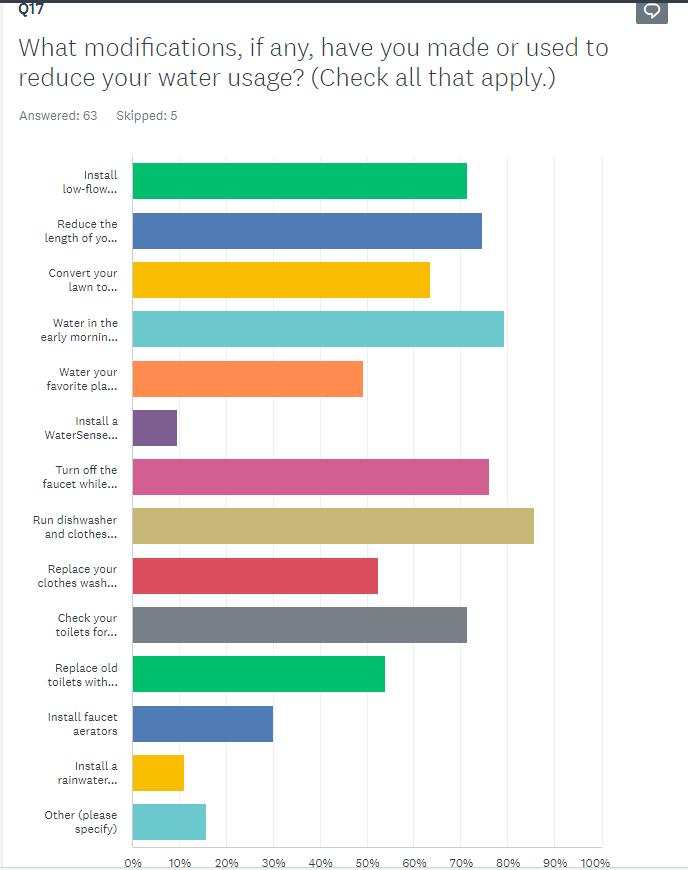
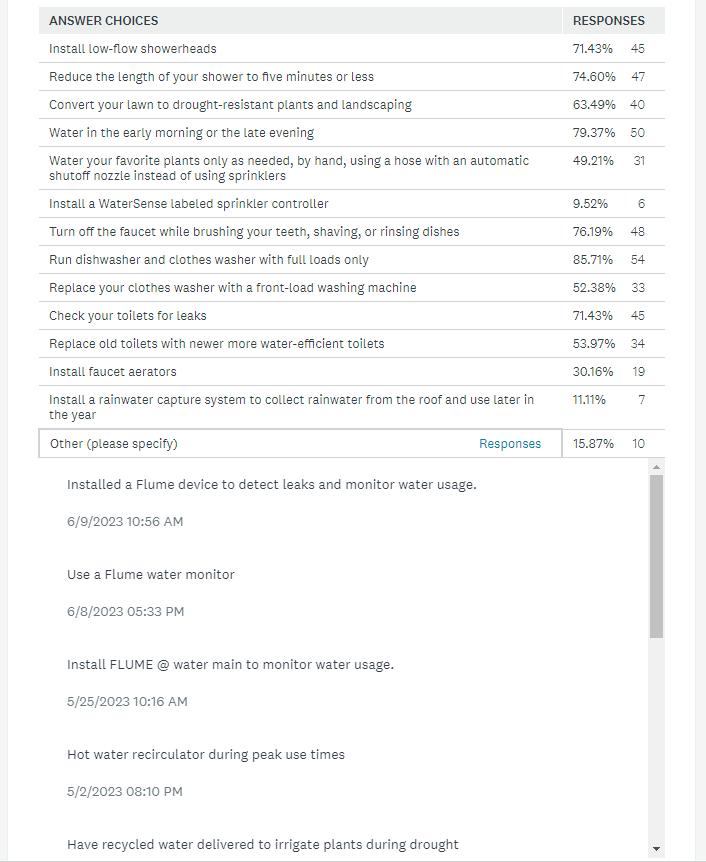
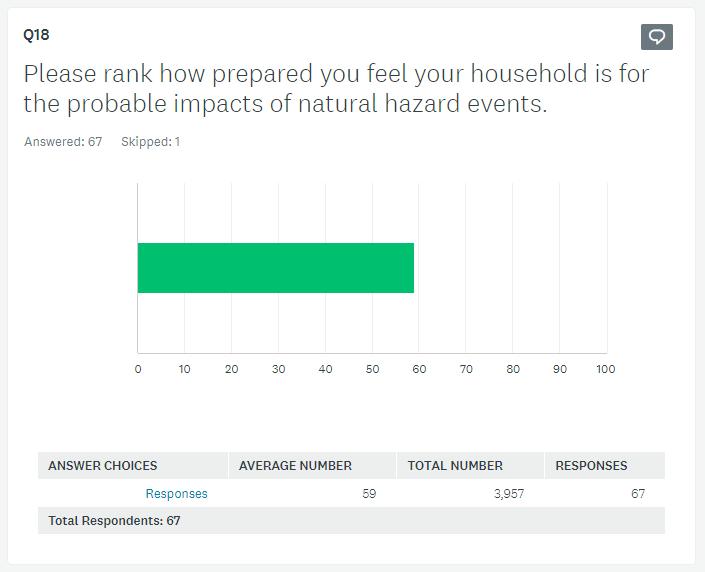
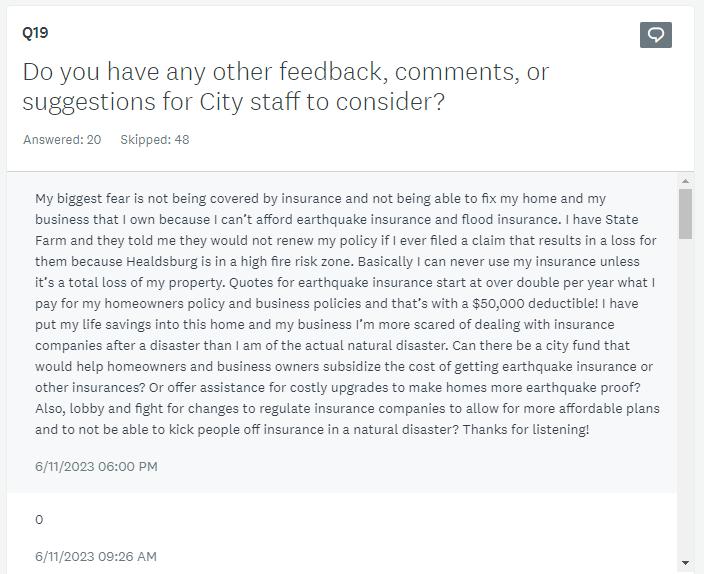
Encuesta del Plan de Mitigación de Riesgos de la Ciudad de Healdsburg 2023
¿Sabía que la ciudad de Healdsburg cuenta con un Plan Local de Mitigación de Riesgos?
¿En caso afirmativo, cuántos años lleva viviendo en Healdsburg? 10+ años
¿Tienes o operas un negocio en Healdsburg?
¿Qué peligros ha experimentado en Healdsburg? (Marque todos los que correspondan )
¿Qué peligros le preocupan más?(Por favor, clasifíquelos por orden de preocupación, siendo 1 su mayor preocupación)
https://www.surveymonkey.com/results/SM-holVUUnvhNHnJlSBRw2rHQ_3D_3D/browse/
6/12/23, 4:00 PM Encuesta del Plan de Mitigación de Riesgos de la Ciudad de Healdsburg 2023 - Responses | SurveyMonkey
1/3
QUESTION SUMMARIES DATA TRENDS INDIVIDUAL RESPONSES
Q1
Q2 Usted: Ambos Q3
No
Q4
Q5
No
Calor/frío extremos Sequía Inundación Incendios forestales Q6
Calor/frío extremo
Sequía 4 Terremoto 1 Inundación 2 Desprendimiento de tierras 6 COMPLETE Started: Tuesday, May 02, 2023 11:23:26 AM May 02, 2023 11:23:26 AM Last Modified: Last Modified: Tuesday, May 02, 2023 11:43:55 AM Tuesday, May 02, 2023 11:43:55 AM Time Spent: Time Spent: 00:20:28 00:20:28 IP Address: IP 207213 205 220 207.213.205.220 Page 1 1 response Share Link https://wwwsurveymonkeycom/res Tweet COPY Share Share ÷ w SIGN UP FREE
5
Licuefacción 7
Incendios forestales 3
Q7
Si hay algún peligro que le preocupe y que no aparece en la lista anterior, especifíquelo a continuación.
Respondent skipped this question
Q8
¿Se ha inscrito para recibir alertas de emergencia?
SÍ
Q9
¿Cómo prefiere recibir información de la Ciudad sobre cómo hacer su casa más segura y qué está haciendo la Ciudad para reducir los riesgos de catástrofe?(Marque todo lo que corresponda).
Sitio web de la ciudad (healdsburg.gov)
Redes sociales (Facebook, Instagram, Nextdoor)
Radio Periódico
Q10
¿En qué actividades de preparación ha participado usted o alguien de su familia? (Marque todas las que apliquen)
Asistió a reuniones o recibió información escrita sobre catástrofes naturales o preparación para emergencias
Elaborar un "Plan de Emergencia Familiar" para decidir qué haría cada uno en caso de catástrofe.
Ha recibido entrenamiento en primeros auxilios o reanimación cardiopulmonar (RCP) en el último año
Q11
¿Se encuentra su propiedad dentro o cerca de una zona inundable designada por la Agencia Federal para el Manejo de Emergencias (FEMA)? (Para averiguar si su propiedad se encuentra dentro o cerca de una zona inundable, visite el sitio de cartografía de llanuras inundables de Healdsburg, aquí, o el Centro de servicio de mapas de inundaciones de FEMA, aquí
SÍ
Q12
¿Tiene azeguranza contra inundaciones?
SÍ
Q13
¿Tiene azeguranza contra terremotos?
No
Q14
¿Qué modificaciones o prácticas de construcción, en su caso, ha realizado o utilizado para mitigar los riesgos sísmicos de su vivienda? (Marque todas las que apliquen )
Anclar librerías/armarios a la pared
Q15
¿Qué modificaciones o prácticas de construcción en su caso ha realizado o utilizado para mitigar
https://www.surveymonkey.com/results/SM-holVUUnvhNHnJlSBRw2rHQ_3D_3D/browse/
6/12/23, 4:00 PM Encuesta del Plan de Mitigación de Riesgos de la Ciudad de Healdsburg 2023 - Responses | SurveyMonkey
2/3
1 response Share Link COPY ÷ w SIGN UP FREE
¿Qué modificaciones o prácticas de construcción, en su caso, ha realizado o utilizado para mitigar los riesgos de inundación de su vivienda? (Marque todas las que apliquen.)
Respondent skipped this question
Q16
¿Qué modificaciones o prácticas de construcción, en su caso, ha realizado o utilizado para mitigar los riesgos de incendio forestal en su vivienda? (Marque todas las que apliquen.)
Elimine toda la vegetación inflamable a menos de 1.5 metros de las estructuras
Retire regularmente los residuos de los canalones
Podar los árboles para que estén al menos a 3 metros de las chimeneas, cortar las ramas de los árboles a menos de 2 metros del tejado
Eliminar las ramas bajas de los árboles para reducir la "escalera de incendios"
Mantenga una separación vertical y horizontal entre las plantas
Q17
¿Qué modificaciones, en su caso, ha realizado o utilizado para reducir el consumo de agua? (Marque todas las que apliquen )
Reduzca la duración de su ducha a cinco minutos o menos
Convierta su pasto en plantas y jardines resistentes a la sequía
Cierre la llave de agua mientras se cepilla los dientes, se afeita o lava los platos
Sustituye tu lavadora por una de carga frontal
Instalar un sistema de captación de lluvia para recoger el agua del tejado y utilizarla más adelante durante el año.
Q18
Por favor, clasifique el grado de preparación que cree que tiene su hogar para hacer frente a los probables efectos de los fenómenos naturales
55
Q19
¿Tiene alguna otra opinión, comentario o sugerencia para que el personal municipal lo tenga en cuenta?
Respondent skipped this question
Q20
Facilitar su información de contacto es totalmente opcional y no afectará a los resultados de esta encuesta Su información se mantendrá confidencial y sólo será utilizada por el personal de la ciudad en caso de que tenga preguntas o preocupaciones adicionales, o si tenemos más información que proporcionarle sobre asuntos cubiertos por esta encuesta
Respondent skipped this question
https://www.surveymonkey.com/results/SM-holVUUnvhNHnJlSBRw2rHQ_3D_3D/browse/

6/12/23, 4:00 PM Encuesta del Plan de Mitigación de Riesgos de la Ciudad de Healdsburg 2023 - Responses | SurveyMonkey
3/3
out our sample surveys and create your own now!
by
Check
Powered
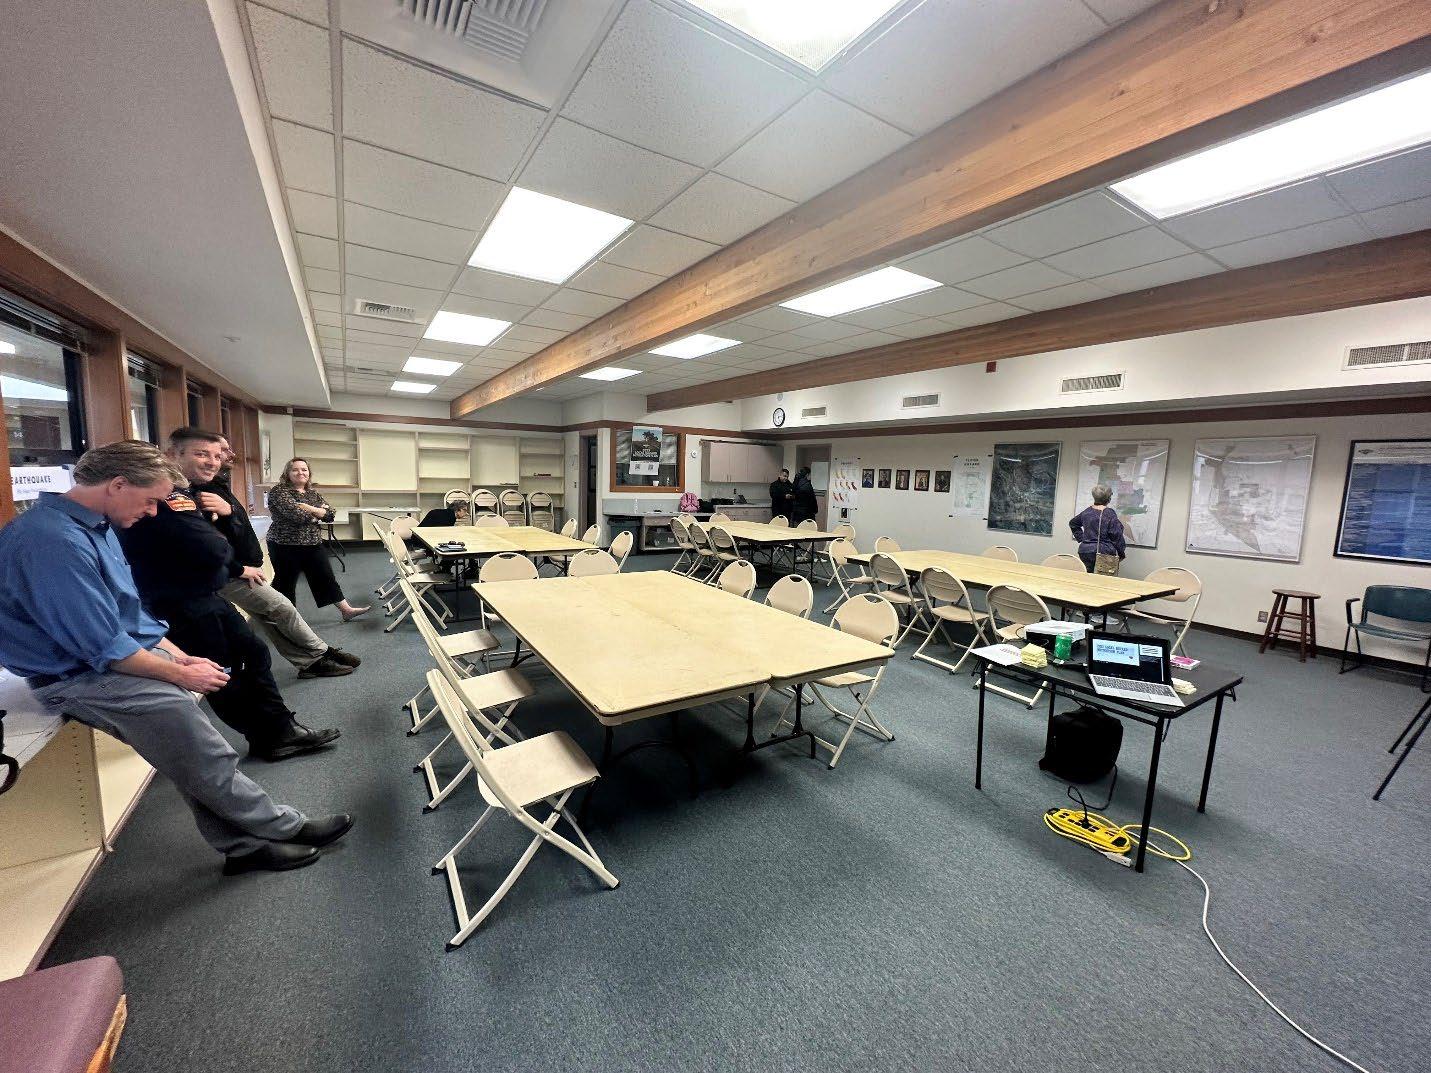
CommunityWorkshop
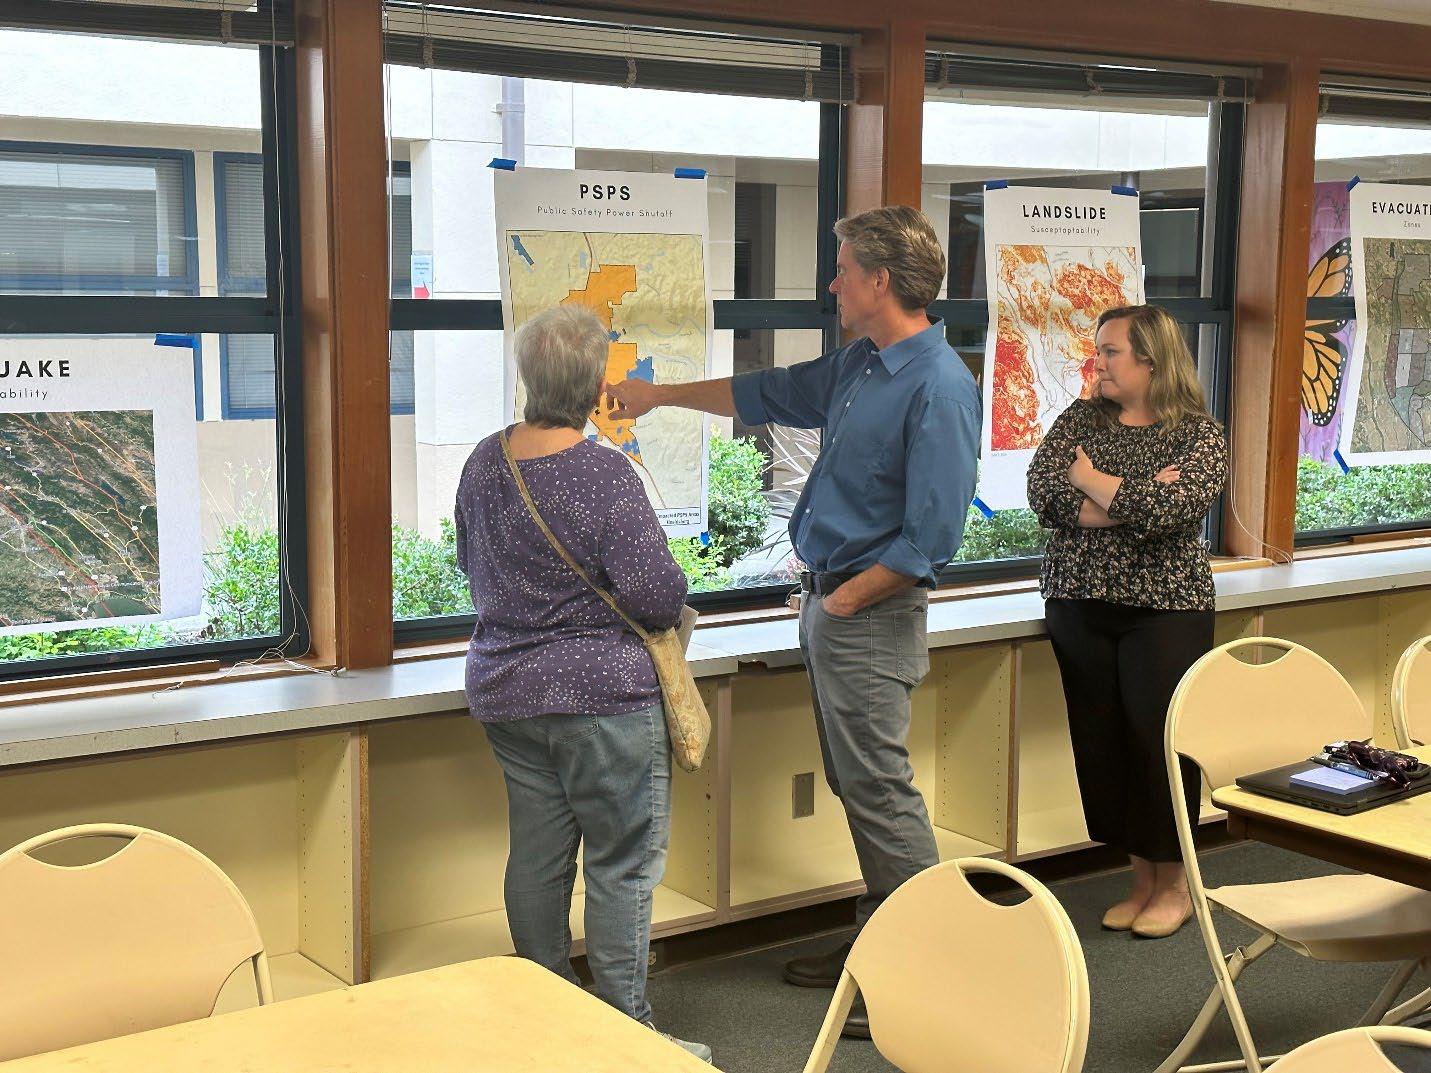
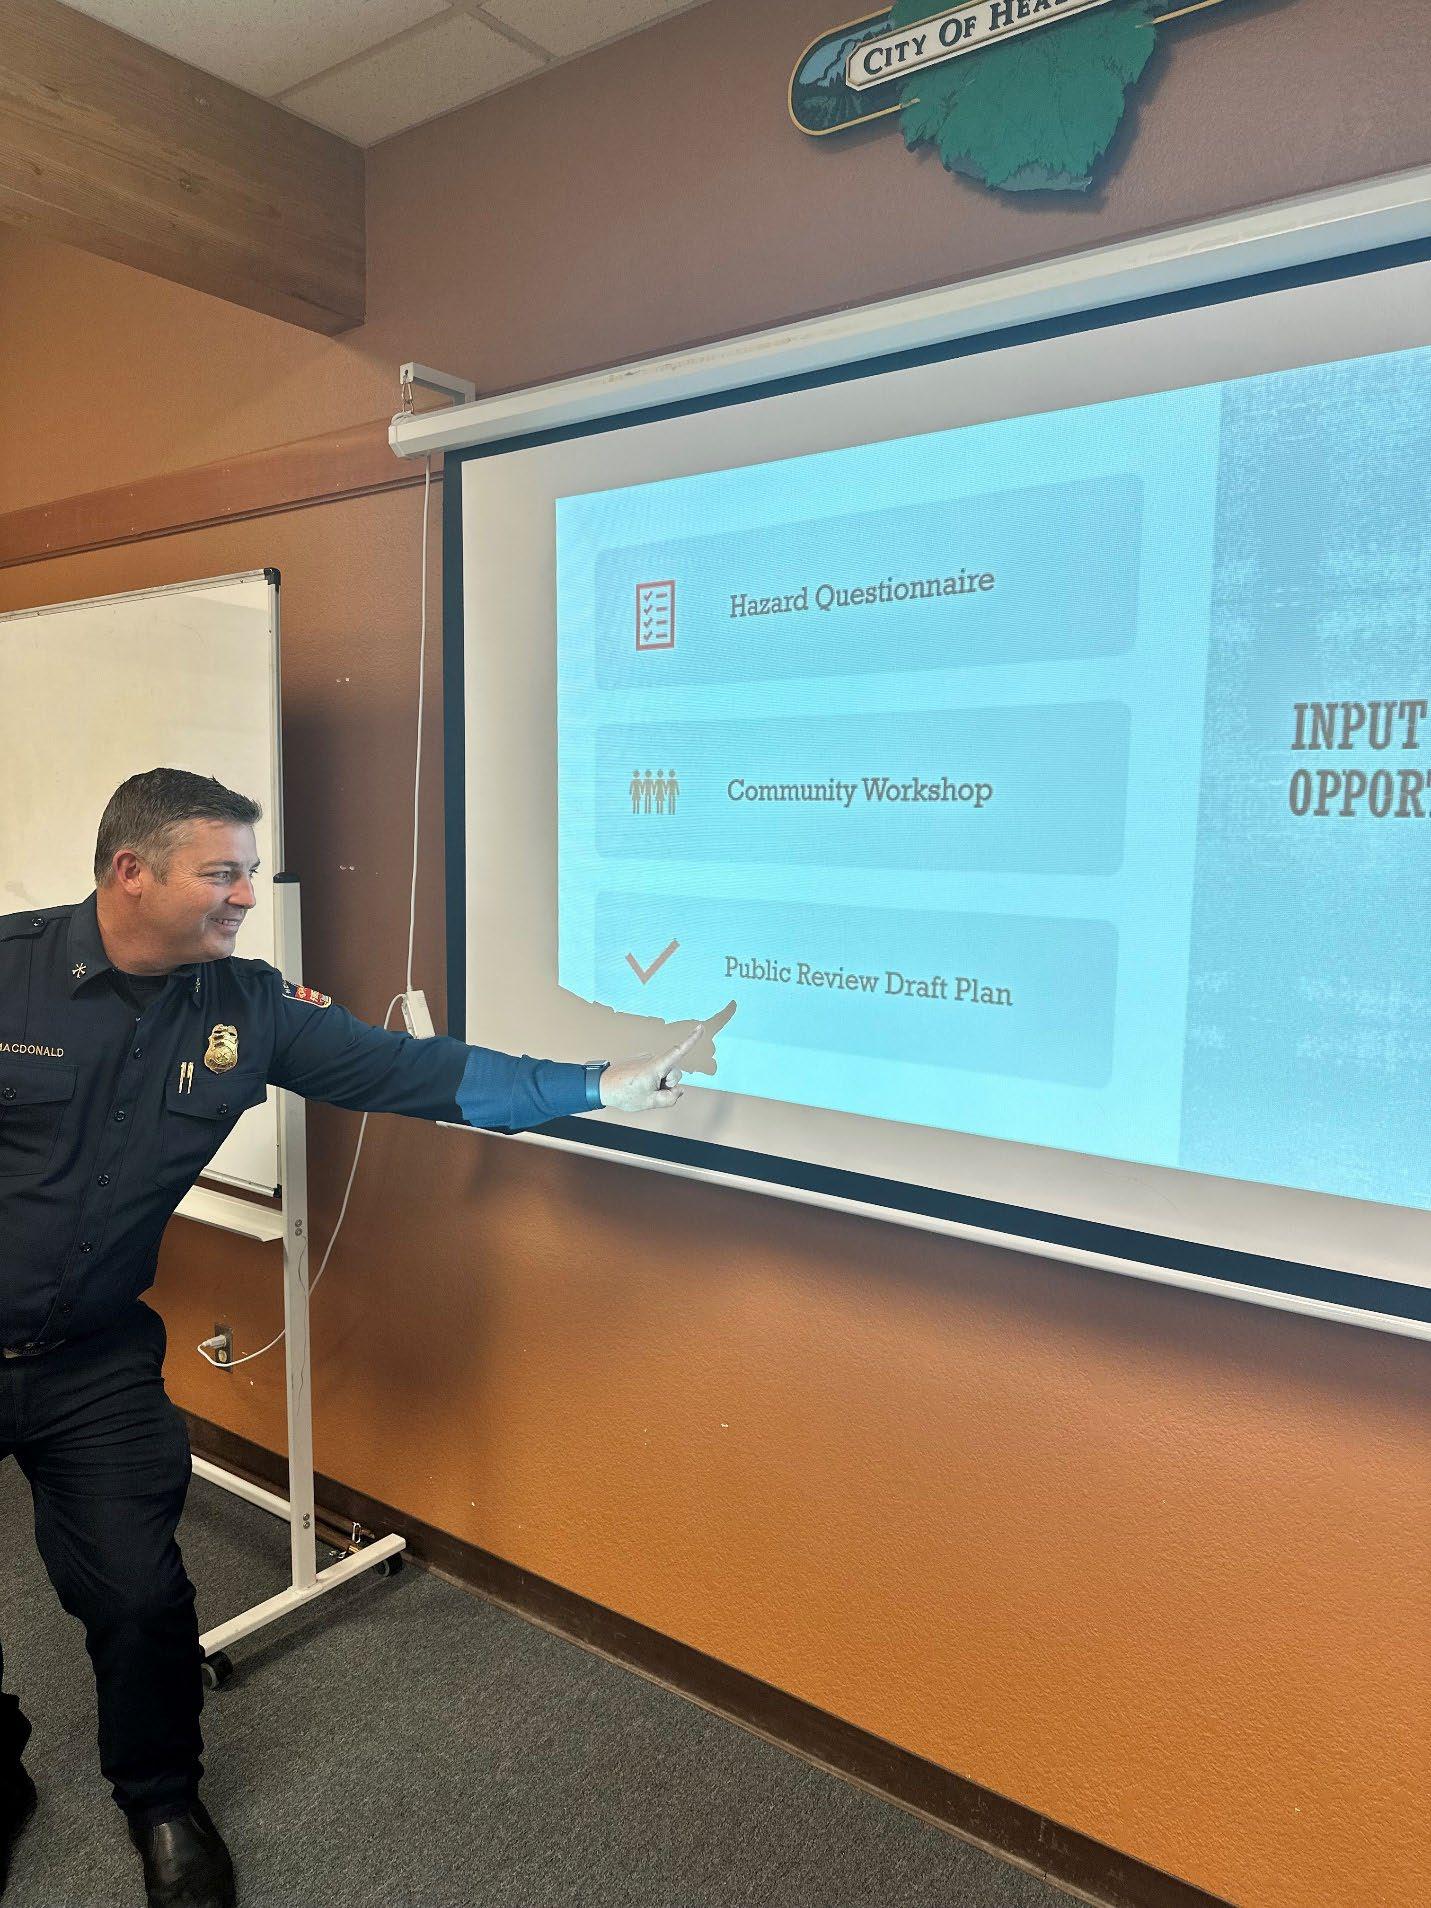
June 7th, 2023


Community Workshop
What is Hazard Mitigation?
•Sustained actions taken to reduce or eliminate long-term risk to life and property from hazards.
What is an LHMP?
•A plan based on a community’s values and needs
•An all-hazards look at community risk and vulnerability
•A process to develop of mitigation strategies and actions
Disaster Mitigation Act of 2000 (DMA 2000)
•Represents a shift toward mitigation
•Establishes funding requirements
•LHMP must be updated every 5 years

Creates a 5-year mitigation roadmap
Builds partnerships
Increases education and awareness

Contributes to a resilient community
Establishes funding priorities
Gains funding eligibility
Association of Bay Area Governments (ABAG) Regional HMP •2005 •2011 Healdsburg LHMP •2018 •2023 (Current Draft)
Replacement of the Healdsburg Bridge included seismicretrofits
Vegetation management/weed abatement programs

Curbs under construction at new roundabout have porousconcrete
Water mains have emergency connector hoses where theycross fault lines
City offers free energy audits to residential and commercialelectric customers
City offers free water saving items (such as toilet tankdisplacement bag, 1.5 gallon per minute showerhead)
Hazard Identification
Hazard Analysis

Assets Identification
Vulnerability Analysis


Capability Analysis

Mitigation Strategy

Introduction
Community Profile


Planning Process
Hazard Assessment
Vulnerabilities Assessment
Capabilities Assessment
Mitigation Strategy
Plan Implementation & Maintenance
References
Appendices


Drought
Earthquake

Landslide
Flood
PSPS
Severe Weather
Wildfire
Title Planning Team Member
Kelsey Carreiro
Allison Mattioli
Matt Jenkins
Jason Boaz
Lance Macdonald
Andrew Sturmfels
Patrick Fuss
Ellen McDowell
Tyler Kettmann
Curt Bates
Terry Crowley
Adam McKenna
Emergency Manager
Public Information Officer
Police Chief
Fire Chief
Fire Marshall
Assistant City Manager
Utilities Engineering Manager
Senior Planner
Central Services Manager
Principle Engineer
Utility Director
IT Manager
•Community Engagement Strategy
March 27th
April 10th
April 24th
May 15nd
June 7th
June 12th
Media Release
•Hazard Identification
•Capabilities Assessment Meeting #1
•Website

•Social Media
•Hazard Questionnaire


•Hazard Assessment
•Critical Facilities Meeting #2
•Capabilities Assessment
•Mitigation Strategy Meeting #3
•Hazard Assessment Results


Community Workshop
•Gather Community Feedback

•Close out Hazard Questionnaire


•Review Draft Plan Meeting #4

•Review Community Workshop Feedback


•Cal OES •FEMA Submit Plan
Hazard

Questionnaire


Community Workshop

Public Review Draft Plan


Questions
Comments

Concerns
Input


THANK YOU FOR ATTENDING!
This page intentionally left blank
Appendix C
Hazard & Vulnerability Figures
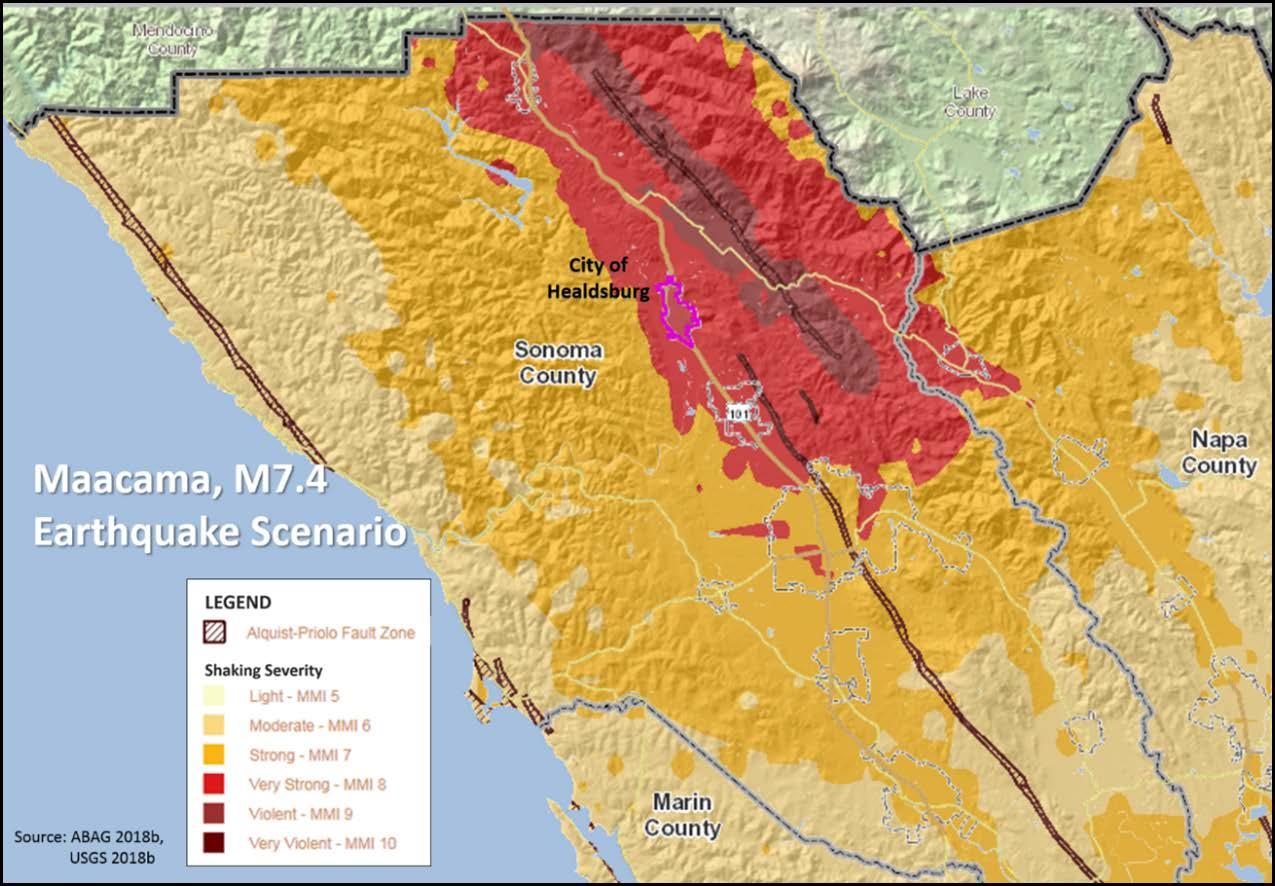
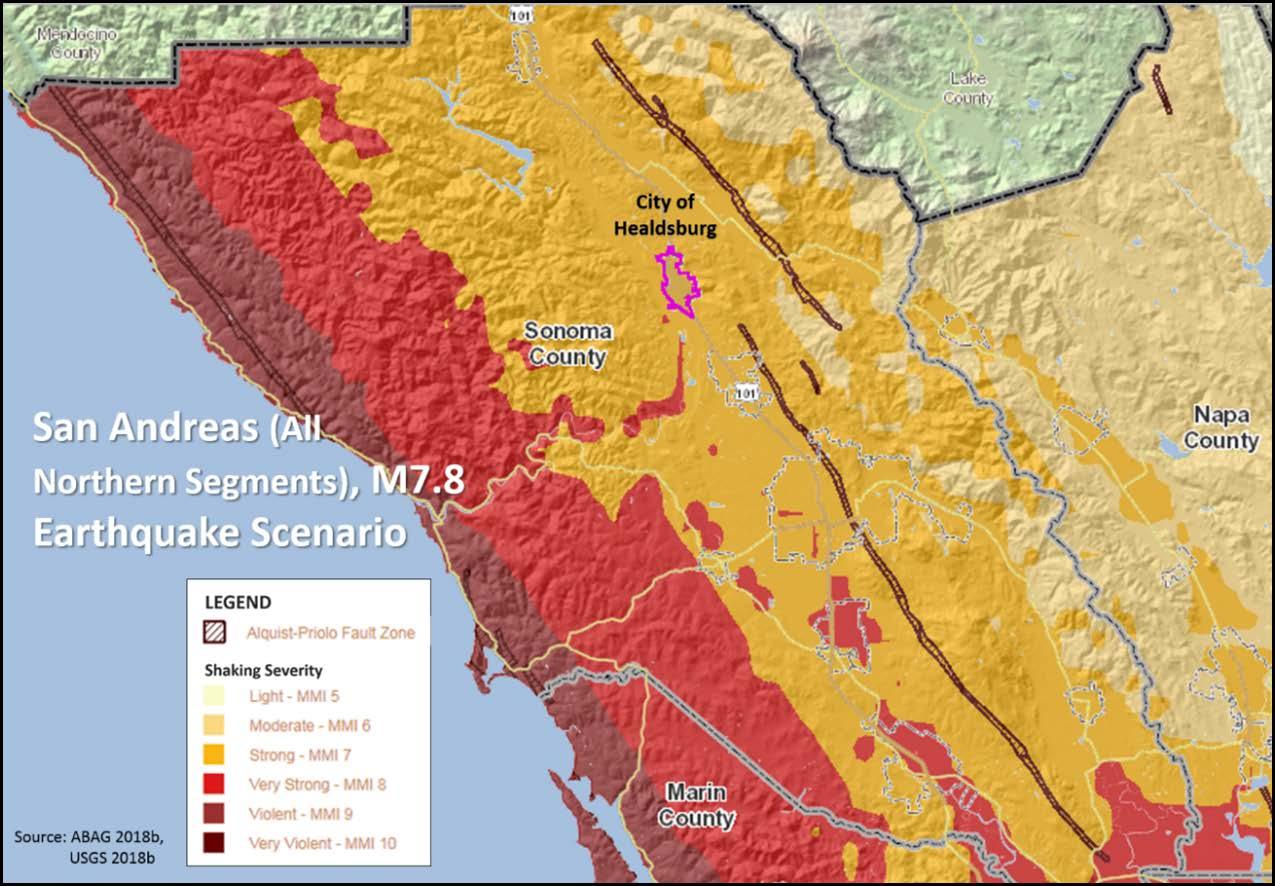
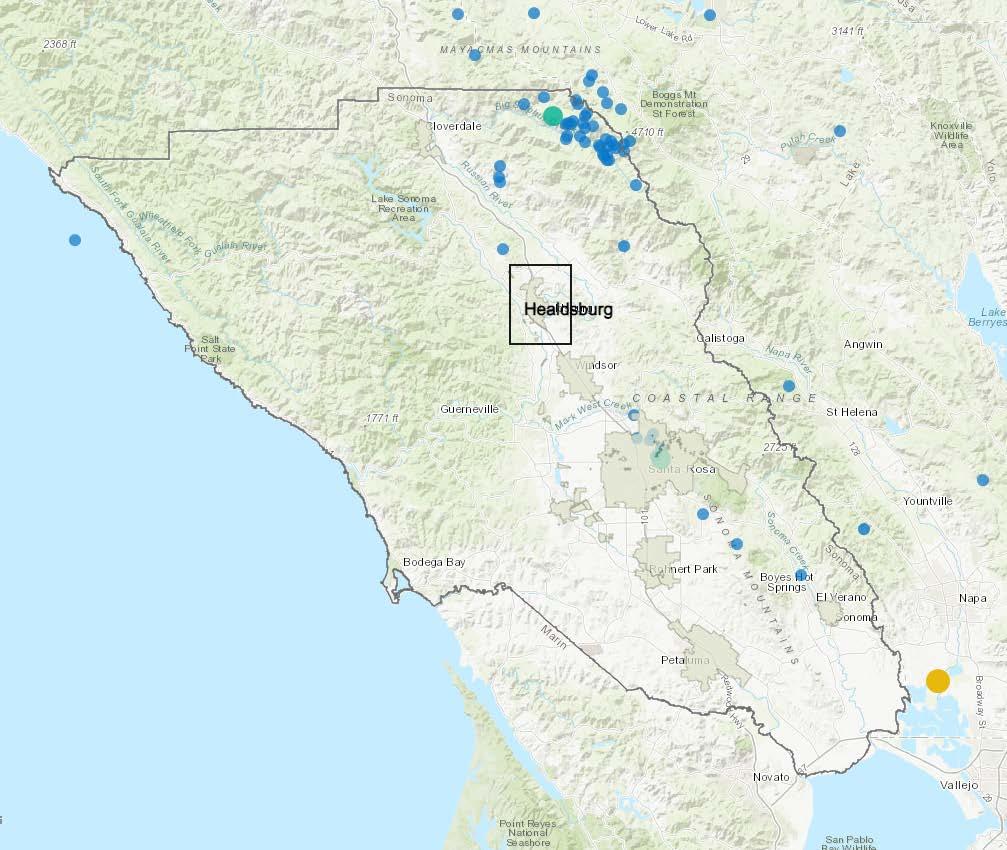
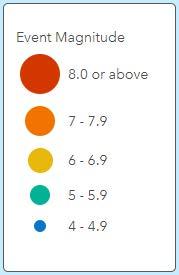

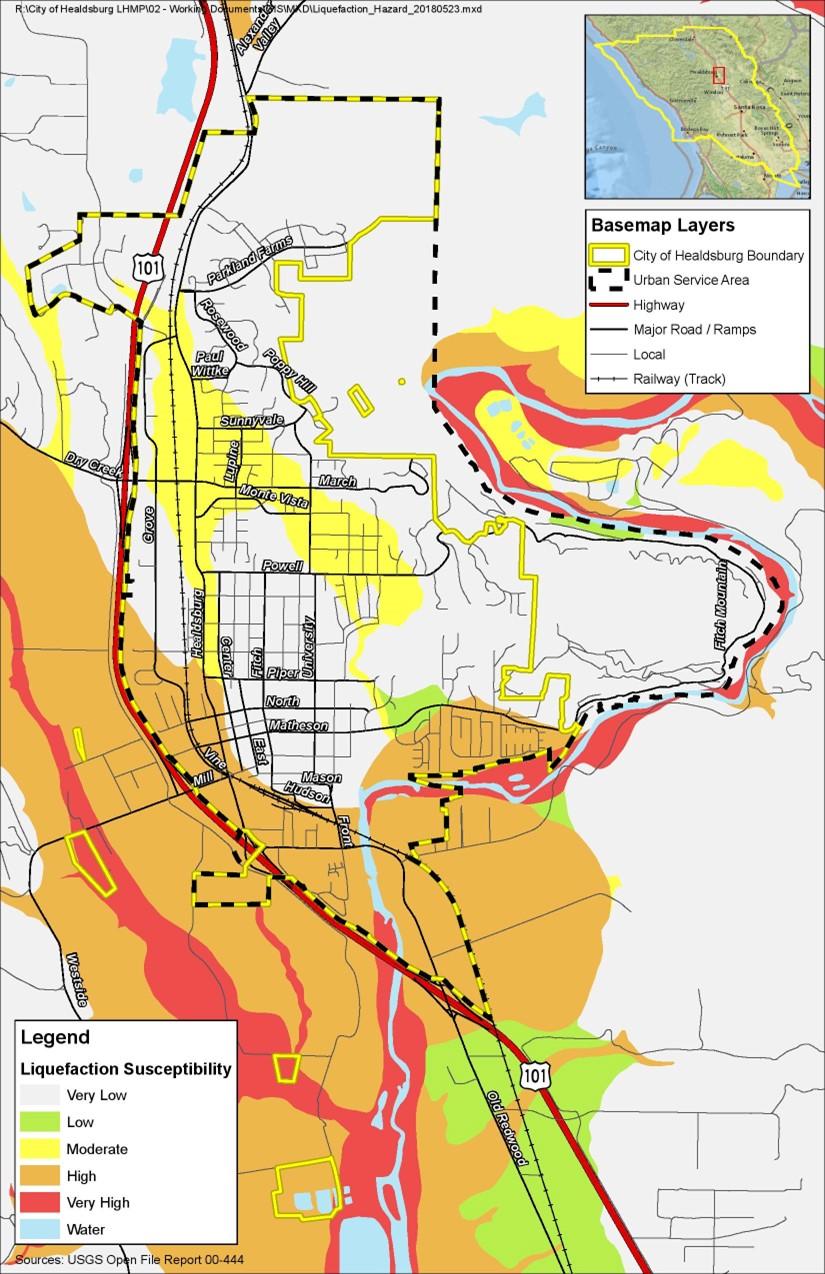
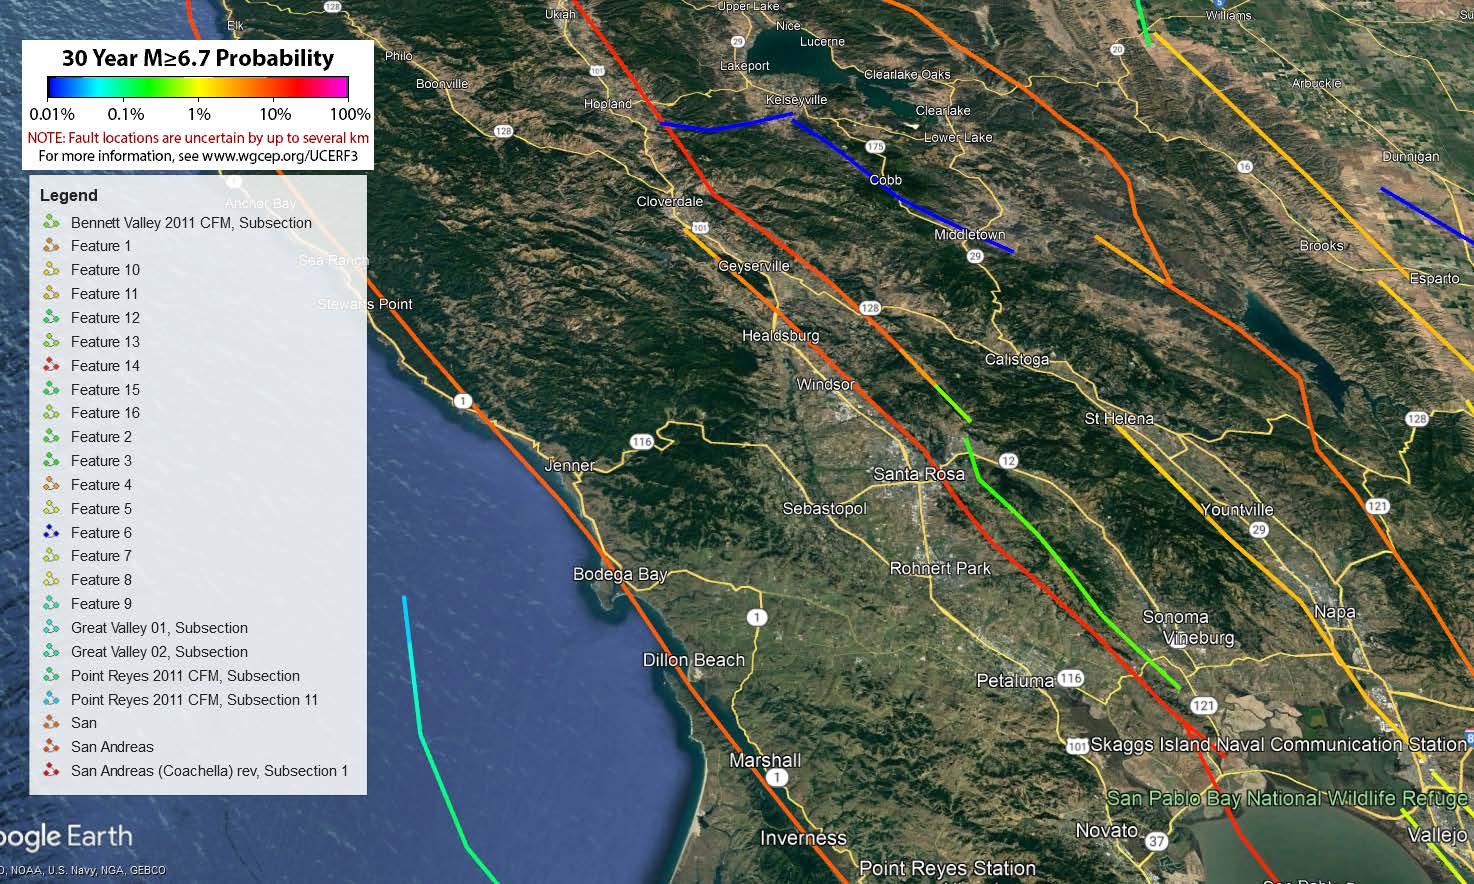
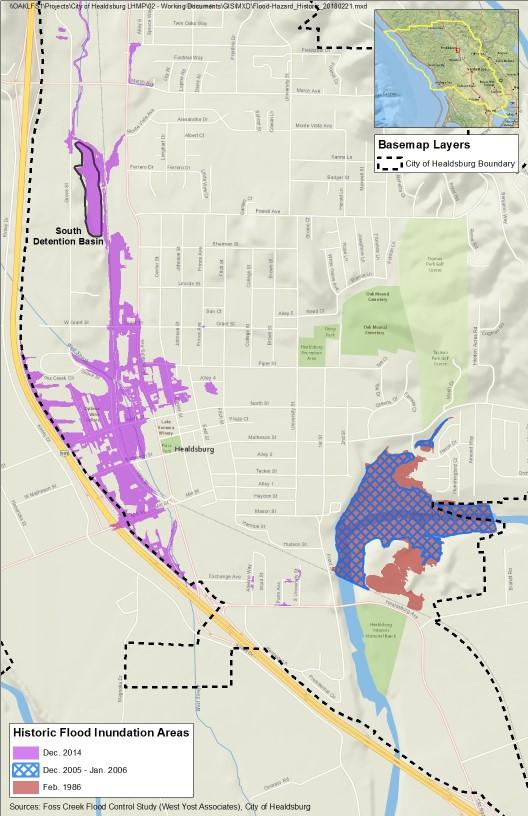
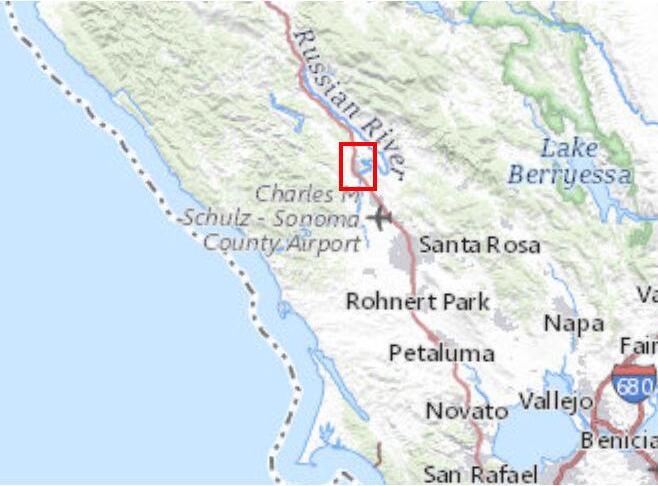
VineSt RosewoodDr H e a l d s b u r g A v e Westside Rd G r o v e S t Lytt on S prings Rd Alexander Valley Rd F i t c h S t Old Redwood Hwy Powell Ave North St U n i v e r s i t y S t Lytt on S tation R d W North St C e n t e r S t HealdsburgAve March Av e N Fitch Mountain Rd S unnyvale Dr S Fitch MountainRd East S t Monte Vista Ave F r ont S t MillSt Piper S t DryCreekRd PoppyHillDr Mason S t ParklandFarmsBlvd £ ¤ 101 £ ¤ 101 City of He aldsburg City of Hea lds burg Bound ary Urban Se rvice Area Ra ilway (Trac k) Stream/Riv er Lake/Pon d/Re servoir High way Ma jor Road/Ramps Local Flood Hazard FEMA Natio nal F loo d Hazard Layer 0.2% change of flooding in any given year 1% change of flooding in any given year
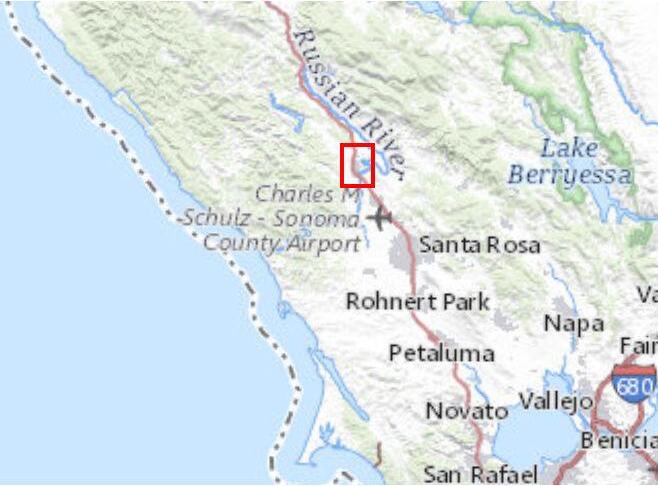
VineSt RosewoodDr H e a l d s b u r g A v e Westside Rd G r o v e S t Lytton Springs Rd Alexander Valley Rd F i t c h S t Old Redwood Hwy Powell Ave North St U n i v e r s i t y S t Lytton Station Rd WNorthSt C e n t e r S t HealdsburgAve March Ave N Fitch Mountain Rd Sunnyvale Dr S Fitch MountainRd East S t Monte Vista Ave F r ont S t MillSt Piper St DryCreekRd PoppyHillDr Mason St ParklandFarmsBlvd £ ¤ 101 £ ¤ 101 City of He aldsburg City of Hea lds burg Bound ary Urban Se rvice Area Ra ilway (Trac k) Stream/Riv er Lake/Pon d/Re servoir High way Ma jor Road/Ramps Local
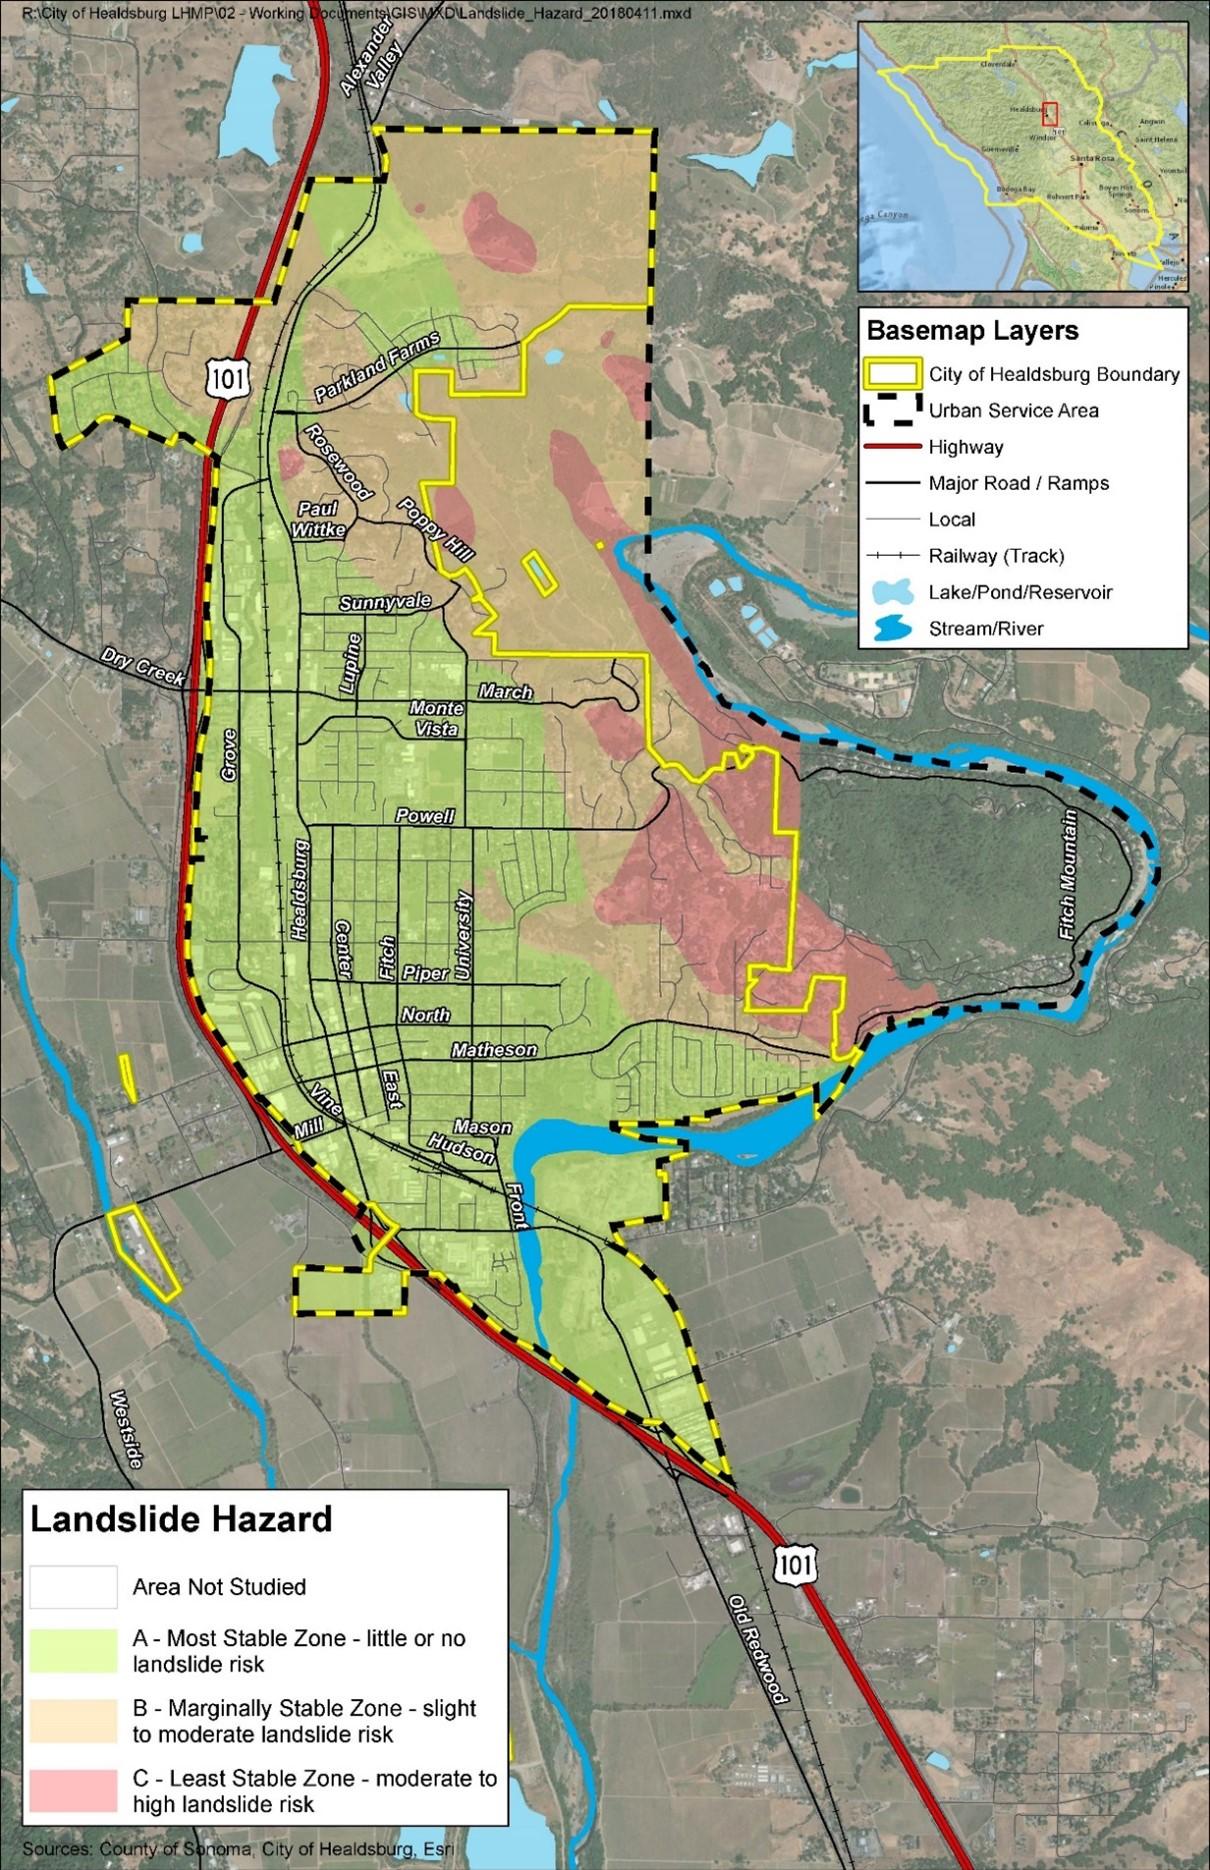
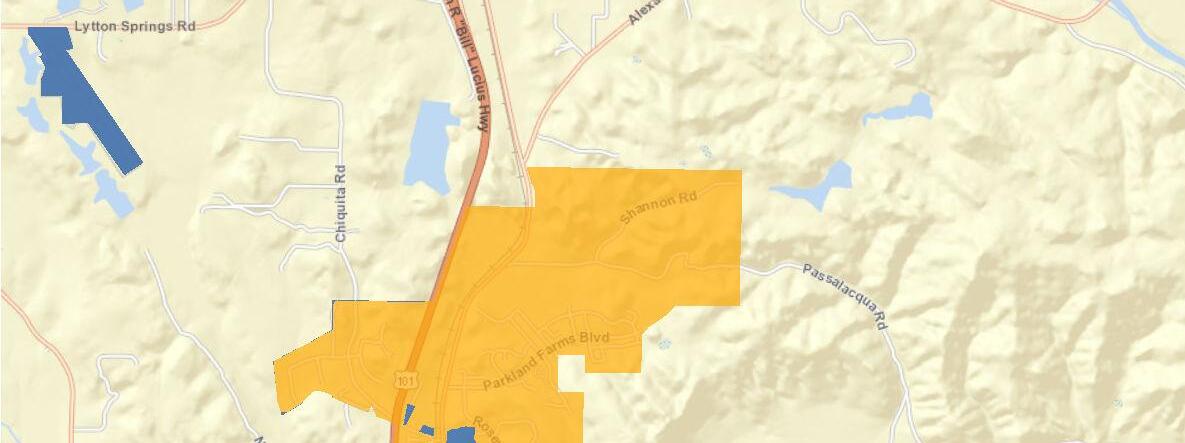
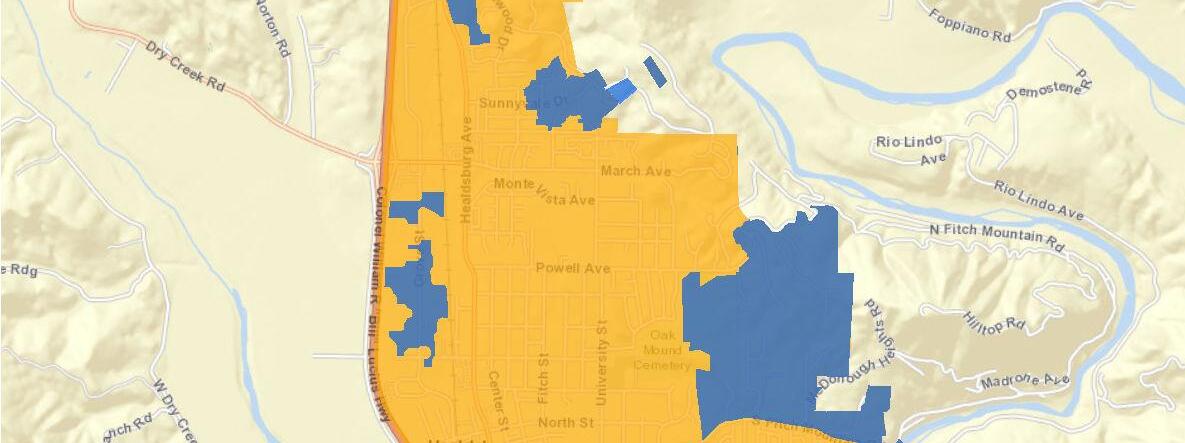
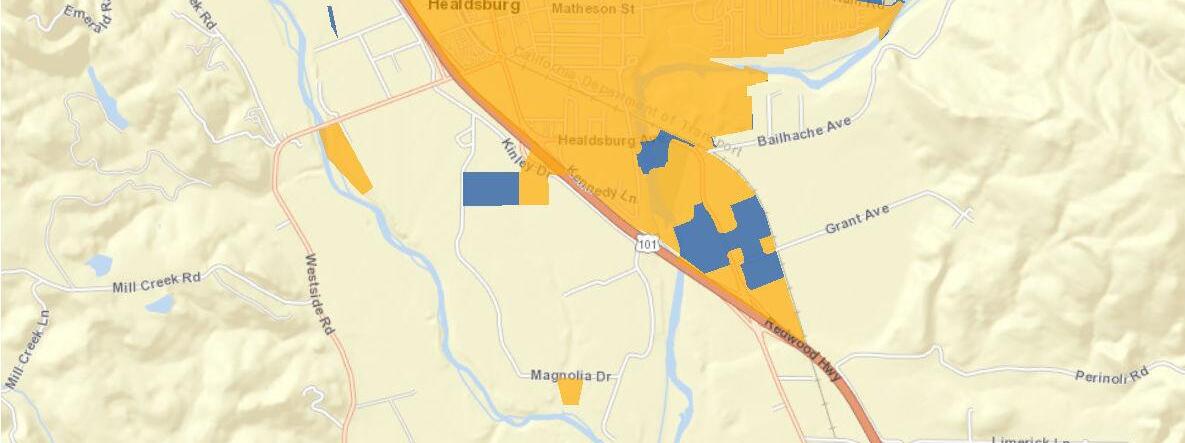

5/ 9/ 2023 Di s tr i b ut i on PS PS Tr a n sm is s io n PS P S Impacted P S PS Areas Healds burg (l o w er v o l ta ge t o cu s to m er s ) (h i g er v o l ta ge t o s ub s t at io n )
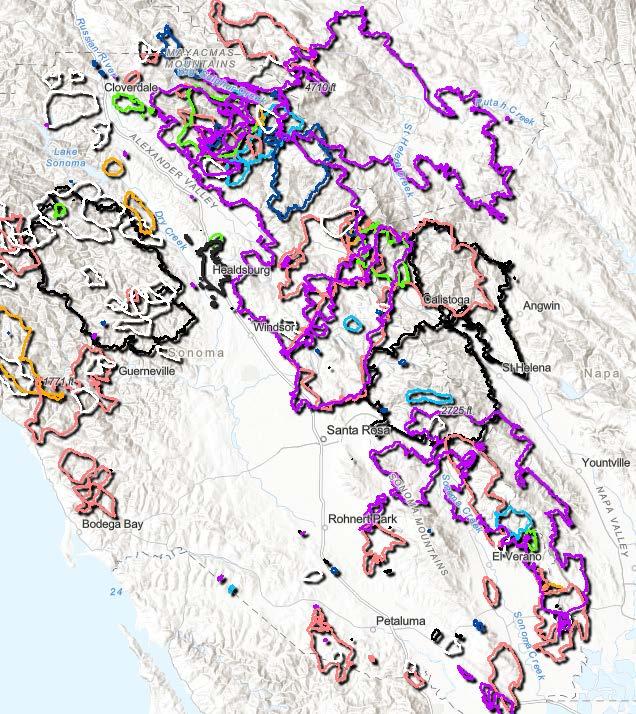
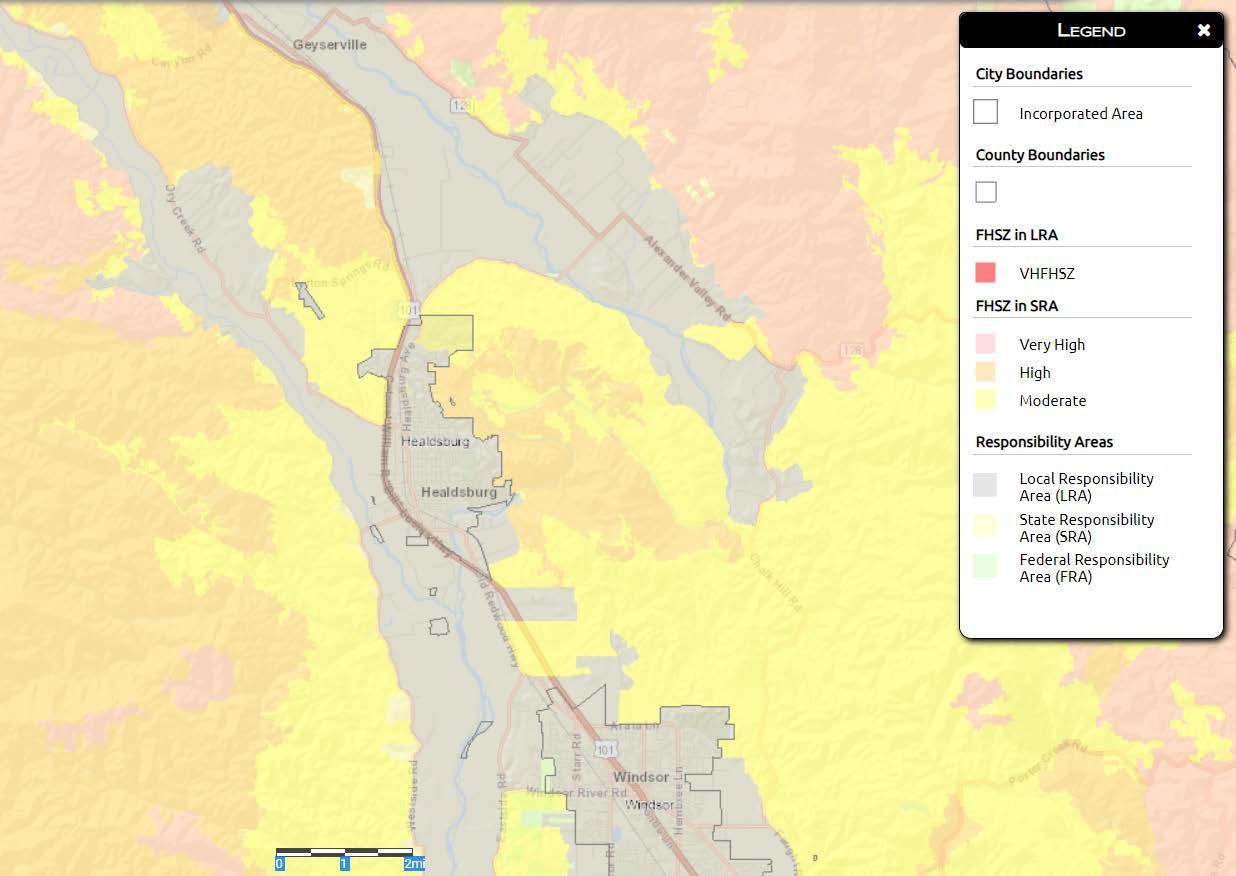
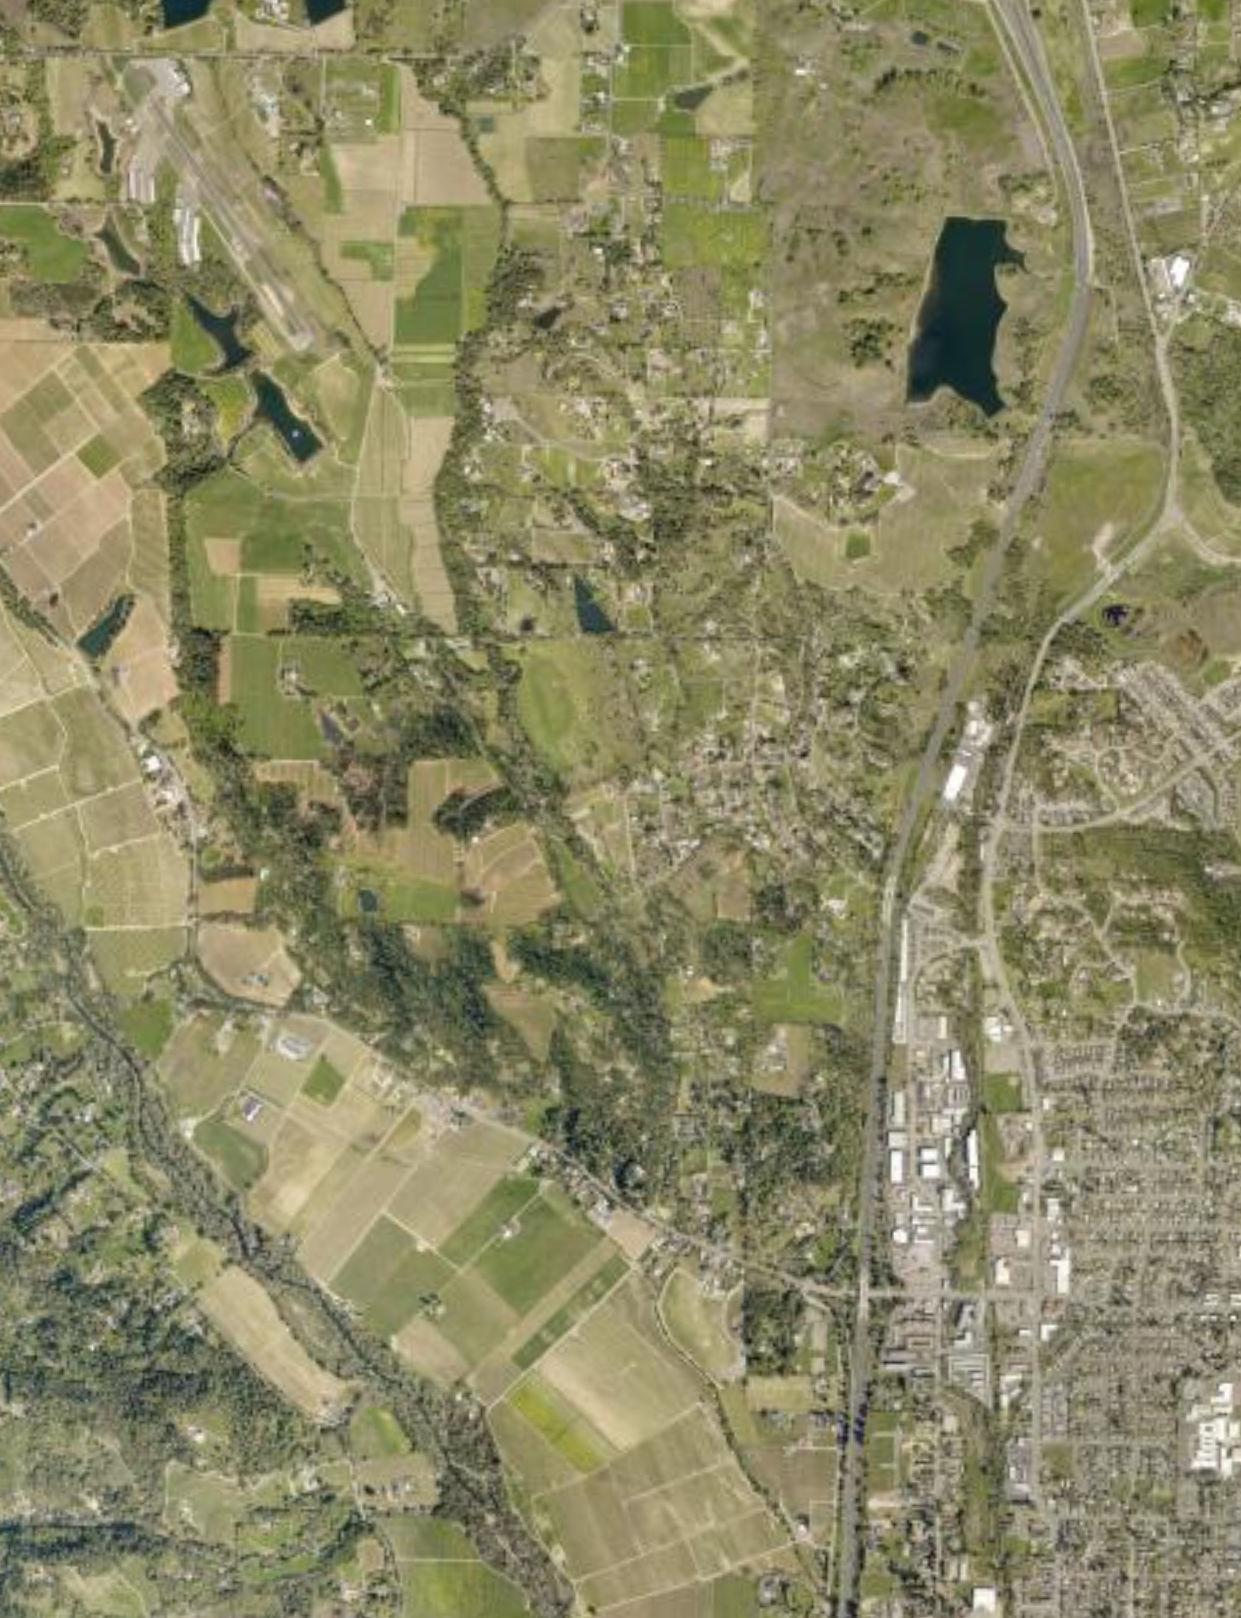
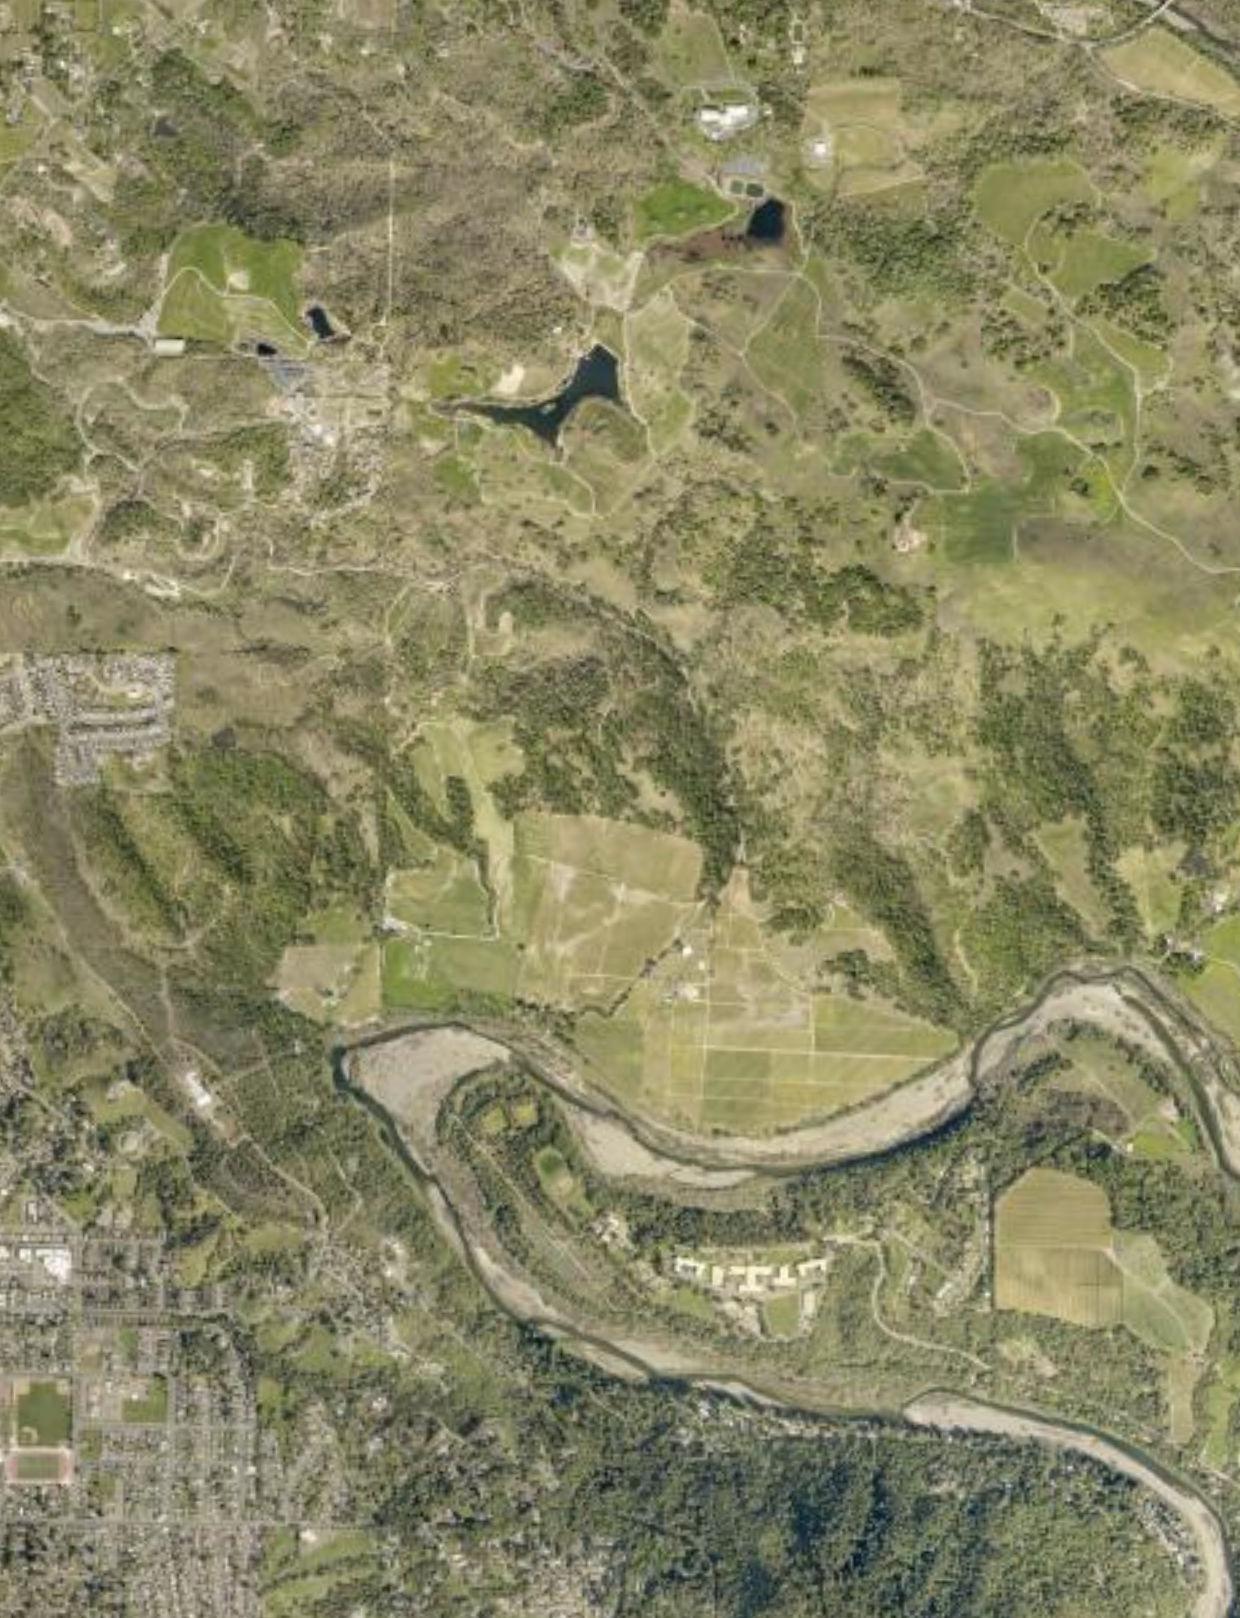
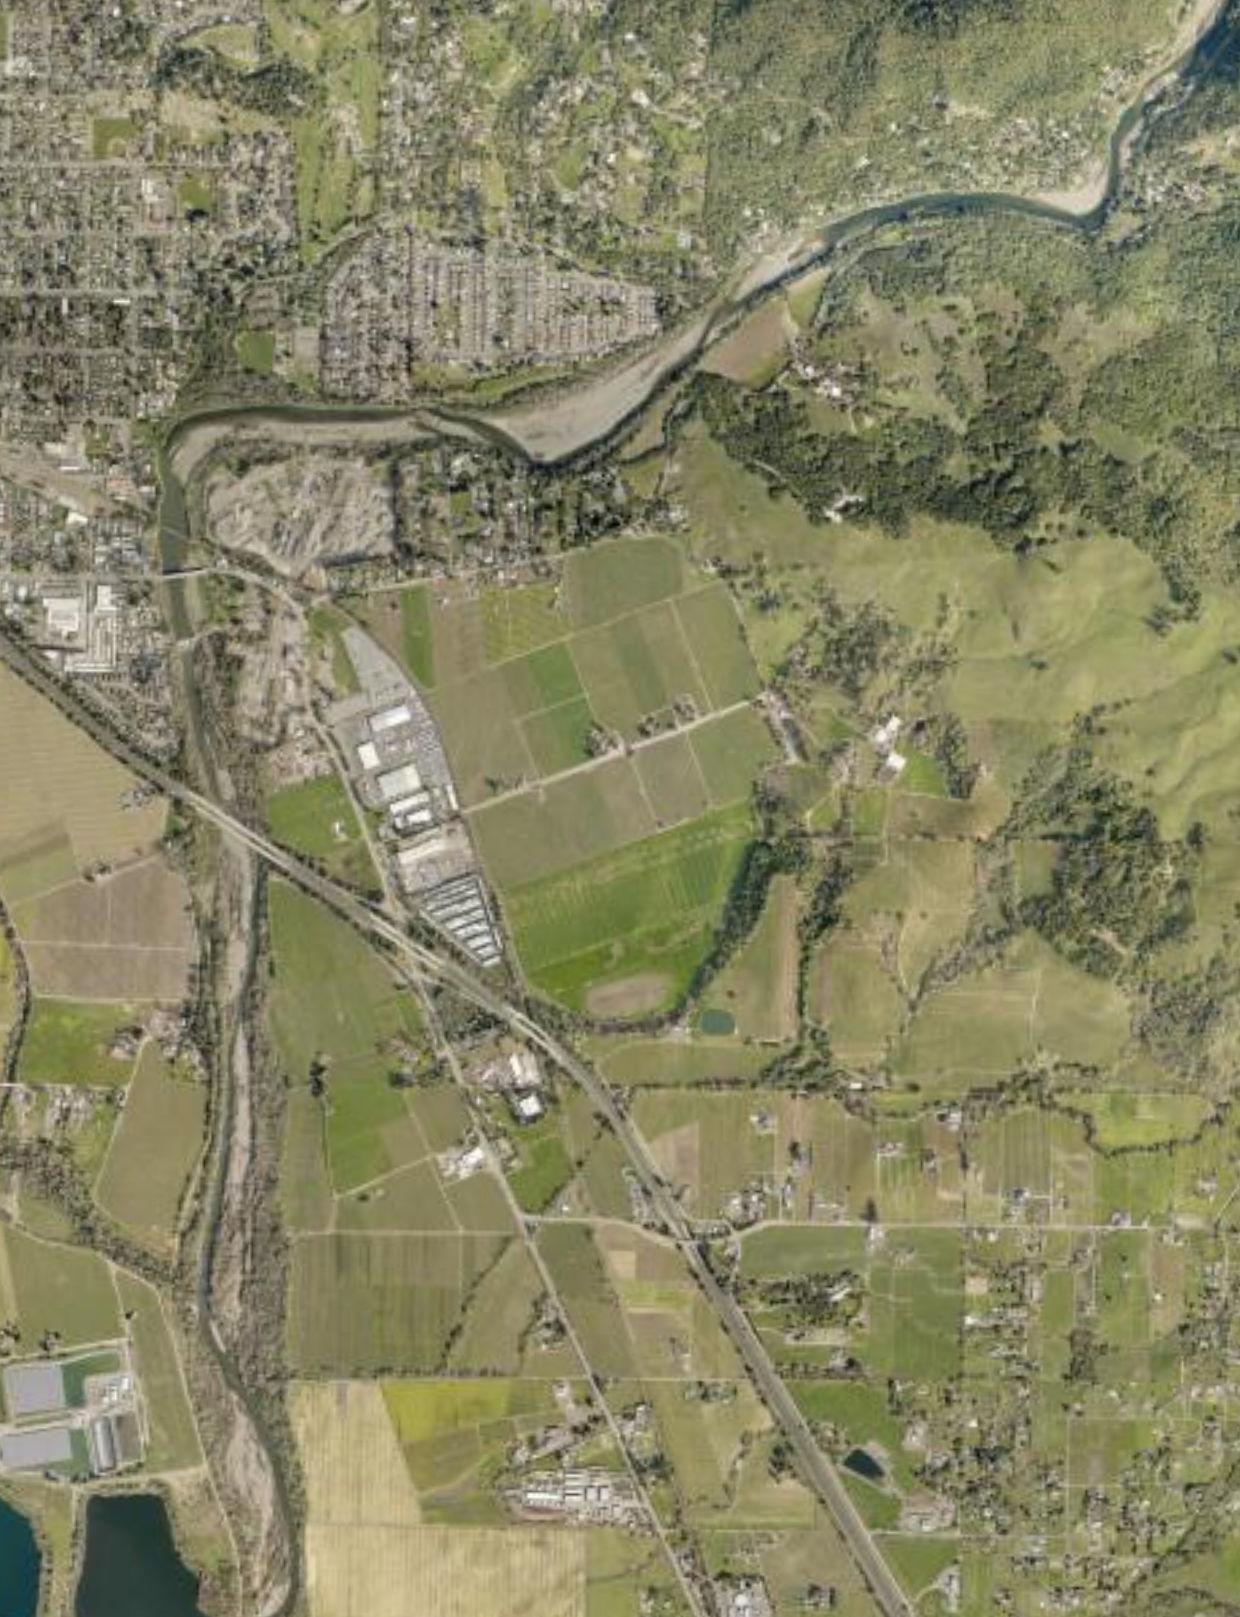
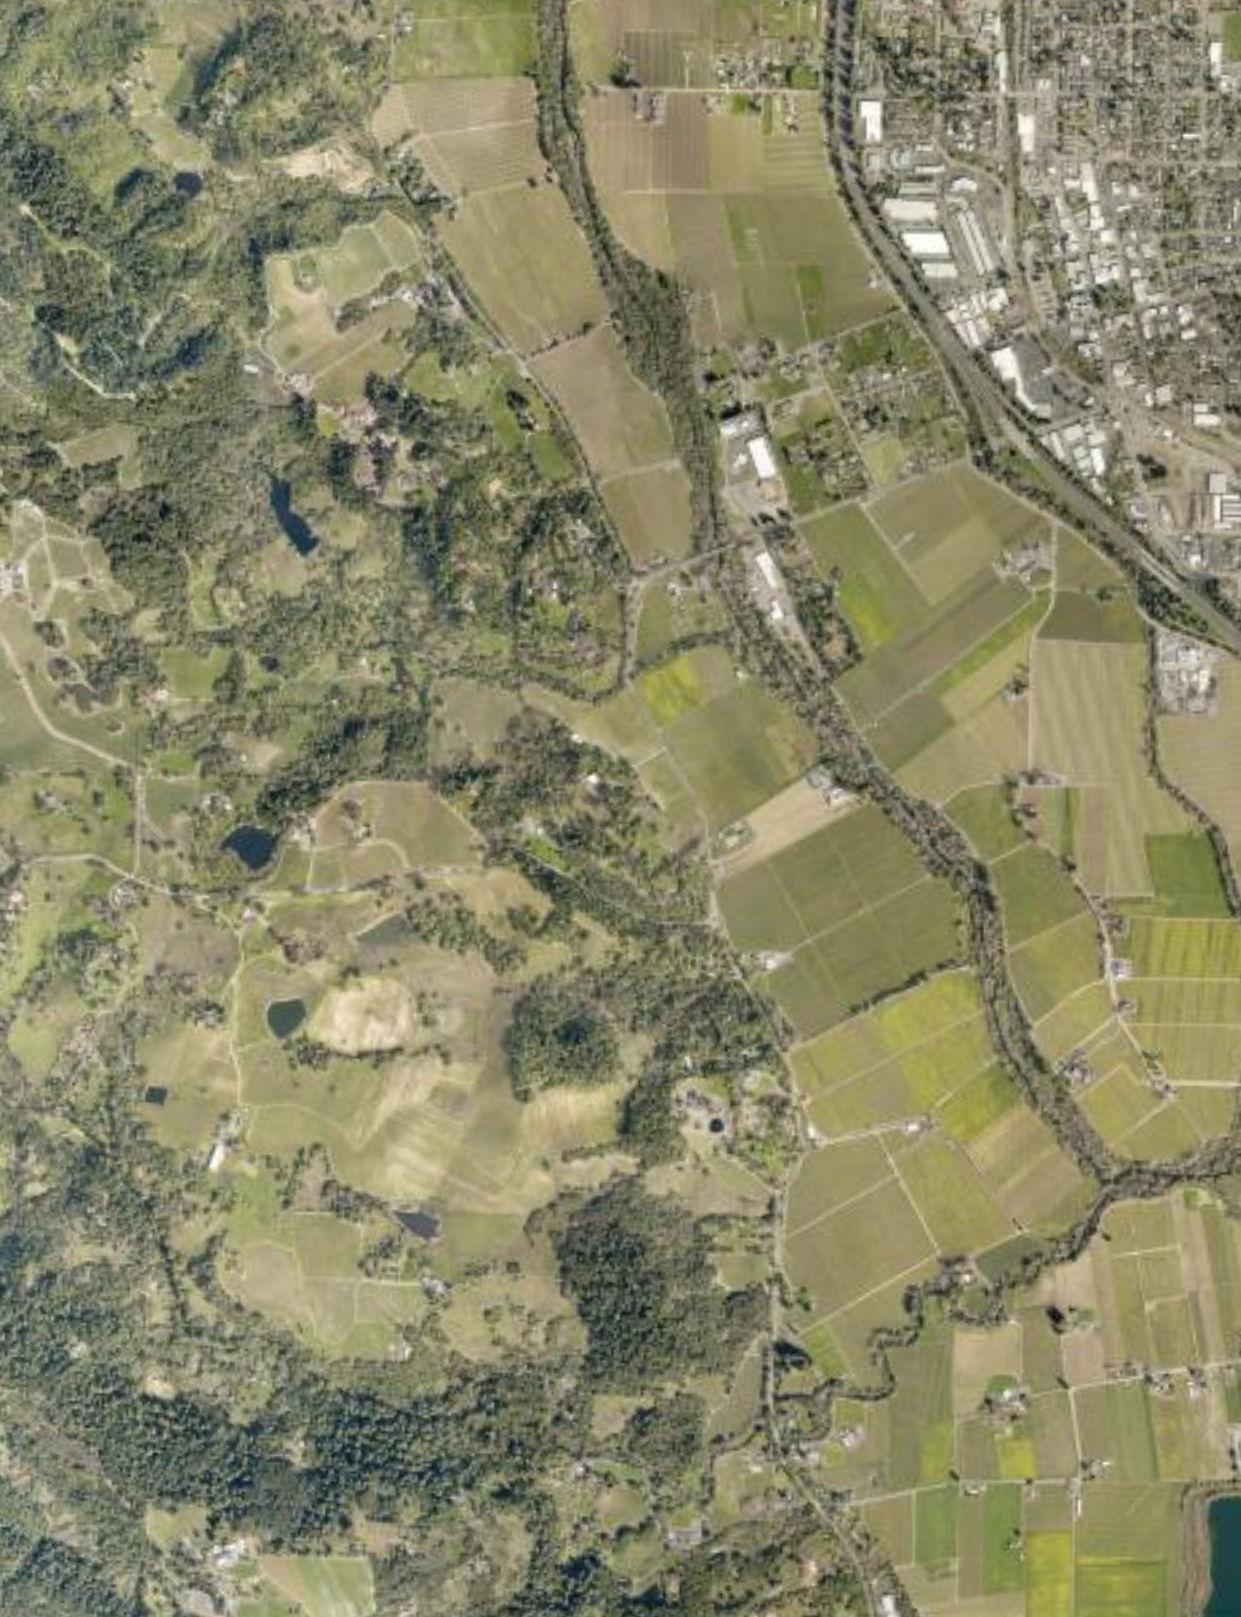
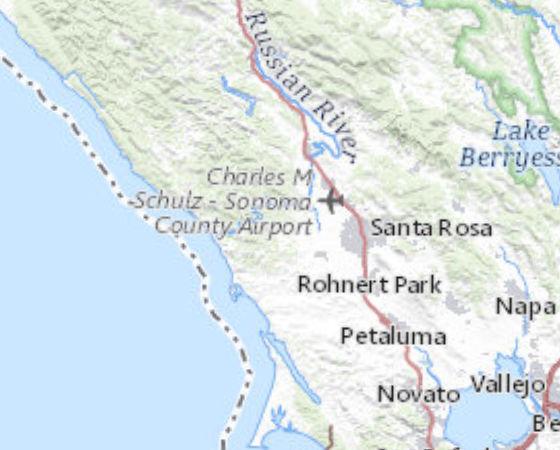
! ! ! ! ( ! ( ! ! ! ! ( ! !( ( ! ( ! ! ! ! ( ! ( ! ! ! ( ! ! ( ! ! ! ! ! ! ( ! ! ! ! ! ! ( ! ! ( ! ( ! ( ! ! ! 6 1 5 8 2 3 4 42 49 41 45 39 36 34 31 28 38 24 33 22 18 13 14 46 23 19 20 40 30 37 10 26 27 25 12 32 44 43 16 15 Grove St Kinley Dr WestsideRd Chiquita Rd D r yC reekRd PowellAve NF itchMoun ta inRd University St Hea l ds bu rgAve MathesonSt MarchAve University Ave SF itchMoun ta inRd OldRedwoodHwy V ineS t A lex Mad roneAve BailhacheAve First St FrontSt ScenicLn MillSt WDryCreekRd OakS t Park landFarmsB lvd AllanCt B en jam inW a y CemeteryLn Hasse tRd WGrantSt R iverv iewD r Reisling Ln Cali Ln MasonSt Park landFarmsB lvd Healdsburg Ave H eal dsbu r gAve Hwy OldRedwoodHwy £ ¤ 101 £ ¤101 1 AllianceMedicalClinic 2 BadgerElectricSubstation 3 CadoulReservoir 4 ChablisLiftStation 5 CityHall 6 CorporationYard 7 DataCenterInfrastructure 8 DryCreekWellField 9 ElectricalDistributionSystem 10 FireStation 11 FireSubstaion 12 FitchMountainWellField 13 GauntlettCommnuicationsTower 14 GauntlettWellField 15 GauntlettWellFieldControlStation 16 Gauntlett/FitchWaterTreatmentPlant 17 Gauntlett/IversonReservoir 18 HealdsburgAvenueBridge 19 HealdsburgCommunityCenter 20 HealdsburgHospital 21 HealdsburgMunicipalAirport 22 HendricksLiftStation 23 HeronDriveLiftStation 24 Highway101Bridge 25 KennedyLaneLiftStation 26 KinleyDriveLiftstation 27 MagnoliaDriveLiftStation 28 McDonoughPumpStation 29 Network/TelecomInfrastructure 30 NorthDetentionBasin 31 NorthStreetPressureReducingStation 32 OrangewoodLiftStation 33 OrchardLiftStation 34 PanoramaPressureReducingStation 35 PanoramaWaterFacilities 36 PassalacquaPumpStation 37 PoliceStation 38 RecycledWaterBridge 39 Revel/HiddenAcresPressureReducingStation 40 SeniorCenter 41 SouthDetentionBasin 42 FitchWellFieldControlBuilding 43 SunsetReservoir 44 TaymanReservoirs 45 VillaPressureReducingStation 46 WaterReclamationFacility 47 WaterDistributionSystem 48 WastewaterCollectionSystem 49 WindingCreekLiftStation NumberCriticalFacility CriticalFacilities ! Airport ! Bridge ! Community ! ( Electrical ! Government ! Health/Hospital ! Police/Fire ! ( SewageUtility ! Stormwater ! WastewaterUtility ! WaterUtility Railway(Track) UrbanServiceArea CityofHealdsburgBoundary
This page intentionally left blank
Appendix D Planning Maintenance Forms
Mitigation Project Progress Report (Page 1)
Summary of Progress of Project for this Reporting Period
1. What was accomplished during this reporting period?
2. What obstacles, problems, or delays did the project encounter, if any?
3. How were the problems resolved?
Appendix D Plan Maintenance Forms City of Healdsburg 2018 LHMP D-1
Progress Report Period From (date): To (date): Project Title: Project ID: Description of Project: Implementing Agency: Supporting Agencies: Contact Name: Contact E-mail: Contact Number: Grant/Finance Administrator: Total Project Cost: Anticipated Cost Overun/Underrun: Date of Project Approval: Project Start Date: Anticipated Completion Date:
Mitigation Project Progress Report (Page 2)
Project Status
Project Cost Status
Appendix D Plan Maintenance Forms D-2 City of Healdsburg 2018 LHMP
Milestones Complete Project Date of Completion Plan Goal Addressed: Goal: Indicator of Success:
Project on Schedule Cost Unchanged Project Completed Cost Overrun* Project Delayed* *explain: *explain: Cost Underrun* Project Canceled *explain:
PLANNING PROCESS
Annual Review Questionnaire
Are there internal or external organizations and agencies that have been invaluable to the plan update process or to implementing a mitigation project?
Are there procedures (e.g., meeting announcements, plan updates) that can be done differently or more efficiently?
Has the Planning Team undertaken any public outreach activities regarding the LHMP or a mitigation project?
Has any natural and/or human-caused disaster occurred in this reporting period?
HAZARD ANALYSIS
Are there any natural and/or human-caused hazards that have not been addressed in this LHMP and should be?
Are new maps, reports, or studies available? If so, what are they and what have they revealed?
Do any new assets need to be included?
VULNERABILITY ANALYSIS
Have there been changes in development trends that could create additional risks?
CAPABILITY ASSESSMENT
MITIGATION STRATEGY
Are there different or additional resources (financial, technical, and human) that are now available for mitigation planning?
Should new mitigation actions be added? Should any existing mitigation actions be deleted?
Appendix D Plan Maintenance Forms City of Healdsburg 2018 LHMP D-3
LHMP Section Questions Yes No Comments
This page intentionally left blank
Appendix E Adoption Resolution
Adoption Resolution to be inserted once obtained.
This page intentionally left blank
Appendix F FEMA Documentation
Local Hazard Mitigation Plan Review Tool
REGION IX LOCAL HAZARD MITIGATION PLAN REVIEW TOOL
Updated 12/4/2019
The Local Hazard Mitigation Plan Review Tool demonstrates how the Local Hazard Mitigation Plan meets the regulation in 44 CFR §201.6 and offers State and FEMA Mitigation Planners an opportunity to provide feedback to the community.
• The Regulation Checklist provides a summary of FEMA’s evaluation of whether the plan has addressed all requirements.
• The Plan Assessment identifies the plan’s strengths as well as documents areas for future improvement. This section also includes a list of resources for implementation of the plan.
• The Multi-Jurisdiction Summary Sheet is a mandatory worksheet for multi-jurisdictional plans that is used to document which jurisdictions are eligible to adopt the plan.
• The Hazard Identification and Risk Assessment Matrix is a tool for plan reviewers to identify if all components of Element B are met.
Jurisdiction: City of Healdsburg
Title of Plan: Local Hazard Mitigation Plan
Local Point of Contact: Kelsey Carreiro Address: 238 Center Street Healdsburg, CA 95448
Title: Emergency Manager
Agency:
Police Department
Phone Number: 707-955-6362
Date of Plan: 2023
E-Mail: Kcarreiro@healdsburg.gov
State Reviewer: Title: Date:
Date Received at State Agency
Date Sent to FEMA
FEMA Reviewer: Title: Date:
Date Received in FEMA Region IX
Date Not Approved
Date Approvable Pending Adoption
Date Approved
FEMA Region IX Local Hazard Mitigation Plan Review Tool 1
SECTION 1: REGULATION CHECKLIST
INSTRUCTIONS: The Regulation Checklist must be completed by FEMA. The purpose of the Checklist is to identify the location of relevant or applicable content in the plan by element/subelement and to determine if each requirement has been ‘Met’ or ‘Not Met.’ The ‘Required Revisions’ summary at the bottom of each element must be completed by FEMA to provide a clear explanation of the revisions that are required for plan approval. Required revisions must be explained for each plan sub-element that is ‘Not Met.’ Sub-elements should be referenced in each summary by using the appropriate numbers (A1, B3, etc.), where applicable. Requirements for each Element and sub-element are described in detail in the Local Plan Review Guide in Section 4, Regulation Checklist.
1. REGULATION CHECKLIST
Regulation (44 CFR 201.6 Local Mitigation Plans)
ELEMENT A. PLANNING PROCESS
A1. Does the plan document the planning process, including how it was prepared and who was involved in the process for each jurisdiction? (Requirement §201.6(c)(1))
a. Does the plan provide documentation of how the plan was prepared? This documentation must include the schedule or timeframe and activities that made up the plan’s development as well as who was involved.
b. Does the plan list the jurisdiction(s) participating in the plan that are seeking approval?
c. Does the plan identify who represented each jurisdiction? (At a minimum, it must identify the jurisdiction represented and the person’s position or title and agency within the jurisdiction.)
3.1
3.1
A2. Does the plan document an opportunity for neighboring communities, local and regional agencies involved in hazard mitigation activities, agencies that have the authority to regulate development as well as other interests to be involved in the planning process? (Requirement §201.6(b)(2))
a. Does the plan document an opportunity for neighboring communities, local, and regional agencies involved in hazard mitigation activities, agencies that have the authority to regulate development, as well as other interested parties to be involved in the planning process?
b. Does the plan identify how the stakeholders were invited to participate in the process?
3.2
3.2
2 FEMA Region IX Local Mitigation Plan Review Tool
Location in Plan (section and/or page number) Met Not Met
Section 3
1.
A3. Does the plan document how the public was involved in the planning process during the drafting stage? (Requirement §201.6(b)(1))
a. Does the plan document how the public was given the opportunity to be involved in the planning process?
b. Does the plan document how the public’s feedback was incorporated into the plan?
A4. Does the plan describe the review and incorporation of existing plans, studies, reports, and technical information? (Requirement §201.6(b)(3))
A5. Is there discussion of how the community(ies) will continue public participation in the plan maintenance process? (Requirement §201.6(c)(4)(iii))
A6. Is there a description of the method and schedule for keeping the plan current (monitoring, evaluating and updating the mitigation plan within a 5year cycle)? (Requirement §201.6(c)(4)(i))
a. Does the plan identify how, when, and by whom the plan will be monitored (how will implementation be tracked) over time?
b. Does the plan identify how, when, and by whom the plan will be evaluated (assessing the effectiveness of the plan at achieving stated purpose and goals) over time?
c. Does the plan identify how, when, and by whom the plan will be updated during the 5-year cycle?
3.2
3.1.2
8.4
8.2
8.2
8.2
ELEMENT A: REQUIRED REVISIONS
ELEMENT B. HAZARD IDENTIFICATION AND RISK ASSESSMENT
(Reviewer: See Section 4 for assistance with Element B)
B1. Does the plan include a description of the type, location, and extent of all natural hazards that can affect each jurisdiction(s)? (Requirement §201.6(c)(2)(i))
a. Does the plan include a general description of all natural hazards that can affect each jurisdiction?
b. Does the plan provide rationale for the omission of any natural hazards that are commonly recognized to affect the jurisdiction(s) in the planning area?
c. Does the plan include a description of the type of all natural hazards that can affect each jurisdiction?
d. Does the plan include a description of the location for all natural hazards that can affect each jurisdiction?
e. Does the plan include a description of the extent for all natural hazards that can affect each jurisdiction?
4.1
4.1
4.2
4.2
4.2
FEMA Region IX Local Hazard Mitigation Plan Review Tool 3
Location in Plan (section and/or page number) Met Not Met
REGULATION CHECKLIST Regulation (44 CFR 201.6 Local Mitigation Plans)
3.2
B2. Does the plan include information on previous occurrences of hazard events and on the probability of future hazard events for each jurisdiction?
(Requirement §201.6(c)(2)(i))
B3. Is there a description of each identified hazard’s impact on the community as well as an overall summary of the community’s vulnerability for each jurisdiction?
(Requirement §201.6(c)(2)(ii))
a. Does the plan include information on previous occurrences of hazard events for each jurisdiction?
b. Does the plan include information on the probability of future hazard events for each jurisdiction?
a. Is there a description of each hazard’s impacts on each jurisdiction (what happens to structures, infrastructure, people, environment, etc.)?
b. Is there a description of each identified hazard’s overall vulnerability (structures, systems, populations, or other community assets defined by the community that are identified as being susceptible to damage and loss from hazard events) for each jurisdiction?
B4. Does the plan address NFIP insured structures within the jurisdiction that have been repetitively damaged by floods? (Requirement §201.6(c)(2)(ii))
ELEMENT B: REQUIRED REVISIONS
ELEMENT C. MITIGATION STRATEGY
C1. Does the plan document each jurisdiction’s existing authorities, policies, programs and resources and its ability to expand on and improve these existing policies and programs?
(Requirement §201.6(c)(3))
a. Does the plan document each jurisdiction’s existing authorities, policies, programs and resources?
b. Does the plan document each jurisdiction’s ability to expand on and improve these existing policies and programs?
C2. Does the plan address each jurisdiction’s participation in the NFIP and continued compliance with NFIP requirements, as appropriate? (Requirement §201.6(c)(3)(ii))
C3. Does the plan include goals to reduce/avoid long-term vulnerabilities to the identified hazards? (Requirement §201.6(c)(3)(i))
C4. Does the plan identify and analyze a comprehensive range of specific mitigation actions and projects for each jurisdiction being considered to reduce
a. Does the plan identify and analyze a comprehensive range of specific mitigation actions and projects to reduce the impacts from hazards?
4.2
4.2
5.2
5.2
5.2.3
Section 6
Section 6
5.2.3
7.1
7.3.1
4 FEMA Region IX Local Mitigation Plan Review Tool
Location in Plan (section and/or page number) Met Not Met
1. REGULATION CHECKLIST Regulation (44 CFR 201.6 Local Mitigation Plans)
1.
the effects of hazards, with emphasis on new and existing buildings and infrastructure? (Requirement §201.6(c)(3)(ii))
b. Does the plan identify mitigation actions for every hazard posing a threat to each participating jurisdiction?
c. Do the identified mitigation actions and projects have an emphasis on new and existing buildings and infrastructure?
7.3.1
7.3.1
C5. Does the plan contain an action plan that describes how the actions identified will be prioritized (including cost benefit review), implemented, and administered by each jurisdiction? (Requirement §201.6(c)(3)(iv)); (Requirement §201.6(c)(3)(iii))
C6. Does the plan describe a process by which local governments will integrate the requirements of the mitigation plan into other planning mechanisms, such as comprehensive or capital improvement plans, when appropriate? (Requirement §201.6(c)(4)(ii))
a. Does the plan explain how the mitigation actions will be prioritized (including cost benefit review)?
b. Does the plan identify the position, office, department, or agency responsible for implementing and administering the action, potential funding sources and expected timeframes for completion?
a. Does the plan identify the local planning mechanisms where hazard mitigation information and/or actions may be incorporated?
b. Does the plan describe each community’s process to integrate the data, information, and hazard mitigation goals and actions into other planning mechanisms?
c. The updated plan must explain how the jurisdiction(s) incorporated the mitigation plan, when appropriate, into other planning mechanisms as a demonstration of progress in local hazard mitigation efforts.
7.3.1
7.3.1
8.3
8.3
8.3
ELEMENT C: REQUIRED REVISIONS
ELEMENT D. PLAN REVIEW, EVALUATION, AND IMPLEMENTATION (Applicable to plan
updates only)
D1. Was the plan revised to reflect changes in development? (Requirement §201.6(d)(3))
D2. Was the plan revised to reflect progress in local mitigation efforts? (Requirement §201.6(d)(3))
D3. Was the plan revised to reflect changes in priorities? (Requirement §201.6(d)(3))
ELEMENT D: REQUIRED REVISIONS
1.5
7.2
3.1.2
7.3.1
FEMA Region IX Local Hazard Mitigation Plan Review Tool 5
REGULATION CHECKLIST
Location in Plan (section and/or page number) Met Not Met
Regulation (44 CFR 201.6 Local Mitigation Plans)
1. REGULATION CHECKLIST
Regulation (44 CFR 201.6 Local Mitigation Plans)
ELEMENT E. PLAN ADOPTION
E1. Does the plan include documentation that the plan has been formally adopted by the governing body of the jurisdiction requesting approval? (Requirement §201.6(c)(5))
E2. For multi-jurisdictional plans, has each jurisdiction requesting approval of the plan documented formal plan adoption? (Requirement §201.6(c)(5))
ELEMENT E: REQUIRED REVISIONS
OPTIONAL: HIGH HAZARD POTENTIAL DAM RISKS (Applicable to jurisdictions interested in becoming sub applicants to FEMA’s Rehabilitation of High Hazard Potential Dams (HHPD) Grant Program only)
HHPD1. Did Element A4 (planning process) describe the incorporation of existing plans, studies, reports, and technical information for high hazard potential dams?
HHPD2. Did Element B3 (risk assessment) address HHPDs?
HHPD3. Did Element C3 (mitigation goals) include mitigation goals to reduce longterm vulnerabilities from high hazard potential dams that pose an unacceptable risk to the public?
HHPD4. Did Element C4-C5 (mitigation actions) address HHPDs prioritize mitigation actions to reduce vulnerabilities from high hazard potential dams that pose an unacceptable risk to the public?
REQUIRED REVISIONS
ELEMENT F. ADDITIONAL STATE REQUIREMENTS
(Optional for State Reviewers only; not to be completed by FEMA)
F1.
F2.
ELEMENT F: REQUIRED REVISIONS
6 FEMA Region IX Local Mitigation Plan Review Tool
Location in Plan (section and/or page number) Met Not Met
SECTION 2: PLAN ASSESSMENT
INSTRUCTIONS: The purpose of the Plan Assessment is to offer the local community more comprehensive feedback to the community on the quality and utility of the plan in a narrative format. The audience for the Plan Assessment is not only the plan developer/local community planner, but also elected officials, local departments and agencies, and others involved in implementing the Local Mitigation Plan. The Plan Assessment must be completed by FEMA. The Assessment is an opportunity for FEMA to provide feedback and information to the community on: 1) suggested improvements to the Plan; 2) specific sections in the Plan where the community has gone above and beyond minimum requirements; 3) recommendations for plan implementation; and 4) ongoing partnership(s) and information on other FEMA programs, specifically RiskMAP and Hazard Mitigation Assistance programs. The Plan Assessment is divided into two sections:
1. Plan Strengths and Opportunities for Improvement
2. Resources for Implementing Your Approved Plan
Plan Strengths and Opportunities for Improvement is organized according to the plan Elements listed in the Regulation Checklist. Each Element includes a series of italicized bulleted items that are suggested topics for consideration while evaluating plans, but it is not intended to be a comprehensive list. FEMA Mitigation Planners are not required to answer each bullet item and should use them as a guide to paraphrase their own written assessment (2-3 sentences) of each Element.
The Plan Assessment must not reiterate the required revisions from the Regulation Checklist or be regulatory in nature and should be open-ended and to provide the community with suggestions for improvements or recommended revisions. The recommended revisions are suggestions for improvement and are not required to be made for the Plan to meet Federal regulatory requirements. The italicized text should be deleted once FEMA has added comments regarding strengths of the plan and potential improvements for future plan revisions. It is recommended that the Plan Assessment be a short synopsis of the overall strengths and weaknesses of the Plan (no longer than two pages), rather than a complete recap section by section.
Resources for Implementing Your Approved Plan provides a place for FEMA to offer information, data sources and general suggestions on the plan implementation and maintenance process. Information on other possible sources of assistance including, but not limited to, existing publications, grant funding or training opportunities, can be provided. States may add state and local resources, if available.
FEMA Region IX Local Hazard Mitigation Plan Review Tool 7
A. Plan Strengths and Opportunities for Improvement
This section provides a discussion of the strengths of the plan document and identifies areas where these could be improved beyond minimum requirements.
Element A: Planning Process
How does the Plan go above and beyond minimum requirements to document the planning process with respect to:
• Involvement of stakeholders (elected officials/decision makers, plan implementers, business owners, academic institutions, utility companies, water/sanitation districts, etc.);
• Involvement of Planning, Emergency Management, Public Works Departments or other planning agencies (i.e., regional planning councils);
• Diverse methods of participation (meetings, surveys, online, etc.); and
• Reflective of an open and inclusive public involvement process.
Element B: Hazard Identification and Risk Assessment
In addition to the requirements listed in the Regulation Checklist, 44 CFR 201.6 Local Mitigation Plans identifies additional elements that should be included as part of a plan’s risk assessment. The plan should describe vulnerability in terms of:
1) A general description of land uses and future development trends within the community so that mitigation options can be considered in future land use decisions;
2) The types and numbers of existing and future buildings, infrastructure, and critical facilities located in the identified hazard areas; and
3) A description of potential dollar losses to vulnerable structures, and a description of the methodology used to prepare the estimate.
How does the Plan go above and beyond minimum requirements to document the Hazard Identification and Risk Assessment with respect to:
• Use of best available data (flood maps, HAZUS, flood studies) to describe significant hazards;
• Communication of risk on people, property, and infrastructure to the public (through tables, charts, maps, photos, etc.);
• Incorporation of techniques and methodologies to estimate dollar losses to vulnerable structures;
• Incorporation of Risk MAP products (i.e., depth grids, Flood Risk Report, Changes Since Last FIRM, Areas of Mitigation Interest, etc.); and
• Identification of any data gaps that can be filled as new data became available.
8 FEMA Region IX Local Mitigation Plan Review Tool
Element C: Mitigation Strategy
How does the Plan go above and beyond minimum requirements to document the Mitigation Strategy with respect to:
• Key problems identified in, and linkages to, the vulnerability assessment;
• Serving as a blueprint for reducing potential losses identified in the Hazard Identification and Risk Assessment;
• Plan content flow from the risk assessment (problem identification) to goal setting to mitigation action development;
• An understanding of mitigation principles (diversity of actions that include structural projects, preventative measures, outreach activities, property protection measures, postdisaster actions, etc);
• Specific mitigation actions for each participating jurisdiction that reflects their unique risks and capabilities;
• Integration of mitigation actions with existing local authorities, policies, programs, and resources; and
• Discussion of existing programs (including the NFIP), plans, and policies that could be used to implement mitigation, as well as document past projects.
Element D: Plan Update, Evaluation, and Implementation (Plan Updates Only)
How does the Plan go above and beyond minimum requirements to document the 5-year Evaluation and Implementation measures with respect to:
• Status of previously recommended mitigation actions;
• Identification of barriers or obstacles to successful implementation or completion of mitigation actions, along with possible solutions for overcoming risk;
• Documentation of annual reviews and committee involvement;
• Identification of a lead person to take ownership of, and champion the Plan;
• Reducing risks from natural hazards and serving as a guide for decisions makers as they commit resources to reducing the effects of natural hazards;
• An approach to evaluating future conditions (i.e. socio-economic, environmental, demographic, change in built environment etc.);
• Discussion of how changing conditions and opportunities could impact community resilience in the long term; and
• Discussion of how the mitigation goals and actions support the long-term community vision for increased resilience.
FEMA Region IX Local Hazard Mitigation Plan Review Tool 9
B. Resources for Implementing and Updating Your Approved Plan
This resource section is organized into three categories:
1) Guidance and Resources
2) Training Topics and Courses
3) Funding Sources
Guidance and Resources
Local Mitigation Planning Handbook
https://www.fema.gov/media -library/assets/documents/31598
Beyond the Basics
http://mitigationguide.org/
Mitigation Ideas
https://www.fema.gov/media -library/assets/documents/30627
Plan Integration: Linking Local Planning Efforts
https://www.fema.gov/media -library/assets/documents/108893
Integrating Disaster Data into Hazard Mitigation Planning
https://www.fema.gov/media -library/assets/documents/103486
Integrating Historic Property and Cultural Resource Considerations into Hazard Mitigation Planning
https://www.fema.gov/ar/media-library/assets/documents/4317
Community Rating System User Manual
https://www.fema.gov/media -library/assets/documents/8768
U.S. Climate Resilient Toolkit
https://toolkit.climate.gov/
2014 National Climate Assessment
http://nca2014.globalchange.gov/
Managing the Risks of Extreme Events and Disasters to Advance Climate Change Adaptation
http://ipcc-wg2.gov/SREX/images/uploads/SREX-All_FINAL.pdf
FY15 Hazard Mitigation Assistance Unified Guidance
https://www.fema.gov/media -library/assets/documents/103279
Climate Resilient Mitigation Activities for Hazard Mitigation Assistance
https://www.fema.gov/media -library/assets/documents/110202
Training
More information at https://training.fema.gov/emi.aspx or through your State Training Officer
Mitigation Planning
IS-318 Mitigation Planning for Local and Tribal Communities
https://training.fema.gov/is/courseoverview.aspx?code=is-318
IS-393 Introduction to Hazard Mitigation
https://training.fema.gov/is/courseoverview.aspx?code=is-393.a
G-318 Preparing and Reviewing Local Plans
G-393 Mitigation for Emergency Managers
Hazard Mitigation Assistance (HMA) Grant Programs
10 FEMA Region IX Local Mitigation Plan Review Tool
IS-212.b Introduction to Unified HMA
http://www.training.fema.gov/is/courseoverview.aspx?code=IS-212.b
IS-277 Benefit Cost Analysis Entry Level
http://www.training.fema.gov/is/courseoverview.aspx?code=IS-277
E-212 HMA: Developing Quality Application Elements
E-213 HMA: Application Review and Evaluation
E-214 HMA: Project Implementation and Programmatic Closeout
E-276 Benefit-Cost Analysis Entry Level
GIS and Hazus-MH
IS-922 Application of GIS for Emergency Management
http://www.training.fema.gov/is/courseoverview.aspx?code=IS-922
E-190 ArcGIS for Emergency Managers
E-296 Application of Hazus-MH for Risk Assessment
E-313 Basic Hazus-MH
Floodplain Management
E-273 Managing Floodplain Development through the NFIP
E-278 National Flood Insurance Program/ Community Rating System
Potential Funding Sources
Hazard Mitigation Grant Program
POC: FEMA Region IX and State Hazard Mitigation Officer
Website: https://www.fema.gov/hazard-mitigation-grant -program
Pre-Disaster Mitigation Grant Program
POC: FEMA Region IX and State Hazard Mitigation Officer
Website: https://www.fema.gov/pre-disaster-mitigation-grant-program
Flood Mitigation Assistance Grant Program
POC: FEMA Region IX and State Hazard Mitigation Officer
Website: https://www.fema.gov/flood-mitigation-assistance-grant-program
Emergency Management Performance Grant Program
POC: FEMA Region IX
Website: https://www.fema.gov/emergency -management-performance-grant-program
FEMA Region IX Local Hazard Mitigation Plan Review Tool 11
SECTION 3: MULTI-JURISDICTIONAL SUMMARY SHEET
INSTRUCTIONS: For multi-jurisdictional plans, this summary sheet must be completed by listing each participating jurisdiction that is eligible to adopt the plan.
12 FEMA RIX Local Mitigation Plan Review Tool
# Jurisdiction Name Jurisdiction Type Eligible to Adopt the Plan? Plan POC Email 1 2 3 4 5 6 7 8 9 10 11 12 13 14 15
MULTI-JURISDICTION SUMMARY SHEET
SECTION 4: HAZARD IDENTIFICATION AND RISK ASSESSMENT MATRIX (OPTIONAL)
INSTRUCTIONS: This matrix can be used by the plan reviewer to help identify if all of the components of Element B have been met. List out natural hazard names that are identified in the plan in the column labeled “Hazards” and put a “Y” or “N” for each component of Element B.
13 FEMA RIX Local Mitigation Plan Review Tool
HAZARD IDENTIFICATION AND RISK ASSESSMENT MATRIX Hazard Requirement Met? (Y/N) Type Location Extent Previous Occurrences Probability Impacts Vulnerability Mitigation Action
This page intentionally left blank
