

Energy security is about ensuring and maintaining a resilient and diverse energy supply capable of meeting our current and future needs. Tariffs. Elbows-Up. One Canada. Energy security is at the forefront of this conversation and Canada is well positioned to grow our economy given the abundance of natural resources we have available to us. But we need more than the resources we need innovators, disrupters, and creative thinkers who understand how to characterize our reservoirs and produce energy in ways we haven’t before. This is where geoscientists shine.
This two-day symposium is aimed at advancing discussions on how geoscientists can impact energy security through reservoir characterization and innovative approaches to subsurface reservoir delineation. The objective is to feature technical presentations that showcase both proven and emerging methods and technologies that contribute to improved reservoir characterization. Emphasis will be placed on how these advancements contribute to Canada’s energy security.

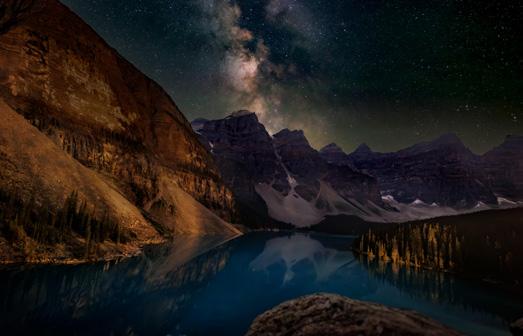
Way at Moraine Lake, Alberta.
nightscape image of the Milky Way over Moraine Lake (1,884 m) as seen at darkest night on July 23, 2023. The photo was taken from the iconic vantage point on the top of the Rock Pile
in the
of
The
Thursday, September 25, 2025
Join us for a 5km or 10km race or fun run/walk! All registrations include a t-shirt, chance to win great prizes, and a ticket to the race after party including food and drink.

Register by June 30 for early bird prize draw
Guaranteed t-shirt size if registered by August 25
Sponsorship opportunities Available!

The RESERVOIR is published 6 times per year by the Canadian Energy Geoscience Association. The purpose of the RESERVOIR is to publicize the Association’s many activities and to promote the geosciences. We look for both technical and non-technical material to publish.
The contents of this publication may not be reproduced either in part or in full without the consent of the publisher.
No official endorsement or sponsorship by the CEGA is implied
https://cegageos.ca/social-events/
for any advertisement, insert, or article that appears in the RESERVOIR unless otherwise noted. All submitted materials are reviewed by the editor. We reserve the right to edit all submissions, including letters to the Editor. Submissions must include your name, address, and membership number (if applicable). The material contained in this publication is intended for informational use only.
While reasonable care has been taken, authors and the CEGA make no guarantees that any of the equations, schematics, or
devices discussed will perform as expected or that they will give the desired results. Some information contained herein may be inaccurate or may vary from standard measurements. The CEGA expressly disclaims any and all liability for the acts, omissions, or conduct of any third-party user of information contained in this publication. Under no circumstances shall the CEGA and its officers, directors, employees, and agents be liable for any injury, loss, damage, or expense arising in any manner whatsoever from the acts, omissions, or conduct of any third-party user.

PRESIDENT
Shelley Leggitt
Kiwetinohk Energy Corp. shelley.leggitt@cegageos.ca LinkedIn

FINANCE DIRECTOR ELECT
David Lipinski
AtkinsRealis directorfinance@cegageos.ca LinkedIn

DIRECTOR
Michael Livingstone GLJ Ltd technicaldivisions@cegageos.ca LinkedIn
CEGA OFFICE
#415, 500 4th Ave SW
Calgary Alberta, Canada T2P 2V6
Tel: 403-264-5610 | cegageos.ca

PAST PRESIDENT
Andrew Vogan
ConocoPhillips Canada Ltd. andrew.vogan@cegageos.ca LinkedIn

DIRECTOR
Gary Bugden
Cabra Consulting Ltd membershipdirector@cegageos.ca Linkedin
DIRECTOR
Michael Wamsteeker
ExxonMobil publications@cegageos.ca Linkedin

PRESIDENT ELECT
Christa Williams
Canadian Discovery Ltd. christa.williams@cegageos.ca LinkedIn

DIRECTOR
Ryan Lemiski
Canadian Natural Resources Limited outreach@cegageos.ca Linkedin

DIRECTOR
Kevin Webb
Aquitaine Energy Ltd. conferences@cegageos.ca LinkedIn

FINANCE DIRECTOR
Rachel Lea
Suncor Energy directorfinance@cegageos.ca LinkedIn

DIRECTOR
Scott Leroux
Taggart Oil Corp. education@cegageos.ca Linkedin
OFFICE CONTACTS
MEMBERSHIP INQUIRIES
Tel: 403-264-5610
Email: membership@cegageos.ca
ADVERTISING INQUIRIES
Britney Stewart
Tel: 403-513-1230
Email: britney.stewart@cegageos.ca
CONFERENCE INQUIRIES
Kristy Casebeer
Tel: 403-513-1234
Email: kristy.casebeer@cegageos.ca
MANAGING DIRECTOR
Emma MacPherson
Tel: 403-513-1235
Email: emma.macpherson@cegageos.ca
SCOTT LEROUX; CEGA EDUCATION DIRECTOR

s I reflect on nearly 25 years of volunteering with CEGA (and its predecessor, CSPG), I’m reminded of how influential this organization has been in shaping my professional journey. From conventions and technical talks to networking, field trips and short courses, CEGA has provided opportunities that have significantly contributed to my growth as a geoscientist.
Let’s
continue working
together to build the next generation of geoscientists—and ensure they have the training, mentorship, and support they need to succeed.
I consider myself fortunate to have started my career at PanCanadian in the early 2000s, through the “Center of Excellence” program. At the time, training was one of the most compelling reasons new graduates were drawn to roles at these companies. Several of the major players—Shell, Conoco, Imperial, PetroCanada, and Talisman to name a few—offered exceptional training and development that included structured mentorship, in-house experts, and formal learning paths. Some even provided international training stints as part of multi-year blended development programs.
These early-career learning environments laid the groundwork for a strong, well-prepared geoscience workforce. But over time, these programs have slowly been eroded by mergers, budget cuts, and the general contraction of our industry. Many of the specialists who once mentored new professionals have either moved into consulting or retired, and their replacements haven’t arrived at the needed pace. As technology advanced and the pandemic pushed us into virtual environments, much of the remaining in-person training dried up.
CEGA has worked hard to adapt to this changing landscape. Education and training are important services offered to our members and are one of the many benefits of membership. Courses are priced to break even and are not intended to generate a significant income stream for the association. Taking inspiration from the best training models in our industry, CEGA has recently developed a Training Matrix—now available on the CEGA website This matrix is a centralized resource outlining a comprehensive set of geoscience-related courses, broken down into beginner, intermediate, and advanced levels. It’s designed to support professional development across the career arc, from summer students and early-career professionals to seasoned experts.
Each course listing includes the title of the course, instructor, duration, and the number of APEGA Continuing Professional Development
(CPD) hours for easy annual reporting purposes. Many courses in the matrix are offered directly by CEGA, while other courses link to external providers. This initiative will provide geoscientists and their leaders annual training options to fulfill APEGA CPD requirements, company or positionspecific training requirements and will be helpful in the planning and budgeting for training. Over time, this tool will continue to evolve, with new courses added and training gaps addressed.
The ”Matrix” will be a Canadian geoscience brand resource for career development—an accessible, practical tool that reflects the realities of today’s industry while aiming to rebuild some of the training culture we’ve lost. We also encourage companies to consider sharing or opening their in-house training to CEGA members when appropriate; this will help to broaden access and reduce costs for everyone involved.
Feedback from industry leaders continues to emphasize the need for high-quality, targeted training—both classroom and field-based. If programs are relevant, well-advertised, and appropriately timed and priced, they tend to be successful. That said, we’ve also learned that reduced staffing levels and tighter budgets make finding the right offering at the right time a real challenge, and this has sometimes led to the cancellation of even well-designed courses.
CEGA’s Education portfolio currently oversees three main areas: short courses, field trips, and technical luncheons. The Short Courses Committee, which went dormant during the pandemic, is now active again with six dedicated members. The Field Trip Committee is back under the Education umbrella, and the Technical Luncheon Committee continues to run smoothly with an excellent team in place.
If you’re interested in teaching a course, leading a field trip, or volunteering your time in any capacity, please don’t hesitate to reach out to me directly, contact Kristy Casebeer at the CEGA office, or get in touch with any of our committee members. The strength of our community lies in its willingness to share, collaborate, and support one another.
Let’s continue working together to build the next generation of geoscientists—and ensure they have the training, mentorship, and support they need to succeed.

July 20th
Go Talk a Walk Together!
Tyndall Stone: Exploring and Studying
450-Million-Year-Old Ordovician Fossils in Inner City Calgary
Leader: Tako Koning
August 9th
Go Take a Hike Together!
Helen Lake Stromatolites
Leaders: Astrid Arts & Mark Mallamo
August 20th Sold Out
CEGA Golf Tournament

September 16th
Technical Luncheon
Geology in Motion: Craters, Coastlines, and the Unexpected Power of Observation
Speaker: Sean Fletcher
September 25th
Sweat the Subsurface Road Race
October 21st
Technical Luncheon
Exploring the Depositional Evolution of the Cambrian Sequence in Alberta and Saskatchewan Subsurface: Sedimentology and Ichnology of the Basal Sandstone Unit, the Earlie Formation, and the Deadwood Formation
Speaker: Andrei Ichazo Demianiuk, PhD.
November 12th
Postponed Technical Luncheon
Addressing Challenges in RTA using New Core Analysis Method
Speaker: Christopher Clarkson, PhD., P.Eng.
You and your team have spent days using sophisticated geosteering to drill your well to TD. Everything went well. You sure are glad that you listened to the geomechanist’s recommendation for mud weight so your well drilled silky smooth. Casing has been run and preparations are being made for completion of the well. There is little input left for the geologists as the completions, testing, tiein and producing of the well are up to the engineers further downstream.
Not so fast. There is increasing recognition of the critical importance of a subsurface phenomenon that can have an enormous impact on the economic performance of your drilling program. The lurking menace is known by a number of aliases: casing damage, casing deformation, casing failure and, the most frightening term of all, casing shear. For the remainder of the article, I will simply use casing deformation.
In this article, I will outline the types of casing deformation and their distribution in Alberta (AB) and British Columbia (BC), the costs of casing deformation to both the producer and the regulator, and industry’s current understanding of its causes, as well as how geomechanics protocols can, in many cases, help to avoid or minimize the problem.
• Tubular pressure differential exceeded
• Allows pressure to bypass plug
• Non-uniform formation load distributions due to poor cement
• Allows direct contact with formation
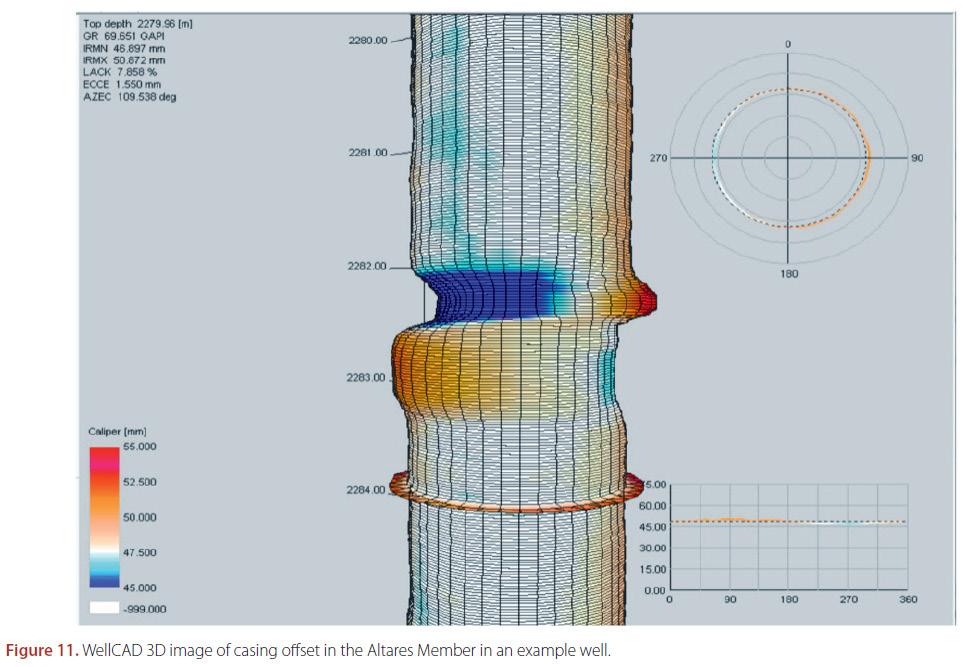
Figure 2. Casing deformation articles by publication year. Publications focused on China and the WCSB are highlighted. Derived from data in Uribe–Patino et al. (2024).
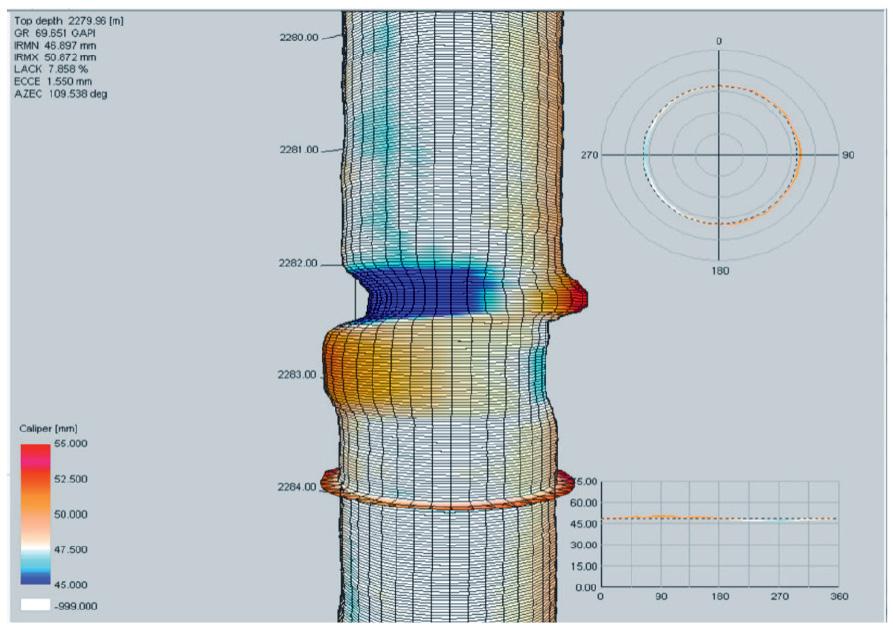
Figure 1. Caliper data revealing casing deformation in a northeast BC Montney well. Sanders et al. (2018).
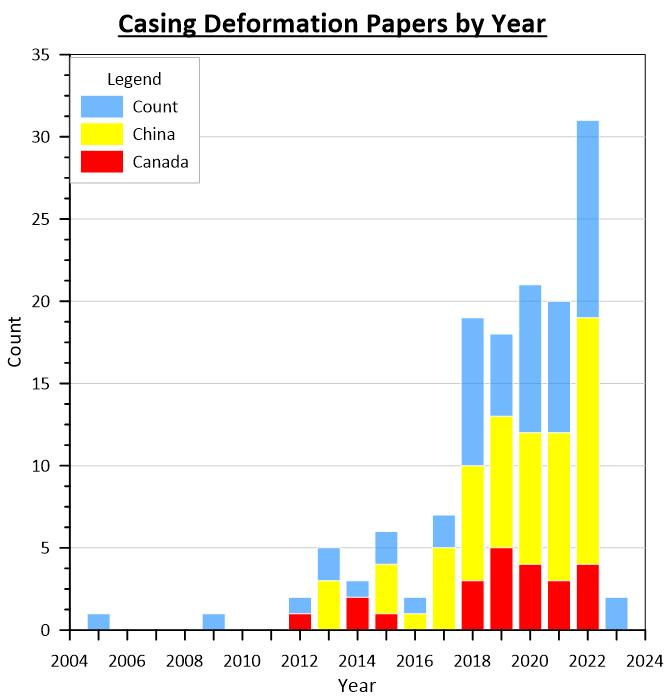
In a comprehensive review of 138 papers published between 2005 and early 2023, Uribe-Patino et al. (2024) collated the types of casing deformation reported according to the four-part classification shown in Table 1. The cases reviewed were from China, Canada, the United States, Australia, Argentina, Oman and unspecified regions. It is important to note that Type III includes casing deformation caused by geomechanical factors; therefore, this type of deformation will be the focus of further discussion. An example of Type III casing deformation in the Montney play is shown in Figure 1.
The papers are tabulated by publication year as shown in Figure 2. The overall pattern of increased research with time is very apparent. The predominance of investigations in China, particularly the Sichuan Basin, indicates the importance with which the subject is regarded elsewhere in the world. The Western Canada
• Formation compaction
• Fault, fracture, layer or bedding plane slip and creeping
• Thermal effect
• Cyclic loading
• Casing wear
• Running damage
• Pumping erosion
Table 1: Four Types of casing deformation. After Uribe-Patino et al. (2024).
Sedimentary Basin (WCSB) is, however, the second most prevalent locality by a fair amount, where a similar pattern is observed.
Uribe-Patino et al. (2024) concluded that Type III casing deformation constituted 60% of the global data set. In the WCSB, Type III was referenced in 51.5% of the publications, as shown in Figure 3.
Precisely defining the extent of the casing deformation challenge in AB and BC is difficult. The Alberta Energy Regulator (AER) maintains a list of reported casing deformation events and the mitigation steps undertaken that is updated daily. The April 30, 2025 edition listed 12,317 separate casing deformation events. The AER classifies the nature of casing deformation based on the terminology outlined in Table 2.
Since the only classifications that definitively correspond to Type III are Buckling and Collapse, at the time of writing there is a base level of 554 Type III casing deformation events recorded in AB. Unfortunately, the current AER classification scheme does not directly correspond to the Uribe-Patino et al. (2024) categories, and there is ambiguity as to whether the “Hole” and “Parted” categories should be partly listed as Type III. At a combined 10,710 events, these categories comprise the vast majority of casing deformation events in AB. Given that Type III casing deformation was found to be 51.5% of casing deformation in the WCSB by Uribe-Patino et al. (2024), the possibility that there are 5,000+ casing deformation events that are Type III is not unrealistic.
The British Columbia Energy Regulator (BCER) does not currently require casing deformation to be reported; therefore, events must be identified or inferred from details in the completion workover reports in PDF format. The BCER has identified several casing deformations from 2014 to 2019. The focus on this tabulation was the Montney Formation, with all but one of the wells focused on that zone (the other was a Horn River well). Enlighten is in the process of accessing other data sources to build upon this original BC list.
A more rigorous and comprehensive collation of casing deformation events is an obvious first step in coming to grips with the extent of the challenge. Regardless of the completeness of the dataset, a Type III data distribution map (Figure 4) illustrates the widespread nature of this geological challenge.
A couple of observations are evident from the map in Figure 4. In talking to colleagues, there appears to be a consensus that Type III casing deformation is primarily a concern for the North Montney play, but clearly this issue impacts wells across AB and Northeast (NE) BC. Additionally, a casual visual inspection might lead to the impression that Type III casing deformation is concentrated in NE BC, but the data currently available indicates that there are 1.05 wells per 1,000 square kilometres with Type III casing deformation in NE BC versus 1.12 wells per 1,000 square kilometres in AB. These numbers are highly likely to change should more well-defined identification and classification of casing deformation occur in the future. Failure
Buckling Casing is deformed under compressive stress, due to changes in temperature or pressure
pressure acting on the casing which exceeds its burst strength
Collapse External pressure acting on the casing which exceeds its ability to withstand that pressure
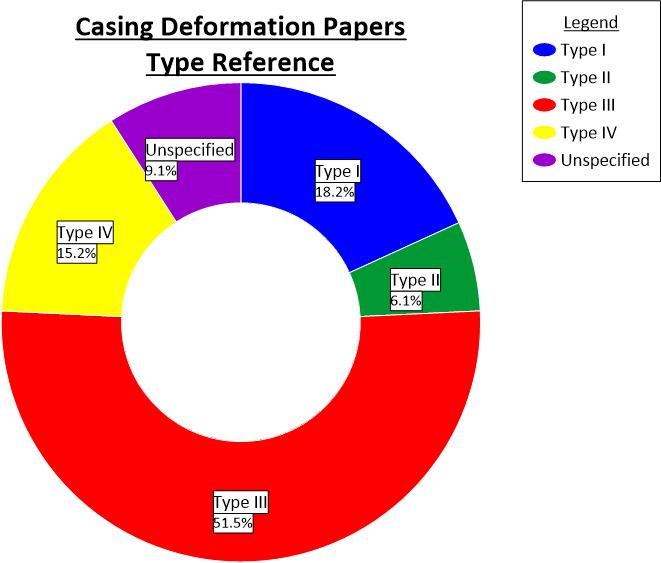
Figure 3. WCSB papers discussing casing deformation in Canada by type. Over half were found to be related to geomechanical factors. Derived from data in Uribe-Patino (2024).
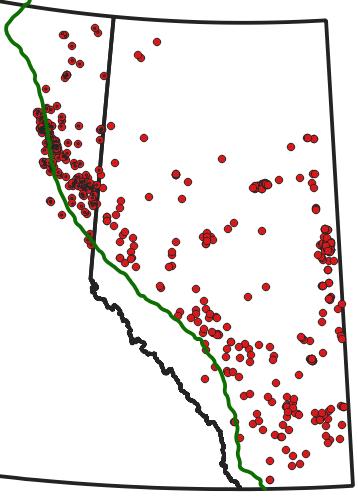
Figure 4. Map of Type III casing deformation as defined through AER and BCER sources.
Hole Leak path through the casing due to internal or external causes I, II, III or IV
Parted Casing is partially of fully separated from the rest of the string I, II, III or IV 1,341
Thread Leak Leak path across the casing threads or connection
No longer used
longer used
Table 2: Summary of casing deformation types in Alberta based on classifications used by AER.
(Chris Perkons, personal communications).
It is worth considering the reasons why the issue of casing deformation has garnered a relatively low level of attention by the AER and BCER. After discussions with representatives from both, it is apparent there is a good rationale given their responsibilities. Unlike other geomechanical challenges, such as induced seismicity, the current perception of risk to the public is low. Regulators do, however, have responsibilities regarding the preservation of wellbore integrity, particularly if casing deformation has the potential to propagate Surface Casing Vent Flows (SCVFs), which are a major environmental concern with regards the release of methane, a significant greenhouse gas.
Proactive, geomechanically informed, drilling and completion programs can be developed to reduce the frequency of casing deformations. This improved program could then evolve to a level of consistent efficiencies.
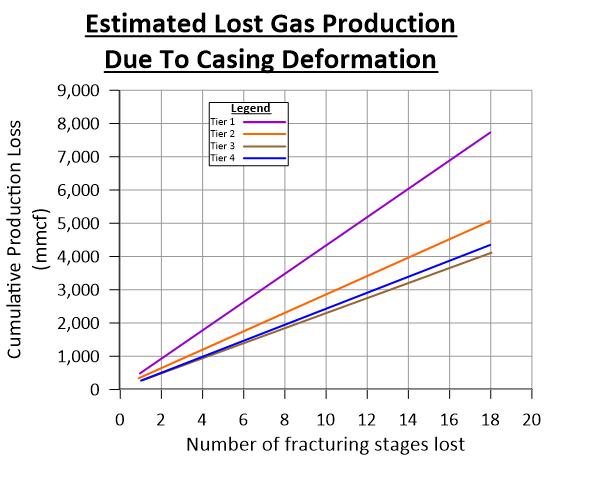
One aspect that impacts both regulators and producers is lost production and the accompanying lost royalties and revenues, respectively. Damaged casing often forces the abandonment of hydraulic fracturing stages. Figure 5 is reproduced from Suarez Jerez (2015) and illustrates the estimates of lost gas production with increasing numbers of bypassed stages in four tiers of Montney wells (Tier 1 represents the best producing wells). This estimate does not include any liquids production and, cruelly, indicates that better wells are hampered to an even greater degree than lower quality wells. It should be kept in mind that milling, casing patches and premature abandonment are additional costs imposed by casing deformation. This foregone production and additional costs have been estimated to have resulted in an economic loss of between $2MM to $15MM in Net Present Value.
At this stage, I expect the point has been made that casing deformation is a serious and significant subsurface issue impacting both producer
Figure 5. Modelling of the increase in lost natural gas production with number of bypassed completion stages due to casing deformation for four tiers of Montney gas producers. Note that the best wells are within Tier 1. Reproduced from Suarez Jerez (2015).
revenue and provincial royalties, and that engineering interventions after the fact are expensive and often fail to eliminate the problem. The best answer is to avoid dealing with casing deformation in the first place. But what geomechanical considerations might help prevent casing deformation?
As discussed earlier, Type III casing deformation occurs across the western portion of the WCSB. The root causes of these events are as varied as the formations, lithologies and tectonic settings in which they occur. Thermal production techniques contribute to issues along the eastern edge of AB. Salt movement can impact casing in east-central AB. Closer to the Deformed Belt, far field tectonic forces come to bear, as does strike-slip faulting along features such as the Hay River Fault Zone. It is a wide variety of regions, with a corresponding variety of geomechanical considerations.
Harland Howard famously said that country music was “three chords and the truth.” Perhaps geomechanics can be seen as “three parameters and the truth.” Not as pithy, perhaps, but understanding the geomechanics of casing deformation comes down to understanding the interplay between earth stresses, pore pressure, and rock properties. The primacy of these factors was outlined in a landmark paper on casing shear by Dusseault et al. (2001).
According to Dusseault et al (2001), shear failure occurs along weak bedding plane interfaces (bedding plane slip) or pre-existing fractures or faults when volume changes occur resulting in stress concentration changes. These volume changes can be the result of fluid injection, production, other pressure changes or temperature increase. Mechanical
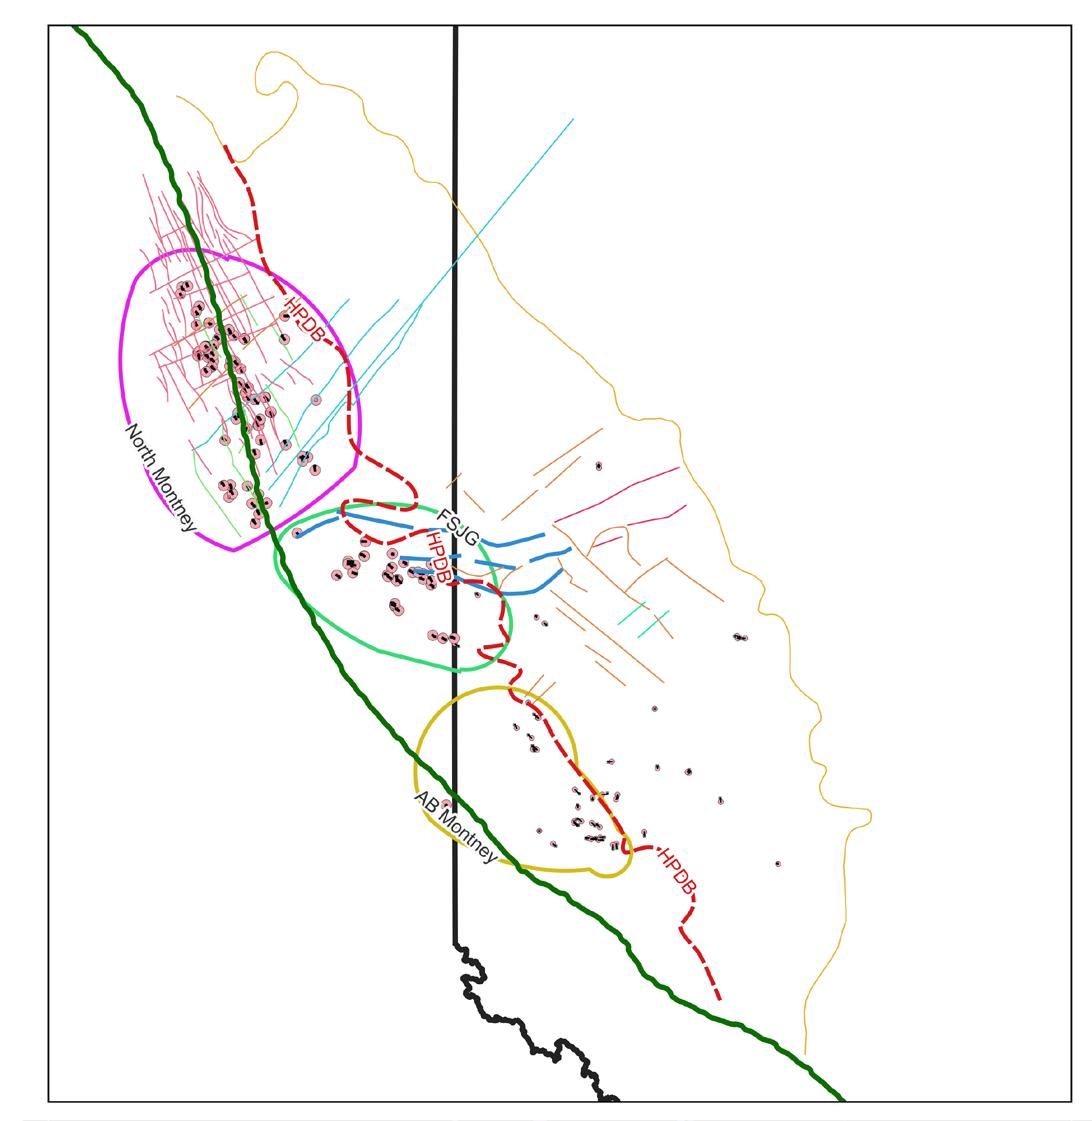
Figure 6. Montney horizontal wells with casing deformation events reported to the AER and BCER. Red dashed line represents the Higher Pressure Deep Basin edge (HPDB), Davies et al. (2018). Production regions highlighted by solid shapes. Structural features from Hayes et al. (2021) and Davies et al. (2018).
interventions such as revised casing design are unlikely to prevent casing shear, but amending drilling and completion workflows in such a way as to recognize how the geomechanical factors interact can lessen or obviate the impact.
It may be an example of recency bias, but, as mentioned earlier, a lot of attention is paid to Type III casing deformation events in the North Montney play. Although the data needs to be carefully considered on a local basis, perspective on the need for detailed information may be garnered through a regional lens with the Montney as an example.
Figure 6 shows the distribution of casing deformation events recorded by the AER and BCER for Montney horizontal wells only
The map provides the visual sense that the majority of the events are west of the Higher Pressure Deep Basin (HPDB) edge as defined in Davies et al. (2018). This impression is confirmed by considering that 144 of 168 (86%) horizontal Montney wells with casing deformation are west of the HPDB boundary. This does not, however, necessarily indicate a singular link between over-pressuring and casing deformation. The dominance of casing deformation in the over-pressured portion of the Montney might also be a reflection of the industry’s propensity to drill in this region due to expected higher anticipated production rates and reserves. It should also be kept in mind, again, that these numbers are liable to change subject to a thorough study.
Inspection of the map also indicates that the casing deformation may be broken down into three general regions within the HPDB defined in a northwest – southeast direction as:
• North Montney: 87 wells (60%)
• FSJG (Fort St John Graben): 28 wells (20%)
• AB Montney: 29 wells (20%)
Reactivation of fault and fractures is accepted as a contributor to casing deformation in addition to bedding plane slip. When the Montney-level faults from recent literature are considered, it can be seen that the North Montney is indeed the locus of a number of interlaced fault complexes. These faults include the Hay River Fault Zone, thrust faults, duplex structures and several conjugate strike-slip faults. It is definitely a structurally complex area.
However, the region along the FSJG is also complex. This area has seen the normal faulting associated with collapse of the Peace River Arch modified by transpression during the Laramide orogeny. At 20 events, casing deformation in the FSJG is a third as prevalent as the sixty events in the North Montney. Is this difference due solely to the different tectonics, or fewer recorded incidents? In contrast, there have been no significant structural features defined recently in the AB Montney. The North Montney and FSJG have been extensively studied in part to understand induced seismicity in those areas. Is the lack of structures an intrinsic component of the AB Montney play area, or is it due to having been studied less?
This map illustrates the need for an integrated and rigorous analysis of the geomechanical and structural setting when faced with the challenge of casing deformation. As summarized by Uribe-Patino et al. (2024), the recommended strategy to mitigate Type III casing deformation in the Montney involves “a better understanding (of) the risk of (fault) reactivation.
An example of the end result of the recommended style of analysis is the map of the Montney Critical Perturbation Pressure with Montney casing deformation wells shown in Figure 7. This map indicates the
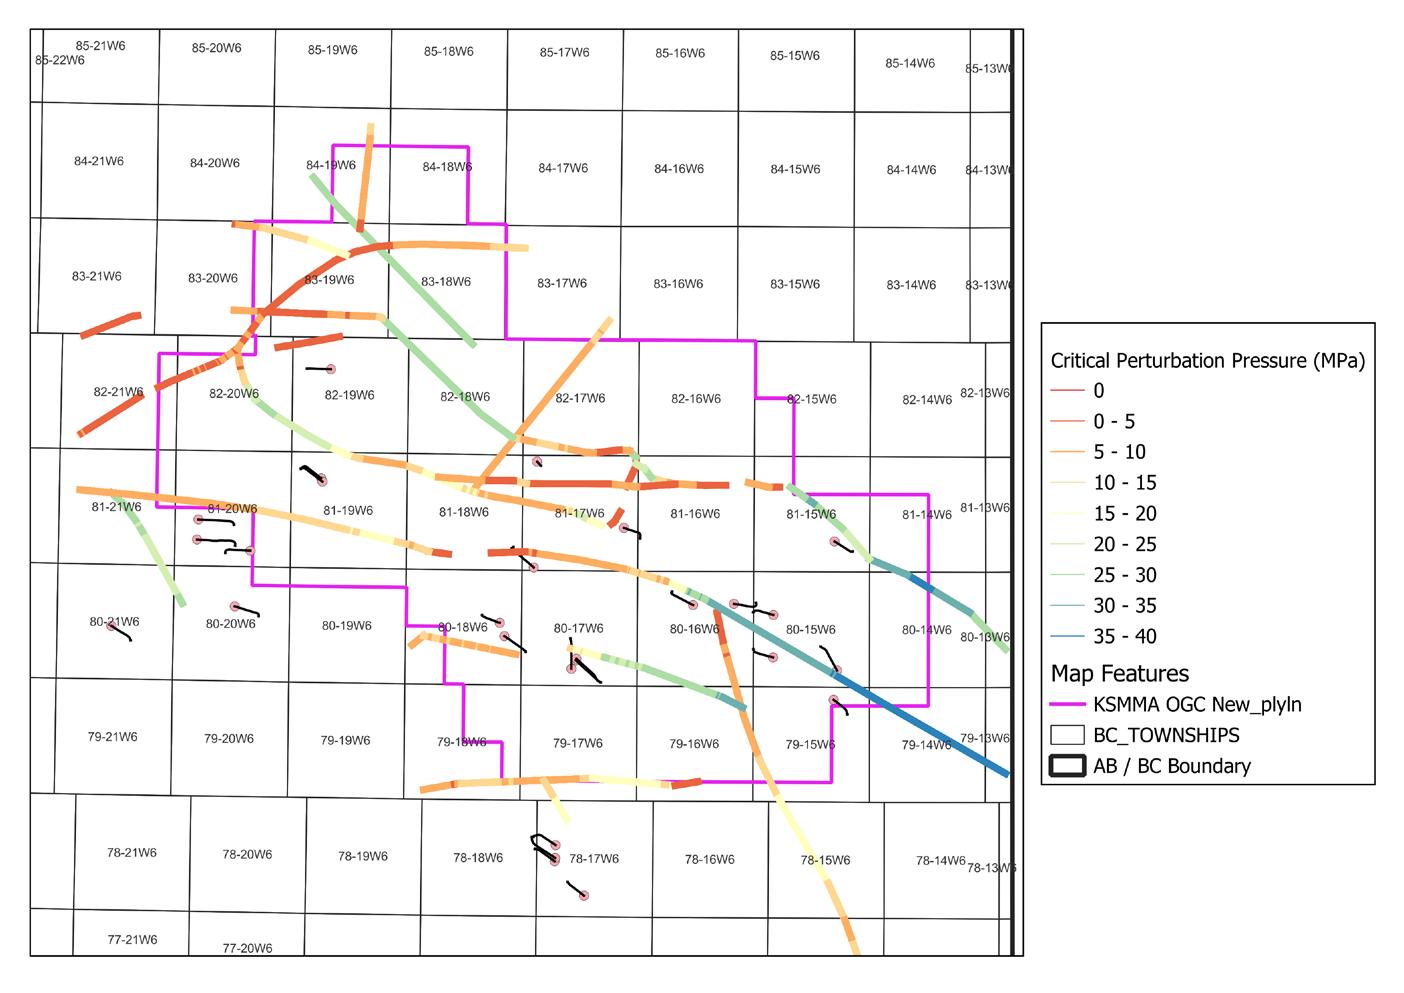
Figure 7. Montney Critical Perturbation Pressure map of representative faults in the Kiskatinaw Seismic Monitoring and Mitigation Area of NE BC. Reproduced from Enlighten Geoscience (2021).
range of additional fluid pressure above existing pore pressure that will cause identified faults to become critically stressed and at risk of slipping. It is important to recognize that the faults are from literature and at the Precambrian level rather than proprietary and at the Montney level. Their reposition for the Montney stratigraphic level would align more closely with the casing deformation wells. Regardless, the position of several of the mapped wells near critically stressed faults implies that fault slip has the potential to induce casing deformation as well as seismicity. These factors lead to the conclusion that applying a rigorous geomechanical model to a balanced structural model will help understand methods to avoid triggering even minor movement of faults.
Casing deformation is increasingly being recognized as a significant impact on the profitability of a number of play types around the globe. Casing deformation due to geomechanical factors (Type III) is particularly significant in regions such as the Sichuan Basin of China. A similar pattern is witnessed in Western Canada. Casing deformation can have a strongly negative impact on both provincial royalties and producer net present value. Avoiding these impacts through strictly mechanical interventions seldom provides a satisfactory outcome, and adjusting drilling and completion programs to work in alignment with the geomechanical and structural setting has the highest potential to avoid the costs associated with casing deformation. To have the maximum benefit, these subsurface understandings must be based on a thorough and rigorous geological and geomechanical workflow.
This article benefited from discussions with Michelle Gaucher and Karen Diamond of the BC ER. I am very grateful for their contributions. Any errors are solely the responsibility of the author.
Davies, Graham R., Neil Watson, Thomas F. Moslow, and James A. MacEachern. 2018. “Regional Subdivisions, Sequences, Correlations and Facies Relationships of the Lower Triassic Montney Formation, WestCentral Alberta to Northeastern British Columbia, Canada — with Emphasis on Role of Paleostructure.” Bulletin of Canadian Petroleum Geology 66 (1): 23–92.
Dusseault, Maurice B., Michael S. Bruno, and John Barrera. 2001. “Casing Shear: Causes, Cases, Cures.” SPE Drilling & Completion 16 (02): 98–107. https://doi.org/10.2118/72060-PA.
Enlighten Geoscience Ltd. 2021. “Pressure, Stress and Fault Slip Risk Mapping in the Kiskatinaw Seismic Monitoring and Mitigation Area, British Columbia.” ER-Seismic-2020-01. BCOGRIS. https://www.bcogris.ca/news/ final-report-pressure-stress-and-fault-slip-risk-mapping-in-the-ksmma/. Hayes, Brad, Howard Anderson, Mark Cooper, Patrick McLellan, Ben Rostron, Jason Clarke, and Martin Perra. 2021. Wastewater Disposal in the Maturing Montney Play Fairway of NEBC.
Sanders, S., C. Etienne, A. Gegolick, D. Kelly, and J.-P. Zonneveld. 2018. “The Middle Montney Altares Member: Lithology, Depositional Setting and Significance for Horizontal Drilling and Completion in the Altares Field, British Columbia.” Bulletin of Canadian Petroleum Geology 66 (1): 318–37.
Suarez Jerez, N. A. 2015. “A New Production Casing Design to Withstand Combined Installation Compression Loading and High Multi-Stage Hydraulic Fracturing Pressures in Montney Shale Horizontal Wells.” Graduate Studies. https://doi.org/10.11575/PRISM/24871.
Uribe-Patino, J. A., A. Casero, D. Dall’Acqua, E. Davis, G. E. King, H. Singh, M. Rylance, R. Chalaturnyk, and G. Zambrano-Narvaez. 2024. “A Comprehensive Review of Casing Deformation During Multi-Stage Hydraulic Fracturing in Unconventional Plays: Characterization, Diagnosis, Controlling Factors, Mitigation and Recovery Strategies.” In SPE Hydraulic Fracturing Technology Conference and Exhibition. The Woodlands, Texas, USA: SPE. https://doi.org/10.2118/217822-ms.
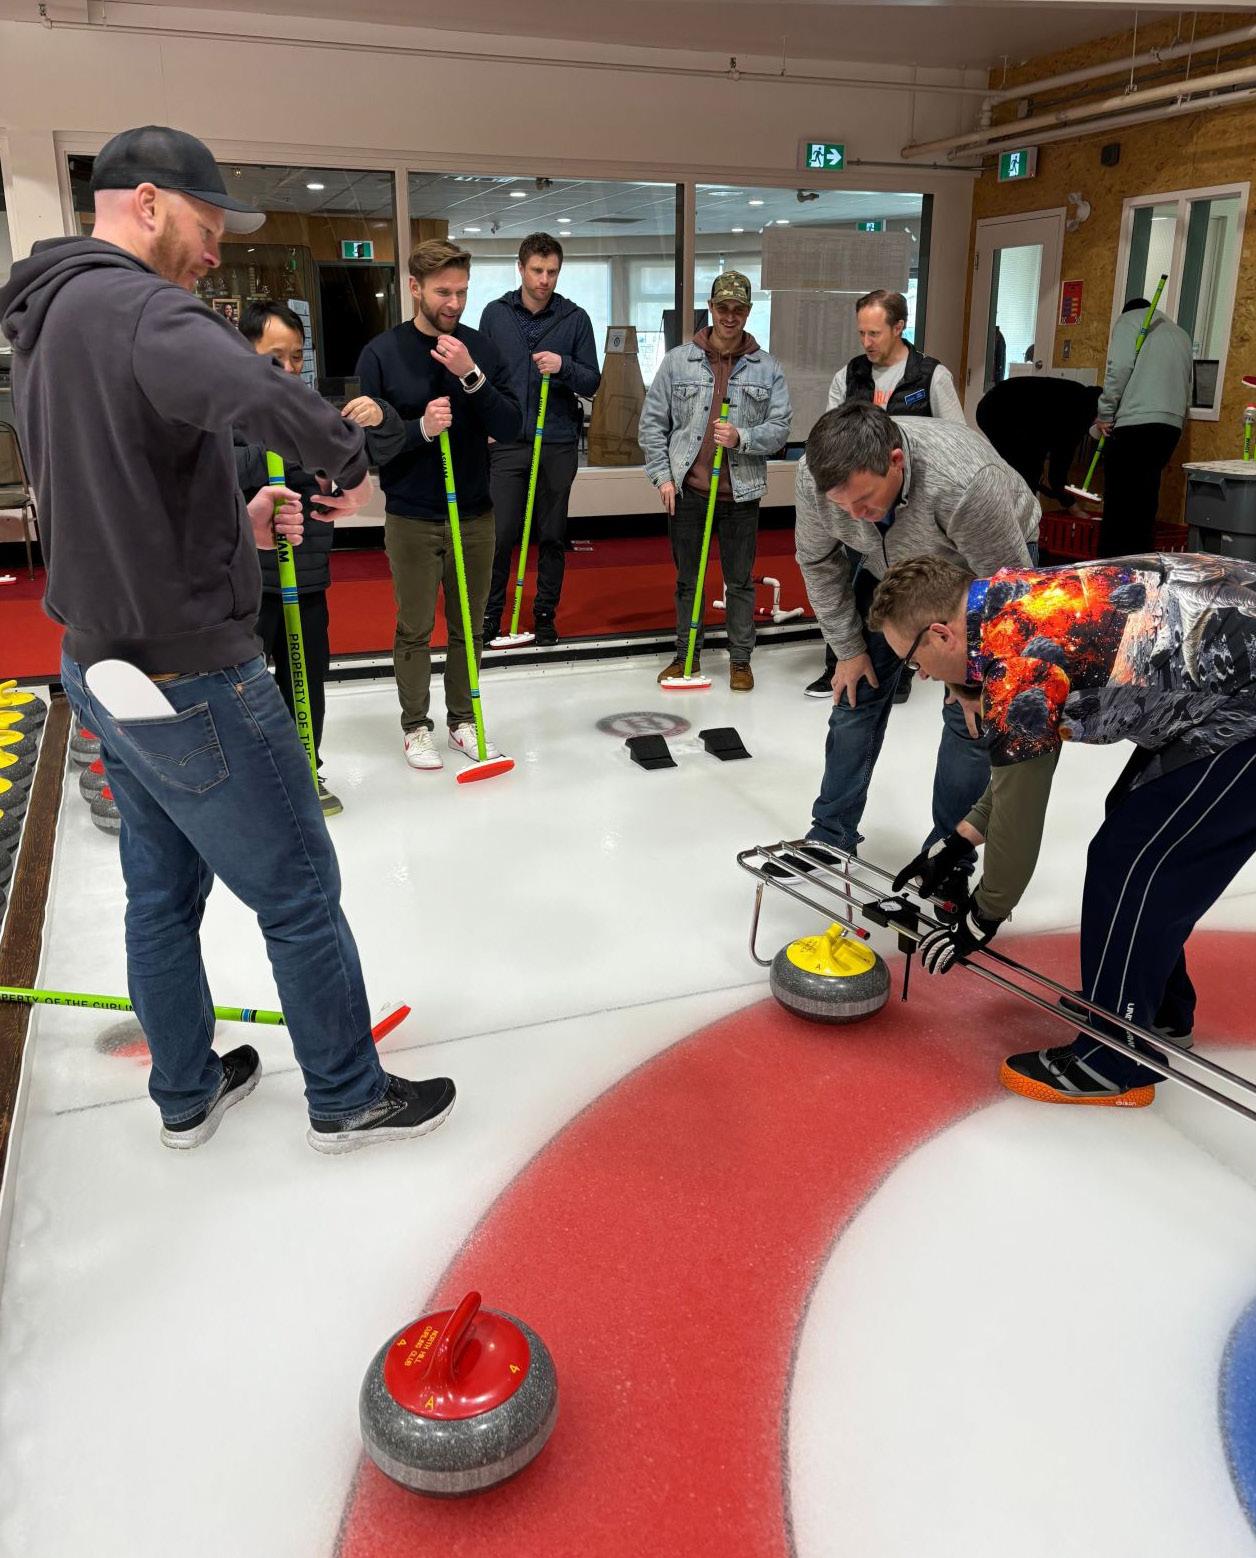
The first-ever CEGA Geospiel, held at the North Hill Curling Club, was nothing short of a triumph. From enthusiastic curlers to dedicated organizers and generous sponsors, the inaugural event brought the geoscience community together in a fun, dynamic, and highly memorable way. Based on overwhelmingly positive feedback from participants, the Geospiel delivered on all fronts—as a social event, networking opportunity, and community celebration. Planning is already underway to bring it back next year, even bigger and better.
Hosting a bonspiel for the first time posed some logistical challenges. With an uncertain number of players, the organizing committee developed low, medium, and high participation scenarios to guide budgeting and scheduling. Incredibly, the event came within just three players of reaching the high-end target of 96 curlers. A total of 22 teams competed across two brackets—Advanced and Beginner—with trophies and prizes awarded to the top four teams in each.
In the B Bracket, Grand Champions honors went to the Haliburton Hitmen (Aaron Hooper, Eric Atamanik, Amy Foster, and Sean Cold). The Conglomerates (Callum Graham, Coline Thiessen, Jeff Fisher, Robert Panek, Sara Ange Mpakou, and Shaharyar Ahmad) claimed second place.
In the A Bracket, Team LXL Consulting (Daniel Perez, Jason Lentz, Marco Perez, and Matt Ng) emerged as the Grand Champions, while Team Sigma (Alex Saldana, Christ Baldwin, Paul Hausmanis, Stephen Kotkas, and Steven Metzger) took home second place.
Of course, this event wouldn’t have been possible without the support of our fantastic sponsors. A special thank you to our Title Sponsor, Cabra Consulting, and our Ice Sheet Sponsors, Halliburton and Phoenix Technology Services.
We also extend our gratitude to our Gold Sponsors: Altitude Energy Partners, Belloy Petroleum Consulting, Chinook Consulting Services, Tetra Tech / RPS Energy, and XRF Solutions.
Silver Sponsors included Co-point, Pro-Geo Consultants, CoreLab, Caltech, Lonestar, and Reservoir Dogs.
Bronze Sponsors were Cordax, Sigma Explorations, and Kokoro Energy.
The three-day event featured a relaxed, social atmosphere enhanced by beverages from our Title Brewery Sponsor, Balzac Brewing. Friday evening’s banquet, catered by the wonderful staff at the North Hill Curling Club, offered a chance for attendees to unwind and celebrate. Numerous door prizes were handed out, many donated by our sponsors and oil-field vendors including Tectonic Energy, McLeay Geological, RigSat/Petrocraft, ShearFRAC, NOV, and VZ Fox.
A huge thank-you goes to the Geospiel organizing committee for their tireless work: Co-Chair Tracy Theunissen, Jeff Fisher (Scheduling), Shannon Ward (Prizes), Gary Bugden (Trophies), Erin James (Sponsorship), and CEGA office support from Julie Beally.
A special shoutout goes to Team Slippery Schists for their creativity in introducing a one-of-a-kind Tumbler Trophy, awarded to the individual that best embodied the spirit of “on-ice crashing.” This year’s recipient was Gary Bugden.
The enthusiasm from attendees and sponsors alike has set the tone for what we hope will become a long-standing CEGA tradition. We can’t wait to see you at next year’s Geospiel!
JON NOAD, STANTEC CONSULTING; UNIVERSITY OF ADELAIDE
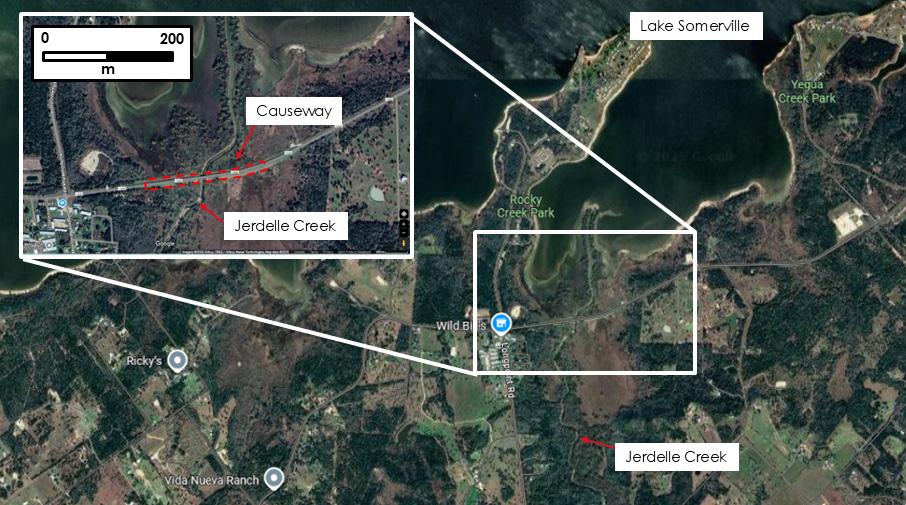
Mass mortality events, particularly those involving vertebrates, have always fascinated me. Tens or even hundreds of animals ending up preserved in a sedimentary deposit is highly unusual. The ways in which it may have happened in the fossil record are diverse and sometimes difficult to explain, an example being the Campanian bone beds of Dinosaur Provincial Park, Alberta and surrounds, for which several models have been put forward over the years (Currie and Koppelhus 2005), now interpreted as a series of storm surges. Interpreting such deposits may be facilitated by referencing modern analogues (Weigelt 1989) but such events are rarely encountered. On a core logging trip to Texas, I was lucky enough to witness such an event in person. I had travelled to Burton, Texas (Figure 1) for a couple of days, and was booked in a small cabin, close to Lake Somerville….
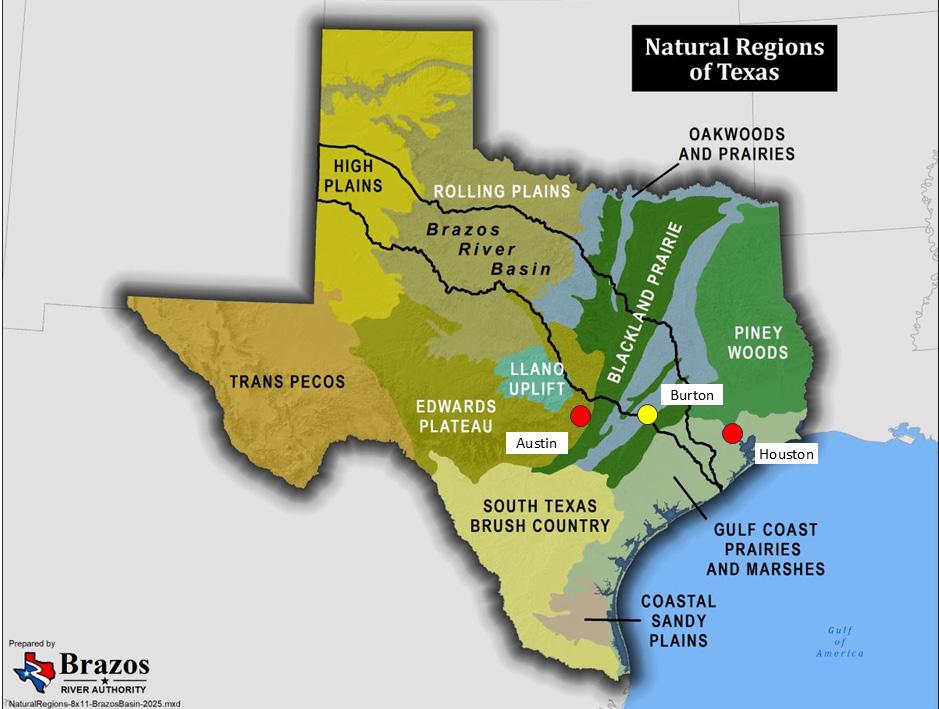
The Brazos River Valley has a long history of flooding, with 43 events recorded between 1912 and 1958. In an attempt to control this flooding, construction of the Somerville Dam began in 1962, and was completed five years later, creating a reservoir named Lake Somerville. The lake is located 32 km upstream of the Brazos River and is fed by three major creeks: the Nails, Yegua and Birch Creeks. Several parks were created along the lakeshore. At conservation level, the lake has a surface area of 11,160 acres, reaching 24,400 acres at peak flood control level. Lake Somerville State Park is located an hour and a half (145 km) from both Austin and Houston and has a network of trails and other activities. Wildlife is abundant including white-tailed deer, fox, coyote, bobcat, river otter, raccoon, rabbit, various waterfowl, quail, painted and snapping turtles, snakes and even the occasional alligator. A diverse bird fauna includes many waterfowl (ducks, geese, waders) and other avifauna including many small birds and a variety of raptors. Anglers enjoy fishing for white bass, crappie, largemouth bass and catfish.
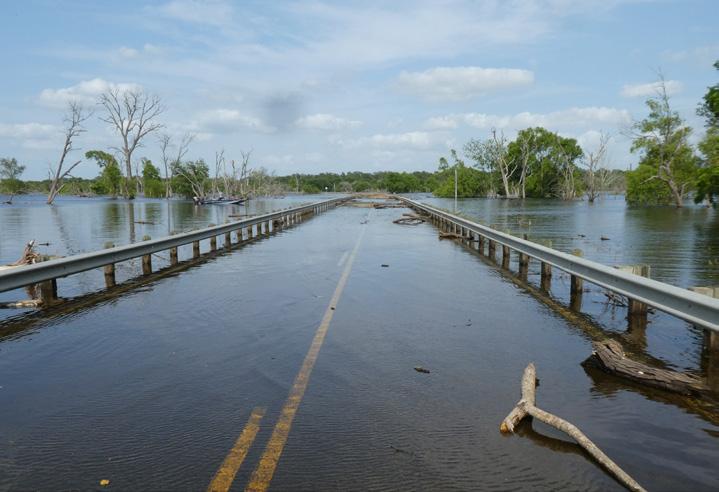
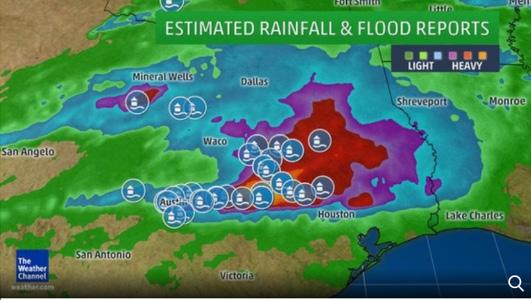
May 22, 2019, saw extensive flooding in Texas. Over 43 cm of rain hammered the official reporting station in Brenham, 21 km east of Burton, shattering the 24-hour record for Washington County, Texas (Figures 2 and 3). Rain gauges overflowed and numerous roads were flooded with several washouts reported (weather.com, May 27, 2019).
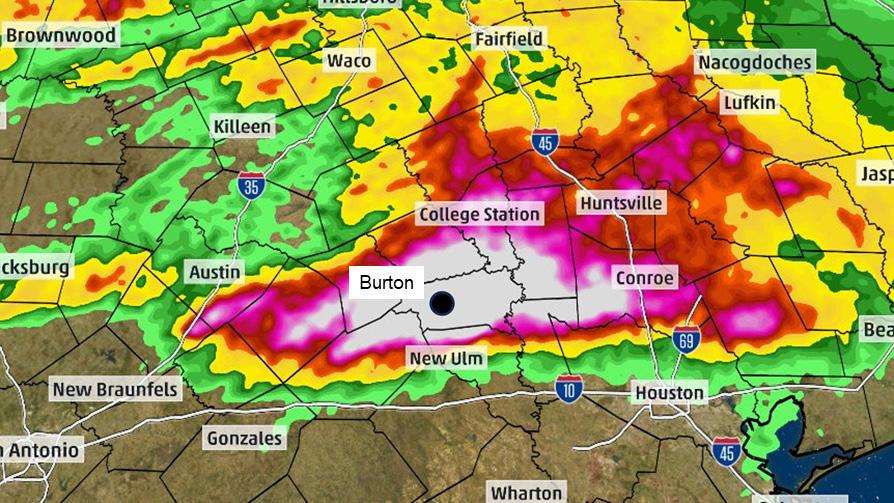
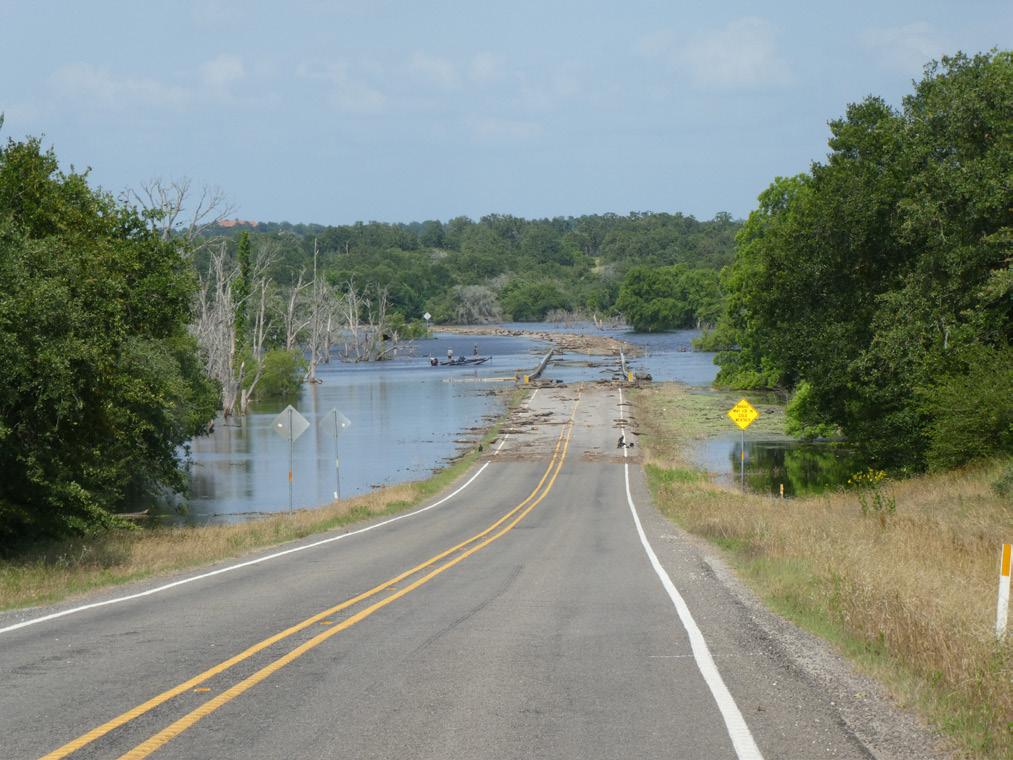
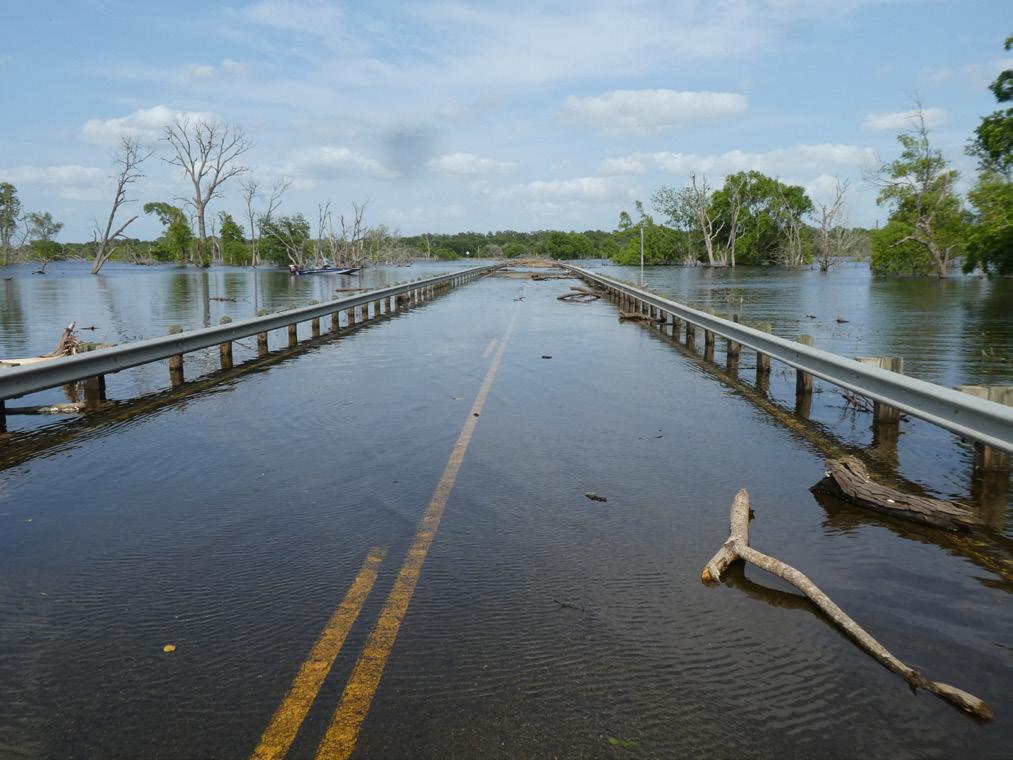
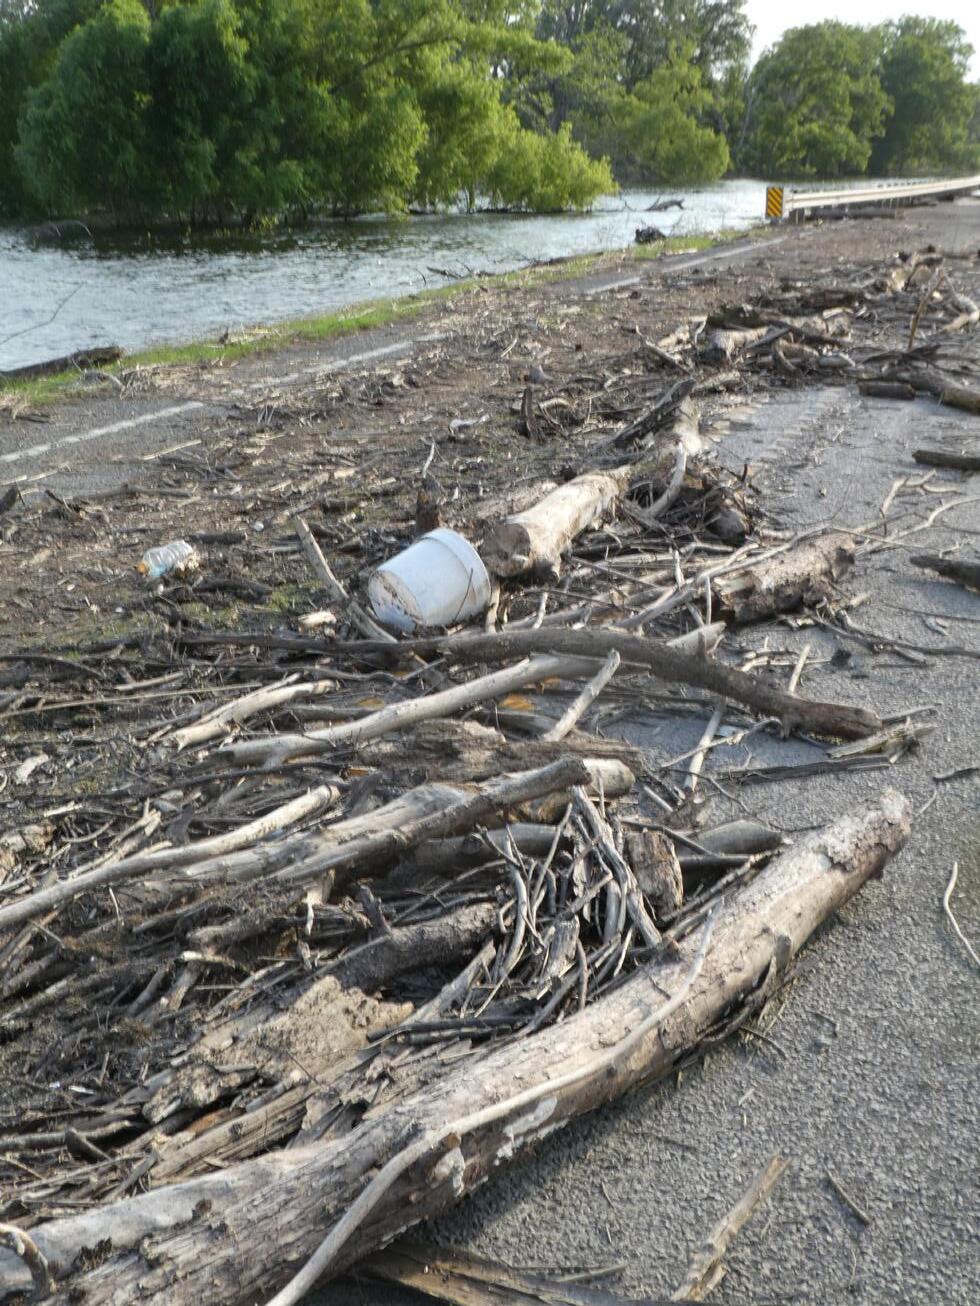
One of the areas most affected was close to Burton, Texas, 30 kilometres southwest of College Station, where the base level of the Somerville Lake rose by more than 6 feet. The resulting flooding inundated low points on the southern margin of the lake, including causeway sections of Highway 1948 (Figure 4).
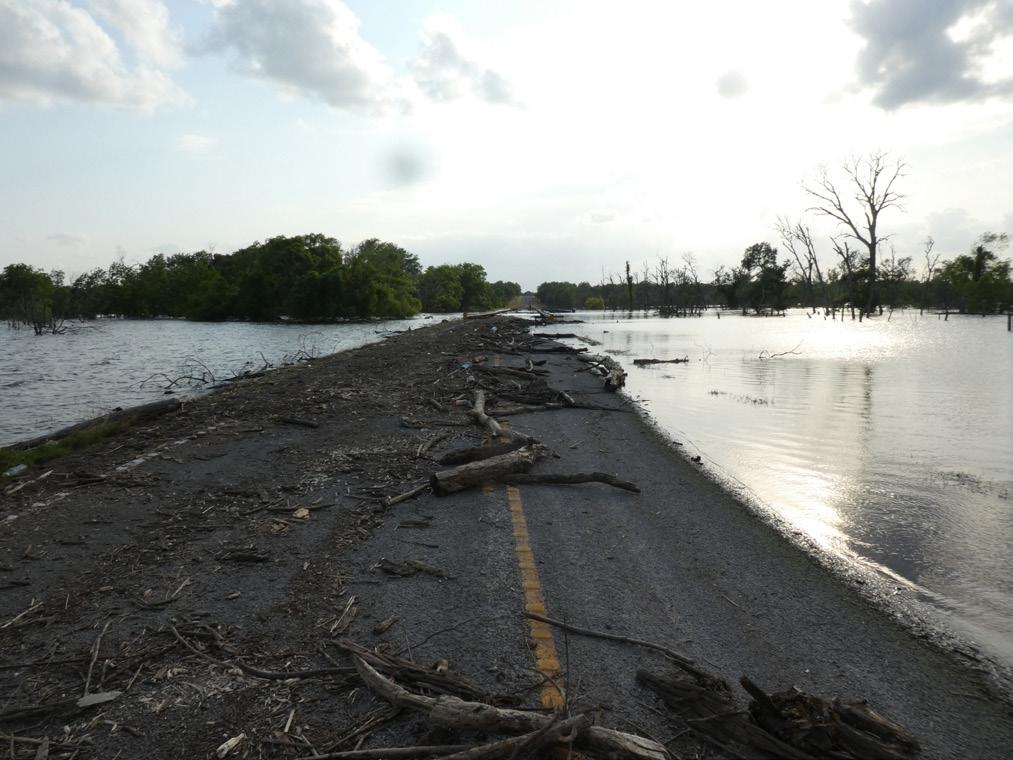
I arrived in Burton on May 27 and drove along Highway 1948. Just east of the junction with Rocky Creek Park Road the road sloped down to a causeway that forded Jerdelle Creek (Figure 4). The creek was flowing swiftly across the western end of the roadway, to a depth of more than 50 cm in places and overall, the submerged section of road stretched for
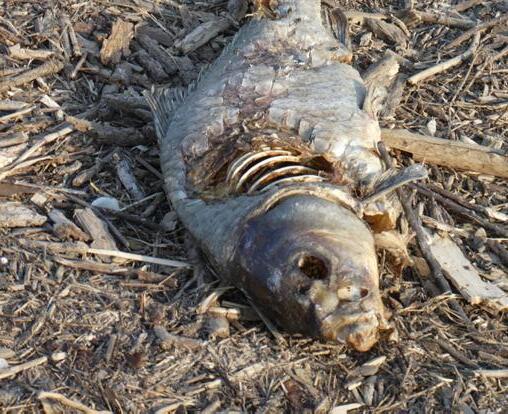
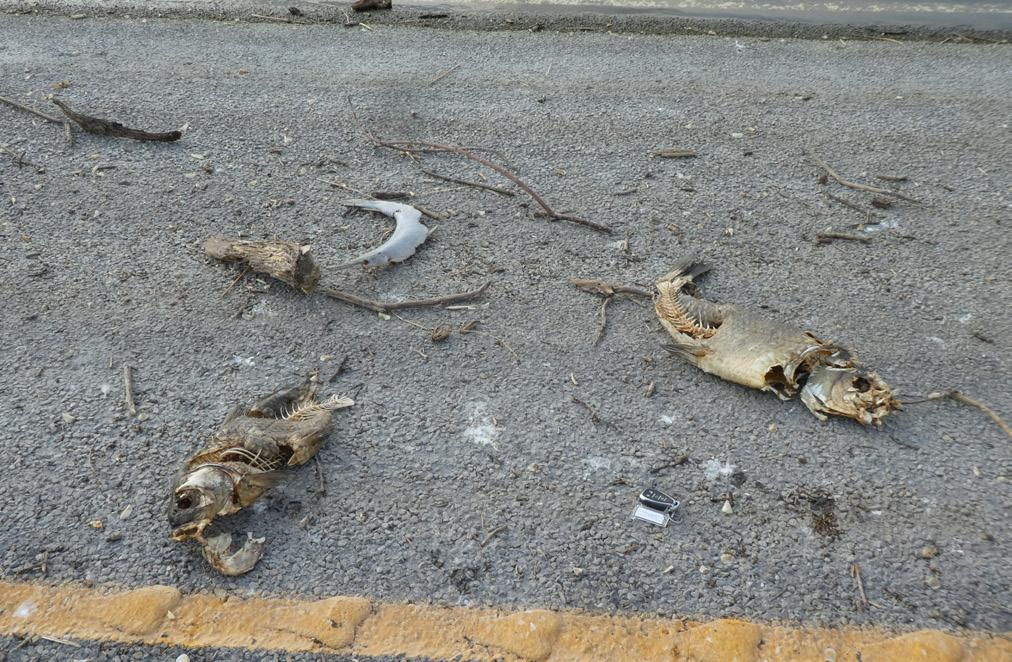
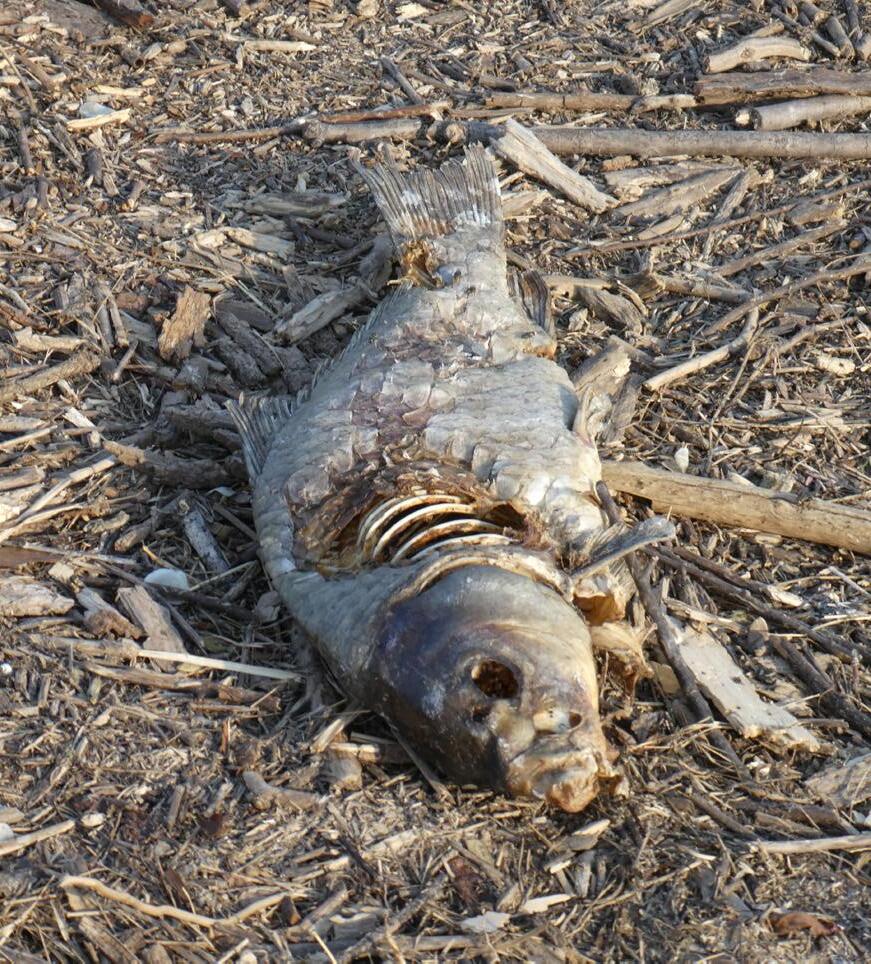
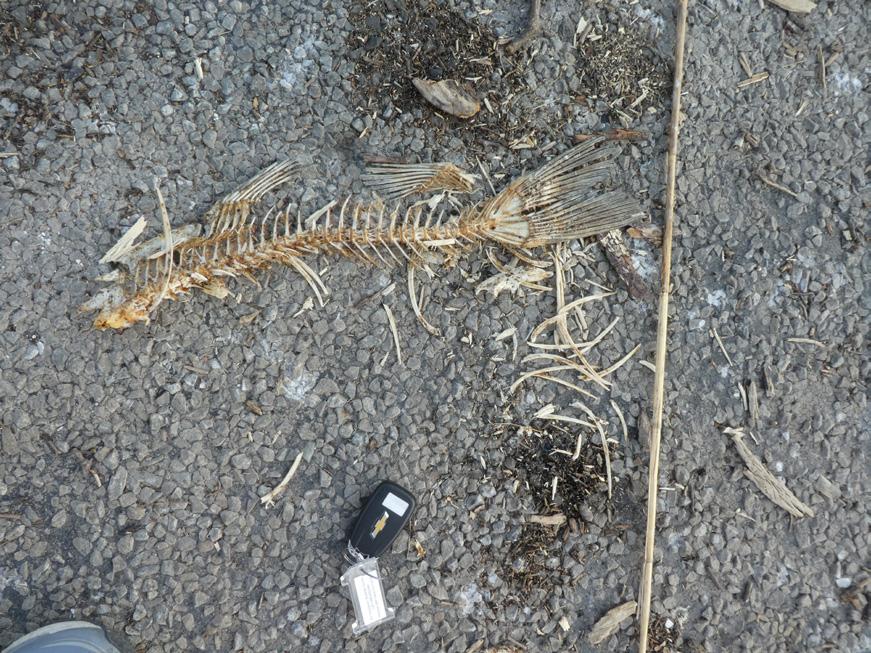
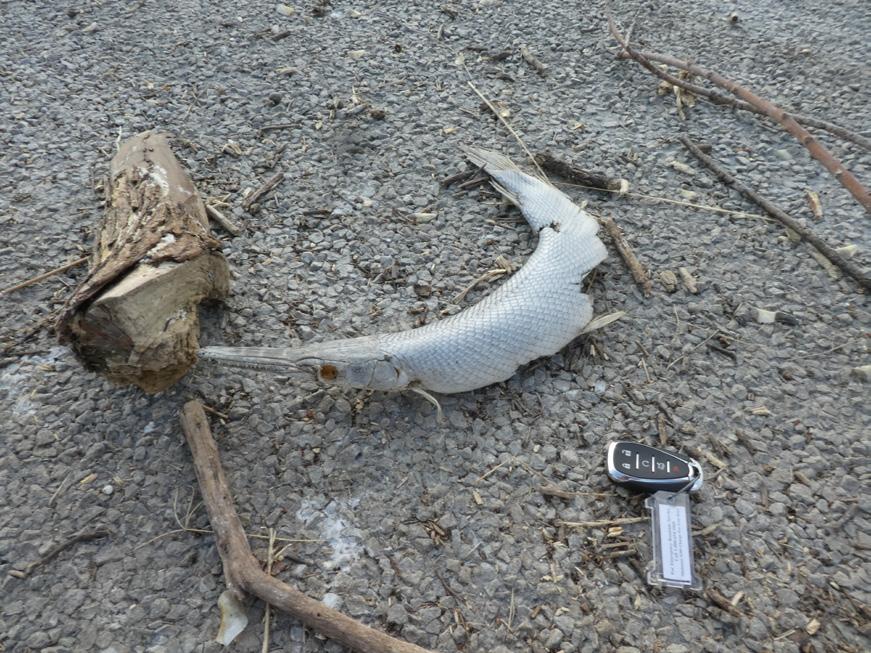
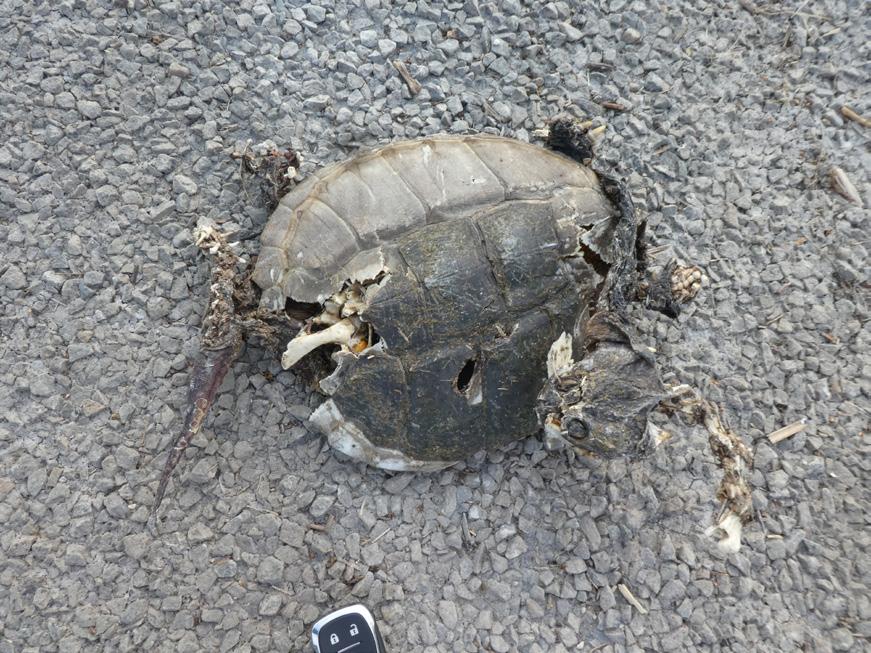
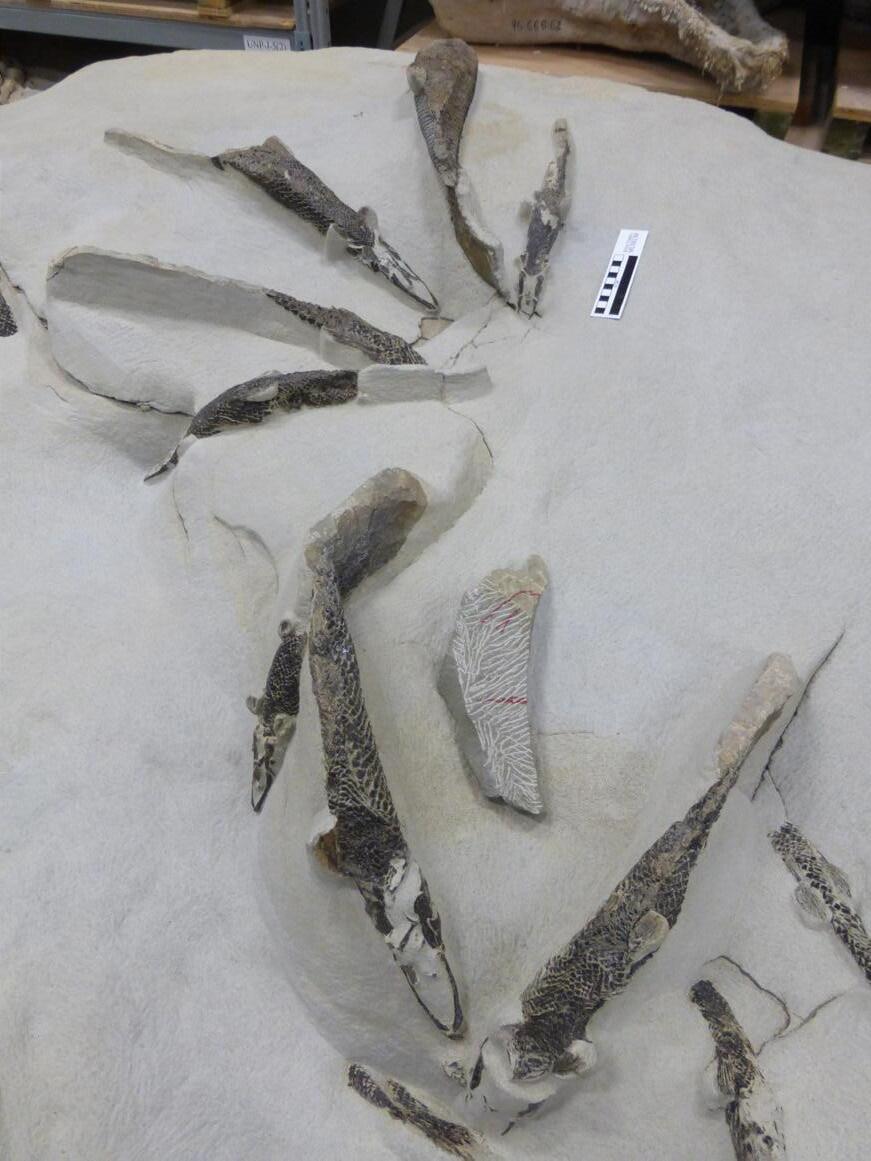
more than 200 m (Figures 5 and 6). Over the next two days, as the flood waters receded, it left the roadway littered with logs, branches (Figure 7) and the carcasses of many large fish and other vertebrates (Figure 8). Using backroads, I was able to visit both ends of the causeway and to survey the material strewn along the road.
Taphonomy is the study of what happens to organic remains after death (Efremov, 1940; www.si.edu, 2025), including how they decayed and were fossilized. The five stages of taphonomy are disarticulation, dispersal, accumulation, fossilization, and mechanical alteration, all of which may provide critical data to help determine the animal’s behaviour in life, ecology and cause of death. Ideally it should also be possible to build up a temporal series of events that led to the death, burial and fossilization of the organism (Efremov, 1940).
Most of the material trapped on the causeway consisted of branches and logs. Tree trunks up to 50 cm in diameter were observed along the causeway, along with some plastic debris (Figure 9). The trees and branches were mostly oriented parallel to the roadway and perpendicular to flow.
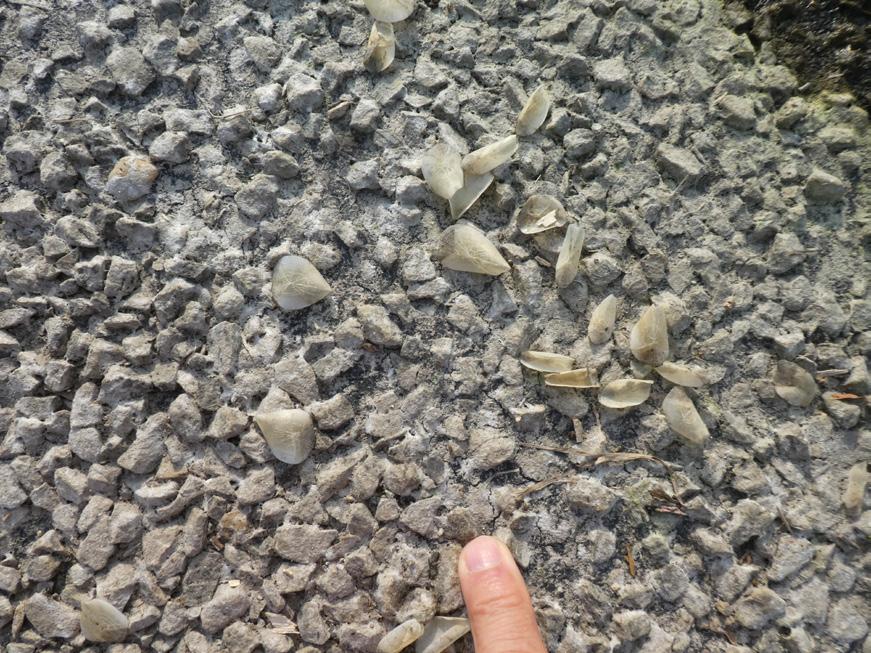
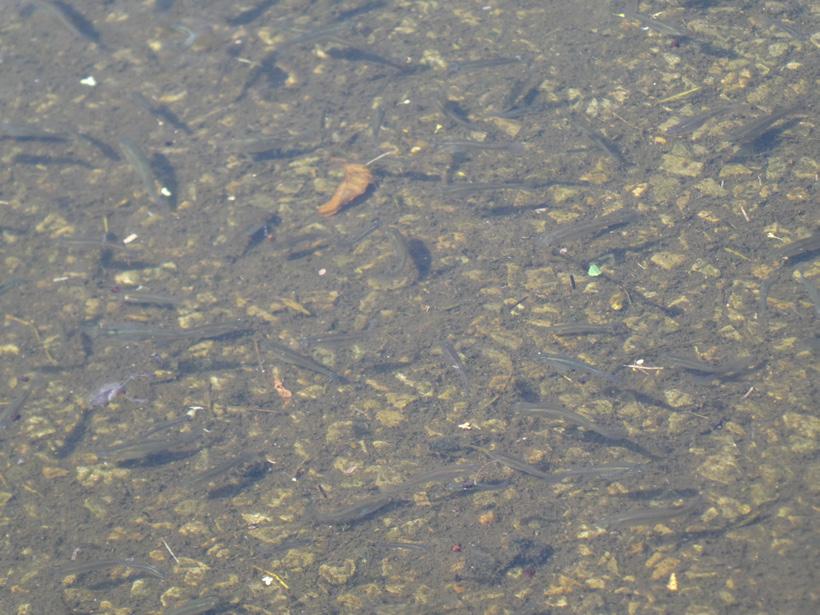
The bodies of more than 50 fish were scattered along the roadway, some more than 50 cm in length. Occasionally the bodies were still fleshed (Figure 10), although most were preserved as skeletons (Figure 11), some dissociated. Scattered ribs were all that remained of some fish, and there were also patches of fish scales (Figure 12). Most of the fish were oriented approximately parallel to the road orientation. Bass made up the majority of the remains (Figure 10), with at least three alligator gar (Figure 13) and the bodies of two snapping turtles (Figure 14). No smaller fish carcasses were observed, which can be attributed to either flow characteristics across the roadway (small fish bypass versus large fish strandings) and/or to activity by turkey vultures and other smaller scavengers. Many living, small fish (minnows?) were observed swimming in the shallows of the flooded lake (Figure 15) showing that they do occur in this environment
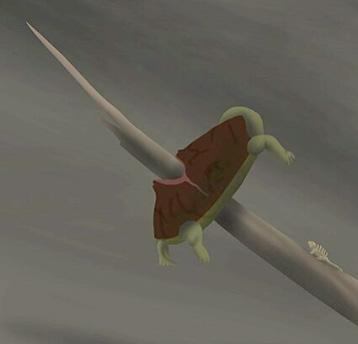
(L) Carcass of snapping turtle
(R) Artist’s impression of impaled turtle at Tanis (YellowPanda2021)
yet are not represented in the death assemblage. The process(es) by which these carcasses were segregated provides possible mechanisms to explain similar deposits in the fossil record, contrasting with other fish-dominated, mass mortality bone beds deposited during droughts, as middens and due to poisoning of the waters due to deoxygenation or bush fires. Animals of all ages are typically preserved in those deposits.
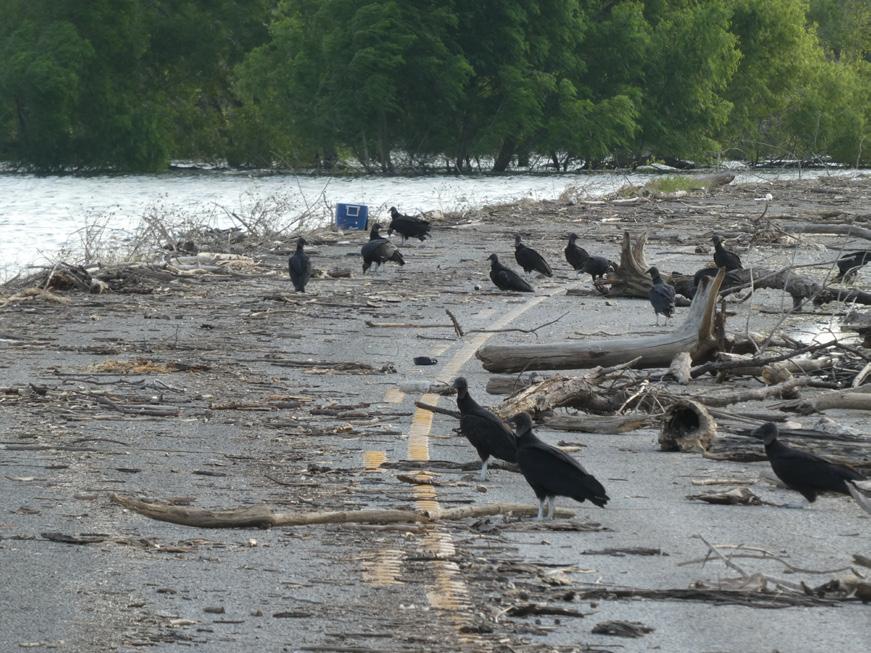
The importance of scavengers in processing the carcasses cannot be overstated. More than 100 vultures were observed in trees at the western end of the causeway and feeding on the fish remains (Figure 16). The treed birds would periodically fly down to graze upon one of the fish carcasses. The birds usually removed the flesh from the fish while leaving the skeletons lying on the ground (Figure 17), sometimes assisting in the dissociation of the individual bones. Numerous fish heads were separated from the remainders of the skeletons. It is probable that the birds removed any remaining smaller carcasses to feed on away from their peers.
The flood deposit near Burton is just one modern example of a vertebrate mass mortality event. Re-imagining this event in the fossil record, one could envisage a shallow, bedrock shelf crossing a creek bed (Figure 18), represented by the roadway in the modern, upon which large fish may have become stranded during periodic flooding. Sorting of the carcasses through flow separation or the removal of smaller remains by scavengers might lead to the preservation of large-bodied fauna only. Later, a rapid influx of sediment, carried downstream by further flood waters, would be sufficient to bury the carcasses, possibly leading eventually to fossilization of the fish.
Three deposits have been selected to demonstrate how observations from Burton can be applied to other ancient fluvio-estuarine deposits. Photographs of fossils from these sites have been juxtaposed with photos from the modern Burton event to demonstrate its use as an analogue.
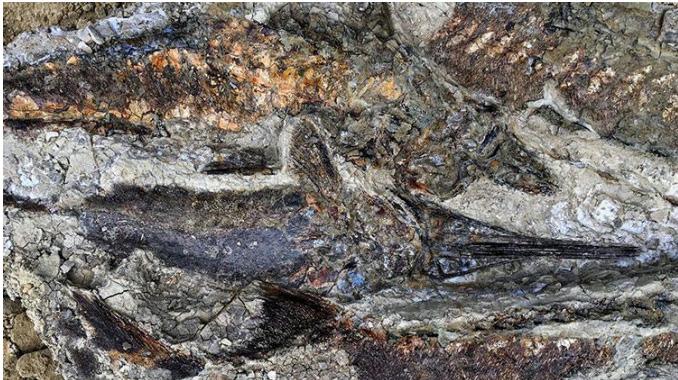
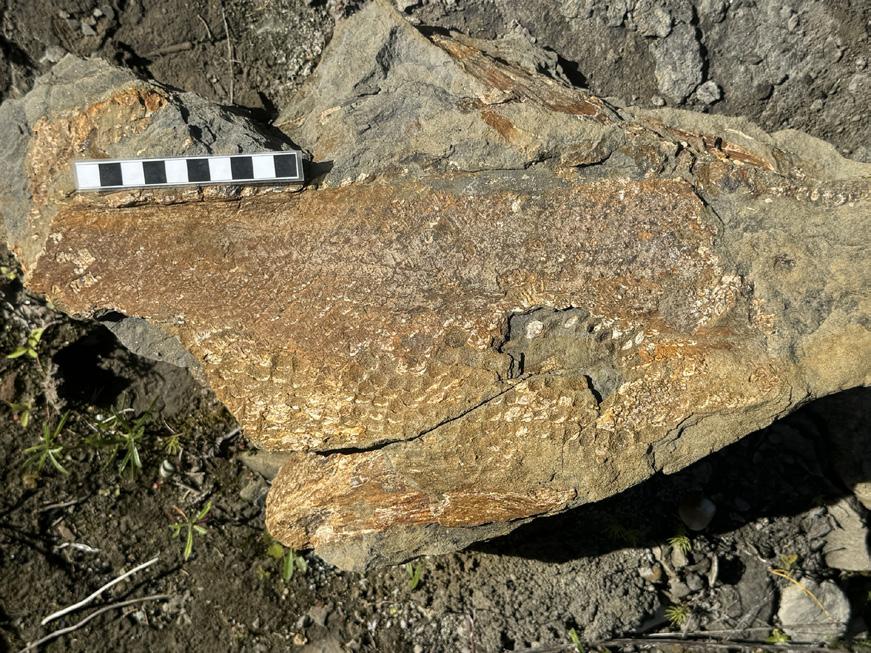
The first, unnamed site outcrops southeast of Fort St. John, Alberta, where fossil fish remains were found in interpreted Cretaceous, estuarine channel deposits. Stacked, wavy laminated sandstone beds (Figure 19) contained large pieces of carbonized wood (Figure 9), representing the remains of branches and tree trunks. Several relatively large, threedimensional sections of fish torso with scales were recorded (Figure 10), as well as isolated patches of fish scales (Figure 12). Using the observations from Burton, the fish deposit at the unnamed site could be interpreted as a flood deposit. The large sections of fish closely resemble some of the remains of fish skin-clad carcasses from Burton. The discovery of a single, smaller skeleton may indicate less flow sorting or scavenging.
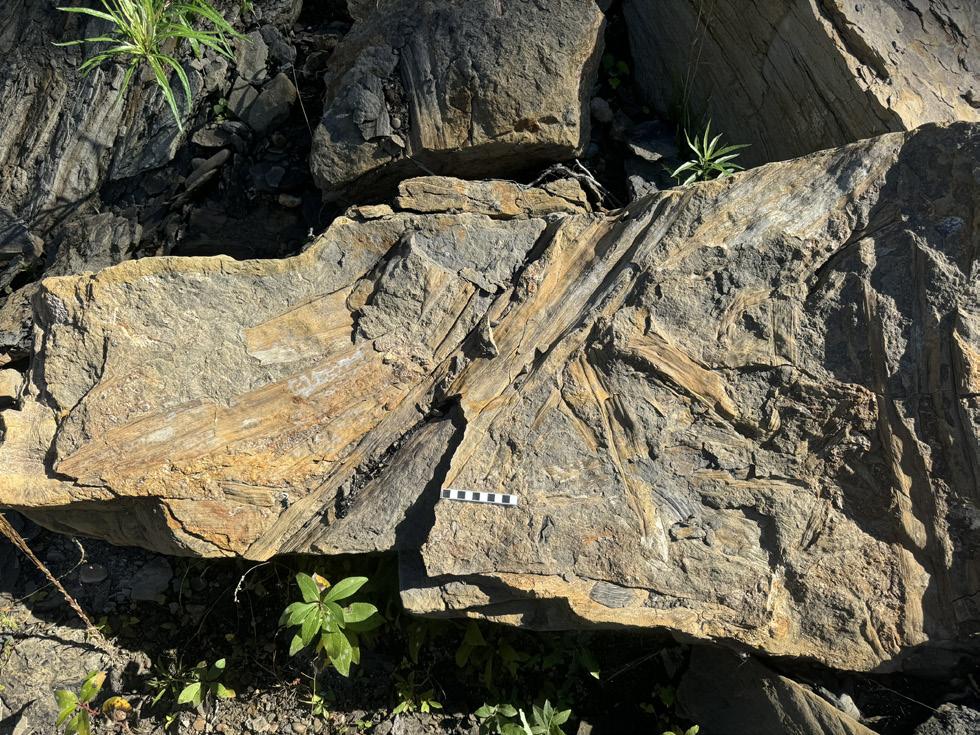
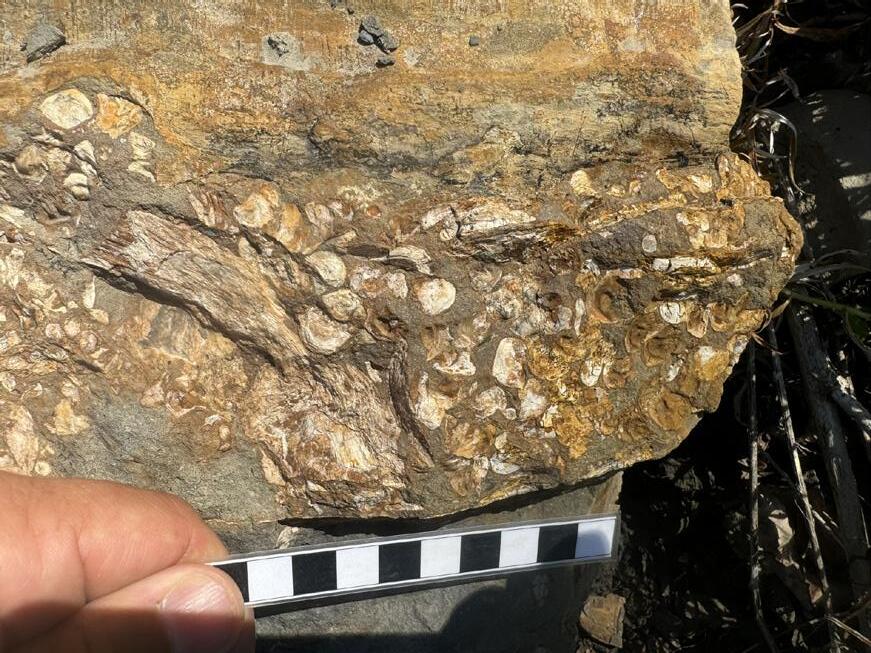
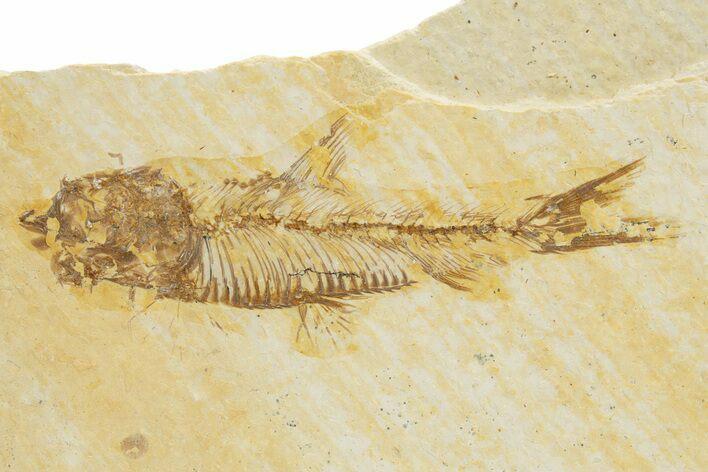
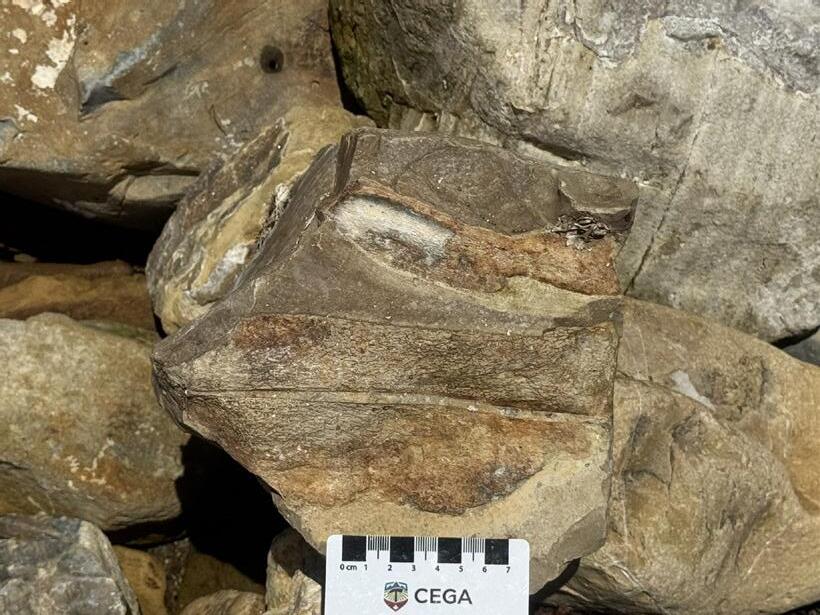
A shoal of fossil gar fish was discovered in a Paleocene boulder at Okotoks, Alberta. A total of 21 fish were exposed over three years of painstaking preparation by staff at the Royal Tyrrel Museum of Palaeontology. The fish were mostly complete and preserved upright in the fluvial sandstone matrix (Figure 13). The reason for their demise is unclear, although their apparently random distribution across a bedding plane (as opposed to being washed together) makes flooding unlikely. Could this be a response to anoxic conditions or even poisoning of the water? Figure 11 shows an Eocene fish skeleton from the Green River Shales of Wyoming for comparison purposes, thought to have been preserved due to a combination of anoxic conditions and rapid burial on the lakebed.
The second Cretaceous site is more famous – the Tanis fossil site in North Dakota. Tanis appears to record, in extraordinary detail, extensive evidence of the direct effects of the giant Chicxulub asteroid impact event, 66 million years ago (DePalma et al 2019; Wikipedia 2025). The site was originally discovered in 2008, and forms part of a river bend (fining upward, point bar deposits) in an ancient meandering river in the Hell Creek Formation. Seiche waves up to 100 m in height, triggered by seismic waves related to the initial asteroid impact (DePalma et al 2019) are thought to have washed together marine and freshwater animals and plants, together with microtektite droplets and impact debris. The waves are thought to have occurred in an onshore storm surge (DePalma et al 2019).
Fossils are preserved in three-dimensional detail (Figure 8). These include articulated freshwater fish, diverse dinosaur remains and even a turtle impaled on a tree branch (Figure 14) as well as many other unique fossils. Hundreds of fish were preserved, distributed by size and showing evidence of suffocation in a single event (DePalma et al 2019). Comparing the fossils to the modern mass mortality event at Burton, many similar animals were extant, a single catastrophic event created each of the deposits, but it appears that in Tanis, there was no post-event sorting, which led to the preservation of ancient animals of all ages, almost certainly due to rapid burial.
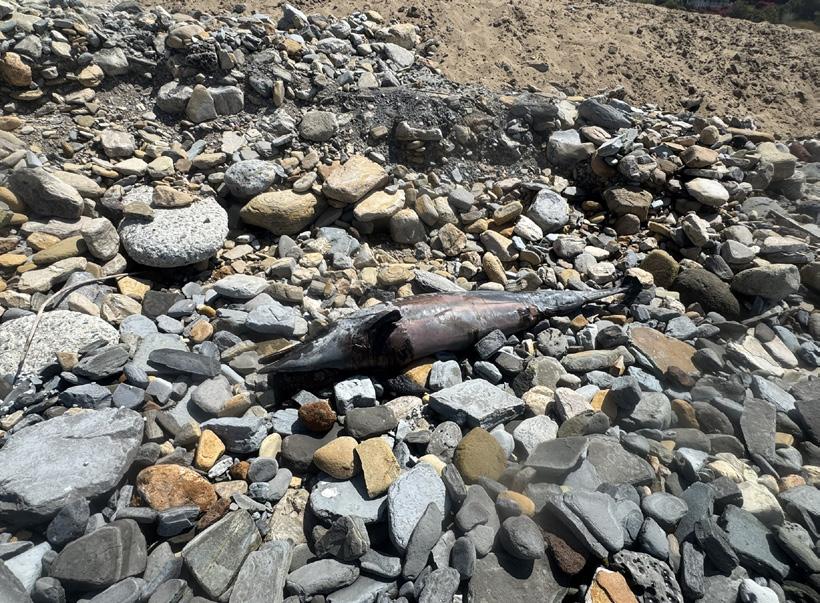
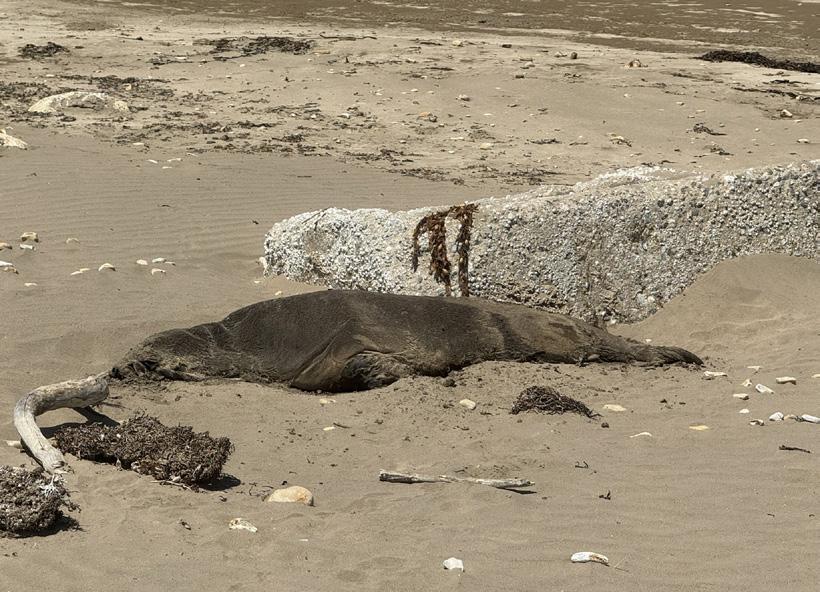
It is important to document such mass mortality events, many of which are reported in the press. Multiple records can be used to develop predictive models that can then be applied to similar deposits in the fossil record. Events are often related to climatic extremes including flood, famine, cold snaps and heatwaves (and associated wildfires and landslides). Poisoning is another possibility; the author recently observed several dead dolphins and sea lions (Figures 20 and 21) on a beach at Portuguese Bend, south of Los Angeles, that had been killed by a red tide (an algal bloom related to overwarmed seawater). Ironically, I was prospecting for fossil whales at the time (Figure 22). Other mass fatalities may be related to gas release (volcanic or CO2 escape), killing fields, disease or a variety of other causes, including human activity. Identifying which of these causes is responsible in each case relies primarily on the taphonomy of the fossils. However, elucidating “what happened” may be facilitated by recording the sedimentology of the deposit, its provenance, any unusual structural features (possibly indicating landslips or earthquakes), geochemical signatures, associated fossils of other species and any other data that may help to pinpoint the “smoking gun”.
Brazos River Authority. 2025. Map: Natural Regions of Texas.
Currie, P.J. and Koppelhus, E.B. (Eds.). 2005. Dinosaur Provincial Park: A Spectacular Ancient Ecosystem Revealed. Indiana University Press.
DePalma, R. A., Jan Smit, D. A. Burnham, K. Kuiper, P. L. Manning, A. Oleinik, P. Larson, F. J. Maurrasse, J. Vellekoop, M. A. Richards, L. Gurche and W. Alvarez. 2019. A seismically induced onshore surge deposit at the KPg boundary, North Dakota. PNAS, vol. 116, no. 17, pp. 8190-8199. Efremov, I. A., 1940. Taphonomy; new branch of paleontology, Pan-Amer. Geol., 74, 81–93.
This article summarizes observations made relating to a single mass mortality event, itself related to an extreme weather event. Many such events are reported in the press, and it is essential that each one is studied and recorded. Much can be learned from them and applied to interpreting similar such events in the fossil record, as demonstrated above. It may also be possible to use them predictively to search for further fossil beds. Hopefully, if a reader comes across an unusually rich palaeontological trove, your first thought will be “how did this happen?”, before you start collecting specimens.
Frenz, B. and Arnold, K. 2019. Birds of Lake Somerville State Park. A field checklist. Texas Parks and Wildlife.
Klym, M. 2008. An Introduction to Texas Turtles. Texas Parks and Wildlife. https://www.si.edu/spotlight/taphonomy website of the Smithsonian Institute, accessed May 2025.
Weigelt, J. 1989. Recent Vertebrate Carcasses and their Paleobiological Implications (translated from the original German book, published in 1927). University of Chicago press.
https://weather.com/storms/severe/news/flash-flooding-texas-severe-weatherforecast-plains-may27 website accessed May 2025.

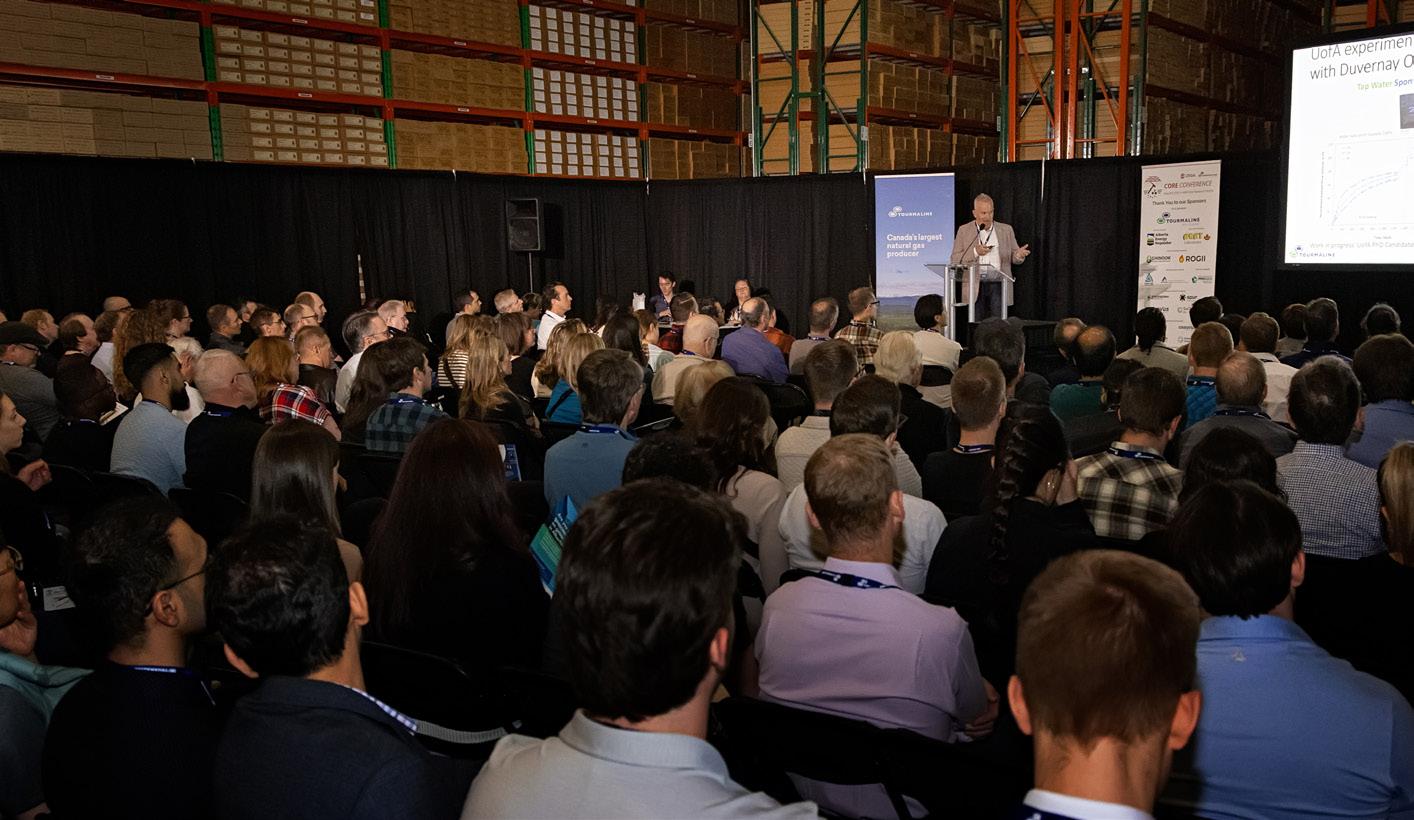
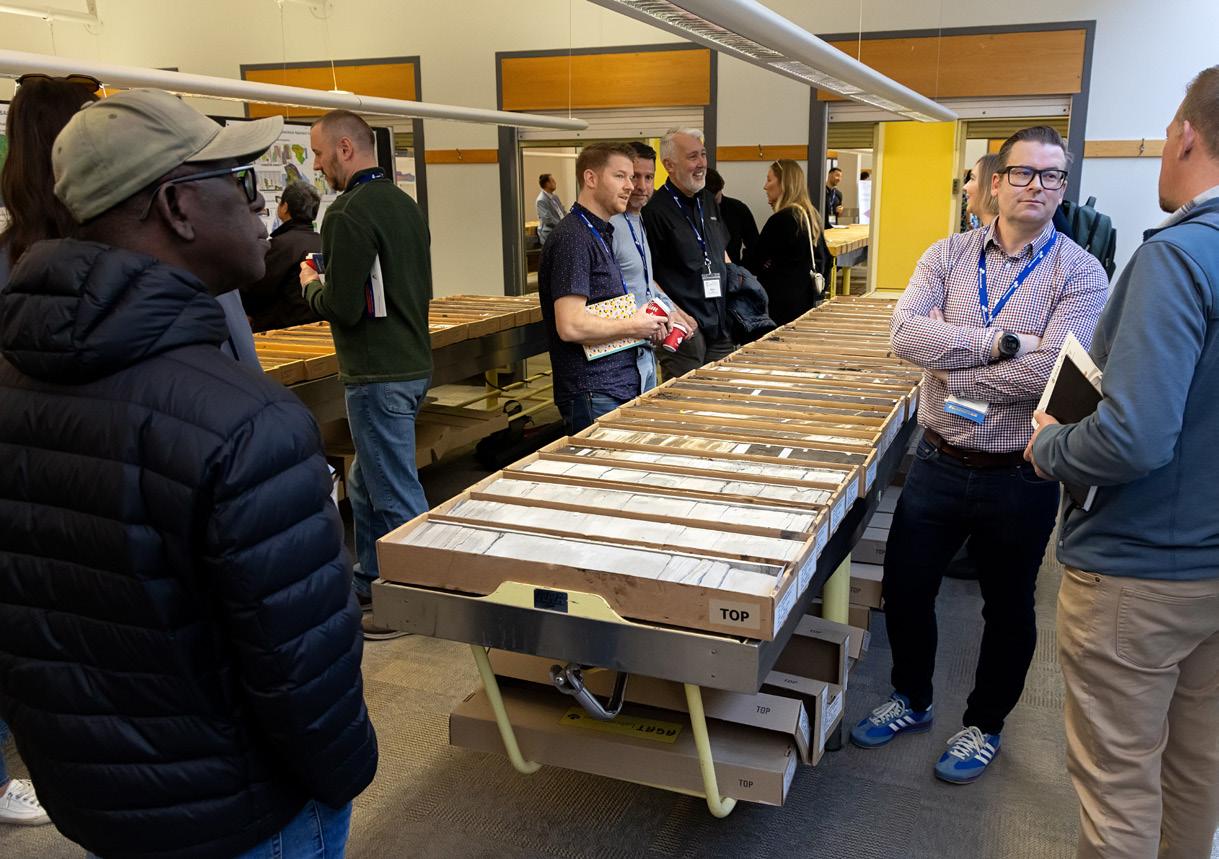
The 2025 CEGA Core Conference featured outstanding presentations and core displays showcasing nearly 50 unique cores from across Canada. Presenters shared their expertise across a wide range of geoscience disciplines, sparking valuable collaboration and insightful debate among delegates. Our theme, “Establishing Connections: The Interplay of Rocks, Energy, and People,” reflected not only the technical discussions on the geological record and energy resources, but also the personal connections that make this conference so special. It is a place where we gather to learn, exchange ideas, and reconnect with friends and colleagues who share our passion for rocks and energy.
This year, we had a fantastic lineup of 21 presenters from industry, government, and academia, who shared insights across four diverse themes: unconventional reservoir characterization of the Montney and Duvernay; stratigraphic frameworks and basin evolution from the Devonian to the Cretaceous across Canada; reservoir characterization for energy storage and sequestration; and exploration of the deep subsurface, including the Basal Cambrian complex and basement rocks.
SAGD operations, and so much more! We are deeply grateful to all our presenters, who generously shared not only their time but also their expertise and diverse perspectives on the challenges and innovations shaping our evolving industry.
Over the course of two days, presentations explored depositional settings and stratigraphic correlations within the Western Canada Sedimentary Basin, geo- and thermochronological methods for basin analysis, ore deposits in the Yukon, and reservoir characterization in
Turnout was exceptional and exceeded our expectations, with 613 delegates in attendance. It was a pleasure to welcome both familiar and new faces to the conference. The positive momentum continued into the Meltdown social, held offsite at the Canadian Brewhouse in the University District, where we caught up with colleagues, talked rocks, and celebrated the close of a successful event.
A HUGE THANK-YOU TO EVERYONE INVOLVED— WHAT A JOB WELL DONE!
Congratulations to the two Pemberton Award winners for best overall presentation: Henry Galvis, for his presentation on the Duvernay Formation, and David Herbers and Tyler Hauck, for their presentation on the stratigraphy of the Basal Cambrian. Additionally, Maziyar Nazemi, along with co-authors Shahin E. Dashtgard, Paula Ramirez-Lopez, Francyne Bochi do Amarante, and James A. MacEachern, won the Baillie Award for best student presentation and the $1,000 prize. Maziyar’s presentation focused on the characterization and architecture of subsurface strata in the Whatcom Sub-basin of the Georgia Basin, and its implications for CO₂ storage in the Lower Mainland of British Columbia.
This conference would not have been possible without the generous support of our sponsors and advertisers. We extend our sincere thanks to our title sponsor, Tourmaline Oil Ltd., for their continued and invaluable support of the Core Conference. Core Laboratories sponsored the delicious coffee break snacks, while AGAT Laboratories provided the always-popular BBQ lunch. ROGII Inc. and Chinook Consulting Services returned as sponsors for the Core Meltdown social. APEGA sponsored the printed program book, and Pro Geo Consultants supported student participation through the student registration sponsorship. We are also grateful to our session sponsors: Strathcona Resources, Spur Petroleum, Cenovus Energy, and Saturn Oil + Gas. A special thank-you to our Premium Core Supporter and Core Supporter Level sponsors: Canamera Coring, Cenovus Energy, ConocoPhillips Canada, Green Imaging, and Imperial Oil. Finally, we are immensely thankful to the AER Core Research Centre for pulling core and granting us access to their world-class facility, as well as to the Saskatchewan Subsurface Geological Lab, the BC Energy Regulator’s Core Research Facility, and the Yukon Geological Survey for allowing us to borrow and showcase core samples.
It has been a true team effort to bring the 2025 conference together, and we were fortunate to have an amazing group of volunteers. Special thanks to: Scott MacKnight, Veren; James Burr, Spur Petroleum; Celine Chow, Saturn Oil + Gas; Carolyn Currie, Cenovus Energy; Lauren Eggie, Imperial Oil; Mastaneh Liseroudi, Natural Resources Canada; Ozzy Ofoegbu, Cenovus Energy; Colin Thiessen, AGAT Laboratories; and Michael Webb, Michael Webb Geoconsulting. We would also like to extend our appreciation to Kristy Casebeer, Kevin Webb, and the staff at the CEGA office for their invaluable support in organizing this event.
A huge thank-you to everyone involved—what a job well done!
And to all who attended the conference, thank you for being part of it. We look forward to seeing you at next year’s conference and to the new opportunities, connections, and conversations it will bring.

Simon’s introduction to CEGA came as a participant with the CSPG’s SIFT (Student Industry Field Trip program) in 1997 when he was completing a B.Sc. in Earth Sciences at Brock University. This led to a summer student job in the oilpatch, which opened his eyes to the opportunities out west. He still recalls being told in 2nd year paleontology in 1996, that oil and gas was a “sunset industry”, yet almost 30 years later it is still going strong.
He joined Shell Canada in 2003, after completing an MSc. at the University of British Columbia. Shortly thereafter, he was approached to join the CSPG’s University Outreach Committee as the student chapters liaison for Ontario and Quebec. Simon later chaired the Outreach Committee from 2009 through 2010 and eventually joined the CSPG Board as Outreach Director from 2011 to 2012. This overlapped with a term as a Trustee with the CSPG Educational Trust Fund (now the CSPG Foundation) to help direct funding to various outreach programs. From a technical perspective he chaired sessions on Canadian Frontier geology at GeoConvention, in addition to oral and core presentations at the CSPG Core Convention.
In 2019, after returning from a posting with Statoil in Europe, Simon was asked to form a GeoLeader’s Forum by the current CSPG President Jen Russel-Houston. The idea was to invite technical geoscience leaders from Calgary-based petroleum companies to meet quarterly, provide direct feedback to the CSPG Executive, and to encourage industry networking opportunities for the people who oversee the technical geoscience work of their staff. This has been expanded to include geoscience leaders associated with other forms of energy resources, including critical minerals and geothermal. From 2020 through 2023 he assumed the role of Secretary on the Steering Committee for the 2027 Western Canada Geological Atlas.
In 2022, Simon spent his year as CSPG President-Elect forming and working with a committee to reinvent the Society. As the oil and gas industry experienced a decadelong contraction, the CSPG membership dropped to half of what it had been previously. Discussions with various geoscientists who had left the Society over that timeframe suggested that as they were no longer working in the hydrocarbon space, they no longer felt welcome. At the 2023 CSPG AGM, his first motion as President was to change the name of the CSPG to the Canadian Energy Geoscience Association (“CEGA”). It was overwhelmingly supported and accepted.
Outside of CEGA, Simon has volunteered on the Boards of the Canadian Global Exploration Forum (CGEF) and with the Burgess Shale Geoscience Foundation. He is still involved with the latter and enjoys guiding people to see the 505-million-year-old fossils at Walcott Quarry, near Field. BC. He and his wife Cathy are active in the outdoors, hiking, biking, paddling, and cross-country skiing.

Peter Aukes has been an active member of the Canadian Society of Petroleum Geologists (CSPG), now CEGA, since 1981, beginning his professional journey as a geologist with Norcen Energy Resources. Over four decades, Peter has demonstrated exceptional dedication to advancing the mission of the Society through consistent and meaningful volunteer service.
In the 1980s, Peter organized luncheon talks for the Sedimentology Division and contributed significantly as an Associate Editor for the CSPG Bulletin throughout the 1980s and 1990s. He played a key role in organizing the CSPG Core Conferences in 1986 and 1989 and was actively involved in the committee for the National Conference on Earth Science (widely known as the “Banff” Conference) during the same era.
His contributions did not wane with time. In the decades that followed, Peter continued to serve the Society with the same commitment, including his role on the Thesis Award Committee and, since 2012, as a member of the R.J.W. Douglas Medal Committee. He has also regularly contributed to the annual GeoConvention, serving as a session chair on multiple occasions.
Early in Sam’s geology studies at the University of Calgary, she was determined to make connections and discovered Calgary’s incredible geoscience community. She became involved in various geoscience community initiatives, such as the Rundle student geoscience club, Science Mentorship, Earth Science for Society, GeoConvention, and Friday Afternoon Talk Series. Her interest in clastic rocks led to internships in the Canadian energy industry, solidifying her passion for petroleum geoscience. This led to an MSc. in Geology, where she was team lead for the Imperial Barrel Award team that placed third globally and first in North America. After graduating, Sam joined Tourmaline Oil Corp. as an area geologist. Sam is responsible for Tourmaline’s South NEBC assets, running an active drill program, contributing to land sales, mergers, and acquisitions within her area. She is a part of Tourmaline’s summer student committee, helping to plan and organize internship opportunities.
Sam joined the CSPG as a student member after learning about outreach initiatives and opportunities to expand her career. Through a networking event, Sam met professionals who recommended the Student Industry Field Trip (SIFT). CEGA’s SIFT program was instrumental in launching Sam’s career, giving her a foundation of petroleum geology skills before her first internship. After attending SIFT, she became involved with the program, initially coordinating the 2-day core workshop and later serving as Co-Chair during the transition from CSPG to CEGA. During her tenure, she helped expand the program to include topics like geothermal energy, lithium, surficial geology, geomechanics, and wellsite geology.
Sam is grateful for CEGA’s ongoing commitment to mentorship and professional development and is honored to receive this award.

Zach Toews is a young professional with approximately four years of experience in the oil and gas industry. Growing up in a small town in southern Manitoba far from any outcrops, Zach’s passion for geology was sparked by stumbling onto an unexpected source—Geomore.com. The websites breakdown of a Petroleum Geologist’s role, highlighting their work with computers, data, and maps, set him on the path to a career that blends technical expertise with industry innovation.
Zach earned a B.Sc. (Honors) in Geology from Brandon University in 2020 before pursuing a master’s degree at the University of Calgary under the supervision of Dr. Per Pedersen. His research combined advanced data analysis with geological principles, further solidifying his interest in leveraging data and technology to drive innovation in the field.
Professionally, Zach has gained valuable experience working in various capacities as a Geologist with ARC Resources Ltd., Syncrude Canada Ltd., McDaniel & Associates Consultants, and his current position at Cenovus Energy. These roles have allowed him to develop a well-rounded skill set, balancing technical geological work with hands-on industry experience.
Beyond his professional work, Zach is deeply passionate about mentorship and industry collaboration. His first introduction to CEGA came as a student on the Student Industry Field Trip (SIFT) in 2017. After moving to Calgary for his master’s, he began volunteering with SIFT, eventually taking on a leadership role. He has been actively involved with SIFT and currently serving in his second year as Co-Chair. His commitment to fostering connections between students and industry professionals reflects his belief in the power of mentorship to shape the next generation of geoscientists.
Zach looks forward to continuing to blend research, data-driven insights, and mentorship to contribute to the ongoing evolution of the oil and gas industry.
DALLIN LAYCOCK, PAUL BREMNER, SEAN FLETCHER, ERIN PEMBERTON, RICHARD MACKENZIE, HAN BYUL WOO
Part I of this series argued that access to oil resources was a significant factor that set the stage for World War II, and described the actions of major geopolitical powers in the European, African, and Middle Eastern theatres under this umbrella. By the beginning of the 20th century, petroleum had become critical to the growth of major economies and power, and played a central role in setting up the conditions for war. Picking up where Part I left off, Part II expands into the Pacific theatre of the war - Japan’s conquest for access to much-needed oil reserves.
Japan’s urgent need for oil during World War II was rooted in its regional geology, which was not conducive to petroleum production. Situated at the eastern edge of the Eurasian Plate, Japan is adjacent to multiple subduction zones formed at the junction of the Pacific and Philippine Sea Plate. This region’s accretionary tectonics and volcanism produced an island characterized by metamorphic and igneous rocks (Taira, 2001). Unlike continental landmasses like the Middle East or North America, which have extensive sedimentary basins, Japan’s fragmented and geologically young landscape lacks the petroleum system elements conducive to significant reserves (Tatsumi, 2006).
Japan’s absence of domestic petroleum production significantly influenced its foreign policy and military strategy in the early 20th century. Unlike the United States, the Soviet Union, or British-controlled territories in the Middle East and Southeast Asia, Japan had virtually no domestic oil or gas resources, making it heavily reliant on imports (Yergin, 1991). This dependency created a strategic vulnerability that ultimately propelled Japan’s imperial expansion and led to its decision to go to war.
By the 1930s, Japan was rapidly industrializing, and its military ambitions necessitated a steady and secure supply of oil. Without domestic sources, Japan relied heavily on imports from the United States, the Dutch East Indies (modern-day Indonesia), and Britishcontrolled Borneo (Iriye, 1987). As geopolitical tensions rose, Japan’s need for oil became a crucial factor in its aggressive expansionism and its eventual confrontation with the United States (Figures 1 and 2).
The lack of petroleum in Japan and the abundance of it in Southeast (SE) Asia was the driving force behind Japan’s imperialist expansion (Figure 2). As such, the stage was being set for the Pacific Theatre of WWII, approximately 750 million years before WWII, as the geologic history of Japan began with the breakup of the Rodinia supercontinent. The splitting of the South China and North American tectonic plates created the Paleo-Pacific ocean (Isozaki et al., 2010, Wakita, 2013). The PaleoPacific oceanic plate began to subduct under the South China continental plate around 500 million years ago, which led to the formation of ProtoJapan. Until approximately 30 million years ago (Ma), proto-Japan was situated on the continental margin of Asia, at which point back-arc spreading led to the opening of the Sea of Japan (East Sea).
The bulk of the geologic record of Japan reflects a complex history of accretionary complexes, igneous activity, and metamorphism (Figure 3). These accretionary wedges commonly contain sedimentary rocks accreted from the seafloor during subduction. Common components of these complexes include: pelagic and hemipelagic sediment, limestone, siliceous shale, sandstone, conglomerates, felsic tuff, as well as basalt from subducting seamounts (Wakita, 2013). The most extensive of these are the Jurassic accretionary complexes that comprise a large portion of the Japanese archipelago. These accretionary complexes are not all metamorphosed, but are commonly altered locally through lowtemperature and high-pressure metamorphic, or high-temperature and low-pressure metamorphic processes.
Volcanism in Japan occurred concurrently with the accretionary and metamorphic processes, all of which are related to the tectonic processes of subduction and arc volcanism (Figure 3). Major plutons of the archipelago developed in the Paleozoic, Mesozoic, and Cenozoic,
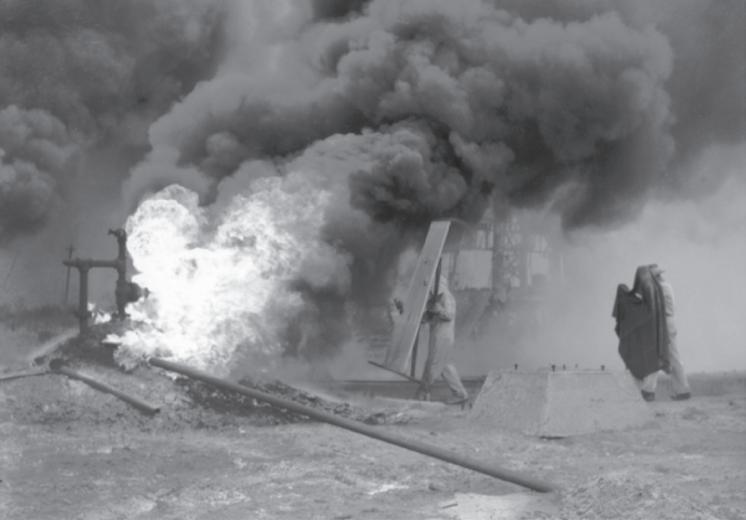
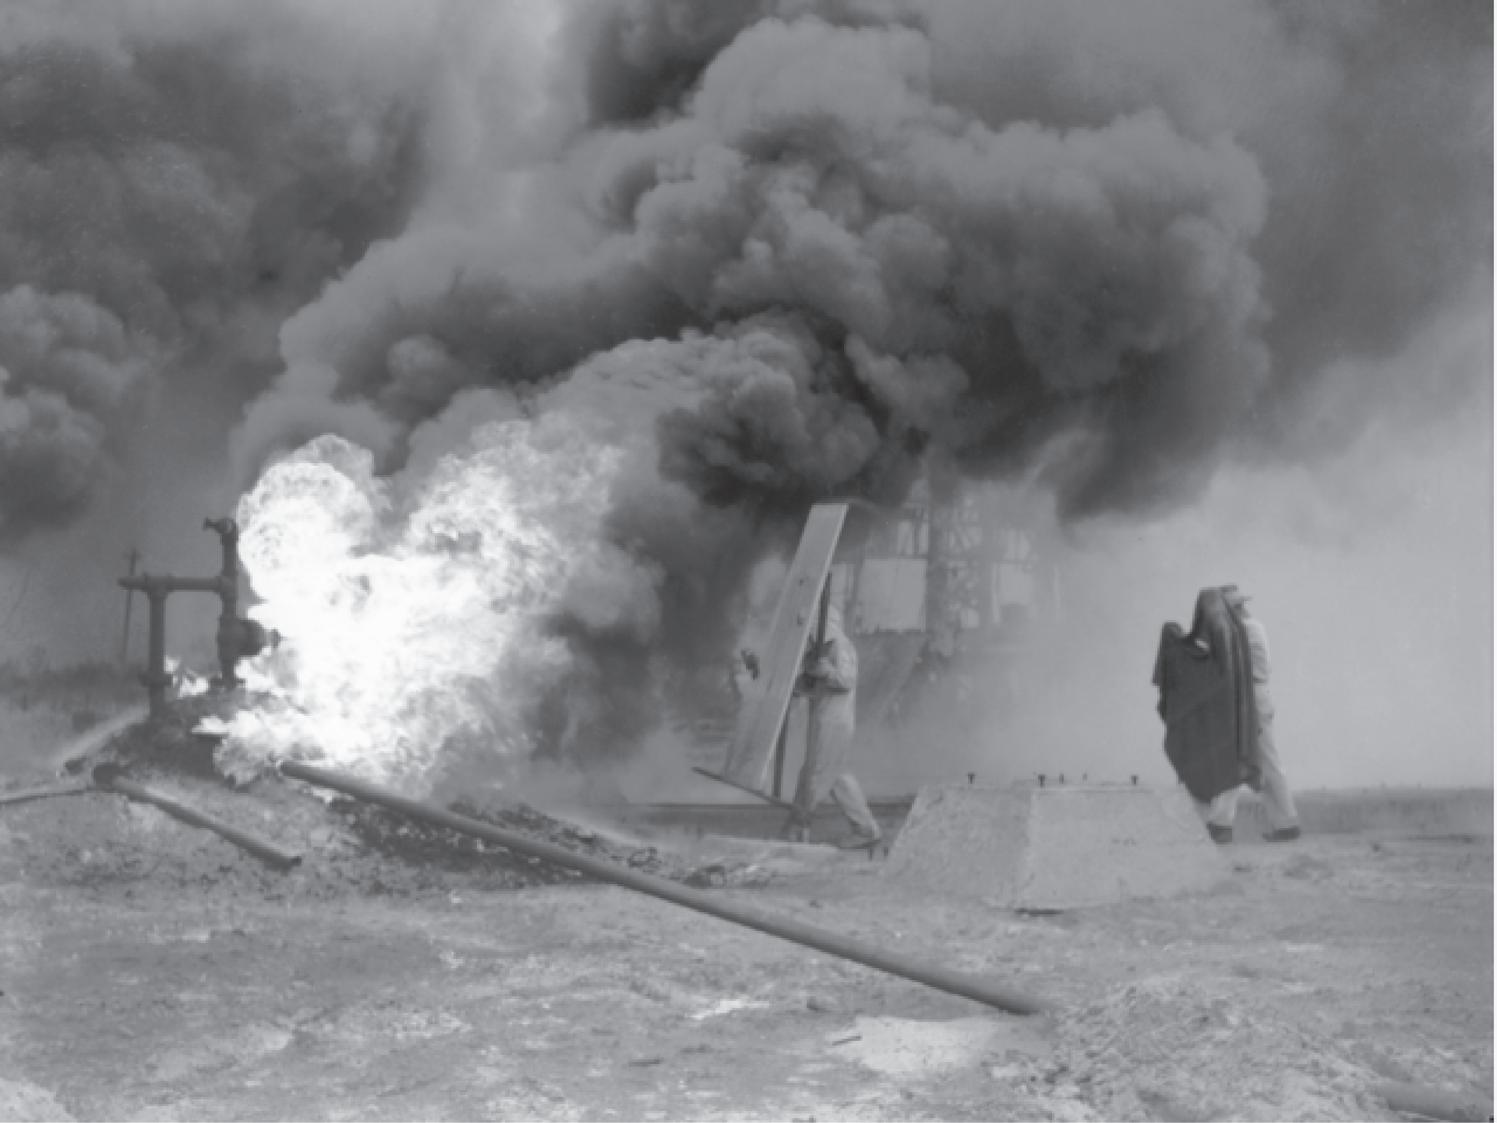
Figure 1: Staff Sergeant M.C. Butler, of the Royal Australian Engineers works to extinguish an oil well fire in Borneo on July 1, 1945. Here he is shown wearing a fire-resistant asbestos suit and holding a shield to allow him to get close enough to the blaze. Image courtesy of the Australian War Memorial.
with the youngest being the Takidani Granite, which represents one of the youngest granites in the world at 1-2 Ma (Wakita, 2013). As a whole, this history of igneous activity, accretionary tectonics, and metamorphic processes was not conducive to the development of petroleum-bearing formations.
The lack of petroleum development in Japan left them to search for it in other ways, either through trade or through war. Approximately 4000 km to the south, many petroleum-bearing basins could be found in the islands around SE Asia (Figure 2) and would eventually become the focus of Japan’s imperialist expansion. But what was different about the geologic history of SE Asia that allowed it to develop hydrocarbons? The geologic setting of SE Asia is not too dissimilar from that of Japan. Both are island arcs on subduction zones on the eastern margin of Asia. However, as we demonstrate below, there is one key difference in their geologic histories that dictated the distribution of these valuable resources.
The region of Southeast Asia sits at the intersection of the Indian-Australian Plate, the Eurasian Plate, the Pacific Plate, and the Philippine Sea Plate, with the
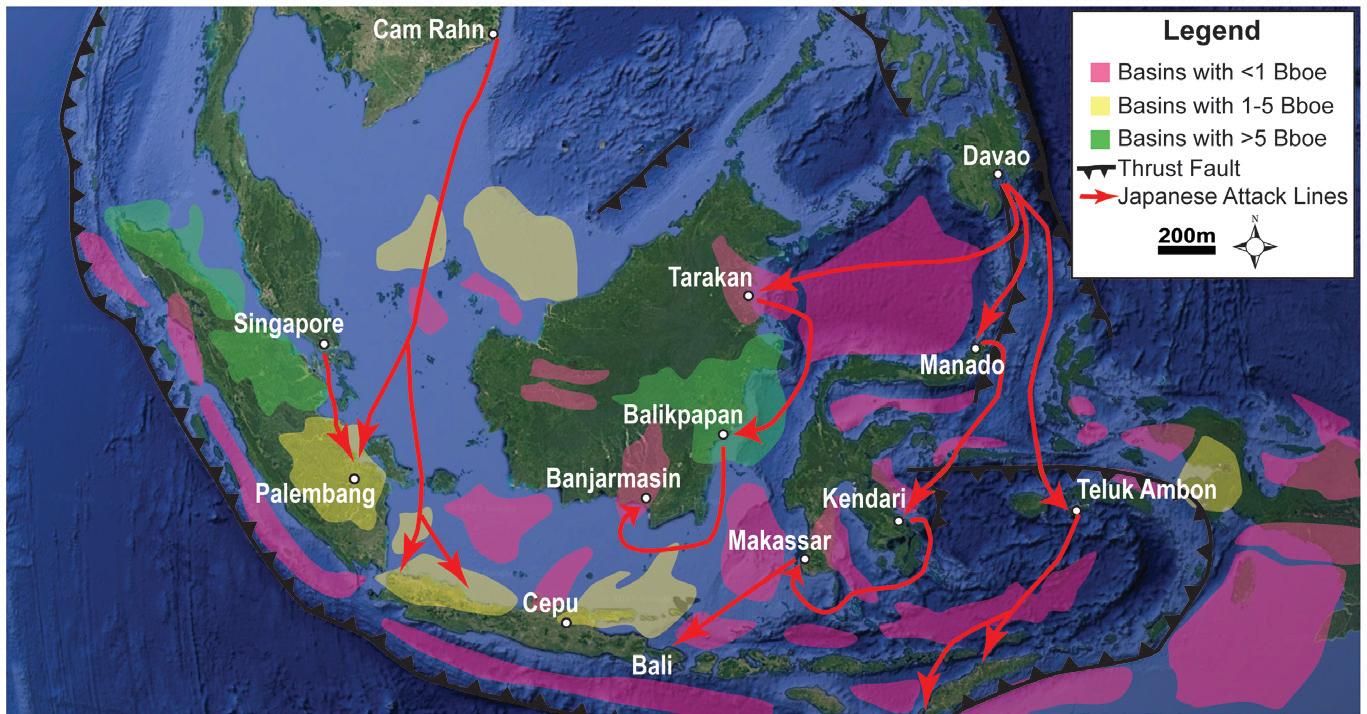
Figure 2: Map of Southeast Asia, showing major thrust faults and sedimentary basins, coloured according to resource volumes (modified from Doust and Noble, 2008 and Metcalfe 2011). Japanese attack lines shown with red arrows. Base map from Google Earth. Bboe = billion barrels of oil equivalent.
bulk of Southeast Asia located within the Eurasian Plate. This results in a complex and intense history of tectonic and magmatic activity (Wang et al. 2023). The region as a whole encompasses a partially drowned continental landmass referred to as Sundaland. This submerged continental shelf has undergone a series of marine transgressions over the past 400,000 years in response to eustatic sea-level changes, but prior to that was permanently exposed (Sarr et al. 2019).
In the late Mesozoic, Sundaland was predominantly composed of granitic and metamorphic rocks, bounded to the east and west by subduction zones (the Tethys Oceanic Plate on the west, and the Pacific Ocean Plate to the east). The tectonic evolution of the region is too complex to
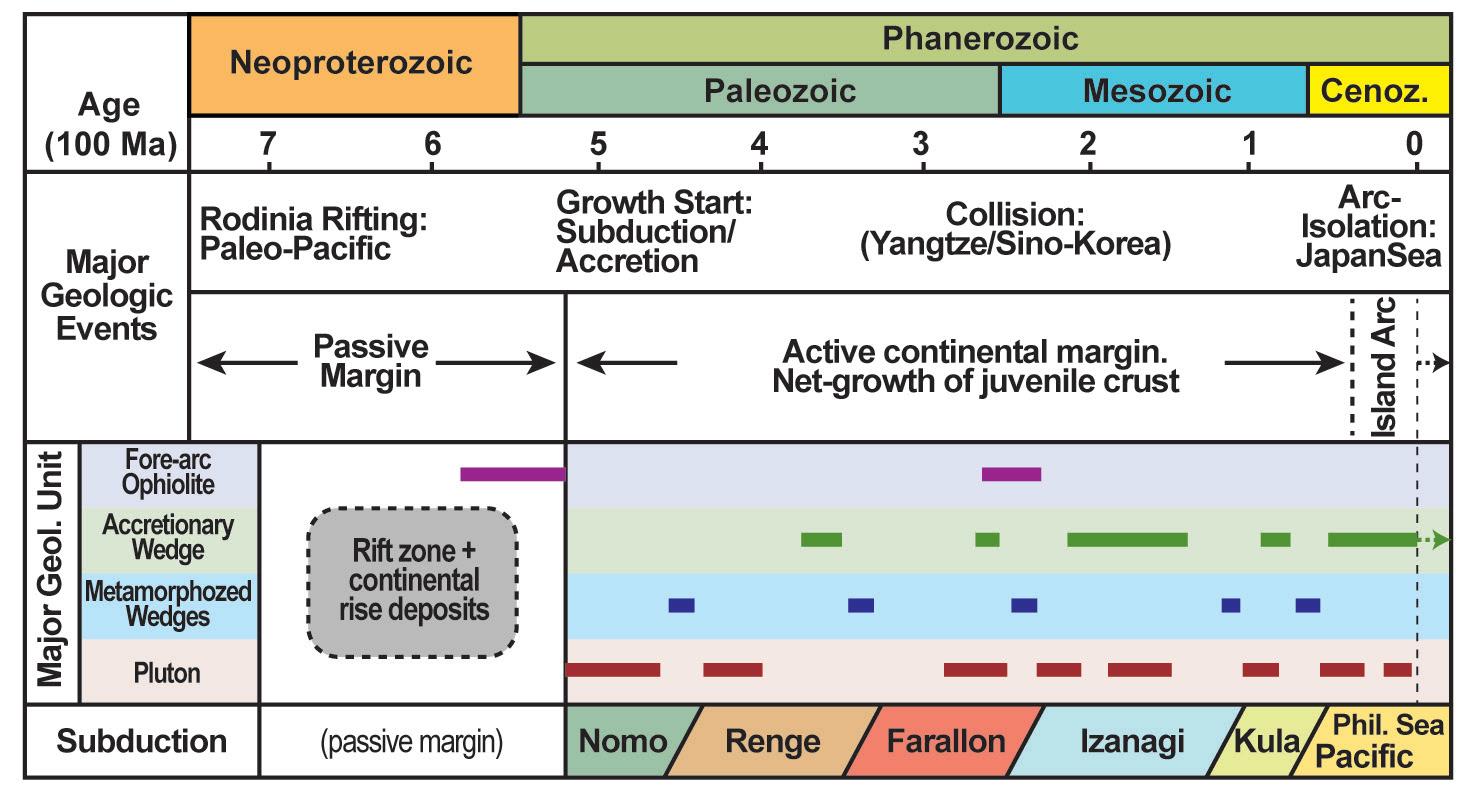
Figure 3: Diagram showing key elements of the geologic history of Japan, including major geologic events, geologic units, and the names of the subducting plates. The right side of the diagram also projects a short distance into the future of the geologic setting of Japan. Adapted from Isozaki et al. 2010.
properly summarize here (see Pubellier and Morley 2014, Mecalf 2011, and Doust and Noble, 2007), but the evolution of subduction along these margins eventually resulted in collapse and regional expansion. It is this period of extension and rifting that separated the geologic histories of Japan and SE Asia, as it allowed for the development of extensive sedimentary basins.
The majority of basins in the area are described as being related to four main stages of tectonostratigraphic evolution: 1) Early synrift (Eocene to Oligocene), 2) Late synrift ( Late Oligocene to Early Miocene), 3) Early postrift (Early to Middle Miocene), and 4) Late post-rift (Middle Miocene to Pliocene) (See Figure 4, and Doust and Noble, 2007).
1931: Invasion of Manchuria
1937: Second Sino-Japanese Warges
July 1941: U.S. Freezes Japanese Assets
August 1941: Oil Embargo Imposed
December 7, 1941: Pearl Harbor Attack
December 8, 1941: Japanese Offensive in Southeast Asia
Seeking to secure resources and expand its empire, Japan invaded Manchuria in 1931, establishing the puppet state of Manchukuo. While Manchuria was rich in coal and iron, it lacked significant oil reserves (Iriye, 1987). However, controlling Manchuria provided Japan with industrial resources to support further expansion.
Japan’s full-scale invasion of China in 1937 increased its demand for fuel. With military operations expanding, Japan’s dependence on imported oil grew. By 1940, approximately 80% of Japan’s oil was imported from the United States (Barnhart, 1987).
In response to Japan’s occupation of French Indochina, the United States, along with Britain and the Netherlands, imposed economic sanctions. The U.S. froze Japanese financial assets, restricting Japan’s ability to purchase vital raw materials (Dallek, 1995).
The United States escalated sanctions by cutting off all oil exports to Japan. Given that Japan imported nearly all of its oil from the U.S., this action placed Japan in a dire strategic position (Iriye, 1987). With existing reserves estimated to last only 18 to 24 months under wartime conditions, Japan faced a critical decision: abandon its expansionist ambitions or secure new sources of oil through military means (Yergin, 1991).
Faced with dwindling oil supplies and the prospect of economic strangulation, Japan launched a preemptive strike against the United States at Pearl Harbor, Hawaii (Stinnett, 2000). The goal was to cripple the U.S. Pacific Fleet and secure the time needed to conquer the oil-rich Dutch East Indies and British Malaya.
Almost simultaneously with the Pearl Harbor attack, Japan invaded British Malaya and the Dutch East Indies, aiming to secure vital oil fields in Sumatra, Java, and Borneo (Barnhart, 1987). By early 1942, Japanese forces had taken control of these regions, securing temporary relief from their oil crisis (Figure 3).
These tectonostratigraphic conditions created many extensional and transtensional rift basins, post-rift sag basins, pull-apart basins, fault-tip basins, and fault parallel basins (Pubellier and Morley 2014). As a result, hydrocarbons are abundant throughout the area. The slight variations in geologic history created sufficiently differing geologic settings between Japan and SE Asia to have lasting impacts on geopolitics, culture, and in this case, war.
Japan’s conquest of Southeast Asia provided only temporary access to petroleum and did not resolve its fundamental oil crisis. The U.S. submarine blockade, initiated in 1943, systematically cut off Japanese shipping routes, preventing oil from reaching the home islands (Dallek,
1995). By 1945, Japan’s oil reserves were nearly depleted, crippling its air force and navy, which contributed to its eventual defeat.
Japan’s geological reality—a landmass with minimal oil reserves—was a significant factor in its imperial ambitions and wartime strategy. The oil embargo imposed by the United States in 1941 forced Japan into a desperate situation: it had to secure oil through military conquest or face economic collapse. This dilemma directly led to the attack on Pearl Harbor and Japan’s subsequent war in the Pacific. Ultimately, oil was not only a logistical necessity but also a driving force behind Japan’s aggressive expansion and its ultimate downfall. Now that Parts I and II have set the stage, Part III of this series will describe competing strategies and efforts of the Axis and Allied powers to control wartime oil logistics and a race for victory.
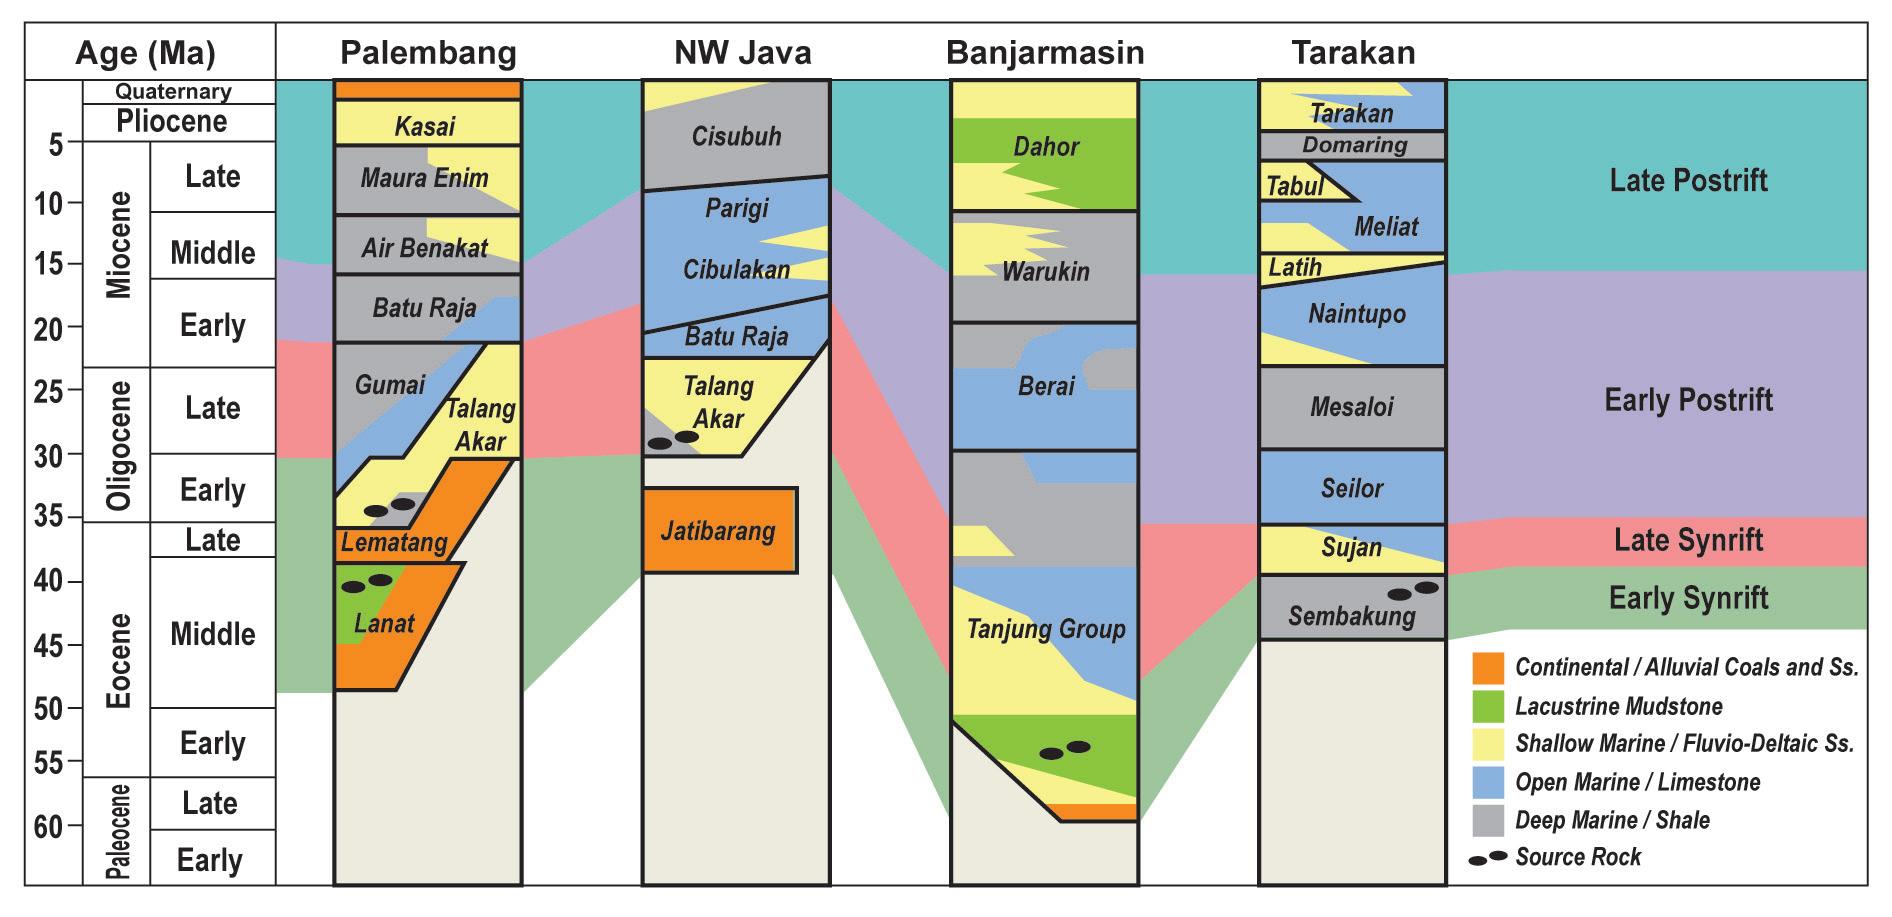
Figure 4: Simplified stratigraphic columns of key oil producing basins, corresponding to locations in Figure 2. The correlations between sections correspond to the tectonostratigraphic setting, which include: Early synrift, Late synrift, Early postrift, and Late postrift. Modified from Doust and Noble, 2008.
Barnhart, M. A. (1987). Japan Prepares for Total War: The Search for Economic Security, 1919-1941. Cornell University Press.
Dallek, R. (1995). Franklin D. Roosevelt and American Foreign Policy, 1932-1945. Oxford University Press.
Doust, H., & Noble, R. A. (2008). Petroleum systems of Indonesia. Marine and Petroleum Geology, 25(2), 103-129.
Doust, H. (2017). Petroleum systems in Southeast Asian tertiary basins. Bulletin of the Geological Society of Malaysia, Volume 64, p. 1 – 16
Ferrier, R. W. (1982). The History of the British Petroleum Company: Volume 1, The Developing Years 1901-1932. Cambridge University Press. Hall, R., Gower, D. J., Johnson, K. G., Richardson, J. E., Rosen, B. R., Rüber, L., & Williams, S. T. (2012). Sundaland and Wallacea: geology, plate tectonics and palaeogeography. Biotic evolution and environmental change in Southeast Asia, 82, 32. Hinsley, F. H. (1993). British Intelligence in the Second World War, Vol. 3. Cambridge University Press.
Iriye, A. (1987). The Origins of the Second World War in Asia and the Pacific. Longman. Isozaki, Y., Aoki, K., Nakama, T., & Yanai, S. (2010). New insight into a subductionrelated orogen: A reappraisal of the geotectonic framework and evolution of the Japanese Islands. Gondwana Research, 18(1), 82-105.
Jackson, A. (2004). The British Empire and the Second World War. Hambledon Continuum.
Metcalfe, I. (2011). Tectonic framework and Phanerozoic evolution of Sundaland. Gondwana Research, 19 (1), 3-21.
Overy, R. (1995). Why the Allies Won. W.W. Norton & Co. Pubellier, M., & Morley, C. K. (2014). The basins of Sundaland (SE Asia): Evolution and boundary conditions. Marine and Petroleum Geology, 58, 555-578.
Roskill, S. W. (1954). The War at Sea 1939-1945, Volume II. HMSO.
Sarr, A. C., Husson, L., Sepulchre, P., Pastier, A. M., Pedoja, K., Elliot, M., Arias-Ruiz, C., Solihuddin, T., Aribowo, S., Susilohadi. (2019). Subsiding sundaland. Geology, 47(2), 119-122
Spector, R. H. (1985). Eagle Against the Sun: The American War with Japan. Free Press. Stinnett, R. B. (2000). Day of Deceit: The Truth About FDR and Pearl Harbor. Free Press. Taira, A. (2001). Tectonic Evolution of the Japanese Islands. Annual Review of Earth and Planetary Sciences, 29(1), 109-134.
Tatsumi, Y. (2006). Geochemical and Petrological Constraints on the Origin of Arc Magmas in Japan. Journal of Volcanology and Geothermal Research, 151(1-3), 57-70. Yergin, D. (1991). The Prize: The Epic Quest for Oil, Money & Power. Free Press.
Strathcona bids for MEG Energy in bold oil sands consolidation move
Global unconventional roundup
n Strathcona bids for MEG Energy in bold oil sands consolidation move
On 15 May 2025, Strathcona Resources announced an unsolicited offer to acquire MEG Energy. The offer consists of a combination of Strathcona shares and cash for each MEG share. Waterous Energy Fund (WEF) is expected to hold a significant ownership of the proforma company, including WEF’s existing Strathcona shares and its WEF III equity investment.
Consolidation in Canada has largely played out, shifting focus to takeover deals. MEG remains one of the high-quality targets in the oil sand as the in-situ industry leader in operating cost performance.
The combined entity would face operational challenges, as Strathcona’s Alberta and Saskatchewan thermal properties have different operating performance compared to MEG’s Christina Lake asset. The targeted synergies, particularly in operational efficiencies, will be challenging to achieve given MEG’s existing operational strength.
We see this offer as an opening bid which is echoed in MEG’s shares surging post-announcement indicating a higher expected premium or competing offers from other oil sands majors. We see factors making the deal’s completion less certain:
Comparing Strathcona’s bid to the Husky offer in 2018, which had a significantly higher premium, it was eventually rejected by both parties. This was due to undervaluation and market conditions like today’s low-price environment and mandated production (currently emissions) curtailments.
This deal contains two equally sized companies which differs from conventional takeovers. Such an ambitious bid for a peer can only be driven with the backing of WEF which has the financial capacity and the conviction for takeovers, as demonstrated in its Greenfire Resources deal.
Building an equivalent oil sands project would take years to construct. Do other operators such as Suncor or Cenovus potentially enter the mix in which there are clear synergies or does the high deal water mark preclude competitive bidding? Strathcona is now committed to heavy oil and moves first in the hope to gain one of the sector’s top performing assets ahead of the competition.
Supreme Court win could fuel Uinta growth
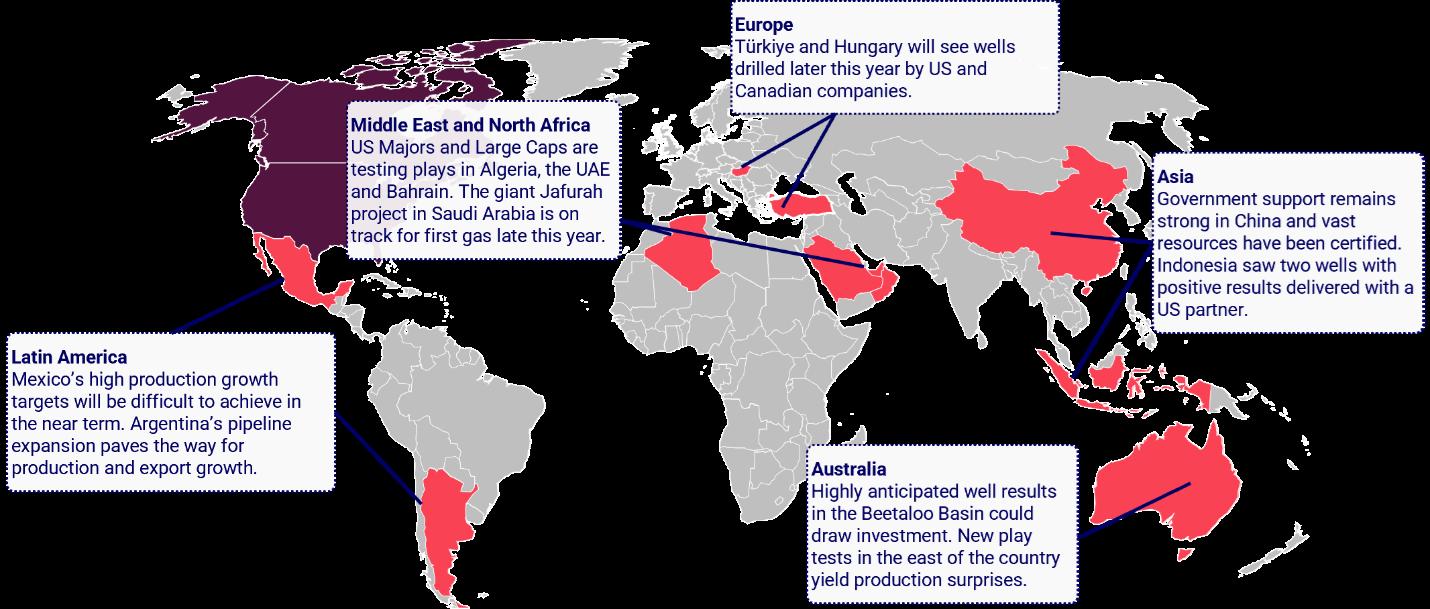
We published our Global unconventional roundup for the first half of 2025 earlier this week. While assessment of unconventional resources outside North America is not new, it has been over a decade since we have seen exploration at this pace and in so many different countries. (see map below).
The US Lower 48 will remain the leader in shale production. But after 20 years of development, some US E&Ps are beginning to apply learnings and expertise abroad.
Who is leading the charge? A range of companies from small caps and Independents like Tamboran and Continental Resources to Majors like Chevron and ExxonMobil are participating. However, EOG Resources stands out, consistently sitting at the leading edge of exploration in both the Lower 48 and internationally. Since the start of 2025, EOG has revealed new country entries in Bahrain and the United Arab Emirates, partnering with local NOCs. While EOG has not started drilling in these plays, we expect the company to follow an expedited timeline. EOG’s quick evaluation of an ultimately unsuccessful unconventional opportunity in Oman demonstrates this approach. The company signed an exploration and production sharing agreement, drilled two wells and exited within two years. Although EOG has not yet publicly commented on the project, we understand it has partnered with Indonesian state energy company Pertamina to drill two wells in the country with further plans for later this year.
Read our full Insight for our analysis of projects on five continents, including maps, development plans and our take on project viability. Key themes include:
• US inventory concerns. US shale plays are maturing, and the lowest breakeven inventory is drying up. Two-thirds of sub-US$40 inventory will be depleted by 2040. The vast, but unproven plays in Asia, Africa, and Australia are tempting some US E&Ps to look globally for reserves growth.
• Technology transfers. The most promising global projects have one thing in common: partnership or involvement with companies experienced in North American shale plays. E&P expertise helps, but high-spec equipment helps more. Companies from Australia to the Middle East have signed long-term contracts with US rig and pressure-pumping providers enabling efficient operations.
• Reality checks. The preliminary stages of conventional and unconventional projects are prone to aspirational timelines and resource estimates. The latest wave of global shale prospects is no exception. We provide our take on the viability (or lack thereof) of timelines, production targets and development plans.
The US Supreme Court ruled in favor of the Uinta Basin Railway on 29 May 2025. The court overturned a federal appeals court decision that had rejected the Surface Transportation Board’s (STB) approval of the proposed railroad. In its ruling, the Supreme Court decided that the STB adequately analyzed the Uinta Basin Railway’s impact in its 2021 approval. Furthermore, the court concluded that the agency did not need to study potential impacts from increased drilling or refining of Uinta Basin crude.
The proposed 88-mile railway would connect Uinta production with the national rail network, facilitating the transport of barrels to the Gulf Coast. The project can now progress, with construction anticipated in 2026 and 2027.
The Uinta Basin Railway will be instrumental in helping unlock the Uinta’s growth potential. Traditionally, nearby Salt Lake City refineries received a significant portion of the crude, effectively capping demand. Slowly, additional barrels now reach the Gulf Coast via rail, where

Scott joined the Canadian Upstream Research team at Wood Mackenzie in June 2019. He is responsible for providing financial asset valuation and objective commercial analysis on company and play activity across Canada. His coverage ranges from North American large caps to junior private producers. He also covers CNRL and Cenovus for the corporate analysis team, providing high level company valuation and strategy analysis.

downstream demand can continue to grow. This outlet has helped the basin’s volumes grow by roughly 50% over the past two years.
But further growth requires more egress capacity at lower costs. The Uinta Basin Railway project could enable additional production of up to 350,000 b/d. Operators appear ready to deliver growth. They have consistently run between 11-12 horizontal rigs over the past year. Despite falling crude prices causing operators in other plays to pull back, the rig count in this region has remained steady.
Testing and delineation within the play may be helping keep activity levels resilient, especially as recent buyers SM Energy and FourPoint actively work to integrate assets and better understand their potential. SM Energy has suggested that it will maintain its current Uinta development pace unless crude prices fall below US$55/bbl. Across the play, well performance continues to show promise and compete with other leading tight oil plays.

Xin's responsibilities include financial asset valuation and emissions modelling for Canadian and Alaskan assets. She also contributes to corporate analysis for Canadian and international mid caps and large caps such as Tourmaline Oil and Chevron.


RigSat
CNOOC International
Teine Energy
Athabasca Oil Corporation
Belloy Petroleum Consultants Ltd.
GVERSE GeoGraphix
Heritage Royalty
Key Seismic Solutions Ltd.


Spectrum Geosciences
Tallman Geological Consulting
Torys LLP
Beryl Mining Services Ltd.
Echo Seismic
lxl consulting ltd
DMT Geosciences Ltd.
Ampco Pipe Ltd.
BJV 3D Design
Bow Tie Club
Earth Signal Processing Ltd
Freehold Royalties
GeologicAI
Katalyst Data Management
Qeye Labs
Synterra Technologies


XRF Solutions
SIGMA Explorations Inc.
Barrel Eye Tools
Eagle Canada Seismic Services ULC
Headwaters Seismic Processing
Cordax Evaluation Technologies
Stack Technologies Ltd
MacPherson Energy Consulting