20 Reservoir Engineering for Geologists: Reservoir Simulation
25 Virtual Outcrops and Geocellular Models of the Windermere Turbidite System
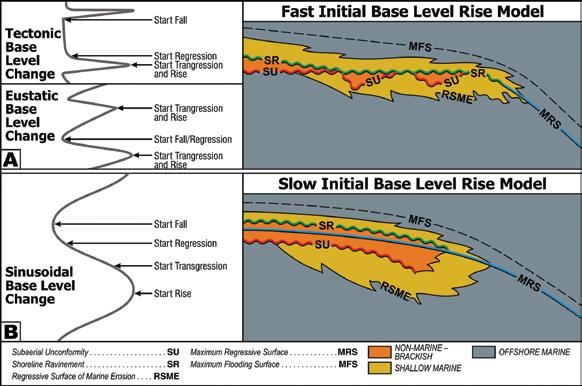
31 Practical Sequence Stratigraphy VII. The Base Level Change Model for Materialbased, Sequence Stratigraphic Surfaces
Prakash Mandalia Customer Support Analyst IHS
And you thought you were just buying IHS software…
When you invest in any one of the IHS software superstars like — AccuMap®, PETRA® or GeoSyn™ you get more than just easy-to-use, time-tested tools from a proven industry leader—tools that can dramatically simplify your search for oil and gas. You get a whole team of hometown professionals supporting your efforts—people just like Prakash. Got a “how-do-I-do-this” software question? Need training fast? Come to the source. At IHS you get more answers, more training, more resources, and more people—all working for you.
IHS. Great Products. Great People.
Connect to the source and get MORE. Call us today at 403.770.4646 or visit ihs.com/connect and find what MORE means to you.
CSPG OFFICE
#600, 640 - 8th Avenue SW
Calgary, Alberta, Canada T2P 1G7
Tel: 403-264-5610 Fax: 403-264-5898
Web: www.cspg.org
Office hours: Monday to Friday, 8:30am to 4:00pm
Interim Executive Director: Lis Bjeld
Email: lis.bjeld@cspg.org
Communications & Public Affairs: Heather Tyminski
Email: heather.tyminski@cspg.org
Corporate Relations Coordinator: Alyssa Middleton
Email: alyssa.middleton@cspg.org
Membership Services: Dayna Rhoads
Email: dayna.rhoads@cspg.org
Reception: Kasandra Klein
Email: reception@cspg.org
Joint Annual Convention Committee
Convention Manager: Shauna Carson
Email: scarson@geoconvention.org
Convention Coordinator: Tanya Santry
Email: tsantry@geoconvention.org
EDITORS/AUTHORS
Please submit RESERVOIR articles to the CSPG office. Submission deadline is the 23rd day of the month, two months prior to issue date. (e.g., January 23 for the March issue).
To publish an article, the CSPG requires digital copies of the document. Text should be in Microsoft Word format and illustrations should be in TIFF format at 300 dpi., at final size. For additional information on manuscript preparation, refer to the Guidelines for Authors published in the CSPG Bulletin or contact the editor.
Technical Editors
Ben McKenzie Colin Yeo (Assistant Tech. Editor) Tarheel Exploration EnCana Corporation Tel: 403-277-4496 Tel: 403-645-7724
Comunications and Public Affairs, CSPG Tel: 403-513-1227, Email: heather.tyminski@cspg.org
ADVERTISING
Advertising inquiries should be directed to Alyssa Middleton, Tel: 403-513-1233, email: alyssa.middleton@cspg.org. The deadline to reserve advertising space is the 23rd day of the month, two months prior to issue date.
The RESERVOIR is published 11 times per year by the Canadian Society of Petroleum Geologists. This includes a combined issue for the months of July and August. The purpose of the RESERVOIR is to publicize the Society’s many activities and to promote the geosciences. We look for both technical and non-technical material to publish. The RESERVOIR is not intended to be a formal, peer-reviewed publication. Additional information on the RESERVOIR’s guidelines can be found in the May
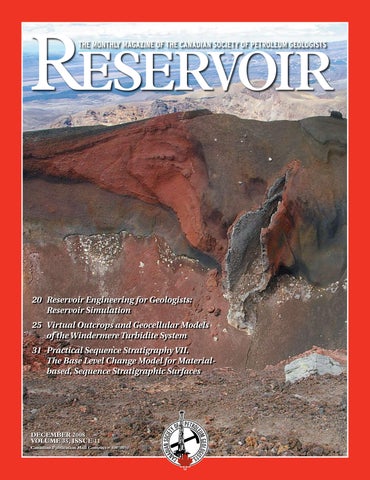
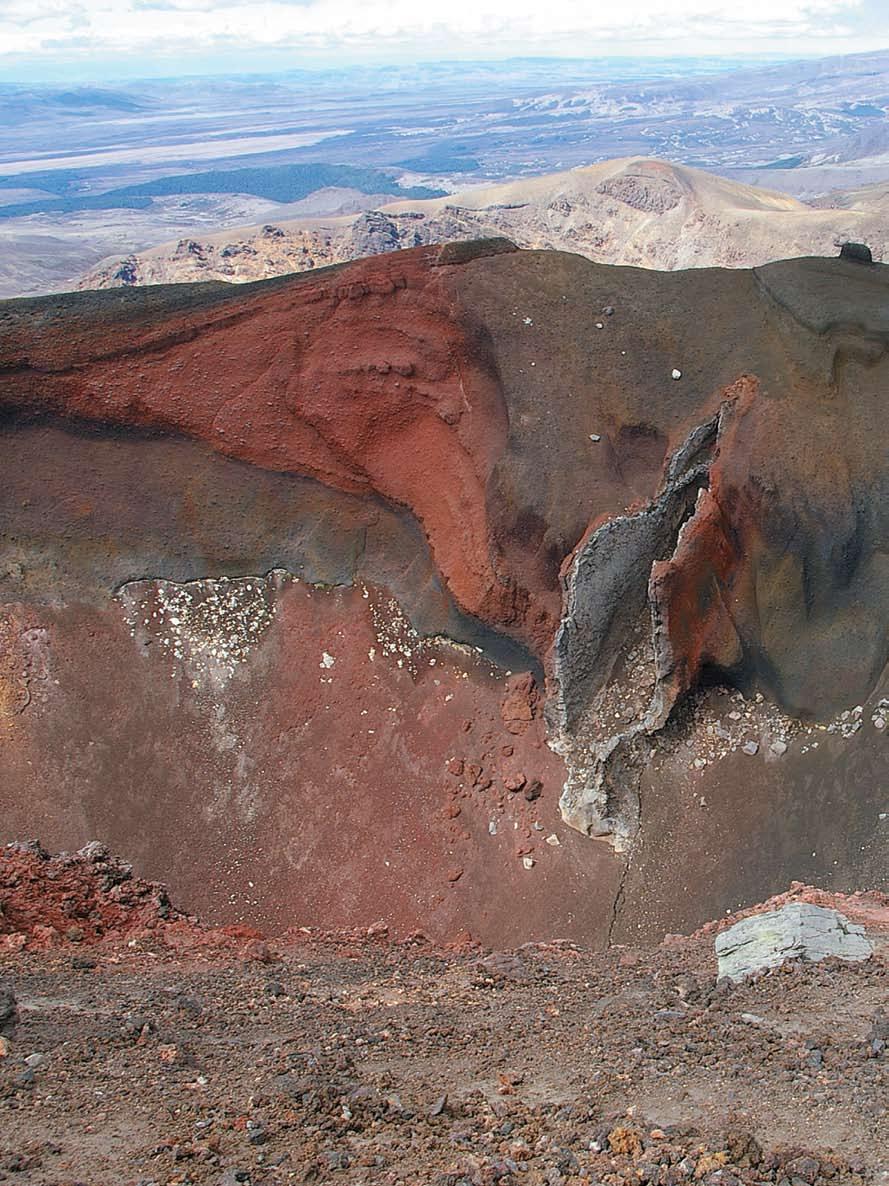
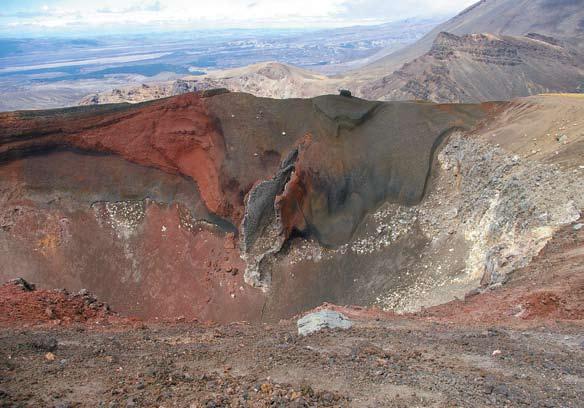
FRONT COVER Tongariro Crossing, New Zealand. Located on the North Island, the Tongariro Crossing passes the still active volcanic Red Crater at an elevation of 1,886 metres.
Photo by Rhea Karvonen.
Personalizing Professionalism
Of all the “isms” in the world, the one that affects us most profoundly is “professional-ism”. We expect strict professionalism on the part of medical doctors when we go for treatment or a check-up, transit operators when conveying us to work every morning and we even expect professional behaviour from sales associates at the computer store.
APEGGA is, naturally enough, highly engaged with professionalism as the Association exists to ensure that geoscience and engineering are performed to the highest standards.
So just what is “professionalism?”
Geoscience Affairs Manager, Tom Sneddon, P.Geol., described professionalism in an article in the October issue of the CAGC The Source.
“In the real world, professionals are people who are constantly striving to gain new knowledge and learn from experience. They strive to treat people honourably and fairly and when they don’t, they clean up the mess and promise to do better next time.”
So how do you personalize professionalism?
When you perform your duties in an ethical, professional and responsible manner, you are personalizing professionalism. When you make sure your professional designation appears on your business card, you are personalizing professionalism. When you stand up for the public’s interest and safety in the face of economic and other pressures, you are personalizing professionalism.
Personalize Professionalism. Visit www.apegga.org for more information or call Tom Sneddon, P.Geol., Geoscience Affairs Manager at 403-262-7714 or 1-800-661-7020.
CSPG EXECUTIVE
President
Lisa Griffith • Griffith Geoconsulting Inc. lgriffith@griffithgeoconsulting.com Tel: (403) 669-7494
Vice President
Graeme Bloy • West Energy Ltd. gbloy@westenergy.ca Tel: (403) 716-3468
Past President
Colin Yeo • EnCana Corporation colin.yeo@encana.com Tel: (403) 645-7724
Finance director
James Donnelly • ConocoPhillips Canada james.donnelly@conocophillips.com Tel: (403) 260-8000
assistant Finance director
David Garner • Chevron Canada Resources davidgarner@chevron.com Tel: (403) 234-5875
Program director
Randy Rice • Suncor Energy Inc. rjrice@suncor.com Tel: (403) 205-6723
serVice director
Jen Vèzina • Devon Canada Corporation jen.vezina@devoncanada.com Tel: (403) 232-5079
assistant serVice director
Ayaz Gulamhussein • NuVista Energy Ltd. Ayaz.gulamhussein@nuvistaenergy.com Tel: (403) 538-8510
A message from the Finance Director, James Donnelly
I am pleased to report to the CSPG on its fiscal position as of its year end, Aug 31, 2008.
The CSPG had a strong financial year while delivering on a varied program of technical and social activities. This would not have been possible without our energetic volunteers and a dedicated office staff.
Our year end financials show a small deficit of $29,567 on revenues of $2,348,726 and expenses of $2,378,293. As a not-for-profit society, we try to budget to break even or show a slight profit each year. This year’s deficit represents only 1.2% of our gross revenues.
This year has been an especially challenging year for our Society with significant turn over in our office staff as well as unforeseen long-term absences due to illness among key employees. These increased our costs and reduced revenues in some key areas. We also experienced some late accruals from the 2007 fiscal year that negatively impacted our bottom line.
The cornerstone of the CSPG’s revenues is the annual convention. This year, we consolidated our convention planning and delivery under the Joint Annual Convention Committee (JACC). The committee has representation from the CSPG and the CSEG as well as provisions for inclusion of the CWLS in future years. The arrangement commits our respective societies to long-term planning and ensures that we have resources in place to deliver quality conventions at least three years in advance. This year’s annual convention was successful from both a technical and financial perspective, with a net CSPG profit of $389,652 (up 0.5% from 2007’s $387,821).
Continuing Education had another strong performance. Short courses and field trips for the Convention as well as Education Week in October generated a profit of $102,048 (up 22% from 2007). Congratulations to the committee and the office staff for a job well done.
Technical luncheons are a key program for our membership and continue to be well attended. Profits during 2008 were $57,376 on revenue of $496,624, a 12% profit margin. We continue to webcast our luncheons at an annual cost of $52,000 and we feel that this is an important investment to market our services to our membership nationally.
Our Society membership income decreased slightly this year to $315,523 from $323,680 in 2007. Our membership dues have remained unchanged since 2002 thanks to healthy profits in other areas. A streamlined electronic renewal process and valuable support from our office staff should allow us to show growth in this area in 2009.
The CSPG’s social events are budgeted to return a small profit to offset the costs carried by the Society to administer them (office costs, staff costs related to sponsorship and ticket sales, etc.) We are able to run a number of events at reasonable expense to our members. These provide an excellent opportunity for networking and are a key part of the Society’s contribution to the industry and our profession.
The Society’s plans to publish a larger Reservoir this year were stymied somewhat by key staff vacancies. The publication still managed to generate a profit, but was down 14% from the previous year. We continue to plan for larger issues in 2009 as our staff’s health improves and our technical content increases.
The Outreach portfolio consists of the annual Honorary Address, SIFT, University Outreach, education awards, K-12 education and 100 Student Jobs. Outreach expenditures reached $168,437 this year on revenue of $172,432. The small profit is somewhat misleading as there was $10,000 in revenue included this fiscal year that
(Continued on page 7...)
CORPORATE MEMBERS
ABU DHABI OIL CO., LTD. (JAPAN)
APACHE CANADA LTD.
BAKER ATLAS
BG CANADA ExPLORATION & PRODUCTION, INC
BP CANADA ENERGy COMPANy
CANADIAN FOREST OIL LTD
CANETIC RESOURCES TRUST
CONOCOPHILLIPS CANADA
CORE LABORATORIES CANADA LTD
DEVON CANADA CORPORATION
DOMINION ExPLORATION CANADA LTD
DUVERNAy OIL CORP.
ENERPLUS RESOURCES FUND
FUGRO AIRBORNE SURVEyS
geoLOGIC systems ltd.
GRIZZLy RESOURCES LTD
HUNT OIL COMPANy OF CANADA, INC.
HUSKy ENERGy INC.
IHS
IMPERIAL OIL RESOURCES LIMITED
LARIO OIL & GAS COMPANy
LITTLE ROCK DOCUMENT SERVICES LTD
MJ SySTEMS
MURPHy OIL COMPANy LTD
NExEN INC.
PENN WEST PETROLEUM LTD
PETRO-CANADA OIL AND GAS
PETROCRAFT PRODUCTS LTD.
PROVIDENT ENERGy LTD
RPS ENERGy CANADA LTD.
SHELL CANADA LIMITED
SPROULE
SUNCOR ENERGy INC
TALISMAN ENERGy INC
TAQA NORTH LTD
TECK COMINCO LIMITED
TOTAL E&P CANADA LIMITED
WEATHERFORD CANADA PARTNERSHIP
AS OF OCTOBER 29, 2008
(...Continued from page 5)
should have been accrued back to 2007. Outreach continues to be a significant component of the Society’s initiative to reach out nationally, as well as to promote itself in our local community. Expenditures this year reflect a 9% increase from 2007.
Operations are the single largest expense category of the Society. Expenses in 2008 totaled $887,137. Work that was once done by volunteers increasingly falls on the shoulders of our office staff. We could not have realized profits in areas such as the annual convention, continuing education, and technical luncheons without their hard work in support of the volunteer base. This year saw increases in costs to operate our lease space as well as added expenses associated with turnover in staff and absences due to long-term disability.
The CSPG’s surplus fund held its own during an up-and-down year in the markets. The funds are split with approximately 70% in fixed income and 30% in equity investments to provide modest growth and stable longterm security. The fund had a market value of $1,036,275 at the end of August, an
increase of 2% over last year. While this seems like a large amount, it represents only 44% of our annual expenses. This “rainy day” fund provides a cushion for the Society and reduces its exposure to revenue shortfalls in one or two key areas or unforeseen expenses. As I write this article, the financial landscape as we know it had entered new, uncharted territory. How this plays out in our industry and our Society is yet unknown, but we can be assured should we need it, this fund will serve us well.
As my tenure as Finance Director draws to a close, I need to recognize and thank the CSPG office staff. I also want to thank the CSPG Executive and my Assistant Finance Director David Garner for their support.
Challenging times are ahead for our industry and the CSPG in 2009. I leave knowing that the Society is well positioned to deal with all eventualities and that I am delivering them into the good hands of David Garner as he assumes his role as Finance Director.
Thank you for allowing me to serve the CSPG these past two years.
Hardrock Seismic Imaging Experience in Hardrock Applications
• 2D & 3D Processing
• Multicomponent (3C) Processing
• Fracture Detection Analysis
• Projects completed for Mining Companies & Government Agencies
Were Triassic rocks of the Western Canada Sedimentary Basin deposited in a Foreland?
SPEAKER
Filippo Ferri
BC Ministry of Energy, Mines and Petroleum Resources
CO-AUTHOR
John-Paul Zonneveld University of Alberta
11:30 am
tuesday, d ecember 9, 2008
telus convention centre c algary, a lberta
Please note:
the cut-off date for ticket sales is 1:00 pm, thursday, december 4, 2008.
csPg member ticket Price: $38.00 + gst. non- member ticket Price: $45.00 + gst.
Due to the recent popularity of talks, we strongly suggest purchasing tickets early, as we cannot guarantee seats will be available on the cut-off date.
The Western Canada Sedimentary Basin (WCSB) preserves one of the most complete sections of Triassic strata found anywhere in the world. This westwardprograding clastic-carbonate succession is an important source of hydrocarbons, containing over 37 percent of British Columbia’s conventional gas reserves. The current exploitation success of unconventional reservoirs within the lower part of this succession will significantly increase recoverable resources and further enhance the economic importance of this package within the province.
Triassic rocks of the WCSB were deposited, in part, on a Carboniferous-to-Permian rift sequence represented by the Fort St. John Graben system. The extensional tectonics represented by these rift deposits appears to be the only disruption to Paleozoic and Mesozoic passive margin deposition within the WCSB until the onset of compressional deformation in the Early Jurassic.
Tectonics and sedimentation within the WCSB are a reflection of processes that were occurring on a continental and global scale. Recent and ongoing work along the western margin of Ancestral North America (ANA, the outer fringes of the WCSB) document Carboniferous to Permian extension associated with arc and back-arc development. Furthermore, this work also shows that uplift and obduction of ophiolitic and arc terranes occurred along this margin in PermoTriassic time, suggesting that the onset of Triassic sedimentation within the WCSB was occurring within a foreland setting. This would also infer that the Early Triassic basinal shales and siltstones (Montney, Doig) represent early foredeep deposits.
This research now suggests that terranes along the western edge of ANA are not far travelled, and are most likely pieces of the ancient continental margin that were pulled off during subduction and backarc development. These fragments were then subsequently “re-attached” through destruction of the intervening small backarc basin.
The timing and nature of tectonic processes along the western margin of ANA can be directly tied to those observed within the WCSB. A thorough explanation of this new model of the Triassic foreland basin is best presented via a description of the prior geologic evolution of the region, beginning with extension of the western margin of ANA in Devono-Mississipian times.
A stable shelf setting that was established along the western margin of ANA in Early Cambrian times experienced eastward subduction along its western-most edge commencing in the Late Devonian. This led to the formation of a magmatic arc along the western margin of ANA. Current evidence suggests that back-arc extension, probably due to slab rollback of the subducting plate, accompanied arc development, leading to the development of the back-arc basin (Slide Mountain Ocean) and attenuation of the western margin of ANA as the magmatic arc and its underlying continental basement ( yukon Tanana Terrane) rifted away from ANA. Arc magmatism and back-arc basin formation continued until the mid-toLate Permian. There is evidence in the southern US Cordillera of contractional deformation during this time (Roberts Mountain Allochthon), although this is succeeded by arc-back-arc development.
The main manifestation of this arc and back-arc development within the WCSB is the development of the Fort St. John Graben (FSJG) and associated Central Montana Trough in the United States. These structures can be thought of as “failed arms” of this rifting event. Extension within the FSJG continued until the mid Permian, suggesting that the width of the back-arc basin was narrow enough such that the extensional tectonism associated with it was being recorded in rocks of the adjoining WCSB. Perhaps the Beaton and Sukunka highs are also products of this extension, representing tilted fault blocks.
Geologic evidence now suggests that the Slide Mountain Ocean disappeared at the end of the Permian through westward subduction of the ocean below the yukonTanana arc complex. This resulted in obduction of Slide Mountain ophiolite and pieces of the western yukon-Tanana magmatic arc. Locally, in the yukon and the southern Canadian Cordillera, coarse clastics of Early to Middle Triassic age record the uplift and erosion of these tectonic elements along the western edge of ANA. Compressional tectonics did not continue after this time, instead, subduction re-commenced to the west leading to the formation of the Late Triassic to Early Jurassic arc complex of the Quesnel Terrane.
Obduction of ophiolite and arc complexes along the western edge of ANA would have depressed the continental crust and led to foredeep development. Restoration of Cretaceous-Tertiary strike-slip faults in the Cordillera would place Late Paleozoic ophiolites and arc rocks of the Sylvester Allochthon orthogonal to the Peace River Embayment defined by Triassic rocks of the WCSB, suggesting that this feature may be an expression of this crustal loading. Evidence for a concurrent forebulge may be found in the Peace River area of the western Foothills where temporally significant disconformities in outboard settings and anomalous sediment thickness trends occur. In this area, Lower and Middle Triassic strata consist of organicrich shale and siltstones deposited in a distal offshore depositional setting. Conodont data indicate that sedimentation rates are relatively consistent through the lower and lower Middle (Anisian) Triassic.
However, there is an abrupt and profound change during the Ladinian (upper Middle Triassic) when sedimentation
rates drop dramatically, followed by a temporally extensive disconformity. Ladinian successions immediately to the east are significantly overthickened and comprise some of the thickest Middle Triassic successions in North America. The Middle-Upper Triassic boundary (which is the Ladinian-Carnian boundary) is characterized by an erosional unconformity, a switch to carbonatedominated deposition and a dramatic increase in sedimentation rates (by at least an order of magnitude above Lower-Middle Triassic rates). Upper Triassic sediments demonstrate an inverse relationship to that exhibited by Middle Triassic successions (i.e., grossly overthickened in the west and dramatically thinner towards the east).
The Ladinian decrease in sedimentation rates and subsequent disconformity in western Peace River localities are interpreted to reflect deposition on an early forebulge. During the Upper Triassic this forebulge is interpreted to have migrated eastwards resulting in a thick deep-water succession of carbonate strata deposited in the west and a thin shallow-water succession of carbonate strata deposited in a proximal carbonate ramp depositional setting towards the east.
The dark, basinal shales represented by the Montney, Toad, and lower Sulphur Mountain formations are interpreted to represent initial foredeep deposition prior to onset of coarser clastic sedimentation. Only eastern-sourced, continentally derived clastics are preserved within the Triassic succession. Indications of westerly derived clastics are rare and are a reflection of poor preservation in the west. Chert granules and pebbles in coarse, Halfway-equivalent sandstones within the western Foothills of the Peace River area suggest a local source. The fact that these coarse clasts are larger and more abundant towards the west may support the hypothesis that these sediments were derived from a western source.
In conclusion, Triassic sedimentation within the Western Canada Sedimentary Basin most likely occurred in a foreland basin setting. Early cessation of deformation associated with foreland development, together with uplift and erosion by JuraCretaceous Laramide deformation, has resulted in the bulk of the preserved Triassic foreland deposits being found along the eastern margin of the basin and having an eastern, continental origin.
BIOGRAPH y
Filippo Ferri
Filippo Ferri is a senior geologist with the Resource Development and Geoscience Branch of the B.C. Ministry of Energy, Mines and Petroleum Resources. He has been with this branch for six years conducting energy-related geoscience. Prior to this, Ferri was a regionalscale mapper for 15 years with the British Columbia Geological Survey. He also has several years of oil and gas exploration experience, gained after he completed a M.Sc. in structural geology at the University of Calgary in 1985.
He has just begun a regional mapping program within the Foothills of the Halfway River area after working for several years examining the hydrocarbon potential of Jura-Cretaceous clastic sequences within the Bowser and Nechako basins.
Ferri’s work experience within rocks of Intermontane and Western Canada sedimentary basins together with regional mapping of Ancestral North America, and the more western peri-cratonic and “exotic” terranes has exposed him to a wide range of geology within British Columbia. This broad perspective has steered him to the large-scale investigative geology he will be presenting here.
John-Paul Zonneveld
John-Paul Zonneveld is an associate professor in the Department of Earth and Atmospheric Sciences at the University of Alberta. He received his B.Sc. in 1988 from Calvin College, Michigan after which he worked as a geologist with a Mississauga environmental consulting firm. He received his M.Sc. in 1994 from Michigan State University and his Ph.D. in 1999 from the University of Alberta. After a brief tenure as a post-doctoral researcher at the University of Calgary, Zonneveld accepted a position as Research Scientist with the Geological Survey of Canada in Calgary in 2000. He attained his present position at the University of Alberta in January 2008.
Zonneveld has authored and co-authored numerous papers on the sedimentary geology, volcanology, ichnology, and paleontology of Mesozoic and Cenozoic successions in western North America. Much of his research, both past and present, has focused on providing stratigraphic and sedimentologic support to the Canadian Petroleum and Mining Industries. As a dedicated Triassophile, his current research, and that of his graduate students, is focussed primarily on the sedimentology, stratigraphy, and geochemistry of hydrocarbon-bearing intervals in Triassic strata of Alberta and British Columbia, specifically the Montney, Doig, and Charlie Lake formations.
technical luncheons JANuARY LuNCHEON
Paleontology, paleoecology, and
climate in an early eocene, high arctic swamp forest
SPEAKER
Jaelyn J. Eberle
University of Colorado, Museum of Natural History, and Department of Geological Sciences
11:30am thursday, January 8, 2009 telus convention centre calgary, a lberta
the 2009 agm will be held at this technical luncheon.
Please note:
the cut-off date for ticket sales is 1:00 pm, monday, January 5, 2009. csPg member ticket price: $38.00 + gst. non- member ticket Price: $45.00 + gst.
Due to the recent popularity of talks, we strongly suggest purchasing tickets early, as we cannot guarantee seats will be available on the cut-off date.
The Early Eocene marked the peak of global warming since onset of the Cenozoic Era (ca. the last 65.5 million years), when mid-latitude temperatures soared, and Canada’s High Arctic was home to lush swamp forests inhabited by alligators, giant tortoises, and a diverse mammalian fauna that included primates and tapirs. As the relevant fossil-bearing rocks of the Eureka Sound Group on central Ellesmere Island were well above the Arctic Circle during Eocene time, this environment experienced months of continuous sunlight and darkness, the Arctic summer and winter, respectively.
Resulting from over three decades of paleontological field research, the early Eocene (~52 million years ago) mammalian fauna from the Eureka Sound Group on Ellesmere Island comprises over 20 genera, ranging from tiny rodents to primates, tapirs, brontotheres, and hippo-like Coryphodon. Complementing the paleontology, stable isotope geochemistry, in particular oxygen and carbon isotope analyses of vertebrate bone and tooth enamel, indicate a warm temperate paleoclimate and provide valuable paleoecologic insight into the early Eocene High Arctic vertebrate fauna. More specifically, oxygen isotope ratios from co-occurring mammals, turtle, and fish estimate mean annual temperature (MAT) at approximately 9ºC, with a warm month mean temperature of up to ~20ºC and an above-freezing cold month mean. Analyses of both carbon and oxygen isotope ratios of mammalian tooth enamel suggest that the large herbivorous mammals lived yearround in the Eocene High Arctic, and had an unusual diet over the dark winter months.
Reservoir Characterization
Expertise in heavy oil & deep basin reservoirs
• AVO / LMR Analysis
• Neural Network Analysis
• PP & PS Registration
• Joint PP & PS Inversion
• Fracture Detection Analysis using Azimuthal AVO
• Spectral Decomposition
Time Lapse Analysis
Carmen Dumitrescu P.Geoph., M.Sc., Manager, Reservoir Geophysics
Direct: 403-260-6588 Main: 403-237-7711
www.sensorgeo.com
year-round habitation of Arctic regions is a probable behavioral prerequisite for dispersal across northern high-latitude land bridges. Such migrations have occurred several times in the geologic past, and are hypothesized to explain the early Eocene appearance in North America of several modern mammalian orders presumed to have originated in Asia, including today’s ungulate or hoofed mammals (perissodactyls and artiodactyls) and primates. Such polar dispersals are predicated on climatic conditions in Arctic regions that are wetter and warmer than those of today. If current warming trends continue, year-round occupation of polar regions by plants and animals found today only at mid-latitudes is conceivable, and the Arctic may again become a corridor for intercontinental migration.
BIOGRAPH y
Jaelyn Eberle is a Canadian paleontologist with seven years’ field experience working in Canada’s High Arctic, including on Ellesmere, Axel Heiberg, Devon, and Banks Island.
She is Curator of vertebrate paleontology at the University of Colorado Museum of Natural History and an assistant professor in the Department of Geological Sciences at the University of Colorado at Boulder.
Envision Success
Rely on CGGVeritas to maximize your exploration accuracy. You’ll have access to leading seismic imaging technologies, highly sought 3D and 2D data, the most advanced acquisition capabilities and a staff dedicated to helping you succeed.
Focus on Performance. Passion for Innovation. Powered by People. Delivered with Integrity.
technical luncheons JANuARY
The role of outcrop models in the subsurface characterization of deep-water reservoirs
SPEAKER
Michael H. Gardner
Montana State University
AAPG Distinguished Lecturer
11:30 am
m onday, January 19, 2009 telus convention centre c algary, a lberta
Please note:
the cut-off date for ticket sales is 1:00 pm, Wednesday, January 14, 2008. csPg member ticket Price: $38.00 + gst non- member ticket Price: $45.00 + gst
HUGH REID’S WINTER & SPRING COURSES
PRACTICAL DST CHART INTERPRETATION
(Thorough Basic Course) Jan. 26-30 & Mar. 30-Apr. 3, 2009
16 WAYS TO IDENTIFY BYPASSED PAY FROM DST DATA
(More advanced, for those “comfortable” with DST charts) Apr. 15-16, 2009
HYDRODYNAMICS SEMINAR
(Oil & Gas Finding Aspects) Apr. 20-24, 2009
In-house courses available. For course outline visit: www.hughwreid.com 262-1261
Due to the recent popularity of talks, we strongly suggest purchasing tickets early, as we cannot guarantee seats will be available on the cut-off date.
The derivative source of geology imaged by subsurface data imposes limitations on its veracity because we can only confirm that which we can measure directly. Seismic data is constrained by vertical resolution limits, artifacts and noise, and non-unique processing. Providing higher vertical resolution and direct measurements, the sparse distribution and spacing of well data limits its spatial correlation. Geostatistical and stochastic methods used to manage these uncertainties introduce random effects. For these reasons, the geology being modeled cannot be verified. Furthermore, the modeling procedures that most impact data retention, including information that must be preserved for verification, are largely unknown. Modeling subsurface geology is simply done with too little information; therefore, analogs and probabilistic approaches are used to generate multiple scenarios, which minimizes the risk of an uncertain geologic model.
The twelve-year (1995-2006) study of the Permian Brushy Canyon Formation (BCF) illustrates the application of outcrop analogs to subsurface reservoir characterization. An integrated suite of three-dimensional geological, petrophysical, and geophysical models were generated from 488 sedimentological profiles and detailed mapping (20 metre thick intervals) of continuous shelf-to-basin outcrops. Geologic mapping of this stratigraphy and sedimentary architecture across the multiple fault blocks that dissect the 245 square kilometre outcrop area provides a nearly complete three-dimensional view of the BCF sedimentary system. Advanced GIS technology and three-dimensional subsurface mapping software was used build three-dimensional geological models with meter-scale, resolution for over half the outcrop. Conversion of the outcrop data to subsurface data formats facilitated outcrop to well and seismic data correlations (355 well logs and 3,300 kilometres of twodimensional seismic) across the 33,500 square kilometers Delaware Basin of West Texas.
Generating outcrop models is substantially different from subsurface modeling because outcrops lack the geospatial framework embedded in the collection of subsurface
data. Nonetheless, outcrop geologic models provide a verifiable reference case derived directly from the rocks. Displayed as digital, geo-referenced subsurface data, the BCF models can be used to evaluate how well subsurface modeling methods reproduce known sedimentary architecture. These models provide a target, or benchmark model of the outcrop transformed into subsurface well and seismic data. Because the outcrop geologic models can be verified, they can be interrogated to better determine how (1) model building methods, (2) different data sources, and (3) differences in geologic interpretation affect the model. These are key areas where the introduction and retention of geologic information most impacts modeling results.
BIOGRAPH y
Michael H. Gardner is an Associate Professor at Montana State University in Bozeman, Montana and a geological advisor to Marathon Oil Company. He received his B.A. in Geology from the University of Colorado and his Ph.D. from the Colorado School of Mines. Refined through outcrop studies conducted since 1983, his applied research focuses on outcrop characterization of sedimentary architecture by integrating “old-school” field methods with three-dimensional, geospatial visualization technology.
Gardner teaches and leads the Slope and Basin Consortium at Montana State University, where his current research focuses on developing, testing, and verifying geological rules for deep-water reservoir prediction through the Geological Analogs and Information Archive (GAIA) project.
February 5 – 7, 2009
W
THERE IS A MAXIMUM OF 125 PLAYERS! GET YOUR ENTRY FORM IN EARLY TO AVOID DISAPPOINTMENT!
EVENTS: ENTRY FEE: Generously sponsored by Tucker Wireline Services.
ENTRY DEADLINE: January 5, 2009. January 16, 2009.
REGISTRATION DETAILS:
diVision talKs GEOFLuIDS DIVISION
Mechanical force fields as drivers of fluid migration at carbon sequestration sites
SPEAKER
Dr. Udo Weyer, P.Geol. WDA Consultants Inc.
12:00 noon, monday, december 1, 2008 aquitaine tower auditorium (on +15 l evel), 1400-540 5th avenue sW calgary, a lberta
The long-term fate and leakage of CO2 injected into geological formations depends on the geologic structure as much as on the mechanical force fields for fluid flow in the
subsurface. These force fields are created by gravitational energy omnipresent in the subsurface. Hubbert’s force fields were applied in developing the theory of groundwater flow systems. These flow systems penetrate into similar depth ranges as the injection of CO2 .
In areas of regional downward flow these systems may cause layers with ‘buoyancy reversal.’ ‘Buoyancy reversal’ means that under certain geologic and hydrodynamic conditions in the subsurface, the buoyancy force is directed downwards. These conditions have frequently been encountered in Alberta and in other areas. In general, under hydrodynamic conditions in the subsurface, the so-called buoyancy force may be directed in any direction in space. Only under hydrostatic conditions is it always directed vertically upwards.
customsolution
The application of the principles of Hubbert’s Potential Theory to carbon sequestration is fundamental in achieving realistic results in any modeling attempt. IPCC’s attempt to determine 1,000-year buoyancy-driven migration of CO2 is seriously flawed as it ignores the mechanical vectors created by regional groundwater force fields, as is IPCC’s attempt to confine CO2 migration to aquifers and fault lines. What is generally missing from the treatment of this topic is the consideration of deeply penetrating regional fluid flow systems and its consequences using the principals of Hubbert’s Potential Theory. This will be illustrated with examples from the literature, with field studies, and with the results of mathematical modeling. Any risk analysis on carbon sequestration and subsequent leakage needs to consider fluid flow analysis based on the principles of Potential Theory.
BIOGRAPH y
There is no wrong answer.
At Divestco, we understand what it means to be a customer. You like to be able to depend on a service provider to act in your best interests, give you exactly what you need, and only what you want. Divestco’s integrated offering for geological professionals gives you the ability to choose from a wide range of geological products and services to suit your unique needs. Pick anything you want, choose a bundled offer or let our experts create a custom solution for you.
Call Jennifer Davies at 403.537.9904 or email jennifer.davies@divestco.com for more information. Take your pick
Dr. Weyer is a Senior Hydrogeologist with over 30 years experience in physical hydrogeology (regional and local groundwater flow, water supply, and man-induced changes), contaminant hydrogeology (petroleum industry, base metal and coal industry, chemical industry, steel industry, landfills), mine dewatering, and subsidence in North America, Europe, and Asia. He has supervised the utilization of numerous geochemical and groundwater flow models.
In addition, Dr. Weyer has managed and conducted consulting work and complex field studies of hydrogeology, hydrology, engineering geology, geology, and other issues of environmental nature in a wide variety of geographical and climatological settings, from the tropics to permafrost regions. He has prepared over two hundred reports and technical papers and published a book on subsurface contamination by hydrocarbons.
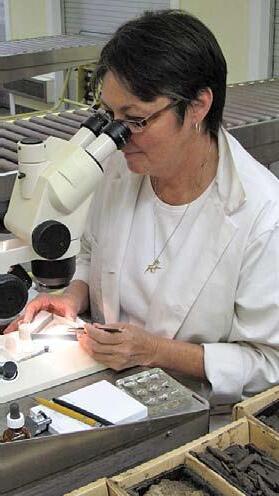
diVision talKs CORE AND S AMPLE DIVISION
Improving drill cuttings quality
using automated wellsite sample collection equipment
SPEAKER Will Rieberer Sample Pro Ltd.
12:00 noon
tuesday, december 9, 2008
ercB core research centre 3545 research Way n.W. calgary, alberta
In recent years poor sample quality of drill cuttings obtained at wellsite has become a concern for Geologists and Petrographers. The main reasons given for deteriorating
sample quality are PDC drill bits, high penetration rates and new mud systems. Various efforts have been made to design automated sampling devices to sample the flow of drill cuttings coming off the shale shaker to obtain the best sample possible. A review and video demonstration of some of these devices will be presented. This will be followed by an examination of cuttings produced from these devices and discussion about the effectiveness and future improvements of these devices.
I NFORMATION
Lunch will be provided. Please contact Doug Hayden (doug@doughayden.ca), Chair, CSPG Core and Sample Division to confirm your attendance. For more information concerning this Division, please contact the Division Chair, Doug Hayden, at (403) 615-1624 or via email at doug@doughayden.ca.
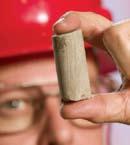
A geologist examining drill cuttings.
diVision talKs S TRuCTuRAL GEOLOGY DIVISION
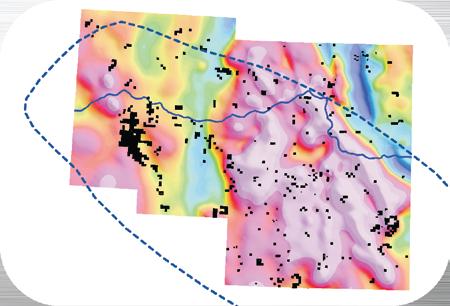
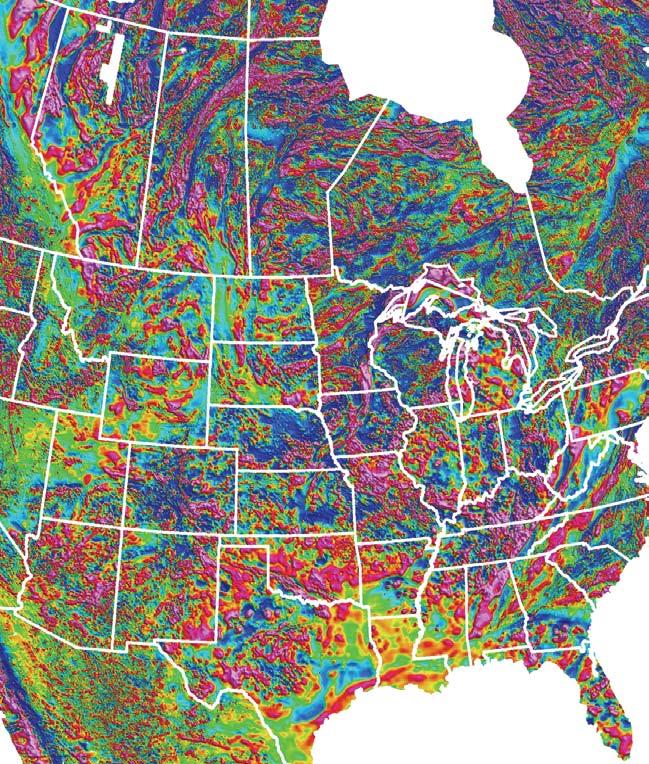
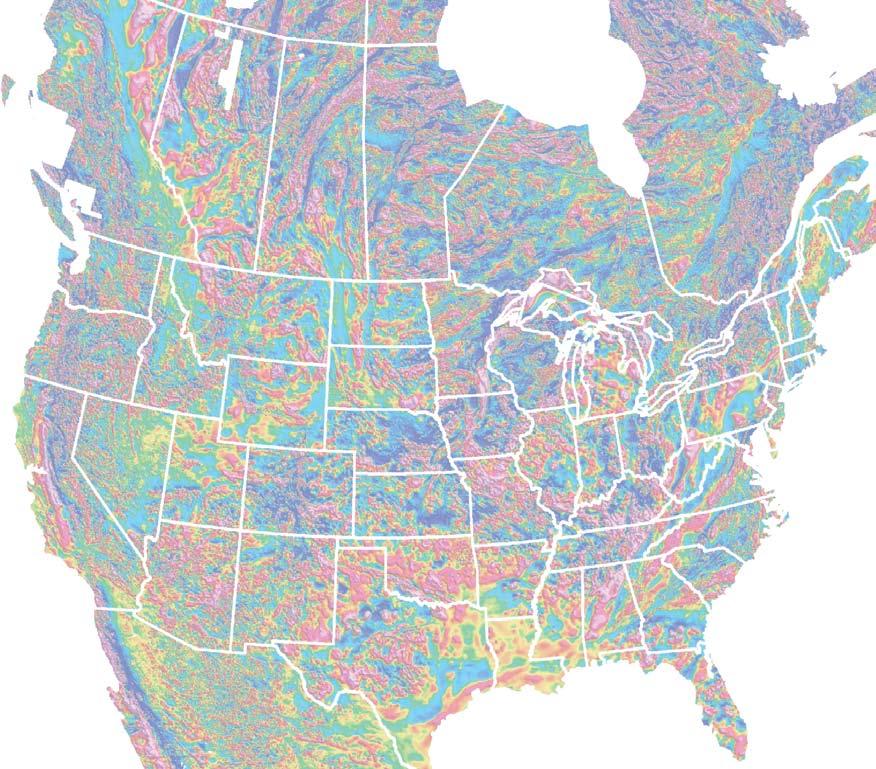
The contribution of integrated structural/ tectonic studies of HRAM data for exploration and exploitation of resource plays in North America
SPEAKERS
Dr. Zeev Berger, Dr. Michelle Boast, and Dr. Martin Mushayandebvu IITECH Inc.
12:00 noon thursday, december 11, 2008 Petro- canada West tower 17th Floor, room 17B/ c 150 – 6 ave sW calgary, a lberta
The recent shift from convention exploration to resource play exploitation has presented the geosciences community with a new and exciting set of challenges. Geologists, geophysicists, and petroleum engineers engaged in resource play exploitation are being challenged to identify “sweet spots” and “preferred trends” that are often controlled by extremely subtle
ROCK SHOP
geological features. Detection and analysis of these features often requires the use of tools and interpretation techniques which are not routinely used for conventional exploration.
IITECH has recently completed integrated structural and tectonic studies of several active resource play areas including: the Barnett shale in the Dallas Forth Worth Basin of West Texas; the Bakken Formation of the Williston Basin (USA and Canada); the Woodford and Fayetteville shales in the Arkoma and Ardmore Basins (Oklahoma); and the Doig and Montney formations, and the Devonian shale play of the Horn River Basin, northeast British Colombia (Canada). Results show that many of the resource plays contain “sweet spots” and “preferred trends” that are largely controlled by basement structures and topography. These features can be detected and analyzed through integrated analysis of magnetic data.
This talk will focus on resource plays of the Williston Basin and other basins in the USA. The objective is to illustrate our approach to regional structural interpretation and assessment of basins that contain developed and undeveloped resource plays. Special emphasis is placed on illustrating various imaging and filtering techniques that can be used to interpret the magnetic images in conjunction with existing 3D and 2D seismic and other pertinent geological information.
BIOGRAPHIES
Zeev Berger is the president and owner of IITech Inc. He has over 30 years of exploration
experience including 10 years with the remotesensing group at Exxon Production Research Co., five years with Imperial Oil as a technical mentor and four years as President of PAZ Energy.
Michelle Boast is an interpreter of gravity, magnetic, and remote sensing data for IITech. She is a structural geologist with a crossdisciplinary background spanning economic geology, metamorphic petrology, impact geology, petrography, and field-based geology. Boast reinterpreted the effects of the Penokean and Grenville orogenies on the Sudbury impact structure, in Ontario, with implications for Cu-Ni ore exploration in the underlying basement rocks.
Martin Mushayandebvu is chief geophysicist of IITECH with over 20 years teaching and research experience. He was the principal researcher in the development of Extended Euler deconvolution.
I NFORMATION
Talks are free and do not require pre-registration. Please bring your lunch. Refreshments are provided by HEF Petrophysical Consulting, and the room is provided by Petro-Canada. If you would like to be on the Structural Division email list, or if you’d like to give a talk, please contact Jamie Jamison at (403) 816-1818 or wjamison@shaw.ca.
diVision talKs S TRuCTuRAL GEOLOGY DIVISION
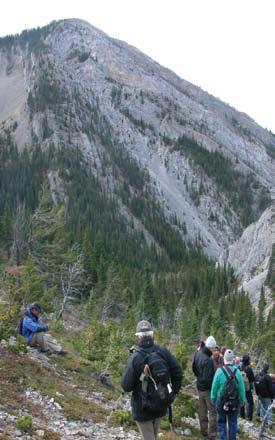
Fall 2008 CSPG structural geology division field trip, Centre Peak Anticline, Southern Livingstone Range
By Jamie Jamison
On a blustery autumn day, October 18, Michael Cooley led a group of 26 geoscientists up Green Creek canyon, a few kilometers northeast of the Frank Slide, to view Centre Peak Anticline. This tight, chevron fold is one of many folds
that are well exposed in Mississippian carbonates throughout Livingstone Range (leading structures in the Livingstone Thrust sheet).
The trek took us through the core of the anticline at Banff level, then up a gulley formed along a transverse fracture system to the ridgeline along the crest of the fold (in the Livingstone Formation). From that vantage point we had an excellent view of a minor thrust that propagates out of the backlimb to offset the core of the fold before dying out in the forelimb beds.
We would like to extend many thanks to Michael Cooley for taking our group through parts of his (Queen’s University) dissertation area and to Deborah Sanderson for initiating and handling the logistics for this field trip. This field trip was made possible through the generous financial support of the CSPG, IHS, Suncor Energy, and BP Canada.
Tar sands: key
geologic risks and opportunities as related to “An Inconvenient Truth” or, hybrids, heartburn and hope
SPEAKER
Jack Century
J.R. Century Petroleum Consultants, Ltd.
8:00 am, thursday, January 29, 2009 rPs energy canada ltd. 1400, 800 5 avenue sW, calgary, a lberta
As conventional oil becomes scarcer, more exploration is occurring in heavy oil, tar sands, and bitumen deposits. While these contribute significantly to the global energy budget, they also contribute a greater share to the global carbon budget and to the detriment of the global environment. The balancing act between economics and environmental concerns is demonstrated on a grand scale in the evaluation of these geologic deposits.
This paper presents the concerns relating to the “carbon footprint” in the development of these deposits in northern Alberta (referred to as “tar sands” for brevity), and to outline opportunities for more balanced tar sands development by improved
ROCK SHOP
integration of geoscience and engineering disciplines.
Petroleum geologists, geophysicists, and engineers often consider they are only doing their professional jobs, while the public, commercial, industrial, and government consumers can choose which kind, how much, and in what manner energy is consumed. In the case of tar sand production, however, we geoscientists and engineers are making that choice ourselves, and releasing unacceptable amounts of carbon into the atmosphere as a result. We must improve our professional practices in the oil patch to become more responsible citizens of the world.
Plans to develop the least carbon-rich tar sands with a practical transition of effective exploratory and development drilling for undiscovered, conventional light-medium oil and natural gas resources in the Western Canada Sedimentary Basin (WCSB) will conclude the presentation. This is done by taking into account the inevitable depletion of conventional, global oil supplies. This interim transition can lead us into greener, economic and sustainable wind, solar, geothermal, hydro, tidal and appropriate biomass energy supplies for future generations. For this to work, energy conservation and efficiency by all levels of society are the most immediate ways to implement necessary changes for a healthier and prosperous Canadian energy / environmental life style.
Former Vice President Al Gore has been a world leader in making the public aware of the global climate crisis we and future generations are facing. His Academy Award winning film, An Inconvenient Truth, has been of great help in focusing attention
on the challenges and solutions of humaninduced global warming and climate change. In April, 2008, 250 volunteers from across Canada were selected to become Presenters of An Inconvenient Truth as part of the Climate Project-Canada program, located in Montreal. A review of this weekend training session, personally conducted by Mr. Gore and others will be discussed also. Dr. Andrew Weaver of the University of Victoria is the science advisor to TCPCanada and Mr. Gore.
BIOGRAPH y
Jack Century has been active as a global petroleum, minerals and environmental geologist for over 56 years. In 1952 he earned a Master of Science degree in geology from the University of Illinois. His thesis was “The Animas Formation in the Northern Part of the San Juan Basin, Colorado.” He began his career as an exploration geophysicist in the Anadarko Basin for Standard Oil of Indiana then switched to exploration geology in the Paradox Basin and other regions of the Colorado Plateau. In 1959 Jack was transferred to Calgary to explore for Devonian reefs and other carbonate reservoirs in the WCSB, eventually leading the Amoco Canada Geological Technical Group. He started his consulting company in 1973.
Century was the Founding Chair of the CSPG Environmental Geology Division in 1990 and in 1992 was a Charter Member of the AAPG Division of Environmental Geoscience. He is an Emeritus Member of the CSPG, AAPG, and a Life Member of APEGGA. In 2008 Century became an official Presenter of An Inconvenient Truth along with 30 Albertans selected for a weekend of training by TCP-Canada.
R ESERVOIR E NGINEERING FOR GEOLOGISTS Reservoir Simulation
| by: Ray Mireault, P. Eng.; Nick Esho; and Lisa Dean, P. Geol.; Fekete Associates Inc.
In Fekete’s experience, a well performed reservoir simulation represents the ultimate integration of geology, geophysics, petrophysics, production data, and reservoir engineering. Through simulation, the flow of multiple fluids in heterogeneous rock over time can be quantitatively estimated to gain insights into reservoir performance not available by any other means.
Initially, reservoir simulation was reserved for large reservoirs requiring large capital investments that justified costly, intensive studies such as offshore developments. However, simulation of more modest-sized reservoirs has increased as simulation software and computer capability have become more readily available. Oilfields under primary production, waterflood, and EOR typically qualify for reservoir simulation but its usage is not uncommon for gas fields, unconventional reservoirs, or pools undergoing CO2 injection.
In broad terms, the geologist / geophysicist / petrophysicist’s role in reservoir simulation is to reliably approximate the (a) stratigraphy, (b) structure, and (c) geometry of the reservoir flow unit(s) and the initial fluid distributions throughout. The aim of the exercise is to quantify and manage the subsurface knowledge and uncertainties. In the practical sense, a good model is the one that is fit-for-purpose utilizing sound
geological reasoning and at the same time supports reservoir dynamics (e.g., fluid flow, history matching).
Geological data is often characterized by sparseness, high uncertainty, and uneven distribution, thus various methods of stochastic simulation of discrete and continuous variables are usually employed. The final product will be a combination of:
• observation of real data (deterministic component),
• education, training, and experience (geology, geophysics, and petrophysics), and
• formalized guessing (geostatistics).
The first step is the geologist’s conceptual depositional model which (s)he must be able to sketch and explain to the other members of the team. The conceptual model should be broadly compared and tested with each discipline’s observations and data (e.g., core permeability versus well-test permeability, core porosity versus log-derived values) until the team has a consistent explanation of the reservoir’s pre- through post-depositional history. Hydrocarbon reservoirs are too complex to develop a complete understanding “in one afternoon” so the process should be viewed as a series of ongoing discussions.
The next step is to define, test, and prioritize the uncertainties to be modeled and their impact on the overall dimensions of the model. For example, a gridblock height that is too large to reflect the layering in
thin beds will introduce significant errors in the flow net-to-gross pay estimates as well as flow pathways. It is essential to agree upfront on the level of resolution and details to be captured in the model. The appropriate level of detail can be different for each reservoir and is also dependent on the purpose of the simulation, sometimes testing and iterations maybe necessary.
Next comes selecting the appropriate grid type (regular or faulted) to model the present day structure of the reservoir. Components to be modeled include the top of structure, faults, internal baffles to flow, and any areal variation in thickness and rock properties. The objective is to replicate the orientation, geometry, and effect of the structural imprint as it affects flow within the model. It is imperative to validate the fault-horizon network to ensure it is geologically feasible and to ascertain the absence of structural distortion and other problems.
Facies modeling is the next step in construction. Where available, the best practice is to integrate core data and outcrop analogues to constrain and refine logderived facies type and property estimates. Understanding the facies distribution provides a tool for predicting reservoir quality away from the known datapoints. The geometry (length, width, thickness, and direction) of each facies body will affect the way heterogeneities in porosity and permeability are modeled. Attribute analysis (inversion/QI) and geobodies extracted
from seismic data are also useful to further refine the geological model.
It is important to quality check at each step of development to ensure consistency in the interpretation and reaffirm that the developing model is fit-for-purpose. A very detailed geological model may be unable to address the question(s) that the simulation team is attempting to answer.
The engineer’s role in the process is to reliably simulate the performance of the geological model for the production scenario(s) under consideration by history matching a producing field and / or forecasting future performance. While it may seem that reservoir simulation would be straightforward if we only knew all the inputs, that perception is incorrect. Limited information unquestionably complicates
the task but the most fundamental (and unavoidable) issue is the error introduced by approximating overwhelmingly complex physical geometries / interactions with simpler but manageable mathematical relationships.
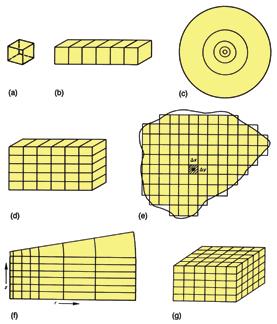
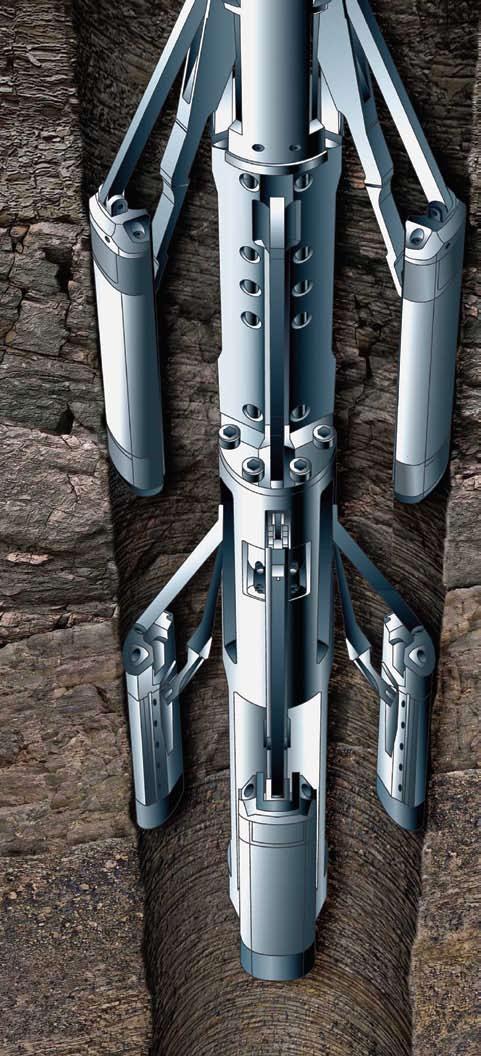
Of necessity, simulation uses a sequence of three-dimensional gridblocks as a proxy for reservoir rock volume (see Figure 1). In order to keep the time, cost, and computing requirements of a simulation manageable, the total number of gridblocks is generally limited to less than 500,000, with a small simulation requiring less than 100,000 gridblocks. For either large or small projects, a gridblock may represent a “unit” rock volume of one or more acres in areal extent and several feet thick (Figure 2).
While fluid saturations and / or other properties can vary significantly over an acre and / or several feet of reservoir (e.g., an oil-water transition zone), each gridblock has only a single value for each property (e.g., porosity, saturation of water, oil and gas, permeability, capillary pressure) of the gridblock. When the true variation in the reservoir is too great to be comfortably represented by a single average value, the solution may be to (iteratively) increase the density of the gridblocks (“fine grid”) in a specific area of the reservoir. Alternatively, a separate, smaller simulation may be run and the results provided as input to the larger study, as when modeling fluid and pressure behaviour at the wellbore sandface.
Similarly, simulation must approximate the continuous movement of fluids and the resulting changes in fluid saturations with calculations performed at discrete timesteps. Though it does not occur in the real world, there can be abrupt changes in a gridblock’s fluid saturation(s) as fluids move into or out of the gridblock. The usual solution is to limit the magnitude of the change to tolerable levels through (iterative) selection of smaller timesteps.
The use of discrete timesteps and discrete gridblocks with a single value for each property also leads to the dilemma of what values to use in modeling the fluid properties for flow between adjacent gridblocks and adjacent timesteps. This artifact of numerical simulation also has consequences on calculated performance that do not exist in reality. For further discussion, see Chapter 2 of the SPE Monograph Volume 13. Though there is no completely satisfactory answer to the problem, workable approximations for flow across gridblock boundaries and
(Continued on page 22...)
Figure 3. Rock and Fluid Properties. Mattax and Dalton (1990).
(...Continued from page 21)
between subsequent timesteps exist. The choice of which to use in a particular situation often comes down to experience and iteration.
DATA R EqUIREMENTS
The rock and fluid properties required for reservoir simulation are summarized in Figure 3. Collecting the data and putting it into a form that can be imported in a reservoir simulator can be a major effort in itself.
A SSIGNMENT OF GRIDBLOCK PROPERTIES
Chapter 4 and 5 of SPE Monograph 13 provide further discussion on the challenges of assigning representative average values for rock and fluid properties to each gridblock in a simulation model and the size of gridblocks and timesteps to use. The choices are interrelated and influenced by:
• the areal and vertical variation in the observed rock and fluid properties,
• the type of physical processes being modeled, and
• the solution techniques being used.
Often, the best approach is to select the smallest gridblock size and number of layers needed to accurately describe the changes
in reservoir facies, reservoir geometry, and fluid distribution. For example, fluid saturation changes in an oil-water transition zone might require gridblocks with an unusually small height of one foot or less to adequately represent the change in saturation through the transition zone with the series of single values available to “stacked” gridblocks. Production and injection wells and internal no-flow boundaries such as shale deposits or non-conducting faults are other features that can be the determining factor in selecting gridblock size.
Porosity and permeability distribution are nearly always important and are often the keys to reservoir performance. Sensitivity studies generally indicate that if the facies distributions through the reservoir are correctly modeled and each facies is assigned the correct order of magnitude for permeability, the relatively small errors in the absolute value of permeability assigned to each gridblock are insignificant, since they are compensated for by the large area of flow that is available for fluid movement.
Constructing the entire reservoir model with a minimum size of gridblock captures the level of detail needed for critical aspect(s) of the reservoir simulation but over-compensates in non-critical areas. Subsequent inspection of the model, keeping
in mind the physical processes (i.e., thermal processes) and solution techniques that will be used to model fluid flow, will identify areas of the reservoir that do not require the level of detail that was built into the original model. The process of subsequently selecting and reducing the number of gridblocks used to model the non-critical areas is referred to as “upscaling.”
Selection of the appropriate timestep is generally left to last, because the pore volume of a gridblock and rate of fluid flow (production) both influence the rate of change in a gridblock’s fluid saturations over time. Limits on the rate of saturation change that are developed from experience, are generally used to determine the largest timestep size that will present apparently smooth results when mapped or graphed. This process is done internally by the simulator to ensure smoothness of results.
SIMULATION OUTPUT
Since it is not possible to individually inspect the millions of calculations that are performed in a simulation, editing and graphical presentation of the output is crucial to assessing the consistency and reliability of the results. As a minimum, the output graphs should include:
• oil, water and gas production rates,
• producing gas-oil ratio;
• producing water cut or water oil ratio, and
• bottomhole flowing pressures.
Maps / movies of fluid saturation and reservoir pressure trends are also invaluable to assessing the quality and consistency of the output. For example, inconsistent pressure behaviour – related to negative cell volumes – may indicate that there is an issue with the gridding and / or assigned transmissibility of gridblocks along a fault zone.
USES AND L IMITATIONS OF SIMULATION
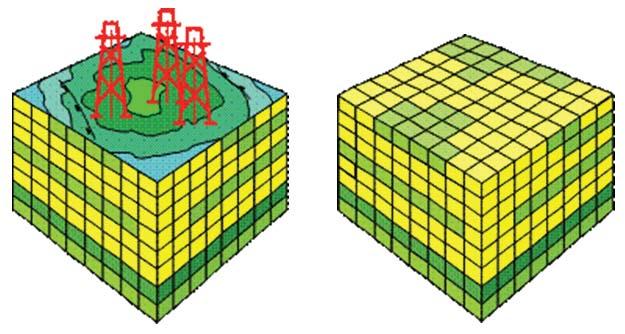
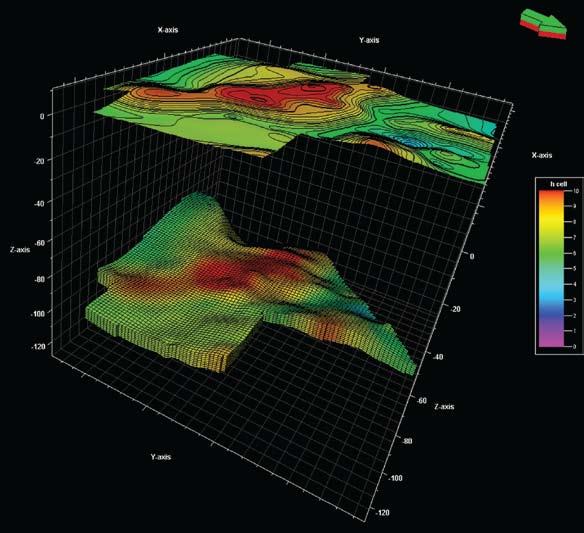
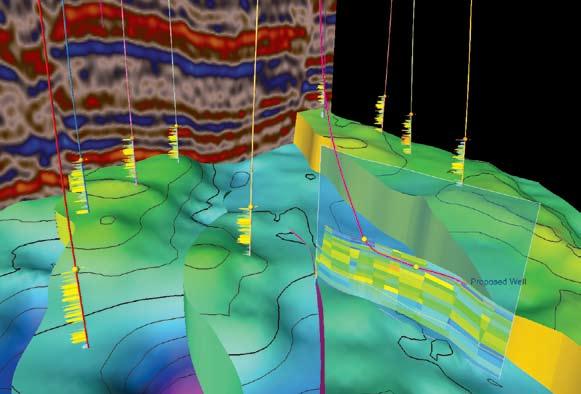
As computing power and software capability have developed, the “art” of reservoir simulation has proven to be a valuable complement to other methods of reservoir analysis. To the geologist, a threedimensional model is the ultimate tool for visualizing and then communicating the reservoir interpretation to others (Figure 4). As a working tool, it integrates the partial interpretations provided by each discipline and allows for an unsurpassed level of consistency checks.
To the reservoir engineer, modern-day
Figure 4. Visualization of 3D Model.
reservoir simulation software provides the capability to visualize and present the movement of fluids through rock in accordance with physical principals. With it we can:
• comparatively assess the hydrocarbon recovery efficiency of various production systems that could be considered for a given reservoir prior to their implementation and
• more closely monitor producing reservoir trends and more quickly identify the probable causes of deviations from forecasted performance, particularly during the early life of a reservoir.
Prior to production, Monte Carlo volumetric estimates are still the best tool to quantify the uncertainty in the gas or oil-in-place within a deposit. But reservoir simulation allows comparison of production performance over the probable volumetric range at a level not previously available. Simulation sensitivity studies are invaluable in identifying the uncertainties that can have a significant impact on production / financial performance and in focusing efforts to acquire additional information and / or modify development plans to mitigate potential impacts.
For a producing reservoir, material balance still provides the most accurate estimates of oil- and / or gas-in-place. Accordingly, tuning the in-place volumes in the simulator to the material balance results improves the diagnoses of well performance and allows for better reservoir management.
R EFERENCES
Mattax, C.C. and Dalton R.L. 1990. Reservoir Simulation. Society of Petroleum Engineers, Henry L. Doherty Series, Monograph Vol. 13.
This is the last of Fekete’s articles on Reservoir Engineering for Geologists. We would like to thank the CSPG for the opportunity to present this series. We also wish to thank the members for the positive feedback we have received.
This article was contributed by Fekete Associates Inc. For more information on this series, contact Lisa Dean at Fekete Associates Inc.
Breakthrough Performance.
Petrel Geology
PET REL* SEISMIC-TO-SIMUL ATION SOF T WARE AMPLIFIES THE IMPACT OF E&P T EAMS. One solution uniting the subsurface domains of geophysics, geology, and reservoir engineering—new modeling capabilities better predict fracture geometries and facies distributions, analyze structural uncertainties, and define your well placement strategy.
“It’s like having an extra geologist sitting there. It’s telling you things that you didn’t know, it’s testing your theories like you never saw before and helping you come up with new ideas.” —David Hamilton, CEO, Subsurface Computer Modeling
Schlumberger Information Solutions—step-changing productivity for geoscientists and engineers.
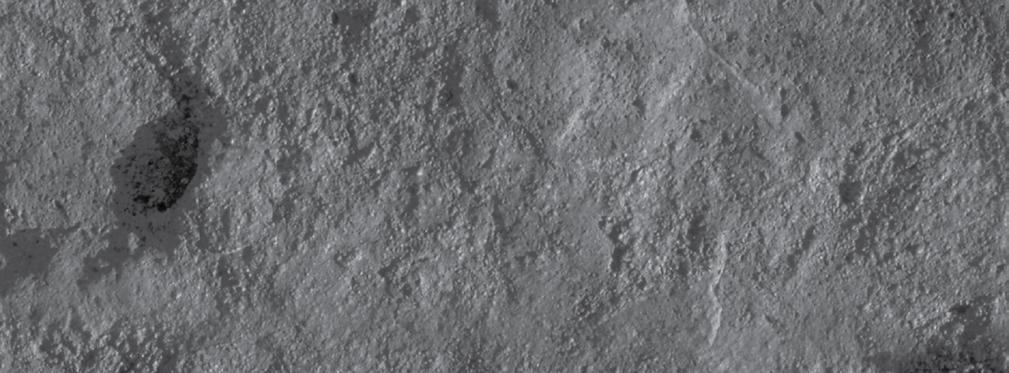
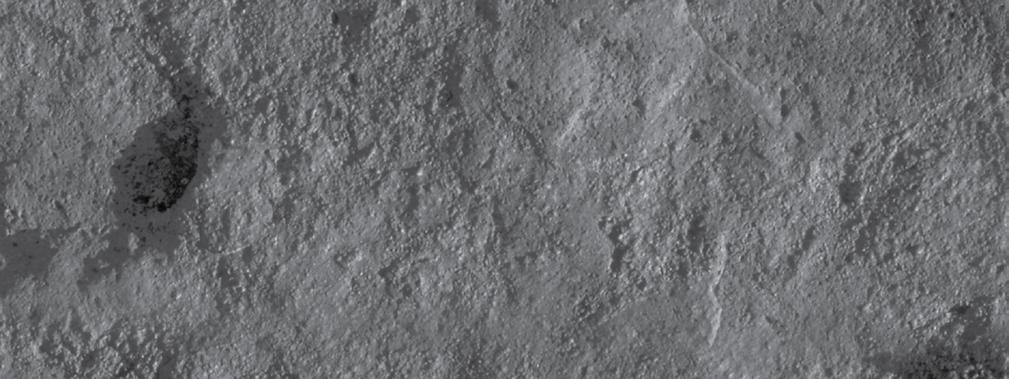
V IRTUAL OUTCROPS AND GEOCELLULAR MODELS OF THE W INDERMERE T URBIDITE Sy STEM, Southern Canadian Cordillera
| by E. Schwarz1, S.J. Buckley2, V. Terlaky3 , J.A. Howell2, R.W.C. Arnott 3
or “smearing”
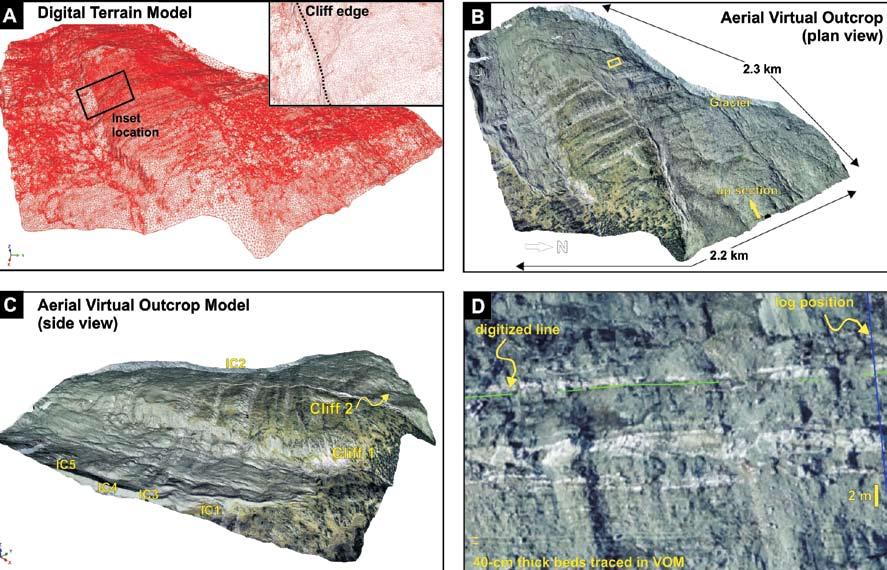
Ross, 2008 for details). D) Close-up view of the high-resolution
INTRODUCTION
A Virtual Outcrop Model (VOM) is a threedimensional, photorealistic representation of the exposed geology of a specific area, and consists of a georeferenced digital terrain surface rendered with high-resolution imagery. This cutting-edge technique is especially useful for outcrop studies where the extraction of accurate geometric data is the primary objective. In addition, by using a VOM, petroleum geologists have the opportunity to study geobodies in a reservoir analogue from different perspectives (3D visualization), to map and correlate key stratal surfaces, and to compare the digital outcrop with other field data (e.g., sedimentary logs, stratigraphic surfaces, outcrop gamma-ray logs).
A virtual outcrop also provides a revolutionary tool for building outcrop geocellular models. A geocellular model is a computer-based representation of a geological volume, which in most cases represents a subsurface reservoir (Enge et al., 2007). An outcrop-based geocellular model is similar, but constrained by outcrop data such as mapped surfaces and logs. The same software that is routinely used in the oil industry to build subsurface reservoir models can be adapted to manipulate data extracted from the VOM to build models of the outcrop (e.g., RMS by ROx AR, Petrel by Schlumberger, and GoCad by Paradigm). In a typical workflow, stratigraphic surfaces are digitized in a VOM and exported into
RMS. Once recreated in 3D, these surfaces are used to define zones where lithofacies and / or objects (geobodies) can be modeled. Lithofacies and geobodies are then used to control the distribution of petrophysical properties within the model, which can eventually be interrogated both statically and dynamically. Results from these analyses can provide important insights and improve input variables to build more realistic subsurface reservoir models.
In this contribution, we present an innovative method for the creation of a virtual outcrop model for strata of the Windermere Supergroup at Castle Creek (west-central British Columbia). The virtual outcrop model was created by draping high-resolution 1. Corresponding author: Centro de Investigaciones Geológicas (CONICET), La Plata, Buenos Aires, Argentina. eschwarz@cig.museo.unlp.edu.ar <mailto:eschwarz@cig.museo.unlp.edu.a.r>. 2. Centre for Integrated Petroleum Research, University of Bergen, Bergen, Norway. 3. Department of Earth Sciences, University of Ottawa, Ottawa, Ontario, Canada.
Figure 1: Digital representations of the Castle Creek study area. A) Digital Terrain Model showing triangle density in the study area. Inset picture shows the effect of a nearvertical cliff on triangle spacing. B) Virtual Outcrop Model created from the aerial photographs. Yellow box shows location of Figure 1D. C) Side view of the same VOM showing the stretching
effect of the draped aerial photograph on a near-vertical cliff face (Cliff 1). IC1 to IC5 for Isaac Channel 1 to Isaac Channel 5 (see Arnott and
aerial VOM, where beds as thin as 40 cm thick can be traced.
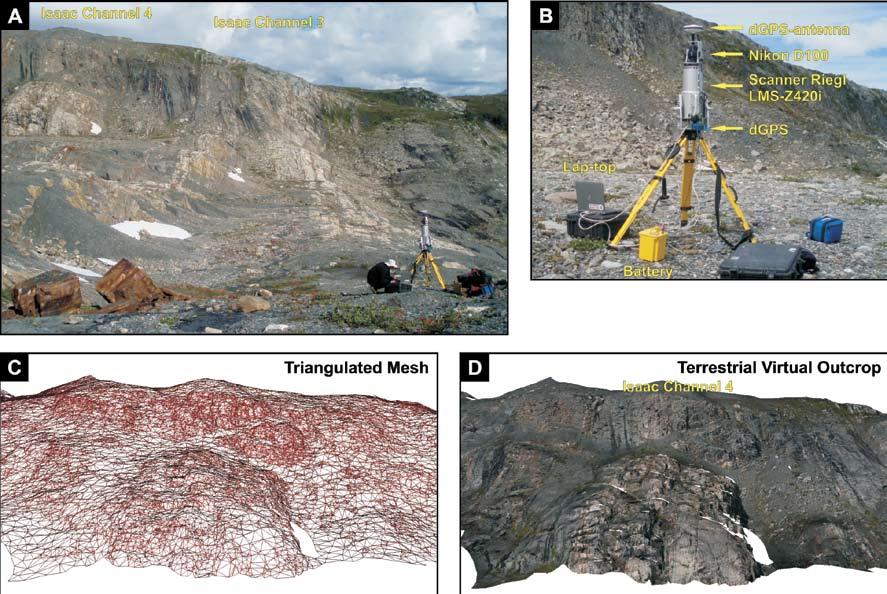
2: Lidar workflow from field to computer model. A) Scan position at Isaac Channels 3 and 4. A single scan of the lidar system acquires several million point measurements, each with x, y, z coordinates and an intensity value. B) Riegl LMS-Z420i instrument showing mounted camera, GPS antenna, power supply, and laptop interface. C) After combination of all scans and decimation of the point cloud, the resulting points are triangulated to produce a triangulated mesh of the outcrop cliff faces. D) Finally, the photographs taken with the mounted camera are draped over the triangulated mesh, producing a high-resolution terrestrial VOM.
(...Continued from page 25))
aerial images onto a topographic model, and then integrating this aerial dataset with ground-based laser scanning surveys of the cliffs that were not clearly represented in the aerial imagery. The utility of this VOM for subsurface studies is illustrated by the ability to show that accurate geometric data can be extracted from the outcrop model and imported into a reservoir modelling package. This aids in the re-creation of zone boundaries in an outcrop-based “reservoir” model of a seismic-scale channel-levee system.
T HE W INDERMERE SUPERGROUP AND C ASTLE CREEK AREA
The Neoproterozoic Windermere Supergroup of the southern Canadian Cordillera represents the remnants of a large, regionally extensive turbidite system that was potentially similar in scale to modern systems such as the Mississippi and Amazon fans (see Arnott and Ross, 2008 for further details). At Castle Creek, an unbroken 2.5 km-thick by 7 km-wide stratigraphic section crops out and comprises basin-floor
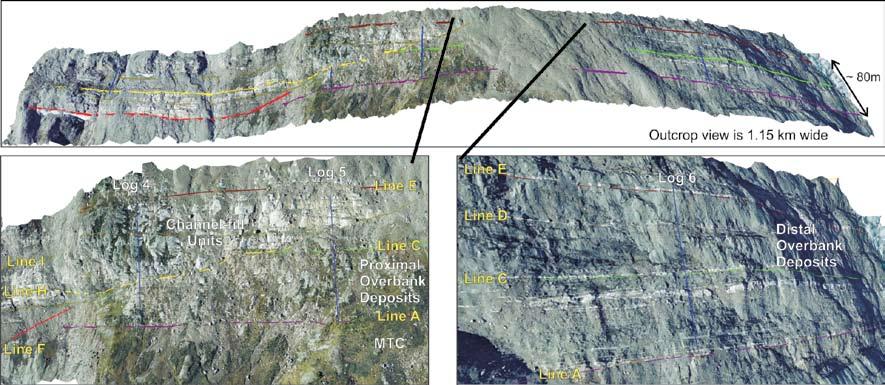
deposits (upper Kaza Group) overlain by a slope succession (Isaac Formation) with common mass-movement deposits (Arnott and Ross, 2008). These periglacial outcrops dip vertically and crop out mostly along a gently inclined to flat topography (see Figure 5 of Arnott and Ross, 2008). Over this subdued topography, channelized and non-channelized stratigraphic elements can be mapped and traced in two dimensions for hundreds of meters to a few kilometers. As a consequence, the seismic-scale architectural elements exposed in the Castle Creek study area represent an ideal outcrop analogue for turbidite-dominated deep-water reservoirs (e.g., Schwarz and Arnott, 2007).
T
HE W INDERMERE V IRTUAL OUTCROP MODEL
A virtual outcrop model (VOM) of the Castle Creek South area was generated by combining aerial and terrestrial datasets. Most of the VOM was reproduced from the aerial dataset. Semi-automatic digital aerial photogrammetry, using overlapping aerial photographs (stereo-pairs) and ground control points, was used to recreate the
digital terrain model of the area (Figure 1a). Subsequently, the terrain model was rendered (“draped”) with the high-resolution digital aerial images to generate the photorealistic representation of the outcrop, the Virtual Outcrop Model (Figure 1b, c). This aerial VOM has very high resolution (each pixel being around 10 cm on the ground), and allows for the detailed mapping of key surfaces and elements over the relatively flat topography (Figure 1d).
However, in near-vertical cliffs the aerial virtual outcrop appears distorted (stretched), because the vertical lines of sight in the aerial photogrammetry are nearly parallel to the cliffs. A terrestrial lidar (light detection and ranging) system was used to acquire three-dimensional outcrop data of two cliff faces (Figure 2a, b). Lidar, also known as laser scanning (Buckley et al., 2008), collects thousands of points per second that are automatically converted into x, y, z coordinates (called a point cloud). Point accuracy is typically a few centimeters. Data collection and preparation of the terrestrial virtual outcrops followed a
Figure
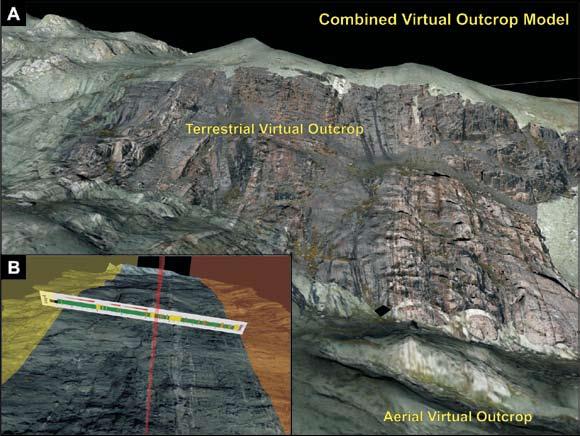
standardized workflow (Buckley et al., 2008). This workflow, which typically takes a few weeks, includes combination of the point clouds into one single project, point-cloud cleaning and decimation, and triangulation to form a terrain model or triangulated mesh (Figure 2c). Subsequently, high-resolution digital photos, which are simultaneously but independently captured, are added to the project and used to render the mesh surfaces and generate the terrestrial virtual outcrop models (Figure 2d). Together, this terrestrial dataset covers ~ 1.2 km of Castle Creek stratigraphy exposed at cliffs, and was combined with the aerial virtual outcrop to provide detail in the third dimension of the final virtual model (Figure 3a).
At this final stage, the combined virtual outcrop was loaded into a viewer and visualized together with the additional geological data (sedimentary logs and outcrop gamma-ray
logs, Figure 3b). The field geologist then uses the VOM to quality control the field correlations and mapping. In addition to supplementing the field work, the VOM has a number of other uses including: a) training, as petroleum geologists can inspect geobodies of the reservoir analogue at different scales and gain improved understanding; b) the direct measurement of geobody dimensions as input for object-based models; and finally, c) for collecting data to build geocellular models of the outcrop.
FROM A V IRTUAL OUTCROP TO AN OUTCROP-BASED “R ESERVOIR” MODEL
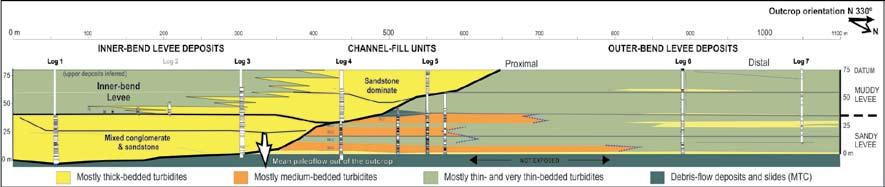
As shown in previous issues of the Reservoir (Khan and Arnott, 2008; Navarro et al., 2008), Isaac Channel 3 of the Isaac Formation offers an exceptional opportunity to study wellexposed overbank strata along both margins of a complex deep-water-slope channel fill (Figure 4). This stratigraphic element can
be used as an analogue for many deepwater channel-levee systems that recently have been documented from modern and Tertiary turbidite-dominated slope settings (e.g., Posamentier and Walker, 2006). In order to extract as much information from this reservoir analogue as possible, a surface-based, geocellular model of the Isaac Channel-levee 3 was built using RMS, extrapolating the outcrop and VOM data into a geological volume.
Key stratigraphic surfaces in Isaac Channel 3 include the terraced, composite surfaces at the base of the channel-fill units (Figure 4). Surfaces mapped in outcrops present a different set of challenges to the surfaces typically used to build 3D geocellular (reservoir) models. In a subsurface reservoir model the main surfaces (horizons) are typically imported from seismic data and have good 3D coverage but poor vertical resolution. Outcrop-extracted surfaces lack good 3D coverage, but are more accurate where mapped. To reconstruct the surfaces, georeferenced 3D lines (i.e., defined by points with x, y, and z coordinates) that represent the intersection of the channel margins with the outcrop were extracted from the VOM (Figure 5). These were then exported to the modeling system and extrapolated into 3D. The extrapolation was heavily influenced by the conceptual geological model (see Navarro et al., 2008), and thus the geologist becomes key in the modeling procedure.
The workflow for building surface-based geocellular models out of 3-D data extracted from a virtual outcrop is summarized by Enge et al. (2007), and has been followed in this study. Firstly, key bounding surfaces both from the channel-fill and overbank units of Isaac Channel 3 were traced and digitized in the virtual outcrop (Figure 5). Secondly, the tectonic dip of the strata (and digitized lines) was removed using a restoration package (3D Move, by Midland Valley). The structural restoration is carried out because outcrop models are typically built to investigate the impact of different stratigraphic and
(Continued on page 28...)
Figure 4: Simplified cross-section of Isaac Channel 3 channel-levee system exposed at Castle Creek. These hard data and the conceptual model (Navarro et al., 2008) are used to guide, constrain, and quality check the geocellular model for the area.
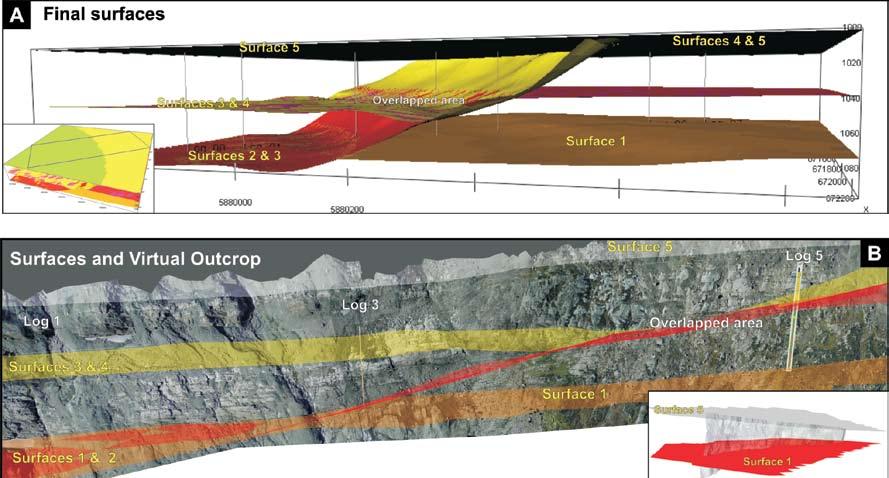
Figure 3: A) The VOMs built from the aerial photographs and the terrestrial lidar survey are merged to produce a combined VOM. The match between the two datasets is remarkable, as can be seen at the boundary between the two datasets (note continuation of individual beds). B) The final VOM is visualized with a sedimentary log taken in the field at Castle Creek. The red and yellow surfaces are the bounding surfaces used in the creation of a geocellular model of the area.
The
(...Continued from page 27)
depositional conditions on the continuity, connectivity, and performance of the reservoir; the particular structural aspect of any particular outcrop is inconsequential.
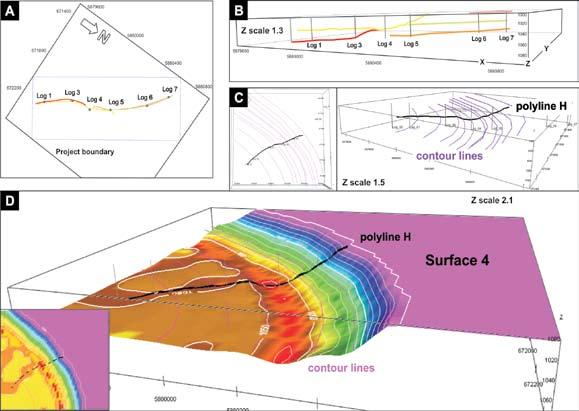
Subsequently, the “undeformed” lines were imported into an RMS project, together with the location of sedimentary sections (Figure 6a). Following the interpretation of the conceptual model, five main surfaces (horizons) were defined for the stratigraphic framework. The outcrop-extracted polylines and artificial contour lines were used to guide the algorithm (global B-spline algorithm) to recreate all the surfaces (Figure 6b). After realistic surfaces were generated, some additional manual editing was needed to adjust minor features. Finally, to avoid cross-cutting of surfaces, areas of individual surfaces were merged, using a process known as “operation between surfaces”. For quality checking, the final RMS-generated surfaces (Figure 7a) and original lines were rotated back to the original structurally “deformed” conditions and then imported again into the 3D viewer to visually inspect the degree of correlation between original polylines, surfaces, and the virtual outcrop data. As the degree of correlation was more than satisfactory (see Figure 7b), these surfaces were used as the basis for the geocellular model.
The facies model workflow of Isaac Channel 3 was similar to the one used for reservoir facies modeling. It involved the definition of modeling zones, which were gridded and populated with facies using different algorithms available in the modeling package
that were heavily constrained by sedimentary logs (as “wells”). As a quality check, modeled realizations in each zone were compared to outcrop data until satisfactory results were obtained. The resulting outcrop-based geocellular model can then be examined both statically and dynamically. Static investigation includes visual inspection and extraction of quantitative (hard and / or statistical) data (Enge et al., 2007). For dynamic investigations (e.g., flow simulation), the model has to be placed at typical reservoir
depths (> 1000 m below sea level) and petrophysical properties assigned to the grid cells. Flow simulation investigations of the Isaac Channel 3 geomodel are currently in progress. Poro-perm data for the lithofacies that are represented in the geocellular model will be extracted from an analogous subsurface channel-levee system (e.g., offshore West Africa or Gulf of Mexico). The results from this flow-simulation study may provide important insights and improve input variables to build more realistic and
Figure 6: A) and B) Locations of structurally restored sedimentary logs and lines. Curved line in A) follows roughly the topography of the Castle Creek area. C) and D) Workflow to generate bounding surfaces using “Surface 4” as example. Polyline H and additional contour lines created with the software are used to algorithmically (global B-spline) reproduce the surface.
Figure 5: Isaac Channel 3 as seen in the VOM. The coloured polylines represent major stratigraphic surfaces that are traced and digitized on the VOM and are used to create bounding surfaces for geocellular models.
surface created with the aid of polyline “Line H” is shown in Figure 6.
accurate subsurface reservoir models of deep-marine channel-levee systems.
ACKNOWLEDGEMENTS
The Windermere Supergroup in the southern Canadian Cordillera represents one of the world’s best geological laboratories to investigate the processes of sediment transport and patterns and architecture of deposition in the deepmarine sedimentary record. Over the past 10 months we have reported on our group’s work over the past 8 years that has focused on architectural elements formed on the basin floor to base-of-slope. Our objective in the coming years is to continue our work on the basin floor, and to move upslope, and onto the mid and upper continental slope, in addition to investigating the effect of sediment concentration on sediment-gravity flows and flow systems. We conclude by acknowledging and thanking our industry and government partners, whose financial support and encouragement have made our research program a reality.
The ongoing research of the WSG is funded by the industry members of the Windermere Consortium (Anadarko Petroleum, Canadian Natural Resources Ltd., Devon Petroleum Ltd., Husky Energy, Encana Corp., Nexen Inc., and Shell) and an NSERC Collaborative Research and Development Grant. S. Buckley and J. Howell also thank the Norwegian Research Council for funding the Virtual Outcrop Geology
project at CIPR. Riegl are thanked for providing RISCAN PRO 1.2 to the University of Ottawa. ROXAR are acknowledged for supplying the IRAP RMS software package to G. Veiga at CIG (University of La Plata and CONICET, Argentina) and to the University of Bergen. Lilian Navarro and Shan Khan collected and provided the sedimentological data, and did a great job putting together a conceptual model for ICL-3. Tor Aas (CIPR) is acknowledged for assistance in structural restoration using the 3DMove software which was made available by MVE.
REFERENCES
Arnott, R.W.C. and Ross, G.M. 2008. Overview of the (Neoproterozoic) Windermere Supergroup of the southern Canadian Cordillera. Canadian Society of Petroleum Geologists, The Reservoir, v. 35, issue 2, p. 35-38.
Buckley, S.J., Howell, J.A., Enge, H.D., and Kurz, T.H. 2008. Terrestrial laser scanning in geology: data acquisition, processing and accuracy considerations. Journal of the Geological Society, London, v. 165, p. 625-638.
Enge, H.D., Buckley, S.J., Rotevatn, A., and Howell, J.A. 2007. From outcrop to reservoir simulation model: Workflow and procedures. Geosphere, v. 3, p. 469-490.
Khan, Z. and Arnott, R.W.C. 2008. Deep-water
channel-levee complex of the Neoproterozoic Isaac Formation, Windermere Supergroup, Cariboo Mountains, western Canada: Part 2: Architectural Analysis of Overbank Deposits. Canadian Society of Petroleum Geologists, The Reservoir, v. 35, issue 7, p. 20-23.
Navarro, L., Khan, S., and Arnott, R.W.C. 2008. Deep-water Channel-Levee Complex of the Neoproterozoic Isaac Formation, Windermere Supergroup, Cariboo Mountains, Western Canada: Part 3: Depositional Evolution Model and Reservoir Implications of a ChannelLevee Complex. Canadian Society of Petroleum Geologists, The Reservoir, v. 35, issue 8, p. 30-35.
Posamentier, H. and Walker, R.G. 2006. Deep-Water Turbidites and Submarine Fans. In: Facies Models revisited. R.G. Walker and H. Posamentier (eds.). Society of Economic Paleontology and Mineralogy. Special Publication, v. 84, p. 397-520.
Schwarz, E. and Arnott, R.W.C. 2007. Anatomy and Evolution of a Slope Channel-Complex Set (Neoproterozoic Isaac Formation, Windermere Supergroup, Southern Canadian Cordillera): Implications for Reservoir Characterization. Journal of Sedimentary Research, v. 77, p. 89-109.
Figure 7: A) Shown are the five surfaces created to delineate and divide the geocellular model into four “zones”, each of which is populated with different facies (side view). The inset shows an oblique view of the surface model. Vertical exaggeration as in 6b. B) The surfaces were rotated back to the structurally deformed orientation of the outcrop. This allowed for visual inspection of these surfaces, and cross-validation with the conceptual model shown in Figure 4.
Right When You Need
Open for business 24/7, Halliburton has the right open-hole technology—backed by our legendary reliability and service excellence—right now Whether you need formation evaluation, imaging, testing, fluid sampling, acoustics/rock mechanics, NMR, hostile/slim hole, sidewall coring or any other open-hole service—Halliburton has exactly what you need, when you need it. For more information, call 1-888-775-6447. Or visit us at www.halliburton.com/wireline.
PRACTICAL SEqUENCE STRATIGRAPH y
The Base Level Change Model for Material-Based, Sequence Stratigraphic Surfaces
| by Ashton Embry
INTRODUCTION
As was described in the previous three articles in this series, six material-based surfaces of sequence stratigraphy, which represent either breaks in sedimentation or changes in depositional trend, were empirically and separately recognized over some 220 years. Furthermore, the origin of each was independently interpreted to be due to the interaction of base level change and sedimentation, as was also discussed in the past articles. For example, almost 100 years ago, Barrell (1917) postulated that subaerial unconformities formed by a fall in base level.
As part of the revitalization of sequence stratigraphy by Exxon scientists, Mac Jervey (1988) demonstrated that the generation of almost all of these surfaces (the RSME was not considered) can be explained by a model which involves oscillating base level with a constant sediment supply. In this article, I discuss the concept of base level, the factors that cause base level to oscillate, and the generation of the six sequence stratigraphic surfaces during one cycle of base level rise and fall. I also touch on a point of contention in sequence stratigraphy, which involves two variants of the base level change model and consequent differences in geometrical relationships between the surfaces.
BASE LEVEL
Harry Wheeler (1964) succinctly reviewed
the history of the use of the term base level in stratigraphy and subsequently Tim Cross (Cross, 1991; Cross and Lessenger, 1998) clearly demonstrated how the concept of base level has direct application to sequence stratigraphy. Base level, in a stratigraphic sense, is not a real, physical surface but rather is an abstract surface that represents a surface of equilibrium between erosion and deposition. It can be thought of as a ceiling for sedimentation and thus, in any area where it lies below the Earth’s surface, no sediment accumulation is possible and erosion will occur. Where base level lies above the Earth’s surface, deposition can and usually does occur in the space between the Earth’s surface and base level. The places where base level intersects the earth’s surface are equilibrium points between areas of erosion and areas of deposition. Such points define the edges of a depositional basin.
In a marine area, base level is usually very close to sea level and intersects the sea bottom only where strong currents or waves result in net sediment removal. This results in net deposition for most marine settings. In a nonmarine area, base level most commonly lies at or below the Earth’s surface and these areas are thus often subjected to active erosion by a variety of processes. However, in some terrestrial areas, base level can be above the Earth’s surface, usually in areas of standing water, and in these situations it usually closely coincides with lake / swamp
Figure 1. Base level change refers to the relative movement between base level (BL), here equated to sea level, and a datum below the sea floor. Two main factors control base level change – movement of the datum (uplift, subsidence) and eustatic sea level change. The space between base level and the datum is known as accommodation space (Jervey, 1988). Changes in base level thus equate to changes in accommodation space. Modified from Figure 3.6 of Coe (2003).
level. Rivers establish a base level profile which means they aggrade or erode until, with the established water and sediment supply, sediment is not deposited or eroded by the rivers. In this case, base level occurs at the base of the riverbed until a change occurs in water energy, sediment supply, or slope of the channel.
OSCILLATIONS OF BASE L EVEL
Base level can be seen as a surface that is associated with the amount of energy needed to erode sediment. The erosive energy available at any given point may change as a result of eustatic or tectonic activity. This will result in either base level falling (increased energy) or base level rising (decreased energy) at that point. Because of the dynamic nature of the Earth, base level rarely remains static in any given location and is usually moving upwards or downwards relative to a datum below the surface of the Earth. A datum is used rather than the Earth’s surface itself to ensure the concept of base level change is independent of sedimentation and erosion. Thus base level changes can be envisioned as changes in the distance between base level and the datum. The space created between the datum and base level, during a specific interval of time has been called accommodation space (Jervey, 1988) (Figure 1). Thus, base level changes equate to changes in the creation or destruction of accommodation space.
(Continued on page 32...
Figure 2. A base level change model for the generation of the six material-based surfaces of sequence stratigraphy. Each surface is generated during a specific time interval of base level change due to the interaction of rates of change in accommodation space with sedimentation rates. Modified from Figure 1 of Embry (2002).
Figure 3. Schematic evolution of the five material-based sequence stratigraphic surfaces associated with a ramp setting. (A) By the end of base level fall (= start base level rise), the subaerial unconformity (SU) reaches its maximum extent and a regressive surface of marine erosion (RSME) also migrates basinward at the base of shoreface deposits during base level fall. (b) Transgression begins as base level begins to rise and a shoreline ravinement (SR) migrates landward, eroding portions of the SU. At the same time, finer sediment is deposited at any given marine locality and a maximum regressive surface (MRS) is generated. (C) In the late phase of base level rise, regression occurs and coarser sediment reaches the marine shelf. A maximum flooding surface (MFS) is generated near the time of maximum transgression and a progradational, coarsening-upward succession then begins to accumulate on the shelf.
(...Continued from page 31)
There are two main drivers of regional base level change (i.e., increased or decreased energy over a substantial part the surface of the Earth). The first one is tectonics that results in upward or downward movements of the reference horizon (datum). In this situation the datum, and not base level, is moving. Downward movement of the datum is referred to as subsidence and, in a relative sense, subsidence results in rising base level and increased accommodation space (i.e., more space between base level and the datum). Conversely, upward movement of the datum (uplift) results in base level fall as the two reference horizons approach each other and accommodation space is reduced.
The second driver of regional base level movement is eustatic sea level change that records the movements of the surface of the ocean in relation to the centre of the earth (Figure 1). In this case, the datum remains stationary and base level, which is closely tied to sea level, moves up or down. Thus, rising eustatic sea level equates to rising base level and increased accommodation space, and falling eustatic sea level equates to falling base level and decreased accommodation space.
Furthermore, any reduction or increase of volume in the sedimentary column due to such phenomena as compaction, salt solution, and salt intrusion also will cause changes in base level and the amount of accommodation space made available.
In addition to the two main drivers of regional base level change, it must be mentioned that the erosive energy can also change due to local climate variations. For example, when water flow is increased in a river due to a wetter climate, e.g., a monsoon season, the erosive energy level rises, resulting in effectively a base level fall with consequent downcutting and erosion by the river. Such climate-driven, base level changes that are independent of tectonics and eustasy are usually local (basin margin) and short-lived and will not be discussed further.
Overall, we know that tectonics and eustasy are the main controls on regional base level change. However, it is often impossible to determine the effect of each factor separately (Burton et al., 1987). Their combined, net effect is expressed as a change in base level. The term relative sea level change is sometimes used (Van Wagoner et al.,
1988) for a combination of eustatic and tectonic movements but I prefer the term base level change because it has priority and does not result in any confusion in regards to moving sea level. Use of the term base level change also avoids often irresolvable arguments of whether tectonics or eustasy is responsible for additions and reductions in accommodation space and the accompanying breaks in sedimentation and changes in depositional trends in given situations.
As noted by Barrell (1917), base level at any given locality is constantly changing due to the interaction of the above factors. Such change is manifest in cycles (episodes) of base level rise and fall that can occur at a variety of time scales, with a variety of magnitudes, and on local and regional scales. In general, high magnitude base level changes (i.e., large falls and rises) occur less frequently than do smaller magnitude ones. This is an empirical observation that has great importance for determining a hierarchical arrangement of sequence stratigraphic units. This will be discussed in a later article.
Given that base level is continually changing, the key point for sequence stratigraphy is that such oscillations in base level result in a number of distinct sedimentary surfaces that reflect depositional breaks and / or changes of depositional trend due to the interaction between changing rates of the addition or reduction of accommodation space and the rate of sedimentation. For example, when accommodation space is eliminated in a given area due to base level fall below the surface of the earth, there is a major change from sedimentation to erosion and a break in sedimentation occurs. The initiation of erosion potentially results in the occurrence of various types of unconformities that can then be used for correlation and the delineation of sequence stratigraphic units. As emphasized previously, an unconformity represents a significant gap in the stratigraphic record and contrasts with a diastem that records only a minor gap.
SEDIMENTARy BREAKS AND CHANGES
IN DEPOSITIONAL T RENDS During a cycle of base level rise and fall, various depositional breaks and changes of depositional trend are generated and such changes are represented by the recognized, material-based surfaces of sequence stratigraphy which were described in detail in previous articles (Figures 2, 3, 4). Here I summarize the development of these surfaces during one base level cycle.
With the start of base level fall, accommodation space begins to be reduced and sedimentation ceases on the basin margin.
Figure 4. Schematic evolution of the six material-based sequence stratigraphic surfaces associated with a shelf / slope/basin setting. (A) During base level fall the subaerial unconformity (SU) migrates basinward. (b) Late in fall, when the shelf is exposed (SU at shelf edge), a slope onlap surface (SOS) is generated and turbidites begin to be deposited in the basin. At the start of base level rise, transgression begins and a maximum regressive surface (MRS) is generated in the basinal turbiditic deposits. (C) As transgression proceeds during base level rise, the shelf is flooded and a shoreline ravinement is cut, removing most of the SU. Finer sediments are deposited in the basin with the horizon of finest sediment marking the maximum flooding surface (MFS). (D) As base level rise gives way to fall, a wedge of sediment progrades basinward and another SU migrates basinward.
Subaerial erosion advances basinward during the entire time of fall and this produces a subaerial unconformity (SU) that reaches its maximum basinward extent at the end of base level fall (Figure 2, 3A, 4A). The seaward movement of the shoreline (regression), which began in the waning stages of base level rise, continues throughout base level fall but at a faster pace.
Also, when base level starts to fall, the inner part of the marine shelf in front of the steeper shoreface begins to be eroded as described by Plint (1988). This is due to the erosion of the inner shelf as it is replaced by the shoreface that has a higher slope. This inner shelf erosion surface moves seaward during the entire interval of base level fall and is progressively covered by prograding shoreface deposits. This results in a regressive surface of marine erosion (RSME) (Figure 2, 3A). It should be noted that an RSME often does not form due to variable energy levels and base level fall rates. Also, because such localized, submarine erosion results in only a minor gap in the stratigraphic record at any one locality, an RSME is a highly diachronous diastem rather than an unconformity over its extent.
Finally, when falling sea level reaches a shelf / slope break, sedimentation patterns are substantially altered. In siliciclastics, sediment is channeled down submarine canyons and
much of the slope becomes starved. In carbonates, the slope becomes starved at this time because the carbonate factory of the shelf is shut down due to subaerial exposure. Erosion of the slope can also occur due to current scouring and gravity
failures. The starved and / or eroded slope is gradually onlapped during the remainder of base level fall and / or during the early part of base level rise and transgression and a slope onlap surface (SOS) is thus generated (Figure 2, 4B).
When base level starts to rise, new accommodation space begins to be created in areas formerly undergoing erosion. This results in landward expansion of the basin margin and progressive onlap of the subaerial unconformity by nonmarine strata throughout the entire time of base level rise. With rising base level, less sediment is transported to the marine portion of a basin because of reduced fluvial gradients and increased sediment storage in the nonmarine area along the expanding basin margin. In most situations, almost immediately after the start of base level rise, the shoreline ceases its seaward movement and begins to shift landward (transgression). Also at this time, less and finer clastic material will reach a given locality in the marine area and the water depth will start to increase. All these changes, which occur at or very soon after the start of base level rise, result in two surfaces of sequence stratigraphy.
Along the shoreline, the slope of the alluvial plain is less than that of the shoreface and erosion carves out a new shoreface profile during transgression. The erosional surface is known as a shoreline ravinement (SR) and it develops during the entire time transgression occurs (Figure 2, 3B, 4B).
(Continued on page 34...)
Figure 5. A schematic cross-section for a ramp setting showing the geometric relationships for the five materialbased surfaces of sequence stratigraphy. Note a combination of SU and SR-U forms the basin flank unconformity and the basinward termination of the SR-U adjoins the landward termination of the MRS. This geometrical relationship is the result of transgression beginning at or very soon after the start of base level rise. The MFS extends from shelf to basin.
This erosional surface almost always cuts down through the basinward portion of the underlying subaerial unconformity (SU) and sometimes erodes most of the SU. This results in segments of a shoreline ravinement being either unconformable (SU eroded) or diastemic (SU preserved) as was described in Part V of this series (Figure 3B).
Also, as base level starts to rise and finer sediment starts to be deposited at any given shelf locality due to the overall reduced supply to the marine area, there is a significant change from a coarsening-upward trend that characterized the preceding base level fall to a fining-upward one. A described earlier, the horizon that marks this significant change in depositional trend is known as the maximum regressive surface (MRS) (Figure 2, 3B, 4B). The MRS also marks a change from shallowing-upward to deepening-upward in the shallow water areas.
Eventually, the rate of base level rise slows and sedimentation at the shoreline once again exceeds the rate of base level rise. The development of the shoreface ravinement stops and the shoreline reverses direction and begins to move seaward (regression). This is associated with increased sedimentation to the marine basin due to less storage capacity in the non-marine area and coarser sediment begins to be deposited at any given shelf locality. This produces a change from a finingupward trend to a coarsening-upward one and the horizon that marks this change in trend is a maximum flooding surface (MFS) (Figure 2, 3B, C, 4C, D). Notably this surface will approximate the horizon of deepest water in nearshore areas, but in areas farther offshore that have higher rates of base level rise, the horizon of deepest water will not coincide with the MFS but will be higher in the section.
In general, three surfaces are formed during base level fall: subaerial unconformity, regressive surface of marine erosion, and slope onlap surface; and three surfaces are formed during base level rise: shoreline ravinement, maximum regressive surface, and maximum flooding surface. However, it must be noted that, in some instances, the SOS is not generated until after the start of base level rise and, in many cases, an RSME is not generated at all. It is also worth mentioning that the surfaces generated during the base level rise portion of the cycle (SR, MRS, MFS) can also be generated during cycles of varying rates of base level rise rather than during risefall cycles. They can also be generated by autogenic processes which result in marked changes in sediment supply (e.g., delta-lobe
switching) during base level rise (Muto et al., 2007).
Overall, a model of oscillating base level change with constant sediment supply can reasonably explain the occurrence of the empirically-recognized, six surfaces of sequence stratigraphy. Because these surfaces form during specific time intervals during a base level cycle (Figure 2), they have a predictable spatial relationship to each other, regardless of sediment supply. Figures 5, 6, and 7 schematically illustrate these relationships for both a ramp and a shelf / slope / basin setting.
As will be discussed in subsequent articles, these spatial relationships are the key for predictions with sequence stratigraphy and for allowing sequence stratigraphic units to be defined by using various surfaces
and combinations of surfaces as unit boundaries.
I NITIAL B ASE L EVEL R ISE MODELS AND SURFACE R ELATIONSHIPS
The base level / sediment supply model discussed above for the generation of the six material-based surfaces of sequence stratigraphy is characterized by relatively high rates of base level rise occurring at or very soon after the start of base level rise. This variant of the general base level / sediment supply model is known as the fast initial rise model (Figure 8A) and I favour it because empirical data from studies of base level changes driven by either eustasy (Shackleton, 1987) or tectonics (Gawthorpe et al., 1994) indicate that high rates of rise occur very soon after the initiation of rise.
In this model, the maximum regressive
Figure 6. The time relationships of the five material-based surfaces of sequence stratigraphy for a ramp setting.
Figure 7. A schematic cross section for a shelf / slope / basin setting showing the geometric relationships for the six material-based surfaces of sequence stratigraphy. Once again, a combination of SU and SR-U forms the basin flank unconformity and the basinward termination of the SR-U adjoins the landward termination of the SOS. The MRS onlaps the SOS and the MFS extends across all the physiographic elements.
Figure 8. Two base-level-change models for sequence stratigraphy for a ramp setting. The same five material-based surfaces are generated in both models. The key difference between the two models is the resulting relationship between the subaerial unconformity and the shoreline ravinement. (A) The fast initial rise model. As shown on the left, both a tectonically-generated and a eustatically-generated base level curve are characterized by rapid initial base level rise. This results in the shoreline ravinement cutting out the basinward portion of the subaerial unconformity and the surface relationships shown on the right. (B) The slow initial rise model. As shown on the left, early base level rise is slow on a sinusoidal change curve. In this situation, the shoreline ravinement does not erode the basinward portion of the subaerial unconformity as shown on the right and a wedge of nonmarine sediment always separates the SU from the overlying SR and MRS. Note the basinward termination of the SU does not join with another material-based surface.
surface (MRS) is generated directly after the start of base level rise because, as described
earlier, sediment supply to the marine shelf decreases and becomes finer at any given
Easy payment terms – no finance charges
Aeroplan® Miles Program
24/7 Emergency Claims Service, with a guaranteed 30 minute claims response
ING Assistance coverage, included with home policies – provides free legal advice/home assistance
Travel insurance
Seasonal
Rented
locality as base level rapidly starts to rise and transgression begins. The shoreline ravinement also starts to form and move landward at or soon after the start of base level rise landward because of the common occurrence of very low sedimentation rates at the shoreline or significantly reduced rates in areas of greater supply (e.g., deltaic centres). Consequently, the landward termination of the MRS joins with the basinward termination of the shoreline ravinement (SR) (Figures 2, 3A, 8A). Importantly, the SR removes the basinward portion of the subaerial unconformity (SU) as it migrates landward and it often truncates much of the SU with remnants left at the base of incised valleys (Figures 3, 4, 5, 7). Thus, in this model, the basinward termination of the SU joins with a portion of the SR. The importance of this relationship will be emphasized when sequence stratigraphic units are discussed in forthcoming articles.
In support of such a model, almost all published, rock-based, sequence stratigraphic studies in both carbonates and siliciclastics, demonstrate that the basinward termination of the SU joins the SR as predicted in the model (e.g., Suter et al, 1987; Pomar, 1991; Embry, 1993; Beauchamp and Henderson,
(Continued on page 36...)
1994; Johannessen et al., 1995; Mjos et al., 1998; Plint et al., 2001; Johannessen and Steel, 2005; and many others).
The other base level/sediment supply model which has been proposed (Jervey, 1988) is one of very slow, initial base level rise (slow initial rise model) and it is illustrated in Figure 8B. In this case, the SR and MRS are not generated over much of the marine area until well after the start of base level rise. The reason for this is that sedimentation rates are high enough to exceed the very slow rise rates that occur during the early part of base level rise in this model. As a result, regression and sediment coarsening on much of the shelf, which occurred during fall, continue during early base level rise.
Furthermore, because the SR does not start to form until well into base level rise, it does not cut down through the basinward portion of the SU as it did in the fast initial rise model. Consequently, in the slow initial rise model, there is no material-based surface which connects to the termination of the SU (Figure 8B). The ramifications for sequence classification of this lack of a basinward correlative surface for the SU will be discussed in later articles.
I do not favour the slow initial rise model because there are no empirical data to indicate that base level rise rates are initially very slow. In fact, the opposite appears to occur, as discussed above. Also, empirical stratigraphic relationships established in rockbased studies indicate that the basinward termination of the SU almost always joins the SR, indicating the basinward portion of the SU has been eroded by the SR. These stratigraphic relationships also negate the viability of the slow initial rise model. The only studies, which have been offered in support of the model, are interpretations of seismic data not calibrated with logs and cores (e.g., Posamentier, 2003). These can be reasonably re-interpreted so as to be compatible with the fast initial rise model.
In my next article, I’ll elaborate on the timebased approach to sequence stratigraphy and the two time surfaces which are advocated for use in sequence stratigraphy.
R EFERENCES
Barrell, J. 1917. Rhythms and the measurements of geologic time. GSA Bulletin, v. 28, p. 745-904.
Beauchamp, B. and Henderson, C. 1994. The Lower Permian Raanes, Great Bear Cape and Trappers Cove formations. Bulletin of Canadian
Petroleum Geology, v. 42, p. 562-597.
Burton, R., Kendall, C., and Lerche, I. 1987 Out of our depth: on the impossibility of fathoming eustasy from the stratigraphic record. Earth Science Reviews, v. 24, p. 237-277.
Coe, A. (ed.). 2003. The sedimentary record of sea-level change. Cambridge University Press, New York, 287 p.
Cross, T. 1991. High resolution stratigraphic correlation from the perspective of base level cycles and sediment accommodation. In J. Dolson (ed.). Unconformity related hydrocarbon exploration and accumulation in clastic and carbonate settings. Short course notes, Rocky Mountain Association of Geologists, p. 28-41.
Cross, T.A. and Lessenger, M. 1998. Sediment volume portioning: rationale for stratigraphic model evaluation and high resolution stratigraphic correlation. In K. Sandvik, F. Gradstein, and N. Milton (eds.). Predictive high resolution sequence stratigraphy. Norwegian Petroleum Society Special Publication 8, p. 171-195.
Embry, A.F. 1993 Transgressive-regressive (T-R) sequence analysis of the Jurassic succession of the Sverdrup Basin, Canadian Arctic Archipelago. Canadian Journal of Earth Sciences, v. 30, p. 301-320.
Embry, A. 2002. Transgressive-Regressive (T-R) Sequence Stratigraphy, In J. Armentrout, and N. Rosen (eds.). Sequence stratigraphic models for exploration and production. Gulf Coast SEPM Conference Proceedings, Houston, p. 151-172.
Gawthorpe, R., Fraser, A., and Collier, R. 1994. Sequence stratigraphy in active extensional basins: implications for the interpretation of ancient basin fills. Marine and Petroleum Geology, v. 11, p. 642- 658.
Jervey, M. 1988. Quantitative geological modeling of siliciclastic rock sequences and their seismic expression. In C. Wilgus, B.S. Hastings, C.G. Kendall, H.W. Posamentier, C.A. Ross, and J.C. Van Wagoner, (eds.), Sea level changes: an integrated approach: SEPM Spec. Pub. 42, p. 47-69.
Johannessen, E., Mjos, R., Renshaw, D., Dalland, A., and Jacobsen, T. 1995. Northern limit of the Brent delta at the Tampen Spur – a sequence stratigraphic approach for sandstone prediction. In R. Steel, V. Felt, E. Johannessen, and C. Mathieu (eds.). Sequence Stratigraphy of the Northwest European Margin. Norwegian Petroleum Society Special Publication 5, p. 213-256.
Johannessen, E.J. and Steel, R.J. 2005. Shelf-margin clinoforms and prediction of deep water sands. Basin Research, v. 17, p. 521-550.
Mjos, R., Hadler-Jacobsen, F., and Johannessen, E. 1998. The distal sandstone pinchout of the Mesa Verde Group, San Juan basin and its relevance for sandstone prediction of the Brent Group, northern North Sea. In K. Sandvik, F. Gradstein, and N. Milton, (eds.). Predictive high resolution sequence stratigraphy. Norwegian Petroleum Society Special Publication 8, p. 263-297.
Muto, T., Steel, R. and Swenson, J. 2007. Autostratigraphy: A Framework Norm for Genetic Stratigraphy. Journal of Sedimentary Research, v. 77, p. 2-12.
Plint, A. 1988. Sharp-based shoreface sequences and offshore bars in the Cardium Formation of Alberta: their relationship to relative changes in sea level. In C. Wilgus, B.S. Hastings, C.G. Kendall, H.W. Posamentier, C.A. Ross, and J.C. Van Wagoner, (eds.). Sea level changes: an integrated approach. SEPM Special Publication 42, p. 357-370.
Plint, G., McCarthy, P., and Faccini, U. 2001. Nonmarine sequence stratigraphy: updip expression of sequence boundaries and systems tracts in a high resolution framework, Cenomanian Dunvegan Formation, Alberta foreland basin, Canada. American Association of Petroleum Geologists Bulletin, v. 85, p. 1967-2001.
Pomar, L. 1991. Reef geometries, erosion surfaces and high
frequency sea level changes, Upper Miocene reef complex, Mallorca, Spain. Sedimentology, v. 38, p. 243-269.
Posamentier, H. 2003. A linked shelf-edge delta and slope-channel turbidite system: 3d seismic case study from the eastern Gulf of Mexico. In H. Roberts, N. Rosen, R. Fillon, and J. Anderson, (eds.). Shelf margin deltas and linked down slope petroleum systems, Proceedings of the 23rd GCSSEPM conference, p. 115-134.
Shackleton, N.J. 1987. Oxygen isotopes, ice volume and sea level. Quaternary Science Reviews, v. 6, p. 183-190.
Suter, J., Berryhill, H., and Penland, S. 1987. Late Quaternary sea level fluctuations and depositional sequences, southwest Louisiana continental shelf. In D. Nummedal, O. Pilkey, and J. Howard, (eds.). Sealevel changes and coastal evolution. SEPM Special Publication 41, p. 199-122.
Van Wagoner, J.C., Posamentier, H.W., Mitchum, R.M., Vail, P.R., Sarg, J.F., Loutit, T.S., and Hardenbol, J. 1988. An overview of the fundamentals of sequence stratigraphy and key definitions. In C. Wilgus, B.S. Hastings, C.G. Kendall, H.W. Posamentier, C.A. Ross, and J.C. Van Wagoner, (eds.). Sea level changes: an integrated approach. SEPM Special Publication 42, p. 39-46.
Wheeler, H.E. 1964. Base level, lithosphere surface and time stratigraphy. GSA Bulletin. v. 75, p. 599-610.
Loring Tarcore Labs
The next generation oil sands lab
Provide certainty for our clients in the highly uncertain oil sands business by uarant ing the delivery date of lab testing results and core photos. g ee
During our two operation seasons, we delivered all Dean and Stark reports and core photos before the end of April each year. Our clients, including big oil companies, enjoy a plenty of time to make their business decisions. TIMELY!
For more information or lab tours, please contact us @(403)874-4588 or visit http://www.tarcore.com.
EXECUTIVE MEETING SUMMARy
September
25, 2008
| by Colin Yeo
Each month, the Reservoir will summarize the CSPG Executive Committee meetings that are usually held the last Thursday of each month except for July. These meetings are open for all members to observe but the reality is few of us have the time to attend. In an effort to keep all members apprised of on-going Society events, this column will present a synopsis of the meeting and decisions made on your behalf. If you have any concerns, you can contact any member of the Executive. Contact information is found on page 4.
This Executive meeting started with our usual month-end budget review. We are forecasting a $28,000 deficit for the 2007/2008 fiscal year. The deficit is less than 1% of total revenues. Our cash position is strong at $300,000.
Past President Bruce McIntyre, Chairman of the CSPG Trust, reviewed with the Executive a proposal to create a new named CSPG award in recognition of a substantial donation to the Trust. The Executive’s preference is to name existing awards as recognition for substantial donations to the Trust and to ensure that any new awards are aligned to the Society’s strategic plan.
Vice President Graeme Bloy, as part of our strategic planning process, reviewed a draft mission statement with the Executive. The Executive provided comments that will be incorporated into the final mission statement.
President Lisa Griffith distributed the “Past Presidents’ Panel Report on Alternative Choices for Management of the CSPG Office.” Past Presidents Ian McIlreath, Craig Lamb, and Terry McCoy looked at the advantages and disadvantages of an Office Business Manager versus an Executive Director. A large number of individuals and organizations were consulted as to their experiences with each type of position. The Panel concluded that the choice of one or the other depends on the strategic direction of the Society but leans towards an Executive Director. The Panel continues to describe the attributes of an Executive Director.
Services Director Jennifer Vezina provided an update on the reconstruction of the Awards Committee. More positions will be created to spread the workload. The website will soon carry proper descriptions of awards and award winners. Jennifer is working on a Distinguished Educator Award and Vice President Graeme Bloy is working on an
Outreach Award. The Special President’s Award will be presented at the December 9th Technical Luncheon. Past President Ian McIlreath will present his report on Awards at the October 2nd Executive Meeting.
President Griffith updated us on discussions with the AAPG about available office space. She will examine all options and present a plan on October 2nd.
A discussion on safety was deferred. As well the 2008 Convention Report was deferred to October 23rd.
Past President Colin yeo reported that the Canadian Potential Gas Committee has elected to dissolve itself. They have asked the CSPG to accept their funds and hold it within the CSPG as a restricted budget category. At the end of 2011, the CSPG is asked to determine if the Committee should be reconstituted, and if it is, the funds be provided for startup costs. An agreement will be written to document the intent and terms of this monetary transfer.
OCT.
2ND, 2008, E XECUTIVE
MEETING
This meeting was extraordinary in that it was held to clear up a backlog of business that has been accumulating over the summer.
Dr. Ian McIlreath was a guest speaker, presenting his excellent analysis of the CSPG’s awards and award processes. Ian challenged the Executive to set high standards in selecting recipients and presenting awards. He provided a background to his detailed, analytic work and linked awards to the Society’s strategic plan. Ian reviewed the history of the awards and how the intent has been changed over time and examined what the Society is doing well and where it could improve. He looked at our current awards hierarchy and compared it to his recommended revision. Finally, he detailed the awards process and made suggestions for improvements. All of this was assembled into a series of recommendations. Now the Executive must review his extensive work and begin to implement his recommendations.
The Executive discussed support for the upcoming Continuing Education Week. We reviewed a proposal from an event planning company but the support from the company was deemed by the Committee to be more than was needed. We will contact the Con Ed Committee to determine what level of support is needed and who is best to provide it.
President Griffith reviewed her discussions with AAPG Executive Director Rick Fritz about the AAPG’s plan to open a Canadian office in Calgary. The AAPG wants to provide service to its members here and will sell publications and promote field trips and short courses. It also plans to seek donations to the AAPG Foundation. The AAPG Foundation will be directly competing with the CSPG Trust. President Griffith is to provide a detailed presentation on this matter October 23rd and, if possible, the AAPG Executive Director will attend.
The status of the Gussow Conference was discussed at length and centered on attendance, costs, and sponsorship.
A report on APEGGA’s Geoscience Council was submitted. A national geoscience syllabus has been adopted through the Canadian Council of Professional Geoscientists which will ensure that educational requirements for licensure are met across the country. Geoscience nominees for the Summit Awards have been identified and nomination papers will be filed. It was confirmed that compliance rates among long-time members is only 65%. A concerted effort has been made to register wellsite geologists and companies, which has proven to be successful.
President Griffith provided more detail about the national syllabus as she attended the CCPG meeting and provided input into discussions. She noted that CCPG has signed an international agreement to coordinate professionalism among earth scientists.
The results of the September 20th Strategy Session were summarized and distributed to all. The mission statement of the Society has been redefined slightly to better reflect the purpose of the CSPG. Small groups will address outstanding issues from the session in the future.
The Past President’s Office Management Task Force report was tabled. The report compares the roles and responsibilities between a Business Manager and an Executive Director and looks at several earth science and engineering technical societies for comparison. The Executive will be engaging in a pro/con analysis sometime in the future. A decision needs to be made aligned with our strategic plan.
I NTRODUCING THE 2009 CSPG E XECUTIVE COMMITTEE
| by Colin Yeo, 2008 Past President
A new CSPG Executive is poised to take office in January 2009. Our 2009 Executive will be a balance of experience and new ideas. The 2008 Vice President and Assistant Directors will become the President and Directors, making way for a new Vice President and Assistant Directors. This apprenticeship period for new Executive members prepares them for a seamless transition to 2010 when they will be actively directing the Society on behalf of the CSPG membership.
First, let me introduce the new Executive. Dr. John Varsek will be the Vice President. John most recently served the CSPG as CoChair of the very successful 2007 Let it Flow Convention. John demonstrated that he is an excellent manager and strategist as he planned and executed the convention through delegation and empowerment. He will bring a combination of technical excellence, high expectations, and considerable problem-solving skills to the job.
President – GRAEME BLOY
Greg Lynch, currently our Outreach Director, was requested by the new Executive to return as Assistant Finance Director. Greg has done a great job overseeing all of our Outreach programs including SIFT, Honourary Address, K – 12 Education, University Awards, and University Outreach. In addition, Greg was a director on the board of the CSPG Trust. Greg’s experience will serve the Executive well.
Scott Leroux is the new Assistant Programs Director. Scott served for many years as the Chair of the Sedimentology Division and most recently as the Technical Co-Chair of the 2008 Back to Exploration Convention. Scott’s experience with technical programs will ensure that the primary focus of the CSPG is maintained.
Penny Colton joins the Executive as the Assistant Services Director. Penny is well known as our Society Photographer, working with Vic Panei, to cover many events. Penny has executive
experience with the CSEG as Director of Member Services and we welcome the new ideas she will bring from our sister society.
The Society welcomes and thanks the new Directors.
Returning to the CSPG Executive in 2009 is Graeme Bloy as President, Lisa Griffith as Past President, David Garner as Finance Director, Randy Rice as Programs Director, Ayaz Gulamhussein as Services Director, Mike DesRoches as Outreach Director and Peggy Hodgkins as Communications Director. The CSPG thanks them for their continuing service.
Below are photos and short biographies of our new Executive. Over the next year, you will hear from them on the pages of the Reservoir as they share their visions for the Society and the strategies they will pursue to provide service to members. They always appreciate comments from the membership.
education : B.Sc. Honours Geology, University of Alberta (1975); M.Sc. Geology, University of Alberta (1979).
e xPerience: Exploration Geologist, HBOG (1977); Senior Geologist, Thomson Jensen Petroleum Ltd. (1982-1987); President, Quarter Point Resources; Senior Staff Geologist, Husky Oil (1988-1993); Senior Geologist, Chauvco (1993-1995); Senior Geologist, Startech Energy Ltd. (1995-1998); Senior Geological Advisor, Ulster Petroleum (1998-2000); Exploration Manager, Geotechnical Services, Anderson Exploration and Devon Canada (2000-2002); Exploration Manager, Peace River Arch and Unconventional Resources, Devon Canada (2002-2007); VP Exploration, West Energy Ltd. (2007).
ProFessional memBershiPs: CSPG, AAPG, APEGGA, CWLS, SEPM.
PuBlications: Co-led a variety of CSPG field seminars to Grassi Lakes, Chester Lake, Sawtooth Range, Montana. Co-authored a variety of core workshop presentations, poster, and oral presentations at CSPG conventions on reservoir attributes, stratigraphy, and exploration models. Co-organized several short courses on carbonate reservoirs and porosity development.
aWards: CSPG Volunteer Award (2004).
Vice-President – JOHN VARSEK
education : B.Sc. Geophysics, University of British Columbia (1979); M.Sc. Geophysics (Seismology), University of Calgary (1984); Ph.D. Geology and Geophysics (Tectonics), University of Calgary (1992).
e xPerience: Geophysicist, Canada Cities Service (1979-1982); Geophysicist, Petrel Consultants (1984-1986); Geologist / Geophysicist, Petrel Robertson (1990-1993); Geologist / Geophysicist, Amoco Canada Petroleum Co. Ltd. (1993-1999); Exploration Geoscientist, BP Canada Ltd. (1999-2000); Exploration Advisor, Alberta Energy Co. (2001-2002); Group Lead, EnCana Corporation (2002-2008); Manager, Strategic Planning, Cenovus Corporation (2008-Present).
ProFessional
memBershiPs: CSPG, AAPG, APEGGA, CHOA, CSEG, SEG.
csPg actiVities: Structural Division Chair and Member (1993-1996), Medal of Merit Committee (1997-1998), GeoCanada 2000 Convention (1998-2000), Bulletin of Canadian Petroleum Geology Associate Editor (1999-2002), Convention Committee Member (2001), Emerging Petroleum Resource Division Co-Founder (2002), Joint Annual Convention Co-Chair (2007).
PuBlications: Published, as a lead or co-author, nearly 30 papers on a variety of geophysical and geological topics and presented numerous papers at CSPG and CSEG conventions since 1985.
aWards: CSPG Service Award (1996), CSPG Tracks Award (2001), CSPG President’s Award (2001).
education : B.A., Rice University, Houston (1977); M.Sc. Geology, University of Calgary (1981).
e xPerience: Geologist, Esso Resources Canada (1980-1985); Geologist, Lead Development Geologist, Regional Clastics Specialist, Amerada Hess Canada (1985-1992); Consulting Geologist, W.R. May and Assoc. (1992-1993); Sr. Geologist, Staff Geologist, Senior Clastics Specialist, PanCanadian/Encana (1993-2002); Chief Geologist, GEDCO (2003-2004); President, Griffith Geoconsulting Inc. (2004-Present).
ProFessional memBershiPs: CSPG, AAPG, APEGGA, SEPM.
csPg actiVities: Thesis Committee (1980s, 1990s), Student-Industry Field Trip, Clastic Core Exercises (1990s), Assistant Finance Director and Finance Director (2002-2004), Visiting Lecturer (2003, 2004), Guest co-Editor Bulletin of Canadian Petroleum Geology (2002), Technical Session Co-Chair (2000, 2005), Convention Awards Committee (2005).
aWards: CSPG-CWLS Best Oral Presentation (1995), CSPG Link Award (1996), SEPM Best Oral Presentation (1997, co-author), CSPG-CSEG Best Integrated Core Presentation (2003).
Finance director – DAVID GARNER
education : B.Sc. (cum laude) Geophysics, Washington and Lee University (1980); M.Sc. Geophysics, Cornell University (1983); Geostatistics Citation, University of Alberta (2006).
e xPerience: Geophysicist, Chevron Petroleum Technology Company in the US and Canada (1982-1995); President, TerraMod Consulting (1996-2002); Reservoir Characterization Specialist, Surmont Oilsands, ConocoPhillips Canada Ltd. (2002-2006); Senior Advisor, Geological Modeling, Ells River Oilsands, Chevron Canada Resources Ltd. (2006-Present).
PuBlications: Numerous oral presentations, posters, and papers for the CSPG, AAPG, CHOA, CSEG, MEG, and SPE. Topics include studies using applied geostatistics, earth modeling, and mapping for resource assessment and development.
assistant Finance director – GREG LYNCH
education : B.Sc. Geology, University of Ottawa (1983); M.Sc. Geology, Washington State University (1985); Ph.D. Geology, University of Alberta (1989).
e xPerience: Research Scientist, Geological Survey of Canada (1989-1998); Exploration Geologist, Shell Canada Limited (1998-Present) .
ProFessional memBershiPs: CSPG, APEGGA.
csPg actiVities: Student Industry Field Trip (SIFT) co-leader (1999-2005); Associate Editor, Bulletin of Canadian Petroleum Geology (2001-03, 2005-07).
PuBlications: Papers on Cordilleran and Appalachian geology; conference presentations on oil and gas geology.
aWards : CSPG Volunteer Appreciation Award; GSC Service Award.
Program director – RANDY RICE
education : B.Sc. Geology, Mount Allison University (1974); M.Sc. Geology (Glacial Sedimentology), University of Alberta (1979); Ph.D. Geology (Fluvial Sedimentology), McMaster University (1987).
e xPerience: Stratigraphy and Grade Control, Mildred Lake Mine, Syncrude Canada Ltd. (1978-1979); Operations and Technical Group, Amoco Canada Petroleum Company Ltd. (1979-1981); Project Geologist, Precambrian Sedimentology, Ontario Geological Survey (1986-1989); Post-Doctoral Fellow/Adjunct Professor, Carleton University, Ottawa (1989-1993); Assistant Professor, American University of Beirut, Lebanon (1993); Regional Geologic Mapping, Capital Resources Ltd./ St. Francis xavier University (1994-1995); Carlin-type gold exploration, Campbell Resources Ltd. (1996-2000); Project Lead, MVT Pb-Zn, Alberta Geological Survey (2001-2003); Team Lead, Regional Geological Study, Alberta Energy and Utilities Board (2003); Oil Sands Section, Geology and Reserves Group, Alberta Energy and Utilities Board (2005-2006); Firebag In-Situ Group, Suncor Energy Inc. (2006-Present).
PuBlications: Presented on seismic attributes at several CSEG conferences; co-authored 1987 SEG convention paper on VSP elastic amplitude partitioning; published article on seismic resolution 1996 issue of the Recorder.
communications director – PEGGY HODGKINS
education : B.Sc. Forestry and Geology, The University of the South, magna cum laude (1988); M.Sc. Geology, The University of North Carolina at Chapel Hill (1990).
e xPerience: Exploration/Development Geologist and Petrophysicist, Amoco Petroleum Co. (1991-2000); Structural Geology/Petrophysics, BP Canada Petroleum Co. (2000-2002); Petrophysics and Rock Properties, BP America, Inc. (2002-2003); Development Geologist, Encana Corporation (2003-2006); Petrophysics and Rock Properties, Hampson-Russell (CGGVeritas) (2006-present).
ProFessional memBershiPs: CSPG, AAPG, SEG.
PuBlications: Application of NMR Logging to Reservoir Characterization of Low-Resistivity Sands in the Gulf of Mexico, AAPG Bulletin; Salt sill deformation and its implications for subsalt exploration, The Leading Edge; The use of fluid inclusions to constrain fault zone pressure, temperature, and kinematic history: an example from the Alpi Apuane, Italy, Journal of Structural Geology.
outreach director – MIKE DESROCHES
education : Hons. B.Sc. Geology, University of Waterloo (1982)
e xPerience: Exploration/Development Geologist, Gulf Canada Resources Ltd. (1982-1996); Geologist, Canadian Natural Resources Ltd. (1996-2006); Geologist, Crew Energy Inc. (2006-2007, 6 months); Contract Geologist, ProsPex Resources Ltd. (July 2007-2008). Team Leader, Talisman Energy (2008-Present).
aWards : CSPG Volunteer Award, CSPG Service Award, CSPG Tracks Award (2006).
Calgary Jan 22 & 23 Houston Jan 27
Dallas Jan 28 Oklahoma Jan 29
Denver Jan 30
For more informa�on or to register, please contact Zeev Berger Jim Genereux zeev@iitech.ca jgenereux@aeroquest.ca
2009 GEOLOGICAL C ALENDAR
| by Dave Hills, 2009 Geological Calendar Chair
Well, it’s been a busy few months since we put the call out to the photographers among you to go out and shoot some rocks for the 2009 CSPG Geological Calendar. The response has been fantastic with over 200 entries covering a variety of geological topics from across Canada and around the globe. Among the 13 chosen photos, we have Cretaceous basalt sills of Ellesmere Island, erupting natro-carbonatite lavas from Tanzania, and weathered sandstones of Dinosaur Provincial Park.
This year, of the 13 finalists chosen by our esteemed panel of judges, two were selected to receive the coveted prizes of Best Canadian Photo and CSPG Photo of the year. As it will be some time before the Calendar Committee is given a budget large enough to hold an award ceremony, we will use this space to announce the winners, and they are (mental drum-roll, everyone please)…
The winner of the 2009 Best Canadian Photo is Glen Stockmal for his photo of the Cambrian Gog Formation overlain by Middle Cambrian platform carbonates in Lake O’Hara, British Columbia.
The winner of the 2009 CSPG Photo of the year is Rhea Karvonen for her photo of the Erg Chebbi dune field, near Merzouga, Morocco.
Congratulations to Glen and Rhea; they will each be receiving a cash prize of $200. Our congratulations also go out to all the successful entrants. In addition to being shown in their full splendor in the 2009 calendar (which was mailed out with the November Reservoir), all of the images will be available for download as wallpapers from the CSPG website (www.cspg.org). Oh what value for your membership fees!
Finally, we would like to thank everyone who sent their prized photos to us. It is only through your participation that we can hope to capture such a diverse range of topics and geographic locations and make the best calendar possible. We hope you enjoy the wonderful images in the 2009 calendar, and please keep those photos coming!
Photo by Glen Stockmal.
Photo by Rhea Karvonen.
Reinson Consultants Ltd.
T ECHNICAL LUNCHEON Committee Update
The CSPG Technical Luncheon Committee is made of four volunteers: Chris Seibel, Riona Freeman, Ryan Mohr, and Tim Bergen. The mandate of the committee is to schedule speakers on topics that are current, interesting, relevant, and related to geology and / or the petroleum industry. The CSPG Technical Luncheon Program, with the more than capable staff at the CSPG office, organizes 19 presentations per year, bi-monthly except in December when there is only one talk. No talks are held during July and August. The average attendance of the luncheons in 2008 is 725.
Over the past year, the membership had the opportunity to hear speakers from across Canada and around the world on a variety of themes. Former CSPG president, Alice Payne, started the year with a presentation about her father, Thomas Payne, and his adventures exploring for gold during the early 1900s in yellowknife, Northwest Territories. Benoit Beauchamp, University of Calgary, spoke in March about the petroleum geology of the Canadian Arctic.
Jonthan Bujak came from London, England in May to speak about climate change and Arctic petroleum source rocks. In June, Stephen Bend from the University of Regina presented his new Petroleum Geology e-textbook, commissioned by the AAPG. Rob Huebert, from the Centre for Military and Strategic Studies, spoke eloquently on the complex issue of Canadian sovereignty and security, relating it to the development of Arctic energy resources. John Wagner from Nexen Inc.’s US operations presented an example of an Upper Miocene to Lower Pliocene evolving channel/levee system from the Gulf of Mexico. In addition, the CSPG welcomed four AAPG Distinguished Lecturers and continue to benefit from this excellent program. The 2007 winners of the annual M.Sc. and Ph.D. thesis awards, Jessica Krawetz and Alex MacNeil, presented their research in 2008.
All these, as well as previous archived luncheon talks, are available for viewing via the CSPG webcasts, which are posted on the CSPG website.
The luncheon schedule for 2009 is filling up quickly. The upcoming year will include AAPG Distinguished Lectures speaking on topics such as climate change, reservoir modeling, and carbonate platforms. Ryan
Mohr of the luncheon committee is working hard to bring the geologists who contributed to the popular CBC series Geologic Journey. So far, four of the six geologists have accepted.
The Technical Luncheon committee continues to work hard to find and bring in relevant and interesting speakers.
However, we also welcome comments and suggestions from the membership. Please do not hesitate to contact us. Hope to see you next luncheon!
Chris Seibel (Nexen), chris_seibel@nexeninc.com
Riona Freeman, rionafreeman@shaw.ca
Tim Bergen (Nexen),tim_bergen@nexeninc.com
Ryan Mohr (Nexen), ryan_mohr@nexeninc.com
Even though the Exhibit Floor will still take place on Monday and Tuesday, there are still exciting changes afoot –popular innovations from last year such as the complimentary lunches and the Field Equipment display in the Corral will return, while the Committee is also working on putting together a revamped and enlarged Icebreaker Reception and sponsored BBQ lunches on the Monday and Tuesday.
EXHIBIT OR PROPSECTUS
personality Stuart McLean will speak Monday and Tuesday will feature Sheila Watt-Cloutier, Nobel Peace Prize nominee – two great speakers sure to be a hot ticket in 2009.
Lastly, in a continuing effort to make onsite registration quicker and easier, this year for the first time delegates will have to have renewed their Society memberships by March 1, 2009 in order to qualify for member rates at the Convention, so keep an eye out for your renewal notice.
F RONTIERS AND THE 2009 CONVENTION
For the first time this year as well, exhibiting companies are able to view the Convention floor plan before submitting their booth application, and request specific spaces for their booth location. This new technology will also allow delegates to get a bird’s eye view of the Exhibit Floor prior to the Convention and see the changes in real time as Exhibitors
These are just a few of the exciting things your Convention Committee is working on for the coming year – please be sure to check www.GEOconvention.org for further news and updates as they become available. We look forward to seeing you
Planning for the 2009 C3Geo Convention is already well underway and the committee is working on many new initiatives to make this year bigger and better than ever.
First, and most importantly, the Convention week has been expanded from four days to five – this means that the Core Conference will now take place Thursday and Friday, with the Core Meltdown winding up the Convention on Friday afternoon. The Exhibit Floor will continue to be a two-day exhibition, which means that the Wednesday of Convention will be solely dedicated to Technical Program presentations at the Roundup Centre. This is especially exciting as the 2009 Core Conference may more accurately be described as a Core to Geophysics Conference, and it is being structured to appeal to all delegates equally. And remember one important change that will affect Technical Program participants – the abstract submission deadline for this year has been moved forward to December 15, 2008!
Another innovation being carried over from last year is the engagement of two luncheon speakers. CBC Radio Canada
It’s easy to switch to geoSCOUT. We’re prepared. We know that almost everyone who tries geoSCOUT™ wants to use geoSCOUT. So, why hasn’t everyone already switched to geoSCOUT? Probably because, in general, people don’t like change. But, in this case we’ve got you covered, so change is good – very, very good.
Just ask the thousands of landmen, engineers & geologists currently using geoSCOUT oil and gas mapping and analysis software to make solid decisions every day. Give us an hour for a demo – we know you’ll see the value. Call 403.262.1992 | Email info@geoscout.com | Online www.geoscout.com/demo
Another powerful suite of tools from geoLOGIC industry-leading customer service easy & efficient migration of existing data helping clients increase productivity
Seeing is believing!
Are you faced with difficult interpretation challenges?
� Would you give this zone a second look?
The Triple-combo logs (left side) show no clear indication this zone contains hydrocarbons.
� What if you could “see” the fluids contained in this zone to identify fluid type and quantity?
Now you can! The 2D NMR images from the MR ExplorerSM (MREXSM) service in tracks 4 & 5 identify gas condensate in this zone.
� Does it contain commercial quantities of hydrocarbon?
The fluid volumetrics measured by the MREX service (in track 6) indicate commercial quantities of hydrocarbon are present in this interval. This was confirmed by formation tests using the Baker Atlas Reservoir Characterization InstrumentSM (RCISM) service.
Image the fluids and know for sure.
The MREX service from Baker Atlas makes direct measurements of fluid type and volume.
2D NMR imaging enables you to “see” the fluids to ensure all potential hydrocarbon zones are identified for maximum recovery on every well.
For direct measurements of reservoir fluid type and volume, contact Baker Atlas today.