25 Reservoir Engineering for Geologists Geological Storage of C02
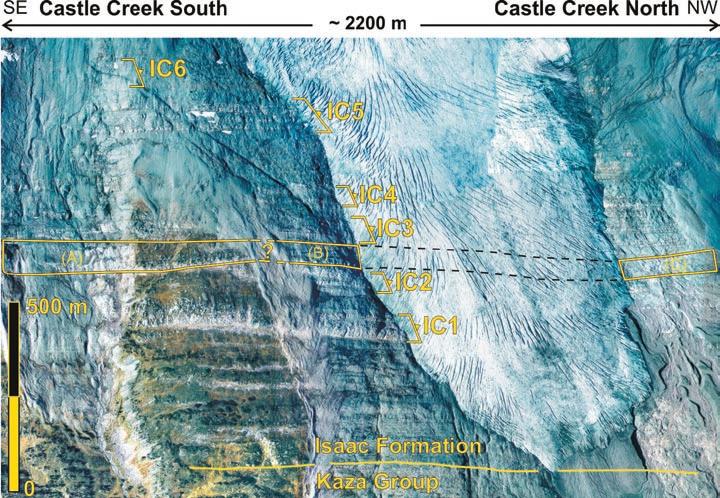
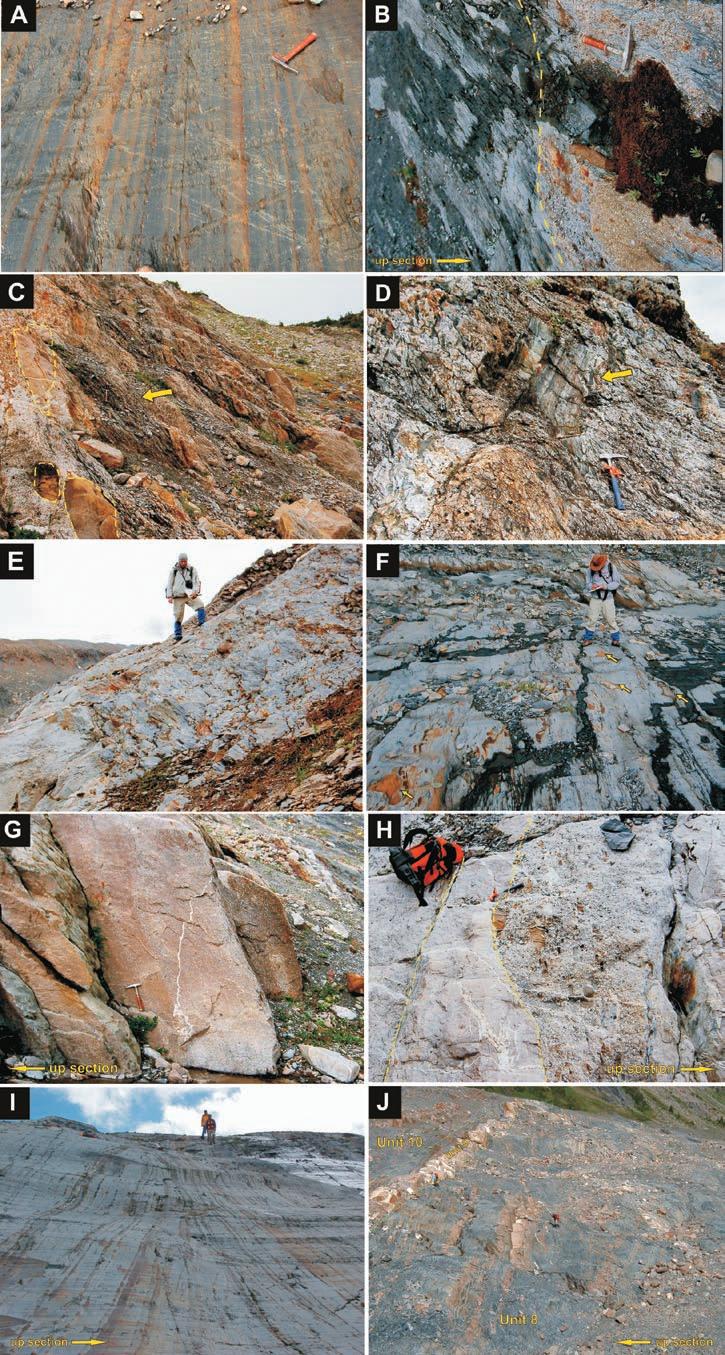
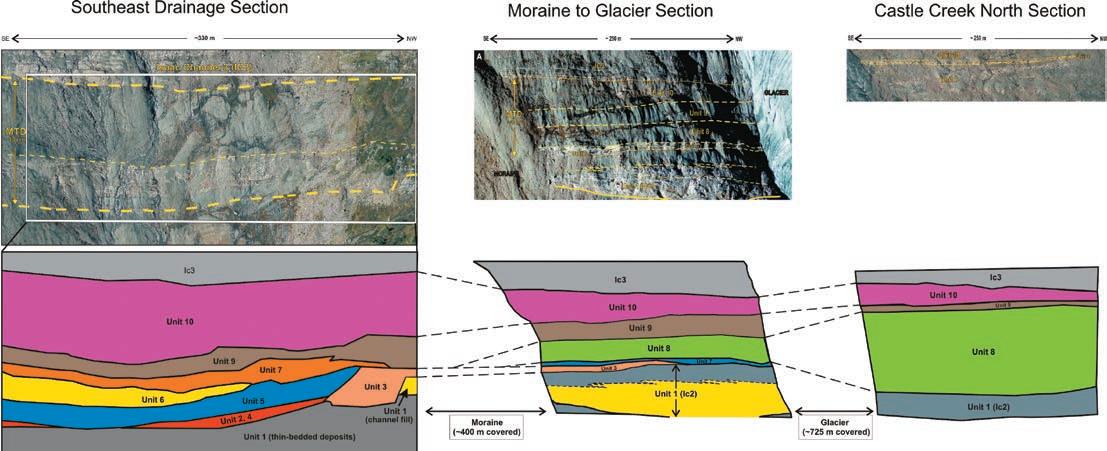
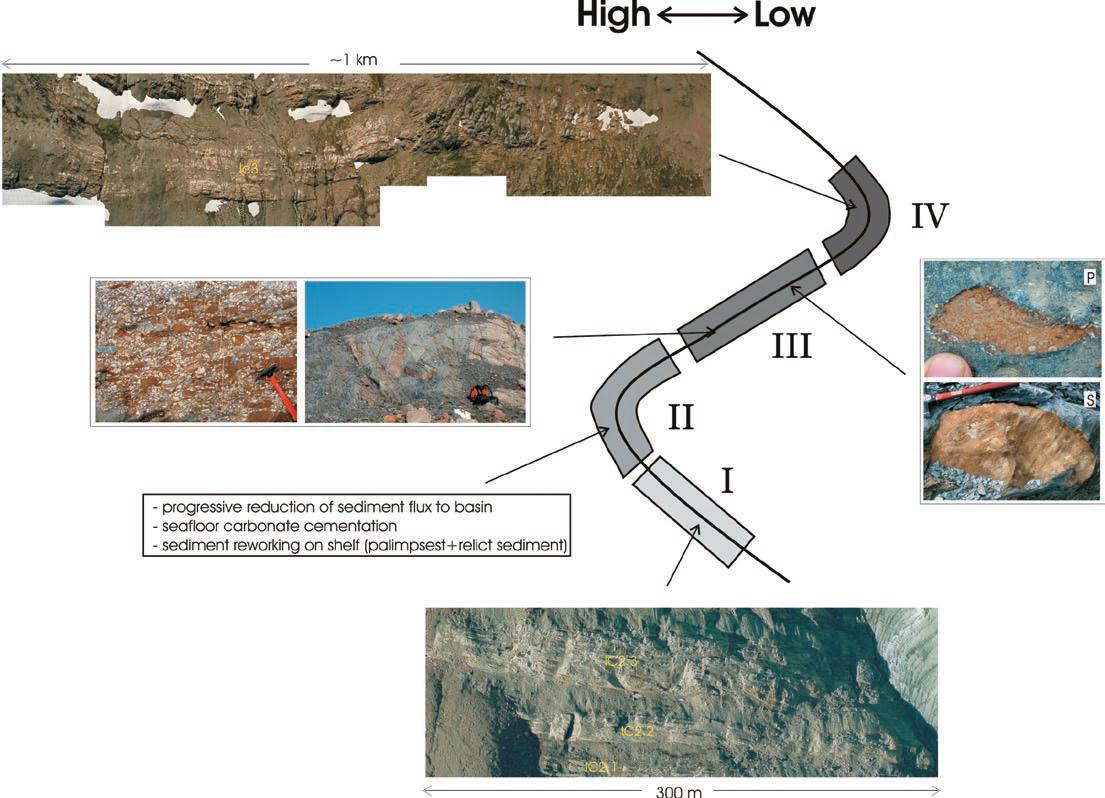
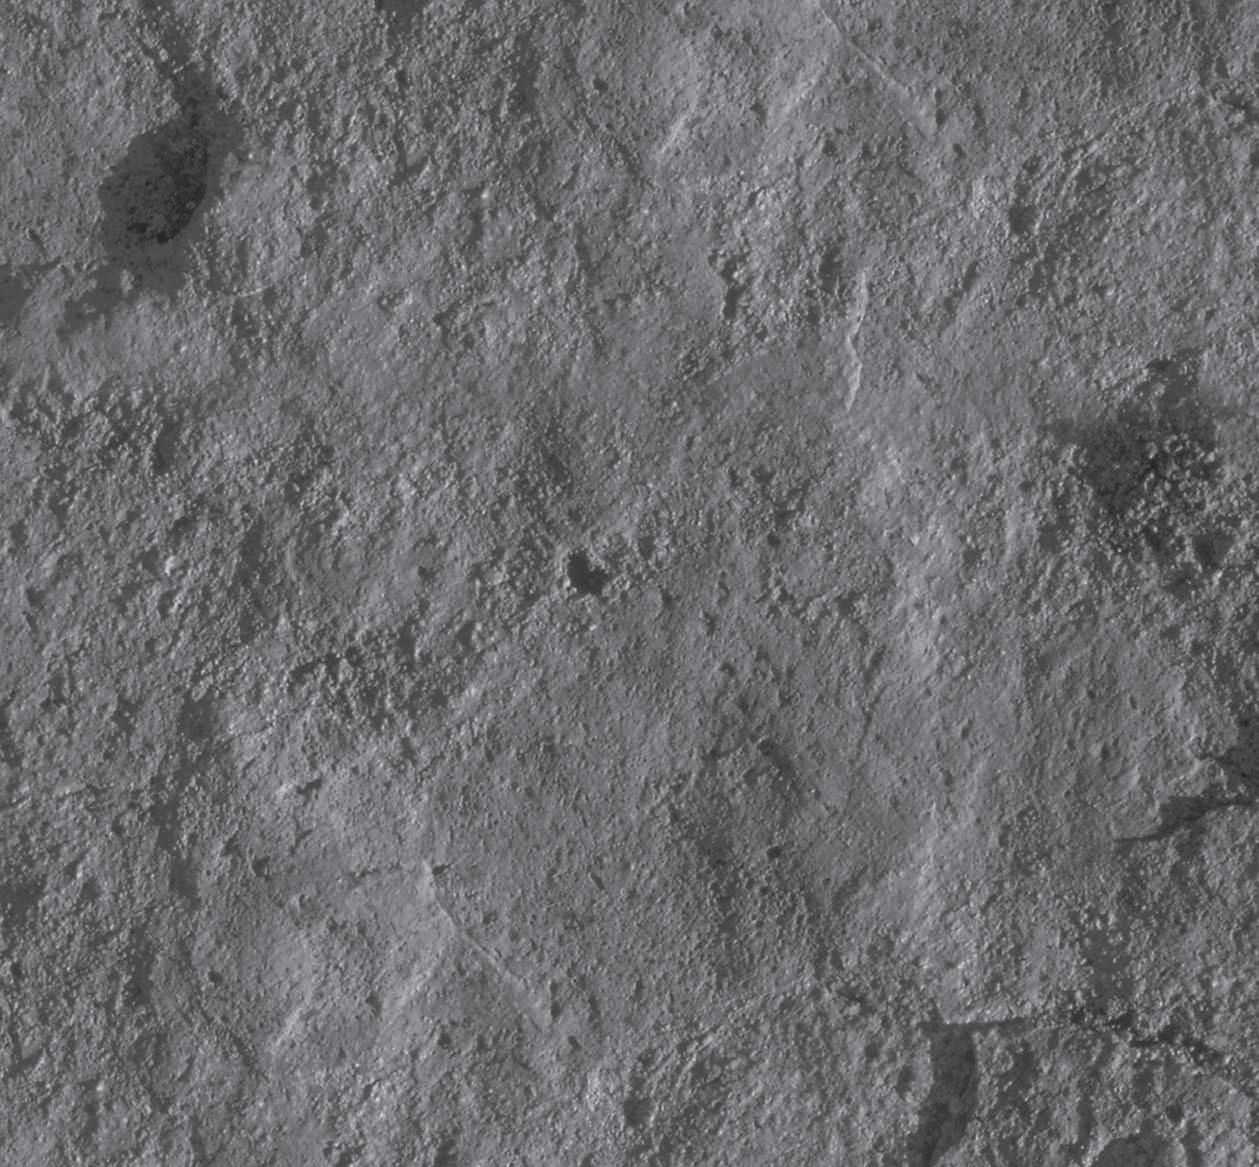
30 Architecture and Evolution of a Mass Transport Deposit (MTD), Neoproterozoic Isaac Formation, Windermere Supergroup
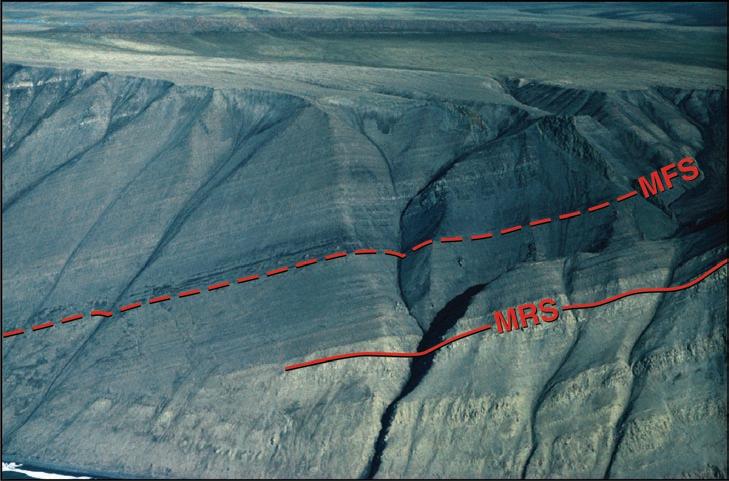
36 Practical Sequence Stratigraphy VI. The Material-based Surfaces of Sequence Stratigraphy, Part 3
42 The Contribution of Integrated HRAM Studies to Exploration and Exploitation of Unconventional Plays in North America, Part 1
Superior data to boost your bottom line
“As a pioneer AccuMap® client in 1989, our feedback helped produce what’s now a fast, efficient tool. Just like our industry, AccuMap keeps evolving on a convenient platform, that consistently delivers. Take away our AccuMap and everything would grind to a halt.”
Warren J. Doenz, P. Geol. Vice President, Exploration Action Energy Inc.
Warren’s right. AccuMap software is the industry-leading SOURCE for E&P data. Continually improving, AccuMap is a tool built for the industry with industry input. Translation? Flexible modules. Superior data. Easy to use. Stable platform. Visit us at ihs.com/connect and discover how AccuMap can boost your bottom line.
Please submit RESERVOIR articles to the CSPG office. Submission deadline is the 23rd day of the month, two months prior to issue date. (e.g., January 23 for the March issue).
To publish an article, the CSPG requires digital copies of the document. Text should be in Microsoft Word format and illustrations should be in TIFF format at 300 dpi., at final size. For additional information on manuscript preparation, refer to the Guidelines for Authors published in the CSPG Bulletin or contact the editor.
Technical Editors
Ben McKenzie Colin Yeo (Assistant Tech. Editor) Tarheel Exploration EnCana Corporation Tel: 403-277-4496 Tel: 403-645-7724
Comunications and Public Affairs, CSPG Tel: 403-513-1227, Email: heather.tyminski@cspg.org
ADVERTISING
Advertising inquiries should be directed to Kim MacLean, Tel. 403513-1229, email: kim.maclean@cspg.org or Alyssa Middleton, Tel: 403-513-1233, email: alyssa.middleton@cspg.org. The deadline to reserve advertising space is the 23rd day of the month, two months prior to issue date.
The RESERVOIR is published 11 times per year by the Canadian Society of Petroleum Geologists. This includes a combined issue for the months of July and August. The purpose of the RESERVOIR is to publicize the Society’s many activities and to promote the geosciences. We look for both technical and non-technical material to publish. The RESERVOIR is not intended to be a formal, peer-reviewed publication. Additional information on the RESERVOIR’s guidelines can be found in the May 2008 issue (p.46-48; available at http://www.cspg.org/publications/reservoir/reservoir-archive-2008.cfm). No official endorsement or sponsorship by the CSPG is implied for any advertisement, insert, or article that appears in the Reservoir unless otherwise noted. The contents of this publication may not be reproduced either in part or in full without the consent of the publisher.
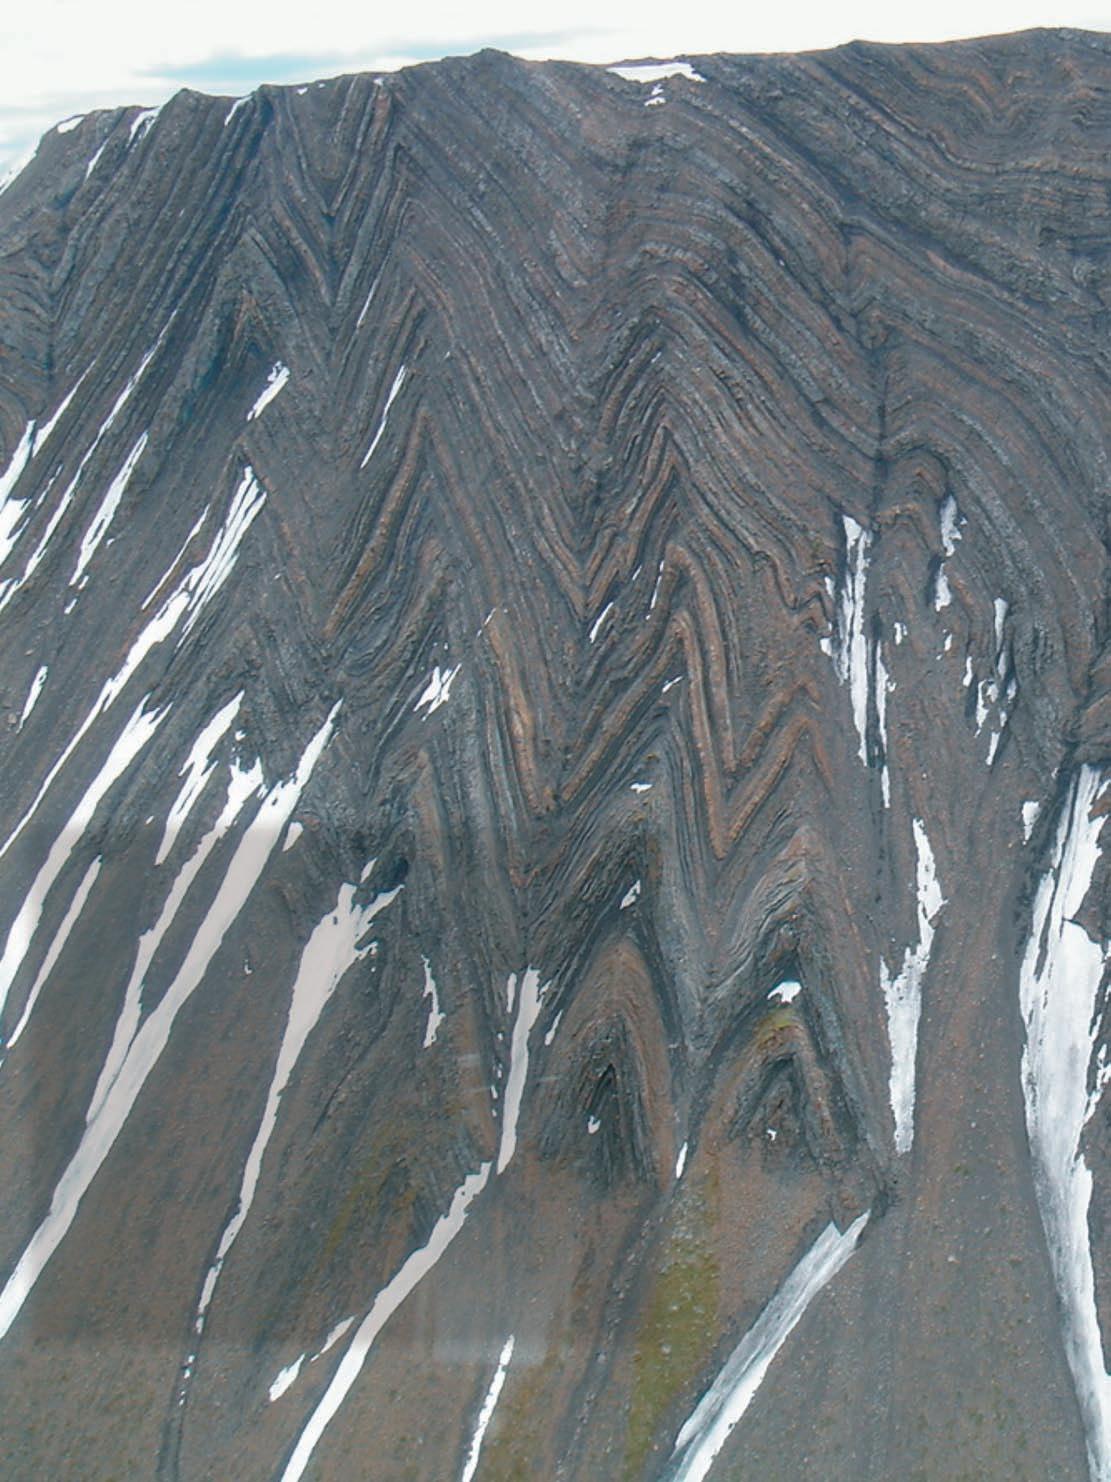
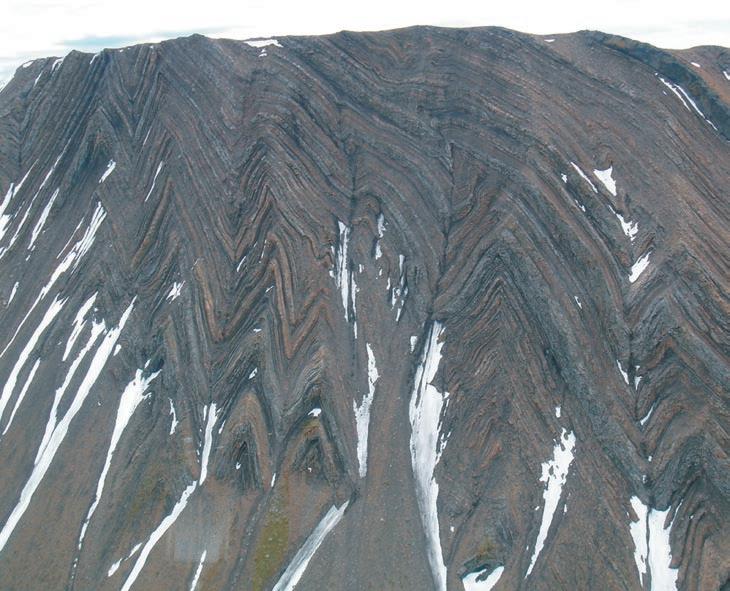
FRONT COVER Grande Cache, Alberta. Chevron folds in upper Cretaceous strata. Photo by Marcus Ebner.
CSPG EXECUTIVE
President
Lisa Griffith • Griffith Geoconsulting Inc. lgriffith@griffithgeoconsulting.com Tel: (403) 669-7494
Vice President
Graeme Bloy • West Energy Ltd. gbloy@westenergy.ca Tel: (403) 716-3468
Past President
Colin Yeo • EnCana Corporation colin.yeo@encana.com Tel: (403) 645-7724
Finance director
James Donnelly • ConocoPhillips Canada james.donnelly@conocophillips.com Tel: (403) 260-8000
assistant Finance director
David Garner • Chevron Canada Resources davidgarner@chevron.com Tel: (403) 234-5875
Program director
Randy Rice • Suncor Energy Inc. rjrice@suncor.com Tel: (403) 205-6723
serVice director
Jen Vèzina • Devon Canada Corporation jen.vezina@devoncanada.com Tel: (403) 232-5079
assistant serVice director
Ayaz Gulamhussein • NuVista Energy Ltd. Ayaz.gulamhussein@nuvistaenergy.com Tel: (403) 538-8510
My term of office on the CSPG Executive is rapidly coming to an end. The 2009 Executive has been elected and will assume office in January 2009. They have been carefully recruited and exhibit attributes of vision, dedication, experience, and a passion for excellence. I wish them well and have every confidence that they will achieve great things. As I leave, I wish to pass on to them advice and counsel based on my experiences and lessons learned serving this Society for the past three years.
First and foremost, know that the CSPG is a Society that is fundamentally strong and performing well. Seven hundred people pack the Telus Convention Centre every two weeks to listen to speakers address a range of diverse topics designed to inform, educate, and entertain our members. The annual convention has a jammedpacked roster of presentations and poster displays; and the core conference is always a phenomenal success. The Reservoir is expanding into a topical magazine anchored by excellent technical series written by industry experts. Our Bulletin provides a solid foundation for our Society. Technical Divisions, Continuing Education, and Gussow Conferences are thriving. Know that we are strong and vibrant.
Keep in mind that this strength is the product of a huge number of volunteers. They are giving up their time and talent in the service of their fellow members, when they could more easily pay their dues and be mere spectators. Many of our volunteers are burdened by fulltime jobs in companies that expect more with less, and are at the point where they cannot handle any more. I am very worried about volunteer burnout. The Directors and the Volunteer Management Committee must be vigilant in monitoring the health of our Committees and make sure they are getting the assistance they
need. Acknowledge and thank them every chance you get.
Remember what our purpose is – and what it is not. Refer often to our mission statement and beware of scope creep. The great pride we feel for the Society can easily translate into grandiose schemes of hubris, and lead the Society away from its primary purpose of developing our members professionally by actively disseminating knowledge of Canadian petroleum geology. Focus on these goals and deliver the programs and services that our members expect. Do not be distracted by new initiatives that do not meet the test of congruency with our mission statement. There are many things that would be nice to do and may make us more prominent, but remember that we are a society founded on serving our members first. If you are to start a new initiative, determine: who is going to lead it, who will volunteer to support it, and if it will be financially viable. Remember, you cannot be all things to all people. Choose wisely.
Be visionaries. Plan well. Think strategically. Set goals. Measure performance. Never shy away from competitive benchmarking. Always ask yourselves if members are getting value for their money or would they be better served by another technical society.
Remember, we are part of a bigger professional community. We have made great inroads with APEGGA and our sister societies, the CSEG and CWLS, and we should make every effort to embrace the CIM. We live and operate in an environment where the integrated team is far more effective than the sum of individual disciplines. And we must not forget the organization from whence we are derived – the AAPG. The AAPG is our link to (Continued on page 7...)
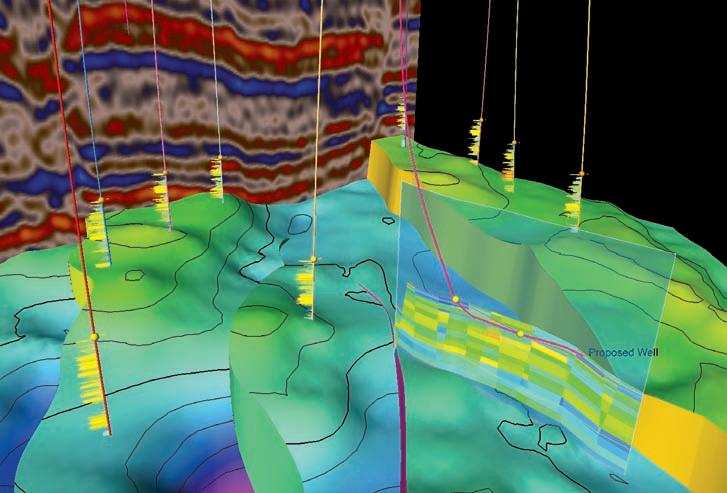
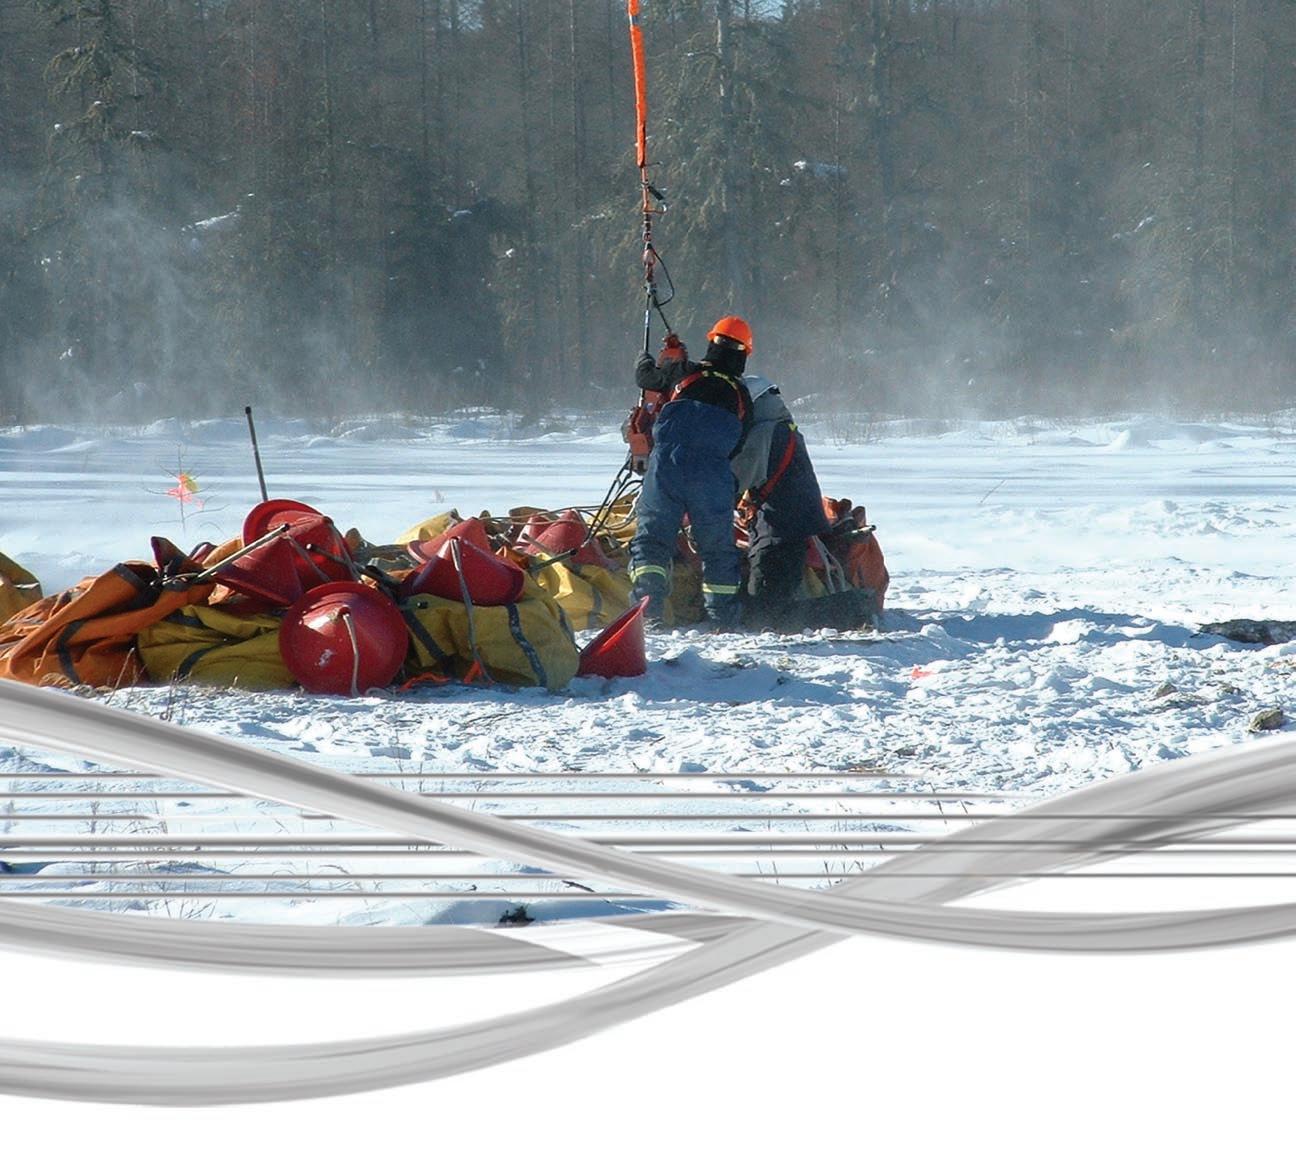
Discover the New Fugro Gravity & Magnetic Services.
Now, the full spectrum of potential field products and services is available from a single source: Fugro Gravity & Magnetic Services. Fugro Gravity & Magnetic Services has more than 50 years of land, marine and airborne oil and gas exploration experience, providing geologic solutions, enhancing seismic data and improving drilling efficiency. And, all delivered by 600 professionals around the world. For cost-effective exploration risk reduction, depend on Fugro Gravity & Magnetic Services, a whole new center of gravity and magnetic services.
CORPORATE MEMBERS
ABU DHABI OIL CO., LTD. (JAPAN)
APACHE CANADA LTD.
BAKER ATLAS
BG CANADA ExPLORATION & PRODUCTION, INC
BP CANADA ENERGy COMPANy
CANADIAN FOREST OIL LTD
CANETIC RESOURCES TRUST
CONOCOPHILLIPS CANADA
CORE LABORATORIES CANADA LTD
DEVON CANADA CORPORATION
DOMINION ExPLORATION CANADA LTD
DUVERNAy OIL CORP.
ENERPLUS RESOURCES FUND
FUGRO AIRBORNE SURVEyS
geoLOGIC systems ltd.
GRIZZLy RESOURCES LTD
HUNT OIL COMPANy OF CANADA, INC.
HUSKy ENERGy INC.
IHS
IMPERIAL OIL RESOURCES LIMITED
LARIO OIL & GAS COMPANy
LITTLE ROCK DOCUMENT SERVICES LTD
MJ SySTEMS
MURPHy OIL COMPANy LTD
NExEN INC.
PENN WEST PETROLEUM LTD
PETRO-CANADA OIL AND GAS
PETROCRAFT PRODUCTS LTD.
PROVIDENT ENERGy LTD
RPS ENERGy CANADA LTD.
SHELL CANADA LIMITED
SPROULE
SUNCOR ENERGy INC
TALISMAN ENERGy INC
TAQA NORTH LTD.
TECK COMINCO LIMITED
TOTAL E&P CANADA LIMITED
WEATHERFORD CANADA PARTNERSHIP
AS OF SEPTEMBER 29, 2008
(...Continued from page 5)
global geology and our scope is expertise in the Canadian subset. Share ideas and joint ventures with these organizations and learn from them. Our members are better off for these alliances.
Look after our younger members. We need to help them prepare for a volatile but exciting career by giving them the tools to succeed in an industry that expects them to hit the ground running. We need to train them to be leaders and to be recognized by their employers as key professionals to their operations. We need to offer them guidance around training and continuing education. We must make them aware of what will be needed for them to succeed in the future.
Cherish our sponsors and advertisers. Not only do we welcome and need their support, we are grateful for it. They provide the financial resources for us to provide member programs and they bring credibility to the Society by their association with us. Our sponsors believe so strongly in particular programs that they cover their entire costs. Our advertisers provide the capability for us to do our jobs and they want us to succeed. Our success is their success. Never take our sponsors and exhibitors for granted.
Learn from our successes and build on them. The Joint Annual Convention has been an outstanding success. Forming the autonomous Joint Annual Convention Committee with its own staff has exceeded all expectations for efficiency and effectiveness. Can we achieve the same success around publications and communications? We must never rest on our laurels. We must always look for opportunities to improve quality and reduce costs.
Finally, tap into the Society’s pool of unparalleled talent, experience, and insight – the Past Presidents. I began the practice of conscripting Past President Panels to investigate such things as Awards, Governance Options, and Membership. Dr. Ian McIlreath chaired two of these Panels and has given us a comprehensive action plan to correct deficiencies and improve performance. Use this resource wisely – don’t waste their time on minutiae.
I would like to extend my sincere gratitude to Dr. McIlreath who has been my mentor and advisor throughout my tenure. With his historical view of the Society (he was the Society’s youngest President in 1984),
he could provide perspective during a very tumultuous period. He provided counsel and advice even before I took office as Vice President. I thank him for his friendship and support.
On completion of my term on the CSPG Executive, I will be continuing to serve the Society as an Assistant Technical Editor on the Reservoir. During my time as President, I had advocated for the Reservoir to begin an expansion program based on a number of ongoing technical series designed to broaden our skills and competencies. Since new initiatives must come with volunteer support, I am going to practice what I preach. I look forward to serving you in the future.
Thank you to everyone who has given me input and feedback during my tenure – both compliments and criticisms. It has been a pleasure to have served you.
3-7, 2008
technical luncheons NOVEMBER LuNCHEON
New insight to controls on the nature of Devonian Reefs –contributions from the Upper Devonian Alexandra Reef System
SPEAKER
Alex MacNeil
Imperial Oil Resources
11:30 am tuesday, n ovember 4, 2008 telus c onvention c entre c algary, a lberta
Please note:
the cut-off date for ticket sales is 1:00 pm, thursday, october 30, 2008. csPg member ticket Price: $38.00 + gst. non- member ticket Price: $45.00 + gst
Due to the recent popularity of talks, we strongly suggest purchasing tickets early, as we cannot guarantee seats will be available on the cut-off date.
Devonian reefs and carbonate platforms of western Canada have been a focus of petroleum exploration and research for more than sixty years. One of the classic regions to visit for examining Devonian reef deposits is the southern part of the Northwest Territories. Near Hay River, well preserved limestones of the Alexandra Reef System (mid-Frasnian in age) are exposed at surface over a distance of approximately 46 kilometres.
First studied in the early 1960s, the Alexandra was recognized as containing stromatoporoid reef facies and a variety of fore-reef and back-reef to lagoon facies associations. The deposits are timeequivalent to the lower-mid Grosmont and Leduc formations, and represent a northern extension of the Grosmont carbonate system that developed on the western edge of the Laurussian Supercontinent.
Excavation of a large quarry and a number of roadcuts through the Alexandra Reef System, in the 1980s and 1990s, offered the opportunity for new insight to its facies and stratigraphy. Study of the new exposures, extensive coring, and field mapping in the summers of 2002 and 2003, as part of a Ph.D. thesis at the University of Alberta, has revealed that the Alexandra is more complex that previously realized. It consists of two stromatoporoid-dominated reef complexes that are separated by a sequence boundary and its correlative conformity.
The stratigraphic architecture of these complexes, which represent thin (10-20 m thick) but areally extensive carbonate units, has been delineated with high-resolution (4th-order) sequence stratigraphy.
The second reef complex developed basinwards of the first after a 15-20 m fall in sea-level that exposed the entire inner ramp region where the first reef complex had been located. The second reef complex, in its basinward location, subsequently developed through a lowstand-to-highstand
rise of sea-level, before being terminated by a second fall in sea-level.
Exceptional preservation of several facies associations in the Alexandra Reef System – from the oldest coastal plain carbonate marsh deposits known in the geological record, to open-marine ramp deposits with carbonate microfossils that were not previously known from the Devonian – and the high-resolution sequence stratigraphic framework, also provided the opportunity to study important attributes of Devonian carbonates that, in general, are poorly understood. These included possible intrinsic and extrinsic controls on facies distribution within the reef complexes.
One of the most striking aspects of the Alexandra Reef System are stromatoporoidmicrobial reef facies that are restricted in distribution to the lower part of the second reef complex. These facies include masses of Renalcis that engulf stromatoporoids and corals, and stromatolites that covered the tops of dead stromatoporoid plates. Similar facies are known from other Devonian reefs of western Canada, including some Leduc, Nisku, and Jean-Marie buildups, where their distribution can affect reservoir quality.
In the Alexandra Reef System, integration of sequence stratigraphy, platform geometry, paleogeography, paleobiology, and detailed sedimentology, with modern analogues, indicates that nutrient levels were probably the greatest control on whether or not Renalcis and other microbial carbonates accumulated. Groundwater seepage, runoff, storm events, and seasonally forced deepening of the water column may have contributed to nutrient flux. When nutrients were present, calcareous algal-microbial blooms flourished; when nutrients were limited, the reef facies returned to being dominated by stromatoporoids and corals.
This interpretation implies that Devonian reefs, which through microbial-carbonate production could thrive in nutrientenriched seawater, were quite different from modern coralgal reefs that do not thrive in nutrient-enriched seawater. This has significant implications for understanding (and predicting) facies distributions and overall platform evolution.
The evolution of the Alexandra Reef System, largely controlled by two high-frequency cycles of sea-level change, also lends insight to understanding overall basin evolution. Biostratigraphic zonation of the formation
indicates that its recorded sea-level history can be correlated to a fall in sea-level and subaerial platform exposure that is recorded in a number of carbonate buildups in Alberta. High-frequency sea-level falls of 10 to 20 metres do not characterize greenhouse climates, which are thought to have characterized most of the Devonian, but can be attributed to transitional phases between greenhouse and icehouse climates.
Thus, the apparent high-frequency shifts in sea-level in the mid-Frasnian, as recorded in the Alexandra and other locations in western Canada, seem to support arguments from the paleontology community that the global extinction events at the end of the Frasnian were related to global cooling. These, and other contributions from renewed study of the Alexandra Reef System, help to demonstrate that there are many important attributes of the Devonian that remain enigmatic and worthy of continued study.
BIOGRAPH y
Alex MacNeil received his B.Sc. Honours degree in Paleobiology/Geology from the University of Saskatchewan in 1998. He subsequently completed his M.Sc. (2001) and Ph.D. (2006) degrees in Geology at the University of Alberta under the supervision of Dr. Brian Jones.
His M.Sc. thesis focused on the sedimentology, diagenesis, and dolomitization of Pliocene carbonates in the Cayman Islands and his Ph.D. thesis focused on the stratigraphy, sedimentology, and paleontology of Devonian carbonates in the southern part of the Northwest Territories. Much of MacNeil’s graduate work was funded by the Natural Sciences and Engineering Research Council of Canada, the Province of Alberta, and graduate scholarships from the University of Alberta.
Most recently, he was awarded the 2007 best Ph.D. Thesis Award from the CSPG for his thesis, “Sedimentology of the Late Devonian (Frasnian) Alexandra Reef System, Northwest Territories, Canada – New Insight to Devonian Reefs.” Various topics of MacNeil’s research have been published in the Canadian Journal of Earth Science, Sedimentary Geology, Sedimentology, and the Journal of Sedimentary Research.
In addition to his graduate research, MacNeil also spent three summers (1999-2001) working on Ordovician-Devonian carbonates in the Arctic Islands for the mining industry. He has co-led five field trips to the Northwest Territories for the petroleum industry, including two field trips for the CSPG. He is currently employed in Calgary at Imperial Oil Resources as a geoscientist.
Breakthrough Performance.
Petrel Geology
Pet rel* SeISMIC-tO-SIMUl AtION SOF t WAre AMPlIFIeS tHe IMPACt OF e&P t eAMS. One solution uniting the subsurface domains of geophysics, geology, and reservoir engineering—new modeling capabilities better predict fracture geometries and facies distributions, analyze structural uncertainties, and define your well placement strategy.
“It’s like having an extra geologist sitting there. It’s telling you things that you didn’t know, it’s testing your theories like you never saw before and helping you come up with new ideas.” —David Hamilton, CEO, Subsurface Computer Modeling
Schlumberger Information Solutions—step-changing productivity for geoscientists and engineers.
technical luncheons NOVEMBER LuNCHEON
Implications of an evolving channel/ levee system on reservoir distribution: an example from the Upper Miocene to Lower Pliocene Gulf of Mexico
SPEAKER
John Wagner
Nexen Petroleum USA, Inc.
AUTHORS
John Wagner, Scott G. Comegys, Justin Nall, Jim Colliton
Nexen Petroleum USA, Inc.
11:30 am thursday, november 13, 2008 telus convention centre calgary, alberta
Please note:
the cut-off date for ticket sales is 1:00 pm, Friday, november 7, 2008. csPg member ticket price: $38.00 + gst. non- member ticket Price: $45.00 + gst.
Due to the recent popularity of talks, we strongly suggest purchasing tickets early, as we cannot guarantee seats will be available on the cut-off date.
Recent drilling of a seismically defined channel/levee system in the deep-water Gulf of Mexico has provided new insight into their architectural development and associated reservoir distribution. Both asymmetry of channel morphology and degree of channel sinuosity (straight versus curve) lend to varying distributions of net/ gross ratios of sand in relation to proximity to channel margin.
Over 100 metres of whole core were taken in this area and provided detailed calibration of reservoir characteristics from channel axis to channel margin to levee/overbank (ranging from proximal to distal).
Early development of channel systems favours deposition within channel bases and is attributed to weaker confinement of sustained flow deposition. Also, at this time overbank deposition has more attributes of crevasse splay (high net/gross) deposition rather than true levee facies typically dominated by highly ripple laminated facies. As channel continues to aggrade, system becomes more confined with only the larger flows contributing to the levee/overbank environment with channel axis acting as a zone of bypass and only passively infilling during waning flow and abandonment. This abandonment phase is attributed to updip avulsion and results in rapid shale deposition within channel and overbank setting creating a master top seal over the entire channel/ levee complex.
The depositional model derived from core and log data allowed for additional drilling in marginal areas where seismic geometry and amplitude were not well imaged. Results were successful away from the inferred channel margin and provided an important test of the impact of understanding the channel architecture of an evolving channel/ levee system.
BIOGRAPH y
John Wagner received both his B.Sc. and M.Sc. degrees in Geology from Louisiana State University in Baton Rouge and his Ph.D. in Geology at The University of Texas at Dallas.
From 1987 to 1998, Wagner worked for Mobil Oil beginning as an exploration geologist for Mobil Exploration and Producing U. S. in New Orleans, Louisiana. He then transferred in 1990 to work as an international consultant for depositional systems analysis at Mobil Exploration and Producing Services in Dallas, Texas and in 1995 to Senior Staff Geologist for Mobil’s Exploration and Producing Research Technical Center in Dallas, Texas.
From February of 1998 to December of 2000, Wagner worked for Pioneer Natural Resources as Sedimentologist/Stratigrapher for Worldwide Exploitation and Development. He joined Nexen Petroleum in December of 2000 as Sedimentologist for Deep-water Exploration and Development and is currently Chief Geologist for Nexen Petroleum U.S.A.
Prior to joining Mobil in 1987, his work ranged from field geologist in Alaska, to manager of a seismic crew, to coastal geologist for the Louisiana Geological Survey Coastal Geology Program. Wagner was a scientist on board the 1985 USGS/IOS GLORIA survey of the deep-water Mississippi Fan, Gulf of Mexico. He is a member of both the AAPG and SEPM and has served on Program Committees for the Gulf Coast Section Society of Economic Paleontologists and Mineralogists (GCSSEPM) Foundation Annual Research Conferences and is currently President-Elect for 2009.
In addition to his role as Chief Geologist for Nexen Petroleum U.S.A., Wagner is currently a Research Associate Professor at Southern Methodist University in Dallas, Texas, where he teaches graduate courses in the field of sedimentology and has published over 25 papers and abstracts. His work travels have taken him from the rivers and streams of Sakhalin Island Russia, to the coast of Vietnam, and to the jungles and mountains of Bolivia and Argentina.
His primary research interests are focused on siliciclastic depositional systems, sandstone sedimentology, reservoir architecture, depositional systems analysis, and understanding the various allocyclic and autocyclic controls that influence deposition.
and Images Originate
Where Exceptional Data
Rely on CGGVeritas to maximize your exploration success. Using the most advanced land acquisition technology, we have acquired more data in the Canadian Foothills and Heavy Oil region of N.E. Alberta than any other company, and have achieved an industry-leading QHSES record in the process. When quality and safety are top priorities, choose CGGVeritas.
Focus on Performance. Passion for Innovation. Powered by People. Delivered with Integrity.
technical luncheons DECEMBER LuNCHEON
Were Triassic rocks of the Western Canada Sedimentary Basin deposited in a Foreland?
SPEAKER
Filippo Ferri
BC Ministry of Energy, Mines and Petroleum Resources
CO-AUTHOR
John-Paul Zonneveld University of Alberta
11:30 am
tuesday, december 9, 2008 telus convention centre c algary, a lberta
Please note: the cut-off date for ticket sales is 1:00 pm, thursday, december 4, 2008. csPg member ticket Price: $38.00 + gst. non- member ticket Price: $45.00 + gst.
Due to the recent popularity of talks, we strongly suggest purchasing tickets early, as we cannot guarantee seats will be available on the cut-off date.
The Western Canada Sedimentary Basin (WCSB) preserves one of the most complete sections of Triassic strata found anywhere in the world. This westwardprograding clastic-carbonate succession is an important source of hydrocarbons, containing over 37 per cent of British Columbia’s conventional gas reserves. The current exploitation success of unconventional reservoirs within the lower part of this succession will significantly increase recoverable resources and further enhance the economic importance of this package within the province.
Triassic rocks of the WCSB were deposited, in part, on a Carboniferous-to-Permian rift sequence represented by the Fort St. John Graben system. The extensional tectonics represented by these rift deposits appears to be the only disruption to Paleozoic and Mesozoic passive margin deposition within the WCSB until the onset of compressional
deformation in the Early Jurassic.
Tectonics and sedimentation within the WCSB are a reflection of processes that were occurring on a continental and global scale. Recent and ongoing work along the western margin of Ancestral North America (ANA, the outer fringes of the WCSB) document Carboniferous to Permian extension associated with arc and back-arc development. Furthermore, this work also shows that uplift and obduction of ophiolitic and arc terranes occurred along this margin in PermoTriassic time, suggesting that the onset of Triassic sedimentation within the WCSB was occurring within a foreland setting. This would also infer that the Early Triassic basinal shales and siltstones (Montney, Doig) represent early foredeep deposits.
This research now suggests that terranes along the western edge of ANA are not far travelled, and are most likely pieces of the ancient continental margin that were pulled off during subduction and backarc development. These fragments were then subsequently “re-attached” through destruction of the intervening small backarc basin.
The timing and nature of tectonic processes along the western margin of ANA can be directly tied to those observed within the WCSB. A thorough explanation of this new model of the Triassic foreland basin is best presented via a description of the prior geologic evolution of the region, beginning with extension of the western margin of ANA in Devono-Mississipian times.
A stable shelf setting that was established along the western margin of ANA in Early Cambrian times experienced eastward subduction along its western-most edge commencing in the Late Devonian. This led to the formation of a magmatic arc along the western margin of ANA. Current evidence suggests that back-arc extension, probably due to slab roll back of the subducting plate, accompanied arc development, leading to the development of the back-arc basin (Slide Mountain Ocean) and attenuation of the western margin of ANA as the magmatic arc and its underlying continental basement ( yukon Tanana Terrane) rifted away from ANA. Arc magmatism and backarc basin formation continued until the mid-to-Late Permian. There is evidence in the southern US Cordillera of contractional deformation during this time (Roberts
Mountain Allochthon), although this is succeeded by arc-back-arc development.
The main manifestation of this arc and back-arc development within the WCSB is the development of the Fort St. John Graben (FSJG) and associated Central Montana Trough in the United States. These structures can be thought of as “failed arms” of this rifting event. Extension within the FSJG continued until the mid Permian, suggesting that the width of the back-arc basin was narrow enough such that the extensional tectonism associated with it was being recorded in rocks of the adjoining WCSB. Perhaps the Beaton and Sukunka highs are also products of this extension, representing tilted fault blocks.
Geologic evidence now suggests that the Slide Mountain Ocean disappeared at the end of the Permian through westward subduction of the ocean below the yukonTanana arc complex. This resulted in obduction of Slide Mountain ophiolite and pieces of the western yukon-Tanana magmatic arc. Locally, in the yukon and the southern Canadian Cordillera, coarse clastics of Early to Middle Triassic age record the uplift and erosion of these tectonic elements along the western edge of ANA. Compressional tectonics did not continue after this time, instead, subduction re-commenced to the west leading to the formation of the Late Triassic to Early Jurassic arc complex of the Quesnel Terrane.
Obduction of ophiolite and arc complexes along the western edge of ANA would have depressed the continental crust and led to foredeep development. Restoration of Cretaceous-Tertiary strike-slip faults in the Cordillera would place Late Paleozoic ophiolites and arc rocks of the Sylvester Allochthon orthogonal to the Peace River Embayment defined by Triassic rocks of the WCSB suggesting that this feature may be an expression of this crustal loading. Evidence for a concurrent forebulge may be found in the Peace River area of the western Foothills where temporally significant disconformities in outboard settings and anomalous sediment thickness trends occur. In this area, Lower and Middle Triassic strata consist of organicrich shale and siltstones deposited in a distal offshore depositional setting. Conodont data indicate that sedimentation rates are relatively consistent through the lower and lower Middle (Anisian) Triassic.
However, there is an abrupt and profound change during the Ladinian (upper Middle Triassic) when sedimentation rates drop dramatically, followed by a temporally extensive disconformity. Ladinian successions immediately to the east are significantly overthickened and comprise some of the thickest Middle Triassic successions in North America. The Middle-Upper Triassic boundary (which is the Ladinian-Carnian boundary) is characterized by an erosional unconformity, a switch to carbonate-dominated deposition and a dramatic increase in sedimentation rates (by at least an order of magnitude above Lower-Middle Triassic rates). Upper Triassic sediments demonstrate an inverse relationship to that exhibited by Middle Triassic successions (i.e., grossly overthickened in the west and dramatically thinner towards the east).
The Ladinian decrease in sedimentation rates and subsequent disconformity in western Peace River localities are interpreted to reflect deposition on an early forebulge. During the Upper Triassic this forebulge is interpreted to have migrated eastwards resulting in a thick deep-water succession of carbonate strata deposited in the west and a thin shallow-water succession of
carbonate strata deposited in a proximal carbonate ramp depositional setting towards the east.
The dark, basinal shales represented by the Montney, Toad, and lower Sulphur Mountain formations are interpreted to represent initial foredeep deposition prior to onset of coarser clastic sedimentation. Only eastern-sourced, continentally derived clastics are preserved within the Triassic succession. Indications of westerly derived clastics are rare and are a reflection of poor preservation in the west. Chert granules and pebbles in coarse, Halfway-equivalent sandstones within the western Foothills of the Peace River area suggest a local source. The fact that these coarse clasts are larger and more abundant towards the west may support the hypothesis that these sediments were derived from a western source.
In conclusion, Triassic sedimentation within the Western Canada Sedimentary Basin most likely occurred in a foreland basin setting. Early cessation of deformation associated with foreland development, together with uplift and erosion by JuraCretaceous Laramide deformation, has resulted in the bulk of the preserved
Triassic foreland deposits being found along the eastern margin of the basin and having an eastern, continental origin.
BIOGRAPH y
Filippo Ferri
Filippo Ferri is a senior geologist with the Resource Development and Geoscience Branch
(Continued on page 14...)
Investment Analyst
International Energy -Exploration and Production
Wellington West is an employee owned capital markets firm involved in underwriting and trading equities for corporate issuers and institutional investor clients. One of our core competencies is in the international energy sector.
We are currently looking to expand our equity research platform and require a talented and technically competent individual with international energy experience in exploration and production. Strong writing and presentation skills will be a valuable asset, as would a keen interest in capital markets, although investment industry “experience”is not required as we have demonstrated success in recruiting and then training individuals from within the energy sector.
This dynamic role blends industry knowledge with capital markets, and rewards both effort and results.
The position will be located in either Calgary or Toronto, at the candidate’s option. Please send resumes to: Jane Drewe
of the BC Ministry of Energy, Mines and Petroleum Resources. He has been with this branch for six years conducting energy-related geoscience. Prior to this, Ferri was a regionalscale mapper for 15 years with the British Columbia Geological Survey. He also has several years of oil and gas exploration experience, gained after he completed a M.Sc. in structural geology at the University of Calgary in 1985.
He has just begun a regional mapping program within the Foothills of the Halfway River area after working for several years examining
the hydrocarbon potential of Jura-Cretaceous clastic sequences within the Bowser and Nechako basins.
Ferri’s work experience within rocks of Intermontane and Western Canada Sedimentary basins together with regional mapping of Ancestral North America, and the more western peri-cratonic and “exotic” terranes has exposed him to a wide range of geology within British Columbia. This broad perspective has steered him to the large-scale investigative geology he will be presenting here.
John-Paul Zonneveld
John-Paul Zonneveld is an associate professor in the Department of Earth and Atmospheric Sciences at the University of Alberta. He received his B.Sc. in 1988 from Calvin College, Michigan after which he worked as a geologist with a Mississauga environmental consulting firm. He received his M.Sc. in 1994 from Michigan State University and his Ph.D. in 1999 from the University of Alberta. After a brief tenure as a post-doctoral researcher at the University of Calgary, Zonneveld accepted a position as Research Scientist with the Geological Survey of Canada in Calgary in 2000. He attained his present position at the University of Alberta in January 2008.
Zonneveld has authored and co-authored numerous papers on the sedimentary geology, volcanology, ichnology, and paleontology of Mesozoic and Cenozoic successions in western North America. Much of his research, both past and present, has focused on providing stratigraphic and sedimentologic support to the Canadian Petroleum and Mining Industries. As a dedicated Triassophile, his current research, and that of his graduate students, is focussed primarily on the sedimentology, stratigraphy, and geochemistry of hydrocarbon-bearing intervals in Triassic strata of Alberta and British Columbia, specifically the Montney, Doig, and Charlie Lake Formations.
diVision talKs SEDIMENTOLOGY DIVISION
Are Alberta’s foreland basin rivers a key to understanding fluvial deposits of the Western Canada Sedimentary Basin?
SPEAKER
Godfried Wasser Eucalyptus Consulting Inc.
12:00 noon
Wednesday, november 19, 2008
BP tower, 240-4 ave sW, room 201 calgary, alberta
With nearly half of the ancient clastic deposits of Western Canada related to fluvial sedimentation, fluvial deposits are one of the most understated topics of our profession. Fluvial deposits are often classified as ‘braided,’ ‘meandering,’ and occasionally ‘anastomosing,’ leading geologists to envision idealized sedimentary successions and geometries. Not only are these fluvial classes representative of endpoints of a sliding spectrum, they often lead us to ignore that these depositional systems evolve both laterally and through time, and that the final rock geometries preserved are greatly impacted by the development of accommodation space at variable rates.
In this presentation, three fluvial case histories will be presented: two from the Alberta Foreland Basin and one from the Eocene Capella Formation in the Pyrenees of Northern Spain. The Alberta Foreland Basin has isostatically rebounded over the last 10,000 years as a result of the melt-off of the Laurentide Continental Ice sheet(s) and Cordilleran glaciers. The amount of ice in mountain valleys was probably significantly less than that on the plains. Hence rebound in the plains was likely more severe and the topographic gradient between the mountains and the plains has likely declined over the past 10 millennia.
The Milk River Valley at the Pinhorn Grazing Reserve in Southern Alberta is incised into Belly River Formation bedrock and situated approximately 100 metres below the adjacent prairie plateau. The valley is approximately 800 metres wide. Assuming that most valley incision by the Milk River has taken place in the last 10,000 years, the average rate of glacial rebound in Southern Alberta would approximate 10 millimetres per annum. Comparing measured glacial rebound rates in Finland (~2 mm/yr) with that estimated in southern Alberta suggests that the Albertan estimate is too high and probably an ancestral valley existed prior to glacial rebound.
The Recent Milk River channel geometry is ‘typical meandering’, yet the environment is governed by highly variable discharge, a sandy sediment source, very high rates of cut bank erosion (1-2 metres per year) and 25year floods capable of significant erosion. Its older deposits form an extremely intricate mosaic of overbank and point bar deposits. If preserved, the architecture of Milk River channel deposits should be similar to that of the Eocene Capella Formation with a pattern of abrupt lateral channel migration. However, this formation’s sedimentary successions are associated with high rates of accommodation generation, whereas the Milk River has a very low, or even a negative rate of accommodation generation.
The Bow River Basin is also experiencing
glacial rebound, but its ancestral valley dates back to the Late Tertiary based on gravel deposits of that period as described by Moran (1987). Discharge of the Bow River is highly seasonal and flow rates during the last approximately hundred years have seldom been high enough to move large boulders; water energy is rarely sufficient to move pebbles 10 centimetres in diameter. yet, the Bow River displays typical braided river features. Moran’s work (1987) suggests the Bow River reworks glacial deposits that filled the ancestral Bow Valley including older pre-glacial and glacial-fluvial braid bar deposits.
It can be concluded that if recent rivers behave so differently than those idealized with traditional ‘end-member’ fluvial models, than subsurface fluvial deposits are unlikely to resemble the deposits proposed in these classifications either.
BIOGRAPH y
Godfried Wasser has a M.Sc. in sedimentology from the University of Utrecht, Holland. He has worked in the Canadian and international oil industry for nearly 30 years both on staff and as a consultant. Wasser currently offers industry courses, fieldtrips, and consulting services focusing on sandstone reservoirs through Eucalyptus Consulting Inc.
Integrated static model uncertainty analysis of the Lower Ben Nevis I Reservoir at the Hibernia Field
SPEAKER
Julio de la Colina
Chevron Canada Resources Calgary, Alberta
CO -AUTHOR
Michael Ash
Chevron Canada Resources
12:00 noon
thursday, november 20, 2008 encana amphitheatre, 2nd Floor, east end of the calgary tower complex 1st street and 9th ave se calgary, alberta
Although past evaluations of the Early Cretaceous Ben Nevis Avalon (BNA) sands at Hibernia Field have predicted very large volumes in place (STOOIP >1,000 MM bbls), a five-fault-block waterflooding development into the pool has yet to fully meet production expectations. The waterflooding development which consists of five oil-producing and five water-injection wells has taught us a great deal about the risk elements and key uncertainties associated with the nature of the BNA reservoirs.
Key static uncertainty parameters for the BNA include: fault compartmentalization; reservoir facies proportions; spatial distribution; and presence of sand, reservoir quality, reservoir heterogeneity, and connectivity. Well placement and well trajectory are now seen as critical to ensuring good injection rates and good connection between oil producers and water injectors in the discontinuous BNA reservoirs.
OBj ECTIVE
This study presents a fit-for-purpose workflow whose main objectives are the assessment of probabilistic STOOIP and static connectivity. Another objective is the quantification of the key static
model uncertainties on both volume and connectivity. A benefit of this structured and practical workflow is that it provides an un-biased way to select P10, P50, and P90 geologic models based on oil-in-place and static connectivity as ranking criteria. Furthermore, these three geologic models will be the inputs to reservoir simulation and will be used to assess reservoir performance under different development scenarios.
C ASE STUDy
We present a case study that is focoused on the Lower Ben Nevis I (LNB1) section located in the central BNA area of the Hibernia field.
A geocellular model that comprises six major fault blocks is iteratively built using the following applications: GOCAD for geologic modeling, VOxELGEO for seismic horizon and fault interpretation, and PETREL for stratigraphic analysis as well as for well log display. These tasks involve interpretation, integration, and reconciliation of subsurface data.
Previous studies have indicated that fault compartmentalization is one of the key uncertainty parameters that impact fluid flow performance in BNA reservoirs. Consequently, seven major bounding faults and 15 internal block faults are incorporated into the geocellular model. Many smallscale faults could not be incorporated into the model due to modeling constraints. These small-scale faults can be clearly detected using the amplitude extraction and visualization capabilities of VOxELGEO. The effect of these small faults should not be neglected because they have proven to act as baffles during production. They are accounted for in the reservoir simulation stage.
The LBN1 section is divided into four units. Hence, the faulted stratigraphic grid is divided into four zones to capture the unique characteristics of each sequence. These sequences are composed of reservoirs interpreted as a tidal channels deposited in an estuarine environment oriented NNW-SSE. Reservoirs are relatively thin, vertically heterogeneous with a generally poor correlation between wells. Model cell dimension is designed as 25 metres in the horizontal dimension and 0.5 metres on average in the vertical.
The first objective is to generate high, base, and low geologic scenarios.
A six-log “depo-petro” facies model is generated for each well as conditioning data for the geological model. Facies are populated in 3D using Chevron’s proprietary Multi-Point Statistical (MPS) simulation capability added to GOCAD. This technique includes the following input data and external constraints:
• The correlation of low-amplitude anomaly strength indicates the presence of reservoir facies. Hence, a “Facies Probability Cube” is generated as a “soft” threedimensional constraint on the spatial facies distribution.
• A vertical “Facies Proportion Curve” is used to constrain the vertical distribution and the resultant stacking pattern of facies.
• Net to Gross is provided through “Regional Facies Proportions” for each of the four sequences.
• Depositional environment information is included in a three-dimensional stratigraphic grid called a “Training Image.” This grid is generated using the facies body relative dimensions and shapes, as well as associations between each of the six facies types.
Porosity is populated by facies using Sequential Gaussian Simulation (SGS) based on well data external histograms and variograms for each facies. Permeability is then populated by facies using Sequential Gaussian Simulation with a collocated coKriging conditioning with porosity. Water saturation is populated based on the “Flow Zone Indicator” (FZI) equation.
Finally, STOOIP and static connectivity is calculated for each of the end member cases (low and high) as well as for the base case. Static connectivity is defined as the volume of the larger geobody for grid cells with permeabilites greater than 100 mD. At this stage of the analysis we do not know where these cases fall on the probability distribution curve.
The next step is to generate a probabilistic STOOIP and to evaluate the impact of static model uncertainties on STOOIP and connectivity. The objective of this task is to select P10, P50, and P90 geologic models based on STOOIP and static connectivity, two ranking criteria that will be used later to perform fluid-flow simulation and economics. We use the Plakett-Burman Experimental Design (ED) method and Monte Carlo Simulation that are part
Chevron’s Uncertainty Workflow plug-in to GOCAD.
The ED table is composed of six independent variables (uncertainty parameters) and two dependent variables or outputs (ranking parameter criteria). The independent variables that impact STOOIP and static connectivity are the following:
• Permeability variogram (threedimensional distribution). Water saturation (Sw) is considered as dependent to the permeability histogram variable.
The ED method tells us we have to build eight different geologic models to adequately capture uncertainty without running hundreds of realizations. The independent variables can only take either “low” or “high” as values. Each model has a specific combination of those variables dictated by the Plackett-Burman design. A ninth geologic model is constructed, but in this case each independent variable takes the base case values. This case is considered as a reference to compare to the ED analysis and to understand any inherent bias. The outputs are two linear polynomial equations (for STOOIP and Static connectivity) that are a function of each of the six independent variables. Next we assign a distribution to each of the variables and run Monte Carlo simulations with the two equations.
The final step is to select P10, P50, and P90 based on the two output-ranking criteria: STOOIP and static connectivity. Pareto Charts show the relative significance of independent variables to STOOIP and static connectivity. In this case study, facies proportions (NTG) is the main uncertainty parameter that impacts both STOOIP and static connectivity. Sw (dependent on permeability) is a secondary uncertainty parameter that impacts STOOIP.
SUMMARy AND CONCLUSIONS
• A facies probability cube is generated by calibrating seismic amplitudes to reservoir facies proportions. Low amplitudes correlate to high reservoir facies proportions and consequently to NTG. They are used to constrain the orientation and spatial distribution of reservoir facies.
• The low amplitude anomaly distribution
suggests the presence of the two reservoir facies throughout the study area. However, the anomaly strength fades towards the south-southeast suggesting a progressively lower proportion of reservoir facies to the same direction.
• Some of the blocks are highly compartmentalized by small-scale faults as illustrated by the orientation of amplitude anomalies and by the use of visualization techniques.
• The good injection of well B16-52A supporting well B16-23 is because no faulting separates the injector from the producer and because of the presence of reservoir facies in the main producing interval (LBN1-2). Another factor that has contributed to the better injectivity of well B16-52A (currently at about 700 m3 /d ) compared to well B16-32 is that the former has been perforated in all sands with an improved perforating technique (TCP: Tubing-Conveyed Perforation) compared to the later.
• The base case STOOIP is biased to the low side of the P50 probabilistic distribution, i.e., the Monte-Carlo-simulated PlackettBurman result.
• Facies proportion (NTG) is the dominant uncertainty impacting STOOIP and static connectivity.
• The fit-for-purpose workflow provides a
structured, un-biased way to select P10, P50, and P90 geologic models based on oilin-place and static connectivity as ranking criteria.
ACKNOw LEDMENTS
Thanks are given to the Hibernia Field partners (Chevron, ExxonMobil, Petro-Canada, Canadian Hibernia Holding Corporation, Murphy Oil, and Norsk Hydro) for permission to present this talk.
BIOGRAPH y
Julio de la Colina received his B.S. Geology from University of Buenos Aires, Argentina in 1986 and his M.Sc. Geology from University of Oklahoma. He has worked for Chevron since 1998 in a variety of US locations and has been in Calgary since 2003. Julio has worked mainly on international projects using integrated full field geological modeling for the last eight years.
I NFORMATION
There is no charge for the division talk, and we welcome non-members of the CSPG. Please bring your lunch. For details or to present a talk in the future, please contact Weishan Ren at (403) 233-3428, e-mail: weishan.ren@ conocophillips.com.
diVision talKs PALAEONTOLOGY DIVISION
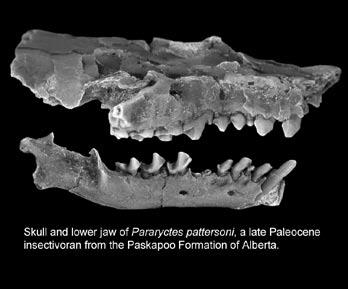
Age of mammals in Western Canada
SPEAKER
Dr. Craig Scott
Royal Tyrrell Museum
7:30-9:30 Pm
Friday, november 21, 2008
mount royal college, room B108 calgary, alberta
Western Canada has long been renowned for preserving some of the most spectacular dinosaur fossils so far discovered, and past and ongoing research has solidified the region as a hotbed for dinosaur paleontology. While dinosaurs continue to garner the awe and scientific interest of amateurs and professionals, a less conspicuous, but equally important component of Late Cretaceous and Early Paleogene terrestrial vertebrate faunas, the mammals, remains less well understood. Strata in the Western Canada Sedimentary Basin document a dense record
of early fossil mammal succession that spans the late Santonian through early Paleogene, and of the approximately 25 million years of mammalian evolution documented by this interval, perhaps none is better represented in terms of quantity and quality of specimens than the Paleocene.
Over 50 Paleocene-age mammalian local faunas are known from Alberta and Saskatchewan, collectively spanning a temporal interval from the Puercan (earliest Paleocene) to the late Tiffanian (late Paleocene). The Ravenscrag Formation of southwestern Saskatchewan yields the oldest
Paleocene mammals in Canada, and includes the earliest primates and carnivorans so far discovered. Slightly younger faunas are known from the Paskapoo Formation in the Calgary and Foothills regions of southern Alberta; these localities document diverse assemblages of multi-tuberculates, archaic ungulates, insectivorans, and primates. The youngest Paleocene mammals are known from localities in the Paskapoo Formation of the Red Deer River Valley near Red Deer, Alberta; these localities have produced abundant and exquisitely preserved specimens that record a remarkable diversity of multi-tuberculates and placentals, and include some of the largest Paleocene mammals so far discovered in western Canada.
Unlike mammals of the Late Cretaceous, which were almost uniformly of small body size and of limited taxonomic diversity, Paleocene mammals, especially placentals, are characterized by larger body size and possess astonishing suites of dental adaptations that are clearly indicative of radiations into a variety of ecological niches. While there is some evidence for a decline in mammalian taxonomic diversity in response to hypothesized climatic cooling through the Paleocene in other parts of the Western Interior, this does not appear to be the case in western Canada.
BIOGRAPH y
Dr. Craig Scott is Edmonton-born. He received his Ph.D. in 2007 from University of Alberta. His dissertation research is on late Paleocene mammals from near Red Deer, Alberta, with a particular focus on the phylogeny of early lipotyphlan insectivorans. He currently holds the position Curator of Fossil Mammals at Royal Tyrrell Museum of Palaeontology.
Scott’s interests are in mammalian paleontology, insectivoran phylogeny, and mammalian biogeography. He is currently researching mammals of the Belly River Group (Campanian) of southern Alberta and examining patterns of faunal change across the K/T boundary.
I NFORMATION
This event is jointly presented by the Alberta Palaeontological Society, Mount Royal College, and the CSPG Palaeontology Division. For details or to present a talk in the future please contact CSPG Palaeontology Division Chair Philip Benham at 403-691-3343 or programs@ albertapaleo.org. Visit the APS website for confirmation of event times and upcoming speakers: http://www.albertapaleo.org/.
diVision talKs BASIN ANALYSIS AND SEQuENCE STRATIGRAPHY DIVISION
Unlocking CBM and shale gas reservoirs
SPEAKER
Isabelle Pelletier Tardy
Schlumberger Information Solutions
12:00 noon
thursday, november 27, 2008 encana amphitheatre, 2nd Floor east end of the calgary tower complex 1st street and 9th avenue se , calgary, alberta
This presentation is to demonstrate how to use the non-traditional data collected by an asset team to understand their unconventional reservoir, here a shale gas play. It focuses on the treatment of fractures and faults, paramount to the flow behavior of the reservoir. It also shows how useful the mineralogical information can be to distinguish the variation of production potential.
Last but not least, flow simulator enables taking into account the adsorbed gas released in order to have a more reliable
prediction of the reservoir evolution through time and thus the recovery, overall and through time. For instance, as with sandstone and carbonate rocks, shales vary in composition and properties, which affects the recovery potential of the reservoir. Three-dimensional modeling provides a tool to study this variability, which affects recovery; it is important to understand how the amount of adsorbed gas changes. Study of this and other unconventional properties is required to unlock the secrets of shale gas or coal bed methane developments.
The workflow presented includes:
• Integration of non-traditional data and sub-seismic fractures information,
• Double/triple porosity (fracture, matrix, and adsorbed gas) in Petrel Reservoir Engineering Core, and
• Single-well simulations used to predict full field recovery.
Be N e FITS :
A full three-dimensional geological model is needed to study a shale gas play. Nontraditional data can be incorporated to help understand the recovery variability. Singlewell simulation models, easier and faster to model and run, can be used to validate against observed production data and to predict recovery variations.
BIOGRAPH y
Isabelle Pelletier Tardy has spent 15 years in the petroleum industry as a geoscientist. She obtained her Ph.D. in Geochemistry/Hydrogeology, at the French Petroleum Institute (IFP) in 1997, in collaboration with Total and Elf, where she studied the clay diagenesis of Dunbar’s sandstone, North Sea.
Tardy started her geological career as a geostatistic and stochastic modeling expert with Roxar (1998-2000), and then in 2000 with Schlumberger, first in its English Cambridge Research Center, and since 2004 in Houston. In 2005, she joined SIS Business Development. She has worked on simulation and production portfolios, where she has implemented solutions like optimizing drilling plans where the geology is uncertain, water flood management, unlocking the potential of CBM and shale gas plays, heavy oil, and CO2 sequestration.
INFORMATION
BASS Division talks are free. Please bring your lunch. For further information about the division, joining our mailing list, a list of upcoming talks, or if you wish to present a talk or lead a field trip, please contact either Steve Donaldson at 403-645-5534, email: Steve.Donaldson@ encana.com or Mark Caplan at 403-532-7701, email: mcaplan@aosc.com or visit our web page at www.cspg.org/events /divisions/basin-analysissequence-strat.cfm.
diVision talKs S TRuCTuRAL DIVISION
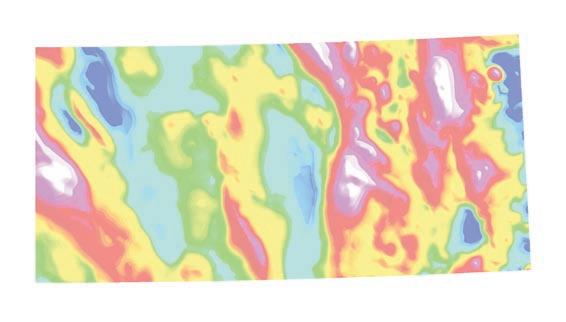
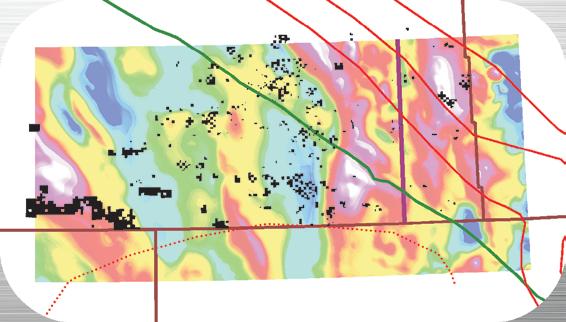
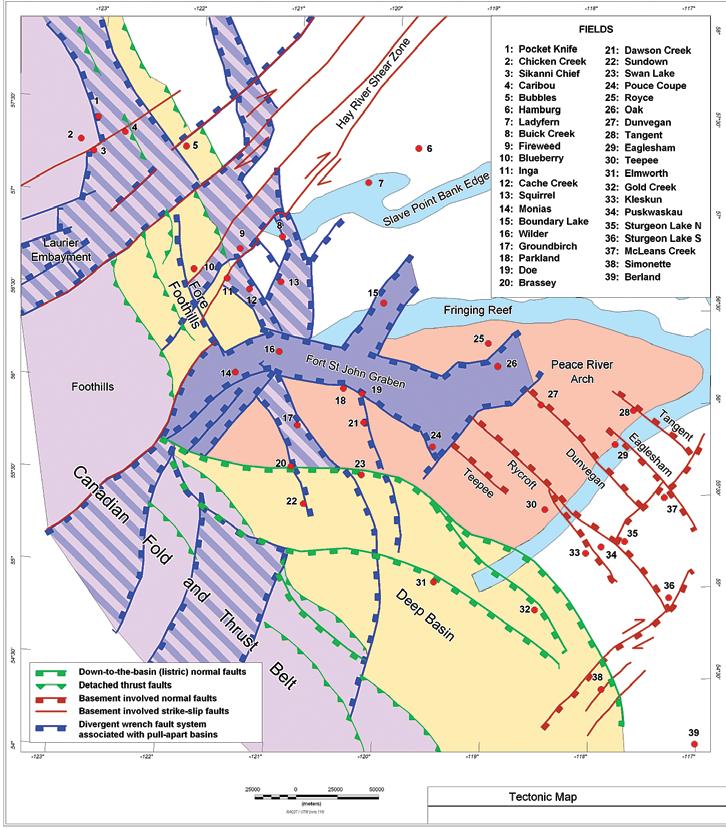
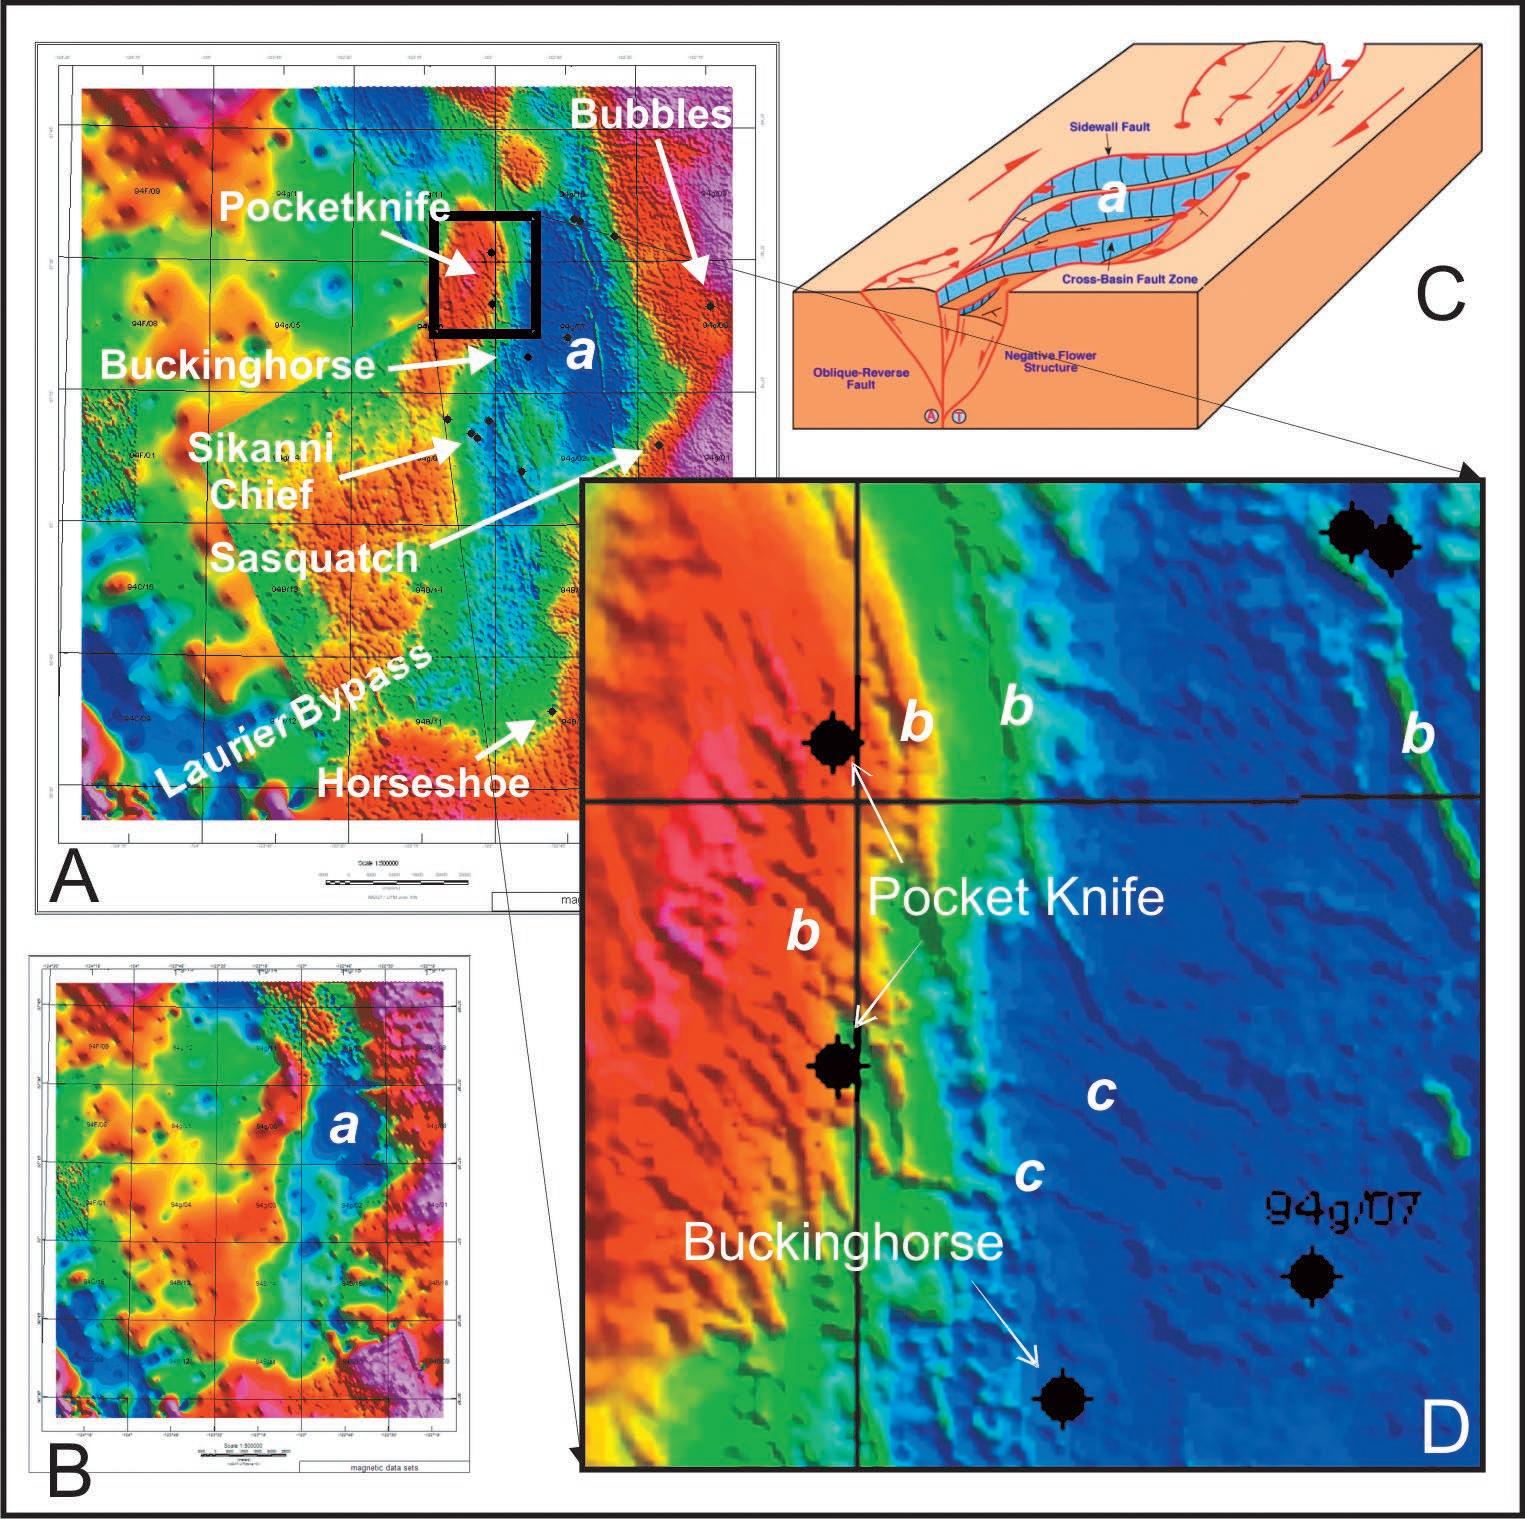
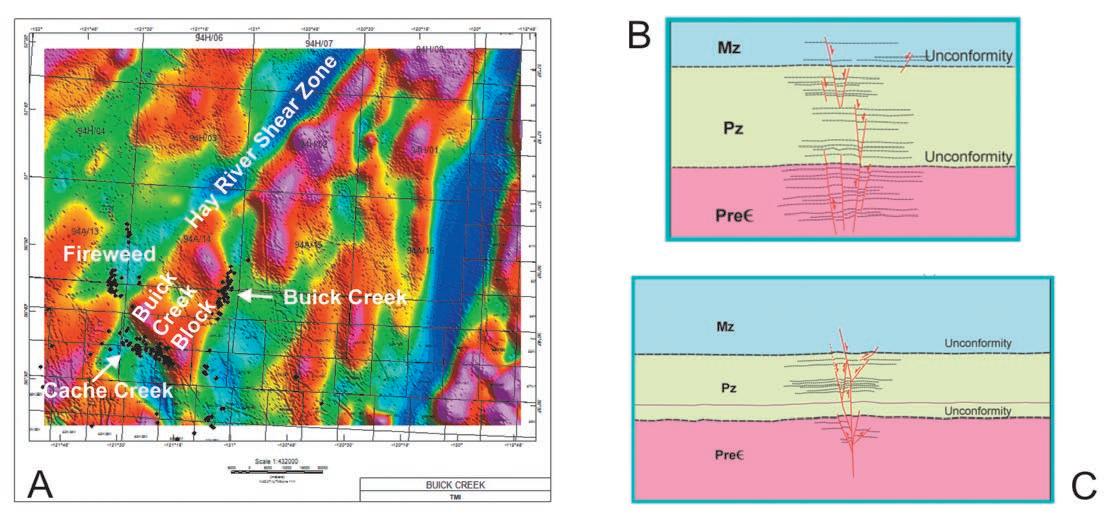
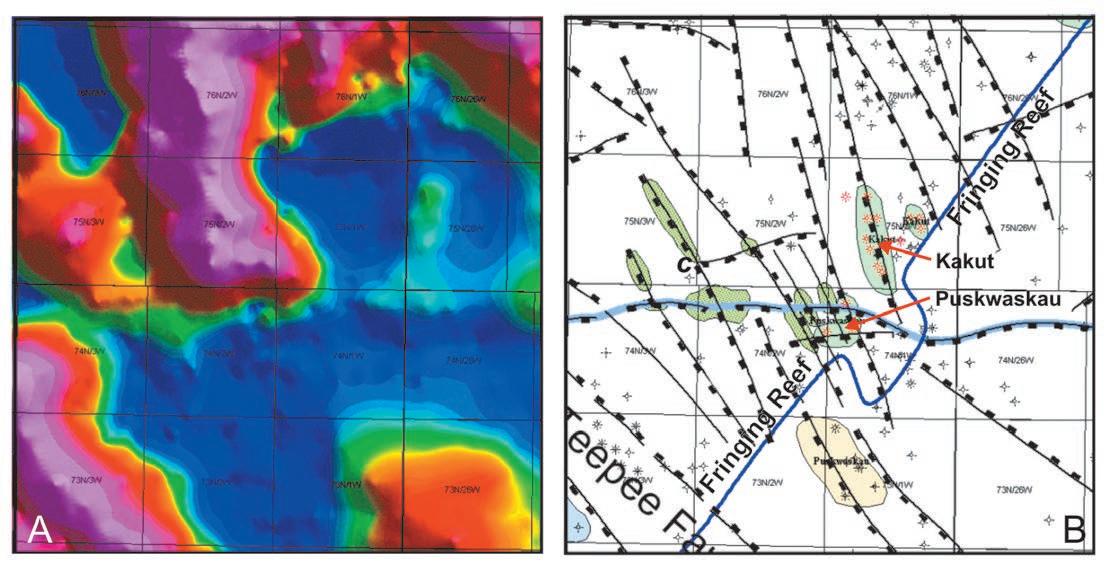
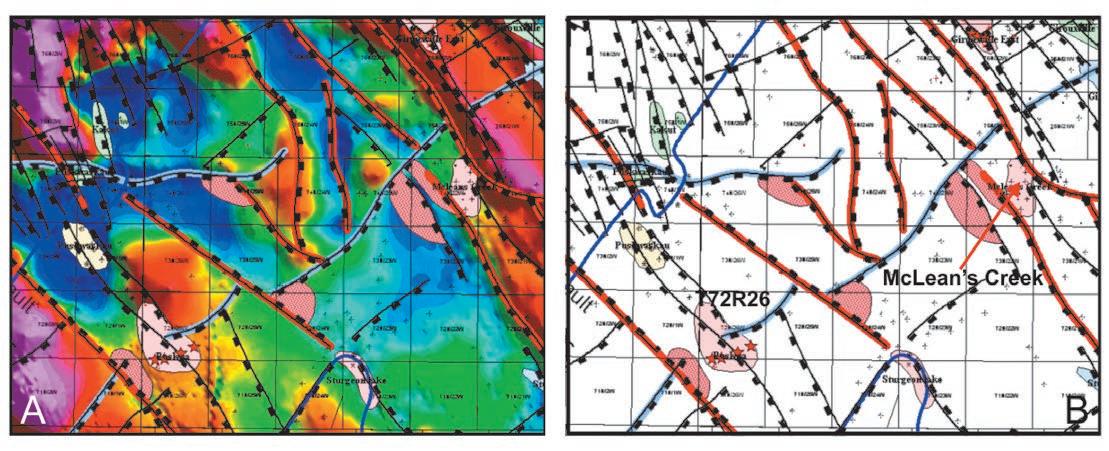
The contribution of integrated structural/ tectonic studies of HRAM Data for exploration and exploitation of resource plays in North America
SPEAKERS
Dr. Zeev Berger, Dr. Michelle Boast, and Dr. Martin Mushayandebvu IITECH Inc.
12 n oon, t hursday, n ovember 27 and december 11, 2008
Petro- c anada, West tower 17th Floor room 17e ( n ovember 27) and 17B/ c ( december 11)
150 6 ave s W c algary, a lberta
The recent shift from convention exploration to resource play exploitation has presented the geosciences community with a new and exciting set of challenges. Geologists, geophysicists, and petroleum engineers engaged in resource play exploitation are being challenged to identify “sweet spots” and “preferred trends” that are often controlled by extremely subtle geological features. Detection and analysis of these features often requires the use of tools and interpretation techniques which are not routinely used for conventional exploration.
IITECH has recently completed integrated structural and tectonic studies of several active resource play areas including: the Barnett shale in the Dallas Forth Worth Basin of West Texas; the Bakken Formation of the Williston Basin (USA and Canada); the Woodford and Fayetteville shales in the Arkoma and Ardmore Basins (Oklahoma); the Doig and Montney formations; and the Devonian shale play of the Horn River Basin, northeast British Columbia (Canada). Results show that many of the resource plays contain “sweet spots” and “preferred trends” that are largely controlled by basement structures and topography. These features can be
detected and analyzed through integrated analysis of magnetic data.
The objective of these talks is to illustrate our approach to regional structural interpretation and assessment of basins that contain developed and undeveloped resource plays. Special emphasis is placed on illustrating various imaging and filtering techniques that can be used to interpret the magnetic images in conjunction with existing three-dimensional and two-dimensional seismic and other pertinent geological information.
The first talk, on November 27, will focus on resource plays in NEBC and the Peace River Arch area.
The second talk, on December 11, will focus on resource plays of the Williston Basin and other basins in the USA.
BIOGRAPHIES
Zeev Berger is the president and owner of IITech Inc. He has over 30 years of exploration experience including 10 years with the remote-sensing group at Exxon Production Research Co., five years with Imperial Oil as a
technical mentor and four years as President of PAZ Energy.
Michelle Boast is an interpreter of gravity, magnetic, and remote sensing data for IITech. She is a structural geologist with a crossdisciplinary background spanning economic geology, metamorphic petrology, impact geology, petrography, and field-based geology. Boast reinterpreted the effects of the Penokean and Grenville orogenies on the Sudbury impact structure in Ontario, with implications for Cu-Ni ore exploration in the underlying basement rocks.
Martin Mushayandebvu is Chief Geophysicist of IITECH with over 20 years teaching and research experience. He was the principal researcher in the development of Extended Euler deconvolution
I NFORMATION
Talks are free and do not require pre-registration. Please bring your lunch. Refreshments are provided by HEF Petrophysical Consulting, and the room is provided by Petro-Canada. If you would like to be on the Structural Division e-mail list, or if you’d like to give a talk, please contact Jamie Jamison at (403) 816-1818 or wjamison@shaw.ca.
Reservoir Characterization
Expertise in heavy oil & deep basin reservoirs
• AVO / LMR Analysis
• Neural Network Analysis
• PP & PS Registration
• Joint PP & PS Inversion
• Fracture Detection Analysis using Azimuthal AVO
• Spectral Decomposition
Time Lapse Analysis
Carmen Dumitrescu
P.Geoph., M.Sc., Manager, Reservoir Geophysics
Direct: 403-260-6588 Main: 403-237-7711
www.sensorgeo.com
Alberta’s Professional Geoscientists and Engineers provide Albertans with many of the essentials of daily living. The work that they do allows all of us to enjoy warmth, light, power, water and the ability to travel and communicate over distance.
Since 1920, Members of APEGGA, The Association of Professional Engineers, Geologists and Geophysicists of Alberta, have made a difference in the daily lives of millions of Albertans by bringing science and innovation to life.
The P.Geol., P.Geoph., P.Eng., and R.P.T. professional designations represent the highest standards of quality, professionalism and ethics in geoscience and engineering. APEGGA Members can take pride in the role they play and the contribution they make to Alberta. APEGGA and its over 47,000 Members are committed to public safety and wellbeing through the self-regulation of the geoscience and engineering professions in Alberta.
Visit www.apegga.org for more information.
Geologists Geophysicists Engineers
diVision talKs GEOFLuIDS DIVISION
Mechanical force fields as drivers of fluid migration at carbon sequestration sites
SPEAKER
Udo Weyer, Ph.D., P.Geol. WDA Consultants Inc.
12:00 noon, monday, december 1, 2008 aquitaine tower auditorium (on +15 l evel), 1400-540 5th avenue sW calgary, alberta
The long-term fate and leakage of CO2 injected into geological formations depends on the geologic structure as much as on the mechanical force fields for fluid flow in the subsurface. These force fields are created by gravitational energy omnipresent in the subsurface. Hubbert’s force fields were applied in developing the theory of groundwater flow systems. These flow systems penetrate into
similar depth ranges as the injection of CO2 .
In areas of regional downward flow these systems may cause layers with ‘buoyancy reversal.’ ‘Buoyancy reversal’ means that under certain geologic and hydrodynamic conditions in the subsurface, the buoyancy force is directed downwards. These conditions have frequently been encountered in Alberta and in other areas. In general, under hydrodynamic conditions in the subsurface, the so-called buoyancy force may be directed in any direction in space. Only under hydrostatic conditions is it always directed vertically upwards.
The application of the principles of Hubbert’s Potential Theory to carbon sequestration is fundamental in achieving realistic results in any modeling attempt. IPCC’s attempt to determine 1,000-year buoyancy-driven migration of CO2 is seriously flawed as it ignores the mechanical vectors created by regional groundwater force fields, as is IPCC’s attempt to confine CO2 migration to aquifers and fault lines. What is generally missing from the treatment of this topic is the consideration of deeply penetrating regional fluid flow systems and its consequences using the principals of Hubbert’s Potential Theory. This will be
illustrated with examples from the literature, with field studies, and with the results of mathematical modeling. Any risk analysis on carbon sequestration and subsequent leakage needs to consider fluid flow analysis based on the principles of Potential Theory.
BIOGRAPH y
Dr. Weyer is a Senior Hydrogeologist with over 30 years experience in physical hydrogeology (regional and local groundwater flow, water supply, and man-induced changes), contaminant hydrogeology (petroleum industry, base metal and coal industry, chemical industry, steel industry, landfills), mine dewatering, and subsidence in North America, Europe, and Asia. He has supervised the utilization of numerous geochemical and groundwater flow models.
In addition, Dr. Weyer has managed and conducted consulting work and complex field studies of hydrogeology, hydrology, engineering geology, geology, and other issues of environmental nature in a wide variety of geographical and climatological settings, from the tropics to permafrost regions. He has prepared over two hundred reports and technical papers and published a book on subsurface contamination by hydrocarbons.
•
•
R ESERVOIR E NGINEERING FOR GEOLOGISTS
Geological Storage of C02
| by Mehran Pooladi-Darvish Ph.D., P. Eng. and R. Mireault P. Eng. Fekete Associates Inc.
Over the past few years, the production and usage of fossil fuels has increased despite rising concern over the atmospheric emission of greenhouse gases (e.g., CO2 ). It appears that fossil fuels will remain the energy of choice for at least a few more decades. Despite conservation, alternate fuels, constrained supply, and higher prices, the National Energy Board predicts that the demand for fossil fuels in Canada will continue to increase. The International Energy Agency forecasts similar trends for worldwide demand at least until 2050.
This article does not debate either the occurrence of global warming or the role played by man-made CO2 emissions. It instead considers the similarities and differences between hydrocarbon production and the geological storage of CO2 . Assuming the public is interested in capturing the CO2 waste created by burning fossil fuels, Alberta is a suitable place for its geological storage and the petroleum industry has the necessary abilities to significantly reduce net CO2 emissions.
CO2 EMISSIONS IN C ANADA AND A LBERTA
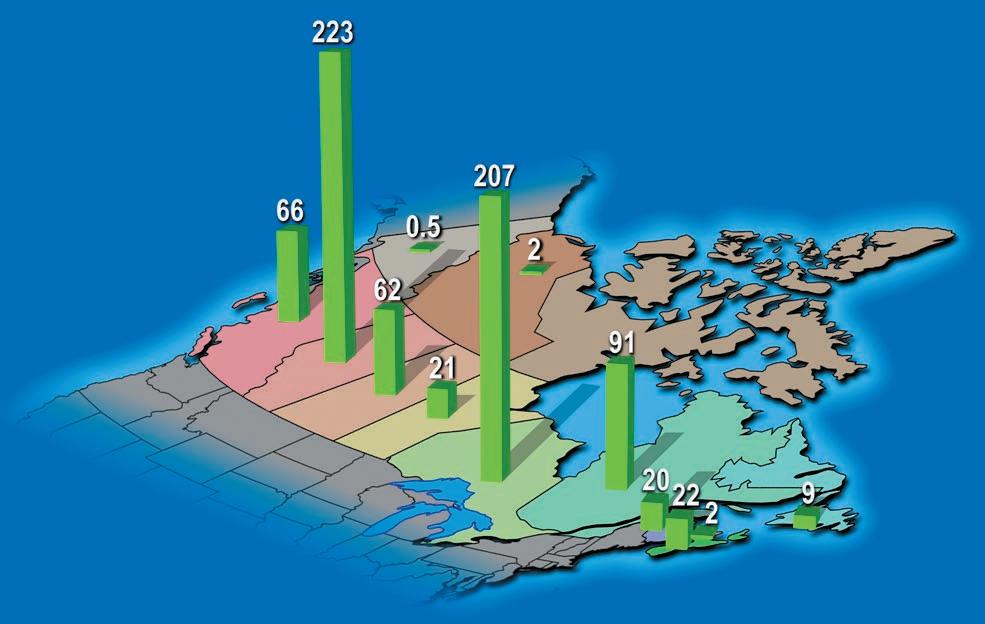
In 2000, Canada’s CO 2 emissions were approximately 725 megatonnes (Mt) (Figure 1). Alberta and Ontario together accounted for 430 Mt or slightly less than 60% of total emissions. Quebec, British Columbia, and Saskatchewan together accounted for 220 Mt or about 30%.
How much gas is this? In petroleum industry terms, 230 Mt/yr (Alberta’s annual emissions) translates to approximately 12 bcf/d; roughly equal to Alberta’s daily natural gas production rate. Conversely, injecting 12 bcf/d of CO2 would require 400 wells, each operating at 30 mmcf/d.
While all generated CO2 presents equal potential in terms of the greenhouse gas effect, the level of effort needed to collect, purify, and inject CO2 varies with the source of the emission. For example, CO2 from large stationary point sources, such as coal-fired power plants and hydrocarbon processing plants, is more easily captured and stored compared to CO2 from small, moving sources such as automobiles.
Note that fossil fuels contribute to CO2 emissions both when they are produced
(e.g., oil sand production, bitumen upgrades, and gas-sweetening plants) and when they are burned. Capture refers to the process of selectively treating or purifying the waste gas stream to “capture” just the CO2 component for injection (e.g., flue gas contains less than 15% CO2 ).
While the majority of CO2 emissions in Ontario are from small emitters, about half of the total emissions in Alberta are from large,
point-source stationary plants. Given the abundance of depleting petroleum reservoirs in the Western Canada Sedimentary Basin, capture and geological storage would appear to be the preferred solution, at least for Alberta’s point sources of CO2
The sheer magnitude of a 6 bcf/d injection rate raises additional considerations. Further, a multi-century time-scale for the geological
(Continued on page 26...)
Figure 1. CO2 Emissions (Mt/year) in Canada in 2000 (Bachu, 2008B).
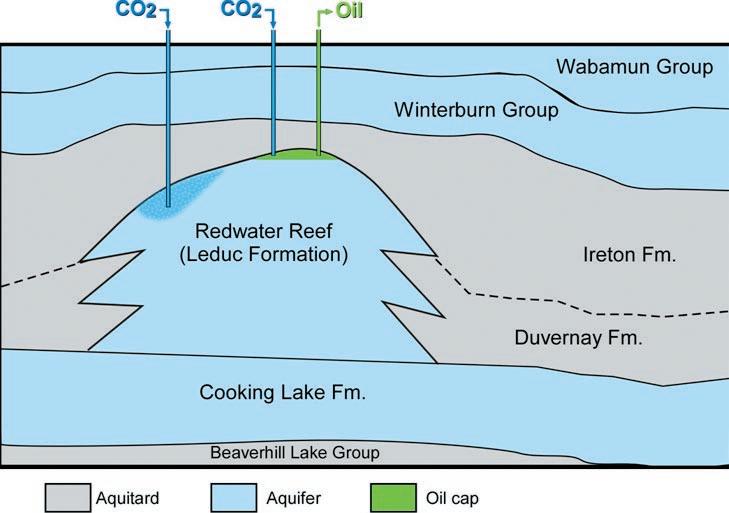
Figure 2. Large-Scale CO2 Storage in the Redwater reef (Gunter and Bachu, 2007).
storage of CO2 is a fundamental departure with the decade(s)-long operating horizon for hydrocarbon development (Bachu, 2008a). To address these differences, the models and workflows used for hydrocarbon development are being reconsidered and revised.
DESIRED STORAGE SITE CHARACTERISTICS
A desired CO2 storage site should have at least the following characteristics:
• Ensure containment over long periods of time (centuries).
• Enough injectivity to receive the CO2 at the desired rates.
• Sufficient storage capacity.
CONTAINMENT
The density of CO2 increases with increasing depth / pressure, to approximately 700 kg/ m3 at 2,000 to 3,000 m. But the density of formation brines is above 1,000 kg/m3. As with petroleum reservoirs, competent cap rock is required to ensure containment.
Even with competent cap rock, creating large, buoyant accumulations of concentrated CO2 that are in storage for centuries raises complex questions. Therefore, natural and man-made processes are being studied that could lead to permanent trapping of the injected CO2 . For example:
• Designs are being considered to enhance the contact between CO2 and the formation brine, to facilitate what is called “solubility trapping.” Once CO2 is dissolved in the brine, the mixture is denser than the in-situ brine and tends to settle.
• Reacting CO2 with formation minerals could create new stable minerals – “mineral trapping.”
• After flowing through porous rock, small CO2 bubbles can remain trapped in the pore space by capillary forces – “residual trapping.”
While many of these trapping processes occur naturally, they occur slowly over centuries. To accelerate these trapping mechanisms, engineering solutions are being proposed. For example:
• In a dipping aquifer, down-dip injection of CO2 could lead to CO2 flow underneath the cap rock and along the length of the aquifer, enhancing solubility trapping. The reduced risk of leakage as a result of enhanced solubility trapping will need to be balanced against the increased risk of leakage with distance from the injection site, since our knowledge of the integrity and areal extent of the cap rock generally decreases with distance from the well.
• Studies conducted by Hassanzadeh et al. (2008) suggest that production of the formation brine farther away from the CO2 injection site and its injection on top of the CO2 plume at some distance from the CO2 injector, could lead to solubility trapping of a significant amount of CO2 at a small energy cost.
INjECTIVIT y
Although total injection rates can always be increased by drilling more injection wells, the number of wells that will ultimately be required to inject 6 bcf/day can significantly affect the economics of geological storage. High permeability reservoirs and formations are obviously preferred.
Fekete’s studies have shown that the CO2 injection rate is not only controlled by permeability in the vicinity of the wellbore but also by the permeability distribution throughout the reservoir. The kv /k h
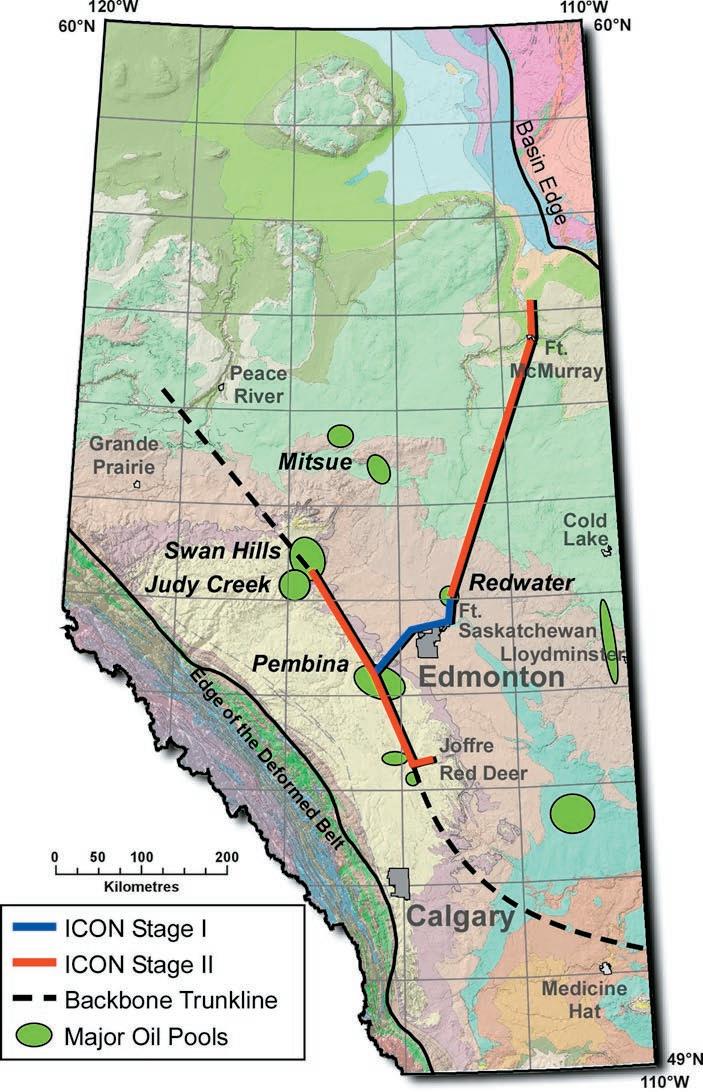
Figure 3. Redwater’s Proximity to Large CO2 Emitters (Gunter and Bachu, 2007).
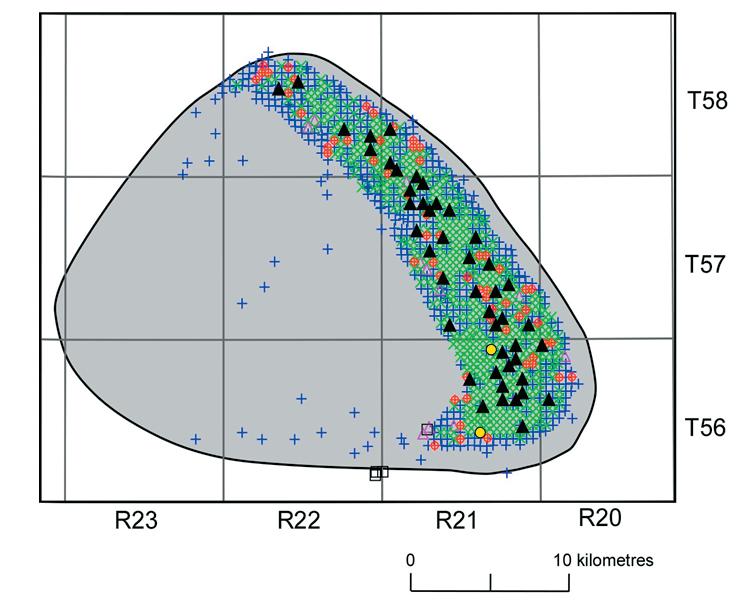
4. Redwater well locations (Gunter and Bach, 2007).
relationship is equally important with respect to overall storage capacity of the formation. For example, in simulation studies of the Redwater reef, the allowable injection rate is strongly affected by the degree of communication / permeability between the margins of the reef, the interior of the reef, and the underlying Cooking Lake aquifer.
Evaluating the permeability distribution throughout a reservoir is not normal practice when injecting petroleum wastes at modest rates. Nonetheless, it is required to assess the dissipation of the resulting pressure build-ups (below fracture gradient) at the rates required for large scale CO2 injection. Thus, additional geology / geophysics / drilling / testing may be required to develop the degree of characterization necessary for
detailed planning of CO2 projects.
C APACIT y
Depleted oil and gas pools are attractive
as storage sites, because of the availability of information and the knowledge that the cap rock is a competent seal. But large scale CO2 injection, (6 bcf/d is 2.2 tcf/year) requires formations that can store 10’s of tcf or 1,000+ megatonnes of CO2 . While depleted petroleum pools may play a part in localized injection of CO2 , two projects that are being considered for Alberta, illustrate the differences between conventional hydrocarbon production and large-scale geological CO2 storage operations.
HARP
The Heartland Area Redwater Project (HARP), run by Alberta Research Council and industrial partner ARC Resources, envisions using the entire Redwater reef as a CO2 storage site. The Redwater oil reservoir was the third-largest oil field in Alberta but it occupied only a small fraction of the total reef volume (Figure 2). The factors that led to the selection of Redwater for large scale CO2 storage are:
• Its proximity to several large CO2 emitters: the Heartland industrial area (northeast of Edmonton) and the CO2 that may be pipelined from oil sands production facilities in the Fort McMurray area (Figure 3).
(Continued on page 28...)
New MeMbership reNewal process!
Starting November 3rd Membership Renewals will be emailed to those who have provided us with an email address. Please be sure to watch your inbox for Membership Renewal form!
Features oF MeMbership:
Purchase Technical Luncheon Tickets at the Member Rate
Member Rates for Continuing Education Courses, Conventions and Social Events
Discounts and Corporate Rates offered by various companies to CSPG Members
Peer Networking Opportunities
Monthly subscription to The Reservoir
Quarterly subscription to the Bulletin of Canadian Petroleum Geology Career and Professional Development
Access to Members Only Section where you can:
Renew your membership online
Purchase Technical Luncheon Tickets Online
Access the Online Membership Directory
Access to Online Bulletin Archive
Update Your Profile
Figure
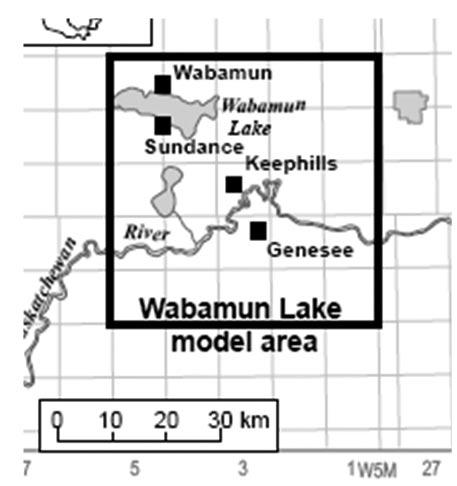
Figure 5. Large Coal-fired CO2 emitters near Edmonton (Michael et al., 2008).
(...Continued from page 27)
• Established knowledge of the reef’s containment geometry, capacity, and injectivity – albeit over a small portion of the reef.
One of the challenges to the project is the lack of geoscience knowledge over large portions of the reef, which nevertheless is required for storage. While hundreds of wells have been drilled in the northeastern portion of the reef (most to shallow depths) the rest of the reef has been penetrated by only a couple of dozen wells (Figure 4).
The reef and its overlying and underlying strata are being characterized, using available geological, petrophysical, geophysical, hydrogeological, and engineering information. Initial studies have been conducted to estimate storage capacity, number, and location of injection wells, and fate of the injected CO2 in the reservoir. These will be refined as exploratory well(s) are drilled and a pilot project is conducted, monitored, and evaluated.
wASP
The Wabamun area CO 2 Sequestration Project (WASP), run by the University of Calgary and Industrial Partners, is investigating aquifer disposal for four coal-fired power plants west of Edmonton that contribute significantly to Alberta’s CO 2 emissions (Figure 5).
Michael et al. (2008) have reviewed the CO2 storage potential of different formations that are in close proximity to the power plants, mapping at least three sequences of aquifers (Figures 6). The dolomitized Nisku aquifer is
separated from the surface by at least two sequences of seals (shales) and appears to potentially meet the three requirements of containment, capacity, and injectivity. Studies similar to those planned for HARP are underway.
FROM w HERE w E ARE TO w HERE w E NEED TO BE
Making a significant impact on the net volume of CO2 emissions, even from Alberta’s 2002 rate of 12 bcf/d, requires a large industry. The petroleum industry, with its earth-science and engineering knowledge, its operating expertise, managerial ability, and financial resources, is well suited to the task of CO2 capture and geological storage. We already know much about the issues by virtue of our hydrocarbon production experience:
• The same formations and knowledge that have produced hydrocarbons from the Western Canada Sedimentary Basin are required for CO2 injection and storage. Further, working in concert provides the potential for co-optimization of hydrocarbon production and CO2 injection.
• The industry is familiar with the challenges posed by surface transport of large fluid volumes and their underground injection and monitoring.
• For more than two decades, dozens of acid gas disposal projects, many having CO2 as the main constituent of the gas, have been underway in Alberta. These projects have much that is of direct application to the geological storage of CO2 (Pooladi-Darvish et al. 2008).
There are differences and significant challenges ahead:
• The injection rate and volumes for the acid gas disposal projects have been much smaller than the scale of CO2 storage projects that will significantly affect the net volume of CO2 emissions.
• Hydrocarbon sweetening operations have been the CO2 source for acid gas disposal projects. But large-scale geological storage projects will mostly capture CO2 from the burning of fossil fuels, such as from coalfired power plants. The different effluent gas composition from power plants may require different technologies to capture and purify the CO2 component in the emissions.
• While smaller CO 2 projects could potentially make use of depleted oil and gas pools, there is a point where only
Figure 6. Wabamun Area Stratigraphic Chart (Michael et al., 2008).
Figure 7. Current and Projected CO2 Injection Rates.
aquifers can provide sufficient storage capacity. But our present knowledge of aquifer extent, quality, and distribution –even those associated with hydrocarbon production – is likely insufficient for large scale CO 2 storage.
Capture and geological storage of CO 2 presents both challenges and opportunities. As Figure 7 illustrates, the industry is on a steep learning curve.
Stay tuned for our last article on Reservoir Simulation in the “Reservoir Engineering for Geologists” series.
R EFERENCES:
Bachu, S. 2008a. CO2 , Storage and Geological Media: Role, means, status, and barriers to deployment. Progress in Energy and Combustion Science – An International Review Journal, v. 34, p. 254-273.
Bachu, S. 2008b. personal communications.
Gunter, W. and Bachu, S. 2007. The Redwater Reef in the Heartland Area: A Unique Opportunity for Understanding and Demonstrating Safe Geological Storage of CO2 . http://www.nrcan. gc.ca/es/etb/cetc/combustion/co2network/ htmldocs/publications_e.html. 16 p.
Hassanzadeh, H., Pooladi-Darvish, M., and Keith, D.W. 2008. Accelerating CO2 Dissolution in Saline Aquifers for Geological Storage – Mechanistic and Sensitivity Studies. Paper submitted (June 2008) to Journal of Petroleum Science and Engineering.
Michael, K, Bachu, S, Buschkuehle, B.E., Haug, K., and Talman, S. 2008. Comprehensive Characterization of a Potential Site for CO2 Geological Storage in Central Alberta, Canada. In: Carbon Dioxide Sequestration in Geological Media – State of the Art. M. Grobe, J. Pashin, and R. Dodge, (eds.). AAPG Special Publication, In press.
Pooladi-Darvish, M., Hong, H., Theys, S., Stocker, R., Bachu, S., and Dashtgard S. 2008. CO2 injection for Enhanced Gas Recovery and Geological Storage of CO2 in the Long Coulee Glauconite F Pool, Alberta. SPE 115789 presented at the SPE annual Technical Conference and Exhibition, Denver, September 21-24, 2008.
This article was contributed by Fekete Associates Inc. For more information, contact Lisa Dean at Fekete Associates, Inc.
UNCOVER THE CLUES
UNCOVER THE CLUES
IN YOUR SEISMIC DATA
IN YOUR SEISMIC DATA
Boyd PetroSearch helps you get to the bottom of seismic mysteries.
For over 30 years, the team at Boyd PetroSearch has been using a keen eye, deductive reasoning and sharp analytical skills to shed light on countless cases of hydrocarbon exploration - in the Western Canadian Basin and around the world.
Put Calgary’s most experienced geophysical team on your next 2-D, 3-D or 4-D seismic case. Specialists in high-resolution and multi-component seismic surveys.
Please call: Larry Herd 403.543.5362 Dick Willott 403.543.5387 or visit www.boydpetro.com Global Geophysical Consultants
A RCHITECTURE AND E VOLUTION OF A M ASS T RANSPORT DEPOSIT (MTD), Neoproterozoic Isaac Formation, Windermere Supergroup
| by Ken Wallace, Joel Laurin, and R.W.C. Arnott
INTRODUCTION
Mass transport deposits, or MTDs, have only recently become a widely recognized depositional element in the deep-marine slope sedimentary record. In large part this advance has been the result of the significant improvements made in various seismic imaging techniques. Stunning 2D and 3D dimensional images of MTDs with their characteristic chaotic and contorted seismic signature have been reported on and beneath the seafloor on the slope of several modern ocean basins (e.g., Posamentier and Kolla, 2005). In spite of major improvements made in minimum vertical resolution, images still lack the detailed resolution offered by the ancient (outcrop) geological record. However this record too suffers from a number of important inadequacies. Foremost, the horizontal scale of most outcrops, which unlike that of most seismic surveys, is small, as is the vertical dimension (thickness) of an uninterrupted section. In addition, most of the geological record of deep-marine deposits occurs in strata deposited in tectonically active basins. In
these basins the commonality of triggering events like seismic shocks, and possibly also rapidly evolving basin physiography, would promote the ignition of a range of different mass transport and sedimentgravity flows. The question, therefore, is the sedimentary record that accumulated in active basins, including MTDs, similar to those that accumulated in passive margin basins, like the Neoproterozoic Windermere Supergroup (WSG).
M ASS T RANSPORT DEPOSITS OF THE w SG AT C ASTLE C REEK
As discussed in earlier contributions, strata of the Neoproterozoic WSG are spectacularly exposed at the Castle Creek study area in the Cariboo Mountains, B.C. (Arnott and Ross, 2008). Here in strata of the Isaac Formation a single laterally extensive MTD sandwiched between IC2 and IC3 crops out and forms a distinctive unit that is at least 2.2 km wide and up to about 130 m thick (Figure 1). IC2, which underlies the MTD, is about 55 m thick and consists of a succession of stacked, 10-30 m-thick sinuous channel-fill deposits
separated by a several-meter-thick unit of thin-bedded turbidites (Arnott, 2008). In contrast, IC3, which overlies the MTD, is a major laterally accreting channel-levee complex (Navarro and Arnott, 2008; Khan and Arnott, 2008; Navarro et al., 2008). The channel fill comprises a complicated, coarse-grained channel complex set up to about 100 m thick that migrates laterally and aggrades vertically over its genetically related levee. The significant thickness and textural differences between IC2 and IC3, in addition to the occurrence of the intervening MTD, is interpreted to have important sequence stratigraphic significance, especially in terms of the influence of relative sea level change on the flux, mineralogy, and calibre of sediment being supplied to the basin.
In the Castle Creek study area the MTD consists of six lithofacies (Figure 2) that make up ten sharply bounded stratigraphic units (Figure 3, Table 1). Except for the lowermost unit, Unit 1, all units are part of the mass transport deposit (MTD). In general the MTD consists of a complex mélange of mud- and sand-rich debris flow deposits intercalated with generally coarse-grained channel fills and thick slide and slump deposits. Based on these and a number of other lithological characteristics, strata of the MTD contrast markedly those that occur stratigraphically above and below, and indicate not only a major episode of gravitational instability along the continental slope, but also a time of significant change in sediment supply and transport mechanisms within the basin.
SEDIMENTAR y C ONTROLS ON DEPOSITION AND S TRATAL
A RCHITECTURE OF AN MTD
The stratal components making up the MTD at Castle Creek are similar in many respects to those reported recently by Pickering and Corregidor (2005) from the Eocene Ainsa basin. However in contrast to the Eocene example where MTDs represent a significant proportion of the basin-fill stratigraphy, MTDs in deep-marine strata of the Windermere Supergroup at Castle Creek, and elsewhere, are rare. In part this rarity is consistent with
Figure 1. Distribution of a thick (~130 m), wide (at least 2.2 km) mass transport deposit (MTD) in the Castle Creek study area. Letters A, B, C indicate the areas where the MTD was measured and mapped in detail (see Figure 3).
the proposed passive-margin setting for the Neoproterozoic Windermere Supergroup, which contrasts completely the tectonically active Ainsa basin. Although an assortment of forcing mechanisms might explain the vertical (temporal) changes in stratigraphy observed in the Castle Creek MTD – for example tectonism, like in the Ainsa example, or changes in sediment supply caused by changes in climate – the most consistent explanation is believed to be changes in relative sea level and its influence on sediment supply and production (Figure 3).
Sinuous channel fills, like those in Unit 1, are commonly observed in the upper parts of major deep-marine channel complexes, and usually are attributed to a reduction in sediment flux and calibre (Stage I in Figure 4). In a marine basin with a shallow-water shelf, such a change could be related to rising relative sea level that moves the principal sediment source landward and reduces sedimentation rate throughout much of the basin. Such changes would promote, where chemical conditions permit (possibly mediated by bacterial processes), the precipitation of early diagenetic cements like calcite and dolomite in sediment close to the sediment-water interface (Stage II in Figure 4). Later erosion of these partly lithified sediments would provide a source for carbonate-cemented mudstone and sandstone clasts, such as those commonly observed in the Castle Creek MTD.
Unit 1 is truncated by an erosion surface that marks a major change in the nature of sedimentation and sediment supply to the basin. Above this surface the stratigraphy is dominated by a complex mélange of anomalously coarse-grained, quartz-rich channel-fill, debris flow, and slump / slide deposits. The initiation of the MTD was marked by highly efficient, erosive turbidity currents that scoured a minimum 25 mdeep depression into Unit 1 strata. The stratigraphic record of these powerful currents is a thin, heterolithic assemblage of laterally discontinuous strata. This major change in the nature of the currents, in addition to the style of deposition, is probably the result of significant changes in the boundary conditions that controlled the currents. Specifically, changes in firstorder parameters like sediment flux, sediment calibre and distribution, and flow volume resulted in disequilibrium between the downslope-travelling currents and the inclination of the slope over which they flowed. These changes are interpreted to be related to the onset of falling relative sea level and concomitant reactivation of voluminous downslope sediment transport
(Continued on page
Figure 2. (A) Thin-and medium-bedded turbidites (levee deposits). (B) Sharp contact at base of Unit 2. This contact represents the base of the MTD in the southeast drainage area. (C, D) Sand-matrix debris flow deposits. (E, F) Mud-matrix debris flow deposits. (G, H) Sharp-based, normally graded quartz granule- and pebble-rich conglomerate (channel fill). (I, J) Mass movement (slide / slump) deposits. In (I), note the low-angle truncation surfaces interpreted to be shear planes that formed as the mass slid downslope. (J) 55 m-thick slump / slide deposit in Castle Creek north. Note the large discontinuous blocks that represent fragments of strata that prior to movement were more laterally continuous.
Fig. 4. Depositional history of the MTD in relation to changes of relative sea level, which ranges from High to Low. Stage 1 – stacked, laterally accreting, sinuous channel fills of IC2 (Unit 1)). As relative sea level continued to rise, sediment flux throughout the basin was reduced (Stage II). As a consequence, early diagenetic cements, principally carbonate cements, indurated sediment at and close to the seafloor. At the same time, but on the shelf, relict and palimpsest sediment accumulated (mostly quartz pebbles, granules, and very coarse sand). Subsequently, falling relative sea level reactivated the slope (Stage III). Sediment eroded from the outer shelf and also remobilized on the slope, including fragments of recently carbonate-cemented mudstone and sandstone, was transported and then deposited further downslope, initiating the MTD (early to mid Stage III). As relative sea level continued to fall (mid to late Stage III) fragments of shallow-water carbonates, including pisolites (upper photo on right – P) and stromatolites (lower photo on right – S), became part of the sediment supply. As relative sea level approached and eventually reached its lowest position (Stage IV) sedimentation style changed dramatically and culminated in the construction of a major channel-levee complex (IC3) composed of immature (feldspar-rich) strata.
Figure 3. Stratigraphic architecture in each of the three main study areas (see Figure 1 for location of each study area).
(Stage III in Figure 4). Part of that transported sediment was abundant quartz pebbles, which is a rather uncommon grain size throughout most of the Castle Creek area. These pebbles are interpreted to be related to physical winnowing of previously deposited sediment by shelf processes like waves and tides during rising and highstand of relative sea level (similar to palimpsest deposits on modern continental shelves) (Stage II in Figure 4). These sediments, in addition to relict shelf sediments, were then eroded and remobilized downslope with the change to falling relative sea level (Stage II to III in Figure 4). In addition to the quartz pebbles is an assortment of carbonate-cemented mudstone and sandstone clasts. These clasts were eroded from sediment that was previously indurated by near seafloor cementation during the preceding rise and highstand of relative sea level. Carbonate-cemented clasts, quartz pebbles, and low total organic carbon (TOC) mudstones eroded from finegrained, low TOC slope deposits became important sources of sediment during falling relative sea level (early to mid Stage III in Figure 4). Deposition was dominated by cohesive mass flow and coarse-grained (quartz-pebble-rich) channel deposits. Mass movement (slump / slide) deposits are confined to a single, albeit up to 55 m-thick, unit. Seafloor topography created by debris flow and slump / slide deposition would appear to have had a first order control on the location of subsequent channels
and channel fills, wherein the latter are thickest and coarsest where the former are thinnest. With time (i.e., stratigraphically upward), although sediment transport and deposition processes changed little, the sediment supply did. In the upper parts of the MTD, shallow-water carbonate clasts, including oolites, stromatolites, and uncommon pisolites, are observed in debris flow and channel deposits (mid to late Stage III in Figure 4). These clasts indicate that for the first time shallowwater carbonates had become part of the sediment supply being transported into deeper parts of the basin. Furthermore, these clasts suggest that the sediment source had now been extended headward (landward) into shallow water, or water depths in the source area have become sufficiently shallow to support the creation of shallow-water carbonate sediment particles. In either scenario, the suggestion is that relative sea level had been falling and now was probably approaching its lowest position.
Abruptly overlying the MTD is IC3 (see Figure 3), which has been interpreted to be an about +80 m-thick channellevee complex (Navarro and Arnott, 2008; Navarro et al., 2008). At the base of IC3, strata consist of quartz-pebble-rich conglomerate with dispersed carbonatecemented clasts. Only several meters above the lower contact, however, grain size fines significantly, wherein coarse clastic deposits, like those observed in
most other places in the Isaac Formation at Castle Creek, consist generally of immature (feldspar-rich) sediment grains up to granule or very coarse sand size. Moreover, carbonate clasts become absent quickly upward. These upward changes are interpreted to indicate the onset of lowstand conditions (Stage IV in Figure 4). At this time, fluvial systems most probably traversed completely the now exposed shelf and delivered their sediment directly to shelf-edge deltas that prograded out onto the upper slope. In addition, exposure of the shelf terminated carbonate production as the system became overwhelmed by continentally-derived immature siliciclastic sediment.
In summary, the MTD exposed at Castle Creek provides another exceptional ancient example of an important element in the deep-marine stratigraphic record. Moreover, it provides another detailed account of the possible stratal components and origin of the myriad of surfaces that might be resolved in seismic profiles of these not so “chaotic” mass transport deposits.
R EFERENCES
Arnott, R.W.C. 2008. Depositional Patterns and Mechanisms on the Inner-Bend Margin (Point Bar) of a Sinuous Deep-Marine Channel. Canadian Society of Petroleum Geologists, The Reservoir, v. 35, no. 9, p. 28-30.
(Continued on page 34...)
9
8
7
6
4
3
2
1 Thin-bedded turbidites (levee) and coarse-grained, thick-bedded (channel fill deposits).
Overlies a major erosion surface that incised about 25 m-deep into unit 1. Strata of unit 2 are up to 3 m thick, laterally discontinuous and consist of grey, normally graded granule conglomerate and sandstone with silty mudstone intraclasts interstratified with thinly-bedded silty and sandy turbidites.
Erosively overlies unit 2, and in places erodes it completely (10 m-high, vertically-dipping erosion surface in one location). Strata are up to 10 m thick and consist of quartz pebble conglomerate (coarse sandstone matrix).
Scoured base up to about 10 m deep and consists of laterally discontinuous lenses of grey, normally graded granule conglomerate and sandstone with silty mudstone intraclasts interstratified with thinly bedded silty and sandy turbidites.
5 up to 15 m thick and overlies a basal scour surface with up to ~1 m local relief. Approximately 300 m long within the study area and pinches out to the northwest where it onlaps units 2, 3, and 4. Strata consist of matrix-supported pebble conglomerate (mudstone matrix).
Onlaps an irregular erosion surface along the top of unit 5. up to about 15 m thick and consists of a comparatively diverse assemblage of facies, including well bedded conglomerate and sandstone. Stratigraphically upward and laterally strata fine and thin.
Sharp base with scours up to 1 m deep. unit is 8 m thick and up to 320 m wide. Strata consist of very thick-bedded granule conglomerate and disorganized pebble conglomerate.
Distinctive unit that can be traced laterally for at least 1.6 km laterally and locally is up to 55 m thick. unit consists of pervasively deformed (brittle and ductile) fine, thin-bedded turbidites with large dispersed coherent clasts (some more than several tens of metres long and several metres thick).
Ranges from 20 m thick in Castle Creek south to 3.5 m in Castle Creek north. The thicker package consists of well bedded conglomerate and sandstone that fines and thins upward and laterally. Thinner succession consists of stacked medium- to thick-bedded turbidites overlain by fine, thin-bedded turbidites.
Channel and adjacent levee deposits of IC2 (Arnott, 2008).
Stratal remnants of erosive, high-energy turbidity currents that transported the bulk of their sediment further downflow (bypass currents). It is these turbidity currents that created the initial topographical depression that focused most of the later transport events that built up the MTD.
Arnott, R.W.C. and Ross, G.M. 2008. Overview of the (Neoproterozoic) Windermere Supergroup of the Southern Canadian Cordillera – the world’s premier ancient deepmarine turbidite system. Canadian Society of Petroleum Geologists, The Reservoir, v. 35, no. 2, p. 35-38.
Khan, Z. and Arnott, R.W.C. 2008. Deep-water Channel-Levee Complex of the Neoproterozoic Isaac Formation, Windermere Supergroup, Cariboo Mountains, western Canada: Part 2 – Architectural Analysis of Overbank Deposits. Canadian Society of Petroleum Geologists, The Reservoir, v. 35, no. 7, p. 20-23.
Similar to unit 2 – bypass-current erosion and deposition.
Mud-rich (high viscosity) debris flow deposit. unit 5 filled remnant topography related to unit 4, and as a consequence pinches out to the northwest.
Fill of a channel that eroded into debris flow deposits of unit 5. upward and lateral thinning and fining are most likely related to progressive waning of flow energy through the channel system (temporal) and lateral waning of individual flow energy toward their margins (spatial).
Like unit 6, unit 7 is interpreted to represent a coarse-grain fill. Increase in grain size compared to unit 6 reflects a change in the calibre of the local (regional?) sediment supply.
Major slump / slide deposit. Absence of exotic clasts or stratal components suggest that these strata were derived from a mobilized sediment mass that previously was deposited further up the slope. During movement, intense internal and basal shearing formed the variety of observed brittle and ductile deformation structures.
Navarro, L. and Arnott, R.W.C. 2008. Deep-water Channel-Levee Complex of the Neoproterozoic Isaac Formation, Windermere Supergroup, Cariboo Mountains, western Canada: Part 1 – Architectural Analysis of Channel Deposits. Canadian Society of Petroleum Geologists, The Reservoir, v. 35, no. 6, p. 29-32.
Navarro, L., Khan, S., and Arnott, R.W.C. 2008. Deep-water Channel-Levee Complex of the Neoproterozoic Isaac Formation, Windermere Supergroup, Cariboo Mountains, western Canada: Part 3 – Depositional Evolution Model and Reservoir Implications of a Channel-Levee Complex. Canadian Society of Petroleum Geologists, The Reservoir, v. 35, no. 8, p. 30-35.
Pickering, K.T. and Corregidor, J. 2005. Masstransport complexes (MTCs) and tectonic control on basin-floor submarine fans, Middle Eocene, south Spanish Pyrenees. Journal Sedimentary Research, v. 75, p. 761-783.
Posamentier, H.W. and Kolla, V. 2003. Seismic geomorphology and stratigraphy of depositional elements in deep-water settings. Journal of Sedimentary Research, v. 73, p. 367-388.
ACKNOw LEDDGEMENTS
Our ongoing research of the WSG is funded by the industry members of the Windermere Consortium (Anadarko Petroleum, Canadian Natural Resources Ltd., Devon Petroleum Ltd., Husky Energy, Encana Corp., Nexen Inc., and Shell) and an NSERC Collaborative Research and Development Grant.
10
Distinctive, easily correlated marker horizon in the Castle Creek study area (>2.2 km wide and up to 80 m thick). Complex mélange of clast-rich and clast-poor matrix-supported conglomerate and silty mudstone. Carbonate clasts, including carbonatecemented sandstone / mudstone, oolites, pisolites, and stromatolites are common.
Table 1. Description and interpretation of Units.
Deposited from at least three separate debris flow events. Although similar in mechanism to other debris flow deposits, these strata also contain abundant exotic carbonate clasts, like oolite, pisolite, and stromatolite fragments, and therefore indicates a source of sediment that for the first time included shallow-water carbonates.
Deposit of a channel-levee complex.
For rock-solid reliability— miles underground—look into our precise imaging solutions.
Halliburton Wireline and Perforating Services has the most reliableimaging solutions in the world—including the new Oil Mud ReservoirImager (OMRI™) tool and its X-tended Range Micro Imager (XRMI™) water-based tool version—both of which generate crisp, digitalwellboreimages across the full range of formation resistivitiesand with excellentvertical resolution.
Before you get in too deep, look into Halliburton Wireline and Perforating Services— the leader in reliability and service excellence. For more information, please visit us at www.halliburton.com/wireline.
HALLIBURTON
PRACTICAL SEqUENCE STRATIGRAPH y
The Material-based Surfaces of Sequence
Stratigraphy, Part 3: Maximum Flooding Surface and Slope Onlap Surface
| by Ashton Embry
1. A surface section of Lower Triassic strata along the northeastern coast of Ellesmere Island, about 10 km north of the entrance to Hare Fiord. A maximum regressive surface (MRS) has been delineated high in a succession of shelf sandstones that coarsen and shallow upwards. The strata above the MRS fine and deepen upward to a thin, fossil-rich, limestone bed, the top of which is delineated as a maximum flooding surface (MFS). Above the MFS, the strata coarsen upwards as shown by the increasingly lighter colour of the section.
I NTRODUCTION
Four material-based surfaces of sequence stratigraphy – subaerial unconformity, regressive surface of marine erosion, shoreline ravinement, and maximum regressive surface, were described in the previous two articles in this series. In this installment, the final two materialbased surfaces – maximum flooding surface and slope onlap surface – are described and discussed. Like the other material-based surfaces, each of these surfaces has a unique combination of physical characteristics which allow it to be defined and delineated in a variety of stratigraphic settings and with various types of data.
The origin of these surfaces, like those previously described, can be explained by the interaction of sedimentation and base-level change. And, also like the other surfaces, these have substantial utility for contributing to an approximate time correlation framework and for acting as boundaries for specific sequence stratigraphic units.
M AXIMUM FLOODING SURFACE (MFS)
The maximum flooding surface has been recognized on the basis of empirical data for over a century, although the specific name maximum flooding surface has been applied to it for only the past 20 years. Its value for correlating well log sections was recognized by the 1950s and many so-called “markers” on published cross-sections would be now designated as maximum flooding surfaces (e.g., Forgotson, 1957; Oliver and Cowper, 1963). Frazier (1974) called such a surface a “hiatal surface” and Vail et al. (1977) called the seismic reflector which encompassed this surface a downlap surface.
In marine siliciclastic strata, the MFS marks the change in trend from a fining upward trend below to a coarsening upward trend above (Embry, 2001) (Figure 1). In nearshore areas, this change in trend coincides with a change from deepening to shallowing. Farther offshore, this relationship does not hold and the deepest water horizon sometimes can lie above the MFS. In terms of stacking pattern, the MFS is underlain by a retrogradational pattern which displays
an overall fining upward and is overlain by a prograding one which records an overall coarsening upward (see Van Wagoner et al., 1990).
In nonmarine, siliciclastic strata, the expression of the MFS can be more subtle, but once again the surface is best placed at the change in trend from a fining upward to a coarsening upward. In general, such a placement coincides with the change from decreasing fluvial channel content to one of increasing channel content (Cross and Lessenger, 1998). The MFS in nonmarine strata is sometimes associated with an absence of clastic material, which can coincide with a prominent coal bed (Hamilton and Tadros, 1994; Allen et al., 1996) or even a nonmarine to brackish water limestone.
In carbonate strata, the MFS also marks a change in trend from fining to coarsening.
Figure 2. In this outcrop of Middle Jurassic strata from central Axel Heiberg Island, a maximum flooding surface (MFS) is placed at the top of an ironstone bed. Note that ironstone content increases upward in the shale below the ironstone bed and that argillaceous ironstone overlies the MFS. The MFS is drawn at the horizon with least clay influx.
Figure
Figure 3. Two maximum flooding surfaces (MFS) have been delineated in this subsurface succession of Jurassic strata from the Lougheed Island area. The MFSs have been placed at the change in gamma log trend from increasing gamma ray to decreasing gamma ray. This change in gamma ray trend is interpreted to reflect a change from fining and deepening-upward (increasing clay content) to coarsening and shallowing-upward (decreasing clay content).
Figure 4. A schematic diagram showing the interpreted relationship between a maximum flooding surface (MFS) and other surfaces of sequence stratigraphy. The MFS overlies the SU/SR-U/MRS surfaces and, as shown, represents the change in trend from fining to coarsening. The surface develops close to the time of onset of regression when the shoreline begins to move seaward and coarser sediment arrives at a given locality on the shelf. In distal areas, the MFS can be an unconformity due to starvation and episodic scouring and it is downlapped by prograding sediment.
Figure 5. The relationship of the maximum flooding surface (MFS) to time. The MFS will approximate a time surface perpendicular to the shoreline but will exhibit minor diachroneity along strike due to varying rates of sediment input along the shoreline. It will develop earlier (i.e., be older) in areas of higher input where regression begins earlier.
Notably, in a shallow-water carbonate-bank setting, the MFS will mark the horizon of change between deepening upward to shallowing upward and this criterion, which
employs facies analysis, can often be more reliable than grain-size variation for its delineation in such a setting. In deeper water, carbonate ramp settings, the MFS
marks a change from decreasing and / or finer carbonate material to increasing and / or coarser carbonate material. In platform settings the MFS is most easily identified on the basis of the change from deepening to shallowing whereas on the adjacent slope and basin areas the grain-size criterion is more reliable.
Similar to identifying an MRS, the recognition of an MFS usually requires the availability of data which reflect the grain size of the sediment and from which general water depths of the deposits can be interpreted from facies analysis. On the basin flanks, the surface is either a minor scour surface (diastem) or conformity. In offshore areas it can be an unconformity that developed mainly due to starvation and minor scouring in both carbonate and clastic regimes. Notably such an unconformity usually is not associated with any demonstrable truncation of strata but rather marks a major loss of time as evidenced by paleontological data. In offshore areas, the MFS often occurs within condensed strata which contain numerous diastems and, in siliciclastics, may be associated with a chemical deposit such as a limestone or ironstone (Figure 2).
On a gamma log of siliciclastic sediments, the MFS is best placed, in the absence of more precise data (e.g., core), at the inflection point from increasing gamma ray (gradual shift to the right indicating fining-upward and increasing clay) to decreasing gamma ray (a shift to the left indicating coarseningupward and decreasing clay) (Figure 3). Where the MFS is represented by a chemical deposit such as an ironstone or limestone bed or concentration of glauconite, the log expression of such lithologies can be variable (Loutit et al., 1988). In pure carbonate strata, it is not possible to use log response to recognize an MFS, and facies data from core are mandatory. On seismic data the MFS is represented by a reflector often referred to as a “downlap surface.” On cross-sections, higher order MFSs often appear to downlap onto a lower order MFS (e.g., Plint et al., 2001).
Given the physical characteristics of the MFS, it has been interpreted to be generated at a given locality mainly by a change from decreasing sediment supply to increasing sediment supply at that locality. Such a change in supply rate is most often associated with the change from transgression to regression. Regression begins when the rate of sediment supply starts to exceed the rate of base level rise at the shoreline and the shoreline subsequently moves seaward. Coarser grained sediment is then deposited at any
(Continued on page
(...Continued from page 37)
given locality along an offshore transect and the MFS is marked by the change from finingupward to coarsening-upward (Figure 4). Thus, the MFS is interpreted to be generated very near the time of start of regression.
On a regional scale, the start of regression will occur at slightly different times along the shoreline, and the MFS is generated later in areas of lower sediment supply (Figure 5). For example, the MFS of the last inter-glacial has already formed in high-input areas of the Gulf of Mexico but has yet to be generated in low-sediment-input areas away from the major rivers (Boyd et al., 1989). In most situations, an MFS is a low diachroneity surface with maximum diachroneity being parallel to depositional strike. Where the MFS is an unconformity, it is an approximate time barrier.
This surface has been called a hiatal surface (Frazier, 1974), a downlap surface (Vail et al., 1977; Van Wagoner et al., 1988), maximum transgressive surface (HellandHansen and Gjelberg, 1994) and a final transgressive surface (Nummedal et al., 1993). I recommend the name maximum flooding surface, which is by far the most commonly used name, for this surface.
The low diachroneity and occasional time barrier property of the MFS make it potentially a very useful surface for correlation and building an approximate time framework as well as for acting as a boundary for specific sequence stratigraphic units. Its usefulness is greatly enhanced by the fact it can usually be reliably identified in outcrop, well sections, and on seismic data.
SLOPE ONLAP SURFACE (SOS)
The slope onlap surface is a surface which has been recorded in the geological literature for a long time but which was not given a specific name until Embry (1995) referred to it as a slope onlap surface (SOS). Embry (2001) included the SOS as one of the six surfaces of sequence stratigraphy. It is a prominent, unconformable surface which is developed in slope environments and is characterized, above all else, by the onlap of strata onto the surface. The strata below the SOS can be either concordant with the SOS without any evidence of scour or erosion or can be clearly scoured and / or truncated. In cases where the SOS is not scoured, the surface is one of starvation onto which younger beds onlap. Where there is scour and loss of section below the SOS, the surface is formed in part by
erosion (gravity collapse, current scour) followed by onlap.
The SOS is best expressed in carbonate strata in a shelf / slope / basin physiographic setting (Figures 6, 7) and is often readily seen in outcrop (Figure 6) and on seismic sections (Schlager, 2005). The SOS forms when carbonate production is greatly reduced due to exposure of the platform (carbonate factory) during base-level fall. When this occurs, most of the slope is starved of sediment. Erosion by margin collapse or by currents can create prominent scarps on the upper slope and feed very coarse sediment down dip where it onlaps the basal portions of the slope. During base-level fall, the slope can be onlapped by prograding siliciclastics as illustrated in Figure 6 or can remain relatively starved, receiving occasional coarse
Figure 6. In this outcrop of an upper Devonian patch reef on northeast Banks Island, shelfal strata occur to the left of the reef and a basin occurs to the right. A prominent slope onlap surface (SOS) occurs basinward of the reef and it is onlapped by prograding siliciclastics. See Embry and Klovan (1971) for a description of the geology of this outcrop.
Figure 7. A schematic diagram showing the interpreted relationship between a slope onlap surface (SOS) and other surfaces of sequence stratigraphy for a carbonate shelf / slope / basin setting. The SOS develops when the shelf (carbonate factory) is exposed and the slope is starved of sediment. Minor sediment input onlaps the basal portion of the slope as a wedge of detached slope deposits. The upper slope is onlapped by shelf-derived sediment deposited during the early phase of transgression.
Figure 8. This schematic diagram, modified from figure 3 of Posamentier and Vail (1988), illustrates the formation and characteristics of a slope onlap surface (SOS) in siliciclastic strata. When the shelf edge is exposed, sediment is funneled down submarine channels and a submarine fan is deposited on the basin plain. Most of the slope becomes starved of sediment at this time. Over time, the fan sediments onlap the slope as the locus of fan sedimentation shifts and deposits build up. The upper part of the SOS is usually onlapped by sediments deposited during the subsequent transgression.
(Continued on page 42...)
Figure 9. A seismically-delineated slope onlap surface (SOS) with onlapping strata clearly apparent. Such strata appear to be deposited during transgression and would equate to the “healing phase wedge” of Posamentier and Allen (1993). The SOS adjoins to an interpreted unconformable shoreline ravinement (SR-U) which truncates underlying deltaic strata. Seismic line from Quaternary succession of the Gulf of Mexico, Desoto Canyon area (modified from Posamentier, 2003).
carbonate sediment. During the following base-level rise, the platform is transgressed, widespread carbonate production resumes, and the remainder of the SOS is onlapped by platform-derived, carbonate sediment. Thus the SOS is usually onlapped by sediments deposited during both baselevel fall and subsequent base-level rise and transgression. This results in the maximum regressive surface (MRS) occurring within the onlapping slope sediments (Figure 7).
In shelf / slope / basin settings for siliciclastics, a slope onlap surface also forms when sea level reaches the shelf edge. At this time, sediment flux to the slope changes from being widely distributed before sea level reaches the shelf edge to being areally restricted and concentrated down submarine channels which develop in front of input centres. Such a concentration of sediment flow results in much of the slope being starved of sediment. Once again this starved slope can remain intact
or can be eroded by currents or submarine landslides. The slope is eventually onlapped by laterally expanding fan deposits (Figure 8) followed by transgressive sediments deposited during the subsequent base level rise (Figure 9).
In some cases, when falling sea level does not reach the shelf edge, a slope onlap surface can develop at the start of transgression when sediment supply to the slope is substantially reduced due to more accommodation space for sediment being available on the shelf and coastal plain. Early in transgression, the water depth of the shelf is shallow enough to allow most sediment to be swept off the shelf as part of the ravinement process. The shelfderived sediment onlaps the slope, forming an onlapping, transgressive wedge, which has been called the “healing phase wedge” by Posamentier and Allen (1993). These authors provide a thorough explanation for the formation of an SOS in such a setting.
In this case the SOS is onlapped only by transgressive sediment and usually shows no evidence of lost section below it.
Notably, an SOS in siliciclastic sediments is usually very difficult to recognize in outcrop because of the difficulty in establishing onlapping relationships in slope lithologies. However seismic data often images the SOS in siliciclastics (Figure 9) and good examples are provided by Greenlee and Moore (1988) and Posamentier and Allen (1999, figures 4.92, 4.93, 4.94). An SOS can also be delineated on detailed log cross-sections (e.g., Posamentier and Chamberlain, 1993).
A slope onlap surface is an unconformity and is a time barrier. All strata below the surface are older than all strata above. In cases where there has been no removal of strata below the SOS, the SOS can be interpreted as representing a preserved depositional slope which was present at the time of the initiation of the SOS. However, in many cases, strata below an SOS are truncated by the SOS with current erosion and / or gravity collapse having removed part of the stratigraphic record. The time span of the onlapping strata can be highly variable and often ranges from part way into base-level fall (regression) to the early part of base-level rise (transgression). In some cases, only transgressive strata onlap the surface.
Curiously, this distinctive surface has not been given any specific names despite its widespread recognition in both carbonate and siliciclastic shelf / slope / basin settings. Given the importance of such a surface for correlation, establishing a chronostratigraphic framework, and bounding sequence stratigraphic units, a name is clearly required if only for adequate communication purposes. Galloway and Sylvia (2002) called slope surfaces on which there was significant erosion slope entrenchment surfaces but such a name does not include the common occurrence of slope onlap unconformities where there has no been no loss of section below the unconformity (only on top of it). I named this surface a slope onlap surface (Embry, 1995) and I would recommend the use of this name, which is descriptive and captures the main features of the surface. The time barrier aspect of the surface makes the SOS an important surface for correlation, chronostratigraphic analysis, and for potentially bounding sequence stratigraphic units.
This article concludes the description of the six, material-based surfaces of sequence stratigraphy. As will be described in subsequent articles, these surfaces are
(Continued on page 40...)
the “workhorses” of sequence stratigraphy and are very useful for building an approximate time correlation framework and for bounding material-based sequence stratigraphic units. Before describing such units and illustrating the application of these surfaces for correlation, it is necessary to discuss two time-based surfaces which some workers advocate as equivalents of the six material-based surfaces. These have been named the “basal surface of forced regression” and the “correlative conformity” and they will be discussed in next month’s article.
R EFERENCES
Allen, G., Lang, S., Musakti, O., and Chirinos, A. 1996. Application of sequence stratigraphy in continental successions: implications or Mesozoic cratonic basins of eastern Australia. Geological Society of Australia, Mesozoic Geology of the Eastern Australian Plate. Brisbane, September, 1996. p. 22 -27.
Boyd, R, Suter, J., and Penland, S. 1989. Sequence Stratigraphy of the Mississippi Delta. Gulf Coast Association of Geological Societies Transactions, v. 39, p. 331-340.
Cross, T.A. and Lessenger, M. 1998. Sediment volume portioning: rationale for stratigraphic
model evaluation and high resolution stratigraphic correlation. In: Predictive high resolution sequence stratigraphy. K. Sandvik, F. Gradstein, and N.Milton (eds.). Norwegian Petroleum Society Special Publication 8, p.171195.
Embry, A.F. 1995. Sequence boundaries and sequence hierarchies: problems and proposals, In: Sequence stratigraphy on the northwest European margin. R.J. Steel, F.L. Felt, E.P. Johannessen, and C. Mathieu (eds). NPF Special Publication 5, p. 1-11.
Embry, A. 2001. The six surfaces of sequence stratigraphy. AAPG Hedberg Conference on sequence stratigraphic and allostratigraphic principles and concepts, Dallas. Abstract volume, p. 26–27. http://www.searchanddiscovery.net/ documents/abstracts/2001hedberg_dallas/ embry03.pdf.
Embry, A. and Klovan, E. 1971. A Late Devonian reef tract on northeastern Banks Island, NWT. Bulletin of Canadian Petroleum Geology, v. 19, p. 730-781.
Forgotson, J. 1957. Nature, Usage, and Definition of Marker-Defined Vertically Segregated Rock Units. Geological Notes. AAPG Bulletin, v. 41, p. 2108-2113.
Frazier, D. 1974. Depositional episodes: their relationship to the Quaternary stratigraphic framework in the northwestern portion of the Gulf Basin. Bureau of Economic Geology, University of Texas, Geological Circular 74-1, 26 p.
Helland-Hansen, W. and Gjelberg, J. 1994. Conceptual basis and variability in sequence stratigraphy: a different perspective. Sedimentary Geology, v. 92, p. 1-52.
Galloway, W.E. and Sylvia, D.A. 2002. The many faces of erosion: theory meets data in sequence stratigraphic analysis. In: Sequence stratigraphic models for exploration and production. J. Armentrout and N. Rosen (eds.). Gulf Coast SEPM Conference Proceedings, Houston, p. 99-111.
Greenlee, S. and Moore, T. 1988. Recognition and interpretation of depositional sequences and calculation of sea-level changes from stratigraphic data – offshore New Jersey and Alabama. In: Sea level changes: an integrated approach. C. Wilgus, B.S. Hastings, C.G. Kendall, H.W. Posamentier, C.A. Ross, and J.C. Van Wagoner (eds.). SEPM Special Publication 42, p. 329-353.
Hamilton, D., and Tadros, N. 1994. Utility of coal seams as genetic stratigraphic sequence
Loring Tarcore Labs
boundaries in nonmarine basins: an example from the Gunnedah Basin. AAPG Bulletin, v. 78, p. 267-286.
Loutit, T., Hardenbol, P., Vail, P., and Baum, G. 1988. Condensed sections: the key to age dating and correlation of continental margin sequences. In: Sea level changes: an integrated approach. C. Wilgus, B.S. Hastings, C.G. Kendall, H.W. Posamentier, C.A. Ross, and J.C. Van Wagoner (eds.). SEPM Special Publication 42, p. 183-216.
Nummedal, D., Riley, G., and Templet, P. 1993. High resolution sequence architecture: a chronostratigraphic model based on equilibrium profile studies. In: Sequence stratigraphy and facies association. H. Posamentier, C. Summerhayes, B. Haq, and G. Allen (eds.). International Association of Sedimentologists, Special Publication 18, p. 55-68.
Oliver, T. and Cowper, N. 1963. Depositional environments of the Ireton formation, Central Alberta. Bulletin of Canadian Petroleum Geology, v. 11, p. 183-202.
Plint, G., McCarthy, P., and Faccini, U. 2001. Nonmarine sequence stratigraphy: updip expression of sequence boundaries and systems tracts in a high resolution framework,
Cenomanian Dunvegan Formation, Alberta foreland basin, Canada. AAPG Bulletin, v. 85, p. 1967-2001.
Posamentier, H. 2003. A linked shelf-edge delta and slope-channel turbidite system: 3d seismic case study from the eastern Gulf of Mexico. In: Shelf margin deltas and linked down slope petroleum systems. H. Roberts, N. Rosen, R. Fillon, and J. Anderson (eds.). Proceedings of the 23rd GCSSEM conference, p. 115-134.
Posamentier, H. and Vail, P. 1988. Eustatic controls on clastic deposition II – sequence and systems tract models, In: Sea level changes: an integrated approach. C. Wilgus, B.S. Hastings, C.G. Kendall, H.W. Posamentier, C.A. Ross, and J.C. Van Wagoner (eds.). SEPM Special Publication 42, p. 125-154.
Posamentier, H. and Chamberlain, C. 1993. Sequence stratigraphic analysis of Viking Formation lowstand beach deposits at Joarcam Field, Alberta, Canada. In: Sequence stratigraphy and facies association. H. Posamentier, C. Summerhayes, B. Haq, and G. Allen (eds.). International Association of Sedimentologists, Special Publication 18, p. 469-485.
Posamentier, H. and Allen, G. 1993., Variability of the sequence stratigraphic model: effects of
local basin factors. Sedimentary geology, v. 86, p. 91-109.
Posamentier, H. and Allen, G. 1999. Siliciclastic sequence stratigraphy – concepts and applications. SEPM Concepts in Sedimentology and Paleontology, no. 7, 210 p.
Schlager, W. 2005. Carbonate sedimentology and sequence stratigraphy. SEPM Concepts in Sedimentology and Paleontology 8, 200 p.
Vail, P. et al. 1977. Seismic stratigraphy and global changes in sea level. In: Seismic stratigraphy: applications to hydrocarbon exploration. Payton, C. (ed.). AAPG Memoir 26, p. 49-212.
Van Wagoner, J.C., Posamentier, H.W., Mitchum, R.M., Vail, P.R., Sarg, J.F., Loutit, T.S., and Hardenbol, J. 1988. An overview of the fundamentals of sequence stratigraphy and key definitions, In: Sea level changes: an integrated approach. C. Wilgus, B.S. Hastings, C.G. Kendall, H.W. Posamentier, C.A. Ross, and J.C. Van Wagoner (eds.). SEPM Special Publication 42, p. 39-46.
Van Wagoner, J.C., Mitchum, R.M., Campion, K.M., and Rahmanian, V.D. 1990. Siliciclastic sequence stratigraphy in well logs, cores and outcrops. AAPG Methods in Exploration, no. 7, 55 p.
STUDIES TO E XPLORATION AND E XPLOITATION OF U NCONVENTIONAL PLAy S IN NORTH A MERICA . Part 1: The Peace River Arch
| by Dr. Zeev Berger*, Michelle Boast, and Martin Mushayandebvu, Image Interpretation Technologies Ltd. *corresponding author: zeev@iitech.ca, michelle@iitech.ca, martin@iitech.ca
INTRODUCTION
The emergence of unconventional plays in North America provided us with the opportunity to critically review high-resolution aeromagnetic (HRAM) studies of several mature basins in the USA and Canada. The results of these studies have been compiled onto a series of structural/tectonic maps that are designed to illustrate the relationships between basement structures and the
presence of “sweet spots” and “preferred trends” within these unconventional plays. In a series of short articles, to be presented in the CSPG Reservoir (for Canadian examples) and the AAPG Explorer (for USA examples), we will attempt to provide the readers with a brief overview of the use of HRAM data and present some intriguing results of our work in both Canada and the USA.
THE
TECTONIC
MAP OF THE PEACE RIVER ARCH AREA
Figure 1 shows a new tectonic map of the Peace River Arch area based upon the interpretation of HRAM data. This area contains many well defined basementrelated and detached geological structures that exhibit a wide range of depths, styles, and magnitudes of deformation. Many of these structures control the location of key oil and gas fields which have been well mapped and documented (e.g., Monias [Norgard, 1997], Parkland [Packard et al., 2001], Tangent [Stoakes, 1997], and Blueberry [Durocher and Al-Aasm, 1997]). These fields can be used to constrain the new tectonic/structural map.
The Peace River Arch is covered by an excellent selection of HRAM surveys, 2D and 3D seismic coverage, well information, and remote-sensing data which were made available to us by different vendors and clients. The area contains several emerging unconventional plays that are clearly controlled by basement structures. These plays include: Devonian and Mississippian hydrothermal dolomite (HTD) in northeast British Columbia (Davies and Smith, 2006; Davies, 2001); the Triassic Montney and Doig resource plays south of the Fort St. John (FSJ) graben (Canadian Discovery Ltd., 2007); the HTD Banff play along the southern Fringing Reef of the Peace River Arch; and the Granite Wash-like play of the Puskwaskau and Beaverhill Lake formations, which is being developed off the southern flanks of the Peace River Arch (Canadian Discovery Ltd., 2008).
Major fault systems in the Peace River Arch area can be divided into three main categories. The first category consists of deep-seated basement faults (Figure 1: mapped in red) which may follow major terrain boundaries (e.g., the Hay River Shear Zone) or develop along major basement features within the same basement terrain (e.g., the Rycroft and Dunvegan faults). On the Arch, these faults can exhibit significant structural relief whereas off the Arch these
Figure 1. Tectonic map of the Peace River Arch and northeast British Columbia. The map is based on integrated analysis of HRAM data with seismic and well data. Major pools which are somewhat controlled by basement structures are also shown. The map was highly generalized for illustration purposes.
faults can be very subtle and difficult to detect on seismic data.
The second category consists of a series of faults that exhibit the structural style of divergent wrench fault systems (Harding et al., 1985) and are mapped in purple in Figure 1. These faults cut across the basement grain and consist of typical “pull-apart” basins, asymmetrical graben features, and weakly developed “failed arm” features. We postulate that these faults represent an old Proterozoic rift system which was reactivated during Paleozoic time. This process of reactivation culminated during the Mississippian collapse of the Peace River Arch and the formation of the Fort St. John Graben. These faults, which are known to be the primary cause of HTD reservoir (Davies and Smith, 2006), also continued to be active during Triassic time, exerting significant control on the development of major fields in the Halfway, Doig, Boundary Lake, and Montney formations.
The third category consists of relatively young and shallow faults that were formed during the development of the thrust belt and the adjacent foreland basin (Figure 1 –shown in green). In the foreland basin area, these fault systems consists of relatively long, arcuate, down-to-the-basin, normal faults that often cut and offset the magnetic basement grain at oblique angles. Closer to the mountain front, these faults are often overridden by shallow, buried thrust faults which are manifested as a series of highfrequency sinuous magnetic features that often reflect the leading edge of a shallow thrust plate.
THE ADVANTAGES OF USING HRAM DATA IN THE MUSK wA-KECHIKA AREA
High-resolution aeromagnetic surveys are usually collected using airplanes or helicopters flying at a constant elevation above the ground (i.e., draping as close as possible over the terrain). Fixed-wing airplane surveys are usually flown at 125-150 meters above the ground, while helicopters, which are used to collect data over extremely rugged terrains, can lower their sensors to less than 50 meters above the ground. Most HRAM surveys are collected with a flight line spacing of 200–800 meters and tie line spacing of 600–2400 meters. The increased resolution of HRAM data improves the imaging of the basement structures, and also provides information on shallow sedimentary structures which can be buried or obscured by thick cover of soil and vegetation.
The improved structural mapping capabilities
of HRAM data, as opposed to regional magnetic surveys, are illustrated here with an example from the Muskwa-Kechika area of north east British Colombia (Figure 2). In this area, the magnetic data suggest the presence of a major “pull-apart” basin with a southwestern arm that forms the Laurier Embayment and a northward-extending arm. Several other HTD-related gas fields such as Bubbles (Slave Point), Pocket Knife, and Sikanni Chief (Debolt) are also located along the faulted margins of this structural element. As illustrated, the proposed “pull-apart” basin can be observed on low-resolution Geological Survey of Canada
magnetic data but the faulted margins of this important feature are better defined with 800 meter HRAM data that were recently flown in this area. The HRAM data also contain high-frequency linear features that reflect the presence of shallow folds and thrust faults as well as small-scale cross faults that cannot be observed with conventional low resolution magnetic surveys (b and c in Figure 2D).
BASEMENT CONTROL OF THE DOIG FORMATION ALONG THE HAy RIVER SHEAR ZONE
The Hay River Shear Zone appears on (Continued on page 44...)
customsolution
There is no wrong answer.
At Divestco, we understand what it means to be a customer. You like to be able to depend on a service provider to act in your best interests, give you exactly what you need, and only what you want. Divestco’s integrated offering for geological professionals gives you the ability to choose from a wide range of geological products and services to suit your unique needs. Pick anything you want, choose a bundled offer or let our experts create a custom solution for you.
Call Jennifer Davies at 403.537.9904 or email jennifer.davies@divestco.com for more information. Take your pick
Figure 2. Magnetic images and structural cartoon of the Muskwa-Kechika and Sikanni Chief area showing the spatial relationships between the faulted margin of a major “pullapart” basin (“a” in figures 2A, B, and C) and HTD-related gas pools. Figure 2A shows residual HRAM data padded with residual low-resolution Geological Survey of Canada (GSC) data while Figure 2B only shows GSC data for the same map window. Figures 2A and 2B demonstrate the improvement in structural mapping capabilities of HRAM data as opposed to the free, low-resolution, GSC data. Figure 2C is a schematic model of a divergent wrench-related “pull-apart’ basin which is quite reminiscent of the feature shown in the magnetic data (courtesy of Graham Davies). Figure 2D illustrates the magnetic expressions of near-surface structures: “b” represents shallow folds and thrust faults and “c” are small-scale cross faults.
(...Continued from page 43)
HRAM data as a profound linear feature that reflects a major lithological boundary in the basement (Figure 3A) (Ross et al., 1994). The shear zone is cut and offset by several cross faults that separate the fault zone into several distinctive basement blocks and associated graben features. The seismic data across this fault, however, show very little displacement suggesting that it has not been significantly active either during or after the
deposition of the sedimentary section above (Figures 3B and 3C).
However, basement block features, such as the “Buick Creek Block” appear to exert significant control on the development of known Doig gas pools in this area. In most cases, these pools are located along the faulted margins of the basement block suggesting that basement topography and / or structure exerted control on
the development of “sweet spots” or “preferred trends” in this area. In fact, these relationships between basement features and the presence of major oil and gas fields can be demonstrated for many of the Triassic discoveries in this region including the newly developed Montney resource play.
BASEMENT CONTROL OF THE NE w Ly DISCOVERED POOLS IN THE
3. An HRAM image of the Hay River Shear zone shows the relationship between deep-seated basement faults and the location of key Doig pools. The seismic expression of the Hay River Shear Zone is illustrated in Figures 3B and 3C.
Figure 4. A magnetic image showing a section of the southern edge of the Peace River Arch (Figure 4A) and the accompanying interpretation map (Figure 4B). These figures illustrate the development of a new HTD play in the Banff Formation. This play is clearly developed at the intersection of major faults that can be mapped with low resolution GSC magnetic data. Structural leads are highlighted in green; Kakut and Puskwaskau are in blue.
SOUTHERN PART OF THE PEACE RIVER ARCH
The structural fabric of the crest of the Peace River Arch is dominated by the presence of several major northwest- trending fault systems which produce profound expressions on magnetic data. Many of these faults control the location of major hydrocarbon pools including the giant Dunvegan field (Debolt) as well as several HTD-related Wabamun pools such as Teepee, Eaglesham, and Tangent
(e.g., Davies 1997). Recently discovered Kakut and Puskwaskau fields suggest that these and other basement faults may have also led to the development of HTD reservoirs in the Banff Formation (Figure 4A and B). As illustrated, the new Banff discoveries are located along northwest and easterly trending faults that produce profound linear expressions on magnetic images. In fact, several of these faults have not been tested and can be considered potential leads for this play.
The major basement-related fault systems that produce profound expressions on magnetic data which affected the Banff Formation also appear to control the location of the recent discoveries made in the Puskwaskau and Beaverhill Lake formations (Canadian Discovery Ltd., 2007 and 2008). Figure 5A and B expands the coverage, seen in Figure 4, further south into the faulted edge of the Peace River Arch. This figure shows that the (Continued on page 46...)
Figure
5.
an expanded coverage (of that seen in Figure 4) of the southern edge of the Peace River Arch (Figure 5A) and the accompanying interpretation map (Figure 5B). These figures show that newly discovered pools of the Beaverhill Lake formation are developed along the downthrown side of major basement faults. Two known fields are located along the intersection of major faults (shown in pink). Leads with a similar structural setting are highlighted in red.
(...Continued from page 45)
Galleon, Hunt, and Duvernay discoveries in Township 72, Range 26 are located at the intersection of two major faults. The first fault is a northwest-trending fault that can be extended to the Banff-Puskwaskau field. The second is a major northeast-trending fault that appears to have a significant drop in basement relief to the south. We postulate that the intersection of these two major faults produced a large topographic depression which was later filled with detrital sediments. The McLean’s Creek field to the west also appears to be located along a major northwest trending basement fault. The strong relationships between basement structures and the position of the known fields direct us to propose several new leads in this area.
CLOSING REMARKS
The control of basement structures on the development of hydrocarbon plays is a longstanding concept in exploration geology. The mechanisms that lead to the propagation of basement structures and topography to the sedimentary section have been well documented and are usually attributed to structural reactivation and differential compaction processes (Berger, 1994). yet, these concepts always remain vague and intuitive because basement features have been very hard to map at the same structural level as the sedimentary features above.
The availability of HRAM data helped us breach the gap mentioned above. HRAM images can often provide structural information that can be correlated with seismic and well data. Therefore, integrating HRAM surveys into exploration programs of mature and frontier basins is gradually gaining recognition. We
hope that the examples presented in this article have demonstrated the important role that HRAM surveys can play in exploration and exploitation of unconventional plays.
REFERENCES AND SELECTED BIBLIOGRAPH y
Berger, Z. 1994. Satellite hydrocarbon exploration: Interpretation and integration techniques, SpringerVerlag Berlin Heidelberg, New York, 319 p.
Barclay, J.E., Krause, F.F., Campbell, R.I., Utting, J. 1990. Dynamic casting and growth faulting: Dawson Creek Graben Complex, CarboniferousPermian Peace River Embayment, Western Canada. In: Geology of the Peace River Arch, S.C. O’Connell and J, S. Bell (eds). Bulletin of Canadian Petroleum Geology, v. 38a, p. 115–145.
Canadian Discovery Ltd. 2007. Puskwaskau –Beaverhill Lake Sand Oil, Alberta T71, R26W5. Canadian Society of Petroleum Geologists. The Reservoir. v. 34, Issue 2, p. 33–36.
Canadian Discovery Ltd. 2008. The Doig Formation in Peace River Country. Canadian Society of Petroleum Geologists. The Reservoir. v. 35, Issue 7, p. 32–35.
Cant, D.J. 1988. Regional structure and development of the Peace River Arch, Alberta: A Paleozoic failed-rift system? Bulletin of Canadian Petroleum Geology, v. 36, p. 284–295.
Davies, G.R. 1997. The Triassic of the Western Canada Sedimentary Basin; tectonic and stratigraphic framework, paleogeography, paleoclimate, and Biota. CSPG. Bulletin of Canadian Petroleum Geology, v. 45, no. 4, p. 434–460
Davies, G.R. 2001. Hydrothermal dolomite (HTD) reservoir facies with related shale-hosted
SEDEX Pb-Zn and dolomite hosted MVT PbZn ore deposits also showing extension-related paleozoic igneous intrusive/extrusives. Fourth edition. Graham Davies Geological Consultants Ltd, Calgary. Map.
Davies, G.R. and Smith, L.B. 2006. Structurally controlled hydrothermal dolomite reservoir facies; an overview. In: Structurally controlled hydrothermal alteration of carbonate reservoirs, AAPG Bulletin, v. 90, no. 11, p. 1641–1690.
Dix, G.R., Barclay, J.E., and O’Connell, S.C. 1990. The origin, history, and regional structural development of the Peace River Arch, Western Canada. CSPG Bulletin of Canadian Petroleum Geology. v. 38a, p. 4–24.
Durocher, S. and Al-Aasm, I.S. 1997. Dolomitization and neomorphism of Mississippian (Visean) upper Debolt Formation, Blueberry Field, northeastern British Columbia; geologic, petrologic, and chemical evidence. AAPG Bulletin, v. 81, p. 954 - 977.
Harding, T.P., Verbuchen, R.C., and ChristieBlick, N. 1985. Structural styles, plate tectonic settings and hydrocarbon traps of divergent (transtensional) wrench faults. In: Strike-slip deformation, basin formation and sedimentation, K.T. Biddle and N.H. Christie-Blick (eds.), Society of Economic Paleontologists and Mineralogists Special Publication, v. 37, p. 51–77.
Mushayandebvu, M.F., van Driel, P., Reid, A.B., and Fairhead, J.D. 2001. Magnetic source parameters of two-dimensional structures using extended Euler deconvolution, GEOPHYSICS, Soc. of Expl. Geophys., v. 66, p. 814-823.
Norgard, G. 1997. Structural inversion of the middle Triassic Halfway Formation, Monias field,
Figure
A magnetic image showing
northern British Columbia. CSPG Bulletin of Canadian Petroleum Geology, v. 45, no. 4, p. 614–623.
O’Connell, S.C., Dix, G.R., and Barclay, J.E. 1990. The origin, history, and regional structural development of the Peace River Arch western Canada. CSPG Bulletin of Canadian Petroleum Geology, v. 38a, p.4–24.
Packard, J.J., Al-Aasm, I., Samson, I., Berger, Z., and Davies, J. 2001. A Devonian hydrothermal chert reservoir: the 225 bcf Parkland field, British Columbia, Canada. AAPG Bulletin, v. 85, no. 1, p. 51–84.
ROCK SHOP
Packard, J.J., and Pellegrin, G. 1989. Diagenesis and dolomitization associated with hydrothermal karst in Fammenian Upper Wabamun ramp sediments, northwest Alberta. In: The development of porosity in carbonate reservoirs, G.R. Bloy, M.G. Hadley, and B.V. Curtis (eds.), Canadian Society of Petroleum Geologists, Calgary. Continuing education short course notes, Section 8. Ross, G.M., Broome, J., and Miles, W. 1994. Potential fields and basement structure Western Canada Sedimentary Basin. In: Geological Atlas of the Western Canada Sedimentary Basin, G.D. Mossop and I. Shetsen (compilers), Calgary, Canadian Society of Petroleum Geologists and
Alberta Research Council, p. 41–48.
Stoakes, F.A. 1997. Fault controlled dolomitization of the Wabamun Group, Tangent Field, Peace River Arch, Alberta. In: Devonian lithofacies and reservoir styles, Alberta. F.F. Krause and O.G. Burrows (eds.) Canadian Society of Petroleum Geologists Core Conference, Canadian Society of Petroleum Geologists, Calgary. p. 73–85.
Zhang, C., Mushayandebvu, M. F., Reid, A. B., Fairhead, J. D., and Odegard, M. E. 2000. Euler deconvolution of gravity tensor gradient data, Geophysics, Soc. of Expl. Geophys., v. 65, p. 512-520.
2008 A NNUAL CSPG 10k Road Race and 5K Fun Run
The annual CSPG Road Race and Fun Run was held on Wednesday, September 10, 2008. The evening turned out to be ideal running weather and the 177 runners bolted from the start with enthusiasm. This year marked the introduction of the five kilometer event, which was received positively, and chip timing, which made volunteering at the finish line much easier. As well, the course had unique distance markers that were based on geologic time.
As in years past, we had a mix of competitive runners and first-time runners and from comments overheard at the finish line, it was a good experience for all. The postrace social was held at Quincy’s and the crowd consumed a large number of pizzas and copious amounts of beer. The evening finished with door prizes, awards, and of course the infamous “sock toss.”
For the first time we reached our capacity of
200 runners and membership participation was up. So register early next year, to avoid disappointment. Another first was that the high participation in this year’s race in combination with record sponsorship allowed us to contribute over $3,000 to the CSPG Trust and $500 to the Strong Kids Foundation.
I would like to thank all the volunteers and sponsors who helped make this event a success. Thank you also to all the runners – it was a pleasure cheering you in at the finish line.
OUR SPONSORS Th IS ye AR We Re: Pl ATINUM : CGGVeritas, IHS, geoLOGIC systems ltd. and Gord’s Running Store;
(Continued on page 50...)
And they’re off.
Curtis Sampson, the overall winner of the 10 kilometre event.
Francois Tremblay, winner 1st place in the 10 kilometre CSPG category.
(...Continued from page 48)
GOlD :
Earth Signal Processing, Tucker Wireline Services, Paradigm, Paramount Energy Trust, and Total E&P Canada;
S I lve R :
Duvernay Oil Corp, Divestco, Weatherford, Devon, Apoterra Seismic Processing, Arcis, Regent Resources, GEDCO, and Sensor Geophysical; and
BRONZe:
Edge Technologies, Continental Laboratories, Belloy Petroleum, Key Seismic Solutions, AGAT Laboratories, and Statcom Ltd. I would also like to thank the staff at the Eau Claire yMCA.
Finally a huge thank-you to the group of people on the committee that helped me this year: Stuart Mitchell, Matt Hall, Kathy Taerum, Kathy Waters, Mike Cardell, Greg Hayden, Cindy Koo, and Alyssa Middleton and Dayna Rhoads from the CSPG office.
For more information on run times and placement, please see www.roadrunners. com.
We look forward to seeing you next year for our 21th event; the race date is September 16, 2009. As always we welcome new volunteers to the Committee. If you are interested in being part of this fun team, please contact the 2009 Road Race Chair, Mike Cardell at cardell1@slb.com.
2008 MIXED GOLF TOURNAMENT
| by David Middleton and David Caldwell. Mixed Golf Tournament Co-Chairs
The 19th Annual CSPG Mixed Golf Tournament was held at Lynx Ridge Golf Course on August 21th, 2008. The 136 golfer shotgun best-ball tournament started with cool temperatures and grey, threatening skies, intermittent drizzle, but sunny skies and warm temperatures did appear sporadically through the day. Lynx Ridge was a new venue for our tournament, and was in great shape. Once again, we had a full tournament, with several disappointed golfers on the wait listing.
The tournament committee consisted of David Middleton and David Caldwell as co-chairs, Darin Brazel, Penny Christensen, Carter Clarkson, Norm Hopkins, Brenda Pearson, Hugh Wishart, and Dick Willott as volunteers on the committee, and corporate relations support by Alyssa Middleton in the CSPG office, and on-line registration supported by Dayna Rhoads of Membership Services.
FMA Insurance was our platinum sponsor, and sponsored the carts for all golfers, which was gratefully appreciated. We would also like to thank our various sponsors and donors at all levels for making the tournament an
outstanding success, helping provide a sense of community among the CSPG members and service partners.
Our gold sponsors this year were Baker Atlas, GLJ Petroleum Consultants Ltd., RECON Petrotechnologies, Tucker Wireline Services, and Weatherford Canada Partnership. Silver sponsors were AGAT Laboratories Ltd., Bodycote Testing Group, IHS, LogTech (Canada) Ltd., and Schlumberger. The following companies stepped forward as hole sponsors to support the tournament, Belloy Petroleum Consulting, DeGolyer & MacNaughton Canada, Core Laboratories, RPS Energy, Boyd PetroSearch, Sproule Associates, geoLogic, ProGeo Consultants, CL Consultants, Scope Wellsite Security, Irelands Field Scouting, Fugro Airborne Surveys, RigSkills Canada, MJ Systems, FirstEnergy Capital, and Geotir.
The tournament committee believes in supporting the CSPG Trust, and to raise funds for the “Geoscientists for the future” campaign, we had two events during the tournament. The mulligan tickets had several
Advanced Geosteering Solutions
very nice prizes awarded for a $20 entry fee, and Larry Bruch was the very happy winner of the 50/50 draw, with the net proceeds of $2,980 being donated to the CSPG Trust.
Golfers began the day with breakfast, and a chance to warm up on the practice range. The course hosted several hospitality tents, and opportunity to participate in many skill challenges, including closest to the pin competitions, long drives for male and female golfers, and careful placement of the ball into water and sand traps. Our sponsors were recognized by copious signage on course, in the dining and breakfast areas, and on the road into the course, and our premier sponsors had the opportunity to put up a banner on the clubhouse.
The trophy for Low Gross was won by the team of Mike Bell, Rex Brigan, Leanne Ewashen, and Carlee Bard with a score of 64. The Low Net trophy was captured by the team of Bob Sullivan, Colin Frostad, David Middleton, and Jessica Duke with a score of 54.1. The High Gross was won with a score of 77 by the team of Dean Anderson, Steve Peach, Geoff Anderson, and Brenda Barkley.
The on-course hospitality venues were hosted by IHS Energy, Recon PetroTechnologies, AGAT Laboratories and Baker Atlas, and the halfway house / cart drink sponsor was GLJ Petroleum Consultants. Once again, Tucker Wireline sponsored the putting contest, which occurred after the tournament, and luckily prior to the rainstorm. The putting contest winner took home a Tucker Popcorn wagon, and other contestants in the putting had a chance to win a very nice bottle of wine. Sproule Associates donated a very nice gift certificate to Nevada Bob’s Golf, and Hycal Energy Research Lab donated a substantial gift certificate to Future Shop. Many others donated prizes to the tournament, and their support was greatly appreciated.
We look forward to seeing everyone next year at the 20th Annual tournament, which is tentatively scheduled for August 20th, 2009, at Lynx Ridge golf course. Watch for announcements in the Reservoir, in the enewsletter, and at the Technical Luncheons.
Thanks to all the committee members for their hard work and support of the tournament. I know the members and guests who attended had a great time and appreciated the fellowship on the course and the various hospitality venues.
19th Annual CSPG Mixed Golf Tournament
The CSPG and tournament participants would like to thank:
MAIN SPONSOR
GOLD SPONSORS
TOURNAMENT SPONSORS
Belloy Petroleum Consulting Ltd.
Boyd PetroSearch
CL Consultants Limited
Core Laboratories Canada Ltd.
GeoTir Inc.
Ireland’s Field Scouting Services
MJ Systems Ltd.
Pro Geo Consultants
DeGolyer and MacNaughton Canada Limited
FirstEnergy Capital Corp.
Fugro Airborne Surveys
GEDCO
geoLOGIC systems ltd.
SILVER SPONSORS
RigSkills Canada
Riley’s Reproductions & Printing
RPS Energy
Scope Wellsite Security Ltd.
Sproule
PRIZE DONORS
Command Equipment
DeGolyer and MacNaughton Canada Limited
Edge Technologies
Fekete Associates Inc.
Genesis
Hycal Energy Research Laboratories Ltd.
MD Totco
Reinson Consultants
EXECUTIVE SUMMARy
| by Colin Yeo
Each month, the Reservoir will summarize the CSPG Executive Committee meetings that are usually held the last Thursday of each month except for July. These meetings are open for all members to observe but the reality is few of us have the time to attend. In an effort to keep all members apprised of on-going Society events, this column will present a synopsis of the meeting and decisions made on your behalf. If you have any concerns, you can contact any member of the Executive. Contact information is found on page 5.
The focus of the August 28, 2008 Executive meeting was twofold: the monthly financial review and the 2009 Budget Review.
We very carefully reviewed the July budget report as we are approaching our fiscal year end of August 31. This lookback is designed to measure our performance on revenue generation and cost control over the past year so that we can apply key learnings to the 2009 budget.
Corporate Relations was off due to reduced
revenue and increased expenses from prior period adjustments. Office and staff expenses were higher that expected. Membership has been down throughout the year and never recovered. Revenue expectations were not met in some Communication initiatives. However, our Programs have done very well by delivering high quality technical content within budget. Overall, we are expecting a balanced budget but there is room for forecasting improvement next year.
We then turned our attention to discussing the 2009 budget. We focused on four key areas of social event budgets, an awards banquet, Outreach funding from the Trust, and staffing issues.
The Executive discussed how much profit a social event should be expected to make given that it is a Society event and an opportunity for networking. Concern was expressed that these events have large budgets, and a slight problem on the revenue side could put an event into a deficit position, resulting in a liability on the Society. In the end, the
Hardrock Seismic Imaging
Experience in Hardrock Applications
• 2D & 3D Processing
• Multicomponent (3C) Processing
• Fracture Detection Analysis
• Projects completed for Mining Companies & Government Agencies
budget was left as recommended with the expectation that organizers will continue to closely monitor and correct any deficiencies.
The Executive continues to search for the best venue to honour our award recipients. We have gone away from the awards gala concept to making presentations at Technical Luncheons but we are still not satisfied that we properly honoring our winners and recognizing our sponsors. We have set aside more money for a different event but we have not worked out the details yet.
Our Outreach budget is very large and we require a significant financial contribution from The Trust. Because The Trust is legally separate and independent of the CSPG, we cannot simply take money to run the programs. The Trust decides when and how much to give us. The Executive feels strongly that our historic and preeminent Outreach activities must go on despite potential funding shortfalls from The Trust. The Executive has prioritized these activities and will have to suspend or drop some if we are to run a balanced budget. The solution, of course, is to work very closely with The Trust and ensure that funding requirements are clearly known and agreed to prior to conducting the activity.
Staff support is essential to many of the products that the Society delivers to you. We cannot manufacture the Reservoir and Bulletin without help; we cannot raise the sponsorship, advertising, and exhibitor revenue we do without dedicated, focused, and skilled corporate relations people. Membership, financial management, and front line staff are needed to make sure you get the services you expect from the Society. As volunteers are forced to limit their time commitment to the CSPG, we download tasks onto the office staff to the point where they cannot accomplish everything that is asked of them. There are two solutions; hire more help or don’t do certain things. The Executive is now reviewing its options to ensure members are best served within budgetary constraints.
The Executive voted to approve the 2009 budget that has us making a very small surplus. There is much work to do addressing the four areas mentioned and that will be part of the new Executive’s mandate.
Seeing is believing!
Are you faced with difficult interpretation challenges?
� Would you give this zone a second look?
The Triple-combo logs (left side) show no clear indication this zone contains hydrocarbons.
� What if you could “see” the fluids contained in this zone to identify fluid type and quantity?
Now you can! The 2D NMR images from the MR ExplorerSM (MREXSM) service in tracks 4 & 5 identify gas condensate in this zone.
� Does it contain commercial quantities of hydrocarbon?
The fluid volumetrics measured by the MREX service (in track 6) indicate commercial quantities of hydrocarbon are present in this interval. This was confirmed by formation tests using the Baker Atlas Reservoir Characterization InstrumentSM (RCISM) service.
Image the fluids and know for sure.
The MREX service from Baker Atlas makes direct measurements of fluid type and volume.
2D NMR imaging enables you to “see” the fluids to ensure all potential hydrocarbon zones are identified for maximum recovery on every well.
For direct measurements of reservoir fluid type and volume, contact Baker Atlas today.
Baker Atlas
Baker Hughes years of service
We know that almost everyone who tries geoSCOUT™ wants to use geoSCOUT. So, why hasn’t everyone already switched to geoSCOUT? Probably because, in general, people don’t like change. But, in this case we’ve got you covered, so change is good – very, very good.
Just ask the thousands of landmen, engineers & geologists currently using geoSCOUT oil and gas mapping and analysis software to make solid decisions every day. Give us an hour for a demo – we know you’ll see the value. Call 403.262.1992 | Email info@geoscout.com | Online www.geoscout.com/demo
Another powerful suite of tools from geoLOGIC industry-leading customer service easy & efficient migration of existing data helping clients increase productivity