Define Reservoir Parameters with Confidence
Looking to maximize opportunities in today’s volatile market?
Combine the power of PETRA® and IHS Critical Information including well and log data to define reservoir parameters and determine new opportunities faster and more cost effectively.
Let IHS information solutions improve your decision-making and reduce your risk.
For more information on PETRA visit us at www.ihs.com/reservoirsolutions


(Assistant Editor) Tarheel Exploration EnCana Corporation Tel: 403-277-4496 Tel: 403-645-7724
Email: bjmck@telusplanet.net Email: colin.yeo@encana.com
Coordinating Editor
Heather Tyminski, Comunications and Public Affairs, CSPG Tel: 403-513-1227, Email: heather.tyminski@cspg.org
ADVERTISING
Advertising inquiries should be directed to Alyssa Middleton, Tel: 403-513-1233, email: alyssa.middleton@cspg.org. The deadline to reserve advertising space is the 23rd day of the month, two months prior to issue date.
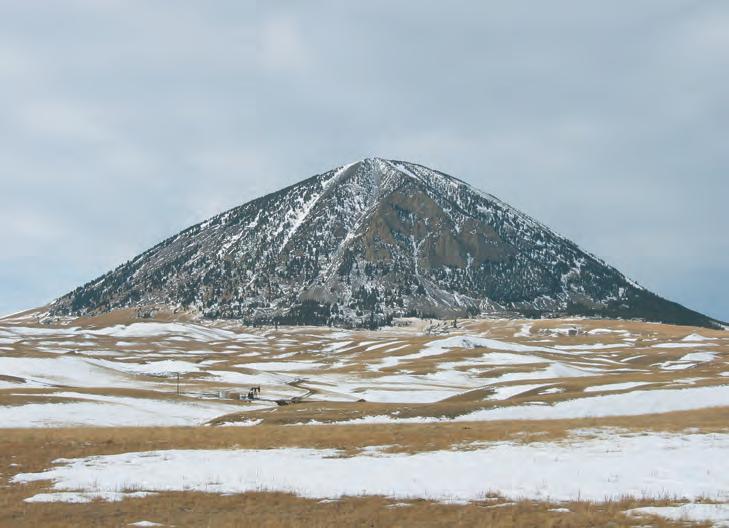
FRONT COVER
West Butte, Sweetgrass Hills, Montana. The pump jack producing oil from the Sunburst Formation is dwarfed by the Diorite Porphyry Intrusive of West Butte, which rises over 3,000 vertical feet from the surrounding plains.
Photo by Wayne Laturnas.
Teamwork Pays
At APEGGA we know and understand that we live and practice in a complex world. The heavy lifting in the resource extraction industries, and in the environmental industry, is done by teams, often led by Professional Geoscientists. These teams include professionals, technologists and support staff both at headquarters in the city and at camp in the field.
There’s no question in our minds that geoscience projects require teams to manage questions surrounding the many varied issues including governance, tax impact, reporting and environmental concerns including land-use and ground disturbance. Through consultation and communication, all these issues, and a multitude of others, are resolved to ensure the projects we work on benefit society. The Geoscience Professionals’ code of ethics and paramount responsibility to protect public safety and well-being must be recognized and acted upon.
P.Geol.s, P.Geoph.s and Professional Licensees (Geological and Geophysical) are team players. No doubt. Our work helps keep Alberta safe and strong and the only way we can achieve that goal is through teamwork amongst professionals.
Teamwork Pays. Visit www.apegga.org for more information or call Tom Sneddon, P.Geol., Geoscience Affairs Manager at 403-262-7714 or 1-800-661-7020.
This ad is the sixth in a series

CSPG EXECUTIVE
President
Graeme Bloy • Canada Capital Energy Corporation gbloy@capitalenergy.ca Tel: (403) 975-5784
Vice President
John Varsek • EnCana Corporation john.varsek@encana.com Tel: (403) 645-5417
Past President
Lisa Griffith • Griffith Geoconsulting lgriffith@griffithgeoconsulting.com Tel: (403) 669-7494
Finance director
David Garner david@terra-mod.com Tel: (403) 815-5589
assistant Finance director
Greg Lynch • Shell Canada Ltd. greg.lynch@shell.com Tel: (403) 691-3111
Program director
Scott Leroux • EnCana Corporation scott.leroux@EnCana.com Tel: (403) 645-2000
serVices director
Ayaz Gulamhussein • NuVista Energy Ltd. ayaz.gulamhussein@nuvistaenergy.com Tel: (403) 538-8510
assistant serVice director
Penny Colton • Exploratech Service Ltd. Penny@xploratech.com Tel: (403) 278-8755
outreach director
Mike DesRoches • Talisman Energy Inc. mdesroches@talisman-energy.com Tel: (403) 513-6843
communications director
Peggy Hodgkins • CGGVeritas peggy.hodgkins@cggveritas.com Tel: (403) 266-3225
executiVe director
Lis Bjeld • CSPG
lis.bjeld@cspg.org Tel: (403) 513-1228
WHAT’S HAPPENING in the CSPG office?
Many of you remember a time when CSPG’s office staff was comprised of two people. That has grown to an equivalent of 4.55 full-time staff. Many will wonder why, so the following will answer your question of “What’s happening in the CSPG office?”
The CSPG staff provides a liaison between the CSPG Board and committees in order to coordinate, facilitate, and monitor our programs. Our staff is trained in such areas as business management, accounting, communications, and event planning –expertise professional geologists generally do not have. This allows our volunteers to focus on the technical aspect of their committee work. The volunteers are integral to the Society, but unfortunately need to do most of their volunteer work during their lunch hours, evenings, and weekends. We recognize the limited time volunteers have and allow them to focus on the technical portion by coordinating the logistics and finances, and helping them where needed. Allow me to introduce you to the CSPG staff.
First of all, there is Lis Bjeld, (B.Ed., CMA, FCMA) CSPG’s Executive Director. The Executive Director executes the Executive Committee’s goals, maintains governance of the Society, steers operations, and works with t he Finance Committee to develop, administer, and monitor the financial affairs. Staff management and training have been a priority, and she has built a team environment while crosstraining staff to increase efficiency. Lis has also renegotiated contracts for the audit, communications portfolio, insurance, and staff. She has revised and managed the budgets as well, revising projects relative to revenue. During the current economic crisis, this has been vital.
We also have Alyssa Middleton, the Advertising and Sponsorship Coordinator.
Alyssa works with CSPG’s committees to coordinate the sponsorship program and advertising. W hile she helps any CSPG committee who needs sponsorship for their program, she mainly focuses on obtaining Reservoir advertising, Convention sponsorship (half of her time is charged to Convention), and website sponsorship and advertising. She also coordinates major sponsorship packages for CSPG sponsors and sponsorship fulfillment. She has provided more value for sponsors and created more ways to recognize their contribution.
I, Heather Tyminski (M.A., B.A.), am the Communications Coordinator and I handle the communications portfolio for the Society. This includes the Reservoir, Bulletin, website, newsletter, Geological Calendar, Technical Luncheon program, and CSPG booths at CSPG and AAPG conventions. I have brought more work in-house (such as design work) to save money, reduced spending, and secured the Reservoir archives in the Members Only section of the website. I am also heavily involved with the Reservoir, helping the committee to generate, write, and edit content.
Kasandra Klein is the Member Services Coordinator. She was the logistics coordinator for Gussow (coordinated location, accommodation, food, schedule, audio visual, and budget), is the coordinator for the Awards and Volunteer Management portfolio, and manages the bookstore. Her work contributed to making Gussow a successful conference and her work on the Awards Reception helped the event run smoothly and offer a better means of recognizing CSPG award recipients. She also ensures the awards are in compliance with CSPG regulations. At the same time, half of her time is devoted to reception and administrative work, answering membership (Continued on page 19...)
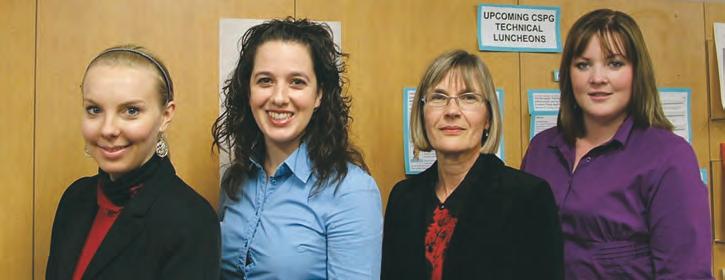
Kasandra Klein, Heather Tyminski, Lis Bjeld, and Alyssa Middleton (Dayna Rhoads absent).
DON’T MISS CANADA’S
GREATEST CONFERENCE ON EARTH SCIENCES
GEO CANADA 2010


WORKING WITH THE EARTH
GeoCanada 2010 is a once-in-a-decade opportunity for anyone who works with the Earth. This valuable event provides the opportunity to discuss and explore the latest developments across a complete spectrum of Earth Science professions. It is the ultimate opportunity to gain insight into your profession and the Earth, sharing experiences and knowledge with your peers from across Canada.
CALL FOR ABSTRACTS
GeoCanada 2010 is now accepting abstracts for oral, poster and core presentations. The Technical Committee encourages and supports proposals from all facets of the Earth Science community. For a complete list of technical sessions and full details on the abstract submission process, please visit the GeoCanada 2010 website at www.geocanada2010.ca

CORPORATE MEMBERS
APACHE CANADA LTD.
BAKER ATLAS
CONOCOPHILLIPS CANADA LIMITED
DEVON CANADA CORPORATION
ENERPLUS RESOURCES TRUST
geoLOGIC systems ltd.
GEOMODELING TECHNOLOGY CORP.
HUNT OIL COMPANY OF CANADA
HUSKY ENERGY INC.
IHS
IMPERIAL OIL RESOURCES
LARIO OIL & GAS COMPANY
LITTLE ROCK DOCUMENT SERVICES
MJ SYSTEMS
MURPHY OIL COMPANY
NExEN INC
PENN WEST PETROLEUM LTD.
PETRO-CANADA OIL AND GAS
PETROCRAFT PRODUCTS LTD.
PROVIDENT ENERGY LTD
RPS ENERGY CANADA LTD.
SHELL CANADA LIMITED
SPROULE ASSOCIATES LIMITED
SUNCOR ENERGY INC
TALISMAN ENERGY INC
TECK COMINCO LIMITED
TOTAL E&P CANADA LIMITED
TOURMALINE OIL CORP
AS OF OCTOBER 29, 2009
WHY SHOULD YOU HIRE a Summer Student?
| By Stephen Kotkas
For several years, employers of geoscientists have been anticipating a sizeable demographic shift in the workplace as the baby boomers prepare to retire. Presently, attrition rates are over 10% at many companies. As the experienced workforce begins to retire, companies need to start looking forward to find the leaders of tomorrow.
Currently, summer student and entry-level positions are very difficult to find. So difficult that often young geoscientists re-educate themselves and move on to different careers. This raises the question: How do we ensure that the knowledge, skills, and attributes of our senior geoscientists are passed on to younger generations?
A great way to ensure this happens is to hire a summer student. For companies who are already planning on hiring summer students, you are helping to ensure the future success of the industry – thank you!
In these economic times, finding the money to hire a summer student can be challenging.
A great way to assist your company is through the Government of Canada Summer Job Initiative. This program is set up to provide funding for small businesses (50 or fewer employees), public-sector employers, and not-for-profit organizations to assist with additional hiring. The main criteria to be eligible for this funding are:
• The job must provide career-related experience for the student; and
• B oth supervision and mentorship must be provided by the employer.
The funding available to approved employers is up to 50 per cent of minimum wage for private and public companies, and up to 100 per cent of the minimum wage for not-forprofit organizations. Employers can apply online or print an application form from the Web Site: http://www.servicecanada.gc.ca/ eng/epb/yi/yep/programs/scpp.shtml.
Take a look back on your own career and ask yourself this: Where would you be without that first person who took a chance and hired you?
Renewing You R 2010 CSP g Me M be R S hiP online
November is quickly approaching, which means it is almost time to renew your 2010 CSPG membership. Starting November 1 you will be able to renew your membership online and print your own receipt and Membership Card. Here’s how to do it:
1. Log into the Members Only section of CSPG’s website. The Members Login link is in the top right corner of CSPG’s homepage (www.cspg.org).
2. Once you’re in the Members Only section, select Membership Dues from the centre list of options.
3. Your screen will list “Membership Renewal Total” below the Item heading and “$105.00” under the Cost heading (includes GST). Select add to basket .
4. Add your Credit Card information (card type, expiry date, card number, card security code, name on card, card owner’s address, etc.). Please note that under the “Credit Card Country” option, leave the space blank if your address is in Canada. Only if you live outside of Canada should you choose your country from the menu.
5. Select the Check-Out button at the bottom of the page. Only click the button once.
6. You will then see the Purchase Detail page, where you’ll be able to print your combined receipt and Membership Card. Select Print Receipt to get the PDF of your combined receipt and Membership Card. The card will include not only your membership information, but also the relevant information for income tax purposes.
If you need help processing your order, call the CSPG office at (403) 264-5610.
technicaL Luncheons DECEMBER LUNCHEON
Geoscience
of one of the largest integrated SAGD operations in the world –a case study from Long Lake, northeastern Alberta
SPEAKER
Dale A. Leckie Nexen Inc.
CO-AUTHOR
Milovan Fustic Nexen Inc.
CO-AUTHOR
Christopher Seibel Nexen Inc.
11:30 am tuesday, december 15th, 2009 telus convention centre calgary, a lberta
Please note: the cut-off date for ticket sales is 1:00 pm, thursday, december 10th, 2009. i ndividual t icket Price: $42.00 + gst. table Price (seating for 10): $420.00 + gst.
e ach csPg technical Luncheon session is 1 a Pegga Pdh credit.
Due to the recent popularity of talks, we strongly suggest purchasing tickets early, as we cannot guarantee seats will be available on the cut-off date. To buy your tickets or tables, visit http:// www.cspg.org/events/events-luncheons.cfm.
Nexen Inc. and its joint venture partner, OPTI Canada Inc., have implemented one of the largest integrated SAGD (Steam Assisted Gravity Drainage) operations in the world to recover a portion of the more than estimated 18.8 billion bbls of original bitumen in place on their joint venture oil sand leases in northeastern Alberta. The purpose of this SAGD scheme is to recover and upgrade bitumen trapped within sands of the Aptian-age McMurray Formation. With the billions of dollars required to acquire land, delineate deposits, drill SAGD well pairs, and build steam generation facilities and an upgrader, it is critical that the geological and geochemical aspects of the reservoir be fully understood.
Early, regional stratigraphic studies by Nexen across the Athabasca basin showed the McMurray Formation to be comprised of three or more episodes of incision, valley creation, and subsequent infill with fluvio-estuarine sediments. Fluvioestuarine deposits are, by their nature, heterogeneous. This, combined with the multiple incision and fill events, has resulted in a complex amalgam of reservoir and non-reservoir sedimentary rocks, creating stratigraphic compartments across the basin.
Since the inception of this project, Nexen, as the SAGD Operator, has been committed to developing a thorough understanding of the deposits of the McMurray Formation through the integration of detailed geological, geophysical, and geochemical

data sets. Subsequent to routine delineation of McMurray oil sand deposits through core hole drilling, core analysis, petrophysical logging, and 2D and 3D seismic surveys, Nexen has put a major effort into a broad range of geoscience studies. These include sedimentology, stratigraphy, sequence stratigraphy, palynostratigraphy, ichnology, chemostratigraphy, geochemistry, seismic attribute analysis, geomechanics, and comparisons with modern analogs.The integration of these data sets has allowed the mapping of individual valley fills on regional and lease scales. On a more detailed reservoir development scale, mapping of depositional facies elements and fluid characterization allows for planning and production optimization of existing and future SAGD well pairs. The resulting 3D object-based model and baseline bitumen characterization studies (physical properties and molecular composition) have reduced reservoir uncertainty, improved reservoir visualization, and are used for reservoir simulation and history matching. Monitoring steam chamber growth is the next step to be undertaken in our understanding of the reservoir and will involve 4D seismic interpretations and other emerging technologies. In this talk, we will present the results of these investigations.
BIOGRAPHY
Dale Leckie is Chief Geologist at Nexen Inc. He has specialized in petroleum systems focusing on sedimentology, marine and non-marine sequence stratigraphy, basin analysis, and unconventional hydrocarbons. He has worked in western Canada and on petroleum systems around the world for most of his career.
Milovan Fustic is a Geologist at Nexen Inc. Fustic has more than 15 years of professional experience of which the last ten years were on major oil sands industry and research projects. He co-authored several papers related to Alberta’s oil sands sedimentology, reservoir characterization, bitumen geochemistry, and applied petrophysics (dipmeter).
Christopher Seibel is a Senior Geologist at Nexen Inc. He has worked in Nexen’s Canadian Oil and Gas Division since 2001 on projects in southeast Saskatchewan, west central Saskatchewan, northeast B.C., and is currently working in northeastern Alberta on the Lower Cretaceous McMurray Formation.

Background
Photo by Astrid Arts.

Targeted Solutions
CGGVeritas is committed to targeted geophysical solutions that fit your local needs. Wherever you’re working, you have access to leading seismic imaging technologies, the highest quality 3D and 2D data library, the most advanced acquisition capabilities and a staff committed to your success.
Count on CGGVeritas to help you explore, develop and produce with confidence.
Contact:
technicaL Luncheons JANUARY LUNCHEON
A bright
multiple fragmentation fireball and meteorite fall at Buzzard Coulee, Saskatchewan, Canada, November 20, 2008
SPEAKER
Alan R. Hildebrand University of Calgary
CO-AUTHOR
Ellen Milley University of Calgary
11:30 am tuesday, January 12, 2010 telus c onvention c entre c algary, a lberta
Please note:
the cut-off date for ticket sales is 1:00 pm, thursday, January 7, 2010. csPg member ticket Price: $38.00 + gst. non- member ticket Price: $45.00 + gst
Each CSPG Technical Luncheon session is 1 APEGGA PDH credit.
The 2010 AGM will be held at this Technical Luncheon. Tickets may be purchased online at https://www.cspg.org/eSeries/source/Events/ index.cfm.
A bright fireball was widely observed across the Prairie Provinces and Montana during late twilight on November 20, 2008. The fireball and subsequent dust trail, and the shadows cast by the fireball, were serendipitously widely recorded by video cameras. The meteoroid had a slightly below average initial velocity and fell from a modestly inclined

and evolved orbit. The fireball fragmented multiple times over ~3 seconds with significant fragmentation continuing deep within the atmosphere to ~18 km altitude; three remaining large pieces were individually recorded to shallower than 12 km altitude.
Since the initial meteorite recovery in Buzzard Coulee, SK, Nov. 27, 2008, a strewn-field ~13 km long and ~3 km wide with a wind drift tail of an additional ~3 km eastwards has been crudely outlined. The long axis of the strewnfield has been rotated to the north-northeast by upper altitude winds. Organized searches and the alerted public have recovered more than two thousand individual fragments ranging from <1 g to 13.1 kg mass (totaling >200 kg) during the first year. This fall, Canada’s most prolific to date, has been an opportunity to experiment with searching strategies and equipment in a variety of ground conditions.
Abundant sonic phenomena were reported by witnesses including anomalous sounds, explosion booms, staccato cracks, and late-stage whirring sounds. The staccato
cracks are interpreted as closely spaced arrivals of discrete sonic booms from individual fragments while the latter were still supersonic in the early portion of their dark flight; this type of sound was reported only within ~50 km of the fall. The whirring sounds were reported only within ~20 km of the fall and are interpreted as produced by individual rotating fragments falling to ground while in subsonic dark flight.
At least six North American infra-sound stations (deployed as part of the monitoring mandated by the Comprehensive Test Ban Treaty) detected signals from the fireball. The rich waveforms from many stations offer the prospect for the first time of resolving which fragmentation events produced signals at which stations with detailed ray trace modeling. The stratospherically ducted peak frequency measured at each of the three calibrated IMS stations are consistently near 0.32 Hz. Using this measurement yields an infrasonic energy estimate for the source of 0.32 ±0.09 kilotons; this energy yield implies an entry mass of ~10 tonnes for the meteoroid.
Buzzard Coulee is an H4 chondrite at the low end of the thermal range and may be
transitional to type 3. Two lithologies are contrasted by variation in the chondrule sizes; the finer-grained phase has an abundance of <200 micron cryptocrystalline chondrules. The meteorite is also distinguished by the presence of light-coloured, igneous-textured inclusions up to 8 mm in size. Brecciation is only rarely visible in hand specimen, but where observable the inclusions are found only in the matrix. The meteorites are distinguished by the large number of specimens with immature surfaces (angular shapes with numerous small piezoglypts) presumably reflecting the meteoroids’ late stage fragmentation low in the atmosphere. The low abundance of veins and relatively cryptic brecciation are consistent with the low S2 shock state. Several meteorites are broken along slickenside surfaces. Densities span 3.30 g/cm3 to 3.58 g/cm3 with some evidence for a bimodal distribution. The bulk density range mostly reflects porosity variations from 3 to 11%.
BIOGRAPHIES
Alan R. Hildebrand is an Associate Professor in the Department of Geoscience at the University of Calgary where he holds the Canada Research Chair in Planetary Science. After graduating from the University of New Brunswick with a B.Sc.
in Geology in 1977, he worked in the mineral exploration industry before turning to a research career. In 1992 he received a Ph.D. in Planetary Sciences from the University of Arizona. His current research is aimed at understanding the small body population (asteroids and comets) of the Solar System and its interaction with the planets. Aside from exploring the origin of the Solar System and the role of impacts in planetary evolution, these studies address the practical goals of the current impact hazard (and mitigation strategies), and delineation/ characterization of the near-Earth population as potential resources.
Ellen Milley grew up in Halifax, Nova Scotia, completing a B.Sc. Hon. Physics at Mount Allison University in Sackville, New Brunswick. Her undergraduate thesis work focused on the light phenomena associated with meteors, a research area that has continued into her graduate studies. She is now a Master of Science graduate student in the Department of Geoscience at the University of Calgary. She has recently distinguished herself by determining the trajectory of the Buzzard Coulee fireball using a novel method of triangulating measurements from security camera recordings of shadows cast by the fireball.
technicaL Luncheons JANUARY LUNCHEON
Isolated carbonate platforms and mounds (ICPM): initiation, growth, and demise
SPEAKER
Toni Simo ExxonMobil, Upstream Research Company, Houston, Texas
11:30 am t hursday, January 21, 2010 telus c onvention c entre c algary, a lberta
HUGH REID’S 2010 COURSES
PRACTICAL DST CHART INTERPRETATION
(Thorough Basic Course)
Feb. 1-4, Apr. 5-8, 2010 (3 1/2 days)
16 WAYS TO IDENTIFY BYPASSED PAY FROM DST DATA
(More advanced, for those “comfortable” with DST charts)
Apr. 21-22, 2010 (2 days)
HYDRODYNAMICS SEMINAR
(Oil & Gas Finding Aspects)
Apr. 26-29, 2010 (4 days)
In-house courses available. For course outline visit: www.hughwreid.com
Please note: the cut-off date for ticket sales is 1:00 pm, monday, January 18, 2010. csPg member ticket Price: $38.00 + gst. non- member ticket Price: $45.00 + gst
Each CSPG Technical Luncheon session is 1 APEGGA PDH credit.
Did you know that you can book a table for the Technical Luncheon? To book your company’s table or to buy tickets, visit http://www.cspg. org/events/events-luncheons.cfm.
Isolated carbonate platforms and mounds (ICPM) originate on topographic highs in shallow marine waters and are surrounded on all sides by deeper-water environments. Comparative studies of modern and ancient isolated platforms allow insights into mechanisms that control the platforms. Modern examples provide information especially relevant to Tertiary platforms because the carbonate-secreting organisms that built the platforms are very similar and occupied similar ecologic zones.
Detailed information on the organisms and environments of deposition can provide insights into the dominant controls on facies type and dimensions today. However, there is a challenging lack of information regarding how the facies and size change through time. This challenge can be addressed through high-resolution seismic images, which provide sequential and spatial information and allow for comprehensive analysis on ICPM initiation, amalgamation, and demise. A unique combination of insights gathered from modern and ancient datasets on isolated carbonate platforms and mounds can be used to make predictions, create conceptual models, and guide geologic model inputs.
Two- and three-dimensional seismic surveys from Southeast Asia show internal seismic geometries and positions of margins, providing clues on the evolution of the ICPM. Mounds initiate as small positive features that amalgamate to form platforms of different sizes and geometries prior to drowning. The distance between the mounds appears to be the first-order control on amalgamation and ultimate platform size. However, amalgamation may be inhibited if strong currents redistribute sediment transported off-bank and away from the mounds, leaving unfilled accommodation space. Understanding the feedbacks between
mound amalgamation and carbonate production will have implications for predicting control mechanisms and building conceptual models. High amalgamation rates imply large areas of shallow-water carbonate deposition and high carbonate production resulting in the formation of mega-platforms. Smaller areas of shallow water deposition tend to drown faster when environmental conditions deteriorate and platforms cannot keep up with increased accommodation.
Satellite images over several modern platforms in Southeast Asia provide an opportunity to investigate the importance of oceanographic processes such as tides and currents as well as tectonic subsidence and chemistry on carbonate deposition and the impact on ICPM evolution. In the Tertiary, however, special consideration is needed for sea-surface temperature and salinity residence times. These parameters are thought to be the major difference in biologic controls on the types of organisms building shallow-water platforms in the Tertiary versus today.
Modern and ancient datasets are used in parallel to evaluate what and how certain processes control initiation, growth, and demise of isolated carbonate platforms and mounds. This allows us to predict the controls for ancient ICPM, thus establishing a framework of rules for predictive conceptual models.
BIOGRAPHY
Toni Simo completed his B.Sc., M.Sc., and Ph.D. in Geology at the University of Barcelona. He is currently Research Associate for Upstream Research Company, ExxonMobil. Before that he was a professor at University Polytechnic Barcelona and before that, a professor at the University of Wisconsin. Some of his previous publications include Controls on Carbonate Platform and Reef Development, Advances in Carbonate Sequence Stratigraphy, and Cretaceous Carbonate Platforms.

First Iraqi company providing logging services for:
• Open hole services
• Cased hole services
• Perforations
• VSP
• PLT
Unique system, Decades of tools performance and accuracy
DIVISION TALKS Basin analysis and sequence
Integrated 3D reservoir characterization for oil sands evaluation, development, and monitoring
Speaker Laurie Weston Bellman Oil Sands Imaging Inc., Calgary
12:00 Noon
Thursday, December 17, 2009
ConocoPhillips Auditorium, 3rd Floor 401 9th Ave SW Calgary, Alberta
The Athabasca oil sands contain more than a trillion barrels of oil within the Cretaceous McMurray Formation of northeastern Alberta. The McMurray Formation is generally considered to be a compound estuarine valley system characterized by multiple stacked channel sequences. It is bounded below by Devonian rocks at the pre-Cretaceous unconformity and above by the widespread transgressive marine shales and sands of the Wabiskaw Formation. Post oil migration, the reservoir has been subjected to structural changes caused by salt dissolution and tectonics. At the same time, due to its shallow burial, fresh water infiltration has caused severe biodegradation
of the oil, creating the complex mixture of bitumen, gas, and water present today.
So far, the preferred method of in situ bitumen production is the Steam-AssistedGravity-Drainage (SAGD) process. Multiple horizontal well pairs are drilled to inject steam into the reservoir and pump out the heated, liquified oil. The objective of every oil sands operator is to minimize the steam-injected to oil-recovered ratio by maximizing the efficiency of the SAGD process. Reservoir heterogeneity has been found to have the single most significant negative effect on the efficiency of steam chamber development and overall bitumen recovery, directly influencing steam/oil ratios.
Detailed knowledge of the reservoir can therefore allow for better prediction and management of the inherent complexity of the McMurray formation. An accurate baseline reservoir characterization is also essential for subsequent time-lapse seismic analysis and comparison for production monitoring. The process described in this presentation integrates all available data to produce a detailed volume of deterministically derived facies and fluids. The workflow is illustrated using threedimensional seismic and well data from the Nexen/Opti Long Lake SAGD Phase 2 area near the city of Fort MacMurray, Alberta. The subsequent drilling results were compared with the predicted properties and showed that most wells matched the prediction with greater than 75% accuracy. Portions of the facies and fluids volume can be used to populate a geo-cellular grid over a single well pair or a proposed

horizontal drilling pad. After production has commenced, monitoring of steam injection and heated bitumen can be assessed by repeating the reservoir characterization process with time-lapse seismic data.
BIOGrapHY
Laurie Weston Bellman has over 20 years experience in geophysics for the oil business. She started her career in the mid-1980s with Shell Canada doing seismic processing and interpretation in the central plains area of Alberta. Seeking adventure and travel, she took a position with LASMO PLC in London to work on various European, North African, and Middle East projects. Following a short sabbatical to travel and focus on family, she began her consulting career in 1999. She has contracted for a number of other companies and projects, but since 2000 when she took a consulting contract with Nexen Canada Inc. in their newly created Synthetic Oil group, her main professional interest has been the Canadian oil sands. She formed Oil Sands Imaging in 2007.
INFOr M aTION
BASS Division talks are free. Please bring your lunch. For further information about the division, joining our mailing list, a list of upcoming talks, or if you wish to present a talk or lead a field trip, please contact either Steve Donaldson at 403-645-5534, email: Steve. Donaldson@encana.com or Mark Caplan at 403-532-7701, email: mcaplan@aosc.com or visit our web page at www.cspg.org/events/ divisions/basin-analysis-sequence-strat.cfm.
diVision taLKs STRUCTURAL GEOLOGY DIVISION
27th ANNUAL CSPG SQUASH TOURNAMENT
Developing a new framework for the tectonic evolution of the Arctic
SPEAKER
February 4 – 6, 2010
World Health Club • 722 Edgemont Blvd NW there is a maximum of 125 players!
Get your entry form in early to avoid disappointment! Register online at www.cspg.org/events/events-social-squash-register.cfm
continental crust, and rifted continental margins. The spatial evolution of Arctic basin geometry and bathymetry are critical for understanding regional palaeo-oceanography, and its influence on global climate. The development of a robust Arctic plate tectonic model will, therefore, have a significant impact on our understanding of the palaeogeographic and palaeo-climatic evolution of the entire Arctic region and, in turn, important implications for mineral and petroleum exploration.
EVENTS: Men’s and Women’s A, B, C, D, and Novice.
Bridget Ady GeoArctic Ltd.
ENTRY FEE: $75.00 Members (Members of the CSPG and CSEG, Spouse/Partner)
$110.00 Non-Members
$20.00 Doubles
12:00pm – 1:00pm thursday, december 3, 2009 room cP1-1106, calgary Place tower one (between 2nd and 3rd street on 5th ave. s.W.) note room change from previous meetings.
• Two guaranteed matches (Saturday teams tourney), T-Shirt, refreshments and food during the tournament, Saturday night dinner and draw prizes.
• Pre-tournament drop-in squash at Bow Valley Racquet Club (2nd Street and 5th Avenue S.W.) on Monday, January 25, 2010 from 6:00 pm to 8:00 pm. Generously sponsored by Tucker Wireline Services.
Pick up your tournament kit and first draw time. Enjoy a free pint of ale with munchies.
The USGS predicts that the circum-Arctic region contains over 400 billion BOE of undiscovered hydrocarbons; however the geoscientific community has yet to develop a convincing plate tectonic model for the origin of the Arctic Ocean basins. The ocean basins of the Arctic formed during the Late Jurassic, Cretaceous, and Tertiary as a series of small, distinct ocean basins leading to a complex distribution of oceanic crust, thinned
• All door prize draws Saturday evening – must be present to win.
This presentation focuses on the development of a framework for the plate tectonic evolution of the Arctic region through a set of regional continent and ocean-floor reconstructions. The plate reconstructions are created with advanced plate modeling software that reconstructs all available regional and detailed geological and geophysical data to their palaeo-location and removes the effects of extension and compression. The reconstructions can be used to determine the structural development of a basin, the depositional setting and provenance of reservoir rocks, source rock distribution, and even palaeo-climate and ocean currents. Clarification of the progressive evolution of Arctic orogenic and basin-forming episodes is an ultimate objective, which will help to constrain regional models for source and reservoir rock depositional extent.
• Pre-tournament Registration Social will be at the Bow Valley Racquet Club (2nd Street and 5th Avenue S.W.) on Tuesday, February 2, at 5:00 pm.
BIOGRAPHY
ENTRY DEADLINE: Early Bird Deadline January 4, 2010. Qualify for Early Bird Draw Prize.
Registration Deadline January 14, 2010. No refunds after this date.
REGISTRATION DETAILS: q CSPG q CSEG Member # q
Unravelling the evolution of the Arctic Ocean is complicated by a general lack of information over much of the region. Some of these knowledge gaps are being redressed by a number of new datasets, several of which have been acquired in response to recent political wrangling over the extent of the various Arctic Nations’ economic zones. New Arctic datasets include information from recent bathymetric, gravity and magnetics surveys, multi-channel and refraction seismic surveys, and dredge and core samples. Recent onshore field mapping and sampling initiatives have included provenance studies, and the analysis of geochemical and palaeo-magnetic data. These data all help to provide fresh insights into the tectonic evolution of the Arctic. The development of a cohesive plate tectonic model that honours the newly acquired datasets is key to advancing understanding of basin evolution, fill, and deformation in the Arctic.
Petrophysics
...that works the way you do
In 1996 Bridget Ady co-founded GeoArctic Ltd. Since then she has been involved in numerous plate reconstruction projects including the Arctic, the Atlantic margins, the Labrador Sea and Baffin Bay, Northern and Eastern Canada, Southeast Asia, and a global plate reconstruction and source rock study. Clients have included Norsk Hydro, Petro-Canada, EnCana, Shell, Husky Energy, Nunaoil, GX Technology / Ion Geophysics, and GEDCO.
Will you be attending dinner: q Yes q No Meal Preference: q Meat q Veggie Guest Name: q Male q Female
Doubles Squash ($20.00 extra for Doubles if playing singles as well): q Yes q No
Will you be attending the dinner: qYes q No Meal Preference: q Meat q Veggie PAYMENT DETAILS (GST Included. GST# 118836295):
$75.00 Member/Spouse
$110.00 Non-Member (CSPG/CSEG members will be given first priority.)
$20.00 Doubles
$35.00 Extra Meal Ticket (Non-playing guests. Maximum 15 spots; first-come, first served).

(Please
q VISA q MC qCheque (Payable to Canadian Society of Petroleum Geologists)

ACHIEVING TOTAL ASSET TEAM COLLABORATION in the Landmark DecisionSpace® Environment
| by Tom Pierce
‘OVER-THE-WALL’ COLLABORATION
In many organizations, asset teams today collaborate by having the varying disciplines completing their own work independently, with their own data and using their own applications, and then forwarding the results along to the next specialist in the workflow. Truly collaborative interpretation between different specialties is challenging because they often use disparate data, platforms, and applications. Accordingly, disjointed over-thewall collaboration occurs with information and interpretations being shared via spreadsheets and hard-copy maps, sections, and reports. Once shared, the interpretation becomes quickly outdated and new information or new perspectives require new versions to be created and shared.
More importantly, a specialist may question the accuracy or the version of data used in prior work which may lead to decisions and direction based on incomplete information. While mistakes can arise in the workflow processes of every asset team, the real issue is how quickly those mistakes are recognized and addressed.
Disjointed over-the-wall passing of information can result in inconsistent reservoir understanding and conflicting opinions. An asset team can walk a long way down a path without realizing that critical information has changed or that new information has become available. At best, the issues are recognized and corrected within a reasonable time. At worst, they are not recognized at all, and teams make the wrong drilling and field development decisions.
Overcoming over-the-wall collaboration requires an integrated system for subsurface interpretation using a common database. This environment can be used for more efficient collaboration among geologists and geophysicists as well as for successful collaboration with well-planning teams.
INTEGRATED GEOLOGY AND GEOPHYSICS
The concept of integrated subsurface interpretation has long been touted. Results have been mixed because applications and platforms from different vendors usually do not communicate well. To obtain more consistent results, the practice of dynamic integration needs to be applied. This is the ideal of integrated subsurface
interpretation. With dynamic integration, data from every discipline is integrated in real time. New ideas and changes are immediately available to team members for immediate response. There is no confusion over versions and timing of information. Colleagues can explore multiple scenarios, introduce different perspectives, argue about alternatives, and decide which scenario to pursue and which to discard. The team can increase its effectiveness and reduce cycle times by reducing confusion and giving everyone timely access to information. A true collaborative process, with shared accountability for the end result, improves the accuracy of the work.
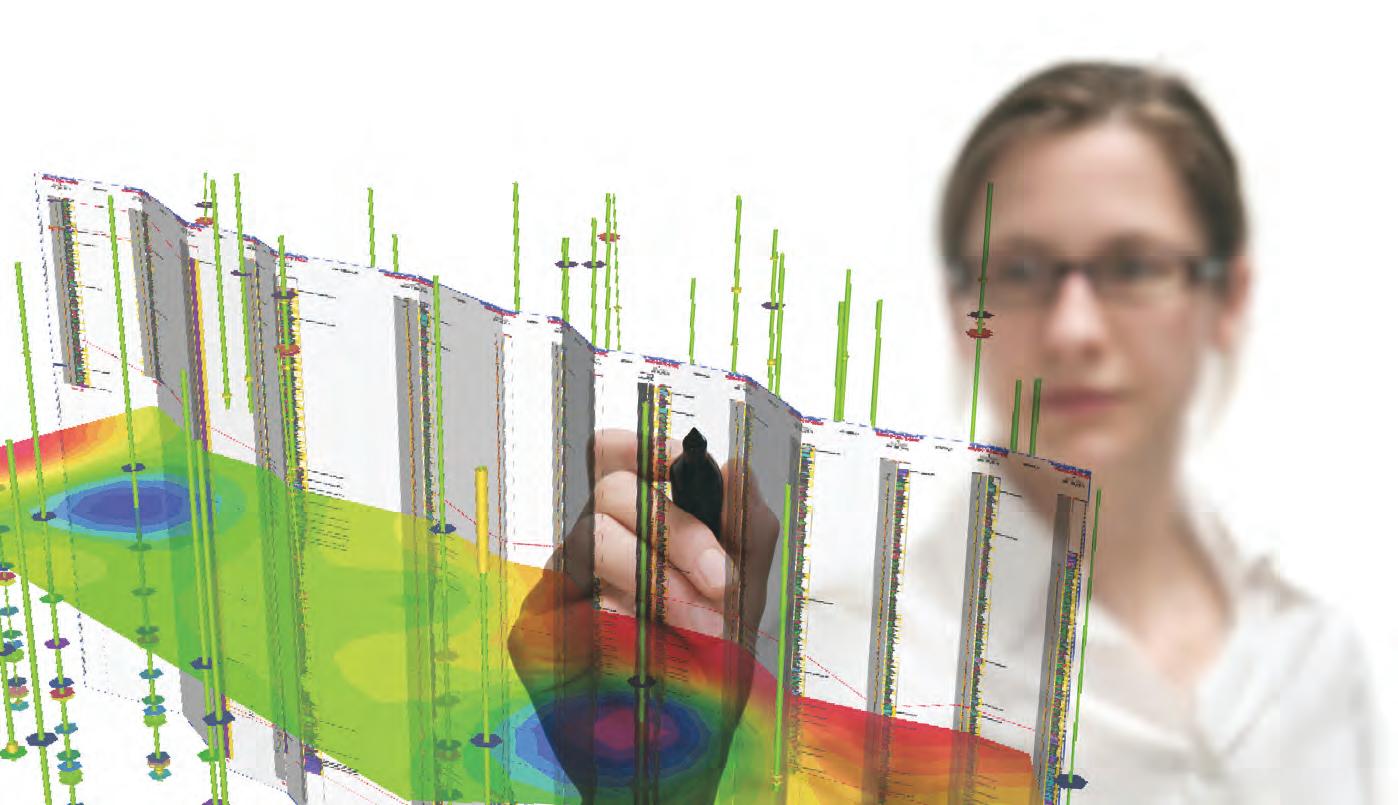
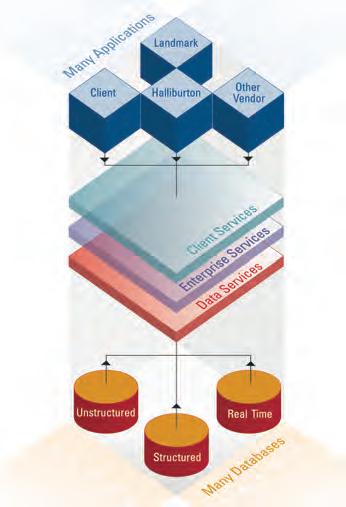
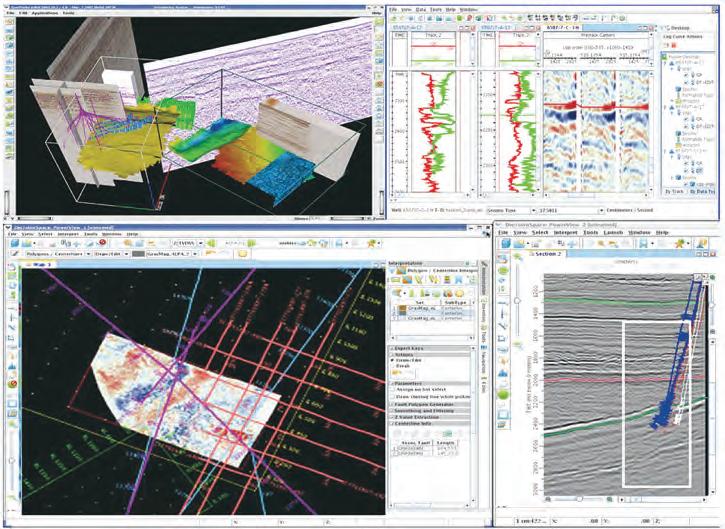
Today, with the Landmark DecisionSpace® environment, these barriers to dynamic integration have been eliminated. Applications across multiple disciplines, developed on both Windows® and Linux™ platforms, can work together (Figure 1). Landmark applications such as GeoGraphix ®, PowerView ®, and GeoProbe® software used by geologists and geophysicists, for example, are considered by many to be best-of-breed; they allow for dynamic integration via the DecisionSpace environment (Figure 2).
Equally important, The DecisionSpace environment can integrate other thirdparty applications; it allows applications
from multiple vendors to communicate interactively with each other. These vendors use available Software Development Kits (SDKs) to bring the various interpretations from different sources together in a single centralized visualization application.
A COMMON DATABASE
The key to making real-time collaboration work, regardless of application vendor, is having a common database that is accessible to all the applications.
OpenWorks ® R5000 defines the next generation of project data management and is critical to dynamic integration in the DecisionSpace environment. The most widely used subsurface project database in the world, OpenWorks software enables multiple asset-team members to store all available subsurface data and interpretation within a common Oracle-based framework (Figure 3).
OpenWorks software and the DecisionSpace environment connects information from multiple team members, focuses project data on the asset, and organizes it in such a manner as to eliminate project boundaries. Interpretation for prospect plays can be interlaced, allowing a wider regional perspective to be fine-tuned from the localized prospect interpretation. Conversely, the regional context is available for the localized interpretation, thereby facilitating consistency and corroboration.
Data optimization is a key element of OpenWorks software and the DecisionSpace environment. The OpenWorks technology model automatically captures changes as information is created, changed, or loaded. As information is created, it creates an audit trail that stores data lineage with the meta data. Similarly, the interpreters are able to add relevant information in the form of interpretation notes, akin to electronic postit notes, that are captured in a form that can be referenced and mined.
By combining a series of decisions and ideas, the OpenWorks data model allows interpreters to pursue a body of work, or a thought process, and then to capture all relevant information within a defined body called an interpretation set. They can then explore multiple scenarios to conclusion, compare them with other interpretation

Figure 1. DecisionSpace, real time, digital asset, Landmark.
sets, assess risk, and determine the most accurate reservoir characterization.
Traditionally, data management has been a cumbersome process with uncertain results. OpenWorks software changes all that. It allows data to be brought forward more readily through expanded workflow support. Its new data management utilities enable dynamic access to relevant information, as the data is stored logically and is comparable through interpretation sets.
COLLABORATION WITH WELLPLANNING TEAMS
Once the agreed-upon reservoir characterization is set, it can be shared directly with the drilling and engineering specialists via automated links between the OpenWorks database and Landmark’s Engineer’s Data Model™ software.
Proper well placement requires precise understanding of the reservoir characteristics and surface constraints. The
DecisionSpace environment is engineered to span multiple disciplines and workflows promoting integration between subsurface, drilling and production. This allows the asset team to achieve the same types of dynamic collaboration described earlier. Collaborative field development makes game-changing improvements in the cycle time achievable.
Collaborative field development enables asset teams to develop field development scenarios, including complete well plans, in hours instead of weeks (Figure 4).
Prolonged well-planning cycles or planning miscalculations can cost millions of dollars.
In the DecisionSpace environment, asset
teams can automatically generate optimized field development scenarios, including target generation, well-path planning, platform requirements, and positioning. The technology works for both new field and mature field development, and it has features that enable users to rapidly generate multiple planning scenarios for sensitivity or economic analysis. Teams can optimize pad locations using known surface and subsurface constraints, properly position horizontal and vertical wells within the target zone, and achieve the maximum reservoir exposure that is so important to optimized production.
Landmark’s Collaborative Well Planning suite is the software that enables this planning. It encompasses surface and subsurface 3D visualization of facilities and the earth model. It includes direct connections to real-time measurement-while-drilling (MWD) and logging-while-drilling (LWD) feeds to support accurate, real-time well-path positioning, updating of the earth model, and real-time engineering analysis and design.
Collaborative field development workflows also integrate with drilling and completion applications for directional planning and wellbore integrity analysis. This eliminates the need for workflow duplication across disciplines. Individual well paths can be created and fine-tuned within the DecisionSpace environment. Engineers can access field development plans directly through drilling applications for rigorous path plan optimization, including collision avoidance, hydraulics, and torque and drag analysis. They can also quickly create multiple scenarios and compare them in the same manner as is done with the subsurface workflows; this capability helps them select the optimum field development plan.
(Continued on page 18...)
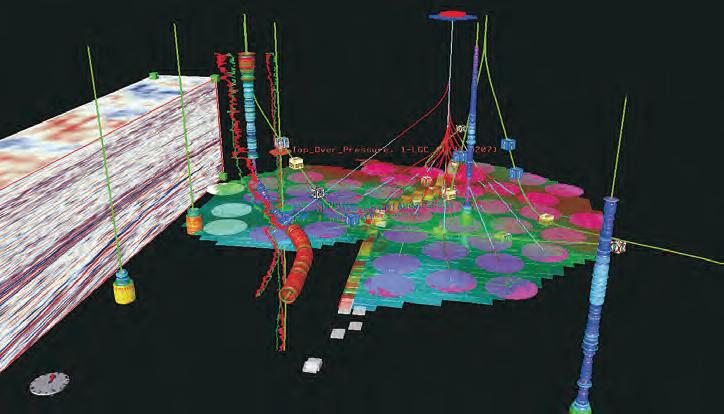
Figure 2. Dynamic integration provides an immersive environment in which best-of-breed tools with a common look and feel act as one application. Users can quickly interpret multiple 2D, 3D, 4D and pre-stack seismic surveys in MultiVolume, section and map views.
Figure 4. 3D visualization environment allows asset team to generate field development plans in hours instead of weeks.
Figure 3. Best Data Management Solutions Award Winner.
(...Continued from page 17)
DECISIONSPACE ENVIRONMENT SAVES MONTNEY DEVELOPMENT COSTS
Using DecisionSpace technology, the asset team optimized execution plans for 70 wellbores from multiple pads in a Montney shale gas play. Specific drilling challenges associated with shale gas were incorporated in the interpretation set, along with topographic constraints including rivers, valleys, roadways, and wildlife conservation areas.
Planners completed 40 planning iterations within two weeks by using the subsurface interpretation, drilling targets, and surface hazards that were defined as “no-go” zones. During this process, the team discovered that small modifications to the field development plans could yield significant savings. In the end, they hit all pre-defined targets, using 10 wells per pad instead of eight wells per pad. Using traditional methods, a planning cycle usually takes months and only a few iterations are
CORE WORKSHOPS
Western Canada Cretaceous Shallow-Marine and Estuary Reservoirs - Analogues to Modern Environments of P.E.I. and New Brunswick
Cost per Participant - $1050 plus GST (Open to anyone, but will be ver y beneficial to those who have attended, or plan to attend, the Maritimes Field Course).
Two 2-day Workshops, ERCB Core Research Center, Februar y 10 & 11, 2010 and Februar y 17 & 18, 2010.

possible. In the end, the higher drilling and completion costs were more than offset by two fewer pad locations; this strategy saved $6 million in the total project cost.
DECISIONSPACE ENVIRONMENT SAVES SAGD DEVELOPMENT
When tight deadlines threatened to derail a 300 well-pair SAGD project, the asset team turned to the DecisionSpace Collaborative Well Planning suite of technologies to rapidly optimize the field development plan. A 3D visualization platform enabled rapid analysis of dozens of possible scenarios to find the best solution (Figure 5).
It quickly became apparent that the original plans failed to maximize coverage for optimal drainage. Within days, the team collaborated on competing objectives within the overall plan. The final result incorporated longer horizontal wellbores to maximize coverage and eliminated three large pads, which saved significant construction and facilities costs. Team members also created a simpler design and eliminated the risks inherent in more complex facilities. Later, the team indicated that, without the DecisionSpace environment, it would not have been possible to analyze that many scenarios so accurately in such a short time.
FIELD COURSES
Modern Barrier-Island and Estuary Environments, Maritime Provinces, September 6 -11, 2010 and 13 -18, 2010
Barrier Beach, Strandplain and Estuary Environments, North Oregon Coast, October 2010
Phone Gerry Reinson 403.538.6200 www.reinsonconsultants.com
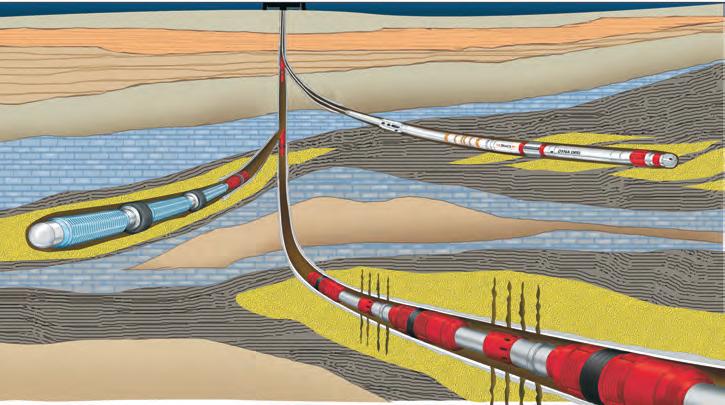
Figure 5. Smartwell Multilateral Systems - Multilateral technology was developed to reduce overall field development costs by using complex drainage architecture to increase the amount of reservoir exposure.
Tom Pierce manages Halliburton Software and Asset Solutions in Canada. He has more than 15 years of experience in the Canadian oil and gas industry and has worked in both the vendor and client side of the industry, gaining significant practical knowledge of data acquisitions, software technologies, and asset team workflows. He is a Business Administration graduate of the University of Alberta and holds a Geological Technology diploma from SAIT.
This article was contributed by Halliburton. CSPG thanks Halliburton for the contribution.
CORRECTiOn
Please note that the third reference from the article “Evolution of Horizontal Completions” published in the November 2009 issue of the Reservoir should be the following:
Schnell, R. A., Tapper, N., Genyk, R., Deliu, D. and Tavakol, H. 2009. SPE 125970 – Montney Unconventional Gas – Next Generation, an integrated approach to optimizing Wellbore Completions Technology. Society of Petroleum Engineers. SPE Eastern Regional Meeting, 23-25 September 2009, Charleston, West Virginia.
(...Continued from page 5)
inquiries, and selling bulk technical luncheon tickets to companies.
Lastly, but certainly not least, Dayna Rhoads is the Registration Coordinator. She coordinates and processes 90% of all registration (social events and Continuing Continuing Education courses and seminars), coordinates membership renewal, and supports the Education Committee in organizing logistics for their sessions. Dayna works half-time at reception, processing memberships, answering membership queries, and selling Technical Luncheon tickets. This year’s enhancements include online printing of the membership cards and official receipts. Similarly, the Technical Luncheon ticket sale process has evolved so members can buy and print their tickets online. Reception is also available by telephone to process a registration for you.
We helped achieve many of the Executive Committee’s fiscal 2009 (September 2008 –August 2009) goals. With the change in the economic environment, our mission was to steer each program and event to operate within the revised budget guidelines, assess operation costs and reduce where possible,
strengthen the presence of CSPG, and embrace technology where cost-effective. We have reduced the staff FTE (full-time equivalents) and are providing more services than before. Some of the new initiatives are to provide high-resolution foldout and diagram access online for all Bulletins from 2002 forward (today you can preview the current Bulletin in high resolution on the website), expand webcasting to include course webinars, and create promotional material to introduce CSPG as part of a membership drive. You asked for new courses and field seminars, job boards, and recruiting assistance in the Member Survey; these will be prioritized at the Executive Strategy Session in November 2009.
Our goal is to have CSPG recognized as the leading volunteer Society promoting Petroleum Geosciences, steering your professional development and being your professional home, a place to be passionate about, to learn and to have fun. Thank you for your interest and support in CSPG.
Submitted by the Communications Coordinator

REMOTE SENSING FOR GEOLOGISTS I
| by Dr. Mryka Hall-Beyer

It can be difficult being a remote sensing (RS) professional. At a party, I could say “I’m a Geography professor” and be asked the capital of South Dakota. Or, I might say “I research hypertemporal remote sensing” and kill all hope of further conversation. Living in Calgary, though, I occasionally get a reply referring to geophysical techniques and aeromagnetic surveys. Unfortunately, this also results in two people talking right past each other. Despite my M.Sc. in Geology, geophysics is outside my ken. RS is a very fuzzy concept among geologists. It needs more explanation – and parties aren’t the place to tackle it. I hope in this series of articles to clear up some terms, let you into my RS world, and explain what RS can do for geologists.
There are many definitions of remote sensing, and in this case the most all-inclusive is also somewhat misleading. According to the Canada Centre for Remote Sensing (CCRS), part of the National Research Council, “[RS is] the science, technology and art of obtaining information about objects or phenomena from a distance (i.e. without being in physical contact with them).” (CCRS, 2005). Even the CCRS admits that this is far too broad and loose – it could certainly apply to most geophysical techniques, and for that matter even to looking out the window to check the weather. Back when the RS was younger and more brash and the CCRS was
less formal, there were also tongue-in-cheek definitions on their website. One of them was “backwards astronomy” and another was “seeing what’s not there.” Both have a grain of truth that I will explore more fully. In practice, RS has come to mean images of Earth’s surface. Although this includes filmbased air photos, RS almost always uses digital images. RS most commonly means such images acquired from satellite platforms –again, unless airborne is specified (as in “aerial RS”). So we are left with a working definition, still a bit fuzzy about the edges, that:
Remote Sensing is the art, science, and technology of obtaining information from digital images of Earth’s surface acquired from satellite platforms.
The other stock party response to my RS answer is “Oh, yes, I have one of them in my car. It gets me lost all the time.” As soon as “satellite” comes into the picture, minds leap to GPS, the US-based Global Positioning System, which is colloquially called “SatNav” outside of North America (in case you find yourself at a party in the UK, let’s say). RS is not GPS. GPS simply lets you know where you are, within constrained accuracy, in terms of a chosen set of absolute coordinates such as latitude and longitude. To make that information useful one needs at the very least a map. Once the map is added, a Geographical Information System (GIS) comes into being,
which is not the same as RS either. A GIS is a system that brings in many forms of data, either raw or interpreted, each attached to a location. The system can then combine all its information to answer specific user-defined questions.
RS images constitute one important potential input into a GIS system. Often these images are used just as attractive backgrounds for output maps or GPS screens, but that is ignoring the vast amount of information that the image itself can be teased into supplying. Getting that information is the heart of the “art, science, and technology” of RS. Most commonly, images are processed to provide a map that gives an attribute to each pixel (location). Sometimes these maps are categorical, for example “this pixel is limestone.” “Continuous field” maps can be derived that list the percent cover of several items within a specified area, e.g., 50% limestone, 40% vegetation, and 10% water (see for example Oak Ridge National Laboratory, 2009). The image can often be manipulated to yield information on physical properties such as vegetation productivity. Particular shapes or textures or lineaments may be highlighted. These more complex products require a great deal of preparation, but are becoming increasingly available as RS matures.
A final confusion that needs removing: a typical satellite image does not automatically provide a digital elevation model (DEM). DEMs can be produced from stereo RS images (though few images are available as stereo pairs), from certain kinds of satelliteborne radar, and from LiDAR, all of which fit our RS definition. But the everyday Google Earth kind of RS image does not come equipped with its own DEM; that must be produced elsewhere and added to the RS data in a GIS-type system.
The “Earth’s surface” part of the RS definition may immediately turn off some geologists, who are most often concerned with finding out what is beneath the surface. Of course looking at the surface can tell a trained eye a lot about the sub-surface, as any field geologist knows. The question then becomes, what surrogates occur on the surface that will provide information about the subsurface? To answer that question we first need more background information. Specific answers will be tackled in a later article. Fortunately, what you see on Google
Figure 1. Digital image of Earth rising over the Moon, taken by astronauts aboard Apollo 8 in 1968. Image NASA, used with permission.
Earth or by looking out the airplane window does not represent the total information that RS images provide.
RS in our sense got its start with the missions to the Moon back in the 1960s, and to some extent with the cold war of the 40s and 50s. Early in this period highflying spy planes, such as the famous U-2, took ordinary photographs of very large areas of earth, and in the process specially adapted cameras were developed for dealing with these images’ special problems of distance, atmospheric interference, and image geometry. During the 1950s and 60s, both the US and the Soviet Union launched extensive military surveillance satellites, data from which has been declassified since the early 1990s (McDonald, 1995). Of course, photographs were taken during the space program, notably of Earth Rising and the Full Earth, which galvanized society to consider Earth as a unified planet (Figure 1). The practical and symbolic foundation was thus laid for advances in RS. When the Moon mission was wrapped up in the early 1970s, and building on the technology developed for reconnaissance satellites, NASA was able to embark upon a satellite system first called EO for Earth Observer. It was later named Landsat – you will most likely be aware that
the Landsat program is still operational, though of course updated many times.
Since photography was the genesis of the project, at first the satellite sensor systems were designed to reproduce, as much as possible, the information on a photograph. The problem, of course, is that satellites stay in orbit, and do not return film to earth. CORONA and Soviet systems in the 1960s and beyond that did exactly that: satellites with huge rolls of film were sent into orbit. At the end of their roll, the film was returned to the atmosphere, where it was intercepted in the air and sent for developing. But that is a clunky solution at best. Therefore, digital imagery was employed in the new systems, because it could be transmitted to Earth without physical film being in play.
The simplest digital image uses photosensitive materials to register the amount of light being received in a particular waveband, or “colour.” Filters or diffraction gratings are used to limit the light received by the sensor to the chosen waveband only. The photosensitive material causes an electrical current to flow, rather than causing a photochemical reaction, but other than this the process is conceptually very like that of colour film. Light energy is registered in red, green, and blue wavelengths.
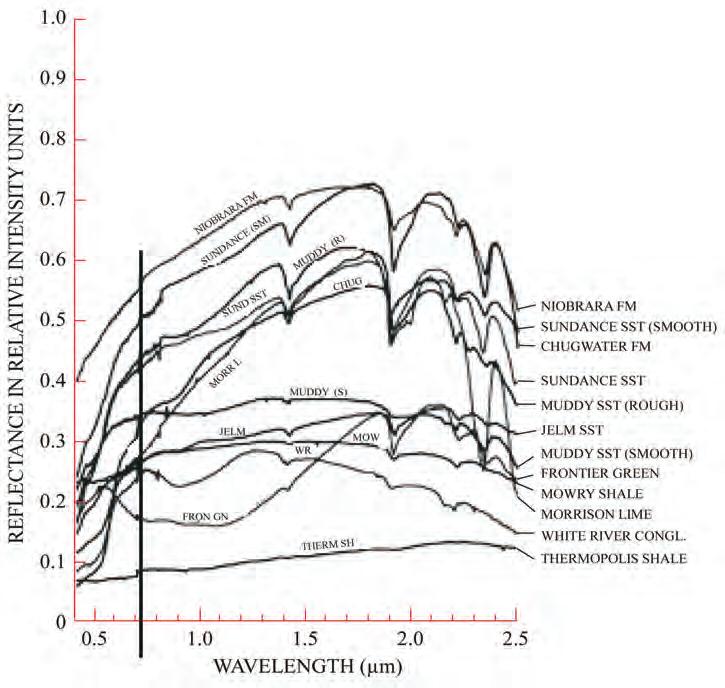
Instead of combining these as film does in a colour separation, digital imagery combines the three on a screen. The light used is sunlight as reflected by surface objects. Since the amount of each wavelength that an object reflects is mainly a function (in the visible region of the electromagnetic spectrum) of its surface chemical composition, colour gives us information from which we can figure out, in many cases, what a reflecting object actually is. Students often resist this concept, until it is pointed out that the difference between a red cotton T-shirt and a green cotton T-shirt is the dye, a substance that differs in its chemistry. The amount of each wavelength that an object reflects is so characteristic that we construct spectral reflectance curves to show how much light of each wavelength is reflected (Figure 2).
Up to this point, interpreting what our image contains is identical to interpreting a classical colour air photo, or to viewing something with our eyes and a telescope properly positioned in an airplane. Hence the definition of RS as “backwards astronomy.” We apply skills of knowing the colour, shape, texture, associations, position, etc. to identifying each object in the scene. Because so much data comes from satellite images, with the whole earth being imaged twice a month or so, there was no option but to develop ways to automate interpretation. The situation only became worse as more data piled up. Landsat 1 was launched in 1972, and it took many years of technological development before there was even a good way for the “average scientist” to visualize these digital images. File size continued to severely limit dissemination and use until the 1990s. But over the years, algorithms have been developed that do allow a computer to do much of this interpretation. Even today, getting a computer to automatically classify by shape and association, as opposed to colour or tone, proves a daunting task.
The simplest image interpretation task to automate is based on colour. If a shale formation is pale grey and sandstone is red, then the computer can very easily mark pixels as belonging to a particular formation or rock type (Figure 3). It can even take into account the colour variability within each formation. The importance of this kind of classification led to adding additional wavelength bands to the sensor’s repertoire. It has been known for decades that chlorophyll-containing vegetation reflects a great deal of light in the near infrared (nir) spectral range. In fact, it reflects far more nir than green. If our eyes could only see nir, we would likely describe leaves as being “a very pretty shade of
on page 22...)
Figure 2. Spectral reflectance curve of formations exposed at the surface in Wyoming. The vertical line separates visible wavelengths to the left from the infrared spectral region to the right. From Short 1982, used by permission. (Continued
greenish nir.” This knowledge is the basis for “false colour” air photos showing vegetation as red. These images have been familiar to image interpreters since the 1940s, when the technique was developed for camouflage detection (cut vegetation would immediately stop reflecting infrared, so would not show red on the photo, but it took a much longer time to lose its green colour). Since recording nir energy was not any more difficult than recording red, green, or blue, and had a respectable history of usefulness, the earliest Landsat sensors added a nir wavelength to its repertoire.
Once this colour barrier had been breached, what was there to stop adding additional wavelength bands to sensors, so as to get information about objects that reflected these other wavelengths in unique – and identifiable – ways? The usual answer: nothing but engineering and money. Wavelengths a bit longer than the nir, called the “shortwave infrared” (swir) or “mid infrared” (mir) required a different photoelectric-sensing medium from the visible and nir, but that was “only” a question of money. A bigger problem early in Landsat was data volume. Each wavelength band would add a considerable amount to the file size.* Only so many bits could be downloaded to a receiving station while the satellite was visible above the horizon. Only limited storage space was available onboard the satellite. And only so much could be loaded and processed on computers of the era. Gradually but dramatically, each of these problems has diminished, although the RS corollary of Murphy’s Law maintains that you always want to use more data than your system can handle. The first effect was two additional wavelength bands added to Landsat, starting with the Landsat 4 Thematic Mapper (TM) sensor launched in 1982.
This Landsat launch was particularly welcome for geologists. At first TM was expected to add a second nir band to harvest more information about snow and ice, and some vegetation and soil moisture information. But late in the design stage, it was decided to add “band 7” in the swir, which was designed to help identify limestones, hydroxide alteration products, and some clay minerals, as well as soil moisture. Referring again to Figure 2, spectral reflectance curves for several prominent formations in Wyoming are shown. The general principle is that the
farther apart the different lines are in the vertical direction, the more one will be able to distinguish among the formations. Since Landsat’s band 7 is between 2.080 and 2.35 μm, the figure readily shows that band’s utility when added to the visible bands (to the left of the vertical line) and the nir at 0.76-0.9 μm (band 4) and 1.55-1.75 μm (band 5).
Landsat was the first major Earth observing satellite. Landsat is often referenced not only because it was the first, but also because since early 2009 all Landsat images have been freely downloadable to anyone (go to http://www.landcover.org/data/landsat/). Landsat, which has pixels sized at 30x30m, is easy to download and use, and each image covers about 185x185 km, allowing regional interpretations. It also has global coverage, and excellent technical support and information. For an excellent explanation of Landsat parameters from NASA, link to http://landsat.gsfc.nasa.gov/data/.
Nevertheless, Landsat is not the only game in town. Others joined it in the 1980s, and since the late 1990s there has been an explosion of different sources of imagery. Enumerating them is more than can be
* Today’s Landsat images contain about 65 Mb per wavelength channel, which compresses for transmission in lossless TIFF format to about 25 Mb. An image between 1982 and 1999 contains 7 channels, and since 1999 contains 9 channels. Prior to 1983, Landsat images were less detailed spatially or in number of available tones, and occupied about 18 Mb per channel; an image contained 4 channels. Compression algorithms were poorly developed in this early period.
tackled in a general overview. From what has been said so far, it becomes clear that there are several things that can be varied to obtain images for specific purposes. The main one is what spectral bands are used. Almost all images contain some visible and some near-infrared bands, because these together are key to examining vegetation, which after all covers 70% of Earth’s land surface. Some satellites specialize in quite different ranges of electromagnetic radiation, such as thermal or microwave (ultraviolet is not used because the atmosphere’s absorption of it prevents obtaining clear images from satellites). Some of this data is quite useful to geologists, and will be considered in a later article.
Not only the bands chosen, but the width of the bands can be varied. Instead of recording all reflection between 1.55 and 1.75 μm, for example, a sensor might record one reading between 1.50 and 1.51 μm, and another between 1.51 and 1.52 μm. Looking again at Figure 2, you will see that some rocks have very narrow dips in their spectral reflectance curves. Focusing on these bands can be very useful – so long as you are able to choose the appropriate wavelengths. Images that contain many narrow bands are called hyperspectral. Such images produce, of course, much larger file sizes, and demand more complex processing techniques. There are also technological constraints: the narrower the band, the less total energy is
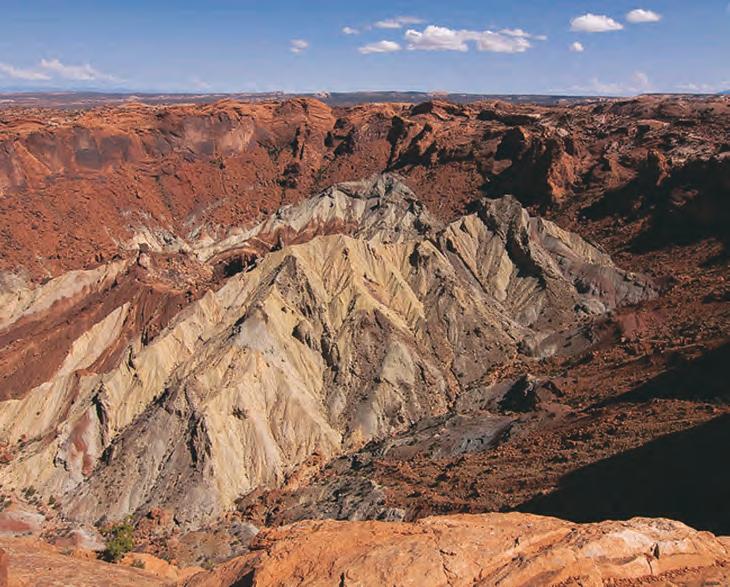
Figure 3. Formations distinguishable on the surface using colour alone, in the visible wavelengths. Automated colourbased classification can account for variability in each. Upheaval Dome in Canyonlands National Park, Utah. Lightcoloured rock in centre is Permian Organ Rock Shale surrounded by Jurassic Navajo Sandstone (Huntoon 2000). Photo Ethan Hall-Beyer, used with permission.
present, so sensing has challenges akin to taking photographs in low-light conditions. Long exposure will not solve the problem: satellites keep moving! Nevertheless, these hyperspectral images are available, some for free (see for example Jet Propulsion Laboratory, 2004).
Another variable is the spatial resolution of an image, either in terms of the size of a pixel or the total area covered by the whole image. Getting high spatial resolution is an area of very rapid commercial development at present, with many competing companies offering satellite images with pixels as small as a half square metre, clearly competitive with aerial photography. These images tend to use only conventional visible and nir bands. They cover small areas of only a few kilometres on a side and they are generally quite expensive. There is no global coverage, and they must be custom-ordered except for a limited number of archival images, mostly of urban areas. Their application to geological topics is limited, but they may serve where an air photo would otherwise be used.
So far we have looked at some of the kinds of images available, some of the things they can be used for, and some of the data sources – as well as clearing
up confusions. Future articles will examine specific RS problems geologists face and what particular solutions might be found in existing imagery and processing techniques. We must also address the question of training, both comprehensive courses or degrees and “just in time” background information and technical support. I would welcome any readers’ ideas about specific topics to be addressed or questions to be answered. Please contact the author at mhallbey@ucalgary.ca.
R EFERENCES
Canada Centre for Remote Sensing. 2005. http:// ccrs.nrcan.gc.ca/glossary/index_e.php?id=486, accessed September 20 2009.
Huntoon, P. W. 2000. Upheaval Dome, Canyonlands Utah: Strain indicators that reveal an impact origin. In: Geology of Utah’s Parks and Monuments. D.A. Sprinkel, T.C. Chidsey, Jr., and P.B. Anderson (eds.). Utah Geological Association Publication 28.
Jet Propulsion Laboratory. 2004. ASTER: Advanced Spaceborne Thermal Emission and Reflection Radiometer. Jet Propulsion Laboratory, California Institute of Technology. Main document 2004, data and technical updates 2009. http:// asterweb.jpl.nasa.gov/index.asp, accessed September 20 2009.
McDonald, R. A. 1995. Corona: Success for Space Reconnaissance, A Look into the Cold War, and a Revolution for Intelligence. Photogrammetric Engineering and Remote Sensing, vol. 61, p. 689-720.
Oak Ridge National Laboratory. 2009. Distributed Active Archive at the Oak Ridge National Laboratory. http://webmap.ornl.gov/ wcsdown/dataset.jsp?ds_id=10011, accessed Sept. 24 2009.
Short, N. 1982 (updated 2009). Washington: Scientific and Technical Information Branch, National Aeronautics and Space Administration, Washington, D.C., NASA Reference Publication 1078. Latest version available at http://rst. gsfc.nasa.gov/Sect2/Sect2_1.html, accessed September 20 2009.
BIOGRAPHY
Dr. Hall-Beyer received her B.Sc. from Middlebury College in Vermont, her M.Sc. in geology (metamorphic mineralogy and petrology) from the University of Alberta and a Ph.D. from the Université de Sherbrooke in remote sensing in geography. She is presently continuing her thirtyyear career in teaching as an Associate Professor of Remote Sensing in the Geography Department of the University of Calgary. She can be reached at mhallbey@ucalgary.ca.


PETROLEUM ECONOMICS FOR GEOLOGISTS
Part 3 – Production Forecasting Basics
| by Colin Yeo, P.Geol. and Lionel Derochie, P.Eng.
INTRODUCTION
Of all the factors used in a petroleum discounted cash flow (DCF) model, it is the production forecast that best lends itself to geological input and considerations. In the DCF model, revenue is simply product volume multiplied by product sales price. However, the quality, quantity, and timing of oil, gas, and by-product production are essential in determining the magnitude of the revenue. We have seen that discounting makes near-term production more valuable than later term if product prices remain constant; correctly predicting when and how much a well or pool will produce is critical. We also know that refiners place a higher value on oil grades that yield high proportions of certain refined products and, similarly, gas producers will fetch a higher price for liquid-rich gas as opposed to lean gas. The production forecast for all products is fundamental in determining the profitability of an investment.
Geologists are instrumental in providing important rock property data used to calculate original oil and gas in place, estimating flow rates, examining offset producers searching for appropriate analogs, and gathering production profiles for type well compilation. Care must be taken to honour and analyze all available data to ensure that the most likely forecast is generated. A successful prospect is one that not only finds hydrocarbons but meets or exceeds forecasted rates and reserves. While investors know that price is an uncontrollable factor, they do expect that a production forecast will be somewhat accurate as it is based on physics, chemistry, and engineering principles.
There are four common methodologies used to forecast production rates and reserves: volumetric, decline analysis, material balance, and statistical (type or analog well). Lisa Dean and her colleagues at Fekete Associates published extensively on reserve estimation last year as part of their excellent series in the Reservoir (Reservoir Engineering for Geologists, October, 2007 to December, 2008). In this article, we will focus on applying these techniques to generate accurate production forecasts as input into the DCF model.
VOLUMETRIC METHOD
R ESERVE FORECAST
In rank wildcat areas or where a formation has never produced, basic geological
Where:
OGIP is original gas in place in cubic metres or standard cubic feet
A is area measured in hectares or acres
h is pay thickness in metres or feet
� is porosity as a decimal fraction
Sw is water saturation as a decimal fraction
T s is standard temperature, °Kelvin (273° + 15°C) or °Rankine (460° + 60°F)
Ps is standard pressure, 101.35 kPaa or 14.65 psia
Tf is formation temperature, °Kelvin (273° + °C at formation depth) or °Rankine (460° + °F at formation depth)
P i is initial reservoir pressure, kPaa or psia
Zi is the compressibility factor at Tf and Pi after Dean, 2007
information can be used to calculate reserves and production. Rock properties, such as porosity, permeability, fluid saturation, and pay thickness, can be determined or inferred from core data and well logs. Areal extent can be estimated from facies analysis, depositional setting, and mapping. Fluid properties can be determined from PVT analysis (chemical) and pressure data. This information is used in the
volumetric reserve equation (Figures 1 and 2) that calculates the volume of oil or gas stored in a pool. It is important to note that both oil and gas have value as separate products and must be accounted for independently in production forecasts and reserves, allowing each product to be valued separately. Gas and natural gas liquids must also be
(Continued on page 26...)
Figure 1. Calculating original oil in place.
Figure 2. Calculating original gas in place.
(...Continued from page 25)
forecasted and valued separately. Natural gas liquids condense from a gas stream as gas is brought to the surface and experience lower pressures and temperatures relative to reservoir conditions. Of course, as liquids drop out of the gas stream, the volume of remaining gas is less. Further losses are added through metering errors, leaks, and fuel gas for compressors. Natural gas liquids are important because liquid prices are highly valued and correlative to oil price and can dramatically increase revenues, especially when gas prices are low.
Because OOIP and OGIP are simply resource estimates of volumes of oil and gas in the ground, a recovery factor needs to be applied to the volume to make some estimate of reserves. Recovery factors vary depending on the reservoir drive mechanism (the energy forcing the oil or gas from the rock to the wellbore). Drive mechanisms include solution gas, gas cap expansion, water influx, and gravity drainage and recover anywhere from 2% to 60% of the original volume in place. Recovery factor is influenced by reservoir permeability and fluid properties of the oil and gas.
There is significant uncertainty around many of the factors in volumetric calculations. Estimations of areal extent and thickness of the reservoir, variability in porosity and Sw, and wide ranges in recovery factor tend to make reserve estimates unpredictable. However, with the large number of wells and well information in western Canada, there is usually information from wells in close proximity that can be used as an analog or provide bookends to a range of values. Geologists need to benchmark their volumetric reserve estimates by comparing them to other nearby pools and explain any significant deviations through rock, fluid, or recovery data.
PRODUCTION FORECAST
Predicting recoverable reserves provides an anchor for the production forecast; it is the sum of the monthly or yearly estimated production volumes over the life of the well. The Darcy Equation for Radial Flow is shown in Figures 3 and the gas well inflow equation is found in Figure 4. An initial rate can be calculated and sequentially reduced as reservoir pressure decreases with production. The initial rate and recoverable gas in place are the end points on a plot of production rate vs. cumulative production and can be used to estimate a monthly or annual production volume. A material balance plot (addressed later) which relates changes in reservoir pressure to produced volumes can be combined with the rate vs. cumulative production graph to provide subsequent rate estimates during depletion.
The shape of the production curve is an important consideration on the rate vs. cumulative production graph. A constant percentage decline (exponential decline) produces at a higher rate but for a shorter period of time while hyperbolic and harmonic decline is proportional to a fractional power of the producing rate over a longer time interval. Figure 5 shows the different production profiles for different decline exponents and the impact they can have on cash flow. Figures 6 and 7 list various rock property, fluid and trap geometry considerations, and the effect these have on the decline exponent. The decline exponent is important because present values are higher when revenues are maximized early. Exponential decline generates a higher NPV, all else being equal.
Economic evaluation software uses initial rate, ROIP or RGIP, and a user-defined decline exponent to make a monthly or annualized production forecast. These are imported into a DCF model for calculating a revenue stream.
Figure 3. The Darcy radial flow equation is used to determine the flow rate for oil.
after Smith, 1992
Figure 4. The gas well inflow equation is used to determine the flow rate for gas.
27th ANNUAL CSPG SQUASH TOURNAMENT
February 4 – 6, 2010
World Health Club • 722 Edgemont Blvd NW
there is a maximum of 125 players! Get your entry form in early to avoid disappointment! Register online at www.cspg.org/events/events-social-squash-register.cfm
EVENTS: Men’s and Women’s A, B, C, D, and Novice.
ENTRY FEE: $75.00 Members (Members of the CSPG and CSEG, Spouse/Partner)
$110.00 Non-Members
$20.00 Doubles
• Two guaranteed matches (Saturday teams tourney), T-Shirt, refreshments and food during the tournament, Saturday night dinner and draw prizes.
• Pre-tournament drop-in squash at Bow Valley Racquet Club (2nd Street and 5th Avenue S.W.) on Monday, January 25, 2010 from 6:00 pm to 8:00 pm. Generously sponsored by Tucker Wireline Services.
• Pre-tournament Registration Social will be at the Bow Valley Racquet Club (2nd Street and 5th Avenue S.W.) on Tuesday, February 2, at 5:00 pm. Pick up your tournament kit and first draw time. Enjoy a free pint of ale with munchies.
• All door prize draws Saturday evening – must be present to win.
ENTRY DEADLINE: Early Bird Deadline January 4, 2010. Qualify for Early Bird Draw Prize. Registration Deadline January 14, 2010. No refunds after this date.
REGISTRATION DETAILS:
q CSPG q CSEG Member # qNon Member
Name: _________________________________________________Email: _____________________________________
Company: ________________________________________________________________________________________
Phone: Daytime: Evening:
q Male q Female Shirt size: q S q M q L q
Level/Frequency of Play: q A q B qC q D q Novice
Doubles Squash ($20.00 extra for Doubles if playing singles as well): q Yes q No
Will you be attending dinner: q Yes q No Meal Preference: q Meat q Veggie
Guest Name:
q Male q Female Shirt size: qS q M q L qXL q XXL
Level/Frequency of Play: q A q B q C q D qNovice
Doubles Squash ($20.00 extra for Doubles if playing singles as well): q Yes q No
Will you be attending the dinner: qYes q No Meal Preference: q Meat q Veggie
PAYMENT DETAILS (GST Included. GST# 118836295):
$75.00 Member/Spouse
$110.00 Non-Member (CSPG/CSEG members will be given first priority.)
$20.00 Doubles
$35.00 Extra Meal Ticket (Non-playing guests. Maximum 15 spots; first-come, first served).
TOTAL
q VISA q MC qCheque (Payable to Canadian Society of Petroleum Geologists) Card Number: ______________________________________________ Expiry: _______________________________
Name of Card holder (Please Print): Signature:
REGISTRATIONS TO BE SENT TO: Canadian Society of Petroleum Geologists Attn: Squash Tournament
600, 640 8 AVE SW, Calgary, AB T2P 1G7 Phone: (403) 264-5610 Fax: (403) 264-5898
L IMITS ON PRODUCING R ATE
In the interest of oil and gas conservation, limits are placed on monthly production volumes. Each province calculates rates somewhat differently but all have the effect of artificially restricting production. Rate restrictions must be considered when building a production forecast. Similarly, restricted access to pipelines and gas processing plants will curtail production from wells and must be accounted for in the production forecast.
DECLINE A NALYSIS METHOD PRODUCTION DECLINE
Once a well or pool has produced enough reserves to show a definitive trend of declining production, decline analysis can be used to forecast future production and, with an extrapolation to the economic limit of the well, determine the estimated ultimate recovery (EUR) of the well. It is an easy, cheap, and fast technique and, although it is meant to be used only on single wells, pools can also be analyzed by grouping wells. Analysis is only valid for depletion drive reservoirs with a constant bottom hole flowing pressure and a specific flow regime.
The basis of this curve-fitting technique is the Arps Equation (Figure 8). As shown in Figure 5, when the decline exponent, b (sometimes referred to as “n”), is 0, the decline rate is independent of production and is a constant percentage each year. The decline is said to be exponential and plots as a straight line on a semi-log rate vs. time graph and an arithmetic rate vs. cumulative production graph. When b falls between 0 and 1, the decline is said to be hyperbolic and is proportional to the production rate. A hyperbolic decline never plots as a straight line on any graph. When b equals 1, the decline is harmonic and the rate is also proportional to production. A harmonic decline plots as a straight line on a semi-log plot of rate vs. cumulative production. The most common plots used in this analysis are semi-log production rate vs. time, production rate vs. cumulative production, and oil cut vs. cumulative production.
Production problems can give a false decline so any deviation from the established trend must be carefully addressed. Well workovers and infill drilling can change decline trends as can regulatory constraints that artificially restrict production in the interests of conservation. For gas wells, back pressure from pipelines and compression coupled with changes to operating conditions are issues that will affect decline trends. Some care must be taken to ensure that calendarday-producing rate (monthly production /
days in the month) are used in the analysis rather than producing-day rate ([monthly production / producing hours in the month] * 24), which can lead to erroneously high production rates and EUR estimates. A consistent gap between producing-day and calendar-day rates should be investigated as remedial action may be needed to ensure the well is producing 24 hours per day.
In practice, most wells exhibit complex declines. Experts recommend not using a decline exponent greater than 0.8 and remembering that exponential declines are rare. They are inclined to let computer software determine the decline exponent,
within reason. When curve fitting, it is important not to fit to the transient phase of the production history as the expanding pressure wave has not yet reached the boundary of the reservoir.
PRODUCTION FOR ECASTING
Figures 9 and 10 show a Value Navigator curve-fitting screen and a resulting tabular production forecast. Visually, the pseudosteady state portion of the production history can be seen in the lower right hand portion of both graphs. This curve-fitting software will yield a forecast of monthly production into the future and is eventually terminated when the economic limit of the
Figure 5. Hyperbolic and harmonic decline exponents mean less monthly volumes of oil and gas early in the life of the well. Because of discounting effects, this shortfall adversely affects the NPV of the well. Additionally, low production rates in the later life of hyperbolic and harmonic decline wells makes them susceptible to negative operating income as revenue fails to cover operating costs.
Figure 6. Encountering certain rock types or fluids may impact the shape of the production curve.
The ArpsEquation for Curve Fitting
well is reached. It is this production forecast that is used along with a price forecast to predict future revenue from the well.
Material Balance Method
Material balance is really an exercise in inventory control, accounting for produced and remaining fluids. This technique does not generate a production forecast but is an independent method of determining original oil and gas in place. Material balance is based on the premise that as oil and gas are removed from a reservoir, the remaining oil, gas, water, and rock will expand to replace the voidage. Reservoir pressure is reduced in the process and the pressure drop is directly proportional to produced volumes.
The reader is referred to petroleum engineering handbooks for a more detailed
0<b<1 hyperbolic b=1 harmonic after
discussion on the derivation and application of material balance equations. However, in the case of gas wells, a useful relationship between pressure and cumulative production can aid in generating a production forecast and is pointed out here.
The general material balance equation for a depletion-drive gas reservoir is:
P/z = Pi /zi (1 – G p /G)
where P is the current reservoir pressure in Kpa or psia, z is the current compressibility factor, Pi is the original reservoir pressure in Kpa or psia, zi is the original compressibility factor, G p is the cumulative gas production in 103m3 or MMcf and G is the original gas in place in 103m3 or MMcf.
Knowing the relationship between reservoir
pressure and produced gas volumes is key to the gas well inflow equation that was addressed earlier. Gas flow rate can be calculated for each incremental drop in reservoir pressure and subsequent flow rates can be used to calculate produced volumes. This iteration between the inflow equation and material balance plot will generate a production forecast.
Material balance requires that 10 to 15% of the reserves must be produced to develop a good trend. In practice, production of this magnitude lends itself to decline curve analysis as a more efficient and effective way of generating a production forecast. In the next installment, we will see how volumetric and material balance estimates of OGIP can be used to anchor and guide decline analysis interpretation.
StatiSt ical ( t y pe Well) Method
As industry becomes more focused on resource plays characterized by high geological success but variable production profiles, “type wells” are generated by normalizing production data to a common start date (also called normalized time plots) and then calculating the arithmetic average. The resulting single, average production profile is representative of what can be expected from a large drilling program. Individual wells are initially selected with production from similar geological formations or geological groups and with similar operating conditions. Well vintage is also an important consideration as the general trend in industry is to be finding wells with smaller reserves and lower initial productivity than in the past.
Perforations
VSP
PLT
Unique system, Decades of tools performance and accuracy
If a well has no production history, it is not used in calculating the type curve and is not included in the well count. If the well has only a limited production history, the well is dropped from the well count when it is no longer producing. When the well count falls below a certain percentage of the well group, the production average is terminated. The percentage cutoff is usually 75%. Statisticians agree that 30 well entities are the minimum number needed for a representative sample.
The resulting type production profile provides important parameters that will be used to build a multi-segment forecast for new wells. Each segment has an initial rate, an initial decline, a decline exponent, a final flow rate, and a period of time to maintain the forecast segment. Any number of segments can be used to construct the type curve that replicates the group average.
(Continued on page 30...)
Figure 7. The shape of the trap and the reservoir drive mechanism will also affect the type of production decline.
Laustsen, 1996
Figure 8. The Arps Equation is the basis of curve fitting and forecasting future production.
Value Navigator can create type production profiles quickly, easily, and accurately from any data set. It is very important that the practitioner carefully select wells that represent a full spectrum of what can be geologically expected.
O T HER M E THODS
Reservoir simulation is a powerful tool in forecasting production. A large amount of rock property, pressure, fluid, and production data is gathered and loaded to models for analysis and projections of future pool performance. A critical element is how well the model matches historical production trends, which gives confidence to the forecast period. Examples of such models are black oil, waterflood, compositional, miscible, polymer, and thermal simulations. There is a large library of reliable software available.
H Y DROCARBON PRODUCTS
I t is extremely important that all hydrocarbon products be identified and forecasted separately. Each product has its own price and as gas price becomes disconnected from oil price, natural gas liquids become a very valuable component in gas well economics. Liquid yields can be calculated from gas analyses that are readily available from public sources.
T OOLS
T here are many curve-fitting software packages available for decline analysis. The practitioner needs to find a suitable product that makes analysis quick, easy and accurate. This software can build a production forecast from as little as an initial rate, a recoverable oil- or gas-inplace volume, and a decline exponent. Of course, the more data a user inputs, the more accurate the forecast.
SU MMARY
The production forecast is an essential and important component of value. The discounted cash flow model calculates revenue by taking price and multiplying by monthly production volume. Luckily, with so much data available in western Canada and access to powerful computer curve-fitting programs, generating production forecasts is easy and reliable. In the next installment, practical examples of curve fitting and typecurve construction will be shown.
R E FERENCES
D ean, L. 2007. Reservoir Engineering for Geologists. Canadian Society of Petroleum Geologists, The Reservoir, vol. 34, issue 11, p. 20-23.
Laustsen, D. 1996. Practical Decline Analysis
Part 1 – Uses and Misuses. Journal of Canadian Petroleum Technology, vol. 35, no. 9, p. 34-37.
Smith, R. V. 1992. Open Flow of Gas Wells. In: Petroleum Engineering Handbook. H. L. Bradley (ed.). Society of Petroleum Engineers, p. 33-1 – 33-23.
Sproule Associates Ltd. 2008. Evaluation of Canadian Oil and Gas Properties. Calgary, Alberta. Course Notes.
Support for this series is provided by Energy Navigator who have reviewed articles, supplied technical consultation, and critiqued manuscripts. We thank them for their help.
Figure 9. Screen capture of a Value Navigator curve-fitting routine. Value Navigator provides a statistical best fit decline but the user is free to override certain elements to produce a customized decline analysis.
Figure 10. Typical production output table showing actual and forecast rates and cumulative production.
Five Great Days of the Finest Geoscience Training for One Low Price
Tentative List of Courses:
• Principles of Reservoir Characterization
• Fundamentals of Siliciclastic Sequence Stratigraphy
• Seismic Stratigraphy & Seismic Geomorphology
• Tight Gas Sands
• 3D Seismic Profiles of US Shale Plays
• Appraising and Developing Coalbed Methane Reservoirs
• Risk and Uncertainty Analysis for Unconventional Resource Plays
• “Old” (Pre-1958) E-Logs: A Quick Review
• Regional Stress and Reservoir Geomechanics
• Image Log Interpretation
• Formation Evaluation of Thinly-Bedded Reservoirs
• Quick Guide to Carbonate Well Log Analysis
(Four concurrent sessions each day - mix and match according to your interests and training needs. Lunch buffet and refreshments included each day.)
Hosted by the Norris Conference Center: 803 Town & Country Lane
Houston, TX 77024
Phone: 713-590-0950
Fax: 713-590-0961
Special AAPG group rates at nearby hotels.
Registration and information:
Toll-free (U.S. and Canada) 888-338-3387, or 918-560-2650
Fax: 918-560-2678
E-mail: educate@aapg.org
Download a registration form at: www.aapg.org/education/wec.cfm
Tuition for the week:
AAPG Members..........................$1595 $1695 Non Members............................$1695 $1795
Individual Courses....................$400/day $450/day
(Your five-day badge can be transferred to a friend or colleague if you can't come all five days.)
GO TAKE A HIKE
Helen Lake stromatolite beds, Banff National Park, AB
| By Philip Benham and Cindy Riediger
Trailhead: Along the Icefields Parkway, 29 km north of the Lake Louise junction with the TransCanada Highway.
The parking lot is located on the east side of the highway opposite Bow Lake and just north of the Crowfoot Dike.
Distance: 15 km round trip, about 3 hours one way. Elevation Gain: 650 m (2130 ft).
Helen Lake is nestled in beautiful alpine meadows of Banff National Park, on the trail en route to Dolomite Pass The hike starts in the treed slopes on the west side of Cirque Peak. At about 3 km, the trail climbs around the shoulder of Cirque Peak , and heads north towards Helen Lake. The hiker is treated to stunning panoramic views of the NeoProterozoic to Cambrian stratigraphy on both sides of the valley. Keep watch for the many marmots (Arctomys columbianus) amongst the rock fall on either side of the trail, and beware of the occasional grizzly bears that frequent the area.
Helen Lake itself provides a beautiful spot to stop for lunch or a break. The stromatolite beds occur in the Middle Cambrian Pika Formation, and are reached by continuing along the trail past Helen Lake, and climbing up the unnamed ridge above the lake. An outcrop of the stromatolite beds is readily apparent near the top of the ridge. However, a full 3-D exposure of the stromatolites is easily located by following the beds along strike to the north. There the domal stromatolites can be seen in beautifully exposed cross section and plan views, in an area about 800 m by 10 m (Dolph and Gibson, 2008). Also keep an eye out for carbonate hard-grounds, bioturbation and syneresis cracks.
The stromatolites are elongated in plan, likely due to tidal flow, and provide insights into the Middle Cambrian marine depositional setting. Most geologists will know that stromatolites are preserved as finely laminated sediments, produced by the trapping and binding of fine sediment on cyanobacterial mats. They are particularly abundant in Proterozoic sediments, due to dearth of grazing fauna. Stromatolites are still present today, primarily in stressed environments where grazing pressure is reduced, such as at Shark Bay Australia.
R EFERENCES
Dolph, J.A. and Gibson, D. 2008. Recent discovery of an extensive stromatolite outcrop in the Middle Cambrian Pika Formation, Helen Lake-Lake Katherine area, Banff National Park. 2008 CSPG CSEG CWLS convention abstract, p. 671.
Figure 2. View of Proterozoic strata en route to Helen Lake.
Background
Photo by Astrid Arts.
Figure 1. The trail quickly climbs to reveal views of the Crowfoot Glacier to the west.
Map from canmap.com courtesy of Dept. Natural Resources Canada.
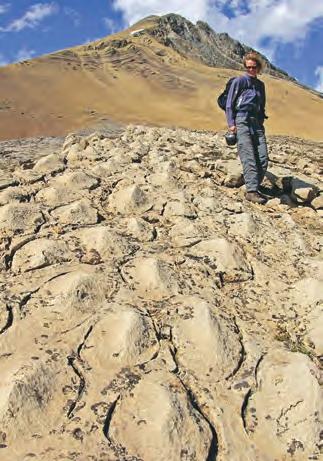
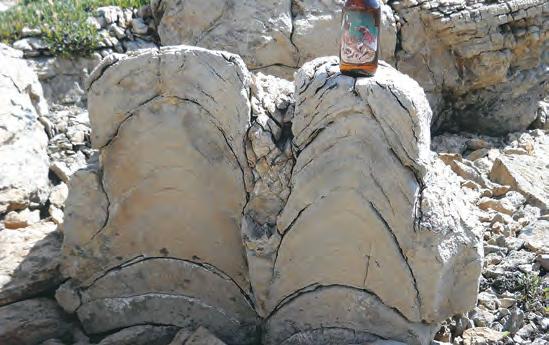
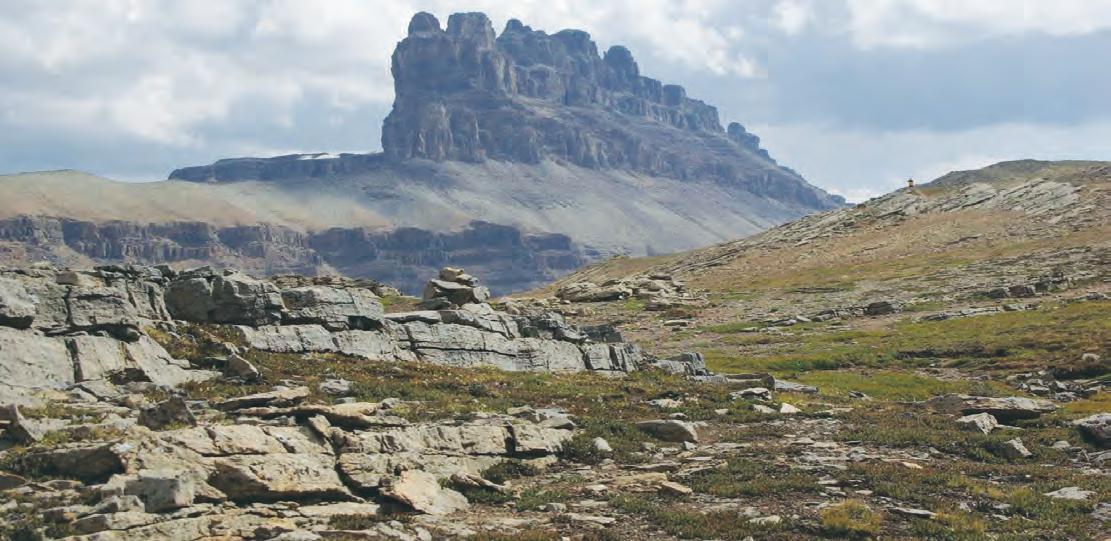
The Reservoir Committee welcomes contributions from our readership to this series. If you wish to offer a submission to Go Take a Hike on your favourite hike of geological interest, email the Reservoir at heather.tyminski@cspg. org for more information.
is
for most
Figure 3. A look back on Helen Lake on the final ascent to the stromatolite beds. Bioturbated shoreface deposits of Pika Fm in foreground.
Figure 4. Oriented stromatolites in the foreground and folded red continental deposits of Arctomys Fm on Cirque Peak in background.
Figure 5. Bioturbated shallow marine carbonates.
Figure 6.Profile view of the stromatolites with Shale Ale bottle for scale.
Figure 7. View from top of trail ascent from Helen Lake. Arctomys Formaiton stromatolite beds in foreground. Dolomite Peak in the background which
visible
of the hike, consists of middle and Upper Cambrian strata of the Waterfowl and Sullivan Formations.

WIUGC 2010
CANADA’S GREATEST CONFERENCE EARTH SCIENCES
In 2010, WIUGC (Western Inter-University Geosciences Conference) goes back to its roots in Saskatoon, Saskatchewan, where the 46th annual conference will be hosted by the University of Saskatchewan’s Ore Gangue Student’s Society from January 7-10th, 2010.
CALGARY, ALBERTA 10–14, 2010
Attendees will have a chance to learn about various geological disciplines through presentations by undergraduate and graduate students. Additionally, there will be many opportunities to meet students from other universities at social functions and events. Highlights include:
• “ Rock Breaker”: A social mixer to meet fellow attendees and industry sponsors;
• Technical Talks & Poster Presentations: Short student talks detailing current research and discoveries;
• In dustry-Related Field Trips: Geological field trips to mines and other related geological sites;
• Keynote Speakers: Seminars from leaders in various geoscience fields; and
Boyd PetroSearch can help you reach the finish line faster by addressing your seismic challenges.
• 2D, 3D and 4D program modeling
GeoCanada 2010 is a once-in-a-decade opportunity for anyone who works with the Earth. This valuable event provides the opportunity to discuss and explore the latest developments across a complete spectrum of Earth Science professions. It is the ultimate opportunity to gain insight into your profession and the Earth, sharing experiences and knowledge with your peers from across Canada.
• Seismic project planning, design and management
CALL FOR ABSTRACTS
• Government approvals
• Stakeholder liaison
• Earth modeling
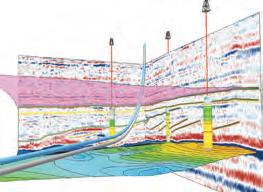
• F ormal Banquet: An evening of good food, good friends and entertainment.
For more information about the speakers, scheduled events, sponsors, accommodations, and to register online, visit our Website at http://ocs.usask.ca/ wiugc2010.
If you are interested in presenting a talk or entering the poster competition for the technical portion of the conference, please visit the website or contact the organizers directly at wiugc2010@gmail.com as soon as possible with your abstract and contact information. Students selected to participate in the technical portion of the conference will receive a registration discount based on their level of participation.
GeoCanada 2010 abstracts for oral, poster and core presentations. Committee encourages and supports proposals from all Science community. For a complete list of technical sessions the abstract submission process, please visit the GeoCanada 2010 website at www.geocanada2010.ca
• Facies analyses and interpretation
Contact Larry Herd, Kevin Bowman or Damien Thenin at 403.233.2455
www.boydpetro.com
Global Geophysical Consultants
DEVONIAN REEF COMPLEXES OF THE CANNING BASIN, W. AUSTRALIA Book Review
| By W. Martindale
Students of Devonian reefs will be familiar with the superbly exposed and exquisitely preserved carbonates and associated sediments of the Devonian Great Barrier reef complex of the Canning Basin in Western Australia and of the role that these rocks have played in our understanding of Devonian reefs worldwide. To those same students, the name of Phil Playford is synonymous with an extensive body of literature devoted to this reef complex.
This publication, from the Geological Survey of Western Australia, is a summary of over 50 years of research in the Canning Basin but it is essentially a synthesis of Playford’s lifelong research, beginning as a graduate student in the mid-1950s and continuing today, with 46 reef-focused publications to his credit. Playford is ably assisted by coauthors and long-time researchers Roger Hocking and Tony Cockbain but when reading the book, one feels that this is truly Playford’s “magnum opus”. I have no doubt that this will be a standard reference for years to come.
The book is boxed along with eight maps of the reef complex, ranging from 1:500,000 regional scale maps down to a detailed 1:25,000 scale map of Windjana Gorge. The book itself is not as thick as one might expect, given the extensive list of publications in the bibliography, but it is beautifully concise in its coverage of the reef and its associated sediments. The text is succinct and requires little effort on the part of the reader, yet is scholarly in content. However, what really struck me when opening this volume is the quantity and exquisite quality of the 536 coloured illustrations that accompany the text and it is these that qualify this Bulletin for a space on the coffee table. Many of the illustrations will be familiar to students of Devonian reefs, but it is the assembly of these and many, many more into one volume that truly makes this a collector’s item. Diagrams are simple and convey their message unambiguously. Photographic images are superbly reproduced and are closely tied to the text.
The Bulletin begins with a historical review of research, accompanied by eight diagrams that summarize the evolution of thought
from a single prograding reef and associated strata to the current interpretation, of a reef complex consisting of two secondorder megasequences and associated thirdorder backstepping and progradational packages. Brief comparisons are made here with Devonian reefs of western Canada and it would have been nice to see this section expanded. A short paragraph addresses the alternative structural/metamorphic origin of the Devonian rocks advocated by Logan and colleagues, underplaying a 20+ year controversy between the two schools of thought. Nevertheless, the author’s acknowledge that tectonics played a fundamental role in the location of the reef, its fabrics (e.g., neptunian dikes) and coeval sediments (e.g., reef-derived debris flows, seafloor cold-water seeps, and alluvial fan conglomerates) and this theme is revisited throughout the text. The authors clearly document t hat syndepositional tectonics as well as eustacy are responsible for the sequence stratigraphic relationships seen today. Tectonics are also significant in the development of postmortem events such as Carboniferous hydrothermal mineralization. Early Permian sub-glacial paleokarst especially is covered in some detail, as this episode of carbonate dissolution was fundamentally responsible for the geomorphology we see today. In depth discussions of each of these topics nicely compliments the geological story of the Devonian reefs.
Approximately one third of the book (107 pages) is dedicated to the lithostratigraphy, sequence stratigraphy, margin geometry, and diagenesis of the reef complexes. The second part of the book, comprising 125 pages, covers topics such as alluvial-fan conglomerates, cyclicity, mineralization, and the origin of paleokarst. The final 133 pages are devoted to a description of key localities along the reef trend. This section, along with the accompanying maps will surely be of immense value to future generations of geologists who wish to visit this world-class region but who may not have the benefit of an experienced field guide. In this section, the authors have included historical sketches from early expeditions as well as numerous illustrations of aboriginal pictographs, many of them drawn on key outcrops. It is clear that the geological community is not the first to be intrigued by caves, fallen reef
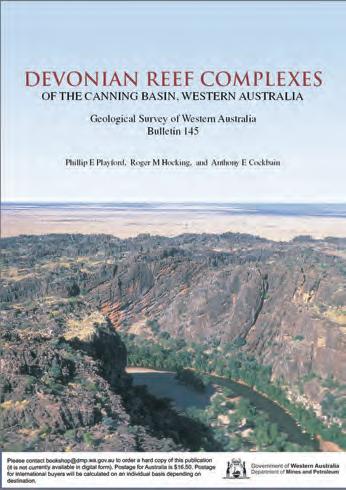
blocks, and steep-sided gorges along the Devonian reef tract.
The book concludes with suggestions for future research (including comparisons with western Canada) and also contains three appendices on U. Devonian conodonts (G. Klapper), Devonian Ammonoid biostratigraphy (R.T. Becker and M.R. House), and Devonian palynology (G. Playford).
As students of somewhat poorly exposed and dolomitized Devonian reefs in Western Canada, we cannot fail to be impressed by the quality and areal extent of exposures in the Canning Basin, where it seems the sea drained away only yesterday. For anyone exploring for Devonian reefs in western Canada, this volume provides a framework in which we can place our own data. We have a wealth of subsurface information in the form of seismic, petrophysical, and core data from over 60 years of Devonian reef exploration. Aspects of Australian Devonian reefs, ranging from reef geometry to frame-building components and diagenetic fabrics, may be duplicated here in western Canada. Perhaps we should be re-examining these various data for unconventional reef prospects (e.g., megabreccia flows, downslope stromatolitic / microbial mounds, hydrothermal vent communities) using the examples presented in this volume.
(Continued on page 36...)

In reading this Bulletin, I couldn’t help but feel a certain irony. While the Australians have the outcrops, we have the hydrocarbons. The petroleum exploration and production history of the Canning Basin is summarized in just three short paragraphs. The first and only discovery of oil in the Devonian, at Blina #1 in 1981, was made by a Canadian company, Home Oil, and has produced approximately 2 million barrels to date (currently 12bopd). All other oil production in the area is from younger rocks, located above the Devonian reef margin. Extensive seismic and drilling have failed to find significant reserves, although the authors feel that there is still potential in subsurface reefs that might be visualized using 3-D seismic techniques.
Pays
and practice in a complex world. and in the environmental industry, Geoscientists. These teams include at headquarters in the city and at
At $77 Aus. (currently about $73Can), this book is truly a bargain. However, with postage and shipping to Canada quoted at $80 Aus., this seems less so. Nevertheless, for anyone who is planning a trip to the Great Devonian Barrier Reef, whether in person or in the virtual world, this book would be the perfect companion.
E DITOR’S NOTE :
projects require teams to manage including governance, tax impact, land-use and ground disturbance.
The CSPG does not carry this publication. For those wishing to order a copy, please contact the Geological Survey of Western Australia at: http://www.dmp.wa.gov.au or at http://www.dmp.wa.gov.au/ebookshop/ mainIndex.asp?content=new.asp&title= titleNew
issues, and a multitude of others, benefit society. The Geoscience responsibility to protect public safety and
Playford, P. E., Hocking, R.M., and Cockbain, A.E. 2009. Devonian Reef Complexes of the Canning Basin, W. Australia. Geological Survey of W. Australia, Bulletin 145, 444 p.
P.Geol.s, P.Geoph.s and Professional Licensees (Geological and Geophysical) are team players. No doubt. Our work helps keep Alberta safe and strong and the only way we can achieve that goal is through teamwork amongst professionals.
Petrel* 2009 gives me an advantage no other application can offer—a better understanding of complex facies using advanced geological population methods like multipoint geostatistics, and parallel processing to efficiently model multimillion cell models—that really makes the difference in honoring the finest reservoir details.
Teamwork Pays. Visit www.apegga.org for more information or call Tom Sneddon, P.Geol., Geoscience Affairs Manager at 403-262-7714 or 1-800-661-7020.
A LSO OF INTEREST WOULD BE : Playford, P. E. 2009. Guidebook to the Geomorphology and Geology of Devonian Reef Complexes of the Canning Basin, Western Australia, Record 2009/5, 81 p.
A PDF version of the Guidebook can be downloaded at: http://geodocs.doir.wa.gov.au/ viewer/multipageViewerAction.do?documentI d=265101&viewMarkId=0&ct=true&at=no ne&btv=true&atv=false&vmtv=false&ac=f f0000&cabinetId=1101&pg=0&scl=65&bd s=0|0|2520|3528 Broad integration. Deep science. Open architecture.
This ad is the sixth in a series
New and Updated Edition of the Iconic Facies Models Book
The Geological Association of Canada (GAC) has recently completed a new version of Facies Models, a classic geologic teaching and reference book featuring colour plates and figures and sponsored by the CSPG. The new edition is a welcome update. The book was originally published in the 1980s and although the book has been re-printed often, the content has not been revised since 1992. Over the years, it has become the standard text for many introductory sedimentology classes around the world.
This well illustrated new edition continues the three-part organization of previous versions. Part 1 deals with Principles, Tools, and General Concepts; Part 2 focuses on
Siliciclastic Facies Models; and Part 3 re-examines Chemical and Biochemical Facies Models. The book will retain and update most of the clastic environments featured in the older books; however there are a number of changes from the previous “Carbonate and Evaporite Facies Models” section. These changes include the replacement of “Shallow Platform Carbonates” with two chapters: “Warm Subtidal Carbonates” and “Cool-Cold Subtidal Carbonates,” and the addition of chapters on “Bioelemental Sediments” and “Lakes.” It is good to see that Roger Walker has maintained his connection to the series by co-authoring the introductory chapter, but Robert Dalrymple and Noel James carry the lead for most of the book.
In the Clastics section, two chapters were written by new authors, while in the Chemical and Biochemical Sediments portion, three chapters were contributed by new authors. Both new graduates and experienced geologists will welcome this addition to their library.
While CSPG’s bookstore does not yet have the new Facies Models book, we will place a notice in the Reservoir when it becomes available.

Loring Tarcore Labs
GEOCANADA 2010 Working with the Earth
A ONCE-IN-A-DECADE OPPORTUNITY
Define Reservoir Parameters with Confidence
Planning is well underway for the next Annual Convention, to be held May 10-14, 2010 at the BMO (formerly Roundup) Centre and ERCB Core Research Centre in Calgary Alberta. This year everything promises to be bigger and better as CSPG, CSEG, and CWLS will host GeoCanada 2010, a national event co-sponsored by GAC, MAC, IAHCNC, CCPG, and CFES, which has the additional support of over 20 earth science organizations.
Involvement by such a diverse group of earth scientists will make GeoCanada an exciting venue for thought-provoking discussion. Truly, if there is one convention you attend in 2010, this is it.
2010 will feature:
• A three-day Exhibit Floor featuring new networking opportunities for delegates;
• Short Courses and Field Trips for the two weeks pre- and post-Convention offered from various sponsoring societies;
• A comprehensive two-day Core Conference;
• A dynamic and diverse four-day Technical Program featuring a range of sessions on topics such as Northern Development, Unconventional and Emerging Resources, Earth and Planetary Evolution, and Bio-Geoscience ;
• Invited technical keynote speakers that will kick-start each day of the program with an in-depth talk on topics of interest to today’s earth scientist;
• Foundations – The Science beneath the art: A one-of-a-kind program that will examine the earth science underpinnings of some well-known Canadian landscapes;
• Teacher workshop and Field Trip: A two-day program that will bring together teachers from across Canada and empower them to integrate earth science topics in their day-to-day teaching;
• Communicating Earth Science to the Public: A one-day panel and workshop that will provide earth scientists with the tools to better communicate with the public;
• Entertaining luncheon speakers – Brent Butt from Corner Gas shares his humor and Canada’s own Ray Zahab shares his experience and lessons from his epic 111-day expedition across the Sahara Desert; and
• Know the Earth under Your Feet:
opportunities in today’s volatile market?
• Great special events like the everpopular Core Meltdown!
IHS Critical Information including well and parameters and determine new opportunities faster and
N EW !
A poster competition for junior high and high school students from across Canada, which will inspire them to understand the geology of their local area.
Remember – the Call for Abstracts is now open!
improve your decision-making and reduce your risk.
Also, for the first time this year there will be a large community outreach component to the Annual Convention. This valuable program will expose students and the general public to the earth sciences through a number of interactive and comprehensive programs:
• Earth Science for Society: A two-day program in the BMO Centre Corral that will expose students and the public to a variety of hands-on exhibits from the industry;
For up-to-the-minute information, or to find out how you or your company can be involved in this exciting event, be sure to visit www.geocanada2010.ca!
For general enquiries, please e-mail Shauna Carson, Convention Manager, at info@ geocanada2010.ca.
THANK YOU. Without you there, we wouldn’t be leading the
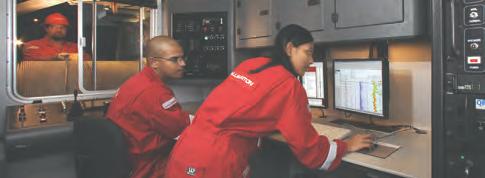
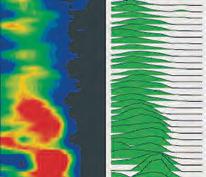
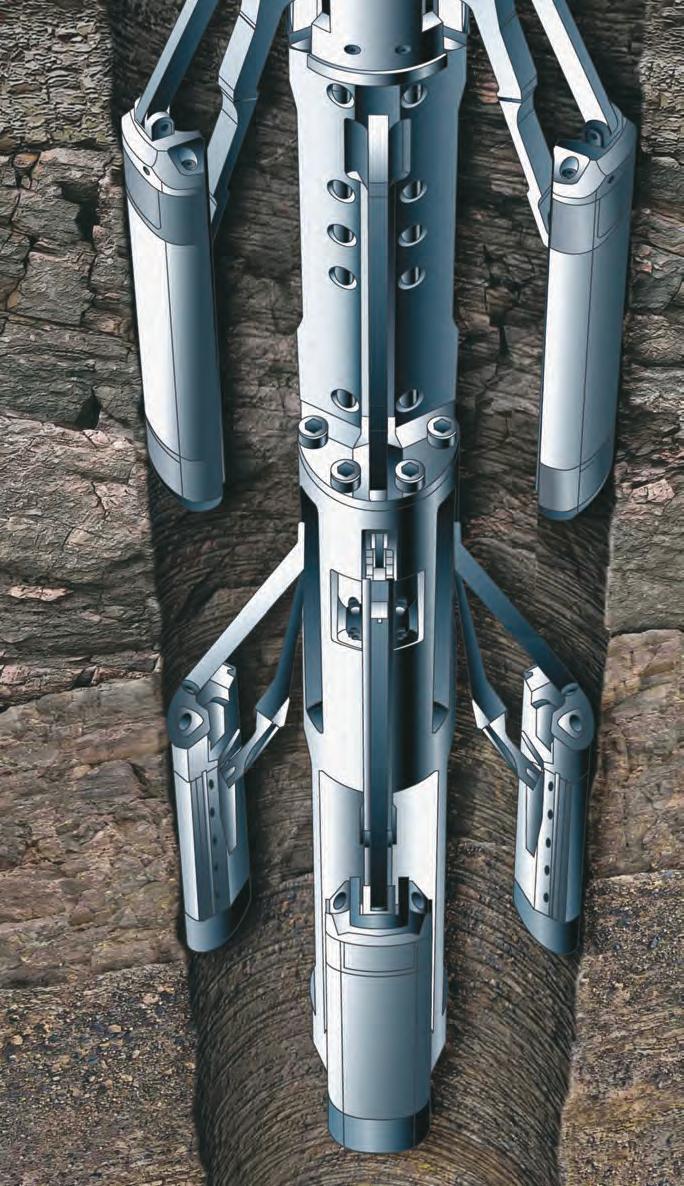

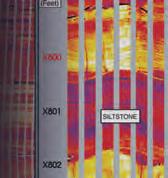

Open for business 24/7, Halliburton has the right open-hole technology—backed by our legendary reliability and service excellence—right now Whether you need formation evaluation, imaging, testing, fluid sampling, acoustics/rock mechanics, NMR, hostile/slim hole, sidewall coring or any other open-hole service—Halliburton has exactly what you need, when you need it. For more information, call 1-888-775-6447. Or visit www.halliburton.com/wireline.