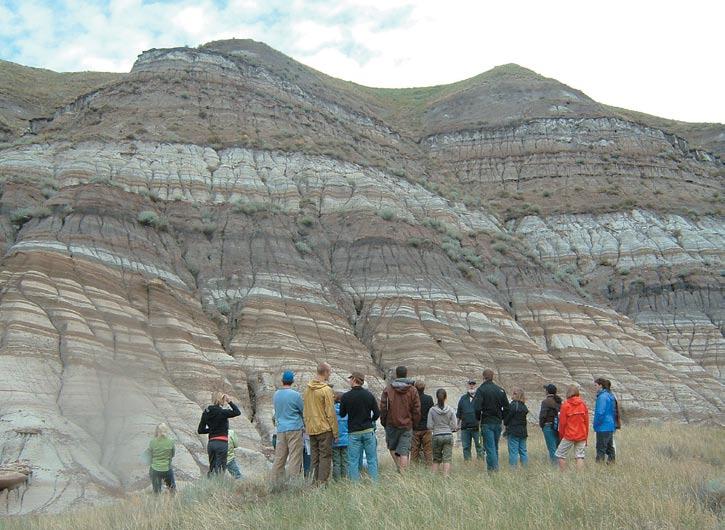
28 Depositional Patterns and Mechanisms on the Inner-Bend Margin of a Deep-Marine Channel
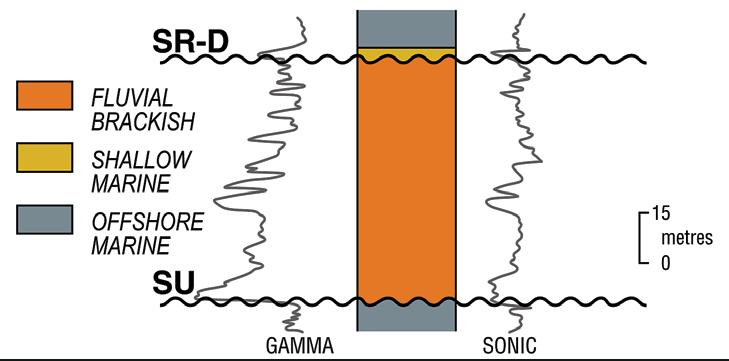
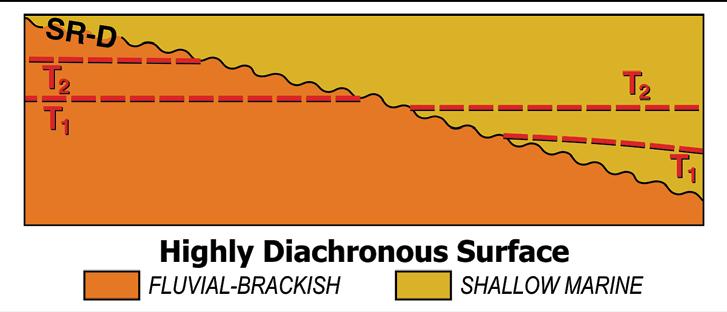
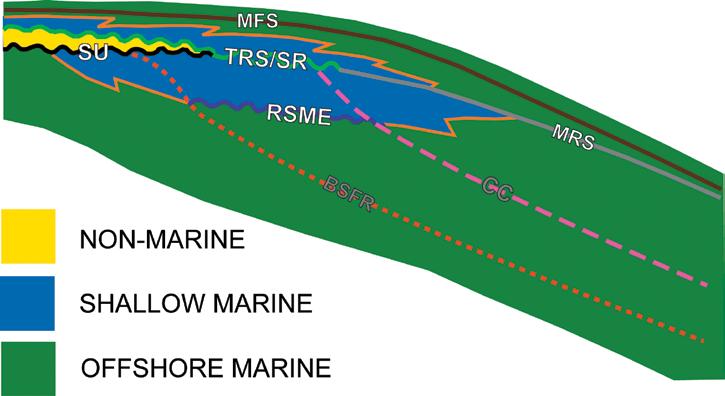
32 Practical Sequence Stratigraphy V. The Material-based Surfaces of Sequence Stratigraphy, Part 2
In appreciation of our customers’ continued business, we’re inviting you to Experience Africa with IHS September 17th, 2008 ihs.com/ExperienceAFRICA
Superior data to boost your bottom line
“As a pioneer AccuMap® client in 1989, our feedback helped produce what’s now a fast, efficient tool. Just like our industry, AccuMap keeps evolving on a convenient platform, that consistently delivers. Take away our AccuMap and everything would grind to a halt.”
Warren J. Doenz, P. Geol. Vice President, Exploration Action Energy Inc.
Visit us at ihs.com/connect and discover how AccuMap can boost your bottom line.
Warren’s right. AccuMap software is the industry-leading SOURCE for E&P data. Continually improving, AccuMap is a tool built for the industry with industry input. Translation? Flexible modules. Superior data. Easy to use. Stable platform.
Please submit RESERVOIR articles to the CSPG office. Submission deadline is the 23rd day of the month, two months prior to issue date. (e.g., January 23 for the March issue).
To publish an article, the CSPG requires digital copies of the document. Text should be in Microsoft Word format and illustrations should be in TIFF format at 300 dpi., at final size. For additional information on manuscript preparation, refer to the Guidelines for Authors published in the CSPG Bulletin or contact the editor.
Technical Editors
Ben McKenzie Colin Yeo (Assistant Tech. Editor) Tarheel Exploration Encana Corporation
Comunications and Public Affairs, CSPG Tel: 403-513-1227, Email: heather.tyminski@cspg.org
ADVERTISING
Advertising inquiries should be directed to Alyssa Middleton, Tel: 264-5610, Email: alyssa.middleton@cspg.org. The deadline to reserve advertising space is the 23rd day of the month, two months prior to issue date.
The RESERVOIR is published 11 times per year by the Canadian Society of Petroleum Geologists. This includes a combined issue for the months of July and August. The purpose of the RESERVOIR is to publicize the Society’s many activities and to promote the geosciences. We look for both technical and non-technical material to publish. The RESERVOIR is not intended to be a formal, peer-reviewed publication. Additional information on the RESERVOIR’s guidelines can be found in the May 2008 issue (p.46-48; available at http://www.cspg.org/publications/reservoir/reservoir-archive-2008.cfm).
No official endorsement or sponsorship by the CSPG is implied for any advertisement, insert, or article that appears in the Reservoir unless otherwise noted.
The contents of this publication may not be reproduced either in part or in full without the consent of the publisher.
For the 2009 Convention jointly supported by CSPG, CSEG and CWLS we encourage the submission of innovative and creative oral presentations and posters that cover a variety of new topics that will help us expand beyond our current boundaries. We particularly favour presentations that integrate the various disciplines of the geosciences, engineering, the environment, and business. With this in mind, we are designing thematic sessions that will encourage multi-disciplinary presentations that combine diverse elements.
Innovative solutions and lessons learned in unconventional and resource plays:
Please contribute to the technical program by submitting a novel paper or poster, thereby helping us explore the various perspectives on Frontiers and Innovation within the following diverse themes:
Get the big picture, look outside the box, and give yourself an out!
Explore new ways of doing geoscientific business in challenging times.
Professionals
continue our search for energy?
the guidelines below in order to be accepted. The deadline to submit oral, poster, and core presentation abstracts is December 15th 2008.
“expanded-abstract” format, not exceeding 4 pages, and should adhere to instructions
abstracts will be accepted based on the review of session chairpersons and the availability of oral novelty of technical content.
for distribution to delegates. Please edit and obtain necessary data releases before submitting final versions.
Presentations must be prepared in single screen electronic format (i.e., Powerpoint presentation).
for each poster presentation. Each presenter is encouraged to prepare a five-minute oral presentation to be delivered at scheduled intervals during the times specifically provided for the indicate with your submission whether there are
same as those for oral and poster presentations.
CSPG EXECUTIVE
President
Lisa Griffith • Griffith Geoconsulting Inc. lgriffith@griffithgeoconsulting.com Tel: (403) 669-7494
Vice President
Graeme Bloy • West Energy Ltd. gbloy@westenergy.ca Tel: (403) 716-3468
Past President
Colin Yeo • EnCana Corporation colin.yeo@encana.com Tel: (403) 645-7724
Finance director
James Donnelly • ConocoPhillips Canada james.donnelly@conocophillips.com Tel: (403) 260-8000
assistant Finance director
David Garner • Chevron Canada Resources davidgarner@chevron.com Tel: (403) 234-5875
Program director
Randy Rice • Suncor Energy Inc. rjrice@suncor.com Tel: (403) 205-6723
assistant Program director
Christopher Collom • Enerplus Resources Fund ccollom@enerplus.com Tel: (403) 693-5042
serVice director
Jen Vèzina • Devon Canada Corporation jen.vezina@devoncanada.com Tel: (403) 232-5079
assistant serVice director
Ayaz Gulamhussein • NuVista Energy Ltd. Ayaz.gulamhussein@nuvistaenergy.com Tel: (403) 538-8510
A message from the Assistant Services Director, Ayaz Gulamhussein
For those of you who are numerically challenged,
the thought of creating a budget likely sends shivers down your spine. You are not alone; I am one of you.
A.A. Latimer once said, “A budget is a mathematical confirmation of your suspicions.” A.A Latimer was correct. As I put together the Services budget for the upcoming year, my suspicions were confirmed. Buried deep within all the digits and decimal points from last year’s budget, was evidence that the success of the Services Committee was based upon unparalleled volunteer support.
Volunteer support has allowed the Services Committee to offer a broad range of programs. These programs include, but are not limited to, the 10K Road Race, the Mixed Golf Tournament, the Squash Tournament, the Past President’s Dinner, and the Awards Banquet.
One of the CSPG’s most successful events, the Long-Time Members Reception, was held at the Rotary House in May 2008. The Long-Time Members’ Reception is an event held for individuals that have been members of the CSPG for more than 30 years. Ted Best, who I had the good fortune of working for at Shiningbank Energy, left me the following note after the event:
Ayaz,
The Long-Time Members Reception is a wonderful event. I always make sure that other matters have a lower priority. It is a welcome event when we can see old friends and associates. We renew our friendships and reminisce about our successes and failures. All of us consider ourselves to have been through the best of times. All the oldtime members are very proud of the CSPG and its contribution to Canadian petroleum exploration and development. It has been a continuous evolution – always striving to fulfill the responsibility to the members, the
profession, and society. All the old timers truly appreciate the CSPG holding this very special event for us.
All of the programs and events offered by the CSPG are unbelievably successful due to continued support from our Membership. However, as with anything, there is always room to improve and expand on a strong foundation.
Each year the CSPG presents a variety of awards to recognize both technical achievements and excellence in volunteerism. Awards are also presented to geoscience students who have achieved exemplary academic accomplishments. Over the past few months, the Services Committee has focused on improving and expanding the CSPG Awards. Details about these new awards will be announced in the very near future!
Randy Rice’s Executive Comment in the April 2008 issue of the Reservoir highlighted the importance of the CSPG becoming an organization with national relevance. Mr. Rice’s thoughts were not lost on the Services Committee. In addition to improving and expanding on the CSPG Awards, the Services Committee is committed to increasing the number of members living within Canada, but more specifically, outside of Alberta. As it currently stands, the largest contingent of CSPG Members outside of Alberta reside in Texas.
As our membership grows in centers outside of Alberta, the CSPG Membership Committee intends to organize events to serve each region. These events will provide members an opportunity to network with their peers, while fostering an esprit de corps.
Although there will be some growing (Continued on page 7...)
Proudly brought to you by Professionals in Geoscience and Engineering
Alberta’s Professional Geoscientists and Engineers provide Albertans with many of the essentials of daily living. The work that they do allows all of us to enjoy warmth, light, power, water and the ability to travel and communicate over distance.
Since 1920, Members of APEGGA, The Association of Professional Engineers, Geologists and Geophysicists of Alberta, have made a difference in the daily lives of millions of Albertans by bringing science and innovation to life.
The P.Geol., P.Geoph., P.Eng., and R.P.T. professional designations represent the highest standards of quality, professionalism and ethics in geoscience and engineering. APEGGA Members can take pride in the role they play and the contribution they make to Alberta. APEGGA and its over 47,000 Members are committed to public safety and wellbeing through the self-regulation of the geoscience and engineering professions in Alberta.
Visit www.apegga.org for more information.
Geologists Geophysicists Engineers
CORPORATE MEMBERS
ABu DHABI OIL CO., LTD. (JAPAN)
APACHE CANADA LTD.
BAKER ATLAS
BG CANADA ExPLORATION & PRODuCTION, INC
BP CANADA ENERGY COMPANY
CANADIAN FOREST OIL LTD.
CANETIC RESOuRCES TRuST
CONOCOPHILLIPS CANADA
CORE LABORATORIES CANADA LTD
DEVON CANADA CORPORATION
DOMINION ExPLORATION CANADA LTD
DuVERNAY OIL CORP
ENERPLuS RESOuRCES FuND
FuGRO AIRBORNE SuRVEYS
geoLOGIC systems ltd.
GRIZZLY RESOuRCES LTD
HuNT OIL COMPANY OF CANADA, INC
HuSKY ENERGY INC.
IHS
IMPERIAL OIL RESOuRCES LIMITED
LARIO OIL & GAS COMPANY
LITTLE ROCK DOCuMENT SERVICES LTD
MJ SYSTEMS
MuRPHY OIL COMPANY LTD
NExEN INC
PENN WEST PETROLEuM LTD
PETRO-CANADA OIL AND GAS
PETROCRAFT PRODuCTS LTD.
PROVIDENT ENERGY LTD
RPS ENERGY CANADA LTD.
SHELL CANADA LIMITED
SPROuLE
SuNCOR ENERGY INC
TALISMAN ENERGY INC
TAQA NORTH LTD.
TOTAL E&P CANADA LIMITED
WEATHERFORD CANADA PARTNERSHIP
AS OF AUGUST 29, 2008
(...Continued from page 5)
pains, the new ideas and initiatives being spearheaded by the Services Committee will strengthen the future of the CSPG.
The Society was founded in 1927 as the Alberta Society of Petroleum Geologists. In 1973, the name was changed to the Canadian Society of Petroleum Geologists to more accurately reflect and foster the Society’s role and activities nationally.
The Services Committee, along with the rest of the CSPG Committees, pledges to carry out the mandate of the Society as defined over 35 years ago.
customsolution
technical luncheons OCTOBER LuNCHEON
Recent advances in understanding the role of tides in beach-shoreface morphodynamics
SPEAKER
Shahin Dashtgard
Simon Fraser university
11:30 am
tuesday, october 7th, 2008
telus convention centre calgary, a lberta
Please note: the cut-off date for ticket sales is 1:00 pm, thursday, october 2, 2008. csPg member ticket price: $38.00 + gst. non-member ticket Price: $45.00 + gst
Due to the recent popularity of talks, we strongly suggest purchasing tickets early, as we cannot guarantee seats will be available on the cut-off date.
Milk
Recent work conducted in modern environments suggests that the hydrodynamic processes responsible for morphological and sedimentological characteristics of beaches are much more complex than previously thought. Significant variability in the sedimentology, ichnology, and morphology of these systems can be observed in response to changing hydrodynamic processes –particularly relative tidal energy.
Beaches deposited in strongly tidally influenced settings are wave-dominated. However, these deposits also exhibit both sedimentological and ichnological characteristics akin to sandy tidal-flat environments. This suggests that beaches and tidal flats comprise end-members along a continuum of depositional environments, with intermediate deposits including tidally modulated beaches and open-coast tidal flats. Both tidally modulated beaches and opencoast tidal flats exhibit sedimentological and ichnological characteristics that are distinctive to these settings. By comparing typical beach-shoreface systems such as occur on the southwest coast of Vancouver Island to beaches present in strongly tidally influenced settings like the Bay of Fundy, it is possible to
River Medicine Hat
Second White Specks
This is a one-day workshop on the geology and reservoir characteristics of these shallow, low-permeability, gas-bearing formations in Alberta, Saskatchewan, and Montana. This popular and well-reviewed course has been updated to include many recent developments in unconventional shallow gas exploration.
Topics include:
Stratigraphy, facies, structure, lithological properties, and log characteristics of each formation.
Shallow gas production issues, including reserve estimation. The geology of all current play trends.
32 cores from Alberta and Saskatchewan will be shown. There is a newly updated 250 page book of course notes containing many unpublished maps and sections
establish criteria elucidating the distinctions between the typical beach-shoreface setting and tidally modulated beaches. Such criteria should enable reliable differentiation of wavedominated beaches from tidally modulated, wave-dominated beaches in the rock record.
As tidal range increases, a distinct change in the morphology and sedimentology of the beach-shoreface system is observed. Sediments deposited in lower to upper shoreface settings at high tide ultimately are exposed in the intertidal zone during low tide. The results of this juxtaposition of environments include subordinate flow indicators, a sharp change in bedding dips in the landward direction, and possible preservation of locally thick shoreface deposits perpendicular to the coastline.
Tidal influence on the depositional character of beach-shorefaces is also observed in the ichnology of a deposit. In a normal beachshoreface system, a Cruziana Ichnofacies to Skolithos Ichnofacies is expected in the lower and upper shoreface, respectively. In strongly tidally influenced settings, sediments laid down in analogous bathymetric settings are characterized by a seaward shift in ichnofacies, generally poor development of the Skolithos Ichnofacies, and an overall decrease in ichnological diversity into subtidal settings. The density of burrowing, however, is locally higher in strongly tidal settings than for normal shorefaces, although spatial distribution of burrowed and unburrowed zones is not entirely resolved in new depositional models.
BIOGRAPH y
Shahin Dashtgard graduated from the University of Alberta with a B.Sc. in Geology in 1998. He worked as a Petroleum Geologist for Fletcher Challenge Energy and Talisman Energy for four years, and returned to university in 2002. He earned his Ph.D. from the University of Alberta in 2006. Following an eight-month work term at the Alberta Geological Survey in Edmonton, Shahin started as an Assistant Professor in the Department of Earth Sciences at Simon Fraser University in Burnaby, British Columbia in January 2007.
His present research interests include modern sedimentological and ichnological studies of beaches and deltas on the southwest coast of British Columbia as analogues to the rock record, as well as reservoir characterization studies of potential CO 2 and acid-gas injection sites in the Western Canada Sedimentary Basin.
Vision for Energy
> Strategic consulting
> Seismic imaging
> Velocity analysis
> Structural interpretation
> Stratigraphic delineation
> Formation evaluation
> Reservoir modeling
> Pore pressure prediction
> Well planning and drilling
Vision is Certainty
Leading science, breakthrough innovation and exceptional people. Providing customers with the intelligence to minimize risk and optimize subsurface asset management. Paradigm. Unconflicted, unsurpassed. www.pdgm.com
technical luncheons OCTOBER LuNCHEON
The stratigraphy and sedimentology of the Paddy Member, Peace River Plains and the Walton Creek Member, Rocky Mountain Foothills: Northwest Alberta and Northeast British Columbia
AUHOR
Jessica Krawetz
Canadian Natural Resources
11:30 am thursday, october 23, 2008 telus convention centre calgary, a lberta
Please note:
the cut-off date for ticket sales is 1:00 pm, monday, october 20, 2008. csPg member ticket price: $38.00 + gst. non- member ticket Price: $45.00 + gst.
Due to the recent popularity of talks, we strongly suggest purchasing tickets early, as we cannot guarantee seats will be available on the cut-off date.
Jessica Krawetz is a recipient of the CSPG Graduate Thesis Award, which is sponsored by Arc Financial.
The Paddy Member of the Peace River Formation and the Walton Creek Member of the Boulder Creek Formation were deposited in the Western Canada Foreland Basin during Cretaceous ( upper Albian) time and form a succession of aggradational coastal plain deposits which undergo an upward transition to increasingly marine facies. Stratigraphic relationships between the marginal-marine Paddy Member in northwestern Alberta, the mainly non-marine Walton Creek Member in northeastern British Columbia, and the marine Joli Fou and Viking formations in
southern Alberta are unclear. Correlation of wireline logs, core, and outcrop suggest that the Paddy and Walton Creek Members are coeval (therefore from now on will be referred to as the Paddy Member), and that the uppermost Paddy allomember can be correlated southward where it passes laterally into the basal part of the Joli Fou Formation, suggesting that the Viking Formation is younger than the Paddy Member.
The base of the Paddy Member is defined by a subaerial unconformity (disconformity) at the top of progradational shoreface sandstones of the underlying Cadotte Member. This unconformity represents progressively more time eastward, as lower Paddy allomembers prograde eastward from the orogen and successively onlap the top Cadotte. These lower Paddy allomembers are wedge-shaped, indicating a dominant tectonic control on deposition. In contrast, upper Paddy allomembers are more tabular, suggesting that small-scale eustatic cycles may have had a greater influence on deposition. The top of the Paddy Member is defined by VE3, a major transgressive erosion surface that can be correlated for hundreds of kilometers throughout the Western Canada Foreland Basin.
Seven non-marine and three marine and marginal-marine facies were recognized in the Paddy Member. The non-marine facies indicate a bimodal system comprising either fine-grained floodplain deposits or coarse-grained and conglomeratic fluvial valley-fill deposits. The fine-grained floodplain deposits are predominantly dark grey and orange-stained beds that are sideritic and carbonaceous. These beds indicate high water table levels and contain poorly drained paleosols, coals and coaly mudstones, and lake-bottom deposits. Finegrained sandstones represent overbank deposits – including crevasse channels, splays, and levees – lake-fill successions, and non-migrating channel fills. All of these facies are interstratified and laterally intergradational throughout the western and southern parts of the study area. Finegrained floodplain facies are thought to have been deposited in high accommodation paleoenvironments on a rapidly subsiding coastal plain where base level underwent a relatively constant rise as a result of isostatic subsidence in response to both tectonic activity and sedimentary loads.
The coarse-grained and conglomeratic facies which comprise multi-storey, highly
amalgamated fluvial sandstones have been interpreted to represent high energy, braided river deposits. The coarse-grained facies are interpreted to be temporally and spatially isolated from the fine-grained facies because they have never been observed inter-fingering with or grading laterally into each other. For this reason, they have been interpreted to represent valley-fill deposits. The valleys were cut during periods of negative accommodation on the coastal plain as a result of a base-level fall, probably due to isostatic uplift in the thrust belt. During the valley-cutting phase, well developed paleosols formed on the interfluves and newly supplied sediment was confined to the valleys and deposited to the north of the study area. As a result of base-level rise, sediment was trapped in the valleys forming highly amalgamated, multi-storey fluvial deposits.
The marine and marginal-marine facies are primarily confined to the stratigraphically higher part of the Paddy Member and have been divided into western and eastern facies. In the west, in outcrop, the top of the Paddy Member contains a series of gravelly delta deposits that range in thickness from thin beds of granules and pebbles to 12.5 metre-thick conglomeratic cliffs. The deltas were probably fed by braided rivers as rocks representing both environments are found laterally equivalent in outcrop. The thickness of the deltaic deposits depends on their proximity to the fluvial feeder systems.
The eastern parts of the Paddy Member constitute a series of bioturbated, stacked bay-fill deposits that range in thickness from 2 to 5 m. Sedimentary structures indicate that these deposits formed in a low energy, marginal-marine environment. Bays filled as distributary channels constructed riverdominated deltas. In the eastern part of the study area, valley-fills with a distinctive estuarine character hang from the VE3 surface and remove up to 25 m of older Paddy strata.
BIOGRAPH y
Jessica Rylaarsdam (now Krawetz) received both her Bachelor’s and Master’s degrees in geology from the University of Western Ontario in London. After finishing her Master’s, Jessica worked at Anadarko Canada Corporation, and is now working at Canadian Natural Resources as an area geologist.
Depth Imaging
Before drilling your next well, work with CGGVeritas to obtain a superior structural image and experience the advantages of effective collaboration between interpreter and imager.
Expertise
> largest team of depth imaging specialists in Canada
> extensive experience processing foothills, deep basin, permafrost, and marine data
> largest in-house geophysical R&D team in Canada
ENVISION SUCCESS
Service
> dedicated imagers, supported by industryrecognized processing experts
> visualization facilities for effective QC and interactive analysis
> leverage communication and teamwork to achieve your goals
Technology
> advanced 2D and 3D model building tools
> anisotropic Kirchhoff and other leading technologies designed for land and marine data
> thousands of CPU nodes enable large throughput capacity
Rely on CGGVeritas to maximize your exploration accuracy. You’ll have access to leading seismic imaging technologies, highly sought 3D and 2D data, the most advanced acquisition capabilities and a staff dedicated to helping you succeed.
Focus on Performance. Passion for Innovation. Powered by People. Delivered with Integrity.
Time in time
Depth in depth
technical luncheons NOVEMBER LuNCHEON
New insight to controls on the nature of Devonian Reefs –contributions from the Upper Devonian Alexandra Reef System
SPEAKER
Alex MacNeil
Imperial Oil Resources
11:30 am tuesday, n ovember 4, 2008 telus convention centre c algary, a lberta
Please note:
the cut-off date for ticket sales is 1:00 pm, thursday, october 30, 2008. csPg member ticket Price: $38.00 + gst. non- member ticket Price: $45.00 + gst
Due to the recent popularity of talks, we strongly suggest purchasing tickets early, as we cannot guarantee seats will be available on the cut-off date.
Devonian reefs and carbonate platforms of western Canada have been a focus of petroleum exploration and research for more than sixty years. One of the classic regions to visit for examining Devonian reef deposits is the southern part of the Northwest Territories. Near Hay River, well preserved limestones of the Alexandra Reef System (mid-Frasnian in age) are exposed at surface over a distance of approximately 46 kilometres. First studied in the early 1960s, the Alexandra was recognized as containing stromatoporoid reef facies and a variety of fore-reef and back-reef to lagoon facies associations. The deposits are time-equivalent to the lowermid Grosmont and Leduc formations, and represent a northern extension of the
Grosmont carbonate system that developed on the western edge of the Laurussian Supercontinent.
Excavation of a large quarry and a number of roadcuts through the Alexandra Reef System, in the 1980s and 1990s, offered the opportunity for new insight to its facies and stratigraphy. Study of the new exposures, extensive coring, and field mapping in the summers of 2002 and 2003, as part of a Ph.D. thesis at the u niversity of Alberta, has revealed that the Alexandra is more complex that previously realized. It consists of two stromatoporoid-dominated reef complexes that are separated by a sequence boundary and its correlative conformity. The stratigraphic architecture of these complexes, which represent thin (10-20 m thick) but areally extensive carbonate units, has been delineated with high-resolution (4th-order) sequence stratigraphy.
The second reef complex developed basinwards of the first after a 15-20 m fall in sea-level that exposed the entire inner ramp region where the first reef complex had been located. The second reef complex, in its basinward location, subsequently developed through a lowstand-to-highstand rise of sea-level, before being terminated by a second fall in sea-level.
Exceptional preservation of several facies associations in the Alexandra Reef System – from the oldest coastal plain carbonate marsh deposits known in the geological record, to open-marine ramp deposits with carbonate microfossils that were not previously known from the Devonian – and the high-resolution sequence stratigraphic framework, also provided the opportunity to study important attributes of Devonian carbonates that, in general, are poorly understood. These included possible intrinsic and extrinsic controls on facies distribution within the reef complexes.
One of the most striking aspects of the Alexandra Reef System are stromatoporoidmicrobial reef facies that are restricted in distribution to the lower part of the second reef complex. These facies include masses of Renalcis that engulf stromatoporoids and corals, and stromatolites that covered the tops of dead stromatoporoid plates. Similar facies are known from other Devonian reefs
of western Canada, including some Leduc, Nisku, and Jean-Marie buildups, where their distribution can affect reservoir quality.
In the Alexandra Reef System, integration of sequence stratigraphy, platform geometry, paleogeography, paleobiology, and detailed sedimentology, with modern analogues, indicates that nutrient levels were probably the greatest control on whether or not Renalcis and other microbial carbonates accumulated. Groundwater seepage, runoff, storm events, and seasonally forced deepening of the water column may have contributed to nutrient flux. When nutrients were present, calcareous algal-microbial blooms flourished; when nutrients were limited, the reef facies returned to being dominated by stromatoporoids and corals.
This interpretation implies that Devonian reefs, which through microbial-carbonate production could thrive in nutrient-enriched seawater, were quite different from modern coralgal reefs that do not thrive in nutrient-enriched seawater. This has significant implications for understanding (and predicting) facies distributions and overall platform evolution.
The evolution of the Alexandra Reef System, largely controlled by two highfrequency cycles of sea-level change, also lends insight to understanding overall basin evolution. Biostratigraphic zonation of the formation indicates that its recorded sealevel history can be correlated to a fall in sea-level and subaerial platform exposure that is recorded in a number of carbonate buildups in Alberta. High-frequency sealevel falls of 10 to 20 metres do not characterize greenhouse climates, which are thought to have characterized most of the Devonian, but can be attributed to transitional phases between greenhouse and icehouse climates.
Thus, the apparent high-frequency shifts in sea-level in the mid-Frasnian, as recorded in the Alexandra and other locations in western Canada, seem to support arguments from the paleontology community that the global extinction events at the end of the Frasnian were related to global cooling. These, and other contributions from renewed study of the Alexandra Reef System, help to demonstrate that
there are many important attributes of the Devonian that remain enigmatic and worthy of continued study.
BIOGRAPHy
Alex MacNeil received his B.Sc. Honours degree in Paleobiology/Geology from the University of Saskatchewan in 1998. He subsequently completed his M.Sc. (2001) and Ph.D. (2006) degrees in Geology at the University of Alberta under the supervision of Dr. Brian Jones. His M.Sc. thesis focused on the sedimentology, diagenesis, and dolomitization of Pliocene carbonates in the Cayman Islands and his Ph.D. thesis focused on the stratigraphy, sedimentology, and paleontology of Devonian carbonates in the southern part of the Northwest Territories. Much of MacNeil’s graduate work was funded by the Natural Sciences and Engineering Research Council of Canada, the Province of Alberta, and graduate scholarships from the University of Alberta. Most recently, he was awarded the 2007 best Ph.D. Thesis Award from the CSPG for his
ROCK SHOP
thesis, “Sedimentology of the Late Devonian (Frasnian) Alexandra Reef System, Northwest Territories, Canada – New Insight to Devonian Reefs”. Various topics of MacNeil’s research have been published in the Canadian Journal of Earth Science, Sedimentary Geology, Sedimentology, and the Journal of Sedimentary Research.
In addition to his graduate research, MacNeil also spent three summers (1999-2001) working on Ordovician-Devonian carbonates in the Arctic Islands for the mining industry. He has co-led five field trips to the Northwest Territories for the petroleum industry, including two field trips for the CSPG. He is currently employed in Calgary at Imperial Oil Resources as a geoscientist.
Come join a Celebration for Laurie Wilcox as she retires from the ERCB Core Research Center
Meet and Greet – October 23, 2008 6:00 – 10:00 p.m.
Implications of an evolving channel/levee system on reservoir distribution: an example from the Upper Miocene to Lower Pliocene Gulf of Mexico
SPEAKER
John Wagner
Nexen Petroleum u SA, Inc.
HUGH REID’S FALL COURSES
11:30 am thursday, november 13, 2008 telus convention centre calgary, a lberta
Please note:
the cut-off date for ticket sales is 1:00 pm, Friday, november 7, 2008. csPg member ticket price: $38.00 + gst. non- member ticket Price: $45.00 + gst.
Due to the recent popularity of talks, we strongly suggest purchasing tickets early, as we cannot guarantee seats will be available on the cut-off date.
Recent drilling of a seismically defined channel/levee system in the deep-water Gulf of Mexico has provided new insight into their architectural development and associated reservoir distribution. Both asymmetry of channel morphology and degree of channel sinuosity (straight versus curve) lend to varying distributions of net/ gross ratios of sand in relation to proximity to channel margin. Over 100 metres of whole core were taken in this area and provided detailed calibration of reservoir characteristics from channel axis to channel margin to levee/overbank (ranging from proximal to distal).
Early development of channel systems favours deposition within channel bases and is attributed to weaker confinement of sustained flow deposition. Also, at this time overbank deposition has more attributes of crevasse splay (high net/gross) deposition rather than true levee facies typically dominated by highly ripple laminated facies. As channel continues to aggrade, system becomes more confined with only the larger flows contributing to the levee/overbank environment with channel axis acting as a zone of bypass and only passively infilling during waning flow and abandonment. This abandonment phase is attributed to updip avulsion and results in rapid shale deposition within channel and overbank setting creating a master top seal over the entire channel/ levee complex.
The depositional model derived from core and log data allowed for additional drilling in marginal areas where seismic geometry and amplitude were not well imaged. Results were successful away from the inferred channel margin and provided an important test of the impact of understanding the channel architecture of an evolving channel/ levee system.
BIOGRAPH y
John Wagner received both his B.Sc. and M.Sc. degrees in Geology from Louisiana State University in Baton Rouge and his Ph.D. in Geology at The University of Texas at Dallas.
From 1987 to 1998, Wagner worked for Mobil Oil beginning as an exploration geologist for Mobil Exploration and Producing U. S. in New Orleans, Louisiana. He then transferred in 1990 to work as an international consultant for depositional systems analysis at Mobil Exploration and Producing Services in Dallas, Texas and in 1995 to Senior Staff Geologist for Mobil’s Exploration and Producing Research Technical Center in Dallas, Texas. From February of 1998 to December of 2000, Wagner worked for Pioneer Natural Resources as Sedimentologist/ Stratigrapher for Worldwide Exploitation and Development. He joined Nexen Petroleum in December of 2000 as Sedimentologist for Deep-water Exploration and Development and is currently Chief Geologist for Nexen Petroleum U.S.A.
Prior to joining Mobil in 1987, his work ranged from field geologist in Alaska, to manager of a seismic crew, to coastal geologist for the Louisiana Geological Survey Coastal Geology Program. Wagner was a scientist on board the 1985 USGS/IOS GLORIA survey of the deep-water Mississippi Fan, Gulf of Mexico. He is a member of both the AAPG and SEPM and has served on Program Committees for the Gulf Coast Section Society of Economic Paleontologists and Mineralogists (GCSSEPM) Foundation Annual Research Conferences and is currently President-Elect for 2009.
In addition to his role as Chief Geologist for Nexen Petroleum U.S.A., Wagner is currently a Research Associate Professor at Sothern Methodist University in Dallas, Texas, where he teaches graduate courses in the field of sedimentology and has published over 25 papers and abstracts. His work travels have taken him from the rivers and streams of Sakhalin Island Russia, to the coast of Vietnam, and to the jungles and mountains of Bolivia and Argentina. His primary research interests are focused on siliciclastic depositional systems, sandstone sedimentology, reservoir architecture, depositional systems analysis, and understanding the various allocyclic and autocyclic controls that influence deposition.
diVision talKs STRuCTuRAL GEOLOGY DIVISION
The application of LiDAR to the mapping of mountains
SPEAKER
Willem Langenberg
Alberta Geological Survey / ERCB Edmonton, Alberta
AUTHORS
C. Willem Langenberg, Michel Jaboyedoff, Andrea Pedrazzini and Shilong Mei
12:00 noon
thursday, october 9, 2008 Petro- canada
West tower, room 17B/ c (17th floor) 150 6 ave sW
calgary, a lberta
Canadians, such as George M. Dawson and John A. Allan, were great mappers of mountains. Nowadays, the use of airborne LiDAR (an acronym for Light Detection and Ranging) is becoming increasingly common in mapping mountains. LiDAR systems employ intense pulses of light, typically generated by lasers, and sensitive optical detectors to receive the reflected pulses.
Airborne LiDAR systems consist of a laser machine mounted beneath an airplane or helicopter that follows a predefined path. The ground is then scanned by means of tens of thousands of pulses per second emitted from the laser. In order to obtain measurements for the horizontal coordinates (x, y) and elevation (z) of the objects scanned, the position of the aircraft is determined using accurate differential GPS measurements and the distance from the aircraft to the ground calculated. These measurements generate a three-dimensional cloud of points with irregular spacing. Left unfiltered, the model includes treetops, buildings and vehicles and the image looks like a picture. Many of these non-ground features can be removed to produce a bareearth Digital Elevation Model (DEM), which is especially useful for geologists.
The Alberta Geological Survey (AGS) purchased LiDAR data for a 33 square kilometre area covering Turtle Mountain. Trees and buildings were removed by
filtering and the resulting bare earth DEM shows details of rock structures, which are concealed in regular aerial photos mainly due to vegetation cover. Draping existing geological map over this DEM allows refinement of these maps. The trace of the Turtle Mountain Thrust as displayed on a Geological Survey of Canada geological map from 1993 and a 2007 AGS map can be more accurately placed.
In addition, the trace of the axial plane location of stratigraphic contacts of the Turtle Mountain Anticline can be accurately placed on the DEM. Contacts needed adjustments of up to 150 metres on the existing maps. The trace of the steeply dipping main coal seam, which was mined in the Frank Coal mine from 1901 to 1918, can also be accurately mapped from well defined mine subsidence pits.
The u niversity of Lausanne (and the Canton de Vaud) obtained LiDAR images of the Morcles Nappe from Swisstopo, the Swiss Geo-information Centre. The geology of the ‘Diablerets’ map-sheet (from Swisstopo) was draped over the DEM and GIS technology allowed the area to be viewed down-plunge. These views can be compared with down-plunge cross sections of cylindrical domains. In the Haute Pointe area, the precise location of the lower contact of the urgonian (Barremian) lithostratigraphic unit could be shown to be 100 metres southeast from the location mapped in the 1980s. In other areas, contacts were mapped more than 100 metres away from their true location. Faults could also be located more precisely.
The remarkable feature about LiDAR is its capability to remove non-ground objects. LiDAR presents a valuable tool to recognize features that would otherwise remain obscured by vegetation. It is anticipated that this technique combined with improved cross sectioning methods will revolutionize the mapping of mountains.
BIOGRAPH y
Willem Langenberg is a senior geologist with the Alberta Geological Survey/ERCB in Edmonton. He obtained a Ph.D. in Structural Geology from the University of Amsterdam in the Netherlands in 1973. He has been employed by the University of Amsterdam, the University of Alberta, Alberta Research Council, Alberta Department of Energy and the Alberta Resources Conservation Board.
Langenberg has had a longstanding career in Structural Geology, with emphasis during the last twenty-five years on economic geology (including energy and mineral resources). He performed the function of Project Control Officer on the inter-governmental Turtle Mountain Monitoring Project from 2003-2005. He is presently conducting investigations on the structure of the Alberta Foothills and Mountains and has a weak spot for the geology of Turtle Mountain (Crowsnest Pass). Recently, he has also worked on coals of the Coalspur, Scollard and Horseshoe Canyon formations. He authored or co-authored 35 refereed articles in scientific journals, four AGS Bulletins and many AGS reports and abstracts of oral and poster presentations.
Langenberg is a member of the Association of Professional Engineers, Geologists, and Geophysicists of Alberta, the Geological Association of Canada, the Canadian Society of Petroleum Geology and the Geological Society of America. He was Publication Manager of the Edmonton Geological Society from 1993-2003 and Associate Editor of the Bulletin of the Geological Society of America from 1991-95.
I NFORMATION
Talks are free and do not require pre-registration. Please bring your lunch. Refreshments are provided by HEF Petrophysical Consulting, and the room is provided by Petro-Canada. If you would like to be on the Structural Division e-mail list, or if you’d like to give a talk, please contact Jamie Jamison at (403) 816-1818 or wjamison@shaw.ca.
diVision talKs PALAEONTOLOGY DIVISION
Global warming, global cooling, extinctions, and petroleum source rocks: the volcanic connection during oceanic anoxic events
SPEAKER
Dr. Steven Turgeon Dept. of Earth and Atmospheric Sciences, university of Alberta
7:30-9:30 pm Friday, october 17, 2008 mount royal college, room B108 calgary, a lberta
Oceanic Anoxic Events (OAE) are brief episodes of marine anoxia (oxygendeficiency) during which high amounts of organic carbon were buried on the ocean floor. OAE2, which occurred about 93.5 million years ago, is the most widespread and best defined OAE of the mid-Cretaceous, a period characterized by extensive volcanic activity, warm surface temperatures, high atmospheric CO2 , and sluggish oceanic and atmospheric circulation.
In addition to a selective extinction most severely affecting deep-sea fauna, this episode of carbon sequestration led to a short-lived but significant reduction in atmospheric CO2 and cooling of surface temperatures, making this interval of particular interest for studies of the effects of climate change. As well, petroleum source rocks from this period – many of which are associated with OAEs – account for a significant proportion of original recoverable oil and gas reserves in the world.
Although the carbon burial during OAEs can be explained either through an increase in organic matter production and/or enhanced preservation due to oxygen-deficient bottom waters, the actual “trigger” mechanism, corresponding closely with the onset of these episodes, had not been clearly identified. under such oxygen-
depleted conditions, however, several redox-sensitive or sulphide-forming trace elements are enriched within the sediments and are therefore useful for reconstructing paleo-environmental conditions.
For this presentation, Turgeon will present several of these geochemical proxies and discuss their implications, including the importance of the seawater osmium isotope record. This record changes dramatically at the beginning of OAE2, and indicates that a massive and widespread magmatic pulse triggered the deposition of these large amounts of organic matter.
BIOGRAPH y
Steven Turgeon received a B.Sc. in Physical Geography in 1991, an M.Sc. in seismostratigraphy from the Université de Sherbrooke in 1993, and a Ph.D. in 2001 from Carleton University in Ottawa. From 2001 to 2003, he lived and worked in Germany
as a European Union Postdoctoral Fellow at the University of Oldenburg studying inorganic geochemical parameters in black shales as part of an international research network. He then moved to Oak Ridge National Laboratory in Tennessee where he was involved in mass spectrometry research from 2003 to 2005. In 2006, he joined Robert Creaser’s group at the University of Alberta as a research associate where he has been looking at rhenium and osmium systematics in organic-rich sediments and hydrocarbons.
I NFORMATION
This event is jointly presented by the Alberta Palaeontological Society (APS), Mount Royal College and the CSPG Paleontology Division. For details or to present a talk in the future please contact CSPG Paleontology Division Chair Philip Benham at 403-691-3343 or programs@ albertapaleo.org. Visit the APS website for confirmation of event times and upcoming speakers: http://www.albertapaleo.org/.
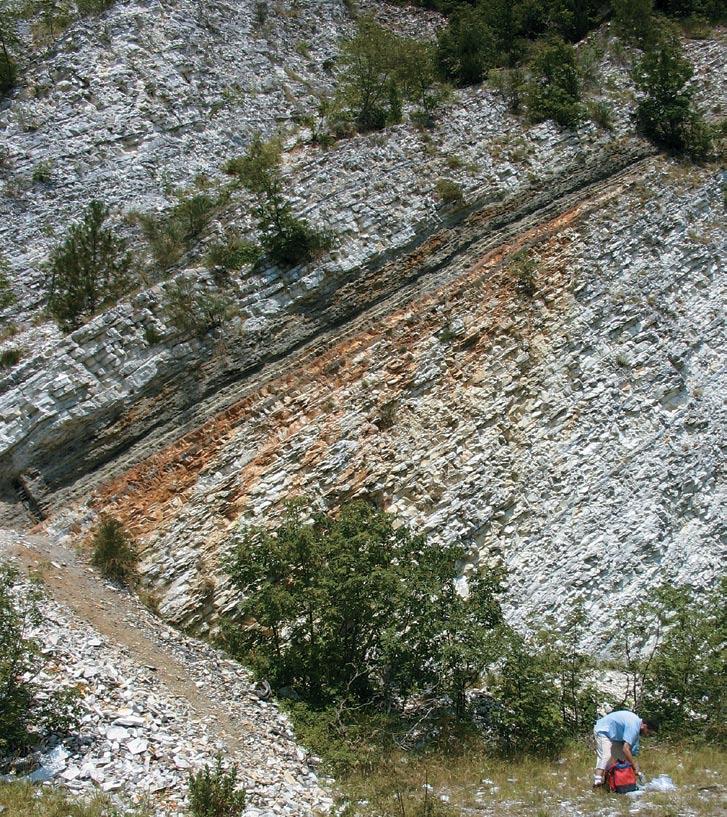
Exposure containing the AOE2 in central Italy (the darker, ca. 1 m band in the middle-top left of the outcrop).
Importance of geological heterogeneity on fluid flow behavior in a SAGD process: an engineering perspective
SPEAKER
Farrukh Akram
Schlumberger Canada Limited
12:00 noon
tuesday, october 21, 2008 encana a mphitheatre, 2nd Floor east end of the calgary tower complex 1st street and 9th avenue se calgary, a lberta
Standing at 2.5 trillion barrels, Canada has the largest portion of the world’s ultraheavy oil and bitumen resources. While shallow heavy oil reserves are extracted from pit mines, deeper reserves can only be extracted through wells. Production requires operations such as Steam Assisted Gravity Drainage (SAGD) and Cyclic Steam Stimulation (CSS) methods. Optimal well placement defines the propagation of steam within the reservoir and the resulting flow of crude towards the producers. These steam recovery methods require a strong geological reservoir characterization in order to assist with the field development plans. It is important for both the geologists and the engineers to understand the effect of assumptions used in designing the production methodology. This presentation looks at the effect of reservoir characterization on the engineering design through the use of flow simulation for a sample Athabasca Oil Sands area.
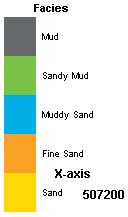
When a geological reservoir model becomes an engineering flow simulation model, changes are often introduced to satisfy engineering constraints. Grid cell orientation, facies grouping, and cell size are some of the common changes that occur. Why the reservoir flow simulation requires these changes will be investigated.
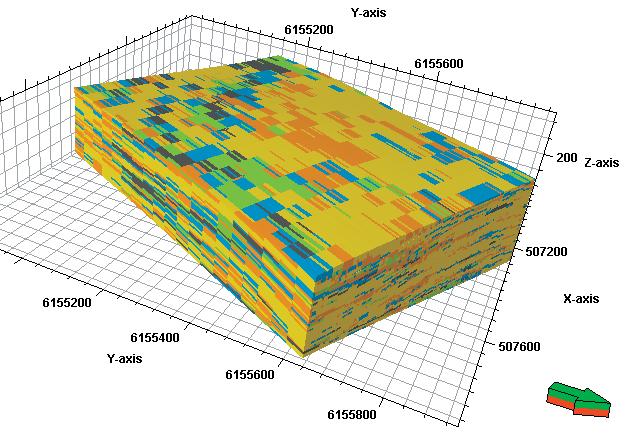
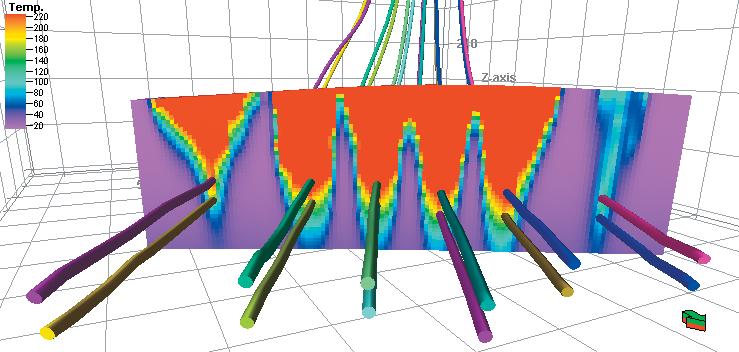
A heterogeneous geological reservoir model (Figure 1) was used as our test case. A full field thermal model was developed to simulate the SAGD recovery process. The study examined a typical SAGD pad consisting of six well pairs (Figure 2). Since horizontal SAGD pairs are seldom perfectly horizontal, an advanced well-bore model is used to account for the complex flow effects in the slowly flowing horizontal wells.
This presentation demonstrates the effect of the geological model and engineering constraints on the flow simulation and the formation of the steam chamber due to the presence of geological baffles and barriers. The behavior of the SAGD process under a full field, multiple pair environment in a heterogeneous reservoir is observed. These
heterogeneities in a full field environment cause irregularities in the steam chamber formation and can result in flow interactions between well pairs, as shown in Figure 3, which traditionally may have been overlooked. Sensitivity analysis was done on the grid block size to determine the optimal flow solution accuracy versus the simulation runtime.
BIOGRAPH y
Farrukh Akram received a Bachelor’s degree in Mechanical Engineering from NED University of Engineering and Technology and a Master’s degree in Petroleum Engineering from Dalhousie University. He is a reservoir engineer for Schlumberger Information Solutions specializing in integrated subsurface workflows and geological modeling and reservoir simulation software. He teaches courses in Petrel Reservoir Engineering and develops workflows for oil sands and offshore reservoirs. He has authored two technical papers, co-authored two other papers, and co-presented two papers to other organizations on modeling, simulation, and field development planning. He is a member of the Society of Petroleum Engineers.
Figure 1. A heterogeneous geological model.
Figure 2. SAGD well placement and spacing.
Figure 3. Steam chamber after four years of injection. The presence of shale and low permeability zones affect the formation and inter-connection between the individual steam chambers.
diVision talKs BASIN ANALYSIS AND SEQuENCE STRATIGRAPHY DIVISION
Engineering without Borders
SPEAKER
Mahyer Mohajer
Schlumberger Information Solutions
12:00 noon
monday, october 27, 2008 encana amphitheatre, 2nd Floor east end of the calgary tower complex 1st street and 9th avenue se calgary, aB
Hydrocarbon exploitation processes cannot be economically assessed from a stand-alone point of view; it is imperative to evaluate their viability by considering different stages in the hydrocarbon recovery process chain, from the reservoir to the upgrading facilities. This is possible today. Petroleum Engineers can model the entire production cycle, from the reservoir through the production network to the surface facilities, all of these integrated with economic analysis.
This case study presents modeling a Canadian tight gas field including a simplified reservoir model integrated to a fully developed surface network, demonstrating a simplified but realistic model is able to perform a good history match. This model is used to test “what-if” scenarios without risking the actual operation of the production field. Furthermore, the model is also able to forecast the new production based on the application of the operating parameters determined to enhance and optimize their production.
BIOGRAPHy
Mahyar (Matt) Mohajer is a Production Engineering consultant with Schlumberger Information Solutions (SIS). Mr. Mohajer earned a B.Sc. in Chemical Engineering from Sharif University of Technology in Tehran, Iran and an M.Sc. in Chemical Engineering from the University of Calgary. Prior to his graduate studies, he worked as a Process Engineer for IRITEC (Iran International Engineering Company) in Tehran. He participated in modeling and designing amine-based gas sweetening and sour water striper units. In 2006, he joined SIS in
Calgary and he is currently involved in providing support and consultancy services using SIS’ production portfolio.
INFORMATION
BASS Division talks are free. Please bring your lunch. For further information about the division, joining our mailing list, a list of upcoming talks, or if you wish to present a talk or lead a field trip, please contact either Steve Donaldson at 403-645-5534, email: Steve.Donaldson@ encana.com or Mark Caplan at 403-532-7701, email: mcaplan@aosc.com or visit our web page at www.cspg.org/events/divisions/basinanalysis-sequence-strat.cfm.
Loring Tarcore Labs
The next generation oil
sands lab
Provide certainty for our clients in the highly uncertain oil sands business by uarant ing the delivery date of lab testing results and core photos. g ee
During our two operation seasons, we delivered all Dean and Stark reports and core photos before the end of April each year. Our clients, including big oil companies, enjoy a plenty of time to make their business decisions. TIMELY! For more information or lab tours, please contact us @(403)874-4588 or visit http://www.tarcore.com.
The Sedimentology of Mangroves
SPEAKER
Jon Noad Shell Canada
12:00 noon
Wednesday, o ctober 29, 2008
BP tower
240 4 ave s W, room 201 c algary, a lberta
Fossil mangrove deposits have received relatively little attention in the published literature, despite their obvious potential as hydrocarbon-prone source rocks. Recent fieldwork examining both ancient and modern deposits suggests that mangroves may also host significant oil deposits. Studies on Miocene coastal clastic deposits in the Sandakan region of eastern Borneo have identified several
well preserved mangrove systems. Detailed sedimentological analysis has allowed the development of new criteria enabling the recognition of these facies in other locations. These criteria include the sedimentological characteristics of both channelized and sheet-like sandstones, as well as macro- and micro-palaeontological observations.
Several morphologically distinct sandbody classes within these successions have confidently been assigned to channel and inter-mangrove broads, based on analogues from both the Everglades of Florida and modern Bornean mangroves. The channelised sandstones have extremely steep banks and appear to accrete vertically, thought to be due to the constraining mangrove root systems. The sheet-like sandstones are massive with very rare rooted intervals. u npublished data from Brunei suggests that mangrove mudstones may provide a significant source of oil, mainly from the waxy cuticles of mangal species. u sing the analogue data to give an indication of the lateral extent of
Reservoir Characterization
Expertise in heavy oil & deep basin reservoirs
• AVO / LMR Analysis
• Neural Network Analysis
• PP & PS Registration
• Joint PP & PS Inversion
• Fracture Detection Analysis using Azimuthal AVO
• Spectral Decomposition
Time Lapse Analysis
Carmen Dumitrescu
P.Geoph., M.Sc., Manager, Reservoir Geophysics
Direct: 403-260-6588 Main: 403-237-7711
www.sensorgeo.com
the fossil mangrove sandbodies, plays can be developed invoking stratigraphic traps sourced from the associated mudstone deposits.
Additional plays have been erected for carbonate mangrove systems which, while sharing some of the features of clastic mangrove systems, have other mangal indicators such as well preserved rooted systems, fenestra, and an absence of large channels. These features relate to their development in arid climates, which have also led to the preservation of soil horizons which form key marker beds within the stratigraphy. Classic examples of rooted carbonate mangroves from the Miocene of Mallorca have been studied and modelled in a reservoir simulator to assess the impact of high vertical permeability values.
B IOGRAPH y
Jon Noad is an exploration geologist working on tight gas deposits with Shell Canada. After graduating from Imperial College, London in 1985 he spent four years working as a mining geologist in South Africa. Returning to the United Kingdom he joined British Telecom (Marine) as their first marine geologist, evaluating potential submarine cable and pipelines routes. During this time he gained an M.Sc. in Sedimentology at evening classes at London University, with a thesis based in Dinosaur Provincial Park, Alberta. He then completed a Ph.D. in London on the Sedimentary Evolution of Eastern Borneo, before joining Shell in the Netherlands in 1998. Since then he has worked primarily in Exploration, concentrating on the Middle East until moving to Canada in 2006. He is currently President of the British Sedimentology Research Group (BSRG), and was formerly President of the PGK in Holland.
diVision talKs STRuCTuRAL DIVISION
Spring 2008
CSPG Structural Geology Division
Field Trip Recap: McConnell Thrust, Mt. Yamnuska
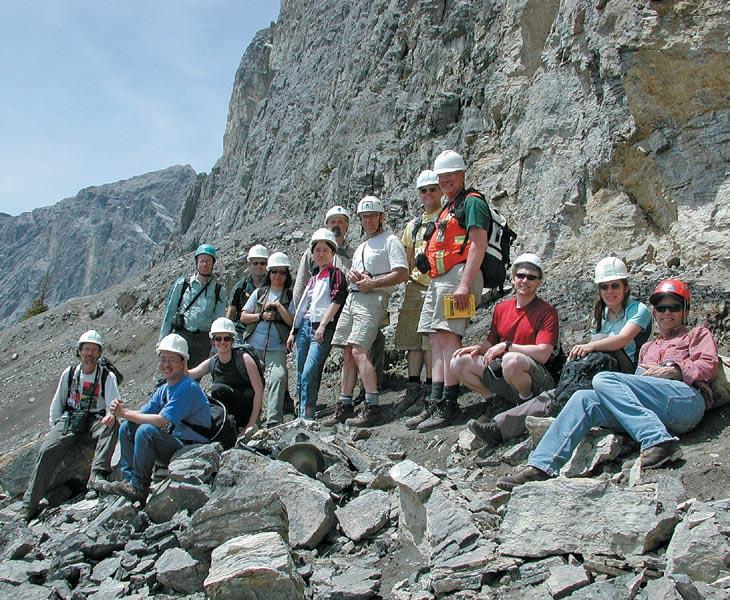
On June 21, 2008, Kevin Root led a group of 15 geologists up the slopes of Mt. Yamnuska to examine supurb exposures of the McConnell thrust fault surface and the sheer face of complexly deformed Eldon Fm. in the hangingwall. The view of these features up close is quite different from the one we get from the Trans-Canada Hwy. We followed the trace of the thrust for the full extent of its exposure beneath the Yamnuska “sail,” then continued into the saddle on the west side of Mt. Yamnuska. In that region Kevin took us to outcrops of Stephen Fm. shales and Cathedral Fm. limestones, both older than the Eldon Fm. The obvious view of a thrust fault with a ramp-flat geometry at Mt. Yamnuska is not so obvious when the details
of the deformation and the stratigraphy are taken into account. Many thanks to Kevin Root for an extremely instructive
presentation and to Jean-Yves Chatellier for handling the logistics for this field trip.
PROCESSING
PROCESSING
November3rd-7th,2008 Calgary,Alberta
The
COURSES
COURSES
8. Seismic Interpretation in the Exploration Domain
16. Understanding Seismic Anisotropy, Hands-On
1. Processing,Inversion and Reconstruction of Seismic Data
1. Processing,Inversion and Reconstruction of Seismic Data
MauricioSacchi November3-4
2. Seismic Processing Fundamentals
MauricioSacchi November3-4
GaryMargrave November5-7
2. Seismic Processing Fundamentals
GaryMargrave November5-7
3. Parallel Computing – Cluster Computing using MPI/OpenMP in Fortran/C
PhilBording November3-4
3. Parallel Computing – Cluster Computing using MPI/OpenMP in Fortran/C
PhilBording November3-4
4. Computational Seismic Imaging: Theory and Practice
Rob Ferguson November3-5
4. Computational Seismic Imaging: Theory and Practice
Rob Ferguson November3-5
INTERPRETATION
INTERPRETATION
5. Seismic Expression of Devonian Carbonates
GeoffreyFraser/NormKohlhammerNovember5
5. Seismic Expression of Devonian Carbonates
GeoffreyFraser/NormKohlhammerNovember5
6. Sequence Stratigraphy:Principles and Applications
OctavianCatuneanu November5-7
6. Sequence Stratigraphy:Principles and Applications
OctavianCatuneanu November5-7
7. Acquiring,Understanding and Interpreting Gravity GradiometryData
Mark Davies / Phillip Houghton / John Lumley November3-4
7. Acquiring,Understanding and Interpreting Gravity GradiometryData
Mark Davies / Phillip Houghton / John Lumley November3-4
8. Seismic Interpretation in the Exploration Domain
DonHerron/TimSmithNovember6-7
9. 3D Seismic Attributes for Prospect Identification and Reservoir Characterization
DonHerron/TimSmithNovember6-7
9. 3D Seismic Attributes for Prospect Identification and Reservoir Characterization
KurtJ.Marfurt/Satinder ChopraNovember 6-7
10. Shallow EM Methods Applied to Oil Sands Investigations
KurtJ.Marfurt/Satinder ChopraNovember 6-7
10. Shallow EM Methods Applied to Oil Sands Investigations
Ted Glenn November6
Ted Glenn November6
11. Oil Field Geomechanics – Application to Fracture Permeability
Lisa Dell’Angelo November 3
11. Oil Field Geomechanics – Application to Fracture Permeability
ROCK PROPERTIES
Lisa Dell’Angelo November 3
12. Inversion Boot Camp
ROCK PROPERTIES
John Pendrel / David TimkoNovember 4-5
12. Inversion Boot Camp
John Pendrel / David TimkoNovember 4-5
13. Properties of Pore Fluids for Geophysical Applications
13. Properties of Pore Fluids for Geophysical Applications
MikeBatzle November4
MikeBatzle November4
14. Applied Petrophysics for Geophysicists (and Other Geoscientists)
TadSmith / Peggy HodgkinsNovember6-7
14. Applied Petrophysics for Geophysicists (and Other Geoscientists)
TadSmith / Peggy HodgkinsNovember6-7
15. Rock Physics for Geophysical Reservoir Characterization and Recovery Monitoring
GaryMavko November3-4
15. Rock Physics for Geophysical Reservoir Characterization and Recovery Monitoring
17. Exploration:From Geology to the Seismic Section
BASIC CONCEPTS
BobParker November5-7
17. Exploration:From Geology to the Seismic Section BobParker November5-7
18. Seismic Data Basics I JohnFernando November3-4
19. Seismic Data Basics II JohnFernando November6-7
18. Seismic Data Basics I JohnFernando November3-4
19. Seismic Data Basics II JohnFernando November6-7
DEVELOPMENT GEOPHYSICS
DEVELOPMENT GEOPHYSICS
20. Multicomponent Seismic Exploration in WesternCanada
RichardA.Bale/RobertKendallNovember5
20. Multicomponent Seismic Exploration in WesternCanada
RichardA.Bale/RobertKendallNovember5
21. Velocity Model Building and Depth Conversion
21. Velocity Model Building and Depth
Richard Lee November3-4
Conversion
Richard Lee November3-4
PROFESSIONAL SKILLS
PROFESSIONAL SKILLS
22. Quantifying Uncertainty and Risk in Oil and Gas Evaluations
ChrisZinkan November7
22. Quantifying Uncertainty and Risk in Oil and Gas Evaluations
23. You’re Presenting...Are they Listening?
ChrisZinkan November7
Carole Wright November6 or 7
23. You’re Presenting...Are they Listening? Carole Wright November6 or 7
*Prize draw to be made from registrations received by this date. Early Bird Registration date is September 26. Registration closes October 17.
R ESERVOIR E NGINEERING FOR GEOLOGISTS Coalbed Methane Fundamentals
| by Kamal Morad, P. Eng.; Ray Mireault, P. Eng.; and Lisa Dean, P. Geol. (Fekete Associates Inc.)
Historically, gas emissions from coal have been a nuisance and a safety hazard during coal mining operations, causing numerous explosions and deaths. But today, coalbed methane (CBM) is an increasingly important source of the world’s natural gas production with many countries, including Canada, actively developing this unconventional energy source.
Currently, CBM accounts for 10% of u.S. natural gas production with the size of the resource (OGIP) estimated at 700 TCF. The most active areas of production are the San Juan Basin in New Mexico, the Powder River Basin in NE Wyoming/SE Montana, and the Black Warrior Basin in Alabama.
In Canada, CBM is still in the early stages of development, yet it already accounts for about 1% of total gas production. The Western Canada Sedimentary Basin contains the majority of Canada’s estimated 600 TCF of CBM resource potential. Formations of greatest interest are the Mannville, which tends to produce water as well as gas (a “wet” coal) and the Horseshoe Canyon, which usually produces gas with virtually no water (a “dry” coal).
In general, coal is classified into four main types depending on the quantity and types of carbon it contains as well as the amount of heat energy it can produce. These are:
1. Lignite (brown coal) – the lowest rank of coal; used as fuel for electric power generation.
2. Sub-bituminous coal – properties range between lignite and bituminous coal.
3. Bituminous coal – a dark brown to black, dense mineral; used primarily as fuel in steam-electric power generation.
4. Anthracite – the highest rank; a harder, glossy, black coal used primarily for residential and commercial space heating; it may be divided further into petrified oil, as from the deposits in Pennsylvania.
Note that graphite, which is metamorphically altered bituminous coal, is technically the highest rank of coal. However, it is not commonly used as fuel because it is difficult to ignite.
COAL C HARACTERISTICS
Coals are recognized on geophysical logs because of several unique physical properties. The coals typically have very low gamma, low density, and high resistivity values.
Similar to conventional naturally fractured reservoirs, coal is generally characterized as a dual-porosity system because it consists of a matrix and a network of fractures (Figure 1). For both groups, the bulk of the in-place gas is contained in the matrix. However, matrix permeability is generally too low to permit the gas to produce directly through the matrix to the wellbore at significant rates.
In a naturally fractured system, most of the produced gas makes its way from the matrix to the fracture system to the wellbore. If the well has been hydraulically frac’d, gas may
also travel from the natural fracture system to the man-made fracture system to the wellbore. With both conventional naturally fractured reservoirs and CBM reservoirs, the natural fracture system has high permeability, relative to matrix permeability, but very limited storage capacity.
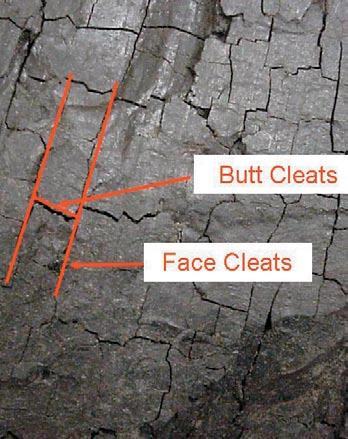
In coal terminology, natural fractures are called “cleats”. The cleat structure consists of two parts: face cleats and butt cleats (Figure 2). Face cleats are typically continuous fractures that go across the reservoir. They are considered the main pathway for gas production.
Butt cleats are discontinuous, perpendicular to the face cleats and generally act as a feeder network of gas into the face cleats.
The effective porosity, permeability, and water saturation are all properties of the coal “cleat” system. Since coal permeability is a property of the cleat space, it is affected by the structure and characteristics of the cleat network, e.g., the dominant fracture orientation, fracture continuity, frequency, and width.
The effective permeability of the cleat system is also influenced by the contrast between face and butt cleat permeability. CBM reservoirs are generally considered to be anisotropic systems, where the effective permeability is the geometric average of face and butt cleat permeability. Permeability anisotropy creates elliptical drainage areas and should be taken into account when placing wells in CBM development projects.
DIFFERENCES w ITH
CONVENTIONAL R ESERVOIRS
A good starting point to understanding the production characteristics of coalbed methane reservoirs is by considering the differences to conventional gas production. The most significant differences are:
• In a conventional reservoir, the majority of the gas is contained in the pore space but in a CBM reservoir, the majority of the gas is adsorbed (bonded to the coal molecules) in the matrix.
• In a conventional reservoir, reservoir gas expands to the producing wells in direct response to any production-induced
Figure 1. Coal is a dual porosity system.
Matrix Fracture
Matrix Butt Cleats
Face Cleats
Figure 2. Example of coal cleat structure. (Continued on page 24...)
(...Continued from page 23)
pressure gradient. But CBM reservoirs generally require that reservoir pressure be below some threshold value to initiate gas desorption.
• In a CBM reservoir, a gas molecule must first desorb and diffuse through the coal matrix to a cleat. It can then move through the cleated fracture system and the hydraulic frac-stimulation to the wellbore via conventional Darcy flow.
CBM G AS S TORAGE C APABILIT y
The primary storage mechanism in CBM reservoirs is adsorption of gas by the coal matrix. Matrix surface area, reservoir pressure, and the degree to which the coal is gas saturated are the factors that determine the in-place gas volume of a coal. Note that the smaller the coal particle size, the larger the surface area.
The complete gas-in-place volumetric equation for a CBM reservoir is:
OGIP= A*h*b*GCi+ Ahøi(1-Swi) Bgi
Where:
• A is drainage area,
• h is net pay,
• b is bulk density,
• GC i is initial Gas Content,
• ø i is porosity,
• S wi is initial water saturation
• B gi is initial formation volume factor.
The first term represents the adsorbed gas in the matrix while the second term is the free gas in the cleats. Since the pore volume in CBM reservoirs is in the order of 1% of the total volume, the free gas contribution to the total in-place gas volume is negligible.
As with all volumetric estimates, uncertainty
in the input data creates a range of possible outcomes for OGIP. Some common areas of uncertainty for CBM projects include:
• The gas content of the coal,
• The degree of heterogeneity and complexity contained in CBM reservoirs,
• The impact of modelling complex multilayer coal/non-coal geometries with simple one- or two-sequence models.
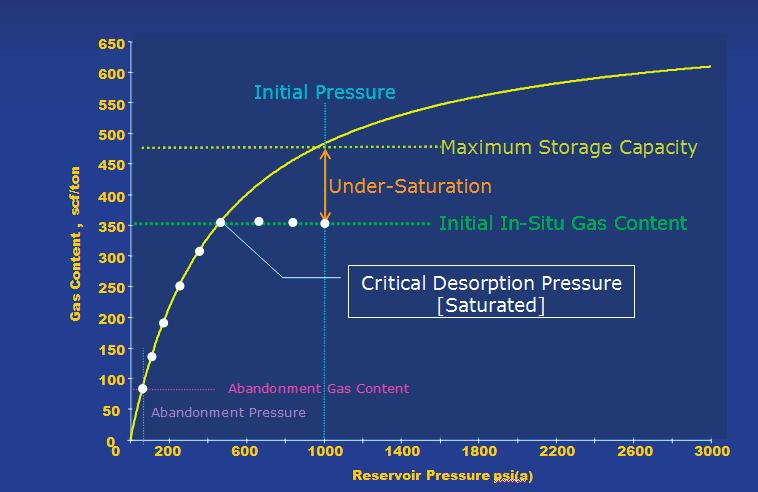
CBM G AS DESORPTION
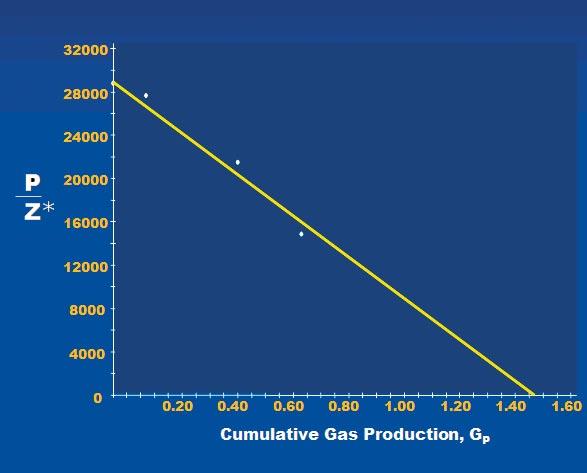
While the relationship between pressure decline and gas production is essentially a straight line in a conventional reservoir (Figure 3), the depletion profile in a CBM reservoir is distinctly non-linear. For a given pressure drop, a CBM reservoir will desorb significantly more gas when the starting reservoir pressure is low compared to when reservoir pressure is high (Figure 4).
If the initial reservoir pressure is significantly greater than the pressure required to initiate desorption (the coal is under-saturated), and water is initially present in the cleat system, then the initial production period may produce only water without any gas (Figure 5). Depending on the degree of under-saturation, dewatering can last from a few months to two or three years and can significantly affect the economics of the prospect.
If initial reservoir pressure is equal to the critical desorption pressure (the coal is gas-saturated), then gas production will start as soon as reservoir pressure begins to decrease. This situation most often applies to “dry” coals but can also apply to saturated “wet” coals.
The equation that is commonly used to describe the relationship between adsorbed
gas and free gas as a function of pressure is known as the Langmuir isotherm. The isotherm is determined experimentally and measures the amount of gas that can be adsorbed by a coal at various pressures. The Langmuir isotherm is stated as: L L P VV PP = +
Where:
• VL , the Langmuir Volume, is the gas content of the coal when reservoir pressure approaches infinity.
• P L , the Langmuir Pressure, is the pressure corresponding to a gas content that is half (½) of the Langmuir volume. The steepness of the isotherm curve at lower pressures is determined by the value of P L
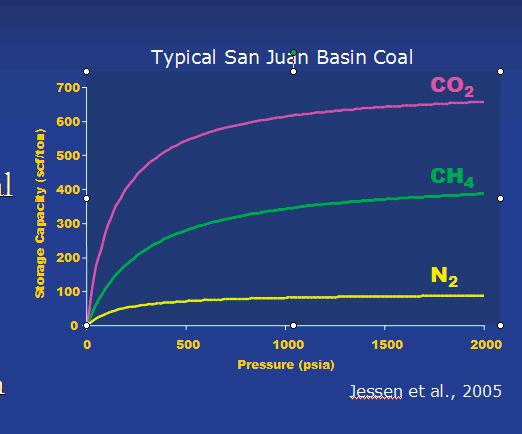
CBM gas consists primarily of methane (CH 4 ) but may also contain lesser percentages of carbon dioxide (CO 2 ) and nitrogen (N 2 ). As coal has the strongest affinity for nitrogen and the weakest affinity for carbon dioxide, the three gases adsorb/ desorb at different rates from coal (Figure 6). Thus, it is not uncommon for the CO 2 content of the produced gas to decrease as gas is produced and reservoir pressure depletes.
CBM G AS T RANSPORT M
ECHANISMS
After desorbing from the coal, gas in a CBM reservoir uses diffusion to travel through the coal matrix to the cleat system. The time required to diffuse through the matrix to a cleat is controlled by the gas concentration gradient, the gas diffusion coefficient, and the cleat spacing. In general, greater concentration gradients, larger diffusion coefficients, and tighter cleat spacing all act to reduce the required travel time.
Figure 3. Conventional gas P/Z plot.
Figure 4. Comparison of desorption volumes with changes in reservoir pressure.
On reaching a cleat, gas then travels the remaining distance to the wellbore by conventional Darcy flow. Since flow in a CBM reservoir is generally two-phase flow, fluid saturation changes in the cleat system and consequent changes in relative permeabilities become important.
As the gas is produced from a CBM reservoir, two distinct and opposing phenomena occur that affect the absolute permeability of the cleat system:
1. As reservoir pressure decreases, it reduces the pressure in the cleats. Cleat effective stress (which is the difference between overburden stress and pore pressure) increases and compresses the cleats, causing cleat permeability to decrease.
2. As gas desorbs from the coal matrix, the matrix shrinks. Shrinkage causes the space within the cleats to widen and the permeability of the cleats increases.
From the Langmuir isotherm (Figure 4), the amount of gas desorbed for a given pressure drop is relatively small at high pressures. Thus in the early stages of production, the compaction effect is the dominant factor and cleat permeability will tend to decrease slightly. As production continues and gas recovery becomes significant, matrix shrinkage will dominate and increase cleat permeability.
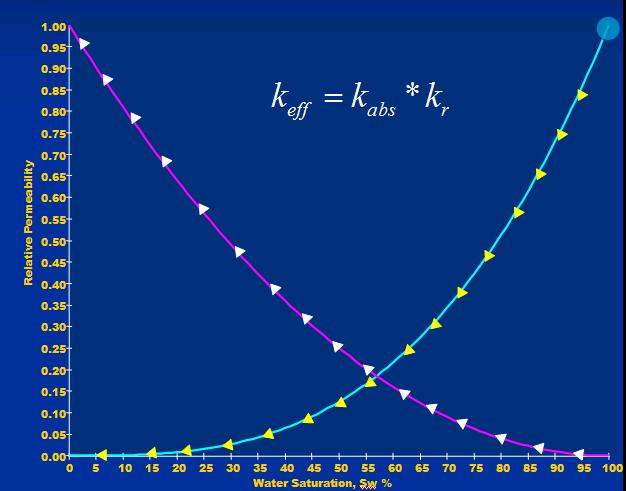
In “wet” coals, changes in the relative permeability of the cleat system with changes in water and gas saturation must be considered in the Darcy flow equation to correctly predict well performance. As illustrated by a typical set of relative permeability curves (Figure 7), the relative permeability to gas increases with decreasing water saturation and vice versa.
CBM wELL PERFORMANCE
The production of CBM wells can be
generally divided into three separate phases (Figure 8):
• Dewatering phase (for under-saturated reservoirs): In this phase, no gas is produced (excepting in the transient near wellbore region or in complex reservoirs)
• Negative decline: Water production continues to decline while gas production increases.
• Production in this phase is generally dominated by the relative permeability of gas and water.
• Decline phase: Declining reservoir pressure is now the dominating factor although its impact is mitigated to some extent by a shrinking matrix and increasing cleat permeability. Nonetheless, the gas production rate declines as in conventional gas reservoirs, albeit at a slower rate of decline.
The water production forecast looks similar (Continued on page 26...)
Figure 5. Desorption behaviour of under-saturated CBM reservoirs.
Figure 6. CBM gas storage capacities for N2 , CH4 , and CO2
Figure 7. Relative permeability to gas and water.
Figure8
Figure 8. CBM well production profile.
to a production forecast for a conventional water producing reservoir. Maximum water production rates are achieved initially but decline thereafter through a combination of reservoir pressure depletion and decreasing relative permeability to water.
The gas production profile displays both the initial, dormant period followed by an increasing production rate till it reaches a peak and then declines. Although reservoir pressure is monotonically declining through the life of the simulation well, it is counteracted during the inclining production period by increases in the relative permeability to gas and in the absolute permeability of the cleats.
As the water saturation approaches its minimum value, declining reservoir pressure dominates and the well goes into the decline phase of its producing life. During this time period, the declining production trend resembles conventional gas production. Note that a “dry” CBM reservoir exhibits only the declining portion of the production pattern.
Given the scope and complexity of the
inputs for CBM reservoirs, simulation is generally required to predict the deliverability and cumulative production of CBM wells. As improvements in drilling, completion and production techniques advance, CBM will continue to be an increasingly important source of natural gas.
REFERENCES
Gas Research Institute. 1993. GRI Reference No. GRI-94/0397, “A Guide to Coalbed Methane Reservoir Engineering,” Chicago, Illinois.
Jensen, D. and Smith, L.K. 1997. A Practical Approach to Coalbed Methane Reserve Prediction Using a Modified Material Balance Technique. International Coalbed Methane Symposium, The University of Alabama, Tuscaloosa, Alabama, paper 9765, p. 105-113.
Lamarre, Robert A. 2005. “Coalbed Methane – A Non-Conventional Energy Source What Is It And Why Is It Important,” 25th Annual North American Conference of the USAEE/ IAEE, Fueling the Future.
Mavor, M.J. 1996. A Guide to Coalbed Methane: Coalbed Methane Reservoir Properties. Gas Research Institute Chicago, Illinois, GRI
Reference No. GRI-94/0397, Chapter 4.
Schafer, P.S. and Schraufnagel, R.A. 1996. A Guide to Coalbed Methane: The Success of Coalbed Methane. Gas Research Institute Chicago, Illinois, GRI Reference No. GRI94/0397, Chapter 1.
Steidl, P.F. 1996. A Guide to Coalbed Methane Reservoir Engineering: Coal as a Reservoir. Gas Research Institute Chicago, Illinois, GRI Reference No. GRI-94/0397, Chapter 2.
Zuber, M.D. 1996. A Guide to Coalbed Methane: Basic Reservoir Engineering for Coal. Gas Research Institute Chicago, Illinois, GRI Reference No. GRI-94/0397, Chapter 3.
Watch for our article in the next issue of the Reservoir.
This article was contributed by Fekete Associates, Inc. For more information, contact Lisa Dean at Fekete Associates, Inc.
Thank you to the sponsors who contributed to the success of the 2008 CSPG CSEG CWLS Convention
SHAREHOLDER – $25,000 +
DEPOSITIONAL PATTERNS AND M ECHANISMS ON THE I NNER-BEND M ARGIN (Point Bar) of a Sinuous Deep-Marine Channel
| By R.W.C. Arnott
INTRODUCTION
One of the most common elements observed in the deep ocean are sinuous channels, which at least superficially bear a striking resemblance with the much better known and studied meandering (sinuous) fluvial systems of the continental realm. In addition to planform similarities, other fluvial features like levees, point bars, lateral accretion surfaces, overbank splays, and cut-offs – as well as fundamental dynamic controls including equilibrium gradients, slope-induced changes in channel sinuosity, channel width-to-depth ratio, and spatial patterns of deposition versus erosion have also been documented. Such similarity, therefore, begs the question whether stratal architectures and geometries of continental sinuous channels can be applied to sinuous deep-sea channels.
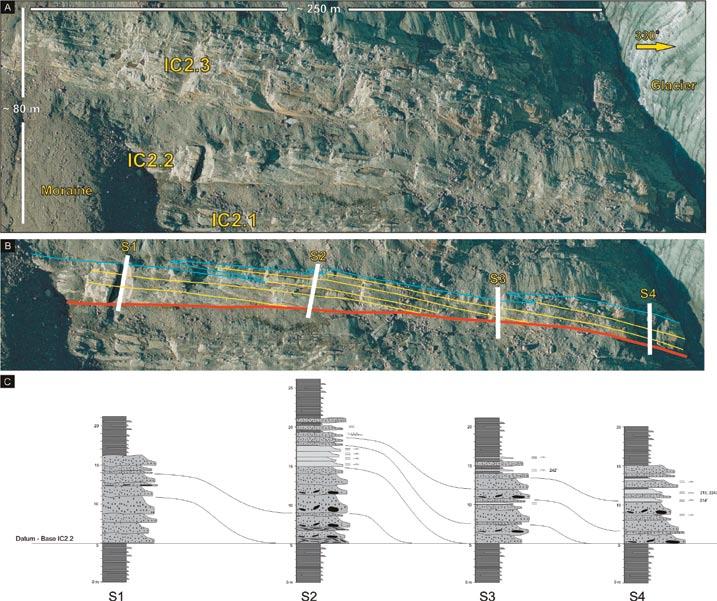
STRATAL RECORD OF A SINUOUS DEEP-MARINE CHANNEL : IC 2.2
Isaac Channel unit 2.2 (IC2.2) is the second of four channel-fill successions that make up Isaac Channel Complex 2 in the Castle Creek south study area (Figure 1A). Paleocurrent data is generally toward 230°, and therefore almost perpendicular to the strike of the outcrop. IC2.2 is 9.5-12.5 m thick and is best exposed in a freshly deglaciated outcrop that is about 200 m wide and bounded to the northwest by Castle Creek Glacier and to the southeast by a moraine. The channel fill continues under the moraine, which is approximately 170 m wide, and then pinches out a short distance (~40 m) after becoming exposed again – the minimum lateral extent of IC2.2 is therefore of the order of 400 m.
Based on observations from high-resolution aerial photographs, and verified by fieldbased observations, IC2.2 can be subdivided into a number of stratal packages that dip consistently at about 7-12° toward the base of the channel fill (Figure. 1). These packages, in addition to their bounding surfaces, are interpreted to be lateral accretion deposits (LADs) formed by the lateral migration of the inner bank of a sinuous deep-marine channel (Figures 1B, C). Two end-member kinds of LADs are recognized: coarse-grained LADs and finegrained LADs (Figure 2). At the top of the channel fill both kinds pass rapidly obliquely upward into fine-grained innerbend-levee deposits. In addition, traction sedimentary structures, namely medium-
Figure 1. Aerial photo of Isaac channel complex 2 (IC2), Castle Creek south. Note that strata dip vertically into the photo. (A) Uninterpreted photo showing the three channel fills (IC2.1, IC2.2, IC2.3) that make up channel complex 2 between the moraine and the glacier. (B) Interpreted photo of IC2.2. Flat base of IC2.2 is indicated by the red line. Yellow lines represent surfaces that in the field and also on the aerial photos could be traced laterally from the top obliquely downward to the base of the channel fill (from left to right). These surfaces are interpreted to be part of coarse-grained lateral accretion deposits, or LADs, formed by the lateral migration of a deep-marine sinuous channel. The serrated blue line indicates the interfingering of coarse- and fine-grained LADs at the top of the channel fill. Fine LADs grade rapidly laterally (toward the left) into conterminuous fine-grained inner-bend-levee deposits. (C) Line diagrams of bed-by-bed measured stratigraphic sections (S1-S4). Location of each section is shown in (B).
scale (dune) cross-stratification and planar lamination are observed, and occur almost exclusively near the termini of the coarsegrained LADs where they pinch out into fine-grained inner-levee deposits.
Fine- and coarse-grained LADs were most probably deposited by vertically stratified, high-concentration turbidity currents. Such strong stratification would have created a sharply defined density interface whose vertical position in the flow is interpreted to have coincided with the location where coarse LADs onlap and then pinch out onto the point bar surface. Compared to flows that deposited fine-grained LADs, these flows were either equally coarse-grained but more depletive, or coarser grained and higher density with higher rates of instantaneous and long-term (but during
a single event) sedimentation. In either scenario, beyond the pinch out point of each discrete coarse-grained LAD, flows formed only a planar bypass surface over which all sediment coarser than lower medium / upper fine sand bypassed. Elevated turbulence, related to instabilities generated along the very abrupt density interface (also a zone of high velocity gradient) promoted traction sediment transport, and where sediment concentration was sufficiently reduced, allowed for the growth and migration of dunes.
The rhythmic interstratification of coarseand fine-grained LADs, which is especially well developed in the upper part of IC2.2, must reflect recurring changes in sediment transport through the channel system. The question, therefore, is what caused these
changes? Deposition of fine-grained LADs most likely represented periods of highly efficient turbidity currents that bypassed the area and transported much of their sediment load further downdip, suggesting that flow and channel conditions were in equilibrium. This condition of equilibrium could be described equivalently as the lack, at least locally, of spatial and temporal gradients in sediment transport, which in turn is the result of a balance between flow conditions and channel parameters. Periodically, however, these conditions were interrupted by episodes of disequilibrium that resulted in deposition of the small number of beds that make up each coarse-grained LAD. Deposition indicates negative spatial and / or temporal gradients in sediment transport. The question, therefore, is what caused these recurring episodes of coarse sediment deposition?
The simplest explanation would be repetitive changes in the nature of deposition related to repeated changes in flow conditions, including parameters like sediment calibre and sediment discharge. Although appealing, especially because of its simplicity, the consistency and rhythmicity in the observed stratal characteristics of coarse- and fine-grained LADs requires a mechanism that operates in a consistent and reproducible manner. If deposition of coarse-grained LADs was related to quasirandom changes in flow parameters, then
stratal characteristics might be expected to show at least some internal variability. However such variability is not observed. Potentially more problematic is explaining why along the length of the ~400 m-long outcrop coarse-grained LADs pinch-out at a consistent elevation above the base of the channel fill, and terminate always in fine-grained, inner-bend levee deposits. These latter deposits, therefore, occur topographically (and stratigraphically) above (in relation the base of the channel) the termini of the coarse LADs, which indicate that the coarse-grained LADs extend only part way up the inner-bend levee.
An alternative mechanism to explain the lithological consistencies and rhythmic interstratification of fine- and coarsegrained LADs is related instead to episodic changes in channel conditions, specifically channel dimensions (Figure 3). One possibility is that a slump failure, most likely along the outer bend margin (cut bank) of the channel, caused a sudden change (increase) in channel crosssectional area. Subsequent flows upon entering this now locally expanded channel reach would have been temporally more depletive (negative gradient in the spatial component flow velocity), and hence less efficient, and deposited a comparatively anomalous amount of coarse sediment preferentially along the inner bank (point bar) of the channel. As deposition
continued, and cross-sectional area was reduced, flows became more efficient and returned to “bypass” sedimentation. In this model the rate of lateral channel migration is controlled primarily by local sedimentological conditions, which then would be superimposed on the largerscale evolution of the channel system. In addition, repetitive episodes of lateral channel migration resulted in a heterolithic assemblage of facies (coarse- and finegrained LADs), especially well developed in the upper part of the channel fill.
SINUOUS CHANNELS : DEEPMARINE VERSUS CONTINENTAL
The model proposed for the origin of deep-marine point bar deposits differs significantly from that proposed for point bars in fluvial systems. In fluvial systems point bar deposition and related lateral accretion is generally attributed to recurring changes in fluid and sediment discharge conditions associated with floods. Coarse sediment deposition is typically attributed to high-energy bankfull discharge around peak flood, whereas fine-grained deposition occurs during waning and baseflow conditions. The height of the point bar deposit (measured upward from the channel base) is controlled primarily by the height of the inner-bend levee, whereafter the flow becomes unconfined and spills out onto the adjacent floodplain. u sing IC2.2
(Continued on page 30...)
Figure 2. Schematic diagram and photos to illustrate the terminology and stratal components describing
IC2.2 (figure not to scale).
Figure 3. Schematic diagram illustrating the depositional history on the inner bend (point bar) of a deep-marine sinuous channel. Flow is from left to right. Upper irregular line marks the top of the turbidity current. Because of the significant thickness of natural deep-marine turbidity currents the full thickness of the current cannot be shown. The double jagged line, therefore, indicates a break in the vertical thickness of the turbidity current that would be of the order of tens to hundreds of metres. Profile to the right in (A) and (B) is a qualitative measure of the vertical sediment concentration ([sed.]) within the current, which also is indicated by the grey-scale shading. (A) Under equilibrium conditions (bypass), sediment discharge into the channel bend (Qin) is balanced by transport out (Qout). Any deposition that did take place was from the dilute, low-velocity tail-end of the flow (fine-grained LADs). Obliquely up the point bar surface fine-grained LADs merge rapidly with even finer and thinner deposits of the innerbend levee. Obliquely downward details of the stratigraphy are unknown because these strata have been eroded. (B) Following failure along the cut-bank margin, equilibrium transport conditions in the channel bend were interrupted and deposition on the point bar occurred in order to restore transport equilibrium (Qin>Qout). Deposition occurred from well-mixed, high-concentration, strongly stratified sediment dispersions that emplaced coarse-grained LADs over much of the point bar surface. The top of the point bar coincides with the abrupt upward pinch-out of coarse-grained LADs and also is a zone of sediment reworking and traction sediment transport. This position coincides where intense turbulence (and related mixing) generated along the density interface impinged on the seabed. Further upward on the inner-bend levee bypass conditions prevailed. This scenario of bypass followed by deposition was repeated many times and caused IC2.2 to accrete laterally with time (L.A.).
(...Continued from page 29)
as an example of a deep-marine sinuous channel, it would appear that the innerbend levee extends some distance above the top of its conterminuous point bar deposit. The height of the point bar terminus above the channel base, therefore, would be unrelated to channel dimensions, but instead to depositional patterns controlled by the formative sediment-transporting flows. As mentioned above, along the 400 m exposed length of IC2.2 coarse-grained LADs terminate at a similar stratigraphic position above the base of the channel fill. This, in addition to the consistent lithological characteristics observed in the upper parts of coarse LADs, would suggest that appealing to consistently varying changes in flow conditions would appear to be equivocal. (Note that similar stratal characteristics are observed also in IC2.1 and IC2.3, in addition to other interpreted sinuous channel fills in the Castle Creek study area). Nevertheless, if such changes were possible then it implies that there is a consistent alternation between lowefficiency, sand-rich and high-efficiency,
mud-rich flows, which in turn requires equally consistent changes in the volume and calibre of sediment being supplied from up-dip source areas or to upslope erosion/ deposition patterns. In natural sedimentary systems such uniformity would seem problematic. A simpler explanation, such as the one proposed above and involving changes in local channel dimensions and its effect on sediment transport conditions and related depositional patterns would, at least intuitively, seem to be more plausible.
Finally, channel-bound packages of dipping seismic reflectors termed lateral accretion packages, or LAPs, have been recently reported and described from subsurface seismic examples in the Tertiary, offshore Angola (Abreu et al., 2003). These authors attributed these features to deposition caused by the lateral migration of sinuous channels. Although the thickness of channels in the subsurface example and that of IC2.2 are comparable, the thickness of individual LAPs are at least an order of magnitude greater compared to LADs described here.
In IC2.2, LADs are at most a few metres thick, which is well below the resolution of the seismic examples described by Abreu et al. A possible alternative explanation for the origin of seismically resolved LAPs is that these features represent a complex of laterally juxtaposed discrete sinuous channel fills, and not, as reported, the result of the migration and attendant deposition of a single, laterally accreting sinuous channel.
REFERENCE
Abreu, V., Sullivan, M., Pirmez, C., and Mohrig, D. 2003. Lateral accretion packages (LAPs): an important reservoir element in deep water sinuous channels. Marine and Petroleum Geology, v. 20, p. 631-648.
ACKNOwLEDGEMENTS
Our ongoing research of the WSG is funded by the industry members of the Windermere Consortium (Anadarko Petroleum, Canadian Natural Resources Ltd., Devon Petroleum Ltd., Husky Energy, Encana Corp., Nexen Inc., and Shell) and an NSERC Collaborative Research and Development Grant.
10-100s m
PRACTICAL SEqUENCE
The Material-based Surfaces of Sequence Stratigraphy, Part 2: Shoreline Ravinement and Maximum Regressive Surface
| by Ashton Embry
I NTRODUCTION
As discussed in the last installment of this series, six material-based surfaces of sequence stratigraphy have been empirically recognized over the past 200 years. Each surface represents a specific change in depositional trend which can be recognized on the basis of observational data. Collectively, these surfaces are the basic building blocks of sequence stratigraphy and allow high resolution correlations, definition and delineation of specific sequence stratigraphic units, and interpretations of depositional history in terms of base level change. The two surfaces discussed in my last article, the subaerial unconformity and the regressive surface of marine erosion, formed primarily during base level fall. The two surfaces which are discussed in this article, shoreline ravinement and maximum regressive surface, form at the start of, and during, base level rise.
As will be discussed, both these surfaces potentially have great utility in sequence stratigraphic analyses. Furthermore, as material-based surfaces, they can be identified on the basis of physical characteristics which include the nature of the surface itself, the nature of underlying and overlying strata, and the geometrical relationships between the surface and surfaces in underlying and overlying strata. The relationship of the surfaces to either base level change or to a change in shoreline direction has no role in their definition and characterization. However, the origin of each surface is interpreted in terms of the interaction of sedimentation with base level change.
SHORELINE R AVINEMENT (SR)
A stratigraphic surface referred to herein as a shoreline ravinement has been empirically recognized for a long time. Excellent descriptions of the surface and its mode of origin were given by Stamp (1921), Bruun (1962), and Swift (1975). The characteristic attributes of a shoreline ravinement which allow its recognition are an abrupt, scoured contact overlain by estuarine or marine strata which fine and deepen upwards. underlying strata can vary from non-marine to fully marine. As a scoured contact, it represents a change in trend from deposition to non-deposition and, as will be discussed
Figure 1. The shoreline ravinement (SR) forms by shoreface erosion during transgression. It migrates landward during the entire interval of transgression and thus can form a widespread surface. In this example the shoreline ravinement surface has cut down only partially through the succession of non-marine/brackish strata that were deposited contemporaneously with the formation of the SR. In this case the SR is a highly diachronous diastem.
Figure 2. The two different time relationships of a shoreline ravinement surface. A shoreline ravinement surface is a highly diachronous diastem (SR-D) when it has not eroded the underlying subaerial unconformity. However, when it has eroded the underlying subaerial unconformity (SU), it is an unconformity and a time barrier (SR-U) with all strata below being older than all strata above the surface. FLUVIAL-BRACKISH
in more detail, it can vary along its extent from being a minor diastem to being a major unconformity.
The origin of a shoreline ravinement surface was determined by early workers on the basis of observations along modern shorelines which are transgressing (i.e., moving landward). Because the slope of the alluvial plain is commonly less than that of the shoreface, erosion carves out a new shoreface profile as the shoreline moves landward during transgression. One or
more such erosional surfaces form as wave and/or tidal processes erode previously deposited shoreface, beach, brackish, and non-marine sediment. The eroded sediment is deposited both landward and seaward of the shoreline (Figure 1). When both tidal and wave processes are acting in a given area, both a tidal shoreline ravinement and a wave shoreline ravinement can form (Dalrymple et al., 1994; Zaitlin et al., 1994), although in most cases only a wave shoreline ravinement is preserved.
Figure 3. In this outcrop of Early Cretaceous strata from eastern Axel Heiberg Island, a subaerial unconformity (SU) is present beneath the white-weathering fluvial sandstone. A shoreline ravinement occurs at a scoured contact which occurs at the base of a thin, marine sandstone which fines upward into marine shale and siltstone of mid-shelf origin. The strata between the SU and the SR are fluvial in origin. In this case the SR is a diastemic shoreline ravinement (SR-D) which is highly diachronous.
The SR begins to form at the start of transgression which occurs when rate of base level rise exceeds the sedimentation rate at the shoreline. This often occurs very soon after the start of base level rise along most of the shoreline where the sedimentation rate is low to moderate (Embry, 2002). The SR stops being generated at the end of transgression which can occur at anytime during base level rise depending on the interaction of the rate of base level rise with the rate of sediment supply. Because it develops over the entire time of transgression, a shoreline ravinement is often considered to be diachronous (e.g., Nummedal et al., 1993). However, over its extent, it can either be a diastem or an unconformity and thus can exhibit two different relationships with regards to time (Figure 2). It is important to determine which parts of a given shoreline ravinement are unconformable (unconformable shoreline ravinement, SR- u ) and which parts are diastemic (diastemic shoreline ravinement, SR-D).
A diastemic portion of a shoreline ravinement (SR-D) has the defining characteristics of an SR as described above and is further characterized by the presence of penecontemporaneous, nonmarine strata underlying the surface and the preservation of the previously developed subaerial unconformity (Figures 1, 2, 3, 4). At any given locality, there is only a very minor time gap across a diastemic shoreline ravinement and overall it is a highly diachronous surface with time lines cutting it at a high angle and somewhat offset (Figure 5).
In contrast, a portion of a shoreline ravinement that has removed both the penecontemporaneous, non-marine strata that were deposited behind the shoreface as it moved landward, and the subaerial
unconformity that had formed during the preceding base level fall and regression (Figure 2), is an unconformity and not a diastem. With the removal of the subaerial unconformity, the shoreline ravinement takes on the time relationships of the subaerial unconformity and becomes a time barrier that represents a significant gap in
the stratigraphic record. All strata below an unconformable shoreline ravinement are older than all strata on top of it (Figure 6).
The SR- u has the defining characteristics of an SR and an additional characteristic is that, in most cases, the underlying strata are marine rather than non-marine (Figures 7, 8). However, the key characteristic which allows the confident recognition of an SRu is that the strata below are regionally truncated and the marine strata above often onlap (Figure 9). Such relationships are often clearly imaged on seismic data (Suter et al., 1987) or are determined by correlations on well log and outcrop cross sections. Notably the SR- u illustrated on the log of Figure 8 would be hard to identify if it could not be demonstrated that truncation was occurring at the stratigraphic level.
Many major unconformities in the stratigraphic record, including some of those used by Sloss (1963) to define his continentwide sequences, are unconformable shoreline ravinements rather than subaerial
(Continued on page 36...)
Figure 4. A subsurface section of Early Cretaceous strata with accompanying gamma ray/sonic logs. A shoreline ravinement separates non-marine strata below from marine strata above. The subaerial unconformity which formed during the preceding base level fall is preserved and the SR is a highly diachronous, diastemic shoreline ravinement (SR-D).
Figure 5. The time relationships of a diastemic shoreline ravinement (SR-D) which overlies penecontemporaneous fluvial-brackish strata. Time surfaces cut the SR-D at a high angle and are offset across the surface. Thus the SR-D is a highly diachronous surface.
Figure 6. The time relationships of an unconformable shoreline ravinement (SR-U) which has completely eroded the penecontemporaneous fluvial-brackish strata as well as the subaerial unconformity. Time lines are truncated below the SR-U and onlap the SR-U. All strata below the SR-U are entirely older than all strata above it, making an unconformable shoreline ravinement a time barrier.
Figure 7. In this outcrop of Triassic strata from northern Ellesmere Island, an unconformable shoreline ravinement (SR-U) occurs at the base of a thin, marine shelf limestone unit (3m) which overlies marine siltstones of mid-shelf origin. The key characteristics of an SR illustrated here are the sharp, scoured contact and the deepening-upward, marine succession directly overlying the SR. Importantly, regional correlations indicate that about 400 metres of strata are missing beneath the SR-U at this locality.
Figure 8. The subsurface succession of Jurassic marine strata from the Melville Island area illustrated here contains a major unconformity as determined from seismic data and regional correlations. The unconformity is an unconformable shoreline ravinement (SR-U) which occurs at the base of a thin, fining-upward marine sandstone interval. The key characteristics which lead to this interpretation include, a sharp contact, marine strata which fine and deepen-upward directly overlying the surface, marine strata below the surface, and regional truncation below the surface.
(...Continued from page 33)
unconformities (e.g., the major, base Norian unconformity illustrated in Figure 9). An unconformable shoreline ravinement can be differentiated from a subaerial unconformity by the presence of marine strata directly above the surface. This characteristic contrasts with that of an S u which has fluvial/brackish strata directly overlying the surface. When estuarine deposits directly overlie an unconformity, it is sometimes difficult to decide if the S u has been preserved or has been eroded by estuarine (tidal?) currents (i.e., surface is an SR- u ).
In carbonate rocks, a subaerial unconformity which develops during an episode of base level fall is not often preserved, in part because little sediment is deposited above high tide. The shoreline ravinement which develops during the following transgression usually removes any thin veneer of supratidal sediment and erodes the subaerial unconformity such that marine strata occur on both sides of the surface. Admittedly, because carbonate strata tend to be cemented very early, especially in situations of exposure, such shoreline erosion during transgression may be extremely minor. However, for consistency and clarity, I suggest use of the term unconformable shoreline ravinement rather than subaerial unconformity in situations where marine carbonate strata directly overlie such an unconformable surface.
In terms of utility, the unconformable portion of an SR (SR- u ) is very useful for correlation and for bounding sequence stratigraphic units because it is a time barrier. However, the diastemic portion of an SR (SR-D) is not useful for these purposes because of its highly diachronous nature. Like the RSME, the SR-D is correlated to delineate separate facies units within a sequence stratigraphic framework.
This distinctive surface has been given a variety of names including ravinement surface (Swift, 1975), transgressive ravinement surface (Galloway and Sylvia, 2002), transgressive surface (Van Wagoner et al., 1988), transgressive surface of erosion (Posamentier and Allen, 1999), and shoreface ravinement (Embry, 2002). I prefer to use the term shoreline ravinement for this very distinctive surface with the proviso that modifiers such as tidal and wave can be added to it. I would emphasize it is important to add the modifier diastemic or unconformable to any stretch of shoreline ravinement surface to differentiate between the two very different relationships to time (highly diachronous or time barrier) that exist for a given shoreline ravinement (Figure 2).
The maximum regressive surface has been recognized from empirical data for as long as fining/coarsening and deepening/ shallowing cycles (“transgressive-regressive or T-R cycles”) have been recorded in the stratigraphic record (at least 150 years). The main characteristic for identification of an MRS in marine clastic strata is it is a conformable horizon or diastemic surface which marks a change in trend from coarsening-upward to fining-upward. The MRS is never an unconformity. Over most of its extent, the MRS also coincides with a change from shallowing-upwards to deepening-upward and this criterion is very helpful, especially in shallow water facies (Figure 10). In deeper water, high subsidence areas, the change from of shallowing to deepening may not coincide with the MRS as defined by grain size criteria (Vecsei and Duringer, 2003)
In nonmarine siliciclastic strata, the change from coarsening to fining is also applicable for objectively identifying an MRS. In carbonate strata the change from shallowing upward to deepening upward is usually the most reliable and readily applicable criterion for identifying an MRS. The change in trend from coarsening to fining also is applicable for carbonates but sometimes can be misleading.
For larger magnitude MRSs which separate successions that contain smaller scale, sequence stratigraphic units, such coarsening and fining trends are sometimes recorded by stacking patterns of the smaller scale units (Van Wagoner et al., 1990). For example, in a stacking pattern which represents a coarsening trend, each small scale unit contains a greater proportion of coarser material than the underlying one. Thus an MRS separates an overall coarsening-upward stacking pattern (often referred to as progradational) from a finingupward stacking pattern (often referred to as retrogradational).
The recognition of an MRS depends on the availability of data which reflects the grain size of the sediment (with or without small scale units) and from which general water depths of the deposits can be interpreted from facies analysis. The MRS may occur within a gradational interval of facies change (conformable horizon) or it can be rather abrupt with a scour surface marking it (diastem). On a gamma log of siliciclastic sediments, the MRS in marine strata often, but certainly not always, marks the inflection point from decreasing gamma ray (gradual
(Continued on page
Figure 9. This outcrop of Carboniferous and Late Triassic strata on northeastern Ellesmere Island contains two major unconformities, both of which are unconformable shoreline ravinements (SR-U). The lower one places Norian strata on tilted Carboniferous strata (time gap of about 90 MA). A thin unit of shallow marine sandstone which fines and deepens upward directly overlies the unconformity leaving no doubt that it is an SR-U rather than an SU. The upper unconformity is at the base of Rhaetian strata (Late Triassic) and, on the right side, a marine sandstone can be seen onlapping the SR-U towards the left. Regional correlations indicate substantial truncation of Norian strata beneath the unconformable shoreline ravinement (SR-U) at the base of the Rhaetian.
10. In the outcropping succession of Early and Middle Triassic strata on northern Ellesmere Island, a maximum regressive surface (MRS) has been delineated near the top of a white-weathering, shoreface sandstone unit. Beneath the MRS, the strata coarsen- and shallow-upward. On top of the MRS, the strata fine- and deepen-upward. At this locality, the MRS is a conformable horizon.
Figure
Figure 11. Two maximum regressive surfaces (MRS) have been delineated in this subsurface succession of Jurassic strata from the Lougheed Island area. The MRSs have been placed at the change in gamma log trend from decreasing gamma ray to increasing gamma ray. This change in gamma ray trend is interpreted to reflect a change from shallowing-upward (decreasing clay content) to deepening-upward (increasing clay content).
Figure 12. A schematic diagram showing the interpreted relationship between an MRS and other surfaces of sequence stratigraphy. The landward termination of the maximum regressive surface (MRS) adjoins the basinward termination of the shoreline ravinement (SR). This relationship occurs because both surfaces begin to form at the start of transgression and is an important one in terms of selecting boundaries for sequence stratigraphic units.
Figure 13. The relationship of the maximum regressive surface (MRS) to time. The MRS will approximate a time surface perpendicular to the shoreline but will exhibit minor diachroneity along strike due to varying rates of sediment input along the shoreline.
(...Continued from page 37)
shift to the left) (coarsening-upward and decreasing clay) to increasing gamma ray (a shift to the right) (fining-upward and increasing clay) (Figure 11). In pure carbonate systems, gamma logs are of no
help for MRS identification and facies data from core and/or cuttings are required.
It must be noted that the MRS is laterally equivalent to the shoreline ravinement (Figure 12) and this relationship results
from the fact that both surfaces begin to be generated at the start of transgression (see below). Furthermore it may be difficult to distinguish an MRS from an unconformable shoreline ravinement (SR- u ) because both can separate coarsening-upward marine strata below from fining upward marine strata above and both can be scoured contacts. For example an MRS might have been interpreted in the succession illustrated on Figure 8 at the top of the thin, transgressive sandstone which overlies the SR- u.
The key criterion for distinguishing these two different surfaces is that an SR- u is an unconformity with truncation below and onlap above whereas the MRS is either a conformity or diastem which is not associated with truncation or onlap. Thus regional data in the form of cross-sections and/or seismic data are usually required when uncertainty exists.
Given the coincidence of the start of fining and the start of deepening in shallow facies at the MRS, it is reasonable to interpret that an MRS is generated at or close to the start of transgression. Transgression begins when the rate of base level rise exceeds the rate of sediment supply at the shoreline. Finer grained sediment is then deposited at any given locality along an offshore transect and the MRS is marked by the change from coarsening upward to fining upward.
Given that the rate of sediment supply along a siliciclastic shoreline will substantially vary, the start of transgression occurs at different times but, in most cases, transgression will be initiated along the entire shoreline within a relatively short time interval. Furthermore, this time interval of MRS generation occurs from the start of base level rise (areas of moderate to no sediment input) to soon after the start of base level rise (areas of higher sediment input). Thus the MRS will be somewhat diachronous but such diachroneity will be minor (Figure 13). Empirical data from carbonate strata indicate the same relationships of the MRS to time. Theoretically there may be exceptions to this generality but they have not been documented.
This surface has been called a variety of names including transgressive surface (Van Wagoner et al., 1988), conformable transgressive surface (Embry, 1993, 1995), maximum progradation surface (Emery and Myers, 1996), and sometimes by the more general term, flooding surface. The more descriptive and less ambiguous term, maximum regressive surface, which was introduced by Helland-Hansen and Gjelberg
(1994), is recommended when referring to this surface.
The low diachroneity of the MRS as well as its ready identification in outcrop, on logs (siliciclastic), and on seismic sections make the MRS a very useful surface for correlation and contributing to a regional, quasi-time framework as well as for bounding sequence-stratigraphic units.
R EFERENCES
Bruun, P. 1962. Sea-level rise as a cause of shore erosion. American Society of Civil Engineers Proceedings, Journal of the Waterways and Harbors Division, v. 88, p. 117-130.
Dalrymple, R., Zaitlin, B., and Boyd, R. (eds.). 1994. Incised valley Systems: Origin and sedimentary sequences. SEPM, Special Publication 51, 391 p.
Embry, A.F. 1993. Transgressive-regressive (T-R) sequence analysis of the Jurassic succession of the Sverdrup Basin, Canadian Arctic Archipelago. Canadian Journal of Earth Sciences, v. 30, p. 301-320.
Embry, A.F. 1995. Sequence boundaries and sequence hierarchies: problems and proposals, In: Steel, R.J., Felt, F.L., Johannessen, E.P., and Mathieu, C. (eds). Sequence stratigraphy on the northwest European margin: NPF Special Publication 5, p. 1-11.
Embry, A.F. 2002. Transgressive-Regressive (TR) Sequence Stratigraphy, in Armentrout, J. and Rosen, N. (eds.). Sequence stratigraphic models for exploration and production: Gulf Coast SEPM Conference Proceedings, Houston, p. 151-172.
Helland-Hansen, W. and Gjelberg, J. 1994. Conceptual basis and variability in sequence stratigraphy: a different perspective. Sedimentary Geology, v. 92, p. 1-52.
Helland-Hansen, W. and Gjelberg, J. 1994. Conceptual basis and variability in sequence stratigraphy: a different perspective. Sedimentary Geology, v. 92, p. 1-52.
Emery, D. and Myers, K. 1997. Sequence Stratigraphy. Blackwell, London, 297 p.
Galloway, W.E. and Sylvia, D.A. 2002. The many faces of erosion: theory meets data in sequence stratigraphic analysis, in Armentrout, J. and Rosen, N. (eds.). Sequence stratigraphic models for exploration and production: Gulf Coast SEPM Conference Proceedings, Houston, p. 99-111.
a chronostratigraphic model based on equilibrium profile studies. In: Posamentier, H., Summerhayes, C., Haq, B., and Allen, G. (eds.). Sequence stratigraphy and facies association. International Association of Sedimentologists, Special Publication 18, p. 55 – 68.
Posamentier, H. and Allen, G. 1999. Siliciclastic sequence stratigraphy – concepts and applications. SEPM Concepts in Sedimentology and Paleontology, no. 7, 210 p.
Sloss, L. 1963. Sequences in the cratonic interior of North America. GSA Bulletin, v. 74, p. 93-113.
Stamp, L. 1921. On cycles of sedimentation in the Eocene strata of the Anglo-Franco-Belgian Basin. Geological Magazine, v. 58, p. 108-114.
Suter, J., Berryhill, H., and Penland, S. 1987. Late Quaternary sea level fluctuations and depositional sequences, southwest Louisiana continental shelf. In: Nummedal, D., Pilkey, O., and Howard, J. (eds.). Sea-level changes and coastal evolution: SEPM Special Publication 41, p. 199–122.
Swift, D. 1975. Barrier island genesis: evidence from the central Atlantic shelf, eastern USA. Sedimentary Geology. 14, p. 1-43.
Van Wagoner, J.C., Posamentier, H.W., Mitchum, R.M., Vail, P.R., Sarg, J.F., Loutit, T.S., and Hardenbol, J. 1988. An overview of the fundamentals of sequence stratigraphy and key definitions, In: Wilgus, C., Hastings, B.S., Kendall, C.G., Posamentier, H.W., Ross, C.A., and Van Wagoner, J.C. (eds.). Sea level changes: an integrated approach: SEPM Special Publication 42, p. 39-46.
Van Wagoner, J.C., Mitchum, R.M., Campion, K.M., and Rahmanian, V.D. 1990. Siliciclastic sequence stratigraphy in well logs, cores and outcrops: AAPG Methods in Exploration, no. 7, 55 p.
Vecsei, A. and Duringer, P. 2003. Sequence stratigraphy of Middle Triassic carbonates and terrigenous deposits (Muschelkalk and lower Keuper) in the SW Germanic Basin: maximum flooding versus maximum depth in intracratonic basins. Sedimentary Geology, v. 160, p. 81-105.
Zaitlin, B., Dalrymple, R., and Boyd, R. 1994. The stratigraphic organization of incised-valleys systems associated with relative sea level change. In Dalrymple, R. and Zaitlin, B. (eds.). Incised valley systems: origin and sedimentary sequences: SEPM special publication 51, p. 45-60.
Nummedal, D., Riley, G., and Templet, P. 1993. High resolution sequence architecture:
2008 SIFT a huge success
| by Thérèse Lynch and Mike DesRoches
The 2008 Student Industry Field Trip (SIFT) was a tremendous success. The goal of SIFT is to introduce university students who might not otherwise have an opportunity to become familiar with the Canadian petroleum industry through classroom lectures, core workshops, an exploration game, several field trips, a Rocky mountain fly-over, and a variety of opportunities to talk to professionals who work in our industry.
The CSPG’s SIFT Committee hosted 31 students in Calgary for the first two weeks in May 2008. The students, most in their third year of study, were from all of the universities across Canada with geology departments. The students are studying in fields including geology, geophysics, and petroleum engineering, though most are future geologists.
Every year, SIFT students have the opportunity to participate in a summer job finding program. This year seven of the SIFT students were hired by petroleum companies including ConocoPhilips, Encana Corporation, Harvest Energy, Paramount Energy, Shell, and Total.
In order to run such a tremendous program, SIFT has phenomenal industry support; from the 20 volunteers on the organizing committee to the many industry professionals who volunteer their time as session lecturers and especially from the companies who support us financially. Shell, Encana Corporation, ConocoPhillips, Devon, Imperial Oil, and Talisman were our major industry sponsors this year.
Over the course of the two-week field trip, students are exposed to all aspects of the petroleum industry. They attend many talks which cover topics including sequence stratigraphy, geophysics, international and frontier exploration, oil and gas production technology, and well logging. They spend two days at the Eu B core facility learning about siliciclastic and carbonate depositional environments and what they look like in core, as well as learning about heavy oil and oilsands. The students go to Dinosaur Provincial Park for a one-day field trip and have the opportunity to visit parts of the park that are not open to the public, looking at the clastic depositional environments exposed in the park and, of course, looking for dinosaur bones.
They also spend four days traveling through the Rocky Mountains, learning about western Canada geology from industry experts Peter Fermor, Kevin Root, and David Repol. On the final day of SIFT, the students get to do a fly-over of the same route that they followed during the four-day field trip, to allow them to have a bird’s eye view of the major structures and features. The final field trip that the students participate in is a rig tour, giving them the opportunity to view the equipment that they have been learning about in action and hearing directly from the individuals working on the rig what it is like to live and work there.
In the evenings, the students participate in the Exploration Game, where they are divided into teams of three or four students. During the course of the two weeks, the students drill wells, buy land, make farmin and other land deals with the other teams, learn to read well logs, and construct stratigraphic and structural cross-sections as well as isopach and structure maps. On the final day of the game, they present their geological interpretations and explain their exploration approach to a panel of industry judges in the hope of winning either of the coveted financial or technical awards available from the judges.
This year’s winners of the Larry Strong Financial Award were Julie Menier from the université du Québec à Chicoutimi, Catherine Goulet from the université du Québec à Montréal, Darren Lefort from St. Mary’s university, and Dainis Burton from
Simon Fraser university. This year’s winners of the Bill Ayrton Technical Award were Renee Crant from Memorial university, Melissa Murphy from the u niversity of New Brunswick, Andrew Weber from the university of Regina, and Ryan Kennedy from St. Francis xavier university.
The students are kept very busy through the two weeks but they also have the opportunity to bond with one another and share their many new experiences. Many of the students form friendships and connections that will last for the rest of their lives and a number will find jobs in Canada’s petroleum business in future years and become part of our big team, looking for oil and gas, wherever it may be hiding.
We gratefully acknowledged the following companies for their generous contributions to SIFT:
We gratefully acknowledged the following companies for their generous contributions to SIFT:
Prime Sponsors:
Prime Sponsors:
Gold Sponsor:
Gold Sponsor:
Silver Sponsors:
Silver Sponsors:
Canadian Centre for Energy Information
Canadian Centre for Energy Information
Canadian Natural Resources Ltd.
IHS
Canadian Natural Resources Ltd.
IHS
Bronze Sponsors:
Bronze Sponsors:
AGAT Laboratories
AGAT Laboratories
Alberta Energy Utilities Board
Alberta Energy Utilities Board
Angle Exploration
Angle Exploration
Apache Canada Ltd.
Apache Canada Ltd.
Ayrton Exploration Consulting Ltd.
Ayrton Exploration Consulting Ltd.
BG Canada
BG Canada
BonavistaEnergy Trust
BonavistaEnergy Trust
CanextEnergy Ltd.
CanextEnergy Ltd.
Compton Petroleum
Compton Petroleum
Harvest Energy
Harvest Energy
Husky Energy Inc.
Husky Energy Inc.
Kerogen
Kerogen
Ketch Resources
Ketch Resources
KennBorekAir
KennBorekAir
Sundog Printing
Sundog Printing
Sunterra Catering
Sunterra Catering
Weatherford
Weatherford
MGM Energy Corp.
MGM Energy Corp.
Neo Exploration
Neo Exploration
Nexen Inc.
Nexen Inc.
OPTI Canada
OPTI Canada
Palliser Oil & Gas
Palliser Oil & Gas
Paramount Energy Trust
Paramount Energy Trust
Petro-Canada Oil & Gas
Petro-Canada Oil & Gas
RigstarCommunications
RigstarCommunications
Royal Tyrrell Museum
Royal Tyrrell Museum
Suncor Energy Inc.
Suncor Energy Inc.
University of Calgary
University of Calgary
Vital Energy
Vital Energy
WinstarResources
WinstarResources
SO yOU wANT TO DO Sequence Stratigraphy…
| by Grant Lowey
The recent Canadian Society of Petroleum Geologists, Canadian Society of Exploration Geophysicists, and the Canadian Well Logging Society 2008 Convention “Back to Exploration” was unprecedented because it offered not one, not two, but three courses on sequence stratigraphy! These included Sequence Stratigraphy: A Practical understanding of Basinal Controls for Mapping and Exploration by Andrew Miall; Practical Sequence Stratigraphy: Concepts and Applications by Ashton Embry; and Sequence Stratigraphy: Principles and Applications by Octavian Catuneanu. I was fortunate enough to take all three courses and offer the following comments for those still on the fringe of sequence stratigraphy and wondering what course is best for them.
Sequence Stratigraphy: A Practical u nderstanding of Basinal Controls for Mapping and Exploration by Andrew Miall, is advertised as a practical course designed to assist the petroleum geologist in the identification of different types of sequences, based on the generating mechanisms. Participants taking this course learn about the complexities of sequence architectures and their causes. I actually took the course in 2007 when it was called understanding Basinal Controls of Sequences. The course does not appear to have changed much for 2008. The two-day course cost $750 and you get a 129-page handout with several exercises on outcrop and seismic correlation.
Practical Sequence Stratigraphy: Concepts and Applications by Ashton Embry, is advertised as presenting the concepts and practical applications of sequence stratigraphy for petroleum exploration. Participants taking this course learn about the principles of sequence stratigraphy and will be able to recognize and use sequence stratigraphic surfaces in correlation. The two-day cost $700 and you get a 377-page handout with exercises on outcrop, well log, and seismic correlation.
Sequence Stratigraphy: Principles and Applications by Octavian Catuneanu, is advertised as presenting the concepts and practical applications of sequence stratigraphy for petroleum exploration and production. Participants taking this course learn about the advantages and disadvantages of various methods of sequence stratigraphy and will be able to recognize sequence stratigraphic surfaces and systems tracks. The three-day course cost $800 and you get Catuneanu’s
Figure1. Generalized cross-section of a continental margin showing non-marine, shallow marine and offshore marine deposits and various sequence stratigraphic boundaries. BSFR = basal surface of forced regression (Catuneanu), CC = correlative conformity (Catuneanu), MFS = maximum flooding surface (Catuneanu and Embry), MRS = maximum regressive surface (Catuneanu and Embry), RSME = regressive surface of marine erosion (Catuneanu and Embry) (also referred to as the ‘regressive wave ravinement’ by Catuneanu), TRS/SR = transgessive ravinement surfaces (Catuneanu) / shoreface ravinement (Embry), SU = subaerial unconformity (Catuneanu and Embry). Modified and redrafted from Embry, 2008, Practical sequence stratigraphy: concepts and applications, Short course Notes, May 5-6, Calgary.
book (Principles of Sequence Stratigraphy, Elsevier, 2006, 375 p.) and several exercises on outcrop, well log, and seismic correlation.
Overall I found Miall’s course the most philosophical and reflective, and it got me truly thinking about sequences. The handout consists of PowerPoint figures with some references. unfortunately, the PowerPoint figures are only in black-and-white, rendering many of them illegible. In addition, because the handout consisted mainly of PowerPoint figures, I found it of limited use a source for future reference. You could buy Miall’s book (The Geology of Stratigraphic Sequences, Springer-Verlag, 1996, 433 p.) for an additional ~$150. The exercises were not very practical, but the course was perhaps the best for trying to understand sequences.
Embry’s course appeared to be the most practical. The handout consisted of 68 pages of text and references, and 309 pages of PowerPoint figures in color – a combination that I found best for a short course. The course was fast-paced, had good exercises, and I felt confident in being able to identify the five sequence stratigraphic boundaries and two systems tracks said to exist. Embry also discussed several interesting reasons (such as Hunt’s Law) as to why other methods of sequence stratigraphy might not applicable in certain situations.
Catuneanu’s course appeared to be slightly more theory-oriented by explaining the sinusoidal curve of base-level rise (which I found useful). His book is an excellent source for reference, but you will have to set aside another three days to read it! The course seemed slower paced, but also had good exercises (only surfaces though – no systems tracks), and I felt confident in being able to identify the seven sequence stratigraphic boundaries and five systems tracks said to exist. Catuneanu suggested that different data require different methods of sequence stratigraphy for interpretation, and like Embry, gave some examples where interpretations based on other methods did not appear to fully explain the geological situation.
A difficulty in comparing Embry’s and Catuneanu’s courses was that they both claimed to be correct, although their methods differed. This difficulty was increased in that both Embry and Catuneanu were equally convincing in their arguments as to why their method of sequence stratigraphy was correct and superior to other methods of sequence stratigraphy!
In summary, for a deeper understanding of the origin of sequences, take Miall’s course; for another tool to add to your geo-tool box, take either Embry’s or Catuneanu’s course. However, you (or your company) will have to decide which ‘correct’ method of sequence stratigraphy to follow.
IN MEMORIAM: E.R. Ward Neale 1924-2008
Ward Neale, a prominent figure in Canadian earth science, passed away suddenly at the age of 84 on 20 May 2008 at his home in Calgary. Ward was one of the great builders of post-war Canadian geology; he was a catalyst and an activist, who remained active to the end of his life.
Ward was born in Beaconsfield, Quebec. He served in the Canadian Navy during the war and briefly studied engineering. A chance meeting with a prospector propelled him towards a career in geology and he graduated from McGill u niversity (B.Sc. 1949) and then from Yale (Ph.D. 1952). He joined the Geological Survey of Canada (GSC) in Ottawa and published geological maps of Newfoundland. In 1963 he published (with John Rodgers of Yale) a seminal paper on the Taconic Klippe of the Newfoundland Appalachians. Coming as it did just before the advent of plate tectonics, the idea was well positioned to be interpreted in the terms of the new theory a few years later. With his contributions to Appalachian geology he was a great choice for Head of the Geology Department at Memorial u niversity of Newfoundland (M u N) where he built a truly magnificent department that was perfectly positioned to unravel the complex plate tectonic history of the Appalachians. Many of the world’s greatest early experts in plate tectonics visited the department, making it a hotbed of geology in Canada and resulting in the graduation of many illustrious geologists. His career alternated between the GSC and M u N
with a return to the GSC Calgary in 1977 as Scientific Editor and his u niversity career culminating in his very effective role as Vice President (Academic) at M u N.
Throughout his career Ward was an agent of development and change in the earth sciences in Canada. His national scientific leadership included terms as President of the Canadian Geoscience Council and of the Geological Association of Canada.
It was during his sojourns in Calgary that Ward came to the attention of many people in our society. He moved back to Calgary finally in 1987 and started in earnest on a new career in developing the public awareness of science. On behalf of the Royal Society of Canada he organized a conference in Ottawa in 1988 that attracted participants from across the spectrum of the sciences in Canada. It afforded an opportunity for those interested in the public dissemination of science to meet and it proved to be an important event for Canadian scientific outreach. Other conferences followed and they produced publications that were among the first handbooks for the revival of outreach from the scientific community in Canada.
Throughout his retirement he worked out of the GSC offices in Calgary (space for which he was eternally grateful). He was a co-founder of the Calgary Science Network in 1989 that has delivered programs in classrooms to hundreds of thousands of Calgary-area school children and workshops for thousands of Calgary-area teachers. It remains as a successful and innovative organization to this day. He was a tireless worker on behalf of science outreach and personally made many classroom visits and judged many science fairs. His efforts were recognized by the establishment of the E.R. Ward Neale Medal of the GAC for contributions to public awareness of earth science. He received the first of these and was always extremely proud of this particular recognition. He would never nominate people for this medal bearing his name but was always keen to know the name of the recipient in May of each year and keener still to have his photograph taken with each new recipient – a moment that he sadly just missed in 2008.
His contributions to the geological life of
Calgary were considerable. He was also a keen promoter of Logan Day (a day to celebrate geology) and worked tirelessly to inspire others to help him. Many CSPG members will recall being drawn into service for these events by Ward. It often took place at the Sandy McNabb Campground west of Turner Valley and it featured a pig roast, a soccer game for all (ages 4-80+), which required avoidance of cow patties while playing, and an evening around the campfire with the beverage of one’s choice and, for the intrepid who stayed overnight, an early morning coffee around multiple campfires the next day, to deal with hangovers.
Ward was above all a great supporter of those who came to know him. He generously supported students from his M u N days throughout their careers. He supported organizations of all sorts, scientific, outreach-oriented, ski clubs, and hiking clubs and always helped to keep them going and always attracting new people to participate. Every time you met him, he would have a good cause ready to be supported and would advocate that you support it with your time, your money, or whatever you had to offer. While in his eighties, he was the leading fund-raiser in the Alberta Wilderness Society’s annual climb of the Calgary Tower. He brought this level of physical and mental energy to bear on everything in which he took an interest.
Numerous honours were accorded to Ward Neale in his life including honorary degrees from the u niversity of Calgary and M u N and appointment to the Order of Canada and the Royal Society of Canada. He also received the Bancroft Award of the Royal Society of Canada, the Ambrose Medal of the GAC, and – perhaps most precious to him – the first E.R. Ward Neale Medal.
He is survived by his wife and devoted partner in life Roxie, two sons, and two grandchildren. He will be sorely missed in the context of national earth science and particularly in Calgary where he lived and made an impact for the last 21 years of his life.
Godfrey Nowlan
CSPG STUDENT FIELD TRIP
| by Erin Linley
On July 23, 2008, 21 students attended a CSPG field trip through the Badlands of Alberta. The purpose of this trip was to give students the opportunity to attend an industry-related field trip and for students to build relationships with others in this industry.
The field trip was divided into two portions: the morning consisted of three outcrop viewings and lectures and the afternoon was spent at the Royal Tyrrell Museum in Drumheller. The outcrop lectures were focused on the geometric and depositional relationships of a tidally influenced deltaic complex within the Horseshoe Canyon and Bearpaw formations. The course was lead by Dennis Meloche, a senior Geologist of Devon Canada Corporation. Dennis had provided the students with a clear interpretation of the geologic processes and depositional sequences that occurred throughout the stretch of the Red Deer River valley.
The students were very energetic and involved. They enjoyed the trip and provided positive feed back. Janelle from
the university of Calgary stated “It was fantastic. I learned a lot, and it was an
amazing deal.” There was a range of first year geology students to new geology graduates. We even had some geophysical students. The companies whose summer student employees participated include: Devon Canada Corporation, Open Range Energy, ConocoPhillips Canada, Nexen Inc., West Energy Ltd., Encana Corporation, Enerplus Resources Trust, Geophysical Service Inc., Norwest Corporation, and Canadian Natural Resources Ltd.
Two Hot Plays. Two New Studies.
Hydrodynamics and Regional Facies Now Pre-Subscribing Final Delivery Q3 2008
Phase I - SE Saskatchewan Now Available!
Phase II - North Dakota Now Pre-subscribing. Final Delivery Q4 2008
Due to the success of this field trip, the CSPG will be organizing yearly trips during the summer months to interested students. The trips will be held at various locations in Alberta of geologic interest and will be lead by a variety of knowledgeable instructors. Advertisement for these trips will be on the CSPG website, announced at CSPG luncheons, and advertisements in the Bulletin of Canadian Petroleum Geology and The Reservoir.
I want to thank Dennis Meloche, Megan Roche, Cheryl Emett, Krista Jewett, Dayna Rhoads, Erin Crerar, and others for your help in organizing this successful trip. Also thank you to the students for your enthusiasm and participation.
This field trip was sponsored by:
2008
Andrew Baillie Award
| by David Middleton, CSPG Trust Board Member
The Andrew Baillie Student Award is the most prestigious student award given by the CSPG and the CSPG Trust. The award has been given out since 1991, and is presented annually to the Best Student Oral and Best Student Poster presentation given at the annual convention. The Award is to recognize excellence in presentation and encourage a high level of technical prowess worthy of Andrew Dollar Baillie.
Andrew Dollar (Andy) Baillie was an active CSPG member and, in particular, an avid supporter of the CSPG Trust and the educational activities that the CSPG promoted to the student members of the Society and the general public in geology. Andy received the Stanley Slipper Gold Medal from the Society in recognition of his accomplishments, contributions to petroleum geology, and the inspiration that he provided to the hundreds of geologists that he encountered during his career.
The CSPG Trust is the steward of the Award, and in conjunction with the CSPG Outreach Director, ensure that sufficient funds are available to ensure the continuous presentation of the award through the ensuing years, after the initial funds for the award were used.
The Andrew Baillie Award is a judged award, with the best technical presentation regardless of the technical society affiliation, being presented with the Award. Since 2001, the Award has consistently been presented to the best oral and poster presentations. The Annual Conference technical chairs are integral to the Award process, as their judging staff assist in the evaluation of all the student winners and the selection of the winners. The CSPG and the CSPG Trust extend a tremendous thank you to all the individuals over the many years that have volunteered their time as judges at the annual conferences.
The Award consists of a Lucite-encased core sample with the winner’s name on the engraved plaque, along with a cheque for $1,000. The current awards consists of a dolomitized section of Middle Devonian Keg River Formation core, illustrating the stromatoporoid-rich reefal and reef proximal sections with vuggy and mouldic porosity typical of the prolific Rainbow and Zama oil fields.
A complete listing of the previous award winners is available on the CSPG website at www.cspg.org/students/awards. Take a look and I am sure you will recognize some of the names of previous winners, as they have continued to make their mark in the industry. Andrew Baillie was a strong visionary and provider of a legacy. The CSPG and the CSPG Trust is fortunate that Andrew Baillie was such a strong, lifelong supporter of the shared vision of “geoscientists for our future”.
The recipients of this year’s Andrew Baillie Award are the following:
BEST STUDENT GEOLOGICAL ORAL PRESENTATION, A NDRE w B AILLIE AwARD w INNER
Reading the Rocks and Fluids to Design Geotailored and Geotolerant Strategies for Heavy Oil and Bitumen Recovery: The Need for High Resolution fluid mobility logs
Jennifer Adams*, Steve Larter, Ian Gates, Haiping Huang, and Barry Bennett
BEST STUDENT GEOPH y SICAL P OSTER , A NDRE w B AILLIE AwARD w INNER
The Canadian geoscience community “answered the call” once more as they turned out in record numbers to the 2008 C3GEO Convention, hosted by the CSPG, CSEG, and CWLS, from May 12-15, 2008 at the Roundup Centre and Energy Resources Conservation Board in Calgary. Over 4,600 registrants seized the opportunity to meet with their peers and hear what new technical, strategic, and business themes are emerging for the Canadian petroleum industry. Against a backdrop of numerous negative regulatory changes, juxtaposed against an unexpected run-up in commodity prices, our industry is indeed re-inventing itself as it refocuses on new resource opportunities and the new technologies required to exploit them, be it shale gas, Arctic, or International prospects. The 2008 C3GEO Convention made clear that the public focus on our economic, environmental, and social performance requires strategies new to us all.
Planning for this year’s Convention began early in the summer of 2007, and the members of the Organizing Committee, along with over 60 session chairs and over 90 student volunteers, volunteered hours of their time bringing the Convention to fruition. Some of the innovations introduced this year to make the Convention bigger and better were:
• Two great Convention luncheon speakers, Rick Mercer and Peter Tertzakian, who gave delegates an interesting and informative midday break on Monday and Tuesday;
• Complimentary ‘grab and go’ bagged lunches on the Exhibit Floor for delegates;
• The introduction of field equipment into the Corral as an extension to the Exhibit Floor;
• Pre-taping the Core Conference presentations on Tuesday and showing them in a running loop in two theatres at the ERCB;
• A Student/Industry night combined with the 3rd Annual CSEG Challenge Bowl at the convention venue, creating a great showcase for these events; and
• Revamped student awards program to encourage technical contributions from younger delegates.
With 80 posters, 20 Core presentations, and over 200 talks this Convention had something for everyone. Couple this with the fact that the sold-out Exhibit Floor boasted over 125 exhibitors and it becomes clear why this Convention was so popular –2008 was a record year for attendance with over 4,600 delegates converging for the four days spread over the Roundup Centre and the Energy Resources Conservation Board.
While the final budget numbers will be confirmed with an audit later in the year, the 2008 Organizing Committee can confidently predict that, with revenue on par with previous Conventions and expenses at or below budget, the forecasted profits from 2008 will be available to each society to help cover their operating expenses.
Playing foozball at the CPSG/CSEG Student Lounge.
Rick Mercer entertaining the Convention delegates at Monday’s Convention luncheon.
Delegates visiting the booths on the Exhibit Floor. Examining core samples at the Core Conference.
2008 CONVENTION Award Recipients
BEST GEOLOGICAL ORAL PRESENTATION
Impact of Shale Heterogeneity Upon Gas Storage Potential and Deliverability: Examples from Jurassic and Devonian/Mississippian Shale Gas Reservoirs
Daniel Ross* and R. Marc Bustin
BEST GEOLOGICAL POSTER
Counter Point Bars: Morphology, Lithofacies and Reservoir Significance of a Newly Recognized Sedimentary Deposit in Large Modern Meandering Rivers and the McMurray Oil Sands Derald G. Smith*
BEST GEOLOGICAL ABSTRACT
Centrifuge Simulations of the Interaction between Folding, Faulting and Diapirism during Regional Extension
Lyal Harris, Benjamin Carlier, Audrey Lessard-Fontaine, Elena Konstantinovskaya*, Jimmy Poulin, Adrien Handschuh, Eric Johnson, Nichola Thomas, and Sylvie Daniel
BEST STUDENT GEOLOGICAL ORAL PRESENTATION
Reading the Rocks and Fluids to Design Geotailored and Geotolerant Strategies for Heavy Oil and Bitumen Recovery: The Need for High Resolution fluid mobility logs
Jennifer Adams*, Steve Larter, Ian Gates, Haiping Huang, and Barry Bennett
HONOURABLE MENTION
STUDENT GEOLOGICAL ORAL PRESENTATION
Tracing the Fate of Injected CO2 during Enhanced Oil Recovery using Stable Isotope Techniques
Gareth Johnson*, Mark Raistrick, Bernhard Mayer, Steve Taylor,Maurice Shevalier, Michael Nightingale, and Ian Hutcheon
BEST STUDENT GEOLOGICAL POSTER
Pre-rift Labrador Shelf carbonates, Hopedale Basin: Diagenetic Implications and Age Assessment
Stephen Schwartz*
HONOURABLE MENTION
STUDENT GEOLOGICAL POSTER
Reading the Rocks and Fluids to Design Geotailored and Geotolerant Strategies for Heavy oil and Bitumen Recovery: The need for High Resolution Fluid Mobility Logs
Jennifer Adams*, Steve Larter, Ian Gates, Haiping Huang, and Barry Bennett
BEST GEOPHYSICAL ORAL PRESENTATION
Microseismic Monitoring of a Multi-Stage Hydraulic Fracture in the Bakken Formation, SE Saskatchewan
Rob Kendall*
BEST GEOPHYSICAL POSTER
Athabasca Oil Sands Exploration and Development Investigation using the Helicopterborne Transient Electromagnetic Technique
Douglas McConnell* and Ted Glenn
BEST GEOPHYSICAL ABSTRACT
Interpolation, PSTM, AVO, and a Thin Gas Charged Viking Shoreface in West Central Alberta
Lee Hunt*, Scott Hadley, Mark Hadley, Jon Downton, and Bashir Durrani
BEST STUDENT GEOPHYSICAL ORAL PRESENTATION
Petrophysical and Seismic Signature of a Heavy Oil Sand Reservoir: Manitou Lake, Saskatchewan
Maria Quijada* and Robert Stewart
HONOURABLE MENTION
STUDENT GEOPHYSICAL ORAL PRESENTATION
Frequency-Domain Waveform Tomography in the Foothills: Velocity Model Estimation with Synthetic Long-Offset Data
Andrew Brenders*, Sylvestre Charles, and R. Gerhard Pratt
The Unexpected Should Not Be Unexplained - Multidisciplinary Integration Including Anomalous Data
Jean-Yves Chatellier*, Giancarlo Giampaoli, Judith de Narváez, and Bob Menard
BEST PETROPHYSICAL ABSTRACT
Improved Wireline Density Acquisition in Elongated, Directional Boreholes Drilled Through Stressed Formations of Western Canada
Harold Hovdebo* and Barry Johnson
BEST CORE PRESENTATION
Reservoir Units Within a Multi-Layered Dolostone Formation: Grosmont Formation, Saleski Area
John Hopkins* and K. Barrett
BEST STUDENT CORE PRESENTATION
Sedimentology, Ichnology and Reservoir Properties of the Low Permeability Upper Cretaceous Alderson Member – Hatton Gas Pool, SW-Saskatchewan, Canada
Ryan Thomas Lemiski*, M.K. Gingras, J. Hovikoski, S.G. Pemberton, J. MacEachern, and A. LaCroix
Brian Glover (2008 Convention Co-Chair), Mike Jones (2009 Convention Co-Chair), Mike Cecile (2009 Convention Co-Chair) and Bruce Shultz (2008 Convention Co-Chair) celebrating innovations.
E XHIBITS MAKE 2008 ‘Kids in Science Program’ a Huge Success
| by Pratt Barndollar
If you were on the Exhibit Floor Tuesday morning during the 2008 Joint Convention, you may have seen a younger than expected crowd. KISP (Kids in Science Program) hosted 168 students from Our Lady of Peace and Sir John Franklin Junior High Schools Grades 7-9. The Convention visit helps show students geosciences career opportunities in a fun and interactive way.
Small student groups visited 24 corporate and professional society exhibit booths. At each booth, the kids saw a short presentation by the host exhibitor then answered questions about the host’s technical or industry role. Students were accompanied by 36 “guides” – industry volunteers who answered general questions and kept the procession moving.
After their exhibit floor visit, the students enjoyed lunch in the Stampede Blue Room, then participated in a rousing game of “Geo-pardy,” where they had the opportunity to test their geosciences knowledge in friendly competition. Christopher Collom and David Moore of EnerPlus did an excellent job as co-hosts, announcers, and judges.
In the weeks before the Convention trip, students attended informal, interactive, in-school presentations on paleontology, geology, and geophysics. These presentations offered hands-on exposure to rocks, fossils, and tools used by modern industry, plus some one-on-one time with professional geoscientists. The Burgess Shale fossils and a “seismic shot” were popular interactive experiences.
Feedback from the students, the teachers, the guides, and the host-exhibitors has been great! The students love the Exhibit Floor (and the free trinkets); “totally awesome” and “this place is so cool!” and “can we go back after lunch?” were heard over the general din at lunch. The guides and exhibitors enjoyed the interaction and energy of a captive young crowd. Teachers are using the question sheets prepared on the trip to incorporate geosciences instruction into their programs.
KISP is sponsored by the Burgess Shale Geoscience Foundation, and funding is provided by CSPG, CSEG, and APEGGA. Our professional societies have hosted convention visits to students in the past, but KISP in its present form was developed by Randle Robertson, Director of the Burgess Shale Geoscience Foundation and Dave Middleton, then CSPG Outreach Director.
They recognized that junior and senior high school curricula are usually short in earth science courses at a time when students are making future career decisions. Exposure to the variety of geoscience opportunities available may influence their career choice. During their lifetimes, these students will face critical issues on power generation, water supply, waste disposal, air quality, and food supply. It is important to give them the knowledge necessary to make appropriate decisions, even if they are not professional earth scientists.
The objectives of KISP are:
1. To re-introduce Earth Sciences into the science curricula for junior high school students and teachers in Alberta,
2. To expose students to various careers options and appropriate levels/types of education in the geological sciences,
3. To create an interest among junior high school students to pursue post-secondary studies in the earth sciences,
4. To provide students with the knowledge to make informed decisions on management of diminishing resources, and
5. To inform students about the significance of the Burgess Shale u NESCO–World Heritage Site.
The Burgess Shale Geoscience Foundation, the CSEG, the CSPG, and APEGGA wish to thank all the volunteers who participated, with a special thanks to the host-exhibitors and to the KISP Committee members. Thanks also to the helpful and flexible Stampede staff. It was through all of your efforts that this year’s KISP was a “totally awesome” success!
The Kids in Science Program would like to sincerely thank the following Sponsors: and Exhibitors:
for making this year’s visit to the 2008 CSPG CSEG CWLS Back to Exploration Convention a huge success! Thank you for investing in our future Geoscientsts
2008 Gussow-Nuna Geoscience Conference
Oct.20 – 23,2008 • The Banff Centre
Understanding the Climate System, and the Consequences of Climat e Change for the Exploitation and Management of Natural Resources
50% in 1997), a proportion that would hardly be affected at all by allowing offshore drilling in areas currently under moratorium, or by opening up the Arctic National Wildlife Refuge to exploration. Offshore (and Canadian) imports only became important in the uS because domestic reserves are becoming depleted. Given that the uS is the most thoroughly explored country on Earth, the likelihood of major new supplies being located is very remote. Estimates of possible reserves in ANWR range from 3 - 31.5 billion barrels. At 20 million barrels/day, which is current uS consumption, this amounts to a supply ranging from 171 days to 4.3 years. A drop in the bucket.
Real political leadership would address these issues head-on by emphasizing the seriousness of the energy situation, for example by discussing the Peak Oil problem. How imminent is “the Peak”? Most countries have monopolistic oil practices and have terrible track records of exploration and production. In other words, if the rest of the world’s basins were explored as thoroughly as those in the uS, would we be talking about oil prices today?
6. T HE DROw NING/STRANDED POLAR BEAR
Photographs of polar bears swimming between ice floes, or perched, apparently forlornly, on a melting ice berg, are often used to make a point about global warming in the Arctic. We are led to think that the bears could not survive a warm, ice-free Arctic. They could even drown—ignoring the fact that polar bears are superb swimmers. Polar bears will certainly have a hard time surviving in an environment of reduced ice cover, but largely because this will force them to come on land where they will encounter humans, not because the land could not support a healthy bear population.
Polar bears evolved as a variant of the brown bear about 200,000 years ago, and survived the last major interglacial, some 120,000 years ago, perfectly well. It is competition for resources with the human population, bears killed because they injure humans, and threats to their health from pollution, that threaten the bear population, not global warming.
As these six examples illustrate ,
simplifications can help opinion leaders to make a point. But there are hazards to this approach, as well as benefits. Pointing out the complexities may take spokespersons “off message” for those trying to argue a simple point, but not doing so insults the intelligence of the general public, whose ability and willingness to understand important scientific arguments is all too easily under-estimated.
Please join us October 20-23 in Banff as these and other subjects are discussed indepth over a three-day technical program which culminates in an optional field trip – ‘Glacial Geology and Climate Change in the Banff Area.’ For more information on all events taking place during the Conference, and how to register, please visit the GussowNuna website at www.cspg.org.
*Registration fee includes two nights accommodation at the Banff Centre as well as all meals and coffee break refreshments.
LETTER TO THE EDITOR regarding climate change
Dear colleagues,
The vigorous discussion about climatic evolution and its relationship with the “Anthropogenic Global Warming as a consequence of Green House Gases Emissions” would benefit immensely if the many participants exhibited basic notions in Meteorology and Climatology.
Thus, if I may, I wish to point out one essential synthesis of Climatology by French Professor Emeritus in Climatology, Dr. Marcel Leroux, a work recommended by Academician Claude Allègre, winner of the 1986 Crafoord Prize in Geology, that all individuals willing to learn and build a documented opinion on the question should be well inspired to read:
Stratigraphic Mapping Career Opportunities
Alberta Geological Survey (AGS) provides geoscience information and expertise to government, industry and the public to support exploration, development, conservation and regulation of Alberta's energy, mineral and groundwater resources.
Within the AGS Mapping Section, we are creating the rst digital atlas of Alberta’s geology. Additional geologists are needed to map and interpret the lithostratigraphy and sequence stratigraphy of the Western Canada Sedimentary Basin, the Rocky Mountains and the Rocky Mountain Foothills within Alberta. Motivated individuals with expertise in both two-dimensional and threedimensional stratigraphic mapping are required for the positions listed below.
Clastic Stratigrapher: Ph.D. (preferred) or M.Sc.
Carbonate Stratigrapher: Ph.D. (preferred) or M.Sc.
Mapping Geologist: M.Sc. (preferred) or B.Sc.
At AGS, you will have the opportunity to work in a stimulating environment on challenging eld and of ce-based projects, work with advanced technology, and remain current in your eld while making signicant contributions to your community of practice.
Global Warming, Myth or Reality: The Erring Ways of Climatology, Springer Praxis editors (2005).
Back in 1983, Dr. Leroux published an authoritative study about the Climate of Tropical Africa under the sponsorship of the World Meteorological Organization. It is from his direct observations and measurements over many years that he has been able to understand phenomenon, integrate satellite imagery, create synoptic charts, and rebuild a modern meteorology based on facts, not models. upon reading this book, you’ll have the tools to read Environment Canada satellite images and to place into context the news we are bombarded with and appreciate their true significance, not the spin.
The mighty mathematician Sir Harold Jeffreys may have had the Royal Academy on his side to scold down Continental Drift back then; but it was Alfred Wegener – a meteorologist – who pushed the boundaries of geological history even if he could not satisfactorily explain its mechanism. Let us return the favor as geoscientists, and seek information from experienced Climatologists on the Climate Change issue and in doing so, avoid parroting official dogma either by ignorance or by opportunism.
And for those who have made an art of elevating the peer-reviewing process in itself to an undisputable scientific truth, I wish to point out that the demonstrations developed in this 500-page work have been presented in scientific journals too.
In conclusion, I let you meditate the quote Dr. Leroux introduces his university lecture with:
“Tell a satisfied man he is wrong, he’ll hate you. Show him how he is wrong; he’ll hate you to death”
James Mills in One Just Man, 1974
Indeed these days, sharing climatological knowledge requires courage. Leroux has it.
Dr. Marc Villéger Geologist
Addendum: Professor Marcel Leroux passed away on August 12, 2008.
LETTER TO THE EDITOR About climate science: Discussion of Mathison Letter
| by David L. Barss
The following is offered in the context of the CSPG’s intention to expand and communicate an understanding on the global history of climate change – a complex and sometimes controversial subject. With that in mind, the following letter places considerable reliance and reference to experts in different fields of climate science. We urge readers to access these references when they have a question or a different point of view.
The comments that follow relate to the consecutive paragraphs of Mr. Mathison’s Letter (Reservoir, June 2008 p. 16-22; available at http://www.cspg.org/publications/ reservoir/reservoir-archive-2008.cfm).
Paragraph 4 – The author discusses the IPCC and climate variability. However, the IPCC is deficient in examining the role of climate drivers. For example, the role of the sun, cosmic flux, and solar system dynamics; the treatment of positive or negative feedback in computer models; the inadequate consideration of the role of water vapour; the irresponsible use of proxy data; and the acceptance of false statistical data and its analysis (the widely publicized infamous Mann “Hockey Stick”). For an in-depth understanding of the IPCC and its process, a paper by Holland is highly recommended.
Paragraph 7 – The author draws attention to the Palaeocene-Eocene boundary implying that warming followed a CO2 increase. This is at odds with the data from ice cores showing that CO2 increase followed temperature rise by a ~900 years (Indermuhle et al., 2000). Also, it would be interesting to know what affect the major Chicxulub asteroid impact event had on global climates before, during, and after that event.
Paragraph 9 – The author attributes mass extinction at the end of the Permian to be due to release of greenhouse gases (CO2 and methane). But that is not substantiated by Wignall, 2007, who comments: “Hitherto, the origin of the terrestrial extinctions has been linked to climatic changes such as global warming (Retallack, 1995) … but the development of mild, wet conditions in high latitudes settings is hardly the stuff of mass extinctions, something more terrible must have happened…”
Paragraph 10 – The same question as described above is present. The author
implies that temperature spikes at the end of the Triassic and the end of the Cretaceous are due to changes in CO2 concentrations. But what is the evidence that temperature spikes followed a rise in CO2 concentrations?
Paragraph 11 – The author mentions the uniqueness of modern times, – “Human activities now equal in scale Earth processes making us a profound planetary force (Rees, Vitousek, in Grimm, 2006) This seems a bit of a stretch – the significance of humans as a planetary force would seem irrelevant: we are not adding matter from outer space and the changes in CO2 concentrations are well within (in fact, much lower) than in previous geological periods.
The author states rising concentrations of CO2 from 280 to 380 ppm is outside natural variability. He seems unaware that CO 2 increased from ~250 to ~360 ppm about 9,700 years BP (Kurschner, 2004). Also, note that Beck, 2007, (http://www.biokurs. de/treibhaus/180C02supp.htm) describes “180 years of atmospheric CO2 Analysis by Chemical Analysis” and shows CO 2 concentrations varying from 450 ppm in 1820 to the often cited 280 ppm in pre-industrial time and were also higher in 1940.
Paragraph 13 – Ignoring the rate and direction of climate change over modern times is a significant omission by the author. It is surprising that he emphasizes rate of change while ignoring the direction of temperature change and CO2 concentrations during the time that we have the most reliable records. For example, the rapid increase in global temperatures from 1915 to 1945 with little change in CO2 concentration is ignored as is the decrease in temperature from 1945 to 1975 when CO2 increased sharply. This clearly shows that CO2 was not the cause of temperature change. It is true that temperatures and CO2 concentration both increased form 1975 to 1998, but the question remains: what part of the temperature increase is natural and what part is due to CO2 ? From 1998 to the present time CO 2 concentrations have continued to increase, but temperatures have remained flat or decreased slightly. The disconnect between temperature changes and CO2 concentrations is evident and highly relevant.
Paragraph 15 – The author’s statement
of climate stability from 8,000 years ago to the present is incorrect. Sanford reports a finding [by Luckman] of 8,000-year-old tree fragments at the ‘snout’ of the Athabasca Glacier, indicating its much reduced extent at that time. He goes on to describe its advances and retreat: The Crowfoot advance from ~11,000 to ~9,000 years ago; “The Little Ice Age or Cavell advance that lasted from 1200 to 1900 AD. During this period, the Athabasca Glacier peaked…then receded until about 1800, when it started to advance again, almost gaining its 1715 size in 1840.” Of course, it has been in retreat since that time. At Lake O’Hara, a study of Opabin lake bed sediments (Reasoner in Geoscience Guide to the Burgess Shale) also reveals retreats and advances from 10, 000 years ago to the present.
It is unclear as what the author means when he writes–“The long-term changes in the Holocene are consistent with changes in orbital variation (i.e., Milankovitch cycles)…” As the Milankovitch cycles are ~20,000, ~40,000, and ~100,000 years long, one questions the accuracy of pinning the relatively short Holocene period on orbital change.
Paragraph 17 – The author states “There is overwhelming scientific consensus…that the Earth’s climate has warmed over the last 100 years”. While this true – scientists are in agreement that warming has taken place over the last 100 years – but that isn’t the point. The point is: what caused that increase – human factors or natural factors?
It is factually incorrect for the author to state that “warming has accelerated in the last 50 years.” Temperatures have oscillated: cooling from 1945 to ~1975 and then warming from 1975 to 1998. From 1998 to 2007 temperatures on average have remained flat or declined slightly. Moreover, records show that temperatures reached the highest in recorded temperature history in the mid1930s in the united States. The same is true for the Arctic (Przybylak, Polyakov). The author claims that warming in the last 50 years in the Northern Hemisphere is likely the warmest in the last 1,300 years is somewhat reminiscent of the discredited claim made by Mann et al. (the “Hockey Stick” graph) that temperatures in the 20th Century were higher than any in the last 1,000 years.
(Continued on page 54...)
Paragraph 18 – The Kyoto protocol and the uN’s urging was political from its very inception. For Canada’s participation, remember that the decision by PM Chretien was based on his “Gut Feeling.” It has been heavily politicized ever since with billions of dollars distributed to organizations, individuals, corporations, and government departments involving expenditures that will have no impact on climate change.
Paragraph 20 – The author in describing “high probability”, “extremely unlikely”, “very unlikely” in discussing a causal relationship between warming and the rise in CO2 levels makes it crystal clear that the relationship between temperature changes and CO2 is unproven. The author is relying on the IPCC for these qualifications, but as we noted elsewhere, the IPCC is not a reliable reference (Holland). The IPCC is not a scientific organization.
Paragraph 21 – It is simply false to state -“Few scientists publishing in refereed atmospheric journals question the validity of a causal relationship … from anthropogenic sources and current rise in global average temperatures”. To name a few who challenge the anthropogenic cause of climate change: Tom Segalstad (Norway), Tim Patterson
(Carleton), Veizer (Ottawa), Jaworowski (Poland), Roy Spencer (NASA), Lindzen (MIT), Carter (Australia), Shaviv (Israel) – the list is very long and represents highly qualified scientists. Solomon’s 34 “Deniers” in the Financial Post have among them published 4,000 peer-reviewed articles and over 100 books. The put-down and discrediting of these and other scientists gives an impression of desperation by disparaging the work of other scientists. The author mentions peer review. Of course, peer review is necessary but that is still no guarantee that it will eliminate unbiased science as the Wegman Report on Mann’s “Hockey Stick” icon demonstrated “… there is a tightly knit group of individuals… our perception is that this group has a self-reinforcing feedback… and, moreover, the work has been sufficiently politicized that they can hardly reassess their public positions without losing credibility.” (Ad Hoc committee report to two uS Congress Committees)
Paragraph 24 – The author states “we are currently in a mass extinction event that may rival…the end of Cretaceous.” However, losses due to extinction are extremely difficult to estimate as Lomborg (2001) notes. “The loss of biodiversity, expressed in the 40,000 species a year, is a dramatic figure, created by models…It is a figure which with monotonous regularity…[repeated until]…it
THE MACKENZIE CORRIDOR: Resources for a pipeline.
Wednesday, October 15, 2008
The Mackenzie Corridor of the Northwest Territories has been producing hydrocarbons for nearly eighty years. An anticipated new pipeline will provide access to more. This one-day workshop will present new data on the stratigraphy, structure, and plays of the region, along with a series of core displays.
Location: Geological Survey of Canada (Calgary). Cost: $250
For more information, or to register:
GSC-Calgary, 3303-33rd St NW, Calgary, AB T2L 2A7 email: 403-292-7142
bmaclean@NRCan.gc.ca
has become part of our environmental litany. But it is also a figure which conflicts with both observation and careful modeling.”
The author goes on to say that “…more acidic seas (due to dissolved CO2 ) results in bleaching of corals…” This concern for reef habitat is discredited by Dr. Francis Manns: http://epw.senate.gov/public/index.cfm?, who notes that the ocean is still decidedly acidic.
The author then comments that “Loss of sea ice in the Arctic will result in collapse of the Arctic marine ecosystem…” What is the evidence for disappearance of Arctic sea ice? It is probably satellite coverage which has been available only since 1979. However, evidence from Russian scientists (Polyakov, Pryzbylak) show that the warmest Arctic temperatures occurred in the 1930s. Similarly, Chylek notes that the warmest temperatures on coastal Greenland occurred in the 1930s. The media and individuals/ organizations have dramatized Arctic ice disappearance in the past year, but readers should be reminded that Roald Amundson sailed the Northwest passage in 1905 while the St. Roch crossed from Vancouver to the Atlantic in 1942-44 and returned to Vancouver in 1946. Not mentioned by the author is the report that the central ice masses in Greenland and the Antarctic are growing and the extent of Antarctic ice sheet in the Southern Hemisphere is increasing.
Paragraph 25 – The author predicts dire consequences for the future of our forests –“…[they] are likely to succumb to heat stress, droughts, forest fires…The current spread of pine beetles…etc.” with these catastrophes predicated by the author on continued global warming. The pine beetle spread is undeniably a concern. The spread of the pine beetle has been blamed on climate change but also on the lack of decisions by the BC Government, which – in spite of the recommendations of experts – refused to expend resources to contain the outbreak in the initial occurrence on Vancouver Island. If in fact temperature increase is the cause, the spread has occurred with a very modest rise in temperature (probably higher winter temperatures). Do we want a return to the Little Ice Age to solve the problem? However, should warming continue, there are many positive climate results that are never mentioned such as expanded growing agriculture season, expanded agriculture area, greater crop variety, greater biodiversity, decreased energy demand, and so on.
Paragraph 26 – The author apparently endorses the Stern Review which stated “…climate change…if not addressed, could lead to disruptions…equivalent in scale to those of the two world wars and the Great Depression.” This overblown hyperbole by Stern and his economic argument has been
responded to by many economists, notably, William Nordhaus, generally considered to be the most authoritative economist in the climate change field (Solomon, Financial Post, May 18, 2007). “The Stern Review has been much criticized for its selective use of data – Sir Nicholas Stern piles one worst case scenario upon another to arrive at his fantastical costs, and Dr. Nordhaus is among those who note this failing…”
Paragraph 27 – The author highlights a wide range of climate-related catastrophes for Canada including the loss of Arctic sea ice (commented on above) and a reduction in stream flow of glacier-fed streams and increased evaporation in the Prairies Provinces. But glacier/stream flow and drought conditions will depend not only on temperature but also on precipitation from changing circulation systems. This is evident from Peter Leavitt et al.’s study that provides information on precipitation and droughts for the last 2000 years basing his analysis on a study of lake bed cores. Apart from the record of low and high precipitation on the Prairies over those years, the study concluded that there is 45% probability of drought by 2030 and as well, noted that droughts are commonly patchy in distribution.
Paragraph 29 – The author reports on a Lockwood and Frohlich paper (2007) featured on the BBC concluding that warming since 1985 could not have been due to solar variability. However, Svensmark and FrisChristensen rebut the Lockwood/Frohlich argument comprehensively and Gregory shows that the Lockwood/Frohlich paper is misleading because the graph titled “Cosmic Ray Count” is not about cosmic rays.
Paragraph 30 – The author concludes “that warming from increased greenhouse gas concentrations is the only plausible source of rapid warming” – but this is falsified by the fact that temperatures have not increased for the last 10 years when CO2 has continued its rapid upward increase.
The author minimizes the impact of solar and cosmic ray flux on climate change and ignores significant research that speaks to these impacts on climate change. Scientists such as Abdussamatov (see Solomon) and David Archibald are forecasting cooling in the next 10 to 40 years. From 1998 to today, temperatures have remained on average flat or decreased slightly which is thought by some to presage that change.
Paragraphs 32, 33, 34, 35, 36 – The author goes to considerable length to discuss intricate details of computer models and their application in analysis of climate change. He obviously takes offence at the preceding policy point – Climate behaviour models are exceedingly complex, possess significant error
and uncertainty, and remain highly imprecise – by his comment “The blanket statement discredits the entire field of atmospheric modelling…”
However, the questionable merit of using computer models to determine future temperature and climate change can be seen in the revisions of temperature projected by the IPCC models over the years – the IPCC 1990 projected warming estimate of 3.2ºC; the 1992 estimate was 2.6ºC; and this was followed by the 1995 estimate of 2.0ºC. The IPCC gave up forecasting specific temperatures after that and used ‘storylines’! The problem is not computers, but the data input and its handling. There couldn’t be a better illustration of this point (and a key recent paper on climate change) than by Spencer which in one part of his paper, asks the question: How Could So Many Climate Modelers Be Wrong? And then goes on to answer that question.
Paragraph 37 – One can agree with the author that it is the duty of the Society to provide unbiased information. However, it is evident that the author does not always follow that advice. The author does present useful science information, but very often there is a challenging scientific argument that should be considered – but is not. The many specific topics within the science of Climate Change require acceptable data, its analysis, and supportable argument by reputable scientists. To advance our understanding, there is need for a forum or mechanism to debate or elucidate research and evidence that is strictly constrained to science.
For those of us that question the human factor’s influence on climate change, we find it difficult to accommodate everyday claims such as “There is a global consensus amongst most scientists that the climate is currently being modified rapidly by the anthropogenic addition of greenhouse gases,” or “the science is settled” or “the consensus of thousands of scientists is…” while at the same time failing to acknowledge the work of many highly regarded scientists doing research or with advanced degrees on the subject of climate science.
SELECTED R EFERENCES
Archibald, D. 2008. Solar Cycle 24: Implications for the United States. International Conference on Climate Change. March, 2008.
Chylek, P., Box, J.E., and Lesins, G. 2004. Global Warming and the Greenland Ice Sheet. Climate Change 63: 201-221.
Darby, D., Bischof, Cutter, G., de Vernal, A., Hillaire-Marcel, C., Dwyer, G., McManus, J., Osterman, L., Polyak, L. and Poore, R. 2001. New record shows pronounced changes in the Arctic Ocean circulation and climate. EOS, Transactions, American Geophysical Union 82: 601,607.
Gregory, K. 2007. A Critique of the Lockwood/Frolhlich Paper. Science and Public Policy Institute.
Holland, D. 2007. Bias and concealment in the IPCC process: the “Hockey Stick” affair and its implications. Energy and Environment. v. 18 p. 950-983.
Indermuhle, A. Monnin, E. Stuffer, B. and Stocker, T.F. 2000. Atmospheric CO 2 concentration from 60 to 20 kyr BP from Taylor Dome ice core, Antarctica, Geophysical Research Letters 27: 735-738.
Kurschner, W. 2004, AAPG Studies in Geology #47, p. 169189.
Jaworowski, Segalstad T.V. and Ono N. 1992. Do glaciers tell a true atmospheric CO 2 story? The Science of the Total Environment, 1992. 114. p. 227-284.
Leavitt, P., Chen, G., Rusak, J., and Wunsam, S. 2002. The Past, Present and Future of Prairie Droughts: How Bad is Bad? University of Regina http://www.uregina.ca/drought.
Lomborg, B. 2001. The Skeptical Environmentalist. Cambridge University Press. p. 247-257.
Mann, M., Bradley R.S., and Hughes M.K. 1999. Northern Hemisphere Temperatures During the Past millennium: Inferences, Uncertainties, and Limitations. Geophysical Research Letters 26, p. 759-762.
Patterson, A. Prokoph, A. Chang, 2004. Late Holocene sedimentary response to solar and cosmic ray activity in influenced climate variability in N.E. Pacific. Sedimentary Geology 172. p. 67-84.
Polyakov, I.V., Alekseev, G.V.Byryaev, R.V., Bhatt, U., Colony, R.L., Johnson, M.A., Karklin, V.P., Makshtas, A.P., Walsh, D. and Yulin A.V. 2002 observationally based assessment of polar amplification of global warming. Geophysical Research Letters 29: 10.1029/2001Gl011111.
Polyakov, I.V. Bereave, R. V., Alekseev, G. V., Bhatt, U.S. Colony, R.L., Johnson, M.A.,Makshtas, A.P., and Walsh, D. 2003. Variability and trends of air temperatures and pressure in the maritime Arctic, 1875-2000. Journal of Climate v. 16, p. 2067-2077.
Przybylak, R. 2000. Temporal and spatial variation of surface air temperatures over the period of instrumental observations in the Arctic. International Journal of Climatology.
Przybylak, R. 2002. Changes in seasonal and annual highfrequency air temperature variability in the Arctic from 1951-1990. International Journal of Climatology v. 22, p. 1017-1032.
Reasoner, M. 2000. In “A Geoscience Guide to The Burgess Shale”. The Yoho Burgess Shale Foundation.
Sandford, R. 1993. The Columbia Icefields. Altitude Publishing.
Solomon for the truth on global warming, FP. 2007 (re: Abdussamatov –St. Petersburg’s Polkovo Astronomical Institute.).
Spencer, R. 2008. Global Warming and Nature’s Thermostat. International Conference on Climate Change, New York.
Svensmark, H. and Fris-Christensen, E. 2007. Reply to Lochwood and Frohlich – the persistent role of the Sun in Climate forcing. Danish National Space Center Scientific Report 3/2007.
Wegman et al. 2006. Ad Hoc Committee report on the “Hockey Stick” global climate reconstruction, commissioned by the US Congress House Committee on Energy and Commerce.
Wignall, PB. 2007. The End-Permian mass extinction – how bad did it get. Geobiology. 5, p. 303-309.
LETTER TO THE EDITOR
Reply by Ed Mathison
Mr. Barss, by continually referring to me as “the author” of statements in the text, gives me far too much credit. For example, he credits me with attributing the mass extinction at the end Permian to greenhouse gas induced warming when this is clearly referenced to Wignall, 2007. Similarly, he appears to believe that I authored the statement, “current CO 2 levels are outside natural variability” whereas in reality, this is derived from and credited to the IPCC (2007). “The long term changes in the Holocene are consistent with changes in orbital variability” is a direct quotation from Houghton (2004). “…[M]ore acidic seas (due to dissolved CO 2 ) results in bleaching of corals…” is referenced to a report compiled for the united Nations and quoted in CBC News (January 20th, 2007). The dire consequences for the boreal forests which Mr. Barss attributes to me are referenced to Pittock (2005) and Carrols (Canadian Forestry Service). Additionally, although the statement “Warming as a result of increased greenhouse gas concentration is the only plausible source of rapid warming over the last view decades” is mine, it is followed by a direct quotation from Dessler and Parson (2006) which it paraphrases.
In response to the statement “However, there is strong opinion among the scientific and political community that the present warming has been accelerated” I stated, “Inclusion of politicians in the above statement has no relevance and serves only to minimize the scientific consensus.” To this Mr. Barss goes on to criticize the Kyoto protocol and how Canada signed on based upon a “Gut Feeling” by Jean Chretien. These comments are not relevant to the issue of global climate change.
Regarding his quote of Wignall (2007) “Hitherto, the origin of the terrestrial extinctions has been linked to climate changes such as global warming (Retlack, 1995) … but the development of mild, wet conditions in high latitude settings is hardly the stuff of mass extinctions, something more terrible must have happened…”, what Mr. Barss does not mention is what that terrible occurrence is interpreted to have been. The entire crux of Wignall’s 2007 article is that outgassing of CO2 , methane, SO 2 , Cl, F, CH 3 Cl due to voluminous outpouring of Siberian flood basalts led to a “cascade of environmental change” resulting in global warming, acid rain, and damage to the ozone layer. These in turn
led to ocean anoxia, elevated surface water salinity, and increased ultraviolet B radiation which precipitated terrestrial and marine extinction. Global warming may not have been sufficient cause for the mass extinction but is a very important contributing cause and the global warming is interpreted to be due input of greenhouse gasses into the atmosphere.
Mr. Barss refers to thickening of the Greenland ice sheet yet fails to mention that glaciers at sea level are retreating rapidly. To quote Professor Ola Johannessen with the Nansen Environmental and Remote Sensing Center in Norway, “… thickening seems consistent with theories of global warming…”. Warmer air allows more precipitation whereas warm air at sea level results in increased melting (News in Science 21/10/2005).
Furthermore, Mr. Barss mentions that the Antarctic ice sheet is growing in both mass and extent. While the East Antarctic ice sheet is growing due to increased precipitation the West Antarctic ice sheet is thinning slightly. However the extent of sea ice has “decreased dramatically” by as much as 20%. Thinning of the West Antarctic ice sheet, loss of sea ice, and land-fast ice may be indicative of climate change (Davis, C. H., Li, Y., McConnell, J. R, Frey, M. M., and Hanna, E 2005, Indicator : AAT-14 Ice sheet mass balance and sea ice extent www. environment.gov.au/soe/2006/publications/ drs/indicator/476/index.html ).
Reconstruction of the extent of Arctic sea ice over the last century based upon ship, aircraft, and satellite observation indicates a relatively constant extent during the first half of the preceding century with a decline in summer minimum beginning mid-century followed by a decline in winter maximum beginning about 1975 ( untersteiner, 20th Century changes in the Arctic Sea Ice Cover www.arctic.noaa.gov/essay_untersteiner. html) . Thinning of sea ice based upon sparse ship data, manned ice camps, and submarine sonar soundings (1958-1976) indicate relatively constant ice thickness from 33.5 m thick. Submarine cruises in 19931994 “show a significant, locally variable of the ice by 1-2 meter” (Rothrock, et. al. 2000 in untersteiner). Thinning appears to have occurred in the last two decades. This is corroborated by satellite-based passive microwave observation that the area covered by multiyear ice decreased by 14%
between 1978 and 1998 (Johannessen, et. al. 1999, in untersteiner).
Evidence of warming in the Arctic is by no means limited to reduction in sea ice extent and thickness. Glaciers in the Arctic and sub-Arctic are retreating or have melted out. Eighteen of the nineteen glaciers in the Juneau Icefield are receding (Struik, 2008,). In addition, of the 850 glaciers on the eastern slopes of the Rockies, 325 have disappeared (ibid.). Over the past 100 years the Mackenzie Delta region has warmed 1.5 degrees C, while the Arctic Tundra warmed by 0.5 degrees C although there has been slight cooling in the eastern Arctic (Climate Change Overview, Environment Canada, www.ec.gc.ca/climate/overviewe.html). Paleolimnology studies in the Arctic document “widespread species change and ecological reorganization of algal and invertebrate communities” which they attribute to climate warming since approximately 1850 (Smol, J.P. et. al. 2005). Some Arctic ponds with paleolimnology records indicating permanent water bodies for millennia are now drying out due to increased evaporation / precipitation ratios, probably associated with climate warming (Smol, J.P. and Douglas, S.V., 2007).
Mr. Barss alleges that I ignore the rate and direction of climate change over modern times, claiming that this is a significant omission. Recent temperature records show an increase from 1915-1945 followed by a decrease from 1945 to 1975 and an increase to the present as indicated by Mr. Barss. My statement, based upon the work of Coward and Weaving (2004) and Dressler and Parson (2006), that the early century warming is attributed predominately to solar radiation, the mid-century cooling is attributed to sulfur emission while the current warming (since 1975) is attributed largely to anthropogenic greenhouse gasses, shows that there are multiple climate drivers and that CO2 levels combined with other greenhouse gasses, principally methane and halogens, are the predominant drivers over the current warming.
The statement attributed to Dr. Francis Mann that “the ocean is still decidedly acidic” does not make sense given that the issue is increasing acidity of the ocean due to absorption of CO2 . The ocean is currently slightly basic with a pH of 8.2 uptake of CO 2 over the last 200 years has led to a reduction in surface sea water
pH of 0.1 units. Given the current trend, this could rise to 0.5 by 2100 - a pH lower than has been experienced for hundreds of millennium (The Royal Society, Policy Document 12/05 www.royalsoc.ac.uk).
Acidification is essentially irreversible over our lifetimes and will take tens of thousands of years to reverse (ibid.).
Mr. Barss claims that my statement drawn from IPCC (2007) that “warming has accelerated in the last 50 years” is factually incorrect displays a misunderstanding of statistical data. Although Mr. Barss admits that there was warming from 1975 to 1998. From 1998 to the present he interprets as constant or slightly decreasing temperature. Climate is the statistics of weather and with any statistic there is variability. To claim that because values that follow the highest of the high are slightly lower and therefore indicative of a cooling trend is not valid given the small time interval. Although temperatures in the mid-1930s in the united States beat out 1998 as the hottest year, the difference is insignificant (.04 degrees) based upon a minor readjustment. using Mr. Barss’ logic we could conclude that there is a cooling trend since then. The change is status of temperatures in the u SA does not alter the global temperatures trends. The Earth’s climate is a complex dynamic system with many positive and negative feedback loops that responds to all climate drivers, as well as to internal re-adjustments, often in a non-linear fashion.
Mr. Brass’s use of climate data from the Rocky Mountains as evidence for lack of relative climate stability over the last 8,000 years is an extrapolation based on a geographically limited dataset. Temperature is not the only determinant of glacial dynamics. Precipitation variability must also be factored in. Glaciers in the western European Alps advanced from 1760 to 1830 and glaciers in southern Norway advanced in the early 18th century, both of which are attributed to increased snow fall (Climate Change 2007). Similarly, warm temperatures on the coast of Greenland in the 1930s or in the Russian Arctic do not prove that the entire Arctic was warmer in the early part of the last century, nor do high temperatures in the u SA in the 1930s prove higher global trends.
Mr. Barss states that “The author claims that warming in the last 50 years in the Northern Hemisphere is likely the warmest in the last 1,300 years is somewhat reminiscent of the discredited claim made by Mann, et. al. (the “Hockey Stick” graph) that temperatures in the 20th Century were higher than any in the last 1,000 years.” My
statement that Mr. Barss is responding to was taken from the IPCC (2007) report as was referenced in the text. For a detailed discussion of how this was arrived at refer to the Palaeoclimate portion of the report (Climate Change 2007). This statement is not based only on the Mann, et. al. 1998 reconstruction but incorporates four independent instrumental measurement compilations plus 12 reconstructions based on a variety of climate proxy records, four of which extend back over 1,000 years. It is my belief that the work of Mann, et. al. (1998) has stood up well to critical scrutiny (ibid. p. 466).
Mr. Barss dismisses my reference to Grimm’s (2006) assertion that we are a profound planetary force (based on the work of Vitousek, et. al., 2002 and Rees, 1997), as a bit of a stretch. Paul J.Crutzen, who won a Nobel Prize in 1995 for his work on ozone depletion, has termed the most recent epoch the Anthropocene in recognition the profound impact that we are having on the planet. To quote Will Steffen, Paul J Crutzen, and John R. McNeill (2007)
(Continued on page 58...)
into planetary terra incognita. The Earth is rapidly moving into a less biologically diverse, less forested, much warmer and probably wetter and stormier state.” The depth and breadth of human impacts on the Earth was demonstrated much earlier from a Canadian perspective in “Planet under Stress (1990), edited by Digby McLaren and Constance Mungal. Mr. Barss trivializes the immense problems that face us brought about largely through our own actions.
Mr. Barss’ statement that use of the “extremely unlikely”, “very likely” (which have precise mathematical expression, see Climate Change 2007) makes it clear that the relationship between climate change and CO2 is unproven.” Mr. Barss apparently does not recognize that these complex problems can only be addressed probabilistically. To not include a measure of uncertainty would be misleading. use of qualifiers also does not imply that there is not an abundance of data that has been critically scrutinized that backs up these statements.
Mr. Barss’ statement that “The author draws attention to the Palaeocene – Eocene boundary implying that the warming followed a CO2 increase. This is at odds with the data
from ice cores …” is a case of mixing apples and oranges. CO2 played a positive feedback to climate change driven by orbital forcing (Milankovitch cycles) (Climate Change 2007). Enhanced warming due to atmospheric increase in greenhouse gasses substantiates the importance of these gasses in insulating the Earth. During the Paleocene, Eocene, late Triassic, and Cretaceous the Earth was largely ice-free making it difficult for these warming periods to follow deglaciation. The Earth’s climate has multiple drivers, increasing greenhouse gasses is well recognized as a major driver (i.e., greenhouse world) of climate in the Earth’s geological record. (Climate Change 2007).
Mr. Barss’s concerns regarding my use of the Stern Review as an indicator of the potential costs of climate change has been addressed in an article in Scientific American (June 2008) by John Broom – The Ethics of Climate Change. Mr. Broom argues that the principal difference between Nicholas Stern and his colleagues at the u.K. Treasury and economists such as William Nordhaus at Yale is in their choice of discount rate. Stern and colleagues choose a low discount rate (1.4) while the latter chooses a high discount rate (6%). The low discount rate of Stern’s places a higher value on the well
being of future generation relative to a high discount rate. Broom argues that the choice of discount rate requires ethical decisions. He furthermore argues that economists that deny the ethical dimensions (i.e., taking it from money markets which Broom argues does not fully reflect our values) are not allowing these decisions to be made in open democratic debate.
Mr. Barss makes a number of statements that aim to discredit the IPCC. To say that it is an organization of scientists gathered to produce comprehensive reports on the status of various lines of scientific enquiry is entirely accurate and therefore it is a scientific organization. If scientific organization means doing scientific research then it is not, but then again the CSPG does not do research, rather its members and other geologists do. Similarly by this standard the Royal Society of Canada, The Royal Society (u.K.), and National Academy of Sciences are not scientific organizations, although their role is similar to the IPCC. Although the reports that the IPCC contribute are not basic research they are exhaustively peer reviewed by hundreds of scientists who are specialists in the particular field of enquiry.
Registration for the Gussow-Nuna Conference Closes October 15!
Held this year at the Banff Centre October 20-22, the 2008 Gussow-Nuna Conference on the geoscience of climate change will give delegates the opportunity to interact with speakers from around the world as they examine the science behind evolving social and economic policy over 2 ½ days of invited talks
Registration for this Conference ($800 for CSPG, GAC, CFES & RSC members, $900 for non-members) includes Monday and Tuesday night accommodation at the Banff Centre, access to the Welcome Reception and all meals including a banquet featuring guest speaker Roberta Bondar
Also offered this year to conference delegates, a one day field trip exploring glacial geology and climate change in the Banff area Taking place on Thursday, October 23, this trip will give the participant an appreciation of how climate change has contributed to the marvelous landscape that we enjoy today in the Canadian Rocky Mountains The cost of the trip ($300) includes Wednesday night accommodation at the Banff Centre.
For more information, please visit www cspg.org
Science does not yield absolute knowledge, rather it yields the most reasonable interpretation based on all the available data and the level of understanding at a given point in time. Science is an ongoing process of self correction aimed at reducing the margin of error. When the margin of error becomes vanishingly small then we refer to these interpretations as facts. Science depends upon well reasoned arguments supported by relevant data. Science is an open process. To guard against bias, the peer review process was implemented. unwarranted assertion based upon faulty or misleading data are weeded out through time. Mr. Barss refers to Lomborg (2001) who disputes the statement that current extinction rates may be approaching that of the end Cretaceous. Mr. Lomborg, the author of the popular book “The Skeptical Environmentalist”, is a political scientist. He has been accused of distortion of statistical data by the Danish Committee of Scientific Dishonesty, union of Concerned Scientists, and Scientific American. One should approach his claims with a certain degree of skepticism. Similarly, Mr. Gregory’s paper critiquing Lockwood and Frolhlich was published by the Science and Public Policy Institute, formerly the Frontiers of Freedom Center for Science and Public Policy, a conservative think tank in the united States set up by Republican Malcolm Wallop. The 2007 paper by Holland (an engineer) criticizing the IPCC appears in Energy and Environment, a public policy journal (which incidentally has Bjorn Lomborg on the editorial board). The editor of Energy and Environment is Sonja Boehmer-Christiansen, a geographer, who served as co-editor with Willi Soon, an astrophysicist, on the article by Chris de Freitas published in the CSPG Bulletin (June, 2002). In 2003, Willi Soon and Susan Baliunis published in the journal Climate Research disputing the climate reconstruction of Mann, et. al., 1998, which was edited by Chris de Frietas. Publication of this article led to the resignation of half of the editors of the journal in protest that the paper was fundamentally flawed (http:// www.sgr.org.uk/climate/StormyTimes_ NL28.htm). The claim made by Wegmann, et al. (2006) in their unsolicited submission to the u S House Committee on Energy and Commerce that “…there is a tightly knit group of individuals … our perception is that group has a self reinforcing feedback…” can certainly be applied to this group.
What is perhaps most disconcerting is Mr. Barss’ total dismissal of the well documented interference in the scientific process by large corporations who have funded sympathetic scientists and friendly organizations who are willing to propagandize in opposition
to the science of climate change (DOB Jan. 4, 2007) This interference has taken place largely by conservative organizations (Beckerman, 2006, Geoscience Canada Vol. 33, No.3, Dessler and Parson, 2006, Charles Montgomery, Globe and Mail, August 12, 2006).
The role of our Society is to present an unbiased account of the state of scientific enquiry. The IPCC is the authoritative voice on climate change. Members of our society can judge for themselves the openness of the IPCC process by reading the exhaustive documentation of the organization (available online).
REFERENCES
Broom, J. 2008. The Ethics of Climate Change. Scientific American (June) p. 96-102.
Chesworth, W. 2006. Review of books: A Poverty of Reason: Sustainable Development and Economic Growth. Beckerman, W. 2003; and Re-thinking Green: Alternatives to Environmental Bureaucracy. Close, C.P. and Higgs, R. 2005. Geoscience Canada Vol. 33, No. 5, p. 143-144.
Coward, H. and Weaver, A. J. (eds.). 2004. Hard Choices, climate change in Canada. Wilfred Laurier University Press, Waterloo, 255 p.
Davis, C.H., Li, Y., McConnell, J.R, Frey, M.M., and Hanna, E. 2005. Indicator: AAT-14 Ice sheet mass balance and sea ice extent www. environment.gov.au/soe/2006/publications/drs/ indicator/476/index.html.
De Freitas, C. R. 2002. Are observed changes in the concentration of carbon dioxide in the atmosphere really dangerous? Bulletin of Canadian Petroleum Geology, Vol. 50, No. 2, p. 297-327.
Dessler, A. E. and Parson, E.A. 2004. The Science and Politics of Global Climate Change, a guide to the debate. Cambridge University Press, New York, 179 p.
Grimm, K. 2006. Katrina, Wilma and Me: Learning to Live with Climate Surprises? Geoscience Canada, Vol. 33, No. 2, p. 76-80.
Houghton, J. 2004. Global Warming, the complete briefing, Third Edition. Cambridge University Press, New York, 332 p.
IPCC. 2007. Summary for Policymakers. In: Climate Change 2007: The Physical Science Basis. Contribution of Working Group I to the Fourth Assessment Report of the
Intergovernmental Panel on Climate Change. Solomon, S., D. Qin, M. Manning, Z. Chen, M. Marquis, K.B. Averyt, M.Tignor, and H.L. Miller (eds.). Cambridge University Press, Cambridge, United Kingdom and New York, NY, USA.
Jansen, E. J., Overpeck, K.R., Briffa, J.C., Duplessy, F., Joos, V., Masson-Delmotte, D., Olago, B., Otto-Bliesner, W.R., Peltier, S., Rahmstorf, R., Ramesh, D., Raynaud, D., Rind, O., Solomina, R., Villalba and D. Zhang. 2007. Palaeoclimate. In: Climate Change 2007: The Physical Science Basis. Contribution of Working Group I to the Fourth Assessment Report of the Intergovernmental Panel on Climate Change. Solomon, S., D. Qin, M. Manning, Z. Chen, M. Marquis, K.B. Averyt, M. Tignor and H.L. Miller (eds.). Cambridge University Press, Cambridge, United Kingdom and New York, NY, USA.
Mungall C. amd McLaren, D. (eds.). 1990. Planet under stress: The Challenge of Global Change, Oxford University Press, 360 p.
Montgomery, C. 2006. Mr. Cool and Friends, Globe and Mail, August 12, 2006.
Pittock, A. B. 2005. Climate Change, turning up the heat, CSIRO Publications, Collingwood, Australia, 295 p.
The Royal Society. 2005. Ocean acidification due to increasing atmospheric carbon dioxide, Policy Document 12/05. www.royalsoc.ac.uk.
Smol, J.P., et. al. 2005. Climate-driven regime shifts in the biologic communities of arctic lakes, Proceedings of the National Academy of Sciences http://www.pnas.org/content/102/12/4397. abstract.
Smol, J.P. and Douglas, S.V. 2007. Crossing the final ecological threshold in the high Arctic, Proceedings of the National Academy of Sciences, 104, p.12395-12397.
Steffen, W., Crutzen, P. J. and McNeill, J. R. 2007. The Anthropocene: Are humans now overwhelming the great forces of nature? Ambio Vol. 36, No. 8 p. 614-621.
Struik, E. 2008. Bearing Witness; why climate change in Canada’s north matters to Alberta, Legacy Magazine. Spring 2008.
Untersteiner, N. 20th Century changes in the Arctic Sea Ice Cover, Arctic theme page, National Ocean and Atmospheric Administration www. arctic.noaa.gov/essay_untersteiner.html.
Wignall, P.G. 2007. The End-Permian mass extinction – how bad did it get? Geobiology Vol. 5, p. 303-309.
The Canadian Society of Petroleum Geologists presents The 2008 CSPG Honorary Address
In association with our presenting sponsors
with Mavericks Pioneer and Big Wave Surfer Jeff Clark and Dr. Stephen M. Hubbard, Assistant Professor, University of Calgary
Southern Alberta Jubilee Auditorium Tuesday, October 28, 2008
Doors Open 5:30 pm for Booth Displays
Presentation begins at 7:00 pm
Tickets available through TicketWeb at 1-888-222-6608 or www.ticketweb.ca
Adults $10. Seniors, Students and Groups $8. For more information surf www.cspg.org/events
DO THE wAVE!
| by David Middleton, Honorary Address Committee Member
In the ever broadening circle of geoscience knowledge, geologists are now comfortable (for the most part), with discussions on topics previously regarded as the domain of geophysicists. Geologists today are able to use terms like p-waves and s-waves with some degree of confidence. The CSPG, in association with the CSEG, APEGGA, and the CSPG Trust, are pleased to present a topic that should appeal to everyone familiar with waves.
The topic of the Honorary Address this year is “The Science of Big Wave Surfing,” and our two presenters are world-famous surfer Jeff Clark and Dr. Stephen Hubbard, who will provide the links to geoscience beneath the waves.
Jeff Clark is one of the pioneers on surfing Mavericks, one of the most dangerous big wave breaks on the planet. He is the founder of the Mavericks surf contest held annually in Half Moon Bay, California, where surfers challenge the most dangerous big wave breaks on the planet, where the waves can exceed 18 metres (or 60 feet) in height.
Dr. Stephen Hubbard is the 2005 CSPG Andrew Baillie Award winner, and is an Associate Professor in the Department of Geoscience at the university of Calgary. He is an active researcher in clastic sedimentology, and outdoor enthusiast. In June 2008 he spent time in California carrying out deepwater research, so we are fortunate to have a definite segue in our presenters, as they tie together the fascinating worlds of surfing the big waves and the geoscience impact of waves.
The goal of the Honorary Address is to foster an appreciation for science within the general public, and to stimulate an interest in science among today’s youth. The presentation will focus on the formation of waves, why they form in certain locations, and impact of the waves in reference to geoscience. The 2008 Honorary Address is a great opportunity to have two acknowledged experts share their passions, one for the pursuit of the ultimate wave, the other a knowledgeable interpreter of how the impact of wave effects are recorded in the geology of the planet.
This year’s presentations will be held on Tuesday, October 28, 2008 at the Jubilee Auditorium; there will be a daytime and evening presentation. The daytime
presentation is exclusively for Junior High School students from the school boards in Calgary, and provides a stimulating event to raise the understanding of the science of big waves and the extrinsic controls that create the perfect, world renowned surfing wave. The evening presentation is open to the public and allows additional students; interested members of the general public; and members of the CSPG, CSEG, and APEGGA; and their enthralled family members, an opportunity
to view the presentations, meet with the speakers, and attend the many fascinating lobby exhibits.
Tickets are available through Ticketmaster. The cost is $10 for adults and $8 for seniors, students, and groups. If you have any questions, please contact Alex Wright (awright@AdvantageIncome.com), Linden Achen (lindenachen@gmail.com), or David Middleton, middletn@petro-canada.ca.
48TH CSPG CLASSIC G OLF TOURNAMENT a Big Hit
| by Foon Der
At 1:00 pm June 18, 2008 on the Elbow Springs Golf Club 27-hole layout 168 golfers teed off to start three days of golf and networking. Since 2004, this tournament has been opened to anyone working in the Canadian oil industry as a geoscientist or as one who provides services to this sector. Incidentally there were nine female competitors this year. The contestants were grouped into 21 divisions of eight players with comparable ability. The winners of each match moves on while the losers were relegated to the chuckwagon races (Texas Scramble-best ball). Tent sponsors ensured that all competitors were well fed and hydrated.
In 2006 the CPGO Golf Tournament expanded its role to providing a community service in addition to its golf activities. To this end Wellspring Calgary was chosen as a charity partner for 2008, a volunteer organization that provides cancer support and education. During the past three years nearly $28,000 has been raised to support charitable services beginning with Hospice Calgary and now Wellspring Calgary.
The winner of the Paskapoo (Championship) Flight this year is Scott Desmarais. The runner-up is Mike Hartwick. The winning Chuckwagon team consisted of Ben Crutchfield, Michael Fawcett, Andreas Georgousis and Bryce Davis. The Quinn Memorial trophy for sportsmanship and dedication was awarded to John Maher.
The CSPG Classic Committee on behalf of the contestants thanks all nearly 80+ sponsors who collectively ensured
the success of this year’s tournament. Sponsorship of all sizes is appreciated. All sponsors will be listed on the 2009 registration form but space limitations allow us to name only the trip and Platinum level sponsors at this time.
Trip #1 (Nassau, Bahamas)
Tristone Capital Advisors – won by Brian Irwin
Trip #2 (New York)
Fugro Data Solutions/Geostrata Resources/ Wildcat Scouting – won by Irene Park
Trip #3 (Fairmont Hotels Package)
– Arcis Corporation – won by Brenda Pearson
Other Platinum sponsors: AGAT Laboratories (Thur. BBQ, keeper trophies), Baker Atlas Wireline (tent), Belloy Petroleum Consulting (steaks, roster book), Devon Corporation (financial), Divestco (tent), geoLOGIC systems ltd. (shirts, tent), GLJ Petroleum Consultants (clubs, trophy), IHS (tent, financial), Logtech Canada (financial), MJ Systems (Friday Breakfast), Pason Systems (prize), ProGeo Consultants (financial), Recon Petrotechnologies (tent, Wed. BBQ), Rundle Energy Partners (charitable donation), Schlumberger of Canada (Halfway House), Sproule Associates (trophy, clubs), Tucker Wireline Services (tent, roster book), Weatherford Canada Partnership (tent), West Canadian (group photos, roster book), and Vega Estate Planning Group(financial).
The CPGO Committee is seeking input from the golf community while it evaluates the pros and cons of sustaining a threeday tournament. The Committee would especially like to hear from anyone who is unable to participate in the three-day event or would prefer a two-day event. Any advice including keeping the three-day format or other improvements would be welcome. You may contact the following committee members with your comments: Mike LaBerge (who has agreed to remain as chairman until after the 50th annual tournament) at mike. laberge@telus.net or Foon Der at foon. der@can.apachecorp.com.
Left to Right: Perry Dyck, Mich Peters, Scott Desmarais (Paskapoo Flight Winner), and Yar Kolomijchuk.
Left to Right: Jessica Duke, Danielle Maughan, Chris Elmquist, and John Chipperfield (Precambrian Flight winner).
industry-leading customer service
easy & efficient migration of existing data helping clients increase productivity
We know that almost everyone who tries geoSCOUT™ wants to use geoSCOUT. So, why hasn’t everyone already switched to geoSCOUT? Probably because, in general, people don’t like change. But, in this case, change is good – very, very good. Just ask the thousands of landmen, engineers & geologists currently using geoSCOUT oil and gas mapping and analysis software to make solid decisions every day. Give us an hour for a demo – we know you’ll see the value. Call 403.262.1992 | Email info@geoscout.com | Online www.geoscout.com/demo Another powerful suite of tools from geoLOGIC
Seeing is believing!
Are you faced with difficult interpretation challenges?
� Would you give this zone a second look?
The Triple-combo logs (left side) show no clear indication this zone contains hydrocarbons.
� What if you could “see” the fluids contained in this zone to identify fluid type and quantity?
Now you can! The 2D NMR images from the MR ExplorerSM (MREXSM) service in tracks 4 & 5 identify gas condensate in this zone.
� Does it contain commercial quantities of hydrocarbon?
The fluid volumetrics measured by the MREX service (in track 6) indicate commercial quantities of hydrocarbon are present in this interval. This was confirmed by formation tests using the Baker Atlas Reservoir Characterization InstrumentSM (RCISM) service.
Image the fluids and know for sure.
The MREX service from Baker Atlas makes direct measurements of fluid type and volume.
2D NMR imaging enables you to “see” the fluids to ensure all potential hydrocarbon zones are identified for maximum recovery on every well.
For direct measurements of reservoir fluid type and volume, contact Baker Atlas today.