


Focus, quality and value. We don’t build our reputation on volumes—instead, we earn it on the quality of the information we extract from that data. For more than 75 years, IHS has processed and analyzed vast amounts of raw data, concentrating it into the in-depth, actionable information that is used today to advance energy-critical business decisions. Energy information, refined.
ihs.com/refined-information/cspg


CSPG OFFICE
#600, 640 - 8th Avenue SW Calgary, Alberta, Canada T2P 1G7
Tel: 403-264-5610 Fax: 403-264-5898
Web: www.cspg.org
Office hours: Monday to Friday, 8:30am to 4:00pm
Executive Director: Lis Bjeld
Email: lis.bjeld@cspg.org
Sponsorship & Outreach Coordinator: Alyssa Middleton
Email: alyssa.middleton@cspg.org
Publications Coordinator: Caitlin Young
Email: caitlin.young@cspg.org
Member Services Coordinator: Kasandra Klein
Email: kasandra.klein@cspg.org
Registration Coordinator: Dayna Rhoads
Email: dayna.rhoads@cspg.org
Convention Contacts:
Convention Manager: Aileen Lozie
Email: aileen.lozie@cspg.org
EDITORS/AUTHORS
Please submit RESERVOIR articles to the CSPG office. Submission deadline is the 23rd day of the month, two months prior to issue date. (e.g., January 23 for the March issue).
To publish an article, the CSPG requires digital copies of the document. Text should be in Microsoft Word format and illustrations should be in TIFF format at 300 dpi., at final size. For additional information on manuscript preparation, refer to the Guidelines for Authors published in the CSPG Bulletin or contact the editor.
Technical Editors
Ben McKenzie Colin Yeo (Assistant Tech. Editor) Tarheel Exploration EnCana Corporation Tel: 403-277-4496 Tel: 403-645-7724 Email: bjmck@telusplanet.net Email: colin.yeo@encana.com
Coordinating Editor
Caitlin Young, Publications Coordinator, CSPG Tel: 403-513-1227, Email: caitlin.young@cspg.org
ADVERTISING
Advertising inquiries should be directed to Caitlin Young, Tel: 403-513-1227, email: caitlin.young@cspg.org. The deadline to reserve advertising space is the 23rd day of the month, two months prior to issue date.
The RESERVOIR is published 11 times per year by the Canadian Society of Petroleum Geologists. This includes a combined issue for the months of July and August. The purpose of the RESERVOIR is to publicize the Society’s many activities and to promote the geosciences. We look for both technical and


CSPG EXECUTIVE
President John Varsek • Cenovus Energy john.varsek@cenovus.com Tel: (403) 645-5417
Vice President
Kirk Osadetz • Geological Survey of Canada, Calgary kosadetz@nrcan.gc.ca Tel: (403) 292-7022
Past President
Graeme Bloy • Canada Capital Energy Corporation gbloy@capitalenergy.ca Tel: (403) 975-5784
Finance director
Greg Lynch • Shell Canada Ltd. greg.lynch@shell.com Tel: (403) 691-3111
assistant Finance director
Darren Aldridge • Baker Hughes darren.aldridge@bakerhughes.com Tel: (403) 537-3505
Program director
Scott Leroux • EnCana Corporation scott.leroux@encana.com Tel: (403) 645-2000
assistant Program director
Brett Norris • TransGlobe Energy Corp. brettn@trans-globe.com Tel: (403) 264-9896
serVice director
Ayaz Gulamhussein • NuVista Energy Ltd. ayaz.gulamhussein@nuvistaenergy.com Tel: (403) 538-8510
outreach director
Mike DesRoches • Talisman Energy Inc. mdesroches@talisman-energy.com Tel: (403) 513-6843
assistant outreach director
Steve Dryer • Consultant whiskeyjackresources@telus.net Tel: (403) 969-2292
communications director
Stephen Hubbard • University of Calgary steve.hubbard@ucalgary.ca Tel: (403) 220-6236
assistant communications director
Jim Barclay • ConocoPhillips Jim.E.Barclay@conocophillips.com Tel: (403) 532-3889
executiVe director
Lis Bjeld • CSPG lis.bjeld@cspg.org Tel: (403) 513-1228
A message from Assistant Program Director, Brett Norris
As I sat thinking about something clever to write that would be worthy for the members,
the realization dawned on me that it just wasn’t happening. Another 15 minutes of struggle and I gave up, wandered downstairs for a Guinness (it is no wonder to me that Ireland is the world leader in beer consumption per capita) and came across my 12-year-old daughter who simultaneously was watching an old episode of Glee on the computer, facebooking hundreds of friends, watching some addictive rubbish on the TV, and, no doubt, finishing off her homework somehow; a wonder of multitasking efficiency. A cheery “Hi Dad” (in that refreshingly pre-teen manner) bubbled out when she noticed me. Guinness in one hand and the remote in the other brought me to Wipeout. A little juvenile humour can’t be such a bad thing. Contestants were required to navigate through the minefield. Opening door 1, 2, or 3 and a large padded pendulum ram swung out, cartwheeling them backwards into a mud pit; walking across a narrow ledge past a wall from where spring-loaded boxing gloves assailed the contestants unexpectedly at face level knocking them dazed into water; running across a rotating plank equipped with a counterrotational sweeper arm that sent contestants flying off and down a couple of stories into water. Lots of fun to watch, for a while. So fun in fact that the CSPG Executive should consider it as a teambuilding exercise. We would probably have a sellout crowd at the technical luncheon if we decided to air the video. Then it occurred to me that Wipeout is in many ways a lot like our industry. Things happen seemingly out of nowhere that throw us, our companies, and our industry sideways. Commodity prices go up and down, wars erupt and subside, environmental and political views change, royalties and incentives get revised, mergers and acquisitions happen, corporate business models and strategies undergo significant alteration. All of these factors impact our jobs, our careers, our lives. Our network of colleagues at the CSPG and our training and skills we have developed over our careers are great assets during uncertain times.
The CSPG is busy working on its vision and resulting initiatives that it set for 2010, based on feedback from members. The mandate of the incoming Executive was to re-invigorate the membership by re-vitalizing our technical programs. Sounds pretty straight forward. Execution of a plan is never as easy as coming up with the plan in the first place. Technical Program revitalization is not easy, especially given the outstanding short course and field trips run in the past. In the past four years,
Continuing Education has delivered 142 short courses and field trips, taken advantage of by about 20% of the membership. In 2010 alone, more than 600 training days were taken by the membership. Doing this better will be a challenge. In this case, better means providing training that will be relevant to more than 20% of our members by offering even greater variety than in the past. Changes are needed to achieve this. Some of these changes are already approved and moving forward, while others are just ideas we are currently pursuing.
Effective for 2011, a change in the fee structure to instructors will provide more opportunity, freedom, and incentive to instructors to deliver high-quality courses and field trips. In addition, courses and field trips will no longer be deliberately scheduled around the annual conference and education week. This will make it easier to attend a larger variety of courses and trips over the calendar year. It also will open up more field trip opportunities in the summer time when researchers are out in the field. A training matrix is being constructed that will act as a guide to the programming of short courses and field trips that Continuing Education is going to provide. The matrix will provide a template of training for geologists of all experience ranges, from new graduates to senior staff. In addition, the CSPG is actively engaging other organizations in discussions to collaborate with training and instructors. In the past, the CSPG provided training directly, working with instructors to develop programs. This will continue, while at the same time the CSPG membership will be able to access training through other organizations, leveraging our membership of almost 3,800. The CSPG website is being upgraded to facilitate better communication of Continuing Education events, scheduling, and registration. Thanks to the volunteers who are implementing these changes.
As we move quickly toward 2011, I would also like to thank the members. It is your continuing support and participation in the society that makes the organization what it is. We look to you for your feedback and input as we continue to grow and change, and ask for your understanding during that change. These changes will make the CSPG stronger, and let’s hope that your continued active participation in the CSPG will help you to develop your career, and be better prepared when the counter-rotational sweeper arm of our industry next comes around!

Courses include:
• Essentials of Subsurface Mapping
• Reservoir Characterization and Production Properties of Gas Shales
• Risk and Uncertainty in the Unconventional Realm
• Image Log Interpretation
• Principles of Reservoir Characterization
• Understanding Heterogeneity in U.S. Shale Plays
• "Old" (pre 1958) Electric Logs: A Quick Review
• Formation Evaluation of Thinly-Bedded Reservoirs
• Tight Gas Sands
• Regional Stress and Reservoir Geomechanics
• Quick Guide to Carbonate Well Log Analysis
(Four concurrent sessions each day – mix and match according to your interests and training needs. Buffet Lunch and refreshments
Hosted by the Norris Conference Center: 803 Town & Country Lane Houston, TX 77024
Phone: 713-590-0950
Fax: 713-590-0961
Special AAPG group rates at nearby hotels.
Registration and information:
Toll-free (U.S. and Canada) 888-338-3387, or 918-560-2650
Fax: 918-560-2678
E-mail: educate@aapg.org
Download a registration form at: www.aapg.org/education/wec.cfm
(Your five-day badge can be transferred to a friend or colleague if you can't attend all five days.)
CORPORATE
MEMBERS
AAPG
AGAT LAborATories
APAche cAnAdA LTd.
APeGGA
Arc FinAnciAL corPorATion
AryTon consuLTinG exPLorATion LTd.
bAker ATLAs
bLuebAck reservoir
boyd PeTroseArch
cAnAdA brokerLink
cAnAdiAn nATurAL resources LTd.
cAsey & AssociATes
cenovus enerGy inc.
cGG veriTAs
coLorAdo schooL oF mines
conocoPhiLLiPs cAnAdA LimiTed devon cAnAdA corPorATion
divesTco inc.
encAnA
enerPLus resources Fund
FuGro Airborne surveys corP.
FuGro – JAson
GeoedGes inc.
geoLoGic systems ltd.
GeomodeLinG TechnoLoGy corP.
GeosTrATA resources inc.
hALLiburTon enerGy services
hunT oiL comPAny oF cAnAdA husky enerGy inc.
ihs
imPeriAL oiL resources
LArio oiL & GAs comPAny
LiTTLe rock documenT services
LorinG TArcore LAbs LTd.
mJ sysTems
murPhy oiL comPAny
neurALoG
nexen inc.
Penn WesT enerGy TrusT
PeTrocrAFT ProducTs LTd.
PLusPeTroL
ProvidenT enerGy LTd.
rPs enerGy
schLumberGer cAnAdA LTd.
sensor GeoPhysicAL LTd.
sheLL cAnAdA LimiTed
sProuLe AssociATes LimiTed
suncor enerGy inc.
TALismAn enerGy
ToTAL e&P cAnAdA LimiTed
TourmALine oiL corP.
Tucker WireLine LTd.
WeATherFord/omni

RPS Boyd PetroSearch’s Earth Modeling Division provides engineers, geologists and geophysicists with a powerful new solution for enhanced reservoir and subsurface understanding.
Using best practices in 3D modeling, our senior consultants combine multi-disciplinary data to create a reliable earth model that enables you to:
• Build complex structural models
• Characterize reservoir properties
• Locate new prospects
• Optimize well positioning
• Estimate resources
• Manage uncertainty
• Reduce risk
Please call: Damien Thenin 403.543.5381 or Larry Herd 403.543.5362 or visit boydpetro.com or rpsgroup.com/canada
rpsgroup.com
SPEAKER
Ron Boyd conocoPhillips, AAPG distinguished Lecturer
11:30 am
Tuesday, November 9, 2010 Calgary TELUS Convention Centre Calgary, Alberta
Please note: The cut-off date for ticket sales is 1:00 pm, three business days before


event. Wednesday, November 3, 2010. CSPG Member Ticket Price: $42.00 + GST. NonMember Ticket Price: $45.00 + GST.
Each CSPG Technical Luncheon is 1 APEGGA PDH credit. Tickets may be purchased online at https:// www.cspg.org/eSeries/source/Events/index.cfm.
The modern coastal sediment dispersal system of eastern Australia operates from sources in the sydney b asin 1,000 km northward to sinks on the coastline of southeast Queensland and the adjacent Tasman sea abyssal plain. individual sand reservoirs of over 203 km3 have accumulated in less than one million years, from longshore transport rates averaging 500,000 m3 per year. Zircon-dating techniques enable the tracing of this entire sediment dispersal system from its original source in Antarctica to its final sink on the floor of the Tasman sea. igneous rocks with a characteristic age of around 600 ma produced zircons and associated source rocks on the current northern margin of Antarctica prior to continental breakup with Australia. Triassic uplift shed sediments and associated zircons 1,000 km northward in a braided river before intermediate deposition in the sydney b asin of eastern Australia. continental rifting in


Webcasts sponsored by
the late cretaceous produced the modern Tasman sea and an uplifted escarpment along eastern Australia, including the sydney b asin. escarpment erosion of the 600 ma zircons and associated quartz sands by river processes feeds the modern Tasman sea longshore transport system, delivering reservoir-quality sand 1,000 km north for storage on the southeast Queensland shelf. in the holocene, at sea-level highstand, this sand river has intersected the shelf edge and is currently supplying the east Australian longshore transport sands directly to the floor of the Tasman sea via a network of wave-, tide-, and gravity-driven flows through a four km-deep network of submarine gullies and canyons. elsewhere the margin is dominated by mass transport processes, including slab slides, box canyons, and retrogressive linear canyons. holocene submarine landslides range in volume up to 20 km3 and represent potential tsunami geohazards, as well as an alternative mechanism to transfer sediment to deep water on the southeast Australian continental slope and Tasman Abyssal Plain. e astern Australia provides an important example of a margin characterized by high wave energy, low subsidence, and coupled gravity mass transport and longshore transport processes.
COASTA l FACiES MOdElS coasts occur at the critical interface between land and sea. coastal sedimentation can be categorized as occurring mainly under either transgressive or regressive conditions, based on the balance between sediment flux and relative sea level change. Further subdivision results from the dominant marine processes operating at the shoreline, mainly either waves or tides, and the influence of river systems. Transgression produces eroding linear coastlines, barrier-lagoon shorelines occupying embayments with little fluvial input, and estuaries at the mouths of river valleys and deltas. shelf shoals and ridges consisting of reworked shoreline deposits lie seaward of transgressing coastlines. Landward of transgressing coastlines, major clastic deposition is typically constrained to river valleys. on regressing coasts, sediment is supplied by rivers to deltas that range from tide- to wave- and river-dominated forms. sediment is also supplied from deltas, offshore areas, and eroding updrift coasts to deposits in strandplains and shorefaces in wavedominated regions, and tidal flats where tidal processes prevail. Transgressive coastlines record a lower rate of sediment input compared to their rate of relative sea level rise. The resulting stratigraphy is composed of more seaward facies overlying more landward facies and details are determined
by the presence of incised valleys, the accumulation of estuarine and coastal barrier sediments, and the trajectories of the major wave and tidal ravinement surfaces. styles of modern and ancient stratigraphy range from low accommodation and low trajectories in which only the lowest incised valley and estuarine deposits are preserved, to complex transgressions with higher accommodation and higher trajectories and stacked transgressive/regressive parasequences. regressive coastal sedimentation results in more landward facies overlying more seaward facies. it has been extensively documented in strandplain/shorefaces, river-dominated deltas, and to a lesser extent in wavedominated deltas, but is only at an early stage in tide-dominated deltas. here, extensive shore-normal sediment transport, high mud contents, and low gradients result in facies and facies models that contrast with their river- and wave-dominated counterparts. by combining the principles of sediment flux and relative sea level change together with the major controlling processes of rivers, waves, and tides, a suite of facies models can be constructed that synthesizes the major depositional features of each coastal environment.
BiOgRAPhy
Ron Boyd is currently a Principal Geologist for the Stratigraphy and Quantitative Modeling Group in ConocoPhillips’ Subsurface Technology organization. Prior to taking up this position in 2008, he was a university professor, most recently at the University of Newcastle from 1992-2008, where he still holds the honorary position of Conjoint Associate Professor.
Boyd received his B.Sc. (Hons) and Ph.D. from the University of Sydney, Australia. He has worked as a university professor at Louisiana State University, USA and Dalhousie University, Canada. He has also been an Alexander von Humboldt fellow at Geomar Institute in Kiel, Germany working on ODP drilling results, a technical advisor to PanCanadian Petroleum on incised valleys in western Canada while on study leave, and a visiting research fellow at the Centre for Coastal and Ocean Mapping at the University of New Hampshire working on seabed mapping.
Boyd’s interests are mainly in the area of sedimentology and stratigraphy where he has specialized in a range of subjects including marine geology, estuary deltas and incised valleys, deepwater sediment transport, terrestrial sequence stratigraphy, seabed multibeam mapping, and fluvial geomodels for petroleum exploration. He has authored over 100 publications on these topics, received a number of best paper awards and best presentation awards, and has given a range of professional short courses to industry and the AAPG, SEPM, and CSPG.


One major oil company has written over 60 Ocean* plug-ins extending Petrel* workflows—to meet specific reservoir challenges and distribute proprietary intellectual property globally across their organization.
With the Ocean framework, software developers can focus on the domain logic of their applications, without worrying about infrastructure code. Apps have been created in as little as one hour. The freedom to innovate is here now.
SPEAKER
Dr. Hasley Vincent cs PG 2009 Ph. d. Graduate Thesis Award Winner
11:30 am, Thursday, November 23, 2010 Calgary TELUS Convention Centre Calgary, Alberta
Please note: The cut-off date for ticket sales is 1:00 pm, three business days before event. Thursday, November 18, 2010. CSPG Member Ticket Price: $42.00 + GST. Non-Member Ticket Price: $45.00 + GST.
Each CSPG Technical Luncheon is 1 APEGGA PDH credit. Tickets may be purchased online at https://www.cspg.org/eSeries/source/Events/ index.cfm.
An integrated sedimentological approach examining facies (physical and biogenic) and sandstone mineralogy is needed to elucidate the palaeogeography and changing sediment sources in complex and poorly exposed areas. The island of Trinidad, located at the northeastern coast of south America, lies at the transition between a deformed continental margin to the west and a relatively undeformed margin to the south that continues to brazil. The island is structurally complex and contains the most easterly exposures associated with the deformed continental margin. in addition, a major river system, the orinoco river, debouches at this transition zone and was a major source of the sediments now exposed on the island. The study of litho- and ichnofacies variation throughout the Trinidad cenozoic in combination with sandstone framework and heavy mineral stratigraphy provided key insights into stages of basin morphology and fill, sediment provenance, and overall impact of tectonism on the sedimentary record.
Trinidad sandstones form part of a recognizable ‘family’ of northern s outh

Webcasts sponsored by
American sediments sourced from three large-scale sedimentary domains. Precenozoic arkoses ( e arly cretaceous) were derived directly from the Guyana shield. by the late cretaceous and e arly cenozoic, passive-margin, deepwater environments persisted, dominated by mature, first-cycle sands derived from lowland plains such as the Llanos. by the Late oligocene to e arly miocene, changes in sandstone lithic fraction and heavy mineral assemblage record the onset of active tectonism and deformation of the passive continental margin. The similarity with Andean-derived sands across northern s outh America link the Late oligocene provenance to this major tectonic domain. deepwater turbiditic environments persisted in the deforming basin, and it was not until the e arly Pliocene that shelf and deltaic sandstones became dominant, sourced from the uplifted c aribbeann orthern r ange mountain belts. The changing sedimentary record in the Trinidad area was similar to changing compositions of modern and ancient sands from northwest b razil and venezuela and demonstrates a gradual, diachronous deformation front across the continental margin.
The results encourage a re-examination of the simplistic south-derived “orinoco” watershed, as the significant majority of Pliocene reservoirs were likely deposited by east- and south-flowing depositional systems. Paleogeographic models based on this integrated dataset also provide a useful framework to assess local and analogue reservoir setting, extent, and geometry. in spite of the complex tectonic-sedimentary setting, the variety of depositional systems (ranging from basin-floor turbidites to oil-saturated estuarine sands), combined with an extensive database of source and reservoir data, makes Trinidad an exciting study area, still relatively underutilized for international developments.


Dr. Hasley Vincent is currently a petroleum geologist with BG Trinidad & Tobago. He received his B.Sc. degree in geology from the University of t he West Indies, M.Sc. from Imperial College, London (2001), and Ph.D. from Dalhousie University, Nova Scotia. Prior to his current post, he has been involved in petroleum exploration and development activities in the Petroleum Company of Trinidad and Tobago and the Ministry of Energy, Trinidad. Hasley’s academic interests lie in the understanding of the stratigraphy and architecture of depositional systems as they relate to hydrocarbon exploration and development. He has done extensive research on the Plio-Pleistocene to Paleogene successions around Trinidad, for which he gained recognition by the Geological Society of Trinidad & Tobago. Hasley and his wife, Wendy, have two children, ages three and one.
SPEAKER
Brendan J. Murphy department of e arth sciences, st. Francis xavier university
11:30 am, Tuesday, December 7, 2010 Calgary TELUS Convention Centre Calgary, Alberta
Please note: The cut-off date for ticket sales is 1:00 pm, Thursday, December 2, 2010. CSPG Member Ticket Price: $42.00 + GST. NonMember Ticket Price: $45.00 + GST.
Each CSPG Technical Luncheon is 1 APEGGA PDH credit. Tickets may be purchased online at https://www.cspg.org/eSeries/source/Events/ index.cfm.
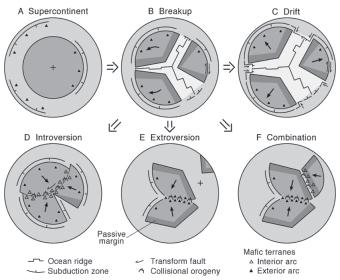
Two contrasting end-member modes of supercontinent formation, extroversion and introversion, are preserved in the geologic record. The ca. 0.8-0.75 Ga breakup of rodinia was accompanied by preferential consumption of the exterior ocean that surrounded rodinia. The exterior margins of the dispersing continental fragments collided, resulting in the Late neoproterozoic assembly of Pannotia by extroversion. The interior oceans generated between the dispersing continents formed part of Paleopacific oceanic lithosphere that surrounded Pannotia.
The Late n eoproterozoic breakup of Pannotia initially led to consumption of the exterior Paleopacific ocean, but at ca. 480 ma to 460 ma, this motion was reversed and preferential subduction of interior oceans (e.g., iapetus, rheic, uralian) led to the formation of Pangea by introversion. These end-member models can be distinguished by comparing the sm- nd crust-formation ages of accreted mafic complexes (e.g., ophiolites) in the collisional orogens formed during supercontinent assembly with the breakup age of the previous supercontinent. most commonly accepted geodynamic models predict the formation of supercontinents by extroversion. m odels explaining the formation of supercontinents by introversion, including the formation of Pangea, are more problematic. during the assembly of Pangea,
subduction was not only initiated within the new Paleozoic oceans, but the rates of subduction of this relatively young oceanic lithosphere must have exceeded those of the already well-established subduction zones within the exterior Paleopacific ocean.
To understand the processes leading to the formation of Pangea, we need to investigate the potential geodynamic linkages between the evolution of the rheic ocean and the penecontemporaneous evolution of the exterior (Paleopacific) ocean. This evolution is recorded in the 18,000 km Terra Australis orogen, which preserves episodes of subductionrelated orogenesis from 570 ma until 230 ma.
BiOgRAPhy
Webcasts sponsored by
Brendan Murphy is a Professor in the Department of Earth Sciences at St. Francis Xavier University, Canada, where he has been since 1982. He obtained his B.Sc. degree in University College Dublin, Ireland, before immigrating to Canada in 1975. He acquired a M.Sc. from Acadia University in 1977 and a Ph.D. degree from McGill University in 1982. He teaches courses
in structural geology, tectonics, and the evolution of the Earth. His research has been supported by NSERC since 1984. He has published over 220 scientific articles in academic journals, book chapters, monographs, or geological field guidebooks, and has authored or co-authored more than 200 conference presentations. He is currently editor of the Geological Society of America Bulletin, and in January of 2011 will commence a two-year research leave supported by a Killam Research Fellowship.
SPEAKER
Carl Sondergeld university of oklahoma, norman, usA, seG distinguished Lecturer
11:30 am Monday, December 13, 2010 Calgary TELUS Convention Centre Calgary, Alberta
Please note: The cut-off date for ticket sales is 1:00 pm, three business days before event. Wednesday, December 8, 2010. CSPG Member Ticket Price: $36.00 + GST. NonMember Ticket Price: $40.00 + GST.
Each CSPG Technical Luncheon is 1 APEGGA PDH credit. Tickets may be purchased online at https:// www.cspg.org/eSeries/source/Events/index.cfm.
The complexity of rocks in nature, and its resultant imprint on rock properties, makes empirical laboratory studies necessary and relevant. numerous efforts are underway in academia and industry to try and use theoretical models to predict petrophysical and seismic rock properties from microscale images of rocks. however, modeling can only honor the physics of the chosen model; measurements are still needed to define and calibrate the modeling physics. it is important to recognize the significant discoveries and technological advancements that are a direct consequence of careful laboratory measurement on rocks.
historically, laboratory measurements have been used to develop an understanding of the physical response of rock and fluid systems under various conditions (frequency, temperature, stress, sample size, etc.). The resulting data were used to provide insights into the key controls governing rock behavior when filled with various fluids and buried below the surface. early work was conducted to develop a better understanding of the correlations between compressional velocities, composition, density, porosity, and pore fluid type; this work formed early interpretations on understanding sonic logs and seismic bright spots. The ability to measure shear and polarized shear
velocities in the laboratory significantly expanded the scope of issues we could explore on naturally occurring materials; this helped to establish a new understanding of seismic rock properties. combining both P and s -wave data, along with some basic concepts of elasticity, provided the basis for lithology and fluid discrimination. Although multiple theoretical models provided an understanding of rock and fluid behavior, it was the experimental confirmation of biotGassmann theory that allowed rock physics to become the workhorse of the oil and gas industry; it is now one of the most important tools for the analysis of prestack seismic data.
new directions in rock physics research will extend the application of rock physics by incorporating petrophysical characterization into our measurement and analysis of rocks. For example, the concepts of capillarity, wettability, and relative permeability are rarely incorporated into seismic modeling. however, all three properties exert primary control on fluid saturation and distribution. o ther promising directions for future rock physics research includes laboratory measurements of production induced strain (in both reservoir and overburden rocks), detailed examination of the effects of pore microstructure on elasticity, examination of velocity behavior at temperatures and pressures equivalent to those found in deep basins, and the effects of co2 and time on seismic wave propagation through reservoir rocks. s imultaneous measurements of multiple properties will provide stronger constraints for computational rock physics models. recent developments in imaging technologies make it possible to image pore microstructures at scales that have historically been impossible. Application and further development of these technologies will allow us to extract more information from smaller and smaller samples. The practical aspect of this is that it should be possible to make better use of drill cuttings as a source of geophysical information. Finally, measurements on new reservoir materials, e.g., coals, shales, hydrates, etc., will lead to new geophysical technologies.
our history is rich with examples of how laboratory measurements have lead to innovations in field-scale technologies. in other words, if we can observe and quantify the magnitude of an effect in the laboratory, we have a basis for developing field-scale applications. This talk will highlight past accomplishments in rock physics, and more
Webcasts sponsored by
importantly will focus on future directions in rock physics and the promising and critical role that laboratory measurements will have in the development of new and innovative technologies.

BiOgRAPhy
Carl Sondergeld is currently the associate dean of the Mewbourne College of Earth and Energy and the Curtis Mewbourne Professor at the Mewbourne School of Petroleum and Geological Engineering, University of Oklahoma. He earned a Ph.D. in geophysics from Cornell University and a B.A. and M.A. in geology from Queens College CUNY.
He spent 19 years at the Tulsa Research Center of Amoco Production Company where he conducted research in petro- and rock physics, taught courses internally and internationally in rock physics, AVO and pore pressure prediction, and helped develop rock properties and AVO forward modeling software, a comprehensive rock properties database, a mobile core characterization system (GEM), and an array sonic logging tool and processing system. He holds 14 US patents. For one year he worked with BP-Amoco mainly in technology transfer and as a technology advisor.
He has been at the University of Oklahoma for 10 years, primarily teaching petrophysics, geological well logging, and seismic reservoir modeling. He is the recipient of three departmental outstanding professor awards and the Brandon Griffith Engineering Professor Award. He has been instrumental in building world class research and undergraduate instructional facilities at OU.
He currently conducts research on unconventional reservoir rocks, in particular shales, and in the areas of microstructural characterization, anisotropy, NMR, petrophysics, hydraulic fracturing, and seismic reservoir modeling. He shares responsibilities for an industry-supported research consortium in “Experimental Rock Physics” and in directing a multidisciplinary gas shale study. He is an active member of the SPE, SEG, serves as the Faculty Advisor to the OU SPE student chapter, and coaches the OU Petrobowl team.
Sponsored by:

www.rpsgroup.com/energy
*On
FARHATHYDERI,P.Geol President 226CopperfieldBlvd.S.E. Calgary,ABT2Z4R6 Tel 4037260666 Fax4034515380 Cell4038192516 farhat@sableconsultants.com SABLECONSULTANTS.COM
Jocelyn

P. Geol. President & CEO


SPEAKERS
Joel Shank and Guy Plint
University of Western Ontario
12:00 Noon
Tuesday, November 2nd, 2010
ConocoPhillips Auditorium, Gulf Canada Square, 401 - 9th Ave. S.W., Calgary, AB
Interest in the Cardium Formation has traditionally centered on large hydrocarbon
reserves hosted by shallow marine sandstone and conglomerate facies. As a result, muddy facies, which comprise the bulk of the formation, have been neglected. A regional, yet detailed, study of the Cardium Formation extending from Township 26 in the north to northern Montana in the south, covering an area of roughly 60,000 km2 , reveals a complex interaction between eustasy, tectonics, and sedimentation. The study is based on 16 outcrops, 12 core logs, and a network of over 700 well logs, with an additional 3,100 wells filling in particular areas of interest.
The geometry of allostratigraphic units based on regional marine flooding surfaces within the Cardium Formation reveals repeated pulses of subsidence (primarily driven by orogenic loading) overprinted by a high-frequency (4th order) eustatic signal. Reactivation of basement structures, including the Vulcan Structure, resulted in localized and intermittent pulses of subsidence. The sedimentology and geometry of Cardium mudstones suggest deposition in shallow, storm-influenced water in a tectonically dynamic basin.
The Cardium Formation reveals the complexity of tectonic affects, on both large and very small temporal and spatial scales. Localised tectonic affects could affect reservoir geometry and heterogeneity. Additionally, the recent economic interest in mudrock-dominated successions, combined with the rejuvenation of mature Cardium pools by technology, raises a growing awareness within the resource community of the need to decipher complexity in previously “boring” and ‘non-reservoir” rocks.
BIOGRAPH y
Joel Shank is a M.Sc. candidate at the University of Western Ontario, with an anticipated completion date of summer, 2011. He also has a B.Sc. from the University of Western Ontario. He is currently on a student work term with Imperial Oil.
INFORMATION
BASS Division talks are free. Please bring your lunch. For further information about the division, joining our mailing list, a list of upcoming talks, or if you wish to present a talk or lead a field trip, please contact either Steve Donaldson at 403766-5534, email: Steve.Donaldson@cenovus. com or Mark Caplan at 403-532-7701, email: mcaplan@aosc.com or visit our web page at www.cspg.org/events/divisions/basin-analysissequence-strat.cfm.
SPEAKERS
Zeev Berger, Michelle Boast, and Martin Mushayandebvu Image Interpretation Technologies Inc.
12:00 Noon
Thursday, November 4, 2010 Room LPW-910
Livingston Place West 250 2nd St SW Calgary, Alberta
The Deep Basin and the southern edge of the Peace River Arch have seen an unprecedented increase in drilling activities that are focused primarily on the development of the following unconventional oil plays: the tight carbonate section of the Swan Hills reef complex; hydrothermal dolomite (HTD) reservoirs in the Wabamun and Debolt at the southern edge of the Peace River Arch; fractured carbonate along the Debolt and Pekisko Mississippian subcrop edges; the fractured shale play of the Nordegg; and tight reservoir sand of the Viking and Cardium formations.
An integrated structural/tectonic study of the Deep Basin and the southern edge of the Peace River Arch area has demonstrated that basement features have exerted significant control on the development of ‘sweet spots’ within many of these plays. For example, all the known oil shows in the Nordegg shale play are located at the intersection of basement faults with Devonian reef edges, such as:
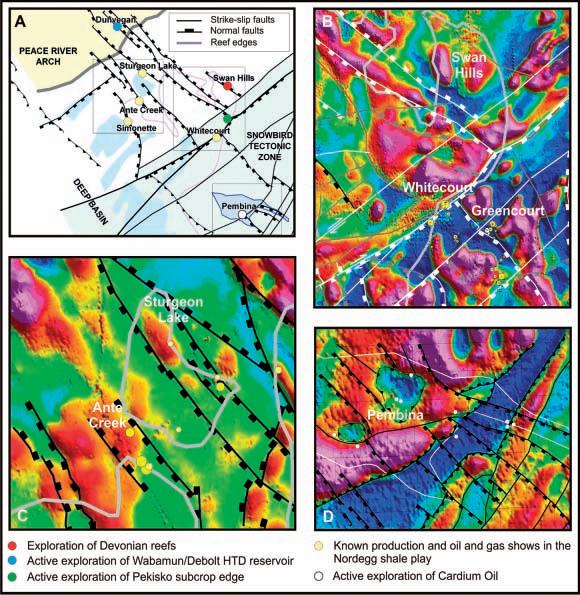
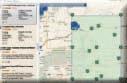
Figure 1. Examples of structural control on active oil plays in the Deep Basin and Southern Peace River Arch (Figure 1a). Basement structures which are interpreted from magnetic data and Devonian reef edges which have been mapped from well and seismic data clearly appear to exert a significant control on the location of known conventional Nordegg gas pools, such as Whitecourt and Greencourt (Figure 1b), as well as key oil shows in the emerging Nordegg shale play (Figure 1c). Basement structure and topography also appear to exert control on the development of the Cardium oil play in the Pembina area (Figure 1d).
Simonette, Sturgeon Lake, Ante Creek, and the Leduc Fringing Reef of the Peace River Arch. Recent exploration activities on the southern edge of the Peace River Arch are largely focused on exploitation of northwest-trending faults that are known to cause the development of HTD reservoir in the Devonian and Mississippian formations.
The methods used to establish the structural framework of the study area, and to identify the location of ‘sweet spots’ for each of the plays, will be demonstrated in two luncheon talks of the CSPG Structural Division. The October talk focused on the emerging Nordegg oil shale play, and the Cardium tight oil sand play of Pembina.
The November talk will cover exploration activities of the Wabamun and Debolt plays of the Peace River Arch, the Mississippian subcrop edge plays, and the development of the Swan Hills Reef Complex.
Each presentation will be limited to 40 minutes and will be followed by an open discussion. Participants are encouraged to bring PowerPoint examples to illustrate their views on the subject matter.
Offshore GuyanaSuriname
South America2010 – 2011 drilling to evaluate the extension of recent West Africa oil discoveries
(Oil & Gas Finding Aspects) November 1-4, 2010 (4 days)
SPEAKERS
Warren Workman, Exploration Vice-President, CGx Energy Inc.
Dave Birnie, President, GEOSEIS Inc.
Phil Harms, Manager Geophysical Interpretation Services, GEOSEIS Inc
12:00 Noon
Wednesday, November 17, 2010
Encana Amphitheatre, 2nd Floor East End of the Calgary Tower Complex 1st Street and 9th Avenue S.E. Calgary, Alberta
The Equatorial Atlantic Upper Cretaceous basin floor fan play has been one of the hottest exploration play trends over the 2007-2010 period as a result of world class discoveries offshore West Africa (Ghana –Jubilee, Odum, Owo, Tweneboa and Sierra Leone – Venus) and will continue to be a focus for the foreseeable future. Multiple world-class opportunities totalling billions of barrels have been found within and along the continental margins of Africa and South America in water depths from 50 to 2,000 meters where Cretaceous reservoirs are charged by oil migrating from mature oil-prone Type 2 Albian to Cenomanian source rocks. This source is mature in the deepwater area due to burial depth and higher geothermal gradients typical of oceanic/ stretched continental margin crust.
Early drilling success rates offshore West Africa have been high. Follow-up is being aggressively pursued in Ghana, Cote D’Ivoire, Sierra Leone, Mauritania, Liberia, and Guinea and also on the South American conjugate margin side offshore Guyana, Suriname and French Guiana, and Brazil. Exploration drilling for 2010-2011 has been announced by Murphy and INPE x in Suriname (3 wells), Repsol-YPF, Tullow, and CGx partnership and CGx in Guyana (2 wells) and Tullow, Shell, and TOTAL partnership in French Guiana(1 well)
In the Guyana-Suriname basin opportunities have been identified in less than 100 meters water depth as the modern shelf edge has prograded out over the ancestral Cretaceous shelf / and deepwater basin. As a consequence, wells can be drilled with three-leg jack-up rigs. Modern 3D seismic (PSTM and PSDM) together with a variety of derived post-stack and prestack seismic attributes define drillable targets in the 100’s of millions to billions of barrels range. Targets are quite deep (to
Sponsored by
6,000+ meters). Detailed velocity analysis and existing well control has been used to predict overpressure and reservoir quality. Existing wells have demonstrated oil shows and porosity preservation at depth. The onshore Suriname fields have in place resources of 1 billion barrels that has been typed to offshore source beds indicating migration distances of greater than 100 km.
The Turonian and Campanian seafloor fan targets are multiple overlapping fan lobes that are interpreted to form large stratigraphic traps. Basin subsidence by underlying tilted fault blocks of the stretched continental margin together with a failed Jurassic rift arm creates the accommodation space for basin-floor fan deposition from sand-rich shelf sediments transported from shelf-to-basin down major submarine canyon systems such as the Cretaceousaged Berbice Canyon, offshore Guyana. Subsequent Maastrichtian transgressive systems tract provides a strong regional seal for these deposits.
Limited well control and geophysical challenges make the use of geological models and analogues very important to assist play and prospect development, assessment of prospect geologic risk, and support for sizeof-the-prize modeling.
Resolution of the border dispute between Guyana and Suriname in 2007 under the UNCLOS treaty has promoted a stable business and regulatory e nvironment to allow investment to occur. Exciting prospects are going to be drilled over the next 18 months. Exploration plays will make great strides when wells are drilled and direct geologic calibration of 3D seismic datasets is achieved.
There is no charge. Please bring your lunch. The facilities for the talk are provided complimentary of EnCana and refreshments by Geochemtech Inc. For further information or if you would like to give a talk, please contact Bob Potter at (403) 863-9738 or ropotter@telusplanet.net or Trent Rehill at (403) 606-6717 or trehill@ kulczykoil.ca. Or visit our new Face Book page (“CSPG International Division”).
SPEAKER
Dr.
Takuya Konishi
Royal Tyrrell Museum of Palaeontology
7:30 PM
Friday, November 19th, 2010
Mount Royal University, Room B108
Calgary, Alberta
A BSTRACT:
During the Mesozoic, a variety of reptilian vertebrates were constantly evolving in the marine as well as terrestrial realms. Mosasaurs, temporally confined to the Late Cretaceous but spatially distributed worldwide, constituted the last major lineage of marine reptiles during the era. Following the emergence of such marine reptiles as ichthyosaurs, plesiosaurs, marine crocodiles, and sea turtles, mosasaurs were unique in that they represented the first and the last squamates, a reptilian group comprising lizards and snakes, to have become fully aquatic with flippers. Some reaching an estimated total body length of 15m or more, mosasaurs are also the largest squamates known to the history of earth. While their taxonomic diversity continues to increase with new fossil discoveries, many biological aspects of mosasaurs, including their swimming styles, continue to be the subjects of active ongoing research.
Plioplatecarpines are typically medium-sized (6–10 m total body length) and shortmuzzled mosasaurs, commonly found in Upper Cretaceous marine strata in North America including southern Alberta. Stomach contents associated with several skeletons show that these medium-sized mosasaurs mostly fed on fish and other small vertebrates. When temporal and geographic ranges of plioplatecarpines were incorporated into the newly proposed
phylogeny, the interrelationships among these mosasaurs, it became evident that: (1) these mosasaurs did not distribute to both sides of the Atlantic Basin until the latest part of the Late Cretaceous; and (2) the only group with this extended geographic distribution, Plioplatecarpus, is also most derived among plioplatecarpine mosasaurs. Hence, I propose that some or many of the anatomical characters that evolved both in the lineage leading to Plioplatecarpus and within the members of Plioplatecarpus after its establishment enabled this mosasaur to become fully pelagic. Based on the new phylogeny, the following characters for Plioplatecarpus are considered indicative of their pelagic and possibly deep-diving adaptations: (1) torso region less flexible; and (2) orbital size increased. Further, among the three known species of Plioplatecarpus, the following anatomical features are exclusively shared by the two, geologically youngest species: (1) posterior torso region primarily immobile; (2) lateral movement of neck restricted; (3) body deepened as neural spines of dorsal vertebrae elongated; and (4) tail base extremely stiffened. Presence of these latter anatomical modifications indicates that plioplatecarpine mosasaurs continued to develop deeper and progressively more rigid body architecture conducive to pelagic lifestyle up to the very end of their evolutionary history, which came to an abrupt end at the end of the Cretaceous.
A recent study indicates that Platecarpus, a moderately derived plioplatecarpine mosasaur, possessed a well-developed tail fin like that found in modern sharks. At the same time, Platecarpus lacked any of
Sponsored by
the aforementioned specializations found in Plioplatecarpus. Plioplatecarpines as a group existed in the last 25 million years of the Mesozoic Era. While a well-developed tail fin was clearly present by 85 million years ago in Platecarpus, acquisition of the large orbit and the stiff torso region, likely prerequisites for fully pelagic existence, did not take place for the next 10 million years or so until Plioplatecarpus appeared in the last stage of the evolution of plioplatecarpines.
Originally from Japan, Takuya Konishi came to Edmonton, Alberta to pursue his education in palaeontology at the University of Alberta. In 2004, he completed his undergraduate degree and proceeded to do his graduate work under Dr. Michael Caldwell at the university. He recently completed his dissertation work and has been a postdoctoral fellow at the Royal Tyrrell Museum of Palaeontology since September, 2009. His specialty is in mosasaurs, from the systematics to palaeoecology to functional morphology.
This event is jointly presented by the Alberta Palaeontological Society, Mount Royal University and the CSPG Palaeontology Division. For details or to present a talk in the future please contact CSPG Paleo Division Chair Philip Benham at 403-691-3343 or programs@albertapaleo.org. Visit the APS website for confirmation of event times and upcoming speakers: http://www. albertapaleo.org.
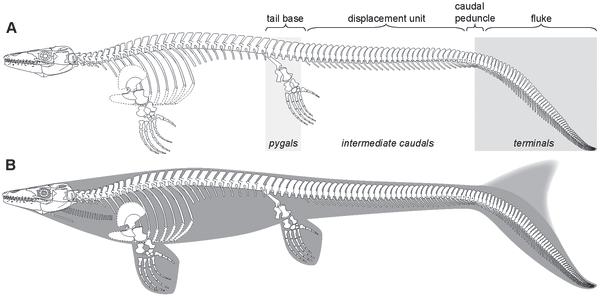
Figure 1. Skeletal reconstruction and inferred body outline of Platecarpus, an 85-million-year-old mosasaur. Note the downward bending of the tail, which is here interpreted to have supported a crescent-shaped tail fin (Image © 2010 Lindgren et al.)
SPEAKERS
Khaled Benzaoui, (Kbenzaoui@slb.com) Schlumberger, Calgary, Alberta, Canada
12:00 Noon, Wednesday November 24, 2010 APEGGA Calgary Office Conference Room, 2200 Scotia Centre, 700 - 2nd Street S, Calgary, Alberta
A BSTRACT:
For reservoir performance prediction usually a large number of realizations may be created quickly to assess uncertainty, but in practice, only a limited number of realizations will be chosen to perform flow simulation because of the computational limitations. The realizations will be selected based on a ranking method.
R ANKING METHODS:
There are many ranking methods. The traditional technique of volumetric “OBIP” does not have a good correlation with reservoir simulation in a SAGD-type project. In this paper we are importing some adjustment and correction to the technique developed by the CCG University of Alberta, called Static Quality (McLennan and Deitsh, 2005). Where we are calculating a recovery factor based on vertical permeability, distance, and position to the well.
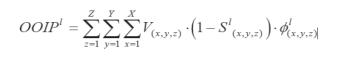
1. OBIP
Summation of all hydrocarbons in place for each realization:
2. STATISTIC RESERVOIR qUALIT y:
Cells connected to the well are the only ones considered (local connectivity approach):
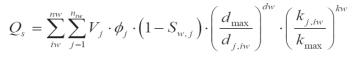
3. R ESERVOIR qUALIT y FUNCTION (RqF):
Our work consists of calibrating and enhancing the QS ranking method. The below changes were introduced to accommodate for SAGD type project.
A. Oil Flow
Qs method assumes oil is flowing straight towards the well. SAGD is a gravitational system, where oil flows vertically down to a level, then moves straight toward the well. It has been seen by TOTAL Canada in
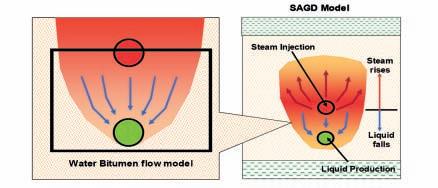
SPE 102159 – predicting flow distribution on Joslyn project. In the new method we will focus on the vertical flow as it is the most dominant.
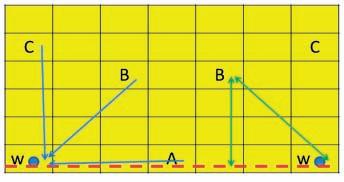
B. Relative position with the well:
In Qs: A, B, and C will be considered the same. To handle the difference we introduce the factor “R”.
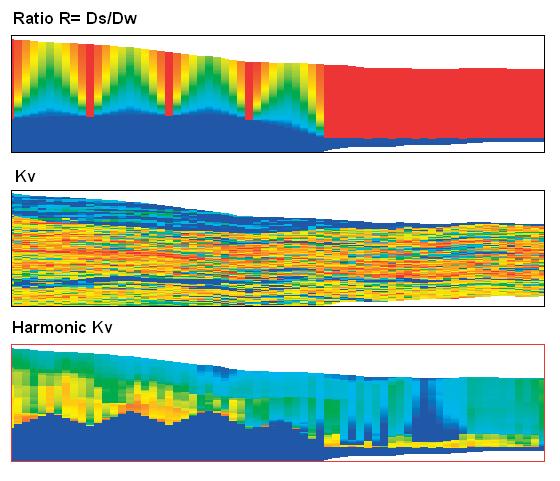
R = Ds/Dw
• S = Surface that pass by all SADG wells
• Ds = Distance from cells to surface S (above)
• Dw = Distance from cell to the well path.
Cells directly above the well “C”
Ds = Dw => R = 1
Cells same level as the wells “A”
Ds = 00 => R = 0
Example:
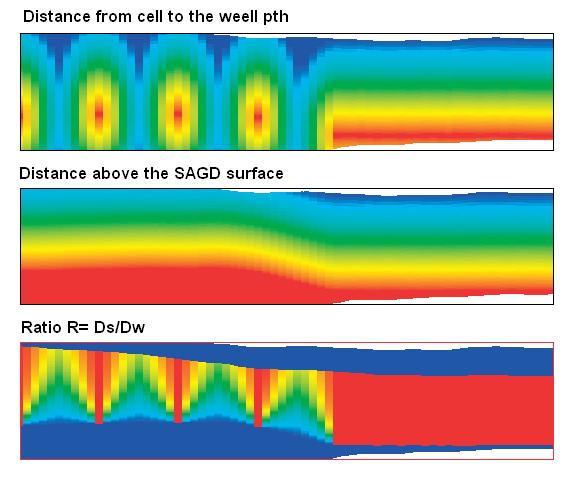
Note: Based on local experience, the lowest cells to be produced have a 10° angle to the well path.
• R is the COS of the angle. Cos(10)= 0.17
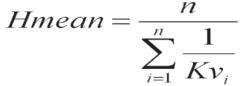
C. PERMEABILIT y
SAGD is mainly a gravitational system controlled by the vertical permeability. The vertical flow is parallel to Kv. Each cell will be assigned an effective permeability that is the harmonic mean of the Kv for all lower cells (only cells with R> 0.17 will be considered).
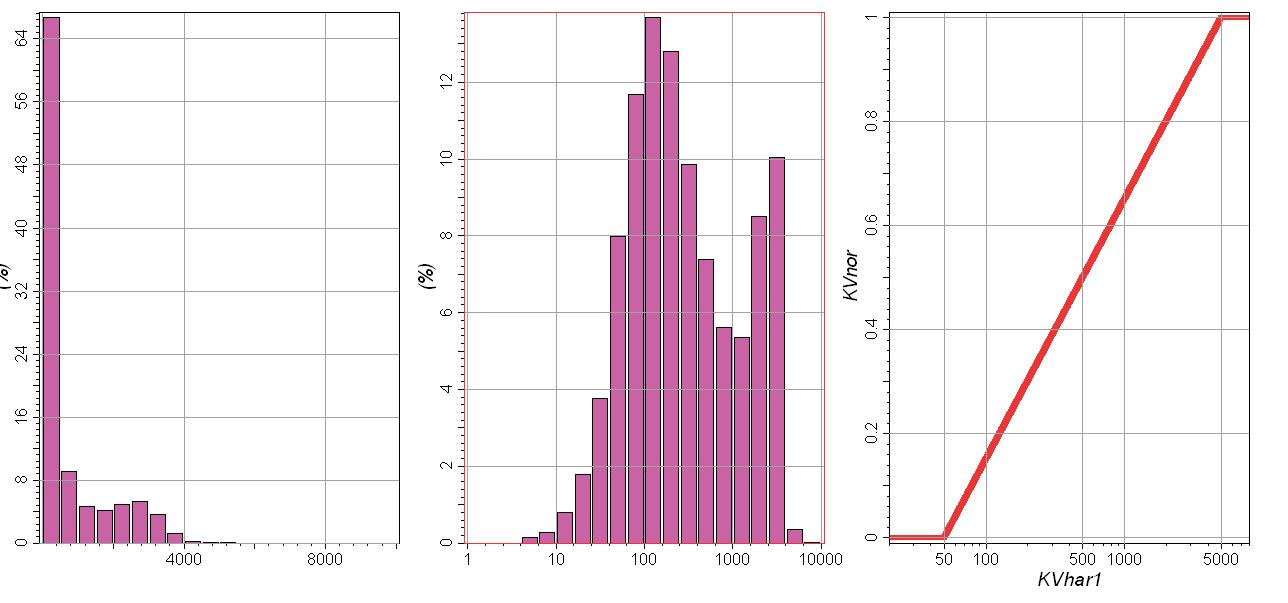
D. PERMEABILIT y NORMALI z ATION:
The OBIP values are small compared to Kv, normalization will be used for the Kv values with a cut-off of 150-5,000mD.
Kv-normalized = [Log (kv)-log(150)] / [log(5000) – log (150)
E. DISTANCE TO w ELL
Distance to the well is important and needs to be included in the equation. Distance is normalized linearly to [0, 1], with 70m as a cut-off.
F. COMBINING ALL THREE FACTORS:
We have three factors all with values between [0, 1]:
1. Distance to well Dwnor
2. Position relative to well R
3. Normalized KV Kvnor
Because all factors are less than one, the distribution of the product will be pushed toward zero. To be able to distinguish between cells with low factor we lognormalnormalized again this final factor.
• Interval to be normalized [0.0001, 1]
• Normalization equation
Rec =1+Log(Dwnor * R * Kvnor)/4
RqF
The final RQF equation is:
• V = Cell volume
• SW = Water saturation
• = Porosity
• Rec = 1+Log(Dwnor * R * Kvnor)/4
• Dwnor = normalized distance to the well
• R = Ds/Dw
• Kvnor = normalized harmonic mean of Kv
RqF SIMULATION CALIBRATION
The permeability cutoffs are the two values to be calibrated. In our work we start with 50-5,000mD. The 150-5,000mD gave better calibration to an already producing well pair, with 70% correlation with simulation.
wELL ELEVATION
After calibrating the RQF with an already producing well pair the method can be
used for model ranking (see above) or well elevation optimization.
In new SAGD projects elevation is not known, the RQF will be used to optimize the elevation.
• RQF has a good correlation with simulation.
• P50 from the RQF ranking is the highly probable realization.
• The best elevation has the best production rate => best RQF.
Workflow steps:
1. Start with the lowest possible elevation.
2. Calculate RQF for all realization.
3. Determine the P50 RQF.
4. Move the well pair up and go back to step 1.
5. The best elevation is the one with the best P50 RQF.
CONCLUSION
RQF showed a good correlation with simulation results and could be used to solve the time and hardware constraint in any uncertainty analysis. RQF is very fast and can be adjusted quickly.
As example: RQF was performed in 16 hours for:
• 15 million-cell model
• 100 realizations (facies, porosity, and Sw)
• 70 well pairs
• One elevation scenario
Note: This time includes all permeability calculations.
ACKNOw LEDGEMENTS
Richard Y. Shang, Ph.D.
Sr. geologist Husky Energy
Zhaowen Li, Ph.D.
Sr. Reservoir engineer Husky Energy
REFERENCES
Krawchuk, P., Beshry, M.A., Brown, G.A., and Brough, B. 2006. Predicting the flow distribution on Total E&P Canada’s Joslyn project. SPE102159-MS.
McLennan, J.A. and Deitsch, C.V. 2005. Ranking Geostatistical realization by measuring of connectivity. SPE/PS-CIM/CHOA 98168.
McLennan, J.A., Ren, W., Leuangthong, O., and Deutsch, C.V. 2005. Optimization of Well Positions for SAGD. Seventh Annual Report of the Center for Computational Geostatistics.
BIOGRAPH y
Khaled has a Masters in Petroleum Geology from Algeria, and an ongoing distance Masters of petroleum engineering with Herriot Watt university. He has 13 years experience, 11 in Oil and Gas, and 10 working for Schlumberger. Khaled’s main experience is around petrophysics and geo-modeling, where he was involved in many projects in conventional and unconventional reservoirs around the world (Algeria, Tunisia, Saudi Arabia, Kuwait, and Canada.
INFORMATION
There is no charge for the division talk and we welcome non-members of the CSPG. Please bring your lunch. For details or to present a talk in the future, please contact Weishan Ren at (403) 2333428, e-mail: weishan.ren@conocophillips.com.

| by Philip Benham


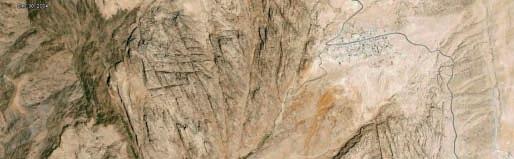
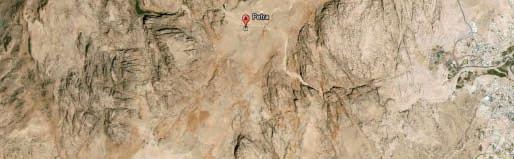
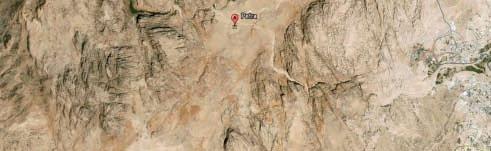
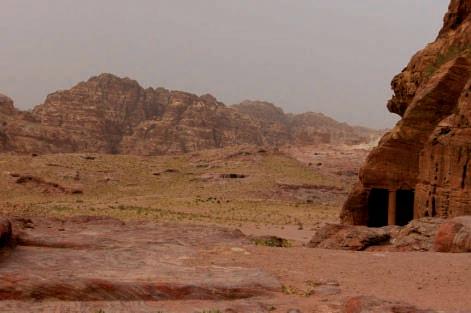
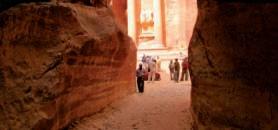
after May 19th, 363 AD when a major earthquake along the Dead Sea fault destroyed buildings and vital water conduits. Locally, the faults and jointing provide planes of weakness and flash floods carved out the narrow entrance (the Siq) to Petra.
R EFERENCE S:
Makhlouf, I.M. and Abed, A.M. 1991. Depositional facies and environments in the Umm Ishrin Sandstone Formation, Dead Sea area, Jordan. Sedimentary Geology, v. 71,
geological interest, email the Reservoir at caitlin.young@ cspg.org for more information.
Trailhead: Drive about 3 hours south of Amman Jordan to the Petra town site on Hwy 35. The trail starts in town and proceeds through the Siq to the ruins (which featured in the movie Indiana Jones and the Last Crusade).
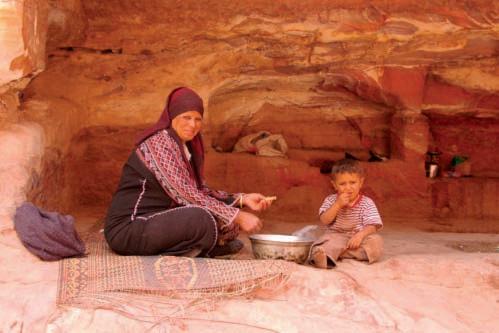
Distance: About 12km return, ignoring the many side excursions you will want to make. Drink lots of water and wear sun protection. If you get tired you can rent a mule from Bedouins still living at the site.
Elevation Gain: <125 m
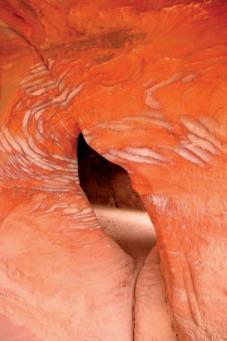
Petra, Jordan, is a UN World Heritage Site and a place where human history is entwined tightly with the geology. Petra was first settled in 1,500 BC and due its central location for trading became the Nabatean capital. The Nabateans controlled the trading routes and therefore the market for gold, precious stones, myrrh, incense, spices, carvings of Today, The quartzose trough cross-beds Rare deposition. in pattern Bands and The Archaeological


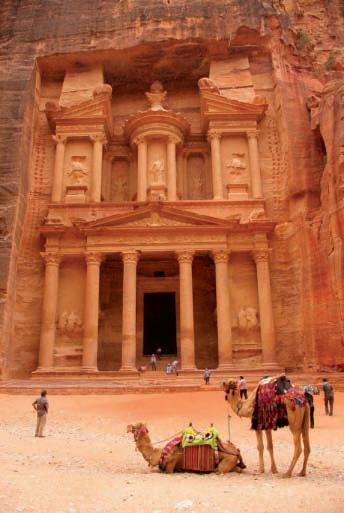


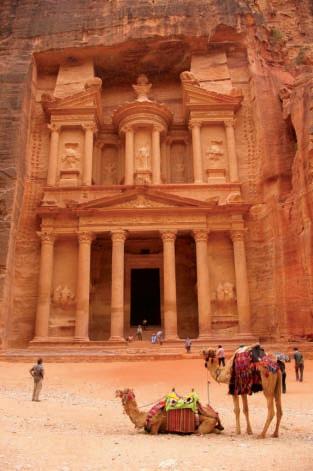
Top Center: The ornate treasury is a single piece of stone.


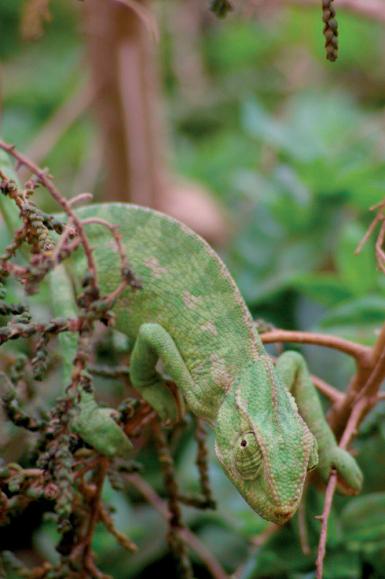
Left: Chameleon in a rare splash of green.
Right: the banding creates a pseudo-sedimentary banding but close inspection does reveal the original fabric.

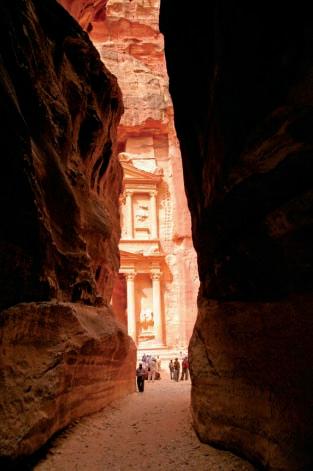
Top Left: The Siq, entrance to Petra and first view of al Khazneh (the Treasury). Water was piped from a spring two km away into the city along a recess carved into the wall of the Siq.
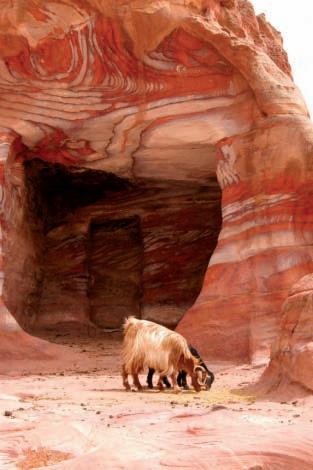
Top Right: Goats graze oblivious to the Liesegang banding in the carved niche behind them.
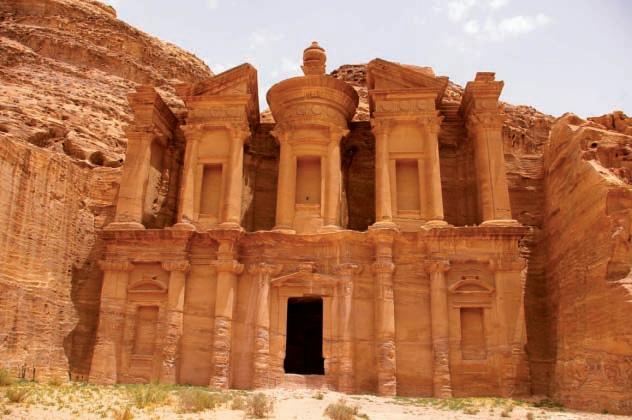
Bottom Left: El Deir. The slope was cut back a great distance to provide sufficient height to this monument.
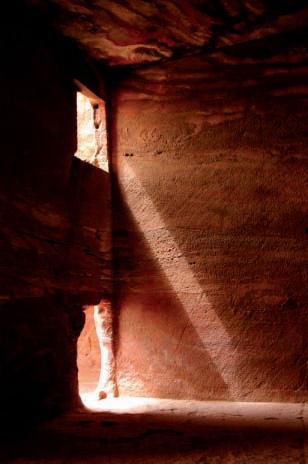
Bottom Right: Shafts of light play across the simple unadorned interior of the tombs.


| By Colin Yeo, P.Geol.
“W HAT yOU dO SPEA kS SO lOUd THAT I CA nnOT HEA r WHAT yOU SAy.”
This quote from American philosopher Ralph Waldo Emerson reminds us that while we politely listen to our CSPG Executives, if we really want to see where our Society is headed, we need to look at the annual budget. The fundamental purpose of our Society is to promote the science of petroleum geology and develop our members professionally. Our
budget should reflect those priorities. When we look at where we have come from and where we are going, we will understand if we are still aligned with our fundamental purpose.
In the winter of 2008 / 2009, the CSPG was facing a significant deficit. Our new Executive Director took immediate action and rather than using the standard top-down, unilateral approach (also called the slash and burn


technique), she empowered Staff to lead the way. And, as usual, our Staff rose to the occasion. Everyone was given a budget and expected to steward to those numbers; every contract was carefully examined, asking critical questions about need and value; staff took over some of the duties and tasks that had been previously contracted out; and, every budget category was put under the microscope looking for waste. The result was a halving of that deficit, which was no small feat considering we were half way through the budget year and also in the depths of a great recession. Despite these draconian cuts, I don’t think our members and volunteers noticed that anything was different with the services they received or the staff support they got. This was a textbook case of increasing efficiencies while maintaining effectiveness.
We ended up fiscal 2009 with a $175,257 loss, half of what had been forecasted six months earlier. This was covered by the sustainability fund that had been built up over earlier years when the Society regularly ran surpluses.
Fiscal 2009 – 2010 was a year of continued rigorous cost control. CSPG renegotiated credit card rates and further streamlined contracts. Staff solicited new members, introduced student membership, and expanded the Technical Luncheon ticket rep program. There were also some missed opportunities for revenue growth. As we all know, you can’t grow member services by cutting costs. However, unaudited estimates project that we will show a modest surplus due primarily to a keen focus on GeoCanada 2010 costs, delivering higher profit levels to the CSPG. What we didn’t do last year was to aggressively solicit for new corporate members and we didn’t expand our efforts significantly in canvassing new sponsors, exhibitors, and advertisers for the Society. Even though it was a difficult year for the petroleum industry, many of our generous benefactors continued to contribute as sponsors because they see value in the services we provide to our members and their employees. We want corporations to join us because the Society’s reputation is enhanced through their membership. For example, when energy advisors and analysts use CSPG publications in their published reports, our reputation for technical excellence is raised. We would love to have those advisors become corporate members. This will be a focus area for 2011.
As we enter a new fiscal year (September 2010 – August 2011),
clearer view of the Society’s finances. Wisely, they have decided to no longer rely on the annual convention to fund ongoing operations but instead will use any convention surplus to fund new technical projects and programs aligned with the mandate of the CSPG. The Executive expects that all programs will fund themselves but we know that sometimes there could be a shortfall. If the program is deemed to be of strategic importance to the members, the first step will be to return the program to profitability by increasing revenue and decreasing expenses but if that is insufficient, then it will be supported by other programs that run a small surplus. The intent is to maximize service to members while staying within an overall affordable budget.
The Executive has identified an additional phenomenon that occurs every five years: a large capital cost expenditure. As we all know, the useful life of computer equipment is about three years (which is why CRA and accounting rules allows an aggressive 55% declining balance depreciation for corporations). This year will see a large cash expense related to IT equipment replacement and updating the membership database and events software. On top of this, leasehold improvements for our office space will require cash. The result will be a capital expenditure spike now but, in Society financial statements, this will be amortized over the next several years. However, the cash is needed now. The Executive is considering budgeting a portion of future major capital expenditures each year so that we don’t have to access the sustainability fund for these episodic cash calls. The Society will now plan financially for at least the next five years.
This budget year’s forecast looks a lot like last year’s. Again, a modest surplus is forecast. What is different this year is that the CSPG will be increasing its revenue by stepping up its drive to seek new individual and corporate members while also soliciting new sponsors, exhibitors, and advertisers. At the same time, it is expected this revenue increase will be offset by expenses related to providing member services and promotional material designed to increase membership. Again, a commitment to living within our means is critical. The benefit will be realized in subsequent years.
There is one initiative the CSPG wants to pursue that might be a loss leader. It is a new, simpler compensation mechanism for short-course and field-trip instructors. This is intended to provide the financial incentive for instructors and consultants to develop new continuing education material that benefits our members. The Executive thinks that this kind of risk is acceptable to our members: the downside is small but the payoff is immense for the professional development of our members.
And, finally, the CSPG has taken on the task of being the “operator” of 2011 CSPG CSEG CWLS convention, Recovery 2011. Each year, either the CSPG or CSEG assumes operatorship. While the Society does not directly benefit from this operatorship (it is mandated to be financially neutral), having daily discussions and help with decision making has already created advantages in how Recovery 2011 will be presented. Many of these benefits will continue over the next three years. Operatorship can become a distraction to ongoing Society activity; therefore, it will take a determined and disciplined Executive and Office Staff to avoid being dragged into the
complex and complicated world of running a large convention.
The Executive and Staff have done a remarkable and highly commendable job in taking a precarious and puzzling financial situation and turning it into a model of financial accountability. The Society now stands on a solid financial foundation for future growth in promoting the science of petroleum geology and developing our members professionally. The Executive’s actions and its words are saying the same thing: multi-year balanced budgets and growth in member services and programs.


| By David Caldwell.
Rule number 1 is before you roast someone you should make sure they are coming to your event. After twenty years of service to the CSPG Mixed Golf Tournament, the committee decided to roast Dick Willott for his hard work and dedication after retiring this past year. Only thing was, Dick was pulled away from the tourney on business for Boyd Petrosearch and no one knew. Way to go Dick! Twenty years and you don’t miss one tourney except for the one where you are going to get roasted. Our huge poster of Dick on Hole 8 almost blew away in the wind but then we should have known that Dick was full of hot air. Here’s to blowing in the wind Dick. Thanks for all the great years.
Despite the poor Calgary weather all summer long this year, we still managed to get in a decent round of golf at the 21st annual CSPG Mixed Golf Tournament this year. The day started out a little cool at about 6-7° Celsius but gradually warmed
up to a balmy 15°, which was better than most days this past summer.
Once again, Lynx Ridge hosted a great tournament and the course conditions were exceptional. This made it easier for more of the hackers out on the course. That is why we are known as the fun tournament although there is still a bit of competitive edge with some teams.
The winning team for gross score was the team of David Caldwell, Jimmy Dowhaniuk, Travis Brookson, and Heather Wright. The winning team for best Net Score was Mike Swain, Victor Verkhogliad, David Cheeseman, and Chad Nelson.
The most honest team this year went to Jim William, Antione Habib, Drue Robinson, and Jill Page.
Thanks again to Canada Brokerlink, who h ave been our tournament sponsor for
all 21 years. Other big sponsors who returned to the event again this year were Tucker Wireline and GLJ Petroleum Consultants. Without big sponsors like these, the tournament would not be the huge success it is. We had the most sponsors ever on Par 3’s this past year as well. IHS sat on Hole 5 and greeted players with drinks and snacks. Roke Technologies and Cougar Consultants had a BBQ and drinks for golfers on Hole 8. On the back nine, Sensor Geophysical served warm beverages for golfers on Hole 12 while AGAT Laboratories had drinks and snacks for golfers on number 17.


Schlumberger was the official scoring system sponsor and posted scores and results at the banquet. CL Consultants sponsored all of the golf carts while Rigsat Gas Detection sponsored the Driving Range. Exova once again stepped forward to sponsor the breakfast while MJ Systems helped co-sponsor the banquet meal. Energy Navigator and AJM Petroleum Consultants helped round out the rest of the Silver level sponsors.
A huge thanks to the Golf Committee for helping out with their time and efforts again this year. Assisting as Chairpersons were Brenda Pearson from Birchcliff Energy and David Caldwell from Command Equipment. Hugh Wishart from Arawak Energy created all of the signs for the tournament although he was a no-show again this year due to his work travel. Sure Hugh!
Penny Christensen organized all of the prizes for every hole competition, teams, and random prize giveaways. Norm Hopkins bought all of the trophies for each winning team. Darin Brazel from IHS Energy Systems and Matt Burns from Energy Navigator helped out tremendously with the sponsorship drive. Thanks to Dayna Rhoads at the CSPG office for being instrumental in helping out the committee with registration and anything else we needed.
Hope to see everyone again next year. It was sold out again this year, so make sure you register early.
The CSPG and tournament participants would like to thank:
PLATINUM SPONSOR
SPONSORS


| By R. J. Spencer1,3 , P. K. Pedersen1, C. R. Clarkson1, R. Aguilera2
1 Department of Geoscience, University of Calgary, 2
Marine-shale-dominated units are commonly perceived to be relatively heterogeneous deposits characterized by very gradual lateral and vertical changes in sedimentary facies, organic content, geochemistry, rock strength, etc. However, the petroleum industry’s drastic increase in exploration for hydrocarbons within shale-dominated successions has spurred a multitude of studies on shales. These studies are dramatically changing our understanding of shale depositional processes, strata architecture, fabric variations, etc.
We review some of the new research on heterogeneity of shale-dominated successions and the variations in shale fabric in this article. Shale fabric not only influences porosity and permeability but also has a major control on the “fracability” of shale-dominated rocks. Natural and induced fracture development is not only controlled by the rock strength of the matrix but also by bedding characteristics, i.e., bed thickness and bed continuity.
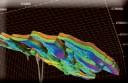
Shales are often assumed to be characterized by layer-cake stratigraphic architecture, reflecting deposition as flat-lying units. However, some shale-dominated successions are characterized by shoreline-detached large-scale, low-angled, sigmoidal clinoform architectures. As these clinoforms typically have dips of much less than a degree, they can only be revealed on long seismic sections or well-log cross-sections, which commonly need to be more than 50km long and oriented in a depositional dip direction. Shale-dominated successions characterized by clinoforms often display a complex threedimensional distribution of sedimentary facies and shale/mudstone reservoir facies of thinbedded silt beds, organic rich units, etc. Within such deposits, shale gas fairways are controlled by the clinoforms, as documented for the Medicine Hat sandstones (Nielsen, 2002), and Milk River Formation (Pedersen, 2003). The latter example is shown in Figure 1, where the location of gas-charged and permeable thin silt and very fine-grained sandstone beds and laminae are controlled by the landward onlap of these reservoir facies onto a slightly older clinoform. Although the Milk River and Medicine Hat both host shallow gas accumulations in southern
Department of Chemical
and Petroleum engineering, University of Calgary 3 Alberta Innovates Technology Futures
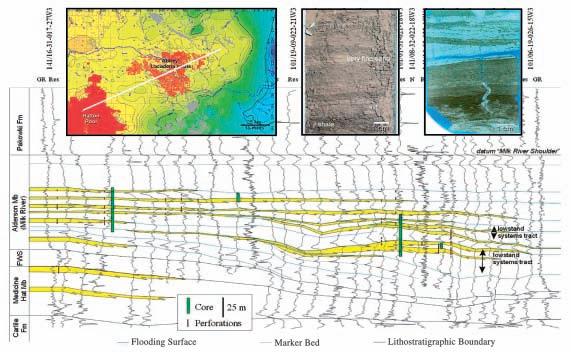
Figure 1. Well-log cross-section showing the stratigraphic control by clinoforms on the location of reservoir facies and seals within the mudstone-dominated distal part of the Milk River Formation at the Abby-Lacadena Pool in southwestern Saskatchewan. Note how the landward onlap of the lower clinoform (lowstand systems tract) demarcates the southwestern boundary of the gas accumulation, and how the pool is located on a structural high (see insert map in top right corner). Core photo and thin section illustrate the thin siltstone and very finegrained sandstone beds and laminae forming the main flow pathways for gas within this overall low permeability, mudstone-dominated succession. Modified from Pedersen (2003).
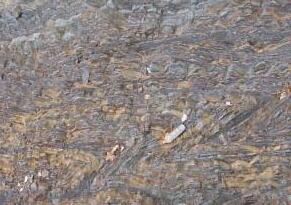
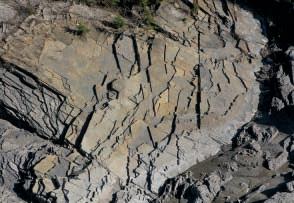
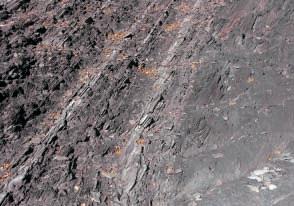
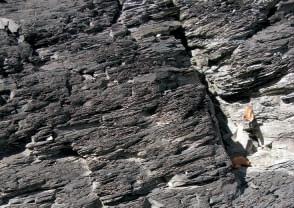
Figure 2. Outcrop photos illustrate the strong control of sedimentary fabric, especially bed thickness, on the development of natural fractures in Cretaceous Colorado Group shales within the triangle zone of the southern Alberta Foothills. A) tightly folded shale succession displaying an increase in bed-perpendicular fracture spacing with increase in thickness of interbedded siltstone and very fine-grained sandstone beds; B) bedding plane view of 10cm-thick very fine-grained sandstone beds displaying 30-60cm fracture spacing; C) contrasting vertical fracture development between the shale-dominated facies in right part of the photo characterized by relatively small discontinuous fractures and the well developed vertical fractures within the overlying succession with interbedded siltstone and very fine grained sandstone beds; D) close-up view of the small and often slightly conical fractures within the organic-rich shale-dominated facies of Figure 2C. Photos courtesy of P.K. Pedersen.
Alberta and Saskatchewan charged by biogenic-generated gas, the reservoir facies of these two formations are very similar to several deep shale gas plays such as the Montney shale gas play in northeastern British Columbia. Similar shale and mudstone clinoforms are also recognized within both recent and ancient sediments (e.g., Asquith, 1970; Cattaneo et al., 2004; Leithold, 1993; Potma et al., 2001).
Shale fabric not only influences the fracability of a shale unit, but also the matrix permeability through which the gas will have to migrate to get to the natural fractures or induced hydrologic fractures (Bustin and Bustin, 2008). In some cases gas migration occurs through interbedded thin sandstone and siltstone beds or bioclast beds/laminae with higher permeability. As in conventional sandstone reservoirs, the main factor influencing the primary transport mechanisms of the sediments and subsequent biological and diagenetic processes is the shale fabric. Shale-dominated successions are often perceived to be deposited from suspension processes. However, recent research has shown that shale might also be deposited as bedload (e.g., mudstone ripples – Schieber and Southard, 2009). Bhattacharya and MacEachern (2009) proposed that a large proportion of shelf mudstones of the Cretaceous Interior Seaway were deposited by hyperpycnal flows. Primary depositional processes likely have a large influence on the formation and preservation of phyllosilicate pores within shales and mudstones. This has been documented in some shales to constitute a larger proportion of the porosity than the porosity associated with organic matter and carbonate dissolution (Schieber, 2010). Depositional processes also have a direct influence on bed and laminae thickness, which in turn exert a strong control on the fracture spacing and ability of fractures
to propagate vertically, as is observed in outcrops in the Foothills (Figure 2).
Compared to sandstones, shales and mudstones commonly have a much larger proportion of components formed within the water mass from which they were deposited (e.g., carbonates, silica, phosphate, and organic matter) relative to detrital components derived from the surrounding landmasses. Thus, shales and mudstones are often characterized by significant vertical changes in composition on millimeter- to meter-scale, which might be controlled by oceanographic controls such as water circulation or climate, rather than changes in water depths. In addition, primary compositional variations are overprinted by early to late diagenetic processes, which often cause significant changes in shale mineralogy and fabric and might obscure the origin of some of the shale components. For example, within siliceous shales (such as the Barnett Shale), the silica has been argued to have originated both as detrital grains or from re-crystallized radiolarians. A differentiation between these two origins of the silica is highly important for mapping the shale gas fairways of the brittle siliceous shales.
x-Ray Diffraction ( xRD) analyses appear to be the most common means employed to determine the mineral composition of shale. These are difficult analyses to perform and the results obtained should be scrutinized carefully. Our experience is that the amount of quartz tends to be overestimated and the amount of clay underestimated in many shale samples analyzed by standard xRD techniques. We also find that determination of which clay minerals are present and in what amounts is difficult. Results can vary from one laboratory to another.
Standard thin-section petrography using transmitted light microscopy, a technique that most geologists are familiar with for examining sandstones and carbonates, is difficult to employ in determining the composition of many shale samples. The constituent grains that make up the bulk of the sample are just too small to resolve and most of the clay minerals have very similar optical properties. Organic matter also tends to prevent visible light from being transmitted through the sample, especially in organic-rich shale.
(Continued on page 28...)
(...Continued from page 27)
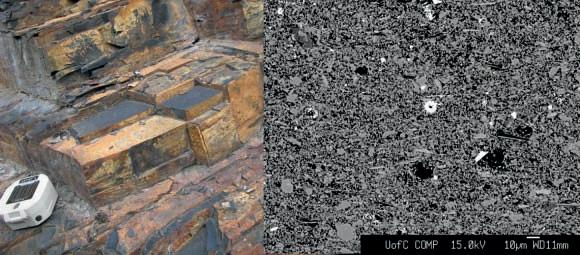
We have had success using polished thin sections examined with a scanning electron microscope (SEM). SEM thin-section petrography allows much higher magnification of the sample and allows geologists to use the same logic and standard techniques employed for examining sandstones and carbonates to interpret shale samples. More importantly, quantitative and semi-quantitative analytical techniques allow compositional information to be obtained in the context of the petrography.
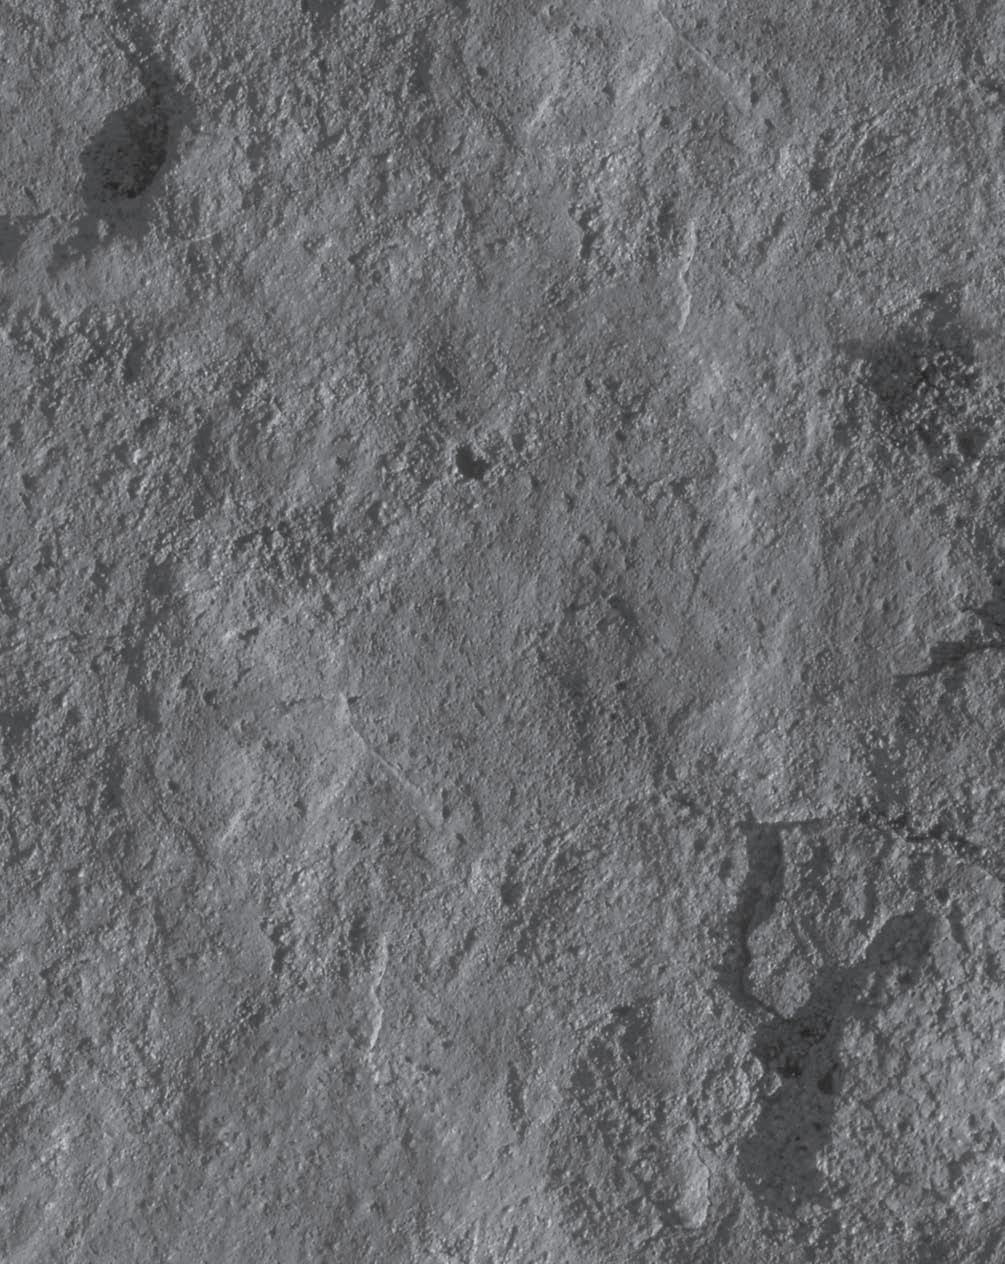
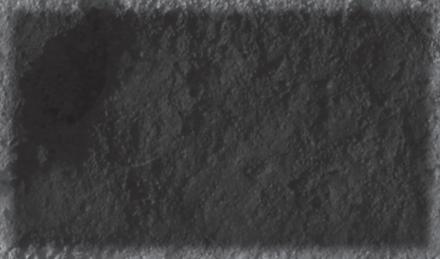
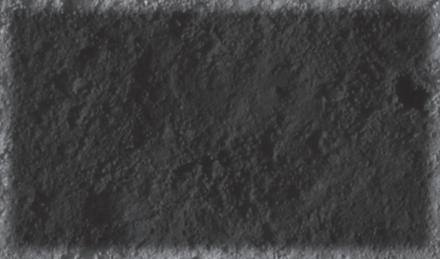
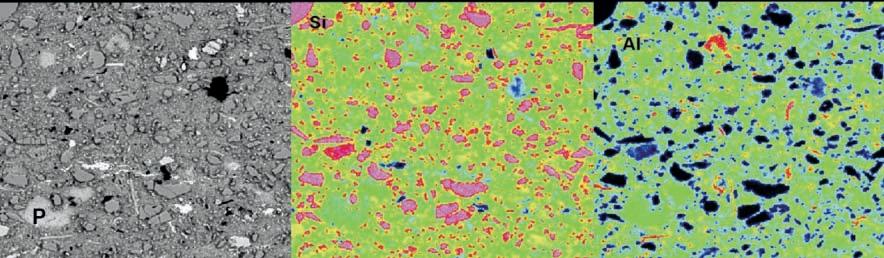
We show an SEM image and electron microprobe element maps in Figure 3 (page
27) to illustrate this point. This sample was analyzed by standard xRD techniques and yielded a quartz content of nearly 40 %, 45% clay, and 15% other minerals (mostly feldspars). SEM analyses of a wider area than that shown in Figure 1 indicate less than 15% quartz, nearly 80% clay and less than 10% other minerals. Further, the SEM analyses show that the quartz and feldspars are present as irregular silt-sized grains in a finer matrix. SEM analyses also reveals that at least some of the clay was deposited as silt-sized aggregates, such as the lighter-colored grain labeled “P” on the backscatter image in Figure 3 (there are a number of other siltsized aggregates in this sample). Therefore,
SEM thin-section petrography not only yields compositional information about the sample, but also places this in the context of the petrography and allows information on the rock fabric to be obtained.
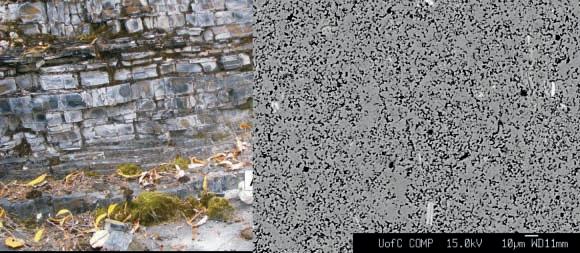
Very little has been published on rock fabrics of shale; however, we feel that rock fabrics are likely more important in many instances than mineralogy in determining the mechanical and flow properties of shale. Two samples from the Besa River Formation shale are used to illustrate the point. Both samples contain more than 90% quartz and less than 10% clay (primarily illite) with less than 1% other minerals (mostly pyrite).
The first sample is quite fissile. This sample parts in blocky plates up to several cm across ranging in thickness from a few centimetres to less than a millimeter as shown in the outcrop photograph on the left side of Figure 4 (page 27). The SEM image of a polished thin section on the right side of Figure 4 displays a classic detrital fabric; silt-sized quartz (up to 20 microns in diameter) and illite (thin elongate grains 10 to 25 microns in length) are present in a finer (micron-scale) quartz matrix. This sample also contains about 7% (by weight) organic carbon and has less than 5% porosity.
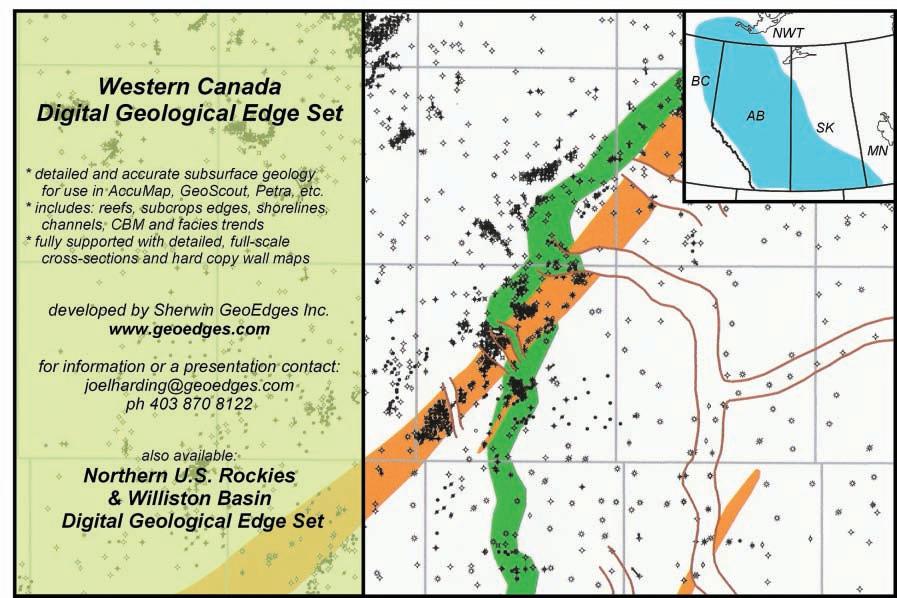
The second sample has a very different appearance in the field (compare the outcrop photographs in Figures 4 and 5). This sample breaks into irregular chunks a few centimetres on a side and several centimeters thick (along bedding). The sample behavior is more reminiscent of chert than shale. The SEM image of a polished thin section on the right side of Figure 5 displays a cemented or welded fabric. Silt-sized quartz and the finer quartz matrix are overgrown and “welded” together by quartz. This sample has a lower organic carbon content (about 2.5% by weight), but a similar porosity to the sample shown in Figure 4.
Although these two samples have nearly identical mineral compositions and similar porosities they are quite different. The fracture patterns developed in the field are an indication of their very different mechanical properties. Laboratory experiments also show they behave differently on crushing. The two samples shown exhibit different stress-strain relationships under load and give different acoustic signals as they break (preliminary experiments performed at Alberta Innovates Technology Futures as part the demonstration phase of a Joint Industry Project on analyses of shale using cuttings). They are also likely to behave differently during hydrological fracture treatments in the subsurface. Although they have similar porosities, the pore networks have very different geometries. Therefore we also expect that the flow characteristics of these will differ.
ACKNOwLEDGEMENTS
Parts of the work presented in this series were funded by the NSERC, AERI, ConocoPhillips, EnCana, Nexen, ExxonMobil, Lundin, and the University of Calgary. Thin sections in Figure 1 were provided by Husky Energy. Their contributions are gratefully acknowledged.
Asquith D.O. 1970. Depositional topography and major marine environments, Late Cretaceous, Wyoming. AAPG Bulletin, v. 54, p. 1184-1224.
Bhattacharya, J.P. and MacEachern J.A. 2009. Hyperpycnal rivers and prodeltaic shelves in the Cretaceous seaway of North America: Journal of Sedimentary Research, v. 79, p. 184-209.
Bustin, A.M.M. and Bustin, R.M. 2008. Importance of Fabric on the Production of Gas Shales. SPE Paper 114167.
Cattaneo, A., Trincardi, F., Langone, L., Asioli, A., and P. Puig. 2004. Clinoform generation on Mediterranean Margins. Oceanography, v. 17, no. 4.
Leithold, E.L, 1993. Preservation of laminated shale in ancient clinoforms; comparison to modern sub-aqueous deltas. Geology, v.21, p. 359-362.
Nielsen, K.S. 2002. Lithostratigraphy, sequence stratigraphy and paleoenvironments of the Upper Colorado Group in southern Alberta and southwestern Saskatchewan: definition of the Carlile and Niobrara formations (Upper Turonian to Upper Santonian). PhD. Thesis, Carleton University, Ottawa, Canada.
Pedersen, P.K. 2003. Stratigraphic relationship of Alderson (Milk River) strata between the Hatton and Abbey-Lacadena Pools, southwestern Saskatchewan – preliminary observations. In: Summary of Investigations 2003, Volume 1, Saskatchewan Geological Survey, Sask. Industry Resources, Misc. Rep. 2003-4.1, CD-ROM, Paper A-11, 11p.
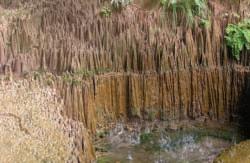
Potma, K., Weissenberger, J.A.W., Wong. P.K., and Gilhooly, M.G. 2001. Toward a sequence stratigraphic framework for the Frasnian of the Western Canada Basin. Canadian Society of Petroleum Geologists, Bulletin of Canadian Petroleum Geology, v. 49, no. 1, p. 37-85.
Schieber, J., and Southard J.B. 2009. Bedload transport of mud by floccule ripples – direct observation of ripple migration processes and their implications. Geology, v. 37, p. 483-486.
Schieber, J. 2010. Common themes in the formation and preservation of intrinsic porosity in shales and mudstones – illustrated with examples across the Phanerozoic. SPE paper 114167.


And join thousands of industry professionals at this year’s recovery
2011 convention May 9 - 13, 2011 at the Calgary TELUS Convention Centre.
• Submit your abstract for oral presentation, poster presentation or core presentation
• Increase your company’s brand visibility among thousands of industry professionals - sponsor or advertise in our official publications
• Bring your company to the show floor. Space is limited, so book now.
• Earn up to 6 PDH credits each day you attend
• Re-connect with friends, meet new contacts and take advantage of the opportunity to network with industry professionals at various social events including Luncheons and the Core Meltdown


Produced by:


• 2D, 3D and 4D processing
• Multi-component processing
• PP and PS modeling
• PP and PS registration
• Joint PP and PS inversion
• Stochastic inversion
• AVO/LMR analysis
• Fracture detection


www.sensorgeo.com

| By E. R. (Ross) Crain, P.Eng.
Unicorns are beautiful, mythical beasts, much sought after by us mere mortals. The same is true of petrophysical models for unconventional reservoirs. This is the first in a series of review articles outlining the simple beauty of some practical methods for log analysis of the unusual.
Organic carbon or kerogen content is usually associated with shales or silty shales, and is an indicator of potential hydrocarbon source rocks. Organic material can be subdivided into a number of types representing the source of the material (Figure 1).
Organic content in gas shales is usually Type II, as opposed to coals, which contain mostly Type III. There is usually a strong correlation between TOC and adsorbed gas in gas shales. TOC correlations with gas content are sometimes used to predict specific gas content (Gc) instead of using detailed calculations with sorption curves.
High resistivity with some apparent porosity on a log analysis is a good indicator of organic content.
Correlation of core TOC values to log data leads to useful relationships for specific reservoirs. The one shown in Figure 2 is for the Barnett shale. A strong correlation exists in some shales with uranium content from the spectral gamma ray log. In other cases, the relationship is made with density, resistivity, sonic, gamma ray, or combinations of these curves.
Visual analysis for organic content is based on the porosity - resistivity overlay technique, widely used to locate possible hydrocarbon shows in conventional log analysis. By extending the method to radioactive zones instead of relatively clean zones, organic-rich shales (potential source rocks, gas shales, oil shales) can be identified. Usually the sonic log is used as the porosity indicator but the neutron or density log would work as well.
The trick here is to align the sonic log on top of the logarithmic scale resistivity log so that the sonic curve lies on top of the resistivity curve in the low-resistivity shales. Low-resistivity shales are considered to be non-source rocks and are unlikely to
Maceral Kerogen Type Original Organic Matter
Alginite I
Exinite II
Cutinite II
Resinite II
Liptinite II
Vitrinite III
Inertinite IV
Fresh-water algae
Pollen, spores
Land-plant cuticle
Land-plant resins
All land-plant lipids; marine algae
Woody and cellulosic material from land plants
Charcoal; highly oxidized or reworked material of any origin
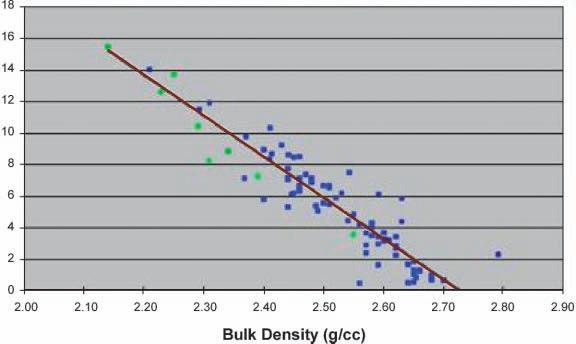
be gas shales. Shales or silts with source-rock potential will show considerable crossover between the sonic and resistivity curves (shaded red in Figures 3 and 4 on page 32).
The absolute value of the sonic and resistivity in the low-resistivity shale are called baselines, and these base-lines will vary with depth of burial and geologic age.
Crossplots of porosity and resistivity (logarithmic) curves can also be used to define and segregate source rocks from non-source rocks (see “Identification of Source Rocks on Wireline Logs by Density-Resistivity and Sonic-Resistivity Crossplots”, by B. L. Meyer and M. H. Nederlof, AAPG Bulletin, v. 68, p. 121-129, 1984). The best description of the method is posted on the online magazine
Search and Discovery, in “Direct Method for Determining Organic Shale Potential from Porosity and Resistivity Logs to Identify Possible Resource Plays” by Thomas Bowman, Article #110128, posted June 14, 2010 (Figures 3 through 6 are from this reference).
These crossplots usually show a non-sourcerock trend line (Figure 5, page 32) on the southwest edge of the data (similar to the water line on a Pickett plot) and a cluster of source-rock data to the right of the nonsource line, as shown in Figure 5. The slope and intercept of the non-source line is used to calculate a pseudo-sonic log, DtR, from the resistivity log, which can then be plotted on the same scale as the original sonic log (Figure 6, page 32).
(Continued on page 32...)
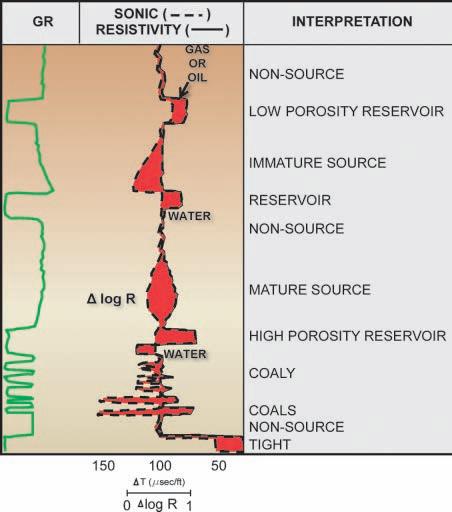
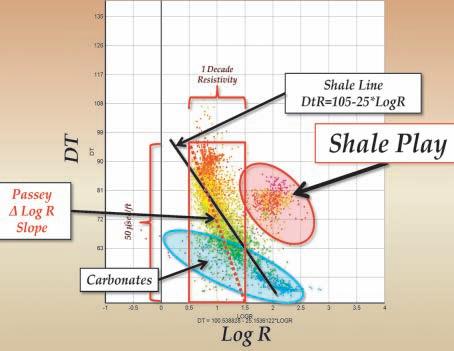
for this Barnett Shale example.
(...Continued from page 31)
As for the manual overlay technique described above, crossover indicates sourcerock potential, shale gas, or an oil shale, or if the zone is clean, a potential conventional hydrocarbon pay zone.
Various methods for quantifying organic content from well logs have been published. The most common method is based on sonic
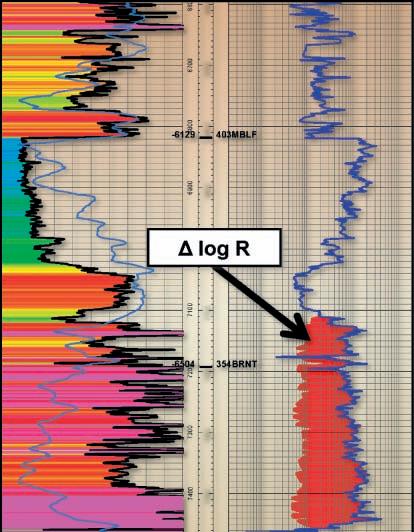
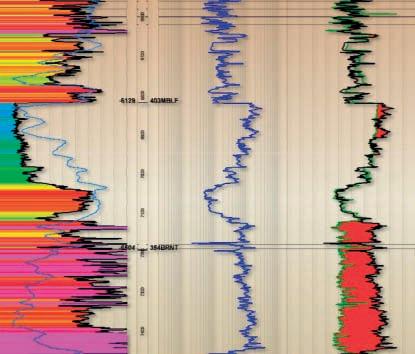
versus resistivity. The method has been revised and modified by others. It is also known as the “D log R” method (with or without spaces and hyphens between the characters). The “D” was originally the Greek letter Delta (logR). See “A Practical Model for Organic Richness from Porosity and Resistivity Logs” by Q. R. Passey, S. Creaney, J. B. Kulla, F. J. Moretti, and J. D. Stroud, AAPG Bulletin, v. 74, p. 17771794, 1990. The basic equations of the Passey model are:
1. DlogR = log (RESD / RESDbase) + 0.02 * (DTC – DTCbase)
2. Wtoc = DLogR * 10^(0.297 – 0.1688 * LOM)
3. WT%toc = 100 * Wtoc
Where:
RESD = deep resistivity in any zone (ohm-m)
RESDbase = deep resistivity baseline in non-source rock (ohm-m)
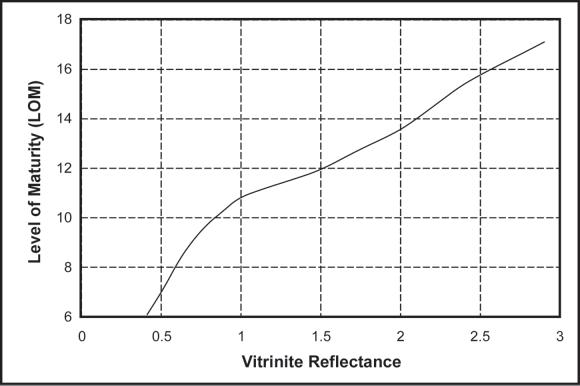
Figure 7. Graph for finding Level of Organic Maturity from Vitrinite Reflectance. Higher LOM reduces calculated TOC. Some petrophysicists do not believe this chart, and use regression techniques on measured TOC to estimate LOM - see Figure 11 for an example.
DTC = compressional; sonic log reading in any zone (μsec/ft)
DTCbase = Sonic baseline in non-source rock (μsec/ft)
DlogR = Passey’s number (fractional)
LOM = level of organic maturity (unitless)
Wtoc = total organic carbon (weight fraction)
WT%toc = total organic carbon (weight percent)
Divide metric DTC values by 3.281 to get μsec/ft. DTC and DTCbase can be replaced with DENS (g/cc) and PHIN (fractional) values, with a corresponding change in the constant (+0.02) to -2.5 for DENS and +4.0 for PHIN. Density of TOC is about 0.94 to 0.98 g/cc.
Numerical Example:
DlogR = 1.556 1.546 1.556
Wtoc = 0.1130.1130.113
In practice, it is rare to have both TOC laboratory measurements and reliable organic maturity data to assist in calibration. Chose a value for LOM that will result in a match with available TOC data. Vitrinite reflectance (Ro) values may be available and are converted to LOM with the graph in Figure 7. LOM is typically in the range of 6 to 12 but could be as low as 4.
ISSLER’S METHOD
Dale Issler published a model specifically tuned to Western Canada in “Organic
Carbon Content Determined from Well Logs: Examples from Cretaceous Sediments of Western Canada” by Dale Issler, Kezhen Hu, John Bloch, and John Katsube, GSC Open File 4362. It is based on density vs. resistivity and sonic vs. resistivity crossplots (other methods are also described in the above paper).
The crossplots were redrafted in Excel, as shown in Figures 8 and 9 (page 34), and a drop-through code developed to generate TOC (Figure 10, page 34), based on the lines on the graphs. No doubt there is a simpler way to code this, but I didn’t have time to sort it out. A spreadsheet is available free from my website at www.spec2000.net that will do the math for you. An example from Issler’s paper of the sonic resistivity method and Passey’s Dlog R method are shown in Figure 11 (page 34).
TOC calculated from DTC vs RESD crossplot is most easily done by a series of IF statements. This can be coded into a spreadsheet or software package that allows user-defined equations. Note that sonic and density data are in metric units. You can download a spreadsheet from my website at www.spec2000.net/00-downloads.htm
Numerical Example:
Wtoc (RESD-DTC crossplot) = 0.11 weight fraction
Wtoc (RESD-DENS crossplot) = 0.10 weight fraction
(Continued on page 34...)
Use our innovative Petrel™ plugins to optimize and increase your efficiency.
New features include:
• Petrel project trawler scanning your discs for Petrel projects
• Seismic amplitude balancing
• Dip indicator display in the interpretation window
• Multi SEGY export of seismic surveys and folders

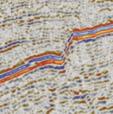
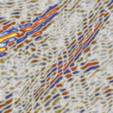
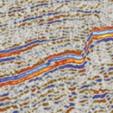
more at www.blueback-reservoir.com sales@blueback-reservoir.com +1 403 538 4821
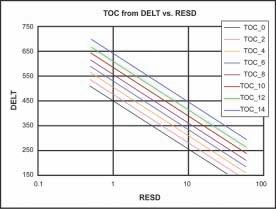
8.
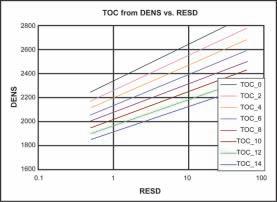
(...Continued from page 33)
E. R. (Ross) Crain, P.Eng. is a Consulting Petrophysicist and a Professional Engineer with over 45 years of experience in reservoir description, petrophysical analysis, and management. He has been a specialist in the integration of well log analysis and petrophysics with geophysical, geological, engineering, and simulation phases of oil and gas exploration and exploitation, with widespread Canadian and Overseas experience.
His textbook, “Crain’s Petrophysical Handbook on CD-ROM” is widely used as a reference to practical log analysis. Mr. Crain is an Honourary Member and Past President of the Canadian Well Logging Society (CWLS), a Member of Society of Petrophysicists and Well Log Analysts (SPWLA), and a Registered Professional Engineer with the Association of Professional Engineers, Geologists, and Geophysicists of Alberta (APEGGA).
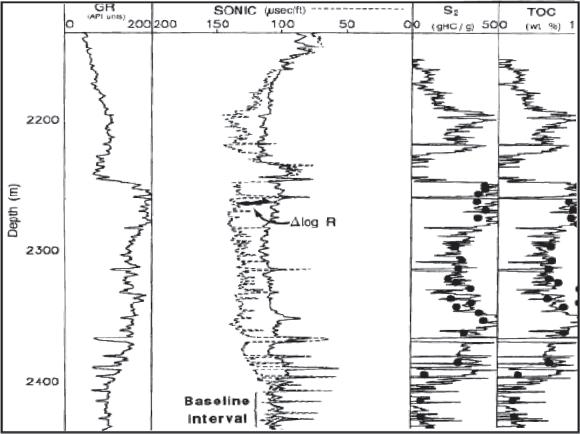
10. TOC calculated from Passey DlogR Method. The sonic resistivity overlay is shown in Track 2. Sonic is a dashed line, resistivity is solid line on a scale of 0.01 to 100 ohm-m. TOC is from Passey equation. There are numerous published examples with much worse correlations between calculated and measured TOC, usually attributed to varying proportions of Type I, II, and III kerogen or mineral variations (calcite, dolomite, pyrite, and quartz) in the shale (Halliburton example).

Figure 11. A comparison of the DlogR method with the Issler model. Both methods use sonic and resistivity logs to calculate the depth variation in TOC. Red dots represent measured TOC analyzed on ore samples using a Rock-Eval 2 instrument; blue dots represent re-analyses of the same samples using a Rock-Eval 6 instrument. For the Issler model, results are presented for both empirical (blue) and Archie (green) resistivity porosity methods. The DlogR method gives poor results for this well when observed thermal maturity is used (LOM = 5.0) An LOM value of 6.9 provides a good fit to the data but it is not representative of the true LOM (see right hand log track). Illustration from Issler’s paper.
| By Dave Hills, Geological Calendar Chair
With this November issue of the reservoir you will be receiving your copy of the CSPG’s 2011 Geological Calendar, proudly distributed free to our members. Once again, the calendar has been filled with stunning images from around the globe, illustrating geology as seen by our members. Among the highlights this year, vividly coloured Devonian sandstones from Western Australia’s Bungle Bungle Range. This shot by Rhea Karvonen shows distinctive beehive-shaped domes that were first seen by western eyes only in the 1980s. Geological splendour of Newfoundland’s rugged coast is illustrated with a photo of the near vertically dipping Rencontre Formation of Grand Banks by Erlangga Septama. And, the small scale is brought large in Markus Ebner’s image of a trilobite fossil preserved for half-a-billion years in the Burgess Shale in British Columbia.
As with previous years, the same panel of judges that selects the 12 images for publication also chose the winners of our photo contest for the ‘Best Photo’, and for this year, ‘Best Macro Photo’. Winner of the

‘Best Photo’ goes to Michael Lam for his stunning shot of the Giant’s Causeway in County Antrim, Ireland. This long exposure coastal shot of some of the 40,000 massive black basaltic columns was chosen for its stunning imagery and significant geological interest. For the ‘Best Macro Photo’, Hamid Farid wins for his portrayal of the Exshaw shale. Shot at a high angle with good use of depth of field, Hamid was able to capture the range of oxidation colours that are present on this exposed surface found along Jura Creek near Canmore, Alberta.
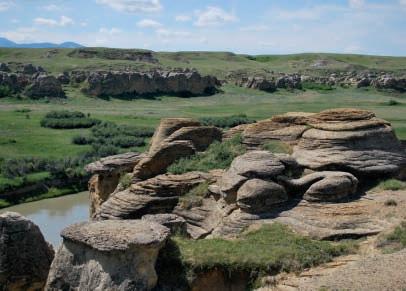

Congratulations to both Michael and Hamid, who will both receive prize money of $200. Also, congratulations to our other photographers whose photos made it into the calendar, all of which will be available on the CSPG website as downloadable wallpapers.
I would like to thank everyone who sent photos for submission to this year’s calendar, and if you were unsuccessful, please have
another go next year. Thanks also to Shannon Acton, Adam Westlake, Don Yep, Erin Linley, Derrick Budden, Justine Sagan, Aaron Grimeau, Markus Ebner, Jorge Marzetti, Andrea Currie, and Mark Dzikowski for lending their geological and photographic knowledge to the judging panel and making this year’s selection process as enjoyable as ever.
And finally, thanks to Heather, Alyssa, and Caitlin for their fantastic efforts at the CSPG office.

Dates: Every second and fourth Thursday each month from September – December, 2010
Time: 8:00 – 17:00
Instructor: Dr. Greg Hu, Loring Tarcore Labs Ltd.
Fees: $375 + 5% GST, including, lunches, materials, use of computer and core logging software
Location: Loring Tarcore Labs Ltd., Bay 2 – 666 Goddard Ave NE, Calgary
This one-day short course is refined and shorten from a popular, in-house workshop that is offered to some oil sands companies. It emphasizes “hand-on” and “practical”. Any one will find it informative, inspiring, and practical: whether you are a geological adviser, project geologist, or core logging geologist.
Typical depth markers: marker types and their core and log expressions
Principles of core depth correction
Common oil sands facies and their core and log signatures
Identification of common ichnofacies on core and their significance in facies interpreation
Wabiskaw-McMurray Stratigraphy and their depositional model evolution
Common core sample types for lab testings and general sample selection guidelines
Core depth correction: core-based vs image-based with software assistance
For more information and registration, please call 403-874-4588 or visit: http://www.tarcore.com/training/
Platinum Sponsors
Thank you to the generous sponsors of the 22nd Annual 2010 CSPG/CSEG
Thank You to the generous sponsors of the 22nd Annual 2010 CSPG/CSEG
10K & 5K Road Race and Fun Run
10K & 5 K Road Race and Fun Run Platinum


Gold Sponsors
Gold Sponsors

Silver Sponsors
Bronze Sponsors


| By Mike Cardell
With the leaves falling from the trees the annual CSPG/CSEG Road Race and Fun Run took place on a blustery September 15th afternoon. The temperature was perfect for running, and a very enthusiastic and hardy crowd of 170 runners dashed from the start line. This year marked our 3nd year for the 5K, and again we saw an increase in participants to 51 runners. Both 5 and 10 km racers had to maneuver through the construction detours for the new Peace Bridge, and I know our race monitors, decked out in new safety vests, helped the runners negotiate the route. Again this year, to assist the runners, distances were uniquely marked in geologic time. Like every year, it’s great to see a mix of competitive and first-time runners. Winning Time provided chip timing, which makes the finish line volunteering easier and timing more precise. We tested a new venue for the post race awards party and have received positive feedback for The Calgary Curling Club, where the mix of racers and volunteers enjoyed plenty of cold beverages and tasty pizza. The evening was topped off with door prizes, awards, and, of course, our now-famous sock toss. Through great sponsorship and strong participation, we were once again able to contribute to the CSPG Educational Trust Fund, and to the YMCA Strong Kids Foundation!
I would like to thank all the volunteers and sponsors who helped make this event a success! Thank you also to all the runners. It was a pleasure cheering you in at the finish line.
This year’s sponsors were: Platinum: IHS, and Gord’s Running Store.
Gold: Earth Signal Processing, Gran Tierra Energy, Paradigm, Sensor Geophysical, and Total E&P Canada Ltd.
Silver: AGAT Laboratories, Belloy Petroleum, CGGVeritas, Divestco, Galleon Energy, Kulczyk Oil Ventures, Perpetual Energy, Pulse Seismic, Regent Resources Ltd., Sigma Exploration, and WesternGeco.
Bronze: Arcis, ARC Resources, Chiropractic Performance and Sports Therapy Centre, CL Consultants, Edge Technologies, Pro Geo Consultants, Scott Land & Lease, and the Eau Claire YMCA.
Finally a huge thank-you to the group of people on the committee that made this all work: Kathy Waters, Jocelyn Frankow, Kathy Taerum, Matt Hall, Greg Hayden, Tim Burk, Mike Cardell, plus Alyssa Middleton and Dayna Rhoads at the
CSPG office. As well, thanks to the staff at the Eau Claire YMCA for their hospitality.
For more information on run times and placement, please see www.winningtime.ca.
Remember to register early next year, to avoid disappointment. We look forward to seeing you next year for the 23rd annual; race date will be September 14, 2011.
| By Jacey Seebach
Four years of hard work and dedication sure goes by fast! In the blink of an eye I graduated with a B.Sc. in Geology from the University of Saskatchewan and, like many before me, set my sights on Calgary’s Petroleum industry. It was only a couple of years ago that I remember watching new graduates being snapped up by companies right off the campus. Unfortunately between then and now the global economy entered a recession and the price of oil and gas fell alongside stock prices. Job opportunities that had seemed so abundant quickly disappeared as capital dried up and the rigs were racked. Nevertheless, I have always wanted to work in this industry and I refused to have my career goals derailed by a type of slow down that the industry has seen many times before. In May of 2010 I headed straight to Calgary in search of a job.
I quickly realized that waiting for job postings to appear on websites not enough; I initiated my search at the annual This experience geologists
on the latest trends in the industry. After the conference I made sure to keep in touch with the professionals I met at the conference and to follow up on any leads they had on companies that might be hiring. I immediately began to receive many emails with lists of people to contact and meet for a coffee. These ‘coffee meetings’ have proven to be a valuable networking tool as I have been accumulating an ever-increasing contact list across a wide variety of companies. In addition to continuing my informal meetings I began to go directly to petroleum companies’ offices in downtown Calgary asking for a chance to meet with their exploration manager or team lead. I asked for the chance to have these appointments to explain that I was not there looking for a high-paying job with lots of benefits; rather any opportunities they had or knew of where I would be given the chance to learn, gain experience, and add value to their company in I could.
or another had experienced what I was going through. I found it was these individuals that were willing to help the most! Since beginning my search, the biggest eye opener for me was the character of the professionals working here and the industry culture. I would never have believed that so many people would take time in their busy schedules to meet with me and refer me on to their colleagues and associates. The good character of these professionals has only increased my desire to become one of them.
While the price of oil has moderately recovered, the price of natural gas has lagged and with it, job opportunities for new grads. I am one of many new grads still looking for a job opportunity and I don’t plan on giving up any time soon. With increasing rig activity and the recent land sales in Alberta and BC it looks as though the job prospects are going to improve. I encourage others to keep contacting people and pound the and a job will come of exciting field, opportunities that petroleum
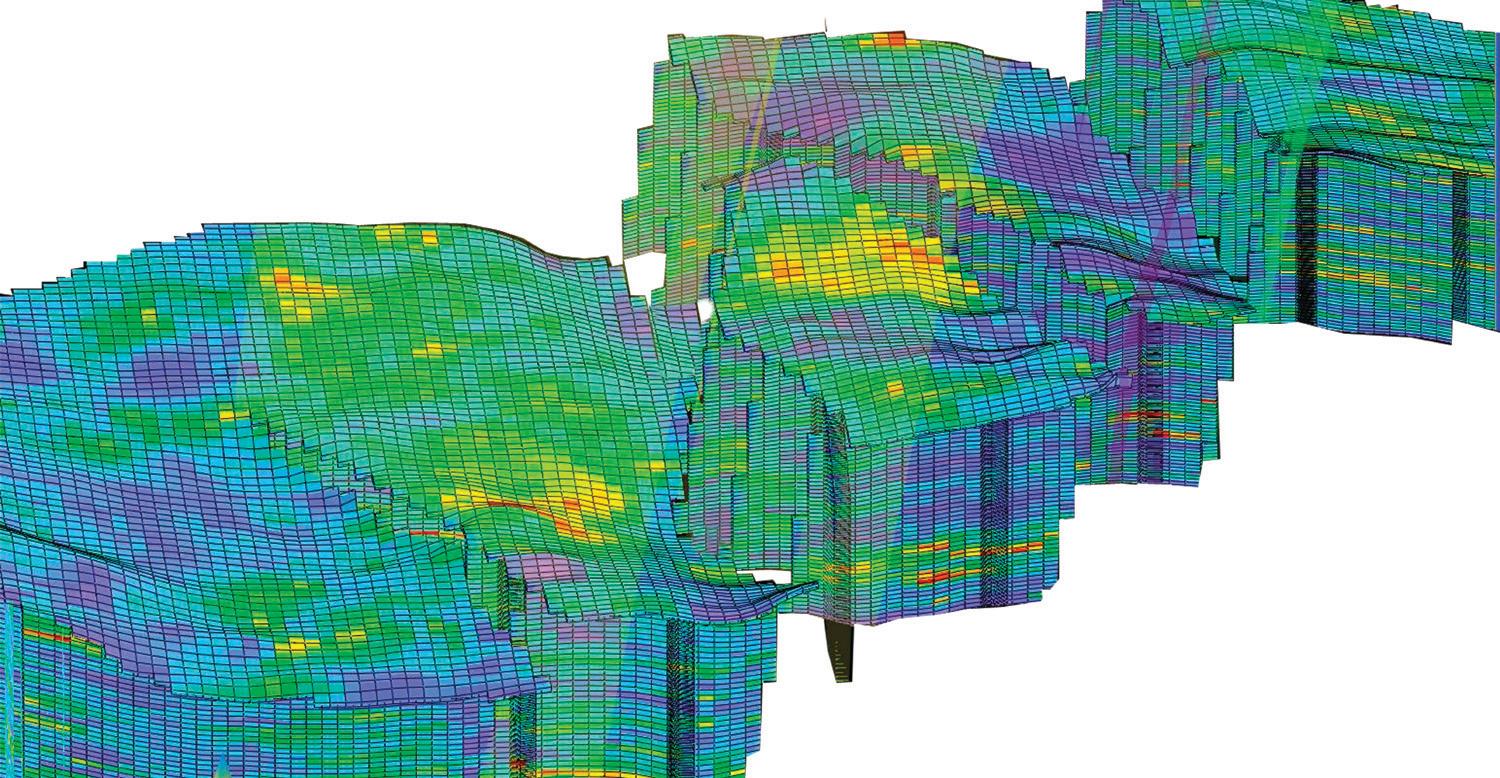


Every unconventional gas project is unique—and mandates a customized, reservoir-specific solution. Around the world, the experts from Halliburton are there when you need them, providing proven solutions along with unequalled customer commitment.
What’s your tight gas challenge?For solutions, go to Halliburton.com/unconventional.