

Looking to maximize opportunities in today’s volatile market?
Combine the power of PETRA® and IHS Critical Information including well and log data to define reservoir parameters and determine new opportunities faster and more cost effectively.
Let IHS information solutions improve your decision-making and reduce your risk.
For more information on PETRA visit us at www.ihs.com/reservoirsolutions


CSPG OFFICE
#600, 640 - 8th Avenue SW Calgary, Alberta, Canada T2P 1G7
Tel: 403-264-5610 Fax: 403-264-5898
Web: www.cspg.org
Office hours: Monday to Friday, 8:30am to 4:00pm
Executive Director: Lis Bjeld
Email: lis.bjeld@cspg.org
Advertising & Sponsorship Coordinator: Alyssa Middleton
Email: alyssa.middleton@cspg.org
Communications Coordinator: Heather Tyminski
Email: heather.tyminski@cspg.org
Member Services Coordinator: Kasandra Klein
Email: kasandra.klein@cspg.org
Registration Coordinator: Dayna Rhoads
Email: dayna.rhoads@cspg.org
Joint Annual Convention Committee
Convention Manager: Shauna Carson
Email: scarson@geoconvention.org
Convention Coordinator: Tanya Santry
Email: tsantry@geoconvention.org
EDITORS/AUTHORS
Please submit RESERVOIR articles to the CSPG office. Submission deadline is the 23rd day of the month, two months prior to issue date. (e.g., January 23 for the March issue).
To publish an article, the CSPG requires digital copies of the document. Text should be in Microsoft Word format and illustrations should be in TIFF format at 300 dpi., at final size. For additional information on manuscript preparation, refer to the Guidelines for Authors published in the CSPG Bulletin or contact the editor.
Technical Editors
Ben McKenzie Colin Yeo (Assistant Tech. Editor) Tarheel Exploration EnCana Corporation Tel: 403-277-4496 Tel: 403-645-7724
Email: bjmck@telusplanet.net Email: colin.yeo@encana.com
Coordinating Editor
Heather Tyminski
Comunications and Public Affairs, CSPG Tel: 403-513-1227, Email: heather.tyminski@cspg.org
ADVERTISING
Advertising inquiries should be directed to Alyssa Middleton, Tel: 403-513-1233, email: alyssa.middleton@cspg.org. The deadline to reserve advertising space is the 23rd day of the month, two months prior to issue date.
The RESERVOIR is published 11 times per year by the Canadian Society of Petroleum Geologists. This includes a combined issue for the months of July and August. The purpose of the RESERVOIR is to publicize the Society’s many activities and to promote the geosciences. We look for both technical and non-technical material to publish. The RESERVOIR is not intended to be a formal, peer-reviewed publication. Additional information on the RESERVOIR’s guidelines can be found in the May 2008 issue (p.46-48; available at http://www.cspg.org/publications/reservoir/reservoir-archive-2008.cfm).
or
Tentative List of Courses:
• Principles of Reservoir Characterization
• Fundamentals of Siliciclastic Sequence Stratigraphy
• Seismic Stratigraphy & Seismic Geomorphology
• Tight Gas Sands
• 3D Seismic Profiles of US Shale Plays
• Appraising and Developing Coalbed Methane Reservoirs
• Risk and Uncertainty Analysis for Unconventional Resource Plays
• “Old” (Pre-1958) E-Logs: A Quick Review
• Regional Stress and Reservoir Geomechanics
• Image Log Interpretation
• Formation Evaluation of Thinly-Bedded Reservoirs
• Quick Guide to Carbonate Well Log Analysis
(Four concurrent sessions each day - mix and match according to your interests and training needs. Lunch buffet and refreshments included each day.)
Tuition for the week:
AAPG Members..........................$1595 $1695
Non Members............................$1695 $1795
Individual Courses....................$400/day $450/day
(Your five-day badge can be transferred to a friend or colleague if you can't come all five days.)

Hosted by the Norris Conference Center: 803 Town & Country Lane Houston,
Phone: 713-590-0950
Fax: 713-590-0961
Special AAPG group rates at nearby hotels.
Registration and information:
Toll-free (U.S. and Canada) 888-338-3387, or 918-560-2650
Fax: 918-560-2678
E-mail: educate@aapg.org
Download a registration form at: www.aapg.org/education/wec.cfm
CSPG EXECUTIVE
President
Graeme Bloy • Canada Capital Energy Corporation gbloy@capitalenergy.ca Tel: (403) 975-5784
Vice President
John Varsek • EnCana Corporation john.varsek@encana.com Tel: (403) 645-5417
Past President
Lisa Griffith • Griffith Geoconsulting lgriffith@griffithgeoconsulting.com Tel: (403) 669-7494
Finance director
David Garner • Chevron Canada Resources davidgarner@chevron.com Tel: (403) 234-5875
assistant Finance director
Greg Lynch • Shell Canada Ltd. greg.lynch@shell.com Tel: (403) 691-3111
Program director
Scott Leroux • EnCana Corporation scott.leroux@EnCana.com Tel: (403) 645-2000
serVices director
Ayaz Gulamhussein • NuVista Energy Ltd. ayaz.gulamhussein@nuvistaenergy.com Tel: (403) 538-8510
assistant serVice director
Penny Colton • Exploratech Service Ltd. Penny@xploratech.com Tel: (403) 278-8755
outreach director
Mike DesRoches • Talisman Energy Inc. mdesroches@talisman-energy.com Tel: (403) 513-6843
communications director
Peggy Hodgkins • CGGVeritas peggy.hodgkins@cggveritas.com Tel: (403) 266-3225
executiVe director
Lis Bjeld • CSPG lis.bjeld@cspg.org Tel: (403) 513-1228
A message from the CSPG Assistant Services Director, Penny Colton

Of course I said yes when 2008 CSPG Past President Colin Yeo ...
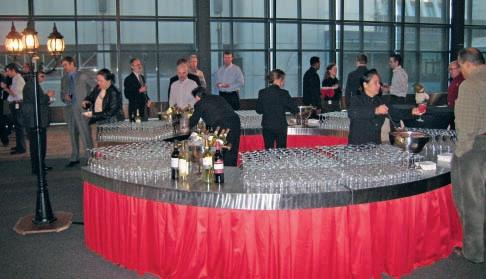
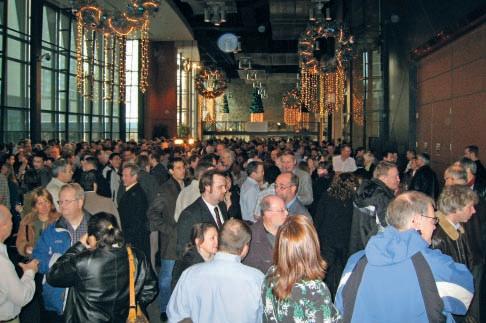
... asked me to serve as the Assistant Services Director. Because photography is a passion of mine and I feel it is important that CSPG has a visual record of its history, I have been
involved in photographing CSPG events. The collage below best illustrates the past year, from my view.


As depicted in the images above, professional development is a key aspect of CSPG. CSPG holds Technical Luncheon sessions, Technical Division talks, education courses, field seminars, and conventions to increase your geosciences knowledge for your current and future jobs. Networking is another important part of CSPG. Through attending or volunteering for CSPG events you will meet new contacts and friends. The Long-Time Members, those who have been part of CSPG for 30 or more years, show that some of these connections and friendships last for decades.
But the Society could not exist without the volunteers. The images above depict activities run by volunteers, whether it is organizing a technical luncheon, running the Student Industry Field Trip (SIFT), or running a booth at a university event to advertise CSPG. CSPG has a strong history of volunteerism which needs to continue. Need an incentive to volunteer? When you volunteer with CSPG, you work alongside industry leaders. You also learn skills


you wouldn’t learn at your own workplace, such as project management. Become part of the CSPG’s volunteering tradition today.
Membership renewal begins November 1. You will be able to renew your membership online, and print your combined membership card and receipt immediately. Membership dues have not increased since last year. In an effort to reach out to our future geoscientists, university students in the geosciences will be able to become CSPG members free of charge. Their student membership will allow them electronic access to the Reservoir and Bulletin to help them in their studies and learn more about petroleum geology. Students will be able to apply on CSPG’s website (www.cspg.org) for their free student membership.
If you know someone who is not a CSPG member or student member, do them a favour and suggest that they sign up. I have enjoyed being Assistant Services Director. Thank you.
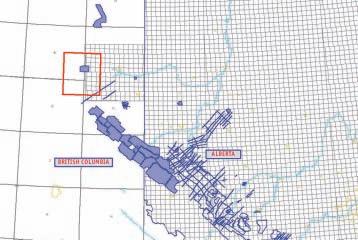
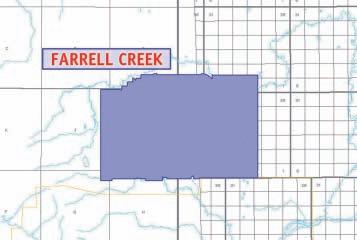
The CGGVeritas Farrell Creek 3D survey provides the highest quality data in Northeast British Columbia.
The Farrell Creek 3D non-exclusive survey is approximately 200 km2. situated over highly prospective coal bed and shale gas sequences. The data was carefully processed to preserve relative amplitude information through to prestack time migration. The resulting high quality data is suitable for further advanced processing products such as Azimuthal AVO analysis and inversion.
Acquisition Parameters:
Source: 4 Vibes, 2 Sweeps @ 12 seconds, 6 second listen, 10-90 Hz linear
Patch: 16 lines X 140 stns
Offsets: Inline 4150 m, Crossline 2250 m, Oblique 4720 m
Line spacing: Receivers - 300 m Sources - 420 m
Stn spacing: Receivers - 60 m Sources - 60 m
COUNT ON CGGVERITAS TO HELP YOU EXPLORE, DEVELOP AND PRODUCE WITH CONFIDENCE.
Contact:


CORPORATE MEMBERS
APACHE CANADA LTD.
BAKER ATLAS
CoNoCoPHILLIPS CANADA LIMITED
DEvoN CANADA CoRPoRATIoN
ENERPLUS RESoURCES TRUST
geoLoGIC systems ltd.
GEoMoDELING TECHNoLoGY CoRP.
HUNT oIL CoMPANY oF CANADA
HUSKY ENERGY INC.
IHS
IMPERIAL oIL RESoURCES
LARIo oIL & GAS CoMPANY
LITTLE RoCK DoCUMENT SERvICES
MJ SYSTEMS
MURPHY oIL CoMPANY
NEXEN INC.
PENN WEST PETRoLEUM LTD.
PETRo-CANADA oIL AND GAS
PETRoCRAFT PRoDUCTS LTD.
PRovIDENT ENERGY LTD
RPS ENERGY CANADA LTD.
SHELL CANADA LIMITED
SPRoULE ASSoCIATES LIMITED
SUNCoR ENERGY INC.
TALISMAN ENERGY INC
TECK CoMINCo LIMITED
ToTAL E&P CANADA LIMITED
ToURMALINE oIL CoRP
AS OF SEPTEMBER 29, 2009
CSPG will be holding their annual Holiday Social again this year before the December Technical Luncheon. We welcome geologists and non-geologists alike to attend this festive event. The Holiday Social is a chance to network and socialize with your colleagues and staff before the Luncheon with a glass of wine and some appetizers. It’s also a great way to celebrate the holidays.
This year’s Social will take place 10:30 am – 11:30 am on Tuesday, December 15 at the Calgary TELUS Convention Centre. At 11:30, the Technical Luncheon begins, providing our audience with a turkey lunch while they listen to Dale Leckie’s presentation “Geoscience of one of the Largest Integrated SAGD o perations in
the World – A Case Study from Long Lake, Northeastern Alberta.”
Your Technical Luncheon ticket will include admittance to the Social and the Luncheon. geoLo GIC systems ltd. is generously sponsoring the Social’s wine and appetizers. Please remember that companies or individuals can buy reserved tables to ensure that you have seating together. Need help buying Technical Luncheon tickets? Call (403) 264-5610 and CSPG will help you with your order.
o rder your Technical Luncheon tables or tickets today at https://www.cspg.org/ eSeries/source/Events/index.cfm.
SPEAKER
Michael A. Cooley Consultant
11:30 am
t hursday, n ovember 12, 2009 telus convention centre c algary, a lberta
Please note:
the cut-off date for ticket sales is 1:00 pm, Friday, november 6, 2009. csPg member ticket Price: $38.00 + gst. n on- m ember t icket Price: $45.00 + gst.
Each CSPG Technical Luncheon session is 1 APEGGA PDH credit.
Did you know that you can book a table for the Technical Luncheons? To book your company’s table, or to buy individual tickets, visit www.cspg.org.
The Livingstone Range anticlinorium (LRA) is a long (>65 km), narrow (<5 km) structural culmination of linked en-echelon chevron-style thrust-propagation folds that marks a major hanging-wall ramp across which the Livingstone Thrust cuts ~1,000 m up-section from a regional décollement in the upper part of Devonian Palliser Formation to a décollement within Jurassic Fernie Formation. It is well exposed and provides actualistic models for exploration of analogous subsurface structures. More
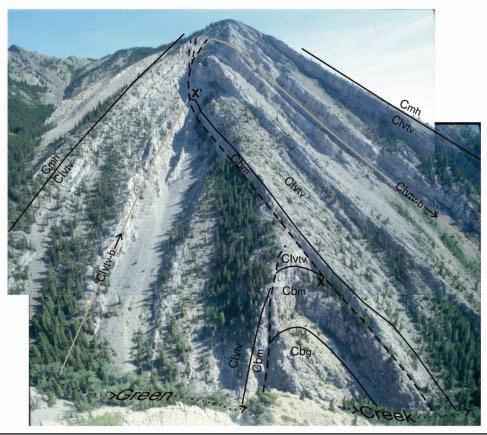
Figure 1. View south at the core of the Centre Peak anticline as exposed on the south side of the Green Creek canyon. The planar limbs of the anticline are separated by a composite, east-verging thrust fault that extends along the hinge zone. The lower segment, at the level of Green Creek, is a near-vertical thrust fault that is sub-parallel with the steep bedding in the micrite unit at the top of the Banff Formation (Cbm) in the forelimb of the anticline but cuts up-section through the sub-horizontal bedding of the Banff Formation grainstone unit (Cbg) and micrite unit in the hinge zone. The footwall and hanging wall cut-offs of the top of the Banff Formation micrite unit along this thrust fault, which are marked by X and X’, respectively, have been offset ~250 metres along this fault.
than 30 km of detailed mapping alongstrike reveals generally gradual changes punctuated by abrupt terminations or offsets of structures at NE- and E-trending tear faults, most of which are interpreted to be reactivated basement faults that originally formed during the Carboniferous. Some folds plunge out both northward and southward at tear faults, forming doubly plunging folds that were once ideal domal petroleum traps. The hinge zones of the chevron-style, flexuralslip, thrust-propagation folds display a distinctive pattern of ramp-flat thrusting comprising stacked detachment thrusts, each of which emerges from a different zone of interbed slip in the backlimb and deflects the hinge zone eastward. Each successively lower detachment thrust dies out in the hinge zone just below an overlying one (Figure 1). Displacements on the detachments, rotation of fold limbs, and inter-bed flexural slip were integrated kinematically during thrust-propagation
folding. Deformation during folding involved a form of cataclastic flow: during large translations and rotations, individual blocks of rock delimited by faults, joints, and sheared bedding surfaces underwent small relative displacements, but little or no internal deformation. Pressure solution and vein formation were widespread but minor components of the deformation. Complex fracturing within the anticlines does not involve patterns that can be related to folding or predicted by curvature analysis; the dominant patterns involve widely spaced (~150 m) transverse zones of intense fracturing that transect hinge zones and limbs. These permeable zones are smaller analogues to the tear faults as they likely also originated by reactivation of minor basement faults.
T HERMAL F LUID H ISTOR y Early syn-folding fluid flow is recorded by dolomite+/-calcite veins with isotopic compositions that are similar to those of
host rocks. It occurred along faults related to thrust-propagation folding, and also along many tear faults and larger thrust faults. o xygen-isotope thermometry of four early syn-folding veins indicates they precipitated at anomalously high temperatures (250 +/-50°C). Most have slightly higher 87Sr/ 86 Sr ratios relative to adjacent host rocks and are interpreted to have formed from a mixture of formation fluids and hotter basement fluids in a rockdominated system. The youngest episode of fluid flow is recorded by calcite veins with very low 18 o values (-18 to -9‰ PDB), which are interpreted to have precipitated
along faults that were active while the LRA was being transported eastward and uplifted by underlying thrust faults, and rapidly cooled by infiltrating meteoric water. The faults along which significant meteoric fluid circulation occurred are marked by visibly altered host rocks that have anomalously low 18 o values and slightly lower 13C values relative to most host rocks.
The structural, thermal, and fluid evolution of the Livingstone Range Anticlinorium began by rapid heating of the Carboniferous and underlying rocks during deposition of
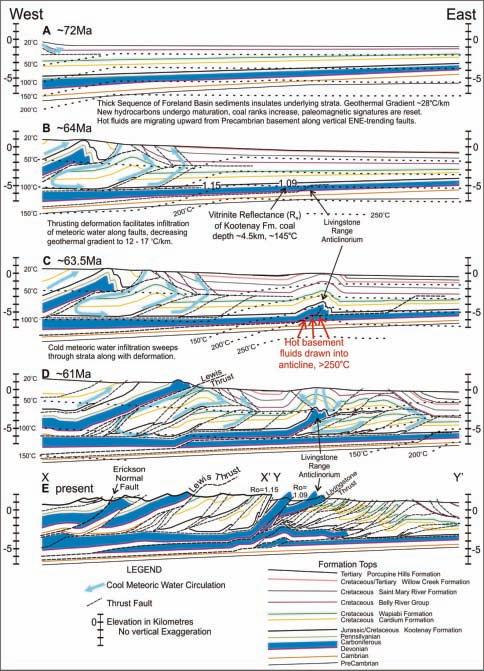
more than five kilometres of insulating shale-dominated foreland basin deposits during Late Cretaceous to Eocene. The Livingstone Thrust then propagated up through the Carboniferous strata forming the Livingstone Range Anticlinorium during the peak of thermal conditions. When the anticlinoirium began to be transported eastward, rapid cooling of the strata occurred by deep infiltration of cool meteoric water (Figure 2).
Black solid hydrocarbon residues along fault surfaces and between crystals in syntectonic veins, and petroleum-rich fluid inclusions in quartz, calcite, and dolomite in syntectonic veins attest to the presence of hydrocarbons within the Carboniferous carbonate rocks in the Livingstone Range anticlinorium at various stages of deformation.
BIOGRAPH y
Michael Cooley was born in Banff, Alberta in 1967. While growing up Cooley was an avid hiker and very interested in rocks, although by grade 12 one could have told him that the Rockies were granite and he would have believed it. Cooley began an undergraduate degree at the University of Calgary in 1988 with the intention of getting a degree in Business but soon switched to Geology. In first year he learned that he had been mainly hiking in limestones and resolved to see actual granite. Cooley completed a Master’s at Queen’s University in 1997, mapping in high-grade metamorphic rocks of the Quesnel Terrane, which was followed by a few years working in the mineral exploration industry. He began a Ph.D. at Queens University in the winter of 2000, which after getting married in 2001, buying a house, doing extensive home renovation, working for a summer for Shell, and having children, he finally completed in October 2007. Cooley is currently working for several mineral exploration companies as an independent structural geology consultant and loving it.
Cooley is the 2008 recipient of the CSPG Graduate Thesis Award for best Ph.D.
SPEAKER
Tom Brent Geological Survey of Canada - Calgary
11:30 am
m onday, n ovember 23, 2009
c algary telus convention centre c algary, a lberta
Please note:
the cut-off date for ticket sales is 1:00 pm, Wednesday, november 18, 2009. csPg member ticket Price: $38.00 + gst non-member ticket Price: $45.00 + gst.
Each CSPG Technical Luncheon session is 1 APEGGA PDH credit.
Buy your Technical Luncheon tickets online at www.cspg.org.
This presentation summarizes some historical aspects of industry’s seismic exploration effort in the High Arctic. A range of seismic interpretation issues related to both geology and seismic data quality, as seen on different vintages and in various arctic regions, are discussed. Also highlighted are efforts of the Geological Survey of Canada (GSC) since 1984 to preserve and add to the knowledge base of High Arctic geology by using and value-adding to the legacy seismic data. These efforts include the current and planned activities involving seismic and geophysics within the Geo-Mapping for Energy (GEM) program of the current government of Canada.
Petroleum exploration of Canada’s High Arctic began with a well drilled on each of Melville, Cornwallis, and Bathurst islands between 1961 and 1963. Seismic exploration however, lagged behind and Panarctic oils Ltd. did not shoot the first line, north from Marie Bay on Melville Island until 1968. Years of seismic acquisition ensued, encountering
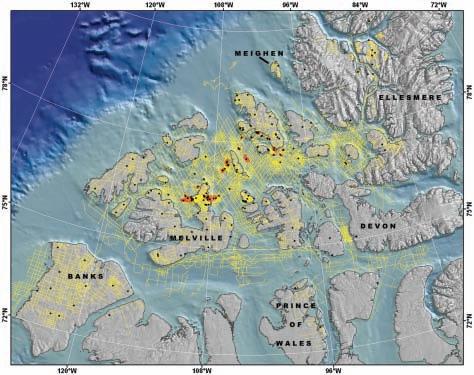
challenges of onshore permafrost and imaging through permanent multi-year sea ice. By 1986, 98,105 km of 2D seismic had been acquired (excluding Baffin Bay marine seismic) and 194 wells had been drilled discovering eight oil and 25 gas pools (Figure 1). The relatively low-fold seismic data, along with the display and interpretation methods of the day, was able to define structural drilling targets both onshore and offshore.
Land-based seismic record quality is largely very good, despite the presence of permafrost. This is primarily because the permafrost in the High Arctic does not often have discontinuities introduced from top melting, or massive ice lenses, such as is the case in the Mackenzie Delta. Because of a lack of permafrost in the offshore High Arctic, processors needed to deal with the rapid decrease of permafrost thickness to zero, at, or near shorelines. Interpreters needed to recognize the resulting velocity anomalies which ranged from a few milliseconds to over 150 ms. This variation is largely a function of the age, porosity, and rock type. Statics were generally not invoked to correct the velocity anomaly, but rather to create a smoothed stack through the relatively narrow transition zone. Prospect maps of the day normally did not have this offshore velocity sag removed and some prospects which resided in permafrost transition zones were avoided
(e.g., N.E. Lougheed Island and Sor Fiord on southern Ellesmere Island). These effects are still contained in currently compiled regional time structure maps illustrated here and although not critical in mapping high structural relief salt-cored features such as the King Christian gas field, are critical for subtler low-relief structures like those of the Maclean and Cisco discoveries. Permafrostcorrections for individual islands will be possible by performing spatial data integration work utilizing digital bedrock geology and frozen/unfrozen map unit velocity databases being built under GEM Energy.
Water depths in the inter-island channels of the Queen Elizabeth islands range to over 600 m and the geomorphology has been influenced by ocean currents, ice scour, glaciation, and glacio-fluvial processes. Further east in Baffin Bay, seismic indicates the presence of ice-rafted sediments which can produce post-glacial sea-floor armouring. Data quality of offshore seismic profiles can vary greatly due to issues related to recording through variable thickness sea ice. Sea floor and ghosts multiples also can also be problematic depending on the marine environment (i.e., hard sea floor, short water period). Smooth, high impedance, shallow sea floor geomorphology produce the worst multiples and energy penetration. This, combined with variable sea ice thickness, can
produce seismic imaging results from very good to dismal. The thinner and smoother the ice, combined with geologic structure dissimilar to sea floor attitude, the better the seismic image. In areas of perennial multiyear ice, Panarctic modified receiver array implementation on ice seismic shooting (e.g., Cisco) beginning in about 1983, calling it “high effort” indicating the additional labour and expense to layout herringbone-style receiver arrays. Re-processing of existing onshore and offshore data will likely provide more information but exploration for stratigraphic play types such as the flanks of Cape Norem structure, and plays under multi-year ice of the offshore Sverdrup rim, will need more consistent seismic imaging quality.
The initial processing and interpretation of this High Arctic seismic dataset largely predated workstation display and inexpensive migration technologies. Interpretation generally produced reliable subsurface maps although detailed stratigraphic breakdowns were not common. Horizons which could be correlated any distance, particularly offshore, were the Triassic Eden Bay or Gore Point Limestones and the Jurassic Sandy Point Formation and Jurassic King Christian Formation (or equivalent) which was often ghosted above one of the Triassic
limestone markers. Regional maps including both new and legacy seismic interpretations have been compiled and form the basis for seismic-related baseline subsurface products planned as spatial datasets to be published as one of several GSC open files of the GEM Energy program.
Examples shown of profiles from this legacy seismic data feature; Paleozoic through Tertiary geology of the subsurface of Banks island; the Siluro- ordovician platform carbonates and Neoproterozoic images from Prince of Wales Island, and a variety of images illustrating the Carboniferous through Cenozoic geology of the Sverdrup Basin.
This time-capsule of reflection seismic data remains a critically important asset for the future of hydrocarbon exploration in Canada’s High Arctic. It requires careful review and integration with other reassessed regional datasets, such as thermal maturity and geochemical data.
The author would like to acknowledge continued support of Suncor Energy (PetroCanada), ConocoPhillips Canada, Husky Energy, Imperial Oil Limited, and BP Canada Energy for their permission to show seismic data.

Tom Brent is a native Calgarian and currently a Physical Scientist with Natural Resources Canada. Brent attended both S.A.I.T. for Engineering Science (Geophysical) Technology (1975), and the University of Calgary for Geology in 1981. Brent has spent his career to date in Canadian arctic seismic, joining Panarctic Oils in 1975 and working staff geophysicist duties in numerous prospect areas. In 1986, Brent shifted jobs to the I.S.P.G. (now GSC-Calgary) and continued high arctic seismic studies, publishing on Prince Patrick, Meighen, Melville, and Prince of Wales islands as well as Lancaster Sound offshore geology. Brent has also written on high arctic deep permafrost and gas hydrate seismic characterization. Brent is currently working offshore Sverdrup, Ellef Ringnes, and Banks islands, as well as the eastern offshore basins of Northern Canada. As a career GSC database builder, Brent is also currently responsible to manage northern seismic and physiographic data for the GEM Energy database and dissemination project.
Sponsored by:

• Joint PP and PS inversion
• Stochastic inversion • AVO/LMR analysis
• Fracture detection
SPEAKER
Dale A. Leckie
Nexen Inc.
CO-AUTHOR
Milovan Fustic
Nexen Inc.
PRACTICAL DST CHART INTERPRETATION
(Thorough Basic Course) Feb. 1-5, Apr. 5-9, 2010
16 WAYS TO IDENTIFY BYPASSED PAY FROM DST DATA
(More advanced, for those “comfortable” with DST charts) Apr. 21-22, 2010
HYDRODYNAMICS SEMINAR
(Oil & Gas Finding Aspects) Apr. 26-30, 2010
In-house courses available. For course outline visit: www.hughwreid.com 262-1261
CO-AUTHOR
Christopher Seibel
Nexen Inc.
11:30 am
tuesday, december 15th, 2009 telus convention centre calgary, alberta
Please note: the cut-off date for ticket sales is 1:00 pm, thursday, december 10th, 2009. i ndividual t icket Price: $42.00 + gst table Price (seating for 10): $420.00 + gst
e ach csPg technical Luncheon session is 1 aPegga Pdh credit.
Due to the recent popularity of talks, we strongly suggest purchasing tickets early, as we cannot guarantee seats will be available on the cut-off date. To buy your tickets or tables, visit http:// www.cspg.org/events/events-luncheons.cfm.
Nexen Inc. and its joint venture partner, oPTI Canada Inc., have implemented one of the largest integrated SAGD (Steam Assisted Gravity Drainage) operations in the world to recover a portion of the more than estimated 18.8 billion bbls of original bitumen in place on their joint venture oil sand leases in northeastern Alberta. The purpose of this SAGD scheme is to recover and upgrade bitumen trapped within sands of the Aptian-age McMurray Formation. With the billions of dollars required to acquire land, delineate deposits, drill SAGD well pairs, build steam generation facilities and an upgrader, it is critical that the geological and geochemical aspects of the reservoir be fully understood.
Early, regional stratigraphic studies by Nexen across the Athabasca basin showed the McMurray Formation to be comprised of three or more episodes of incision, valley creation, and subsequent infill with fluvio-estuarine sediments. Fluvio-estuarine deposits are, by their nature, heterogeneous. This, combined with the multiple incision and fill events, has resulted in a complex amalgam of reservoir and non-reservoir sedimentary rocks, creating stratigraphic compartments across the basin.
Since the inception of this project, Nexen, as the SAGD operator, has been committed to developing a thorough understanding the deposits of the McMurray Formation through the integration of detailed geological, geophysical, and geochemical
data sets. Subsequent to routine delineation of McMurray oil sand deposits through core hole drilling, core analysis, petrophysical logging, and 2-D and 3-D seismic surveys, Nexen has put a major effort into a broad range of geoscience studies. These include sedimentology, stratigraphy, sequence stratigraphy, palynostratigraphy, ichnology, chemostratigraphy, geochemistry, seismic attribute analysis, geomechanics, and comparisons with modern analogs. The integration of these data sets has allowed the mapping of individual valley fills on regional and lease scales. on a more detailed reservoir development scale, mapping of depositional facies elements and fluid characterization allows for planning and production optimization of existing and future SAGD well pairs. The resulting 3-D object-based model and baseline bitumen characterization studies (physical properties and molecular composition) have reduced reservoir uncertainty, improve reservoir visualization, and are used for reservoir simulation and history matching. Monitoring steam chamber growth is the next step to be undertaken in our understanding of the reservoir and will involve 4D seismic interpretations and other emerging technologies. In this talk, we will present the results of these investigations.
BIOGRAPH y
Dale Leckie is Chief Geologist at Nexen Inc. He has specialized in petroleum systems focusing on sedimentology, marine and non-marine sequence stratigraphy, basin analysis, and unconventional hydrocarbons. He has worked in Western Canada and on petroleum systems around the world for most of his career.
Milovan Fustic is a Geologist at Nexen Inc. Fustic has more than 15 years of professional experience of which the last ten years were on major oil sands industry and research projects. He co-authored several papers related to Alberta’s oil sands sedimentology, reservoir characterization, bitumen geochemistry, and applied petrophysics (dipmeter).
Christopher Seibel is a Senior Geologist at Nexen Inc. He has worked in Nexen’s Canadian Oil and Gas Division since 2001 on projects in southeast Saskatchewan, west central Saskatchewan, northeast B.C., and is currently working in northeastern Alberta on the Lower Cretaceous McMurray Formation.
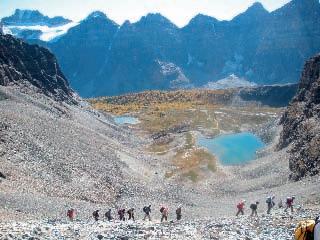
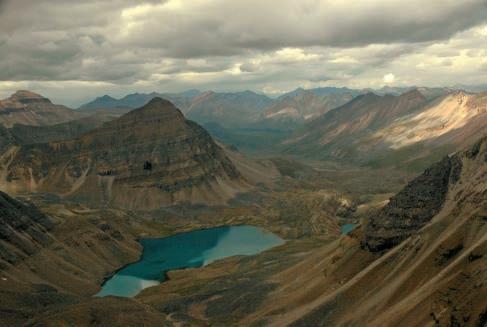
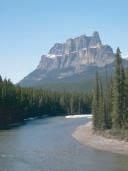
Lower Cambrian Gog Quartzite at Sentinel Pass overlooking the Valley of the Ten Peaks
by: Bill Ayrton
New geologists, engineers, geophysicists and landmen, as well as summer students entering the industry fo r the f irs t time will find the courses a very beneficial introduction to the petroleu m industry. T hese courses will be extremely useful to nonprofessional and support staff in the oi l and gas industry, as w ell as accountants, lawyers, brokerage and financial personnel working primarily alongside the oil and gas industry.
To register or to obtain additional information regarding in-house and upcoming courses, please contact:
Ayrton Exploration Consulting Ltd.
Tel: (403) 262-5440
Email: ayrtonex@telusplanet.net
Or visit our website: www.ayrtonexploration.com
Date: November 3rd & 4th, 2009
Cost: $945 (includes GST)
Instructor: Bill Ayrton
Effective for personnel just joining the oil patch, or for financial, accounting, and information systems personnel.
• Learn about the many facets of the industry.
• Oil finding, land acquisition, drilling, seismic, well completion, jargon and terminology.
Date: November 10th & 11th, 2009
Cost: $945 (includes GST)
Instructor: Bill Ayrton
Effective for geological technicians or administrative staff, or for those who just want a better understanding of geology to appreciate the world around us.
• Learn about earth structure, geologic time-scale and processes, Western Canada geology, and interesting nearby locations.
• Participate in a rock identification e xercise, cross-section project and a mini-field trip in downtown Calgary.
Date: November 24th, 25th, & 26th, 2009
Cost: $1365 (includes GST)
Instructor: Bill Ayrton
Ideal for those who wish to improve their geological understanding of where and how we look for oil and gas fields in Western Canada.
• To visualize what Western Canad a looked like throughout the stages of history, for example, the position of the sea versus land, what sediments were deposited, and what type of life that existed and evolved.
• To review the importance of each major stratigraphic unit, i.e. Devonian, Mississippian, Cretaceous, etc.
• Discuss the geological and seismic expression of typical oil and gas fields in each unit.
SPEAKER
Andrew R. Gorman Department of Geology
University of o tago
Dunedin, New Zealand
12:00pm – 1:00pm thursday, november 5, 2009 room cP1-1106
calgary Place tower one Between 2 street and 3 st. on 5th ave. s.W., calgary, alberta ( note room change from previous meetings)
The Alpine Fault, the surface manifestation of the Pacific-Australian continental plate boundary, running for >400 km along the west side of the South Island of New Zealand, exhibits dextral strike-slip motion estimated
at 23.1±0.8 mm/a. It also accommodates ongoing uplift in the Southern Alps on the hanging wall (east side) of the fault with rates in the southern sector estimated at 5.9 mm/yr. The unique characteristics of the Alpine Fault have recently led to the establishment of a working group – under the auspices of the International Continental Scientific Drilling Program (ICDP) – that is planning to drill an observation well on the central part of the Alpine Fault.
For much of its length, scarps of earlier Alpine Fault ruptures are readily identifiable, even though there have been no ruptures since the arrival of Europeans in New Zealand. However, the subsurface orientation of the Alpine Fault is poorly constrained due to low seismicity, lack of direct geological observations, and the low resolution of past geophysical imaging experiments. This is particularly so in the southern section of the Alpine Fault, near the town of Haast, where early work suggested that the fault may have a shallow dip. In this region, previous paleoseismic work has characterized extensive fault scarps across the valleys of several major rivers that flow west out of the Southern Alps into the Tasman Sea. However, these studies do not provide any
November is quickly approaching, which means it is almost time to renew your 2010 CSPG membership. Starting November 1 you will be able to renew your membership online and print your own receipt and Membership Card. Here’s how to do it:
1. Log into the Members only section of CSPG’s website. The Members Login link is in the top right corner of CSPG’s homepage (www.cspg.org).
2. once you’re in the Members only section, select Membership Dues from the centre list of options.
3. Your screen will list “Membership Renewal Total” below the Item heading and “$105.00” under the Cost heading (includes GST). Select add to basket .
4. Add your Credit Card information (card type, expiry date, card number, card security code, name on card, card owner’s address, etc.). Please note that under the “Credit Card Country” option, leave the space blank if your address is in Canada. only if you live outside of Canada should you choose your country from the menu.
5. Select the Check-Out button at the bottom of the page. only click the button once.
6. You will then see the Purchase Detail page, where you’ll be able to print your combined receipt and Membership Card. Select Print Receipt to get the PDF of your combined receipt and Membership Card. The card will include not only your membership information, but also the relevant information for income tax purposes.
If you need help processing your order, call the CSPG office at (403) 264-5610.

direct evidence for the structure of the fault in the subsurface – a factor that is important in assessing earthquake hazard along the Pacific-Australian plate boundary here.
Two seismic lines were acquired in regions of relatively easy access along the Haast and Turnbull Rivers in late January 2009. A co-incident gravity survey was carried out to constrain density properties and lithological contrasts interpreted in the seismic data. Interpretations of the resulting seismic sections identify the glacially eroded base of the ancient valley and coastal plain that has now been filled with interbedded glacial till and fine-grained sediments. o ffset of strata across the Alpine Fault is imaged and suggests that the Alpine Fault dips steeply to the southeast to depths of greater than 800 m, contrary to earlier suggestions that it would dip at a shallow angle. Uplift estimated from the offset of the eroded base of the valley across the fault on the Haast line corresponds to earlier published rates of 5.9 mm/a.
Additional seismic experiments are planned for the Alpine Fault in the coming year. one of the main goals of this work will be to characterize the geometry of the Alpine Fault at depth in preparation for possible drilling. Interpretations would be improved by networks of orthogonal seismic lines that could better constrain the 3D geometry of the ancient glacial valley in a location where dextral strike-slip motion the Alpine Fault rapidly changes the downstream shapes of the valleys.
Andrew Gorman is a geophysicist at the University of Otago in Dunedin on the South Island of New Zealand. He graduated from the University of Calgary in 1987 with a B.Sc. in geophysics and spent six years in the western Canada oilpatch with Chevron and Suncor before heading off to the University of British Columbia for a Ph.D. in crustal seismology as part of the LITHOPROBE project. In 2000, he moved on to the University of Wyoming for a post-doc in marine seismology focussing on gas hydrate accumulations on the Blake Ridge off the coast of the Carolinas. Andrew’s research interests are in the application of geophysical analytical techniques to geological problems – both on land and at sea. In recent years, he and his students have undertaken several high-resolution seismic surveys to examine the near-surface structure of active faults on the South Island. Results from this work have been used in assessments of seismic hazard in New Zealand.
SPEAKER
Kirstin Brink Department of Biology, University of Toronto at Mississauga
7:30 Pm
Friday, n ovember 13, 2009 m ount royal college, room B108 c algary, a lberta
The lambeosaurine Hypacrosaurus stebingeri ( ornithischia: Hadrosauridae) is an intriguing dinosaur known from complete, articulated skulls from embryonic to adult stages. The present study is the first detailed description of the cranial ontogenetic series of this taxon at five growth stages (embryo, nestling, juvenile, sub-adult, and adult), including specimens
from Montana and Alberta. The adult skulls are characterized by distinctive cranial crests, which do not become prominent until the sub-adult growth stage.
A comparison of the changes through growth of H. stebingeri to changes in H. altispinus, Corythosaurus, and Lambeosaurus reveals that the development of the crest of H. stebingeri and Corythosaurus is very similar. Sub-adults of H. stebingeri and Corythosaurus both possess a bifurcated nasal with branches of similar length that form an interdigitate suture with the premaxilla and a premaxilla-nasal fontanelle that remains partially open late into ontogeny. Adult skulls of H. stebingeri are diagnosed by a unique suite of shared characters: the nasal forms a small portion (49% or less) of the external crest surface, as in Lambeosaurus, and the nasal is rostrally bifurcated and dome-shaped, as in Corythosaurus. A re-examination of embryonic skull material from Devil’s Coulee has revealed that the diagnostic nasal is not preserved, and so the taxonomic identity of these embryonic skulls is difficult to determine.
This study confirms that few characters exist to differentiate species of juvenile lambeosaurines with undeveloped cranial crests, and suggests that most diagnostic characters develop late in ontogeny.
BIOGRAPH y
Kirstin Brink is a Ph.D. candidate at the University of Toronto. She previously received an M.Sc. from the University of Calgary.
I NFORMATION
This event is jointly presented by the Alberta Palaeontological Society, Mount Royal College, and the CSPG Paleontology Division. For details or to present a talk in the future please contact CSPG Paleontology Division Chair Philip Benham at 403-691-3343 or programs@albertapaleo. org. Visit the APS website for confirmation of event times and upcoming speakers: http:// www.albertapaleo.org/.


SPEAKER
Dr. John Harper
Geological Survey of Canada
12:00 noon
Wednesday, november 18, 2009 encana amphitheatre, 2nd floor east end of the calgary tower complex 1st st. and 9th ave. s.e., calgary, alberta
Rifting and salt tectonics often go hand-inhand. We do not get the opportunity to address issues prompted by the interactions of these two processes. In the case of rifting, there is the question of what happens to sediments in the basin once the basin starts to spread apart. What is the nature of deformation of these early sediments? How do the salts respond? What happens as deposition continues before, during, and after the rifting and spreading?
Rift zones are somewhat linear in form and quite narrow. As spreading occurs, the linear nature of the basin ultimately changes to that of a one-sided basin, one side having drifted far enough away so as to no longer have impact on its counterpart.
The Jurassic of the East Coast of Canada allows such questions to be investigated. The basin started out as a late Triassicearly Jurassic northeast-southwest rift (the NAMoR rift) with Morocco to the east (210 Ma+). The rift zone was less than 5 km in some areas and probably not greater than 50 km in others. It was characterized by horsts and grabens both on the North American and Moroccan sides. This discussion will address that portion of the rift that extended from the Laurentian Channel and the Newfoundland Fracture Zone to the northeast, southwest to the Shelburne Basin and the US border.
The earliest phase of deposition was recorded by Eurydice Fm. alluvial fans, braided streams, and lacustrine deposits (210-190/200 Ma).
Contemporaneous with these clastic deposits were the Argo Salts of as yet undetermined original thickness and width. This phase of rift graben fill was terminated by marine incursion recorded by the early Jurassic Pleinsbachian Iroquois shallow to deep-water carbonates and associated reef growth.
This marine incursion is interpreted to be the record of the beginning of spreading. By 180 Ma the NAMoR Sea was still linear but somewhat less than 100 km wide. The first spreading centre to be recorded is the East Coast Magnetic Anomaly (175 M yr ~ 120 km wide) and that occurred after Iroquois time. From Iroquois time through to the end of the Jurassic (190-145 Ma) a major Abenaki carbonate reef complex backed on the west by Mohawk and Mic Mac clastics continued to expand and grow in relief, with some progradational character. By 156 Ma (oxfordian) the NAMoR Sea was ~800 km wide, almost twice the width of the present Red Sea. one has to ask at what point does a sea becomes an ocean. It is a function of current circulation relative to global patterns.
South of the Sable Basin along the continental margin this barrier reef, where free of clastic dilution, continued its growth into the lower Cretaceous. Northeast of the Sable Basin, deeper shelf Jurassic carbonates were deposited on the Banquereau Platform separating the Sable Basin from the Laurentian sub-basin to the northeast. once the Cretaceous Sable delta began to fill in the Sable Basin the deeper Jurassic salts were driven in part from the basin, forming two tiers of salt diapirs and tongues in Cretaceous sediments. By the end of the earliest Cretaceous Berriasian, the barrier reef was progressively drowned and buried by clastic deposits south of the Sable Basin (137146 Ma). A major deformation event along the margin during the earliest Cretaceous resulted in large blocks of reef slumping off of the front (~140 Ma).
In the Laurentian Basin the earliest stage of rift basin filling was likewise characterized by the “Eurydice clastic-Argo salt-Iroquois carbonate” package. This basin stretched back into the orpheus Graben. Similar relationships can be observed in the rift grabens of Morocco. Most of the clastics were deposited along the northeastsouthwest axis of this early rift basin, having been sourced in part from the northeast. Post-Iroquois Mohawk and Mic Mac sands were deposited along this axis but as the spreading began sediments were deposited eastward as well as axis-parallel.
Seismic data illustrate that with continued spreading a time of major slumping and
deformation of the early Jurassic sediments occurred. Salts began to flow eastward from the areas of major clastic deposition. Sediment/salt wall couplets can be identified which demonstrate the gradual turning of the basin depocentre. The characteristics of the resulting salt structures depend on the degrees of freedom available to the salt for flow. In the narrow orpheus Graben setting, where there is no outlet for the salt to flow, diapirs occurred in response to the single upward degree of freedom offered by the seafloor. In the mouth of the linear Laurentian sub-basin, salt had two to three degrees of freedom for flow, with resulting salt walls bounding depositional minibasins. other varieties of salt structures are discussed which reflect the degrees-offreedom factor responsible for the structures observed. Salt distributions observed today are dominantly allochthonous.
Ultimately during the earliest Cretaceous Morocco had moved far enough east that it no longer had any influence on North American sedimentation. It was by this time that a major clastic continental margin had formed and its growth has persisted to this present day.
This geologic history is an excellent example of the interaction of rifting, spreading, salt deposition and tectonics, reef growth, and delta shifting supported by well data and seismic, much of which today are in the public domain.
John D. Harper, Ph.D., P.Geol., FGSA, FGAC; previously Senior Geological Advisor, ConocoPhillips Canada Ltd.; Retired Full Professor, Petroleum Geology, and the first Director of the Centre for Earth Resources Research at Memorial University of Newfoundland to Jan 1, 1998, and Adjunct Professor to 2002; formerly with Shell Development, Shell Oil, Shell Canada, and Trend Exploration. He has operational, management, and research credentials over the past 38 years in reservoir characterization and basin analysis for Canadian, US, and International onshore and offshore basins. His most recent activities have been in the Canadian Arctic, Mackenzie Delta - Beaufort, the Scotian Shelf and Deep Water, Labrador and Grand Banks, and the West Coast of Newfoundland.
There is no charge for International Division Talks. Please bring your lunch. The facilities for the talk are provided complimentary of EnCana and refreshments by Geochemtech Inc. For further information or if you would like to give a talk, please contact Bob Potter at (403) 8639738 or ropotter@telusplanet.net or Trent Rehill at (403) 617-6717 or trehill@kulczykoil.com.
SPEAKER
Khaled Benzaoi Schlumberger
CO -AUTHOR
Tom Cox
Schlumberger
12:00 noon
Wednesday, n ovember 25, 2009 conocoPhillips a uditorium
3rd Floor- above Plus 15+ level 401 9th ave sW c algary, a lberta
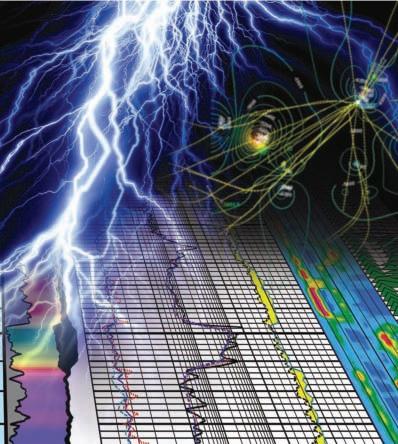
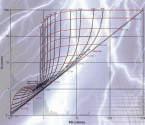
o ne big and common challenge is the integration of multiple-scale data to create one reliable facies models. In this work we will present how to integrate high-resolution data, such as core descriptions and openhole logs, with low-resolution data such as seismic to produce a medium-resolution 3D facies model. The methodology is based on four steps that could be applied separately. The first step uses a neural network to combine the core descriptions and the open-hole logs to generate a facies-log for the non-cored well-intervals. In the second step a neural network model is created from the correlation between seismic attributes and the facies-logs. The neural network modeling generates probabilities for each of the facies over seismic volume area (interwell). Step 3 involves creating horizontal variograms from the facies probabilities. In the forth step the facies probabilities are incorporated with a sequential indicator simulation to produce a stochastic facies model.
wHAT IS N EURAL N ET wORKS BACKGROUND?
Neural Networks are mathematical models that emulate some of the observed properties of biological nervous systems: parallel information processing, adaptative learning.
A neural network is an algorithm that takes multiple inputs and returns one or several
outputs. These inputs may be coincident log values, coincident seismic attributes, coincident surface values, or properties. During the training process, the system will calculate the weights to be assign for each attribute that will generate the best fit. Part of the data will be hidden and used for cross-validation. The weights set that best fit the cross validation data will be used as final result. In our case we are re-estimating the probability of occurrence of each facies.
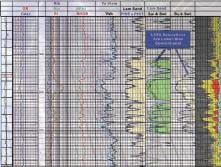
Step one: Facies log for the non-cored intervals
Core is the best source of data we can have however, it is not available everywhere or in every well. We need to use some secondary data to estimate the facies. The second most reliable data source is the open-hole well-logs. For practicality we use only the logs that are most affected by facies changes, these are GR, RH oB, DT, and NPHI.
Step two: Facies from the seismic attributes
Which seismic attributes will be used is the most challenging part. We generate many attributes and select the inputs based on the cross-correlation matrix. The selected attributes should have a low correlation so that each attribute is providing new or additional data to the neural network. As expected the seismic to facies correlation is often low but can give an indication of facies. The presentation will discuss how to improve this correlation. The results of the neural network are shown below.
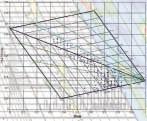
Step three: Variogram information from the NN results
The probability cubes will be used to generate information for the horizontal variogram. For each probability, a variogram map is created to determine the anisotropy and help guide the horizontal variogram ranges, since horizontal ranges can be difficult to determine from sparse well data.
Step four: Sequential indicator simulation (SIS)
The SIS algorithm (found in all modeling software) is based on the estimation of the facies probability using the up-scaled cells and variogram information. SIS provides the capability of using secondary probability data to adjust the SIS results.
BIOGRAPH y
Khaled Benzaoi is a senior reservoir geologist with almost 12 years experience, nine of them working for Schlumberger in seven countries where he consult for over 15 companies mainly in Petrophysics and geo-modeling. Benzaoi holds a Masters of Petroleum Geology.
Benzaoi has lived in Algeria (home country), Tunisia, UEA, Bahrain, Kuwait, Saudi Arabia, and in Canada for the last two years.
There is no charge for the division talk and we welcome non-members of the CSPG. Please bring your lunch. For details or to present a talk in the future, please contact Weishan Ren at (403) 233-3428, e-mail: weishan.ren@ conocophillips.com.


Of all the “isms” in the world, the one that affects us most profoundly is “professional-ism”. We expect strict professionalism on the part of medical doctors when we go for treatment or a check-up, transit operators when conveying us to work every morning and we even expect professional behaviour from sales associates at the computer store.
APEGGA is, naturally enough, highly engaged with professionalism as the Association exists to ensure that geoscience and engineering are performed to the highest standards.
So just what is “professionalism?”
In the real world, professionals are people who are constantly striving to gain new knowledge and learn from experience. They strive to treat people honourably and fairly and when they don’t, they clean up the mess and promise to do better next time.
So how do you personalize professionalism?
When you perform your duties in an ethical, professional and responsible manner, you are personalizing professionalism. When you make sure your professional designation appears on your business card, you are personalizing professionalism. When you stand up for the public’s interest and safety in the face of economic and other pressures, you are personalizing professionalism.
Personalize Professionalism. Visit www.apegga.org for more information or call Tom Sneddon, P.Geol., Geoscience Affairs Manager at 403-262-7714 or 1-800-661-7020.
| by Neil Hutton
one might wonder how a society that could send men to the moon, explorers to Mars, and develop amazing remote sensing technology is unable to develop an appropriate scientific evaluation of climate. The answer is probably that there was an arrogant underestimation of the complexity of climate, together with a naive attempt to reduce climate to the variability of one minor trace gas – ignoring all prior history of climate variability and atmospheric Co2 content.
The IPPC has created, with the cooperation of the media, the impression of thousands of committed objective scientists of impeccable integrity. Supposedly, these experts, reinforced by extensive peer review, have a high moral intent to save the world from the potential Armageddon of warming. The reality is totally different! The IPCC gathered together many meteorologists, climatologists, environmentalists, and political activists. These are the people claimed to be the
2,500 leading scientific experts constituting the consensus. In fact, in IPCC’ s Fourth Assessment, a head count shows that there were 1,656 authors; some of whom were involved in many parts of the report using given names in some parts, initials in others, and an abbreviation in another. If one goes to the trouble of examining the author’s biographies, it emerges that of the some 1,190 separate individuals who wrote the scientific part of the report, many were not scientists but were political and environmental activists. For example, those who authored the publication of the chapters on the health effects of global warming had no formal expertise in the chapters’ subject material (Lindzen, 1992). Indeed the published expert opinions of tropical disease scientists were ignored in a recurring and constant pattern of IPCC reports. There was never a multidisciplinary effort to determine the oscillatory nature of climate change, its history, and its principal drivers.
A proper understanding of climate requires an amalgamation of disciplines such as astronomy, astrophysics, solar physics, geology, geochronology, geochemistry, sedimentology, tectonics, palaeontology, palaeocology, glaciology, climatology, meteorology, oceanography, ecology, archaeology, history (of plagues, famines, economic data on agricultural commodities, land use, crops, etc.), and, last but certainly not least, statistical analysis. The problem, in the beginning, was that this was never intended to be an objective analysis, and other disciplines were deliberately excluded. Led by the apocalyptical vision of Maurice Strong, the IPCC was formed under the United Nations with the specific objective of proving that man-made emissions of Carbon Dioxide would wreak havoc on the world’s climate. This was achieved through the masterminding of conferences in Stockholm, Rio, Kyoto, Johannesburg, Bali, and the coming Kyoto II in Copenhagen in December.
(Continued on page 20...)
Pleistocene Ice Age108,000 - 12,700BC
Rolling 12,700 - 11,900BC
older Dryas 11,900 - 11,600BC
Allered 11,600 - 10,900BC
Younger Dryas10,900 - 9,600BC
Holocene Warming9,600 - 6,300BC
Egyptian Cooling6,300 - 6,000BC
Holocene Warming6,000 - 3,600BC
Akkadian Cooling3,600 - 1,500BC
Minoan Warming1,500 - 1,200BC
Bronze Age 1,200 - 500BC
Roman Warm Period500BC - 535AD
Dark Ages 535 - 900AD
Medieval Warm Period900 - 1300AD
Little Ice Age 1300 - 1850AD
Modern Warm Period1850 - 2009AD
Figure 1. Post Pleistocene Climate Cycles since the end of the last glaciation. There are fifteen climate cycles, which are documented from archaeology; history; sedimentology; palinology; and oxygen, carbon, and beryllium isotope studies.
(...Continued from page 19)
The World Meteorological Association through the auspices of the United Nations became the driving force in the process of establishing that global warming was the result of human activities. While one might conclude that the WMA were exactly the right people for the assignment, there is a problem. Philosophically, the meteorological profession is in the business of forecasting weather, and, therefore, take a forwardlooking approach to weather, and, in turn, climate. Yesterday’s forecast is no longer relevant. This philosophy arrived at a time of tremendous developments in technology, satellite imagery, Doppler radar, and –perhaps worst of all – supercomputers. Despite the work of Edward Lorenz, (The Butterfly Effect, 1979), and the cautions of outstanding scientists such as Henrik Tennekes (1986, 1992), Freeman Dyson (2005), and others (Hutton, 2009d) climate research has relied exclusively on computergenerated climate models whose predictions prove nothing and are evidence of nothing.
Science requires evidence derived from observation, measurement, and experiment. o nly two measurements have been presented by IPCC, the rise of atmospheric Co 2 versus the groundbased global average temperature curves, as presented by the Goddard Institute for
Space Studies (GISS) and Hadley Climate Research Unit (HADCRUT). The groundbased temperature observation stations were never constructed for the purpose of climate research. Apart from the fact that a majority of the thermometers are improperly located adjacent to heat sources (Hutton, 2009a), they also exhibit an extreme geographical bias as the majority of the thermometer records are located within the industrialized nations of the Northern Hemisphere and are so strongly influenced by the Urban Heat Island effect that the bias can not be removed. Although it is claimed that the data has been corrected effectively, the confidence in this assertion has been profoundly shaken, first by Steve McIntyre’s work, which showed that the GISS data contained errors such that the Thirties were the hottest decade not the Nineties and, second, the persistent refusal of Dr. Phillip Jones of the Climate Research Unit, University of East Anglia, to release the raw data, which was the basis for the HADCRUT3 global average temperature curve. This is a completely unacceptable situation preventing analysis and replication by independent researchers and makes a complete mockery of peer review. But this is not the only incident where a refusal to respect normal scientific protocols and transparency has occurred. The exposure of the Mann, Bradley, and Hughes hockey stick occurred only because, over the refusal of the authors to release the data, they were finally legally forced to provide the data by the terms of their government research grant. Furthermore, the fact that this infamous graph was published and accepted by the IPCC, and continued to be used years after it had been completely discredited demonstrates conclusively the complete lack of integrity and scientific objectivity in the IPCC.
The totally political nature of IPCC was clearly demonstrated in the Fourth Assessment report (AR4) in 2007 where, having been forced to relinquish the ‘hockey stick’ – which was done without explanation – they then produced a curve starting in 1850 (Hutton, 2009a). This was as if God created the world in 1850 and before that there was no climate. o f course, this extraordinary manipulation was done in order to avoid acknowledgement that there were climate oscillations comparable to and warmer than those of the 20th Century. In Figure 1 are documented no fewer than 15 climate oscillations since the last ice age. The selection of 1850 in the Little Ice Age was chosen only so that they could show rising atmospheric Co 2 along with a temperature recovering from the cold of the
Little Ice Age. But what of the climate of the last 500 million years? Was it not cyclical? Were there not warm periods and cool periods – even greenhouses and icehouses and was this caused by atmospheric Co 2 ? The answer is clear and unequivocal: there is no correlation between atmospheric Co2 and Phanerozoic climate. There is no correlation in the last decade; the climate is cooling while atmospheric Co 2 continues to increase. The UAH global average satellite temperature in the troposphere shows that the temperature is 0.5°C below the IPCC forecasts in AR4 (Hutton, 2009d). This may not sound like a large difference but within one decade it is substantial. Furthermore, the temperature is now actually lower than the IPCC forecasts in the AR4 report where it was assumed there would be no further additions of Co 2 (Hutton, 2009d).
Then there is the information from the rest of the world that is not reported by the western media in an unspoken form of censorship. In Japan in February a report was presented by the Japan Society of Energy and Resources (JSER), which acts as an advisory panel to the Japanese Government. The report concluded that global warming was not man-made. The report is a complete rebuttal of IPCC methods and conclusions. In short, while Co 2 is increasing the climate is cooling contrary to all predictions. The authors concluded that there was undue reliance on land-based thermometer data with its bias induced by the urban heat island effect and the highly skewed nature of the recording stations. The report bluntly criticized the reliance on computer climate models due to the lack of understanding of climate systems, especially humidity and cloud. The JSER report indicates that the models lack the input of fundamental processes so that they are unsupported hypotheses presented as truth – no more reliable than astrology, according to one author.
Meanwhile in the United States, it has emerged that the Environmental Protection Agency (EPA) withheld a report by one of its staff questioning the validity of Global Warming Science. Alan Carlin argued that since EPA is ultimately responsible for environmental policy it should not simply accept the IPCC data but undertake its own independent enquiry. The study was suppressed and the author Carlin transferred to other duties. The Carlin report is a sound and well reasoned document which can be viewed at http://cei.org/cei_files/ fm/active/0/DoC065209. The study was conveniently withheld ahead of the House vote on the Waxman Markey Bill (Cap and
Trade) which passed by a narrow margin. The bill potentially would be the greatest tax increase in US history. However, the bill appears to have little chance of passing in the Senate, where the Democrats are deeply divided on the issue and Senator Imhofe (Republican) is demanding an enquiry into the suppression of Carlin’s report.
The reliance of the IPCC on surface thermometer data and its lack of correspondence with other observations such as the UAH Global Average Satellite data from NASA satellites or correlation with sun-spot cycle length from the Eighties onward, has led to requests to review the raw data from HADCRUT3, the data interpreted by the Hadley Research Centre, at the University of East Anglia. This data set curated by Dr. Phillip Jones has been marked by his consistent refusal over many years to release the data. He will not provide the computational algorithms used to process the data, nor will he cooperate with other scientists or reveal any of the assumptions he has made. He has even gone so far as to indicate an unwillingness to cooperate with the World Meteorological organization. Jones’ determination not to reveal the data suggests that he is aware that it will not withstand scrutiny. A scientist confident of his work would be happy to cooperate.
Now the determination of the academic community is matching Jones’ obduracy and so he is inundated by requests under the Freedom of Information Act. However, he suddenly remembers that he had entered into confidentiality agreements with a number of countries and is unable to provide the data. This provoked a request to view the agreements. It then turned out that some of the agreements were verbal and the documents for the other arrangements were lost during a move! This is the level of scientific integrity and transparency in the IPPC, and this is only one of several other incidents.
Unrest continues in the scientific community. In July a group of some 40 German scientists from the European Institute for Climate and Energy forwarded a letter to Chancellor Merkel indicating that there is no evidence to support anthropogenic warming and they therefore were requesting a complete review of climate science and especially the associated economic policies.
In the United States, scientists are similarly challenging their Societies’ support of anthropogenic global warming. The American Chemical Society (ACS, claimed to be the largest scientific society in the
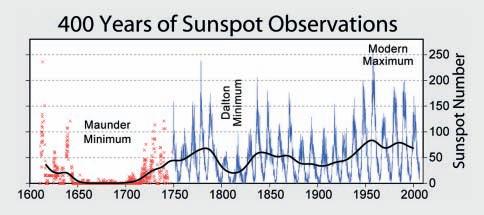
Figure 2. 400 Years of Sun-spot Cycles. The heavy black line is the eleven-year mean of the monthly averages of the sun-spot numbers. The general correspondence of this average with known climate is excellent. The Little Ice Age coincides with the extent of the Maunder and Dalton Minimums and in fact extends to 1350 as a result of the Sporer Minimum. The increased activity in the later part of the 20th Century is striking and it even includes the cooling from the late Forties to the mid-Seventies. This cooling is not reflected in the atmospheric CO2 content. Source: http:// en.wikipedia.org/wiki/File:Sunspot_Numbers.png. This figure was prepared by Robert A. Rohde and is part of the Global Warming Art project.
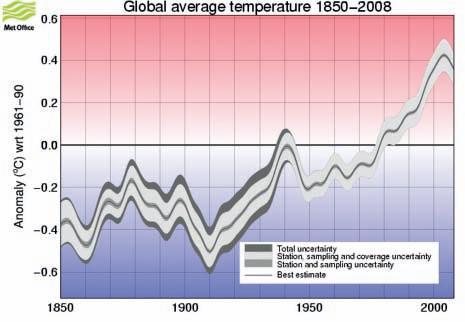
Figure 3. The Global Average Temperature from 1850-2008. This data set is in doubt because of the sudden sharp increase in temperature starting in the Eighties, which is not shown on the satellite temperature curves. Furthermore, data plotting the sun-spot cycle length versus global average temperature (Hutton, 2009c; p.36, Fig. 12) show a near perfect correlation for 130 years until the 1980s. The global-warming faction point to this as evidence of the influence of atmospheric CO2 , but now there is a strong suspicion that it is not properly corrected for the urban heat island effect. The suspicion is strongly reinforced by Dr. Jones’ refusal to release the data. Source: http://hadobs.metoffice. com/hadcrut3/diagnostics/global/nh+sh/.
World) was shaken by the response of their members to an article in their news magazine, Chemical and Engineering News, by the editor-in-chief Rudy Baum. The article claimed that it was increasingly difficult to challenge the consensus view of global warming despite the efforts of climate change deniers, and also that climate change deniers were attempting to derail meaningful efforts to respond to climate change. The appearance of the article was greeted with an immediate and overwhelming scientific rebuke from Baum’s colleagues. Almost without exception the letters castigated
Baum’s climate change views, objected to the pejorative term “deniers” because of the holocaust connection, and, further, rated the editorial as “disgusting,” a “disgrace,” “full of misinformation,” and unworthy of a scientific periodical. Many writers called for Baum’s dismissal. Baum himself acknowledged that he was startled and surprised by the contempt and vehemence of the ACS scientists to his view of Global Warming consensus. To view these letters go to http://acs.org/cen/letters/87/8730/ letters.html.
(Continued on page 22...)
The American Physical Society has been challenged in an open letter from 80 of its members to revise their National Policy Statement on Climate Change. The proposed statement simply removes anthropogenic warming as a causative mechanism of climate change. The recommended revision is available at: http://icecap.us/images/ uploads/APS_openLetter_07_29_09.pdf.
Then to Australia where we have a real scientist capable of independent analytical thought and outstanding scientific scholarship who has wrought major changes in attitudes down-under as a result of his recently published book, “Heaven and Earth, Global Warming, the Missing Science”. The author Professor Ian Plimer, from the University of Adelaide is twice winner of Australia’s highest scientific honour, the Eureka prize. The book is a masterly piece of scholarship of multidisciplinary range and breadth, fully documented by 2,300 peer-reviewed references. This book is required reading for anyone who really wants to understand climate science and understand the inadequate and scientifically unsupportable claims made by IPPC reports.
As a result of Plimer’s book, the Australian Senate refused to pass the Cap and Trade legislation proposed by the Rudd Government in August. Now the Bill must be amended through negotiation with the Senate. If the legislation is again defeated then Rudd would be required to call a general election.
Coming home is somewhat disappointing since it appears from correspondence that the Federal and Provincial Governments fully support the IPPC 2007 AR4 Assessment. This could be viewed simply as a move to appease the environmental vote. on the other hand, we should be concerned because Canada, along with the G8, signed on for the proposal that the Nations would work to maintain a global average temperature no more than 2°C above pre-industrial levels. Using the Global Average Temperature from the Hadley Centre which extends back to 1850 (Figure 2), there is a trend of warming from 1850 until the 1998 El Nino, after which temperatures have been declining approximately 0.5°C below 1998 maximum. This would indicate that we have leeway of about 1.5°C over pre-industrial levels and since the climate is cooling there appears to be no urgency to rush into the so-called mitigation strategies of cap and trade (CT), carbon capture and sequestration, (CCS), carbon credits for offset reductions, and a
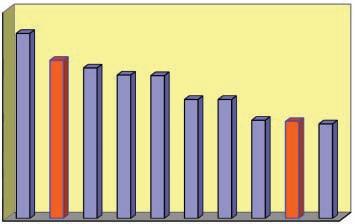
Figure 4. The diagram illustrates the remarkable behaviour of Sun Spot Cycle 23, which now has recorded three years among the record ten low sun-spot years since the start of the 20th Century. The years 2007 (163 days), 2008 (266 days), and 2009 (212 days and counting) give a grand total since the minima started of 723 days. The average number of Sun-spot-free days for the last part of the 20th Century is 345 days and the general average is 485 days.
completely unnecessary bureaucracy. one can detect the vultures wheeling in the sky readying to feed off the new carbon economy, essentially the carcass of the taxpayers. Law firms and consultants are busying themselves to lead you through the maze of carbon regulation so that you can establish and maximize the carbon assets in your business – and none more so than Al Gore.
In 1998 Fortune Magazine derisively declared that Gore’s financial acumen, “Ain’t Worth a Bucket of Warm Spit” at the time his net worth was little more than the vice Presidential income. Now since leaving politics he has a net worth in excess of US$100 million. It appears that many expect him to become the first carbon billionaire through his stakes in a global-warming hedge fund, a carbon-offset business, a renewable-energy investment business, and other global-warming-related ventures according to Lawrence Solomon (National Post, 2009). Gore’s objective is to make fossil fuels uncompetitive by convincing governments to punishingly tax fossil fuel technologies through the mechanisms of CT and CCS. Meantime, Gore and his fellow vultures will make money at every stage of this transformation. This is no time to be taken in with naive altruistic ideas about saving the planet because the plan is to enrich themselves on the average taxpayer’s dollar.
Perhaps the most astonishing feature of the Global Warming Hysteria is the fact that the huge ball of energy in space, which
supports the life and energy of the planet, has been reduced to a bit player behind a trace gas whose volume is recorded in parts per million. (Hutton, 2009b) The Sun has, without question, been the driver of the Earth’s climate for the last four billion years and, if there are any doubts in this regard, the Sun is demonstrating conclusively its dominant role in climate. It is now in a quiescent state not seen in the last 300 years. We have reported in Climate Change v: Here Comes the Sun (Hutton, 2009c), the role of the elevenyear sun-spot cycle and its correlation with climate. In Figure 2 the Sun spot cycles for the last 400 years are reproduced. The correlation with climate is compelling: the quiescent periods of the Sun in the Maunder and Dalton Minimums during the Little Ice Age; the obvious increase in activity in the last part of the 20th Century. Even the subtle cooling from the late Forties to the mid-1970s can be observed in the Sun spot cycles (Figure 3). This 30-year cooling period is not indicated by atmospheric Co 2 nor is the cooling we are experiencing now in conjunction with the Sun’s quiescence. The Sun is currently at 723 Sun-spot-free days and counting. It can be seen in Figure 4 that this Sun-spot minimum accounts for three of the record years for the 20th and 21st Centuries. Sunspot cycle 23 now most resembles cycle 3 in 1790, immediately preceding the Dalton Minimum from 1790-1835 (Figure 2) near the end of the Little Ice Age, 1350-1850. The Dalton Minimum coincided with a period of very cold winters. Historical records show that early settlers successfully crossed the
Mississippi River at St Genevieve, 200 miles south of St. Louis in 1799. The ice thickness was determined to be two feet, sufficient to support the heavily loaded wagon train. The River Thames froze regularly as did the Hudson River, enabling people to walk across the ice from Manhattan to Staten Island. The British rolled heavy canons across the Hudson while the ice remained solid for five weeks. Later in 1821, taverns were constructed in the middle of the Hudson to provide refreshment and warmth to pedestrians.
The purpose of these articles is to provide access to objective scientific information on Climate Change, free of the fear-mongering and spin prevalent in the media and promoted by the environmental activists. The radical green movement has almost reached the point of a neo-religious urban movement and they have become immune to rational discourse on climate change. The level of sophistication is that we are putting all this rotten stuff into the atmosphere and it must be bad for the planet. The contrast between a molecule that stimulates life and growth and stuff that makes you sick (pollution) escapes them. The media, of course, promotes the idea that climate should be stable so that any unusual events can be attributed to global warming. Climate, however, is continuously variable just as we experience weather. In this environment, attempts to introduce data and logic have been treated with anger and hostility. It is common then to introduce an ad hominem attack on the integrity of the individual as a lackey of the oil or coal companies, and attach pejorative terms such as deniers, or skeptics, thereby avoiding having to actually address the scientific point. As more critical evidence comes to light then grimmer and grimmer climate scenarios are posited, even where there is well documented contrary scientific evidence. If the lie is repeated often enough it becomes truth in the public mind. We hope, therefore, that readers of these articles may find the energy and enthusiasm to spread the word to their friends, families, neighbours, and government representatives. This is in order that we may be spared the incredibly misguided policies currently being contemplated. Be clear they are totally misguided taxes, which are liable to triple the cost of fuel and energy with unfathomable effects on the economy, while assuredly having no effect whatsoever on climate.
induced global warming based on incomplete science can only be extraordinarily costly, will distort energy policy, and will make the poor poorer…in the case of the effect of Co 2 on climate, the correct solution to the non-problem of Co 2 is to have the courage to thoughtfully do nothing.”
Carlin, Alan. 2009. Comments on Draft Technical Support Document for Endangerment Analysis for Greenhouse Gas Emissions under the Clean Air Act. http://cei.org/cei_files/fin/ active/0/DOC065209.
Dyson, Freeman J. 2005. Winter Commencement Address. University of Michigan. University of Michigan News Service. www.umich.edu/news/ index.html?DysonWinCom05.
Hutton, A. Neil. 2009a. Climate Change II: The World’s Historic Climate. Canadian Society of Petroleum Geologists Reservoir, v. 36, issue 2, p. 31-35.
Hutton, A. Neil. 2009b. Climate Change III: Carbon Dioxide. Canadian Society of Petroleum Geologists Reservoir, v. 36, issue 3, p. 38-43. (Continued on page 24...)


Let me here close with a quotation from Ian Plimer’s excellent book, Heaven and Earth: “We live in a time when the methodology of science is suspended. Reactions to human-


(...Continued
Hutton, A. Neil. 2009c. Climate Change V: Here Comes the Sun. Canadian Society of Petroleum Geologists Reservoir, v. 36, issue 5, p. 31-39.
Hutton, A. Neil. 2009d. Climate Change VIII: Global Circulation Models. Canadian Society of Petroleum Geologists Reservoir, v. 36, issue 8, p. 24-28.
Lindzen, R. S. 1992. Global Warming: The nature and origin of the alleged scientific consensus. Proceedings of the OPEC Seminar on the Environment, 13-15 April 1992.
Lorenz, Edward M. 1979. Does the Flap of a Butterfly’s Wings in Brazil Set off a Tornado in Texas. American Association for the Advancement of Science, Annual Meeting. Dec. 29th 1979.
McIntyre Steve. 2007. Hansen then and Now, Climate Audit. www.climateaudit.org/?p=1175.


Orlowski, Andrew. 2009. Global Warming Ate My Data, We lost the numbers: CRU responds to Freedom of Information Requests. http://www.theregister.co.uk/2009/08/13/cru_ missing_data.


Broad integration. Deep science. Open architecture.
Petrel* 2009 gives me an advantage no other application can offer—a better understanding of complex facies using advanced geological population methods like multipoint geostatistics, and parallel processing to efficiently model multimillion cell models—that really makes the difference in honoring the finest reservoir details. 403-509-4000 www.slb.com/petrel2009
Orlowski, Andrew. 2009. Japanese Scientists have made a dramatic break with the UN and Western-backed hypothesis of Climate Change. The Register, 25th February. http://www. theregister.co.uk/2009/02/25/jstor_climate_ report_translation/.
Plimer, Ian. 2009. HEAVEN AND EARTH, global warming, the missing science. First published, Australia by Connor Court Publishing Pty. Ltd., Ballan Victoria. Also by Taylor Trade Publishing, Rowman and Littlefield Publishing Group Inc. Lanham Maryland 20706.
Solomon, Laurence. 2009. Carbon Baron Gore, Climate Profiteers. National Post, Wednesday, August 26, 2009.
Tennekes, Hendrik. 1986. No Forecast is Complete without a Forecast of Forecast Skill. European Centre for Medium Range Weather Forecasts www.sepp.org/Archive/NewSEPP/ Climate%20models-Tennekes.htm.
Tennekes, Hendrik. 1992. Karl Popper and accountability of Numerical Weather Forecasting. Weather v. 47 p. 343-346. http:// climate science.org/files/Popper.pdf.
| by Dalis Deliu and Ryan Mattson
Horizontal wells can have important advantages over vertical wells – they allow for more exposure to the reservoir, reduce impact on the environment, minimize safety concerns, and can produce higher net financial returns for operators.
Since horizontal wells first became economical in 1980, the percentage of wells drilled in this manner has increased with each new technology advancement. Today, directional and horizontal drilling accounts for close to half of all wells drilled in North America.
Along with advances in horizontal drilling techniques, completion technologies have also evolved; horizontal completions now enable the development of reservoirs that would have been deemed unrealistic or noncommercial only a few years ago because of reservoir characteristics such as thin pay zones, low permeability, and low porosity. The most notable developments in completion technology are in the use of multi-zonal isolation techniques along with advanced stimulation programs. They are especially effective for tight gas, shale gas, and other unconventional reservoirs.
This article surveys the most important completion technologies available today for horizontal wells; all of these technologies are being used in the unconventional reservoirs of Western Canada.
The first option for horizontal completion and stimulation was “perf and plug” techniques in a cased and cemented wellbore. This type of completion was used in the early stages of Montney field development and was the first step in the evolution of the horizontal completions.
Both cast iron and retrievable bridge plugs have traditionally been popular; however, retrieving or drilling out such plugs can sometimes become time-consuming and costly.
Fas Drill® drillable bridge and frac plugs (Figure 1) were developed to overcome the limitations of traditional perf-and-plug systems. The most important benefit of Fas Drill plug technology is the ease and speed with which they can be removed

from the wellbore, which reduces the time between initial perforations and stimulation treatments and production.
CobraMax ® H frac service (Figure 2) is a second option for cased-hole completions. It is deployed via coiled tubing and provides
a highly efficient method for fracturing multiple-interval horizontal wells, which are completed with unperforated, cemented casing.
CobraMax H service offers Hydra-Jet sm service-assisted fracturing combined with the well control capabilities and speed of coiled tubing to help improve well performance by accurately controlling the placement of fractures in horizontal sections. It allows stimulation engineers to optimize key treatment parameters such as injection rate, proppant volume, and concentration. It also helps to overcome flow convergence issues by providing maximum near-wellbore conductivity, enables operators to exploit multiple zones in a single trip, eliminates the need to set mechanical plugs that must be removed later, enables operators to perform multiple-interval treatments individually, and eliminates the need for packers or separate trips to the hole. This design was used in the Montney by major operators and is an alternative to the perf-and-plug method.
Horizontal completion designs started from a cased wellbore design and evolved to an openhole monobore design where well conditions permitted. The greatest benefit of openhole completions is reduced operational costs.
The Swellpacker ® isolation system with Delta Stim® stimulation and production sleeves is a common type of openhole completion. These completions provide accurate placement of fracture treatments through Delta Stim sleeves (DSS) while maintaining zonal isolation with the Swellpacker system. This allows the operators to reap the benefits associated with maintaining an openhole completion, including more surface contact with the reservoir.
Delta Stim sleeves are stimulation and production sleeves that are hydraulically shifted with phenolic composite balls of graduated sizes (starting with the smallest ball and gradually increasing by 0.25” in diameter). The balls are launched from the surface and are pumped down into place. The balls land in the cast iron ball seats
(Continued on page 26...)
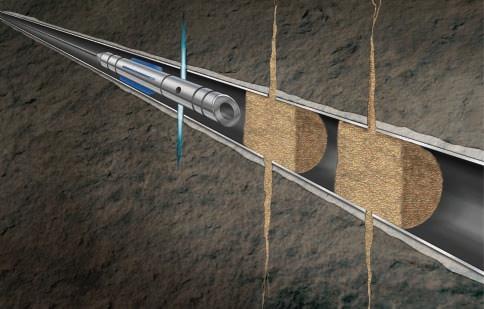

and, when pressure is applied, they shift the sleeves open. After the stimulation is completed, the balls and the seats can be drilled or the balls can be flown to surface. Delta Stim Lite sleeves are also available; they are more economical, but do not have the capability to shift to the closed position once opened (Figure 3).
Isolation between the stimulation points can be maintained with the use of the Swellpacker isolation system. This technology is based on the swelling properties of rubber in hydrocarbon – zonal isolation is achieved by swelling the elastomer in hydrocarbon through a diffusion process, which permanently crosslinks with the polymer and the hydrocarbon. Packers are specifically designed to accommodate the well conditions dictated by the reservoir.
Delta Stim sleeves with the Swellpacker isolation system are delivering excellent production results by isolating the zones without initiating fracs at the packers as some other hydraulic and inflatable packers do. The Swellpacker isolation system and Delta Stim sleeve completions hold up to 68.9 MPa (10,000 psi) differential pressure to meet the stimulation requirements. The packer has no moving parts and the system provides a one-trip frac solution.
Results from this kind of completion and simulation program can be evaluated by running microseismic fracture mapping, which can provide information about the orientation, length, complexity, and asymmetry of the fractures along with information about the integrity of the isolation between the packers. This information is vital to having a good
understanding of the reservoir properties and allows operators to develop stimulation programs that will optimize the economics of the well.
Delta Stim sleeve completions can also be used in cemented wellbores by replacing the Swellpacker isolation system with cement, keeping Delta Stim sleeves as frac sleeves and using a Delta Stim Initiator hydraulic sleeve (Figure 4) to initiate the first fracture. This technology does not require that the hole be in gauge, as the diameters of the completion assembly are not a close fit with the wellbore. Halliburton cemented sliding sleeve systems were first deployed in North America in the Pouce Coupe area in December 2008. Production with these systems is still being evaluated; this experience is a good example of the constant evolution of completion techniques.
In Canada, Halliburton has completed more than 200 horizontal wells to date using openhole completion systems based on Delta Stim sleeves and / or Swellpacker isolation systems in various configurations. Choice of completion and stimulation techniques is dictated by the geological qualities of the reservoir. Clear understanding of the reservoirs’ capabilities will allow the operator to select the optimal completion solution that can also handle the production enhancement program.
To be successful in today’s exploration and exploitation environment, it is imperative to create a strong collaborative environment among groups like geology, reservoir, drilling, and completions so information can flow with no restrictions. With true collaboration, success comes when the results of the entire project are visible, not at the end of any one operation or phase.
All of the completion methods presented are viable solutions and are currently being used in Western Canada. Each of them has advantages and all are delivering good production results for operators. Selecting the best completion method for a particular well is a complex decision and

is dictated by the reservoir characteristics and economics. To compare the economic returns of different completion methods, one has to consider the drilling costs as well as production enhancements costs, as both will fluctuate with the method selected.
Drilling, stimulation, and completion technologies will continue to evolve and make possible more economical development of Canada’s rich unconventional reserves. Savvy operators and service companies will stay abreast of these developments and be receptive to new and improved technologies, while considering all the available options for each project. It is also crucial to evaluate each completed project and continue to adjust practices with the technology advancements within the industry.
Eberhard, M., Meijs, R., and Johnson, J. 2003. SPE 84328 – Application of Flow-Thru Composite Frac Plugs in Tight-Gas Sand Completions. Society of Petroleum Engineers. SPE Annual Technical Conference and Exhibition, 5-8 October 2003, Denver, Colorado.
Roundtree, R. and Eberhard, M. 2009. SPE 123589 – Horizontal, Near-Wellbore Stress Effects on Fracture Initiation. Society of Petroleum Engineers. SPE Rocky Mountain Petroleum Technology Conference, 14-16 April 2009, Denver, Colorado.
Schnell, R. A., Genyk, R., Whitton, S. M., and Tapper, N. C. 2009. SPE 125970 – Montney Unconventional Gas – Next Generation, an integrated approach to optimizing Wellbore Completions Technology. Society of Petroleum Engineers. SPE Eastern Regional Meeting, 23-25 September 2009, Charleston, West Virginia.
Thompson, D., Rispler, K., Stadnyk, S., Hoch, O., and McDaniel, B. W. 2009. SPE 119620 –Operators evaluate various Stimulation methods for Multizone Stimulation of Horizontals in northeast British Columbia. Society of Petroleum Engineers. SPE Hydraulic Fracturing Technology Conference, 19-21 January 2009, The Woodlands, Texas.
Wiley, C., Barree, B., and Eberhard, M. 2004. SPE 90697 – Improved Horizontal Well Stimulations in the Bakken Formation, Williston Basin, Montana. Society of Petroleum Engineers.

SPE Annual Technical Conference and Exhibition, 26-29 Septemer 2004, Houston, Texas.
BIOGRAPH y
Dalis Deliu graduated from the University of Petroleum Engineering, Romania in1988. Dalis started working with Halliburton Canada in 1997 and is currently a Principal Technical Specialist in the Completions group.
Ryan Mattson graduated from the University of Alberta in Mechanical Engineering in 2005. Ryan has worked with Halliburton since graduation and is currently a Senior Technical Professional providing technical support for the Completions group based in Calgary.
This article was contributed by Halliburton. CSPG thanks Halliburton for the contribution.
| By Colin Yeo, P.Geol. and Lionel Derochie, P.Eng.
The commodity price forecast is a significant factor in determining the present value of an oil and gas investment and yet it is the least understood and likely the most complex variable in the profitability equation. As technical professionals, we spend our time gathering data and performing analyses on factors we can measure and, to some degree, control. However, we must remember that the price we fetch at the time of sale, not the price we had assumed, is the greatest determinant of our cash flow and net present value. In this segment of our series, we look at how oil and gas price forecasts are generated, assess their historic accuracy, and learn what strategies investors use to protect themselves from price volatility.
M
y
There are three basic types of forecasts: subjective, deterministic, and probabilistic.
Subjective forecasting is based primarily on experience and intuition and while many data-driven and analytically focused technocrats may be dismissive, this type of forecast is particularly useful when prices are volatile. Past conditions and events serve as indicators of expected future trends; we are all aware of “boom – bust” cycles. Proponents of this type of forecasting watch for signals in the world economy, geo-political developments, and consumer spending trends looking for patterns that might trigger significant changes to world commodity prices. While some of these subjective forecasters are correct once in a while, usually no one forecaster has enough broad experience to make correct predictions consistently.
Deterministic forecasting is based on the belief that observed commodity prices are the result of antecedent causes and are predetermined by independent conditions or events. This type of forecasting assumes that price is the dependent variable related in some fashion to a series of independent variables. For example, it is a strongly held contention that oil price is closely linked to global GDP growth rates, a measure of economic activity. At the same time, it is recognized that oil price itself can influence GDP by driving up production costs for other goods and services which, in turn,
results in slower economic growth. While the demand for oil is based on economic growth expectations, oil supply is estimated from reserve levels and productive capacity, which, in turn is influenced by past decisions on oilfield infrastructure investments that was influenced by expected price levels at a previous time. This convoluted linkage of variables, none of which are truly independent, results in forecasts that are oversimplified and can lead to blind spots in price forecasts.
Deterministic forecasting suffers from the phenomena of precision beyond accuracy. For example, oil netback pricing assumes that refinery buyers prefer a specific type of oil by paying a premium for it and producers would cut their price if a competitor tried to undersell them. The producer sets a wellhead price for their oil and transportation charges are then added to arrive at a landed, or posted, price at a destination. The wellhead price for a competing oil starts with the destination’s posted price, subtracts pipeline charges (tariffs), trucking costs, and adjusts for oil quality (hydrocarbon product yield in the refining process) to arrive at a netback price at the wellhead. Forecasting problems can arise around the many assumptions on pipeline tariffs, handling costs, trucking charges, and other oilfield expenses as often these costs are held constant into the future or escalated at a given inflation rate. The problem is assuming these prices or costs
are certain and fixed while forgetting about the inherent uncertainty around each. This uncertainty can be accommodated through probabilistic forecasting.
Probabilistic forecasting considers how well independent variables have predicted the value of the dependent variable historically. By considering the change in each independent variable over time, a mean and standard deviation can be calculated for each variable and a range can be assigned. For example, pipeline tariffs might have averaged $3.00/bbl over the last 10 years but during that time may have ranged between $2.00 and $5.00 per barrel. By using a mean and standard deviation, errors are minimized and accuracy is enhanced. Models that use ranges for independent variables should be more accurate than a single, specific value.
There are two other types of forecasting that may be used. An end-state technique, sometimes called future mapping, considers different world situations (political, economic, social, and technological) and the associated probability of occurrence. The most likely future state is a weighted-average of those different situations. Estimates of oil price within such a future state are made.
The “Delphi” process summarizes the collective and independent wisdom of knowledgeable experts. Trends, common
(Continued on page 30...)

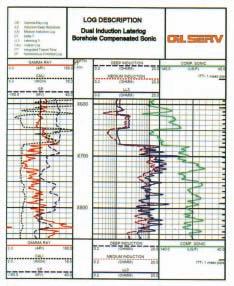
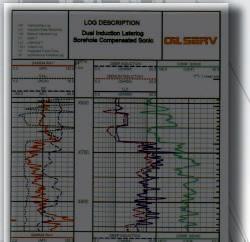

First Iraqi company providing logging services for:
• Open hole services
• Cased hole services
• Perforations
• VSP
• PLT
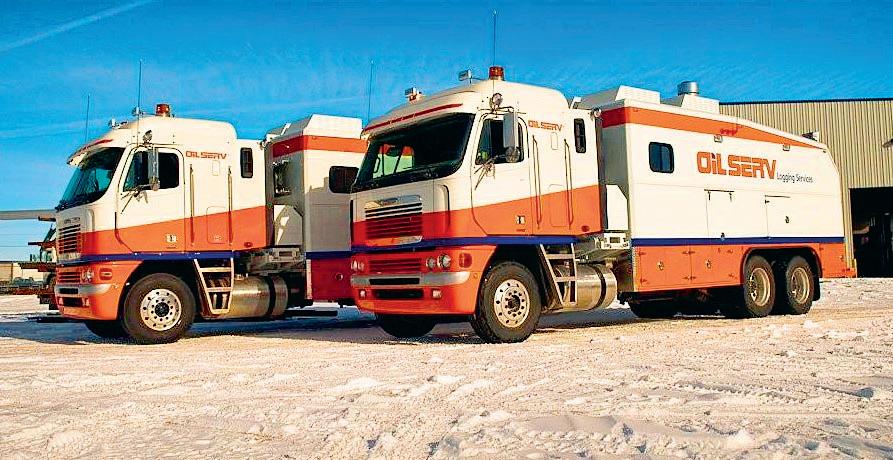
Unique system, Decades of tools performance and accuracy
(...Continued from page
themes, and price forecasts are extracted from these experts and shared independently with them. They then have an opportunity to modify their views if they wish. The ranges of views are posted for consideration and may be used to modify a deterministic or probabilistic forecast. Many companies use the Delphi method when they collect and compare price forecasts from a variety of sources to their proprietary forecasts.
oil is a commodity and its price is simply related to supply and demand. However, there are several controls and limits to supply and demand. As economic activity increases, so too does the demand for
AEO
AEO 1983
AEO 1984
AEO 1985
AEO 1986
AEO 1987
AEO 1989
AEO 1990
AEO 1991
AEO 1992
AEO 1993
AEO 1994
AEO 1995
AEO 1996
AEO 1997
AEO 1998
AEO 1999
AEO 2000
AEO 2001
AEO 2002
AEO 2003
AEO 2004
Actual
oil. As demand begins to exceed supply, additional product is withdrawn from storage and idle production capacity is brought online. If demand continues to exceed this new supply, prices continue to rise and unconventional resources, such as heavy oil and tar sands, begin to be developed and brought on-stream. Supply shortages drive prices higher and higher cost oil supply becomes economic. Eventually, price exceeds what users are willing to pay and consumers look to substitutes or begin to conserve, driving down demand for oil. That last barrel brought on-stream sets the upper price limit. Then, as demand wanes and prices fall, the highest-cost oil is shut in first as revenue per barrel falls below operating costs. As this process of higher-cost oil
exiting the supply chain continues, supply and demand will come into balance and the cost of that last barrel eliminated becomes the oil price floor. Figure 1 summarizes this relationship.
There is an upper limit to the price of oil. Peter Kirkham of Sunov Petroleum Advisors noted that per capita oil consumption declined after dramatic price increases in 1973 and 1979, dropping to a constant 4.5 barrels per person. Kirkham believes that an economic pain threshold had been reached in 1973 and 1979 and this threshold could be quantified by multiplying the per capita oil demand by the oil price of the day and dividing by per capita disposable income. Figure 2 uses US data and plots the per capita oil cost to disposal income ratio by year. During the period 1980 to 1982, per capita oil cost exceeded 5% of disposable income. By 1986, it had declined to 2% and remained there until 2004 when it began to rise to 5% in 2008. At peak oil price in mid-2008, the ratio exceeded 7%. Kirkham reports anecdotal evidence that consumer behaviour was changing in response to higher food and gasoline prices, indicating that demand erosion was already setting in before prices collapsed in September of 2008. He believes that when the cost of per capita oil consumption exceeds 5% of disposal income, consumer demand drops through conservation.
While supply and demand principles apply equally to natural gas, gas is a special case because its markets and supply basins are restricted to North America and inventory and production capacity are merged into one at storage facilities. In essence, gas fundamentals come down to storage and weather. Liquefied natural gas (LNG) is a small but important supply of gas to the North American market. LNG is like floating storage; supply travels the globe looking for the best price.
Like oil, gas demand is correlative with population growth and industrial activity and is forecast to rise in the long term. Industry, which had moved away from expensive natural gas, is switching back as prices have dropped; demand for gas-fired electrical generation is expected to increase as climate change strategies take hold, displacing coaland oil-fired facilities.
Supply forecasts can be easily built by characterizing North America supply basins on initial productivity (IP) and estimated ultimate reserves (EUR) per well. Making assumptions about the amount, timing, and
location of industry capital expenditures translates into wells drilled and production volumes added. Assumptions about typical production profiles allow consolidated production forecast to be built. Large databases and sophisticated automated decline-analysis algorithms make supply forecasts easy and accurate, as long as the assumptions prove to be correct. Natural gas supply forecasts are really an exercise in statistics.
The United States Energy Information Agency annually evaluates the accuracy of its oil and gas price forecasts, called the Annual Energy outlook (AEo ), by comparing the forecast from previous years to actual oil and natural gas prices today. Figure 3 plots oil price forecast from 1985 to 2003 with the actual price shown as a bold green line. The first observation is that every forecast shows increasing price in the future with progressively larger increases in later years. This characteristic gives rise to the term “hockey stick” forecasts. The second observation is that successive forecasts became more conservative as economists recognized that oil prices were staying flat. The third observation is that significant events impact forecasts; note that the most pessimistic forecast was made in 1999, the year oil traded briefly at $10 per barrel caused by oPEC increasing their production quota by 10% (oversupply) amidst the Asian financial crisis (expectation of lower economic activity).
While government agencies and think tanks build elaborate econometric models, many engineering firms simply start with current prices and escalate them at the rate of inflation. Canadian oil and gas price forecasts are additionally influenced by currency exchange rates. Price forecasts are based on US dollars and are geographically referenced to West Texas Intermediate at Cushing, oklahoma, for oil and Henry Hub, in Louisiana, for gas. Local or wellhead prices in Canada are set based on transportation, storage, and handling tariffs incurred to move product to these reference points. In Canada, oil price is referenced to Edmonton Par and gas to AECo.
Figure 4 shows the average annual difference between forecasted and actual prices over the forecast period. The equation used is [average((actual price – forecast price)/ forecast price*100)]. Clearly, the greatest forecast errors are seen to have been made in the early 1980s but have been consistently diminishing and have been
(Continued on page 33...)
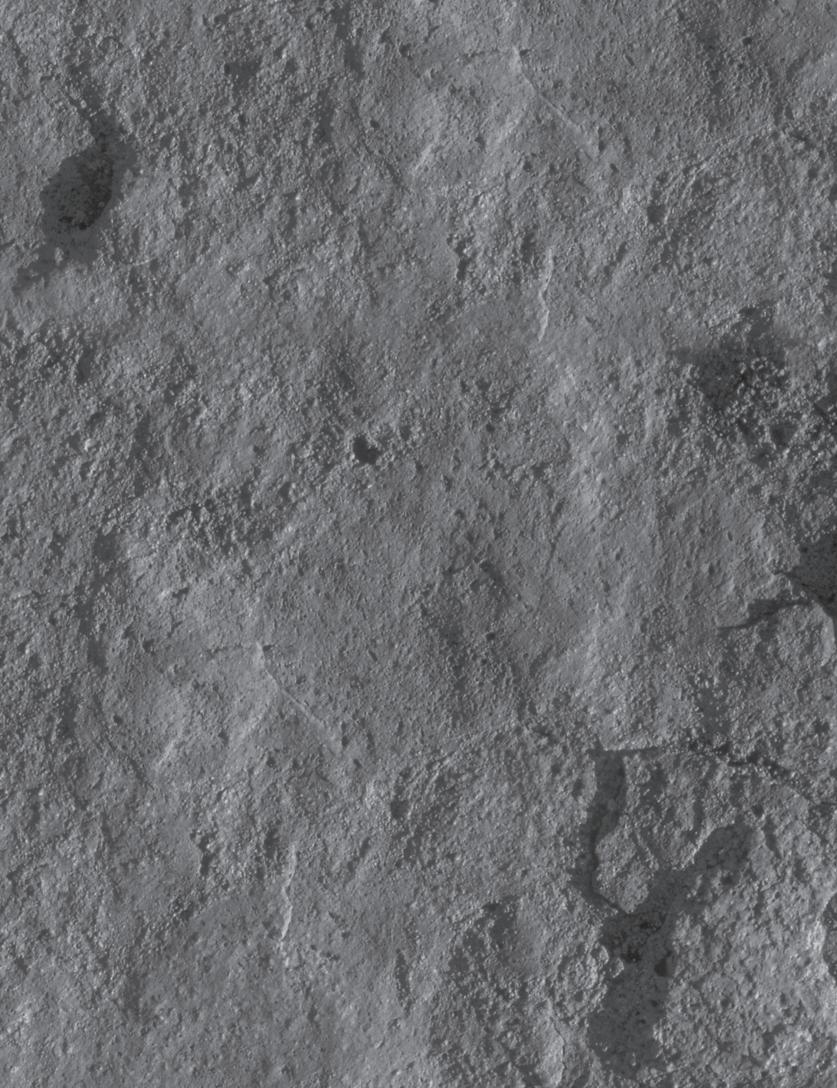


remarkably accurate since the mid-90s on average. Since 1999, surprisingly, forecasts have underestimated actual prices.
Natural gas forecasts show the same trends as oil; significant overestimation initially, muted optimism to 1994, and consistent underestimation since 1995. Figure 5 shows natural gas price forecasts by year and Figure 6 shows the average forecast deviation from actual price throughout the forecast life.
EIA analysts have identified several reasons for these forecast errors and they apply equally to corporate and institutional forecasts. Analysts found there were significant legal, policy, and regulatory changes in the United States subsequent to these projections being made, especially with natural gas. While estimates of consumption, production, and imports have been fairly accurate, technological improvement, erosion of oPEC market power, excess productive capacity, and market competitiveness have resulted in lower prices than forecasted in the 1980s. At the same time, overoptimistic price projections encouraged industry to increase production through drilling and a pessimistic view of exploration and production technology improvements led to under-estimation of production volumes. More wells with higher than expected rates resulted in surplus supply that led to lower prices. Natural gas price predictions have been continually challenged because of significant errors in resource estimates and unreasonably high projections of technological improvements. When these improvements did not materialize, analysts concluded there would be gas shortages and that underpinned a bullish view of future gas prices.
As we have seen, oil and gas price projections are difficult to make and are sometimes inaccurate. The best that can be hoped is that over the life of a project, actual average prices will be close to forecasts. Lower actual prices than forecasted early in the life of an investment are quite detrimental to NPv due to the time value of money. The financial success of a project is tied to higher than forecast prices, especially in early years.
To protect their investment, some companies hedge production by contracting with a counter-party who purchases a production stream for a fixed price. These counter-parties are often refiners, utilities, and brokers acting on behalf of others who
have a need for oil and gas feedstock for refined petroleum products, residential and industrial fuel, and electrical generation. Companies with hedged production can count on a “guaranteed” cash flow stream that allows them to service debt and provide capital for future investment but, because their prices are locked in, they cannot realize any financial gains from price up-ticks.
Companies with the strength to meet their financial obligations without hedging may use a “supply cost” calculation that determines a minimum price that generates a specific rate of return. That price is then compared to prevailing price forecasts and evaluated for probability of occurrence. For example, a project that generates a 15% return based on a gas supply cost of $3.00 may be judged as a low-risk project when prices have been averaging $7.00. More will be said about supply-cost calculations later in the series.
Most reserve evaluators and petroleum engineering consultants generate and post price forecasts that are used in assessing and valuing reserves and preparing engineering reports. Government agencies, banks,
financial institutions, financial analysts, and economists all have an interest in forecasting future prices for themselves or their clients. Price forecasts are often compared to one another to arrive at a consensus (the Delphi approach) and to identify spreads. Most companies use their internal marketing departments to examine prices and set corporate standards. The Chief Financial officer of a company usually decides what forecast will be used. These forecasts usually include oil, gas, natural gas liquids, and transportation and handling offsets that are applied to price projections.
oil and gas price forecasts ultimately are used as an input into a discounted cash flow model. “System Administrators” will often point the model to a corporate price forecast as a default so that all evaluations are done using a price standard and preventing erroneous or inappropriate price forecasts from other sources being used.
value Navigator, a sophisticated economic evaluation tool, can input annual prices for all products and offsets. It provides a list of
(Continued on page 34...)
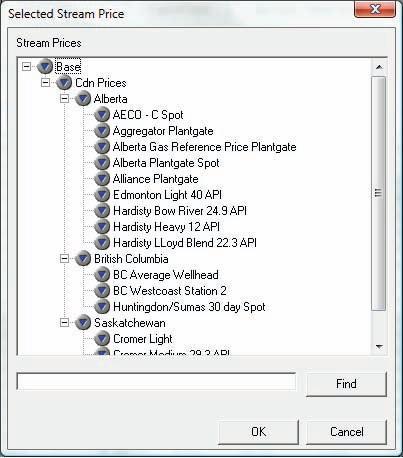
forecasts for a variety of oil gravities and quality, gas, and NGLs from which to select. When choosing a price forecast, it is always a good idea to check with the marketing department to ensure the most appropriate forecast is used.
These forecasts are loaded to a spreadsheet and become the source of revenue calculations in the economic model. Proprietary corporate forecasts are often loaded as a corporate default.
o ffsets to the price related to transportation, storage and handling are entered in a spreadsheet and applied in the program to adjust price appropriately.
Usually the team’s engineer works with oil or gas marketers to gather information on price forecast and offset selection but it is important that geologists know the impact that oil quality, gas liquid content, and transportation issues associated with their prospect have on revenue calculations.
SUMMARy
oil and gas prices have a significant influence on the NPv of projects and investments. Care must be taken to choose the most reasonable forecast available and there must be an expectation that the forecast will be wrong.
Campbell, John M. Jr., Campbell, John M. Sr., and Campbell, Robert A. 1991. Analysis and Management of Petroleum Investments: Risk, Taxes, and Time. Norman, OK. CPS.
Kirkham, P. 2009, April 27. Onset of Demand Destruction. URL http://www.sunovpetroleum. com/category/oil-price-fundamentals/07 July 2009.
Kirkham, P. 2009, April 27. The Most Expensive Barrel. URL http://www.sunovpetroleum.com/ category/oil-price-fundamentals/07 July 2009.
Support for this series is provided by Energy Navigator who have reviewed articles, supplied technical consultation, and critiqued manuscripts. We thank them for their help.
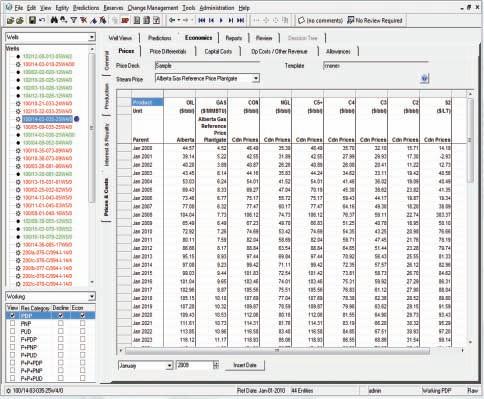
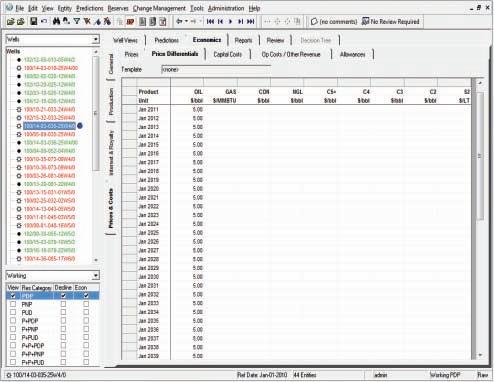
“NeuraSection is unbelievable! I loaded all my data, started correlating and created cross sections in under an hour! Why haven’t I heard about this application before?”
Steve Jackson, Geophysicist, Texas Standard Oil & Gas, LP

Intuitive and user-friendly tools to construct an integrated evaluation of your prospect. Correlate logs, build multi-layer maps and create presentation cross sections with ease using any data format. NeuraSection is the only geological evaluation solution you will ever need!
• Raster and digital well log correlation
• Structural and stratigraphic cross sections on-the-fly
• Multi-layer structural and net pay mapping
• Proprietary and vendor data support
• Presentation quality montages
For more information contact sales@neuralog.com or visit us online at www.NeuraSection.com

“I love the new NeuraSection, it works the way a geologist thinks.”
Carol Shiels, Geologist, Shiels Engineering

Cal G ary, a lberta May 10–14, 2010
WoRKinG WitH t HE EARtH
GeoCanada 2010 is a once-in-a-decade opportunity for anyone who works with the Earth. This valuable event provides the opportunity to discuss and explore the latest developments across a complete spectrum of Earth Science professions. It is the ultimate opportunity to gain insight into your profession and the Earth, sharing experiences and knowledge with your peers from across Canada.
Beginning October 15th GeoCanada 2010 will be accepting abstracts for oral, poster and core presentations. The Technical Committee encourages and supports proposals from all facets of the Earth Science community. For a complete list of technical sessions and full details on the abstract submission process, please visit the GeoCanada 2010 website at www.geocanada2010.ca
WoRKinG WitH tHE EARtH www.geocanada2010.ca


| By Dave Hills, Geological Calendar Chair.


It’s November, which means that along with the issue of the Reservoir, CSPG members will also be receiving the 2010 CSPG Geological Calendar, and it’s looking better than ever. I doubt that there has been a year in which the calendar judges have been so spoilt for choice, thanks to the fantastic quality of shots that were submitted. Not only were the images of good quality, but they have also covered the gamut of Canadian geography and scale, including Ultramafic intrusion thin-sections from Quebec, to deep red tidal channels in Nova Scotia, to the majestic fiord-laden vistas of Ellesmere Island. Also in keeping with past years, we have included some overseas geology. Photos in this category include views of intriguing Tertiary Pancake Rocks of New Zealand, and Miocene granitic towers of Torres del Paine in Chile.
and artistically outstanding shot, marvelously captures depth and colour of finely bedded dolomites, overlain by a series of tidal flat sequences. Use of perspective, showing the beds converge into the distance gives this photograph significant impact that would give the calendar cover a truly professional look.

Despite the high quality of all of the photographs picked for this year’s calendar, our nine-strong judging panel had only a little difficulty in picking this year’s prizewinners for the ‘Best Canadian Photo’ and ‘Best Photo’ awards. For ‘Best Canadian Photo’ Jay Guilmette wins for his image of Mount Yamnuska, Alberta. Despite this being a familiar view to members in the Calgary area with its profile of the McConnell Thrust, Jay has managed to capture the scene in low morning light during the fall. The end result is an enrichment of the colour palette that shows the splendours of this autumnal scene.
Prize for ‘Best Photo’ goes to Peggy Hodgkins’ shot of the Eldon and Pika formations of Yoho Glacier, British Columbia. This technically

Congratulations to both Jay and Peggy, who will both receive prize money of $200. Also, congratulations to our other photographers that made it into the calendar, all of which will be available on the CSPG website as downloadable wallpapers.
I’d like to thank everyone who sent photos for submission to this year’s calendar, and if


you were unsuccessful, please have another go next year. Thanks also to Shannon Acton, Adam Westlake, Don Yep, Erin Linley, Gerry Yamada, Derrick Budden, Justine Sagan, Tamara Holmes, and Hamid Farid for lending their geological and photographic knowledge to the judging panel and making this year’s selection process as enjoyable as ever. And finally, thanks to Heather and Alyssa for their fantastic efforts at the CSPG office.
With that, I suggest you grab a warm beverage of your choice, put your feet up on the desk and leaf through your 2010 CSPG Geological Calendar.
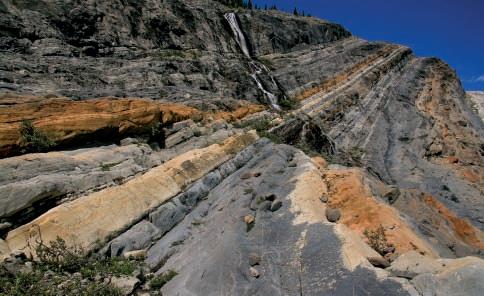


Following the closure of the Executive Nominations on September 15, 2009, a new CSPG Executive is poised to take office in January 2010.
education : B.Sc. Geophysics, University of British Columbia (1979); M.Sc. Geophysics (Seismology), University of Calgary (1984); Ph.D. Geology and Geophysics (Tectonics), University of Calgary (1992).


exPerience: Geophysicist, Canada Cities Service (1979-1982); Geophysicist, Petrel Consultants (1984-1986); Geophysicist / Geologist, Petrel Robertson (1990-1993); Geophysicist / Geologist, Amoco Canada Petroleum Co. Ltd. (1993-1999); Exploration Geoscientist, BP Canada Ltd. (1999-2000); Exploration Geoscientist, Alberta Energy Co. (2001-2002); Group Lead, EnCana Corporation (2002-2008); Advisor Strategy, EnCana/Cenovus (2009-Present).
ProFessionaL
memBershiPs: CSPG, AAPG, APEGGA, CHoA, CSEG, SEG.
csPg actiVities: Structural Division Chair and Member (1993-1996); Medal of Merit Committee (1997-1998); GeoCanada 2000 Convention (1998-2000); Bulletin of Canadian Petroleum Geology Associate Editor (1999-2002); Convention Committee Member (2001); Emerging Petroleum Resource Division Co-Founder (2002); Joint Annual Convention Co-Chair (2007); CSPG vice-President (2009).
PuBLications: Published, as a lead or co-author, nearly 30 papers on a variety of geophysical and geological topics and presented numerous papers at CSPG and CSEG conventions since 1985.
aWards: CSPG Service Award (1996); CSPG Tracks Award (2001); CSPG President’s Award (2007).
education : B.Sc. Geology, University of Toronto (1978); M.Sc. Geology, University of Toronto (1983).


exPerience: various positions in Exploration departments of Gulf Canada Resources Inc. and Petro-Canada Exploration Inc.; Program Manager of ESS’s, Gas Hydrates – Fuel of the Future Program; Lead, Geoscience research programs for the office of Energy Research and Development; collaborating partner and co-investigator on research projects and activities funded by: Energy Sector NRCan, the Yukon Geological Survey, AECL Research Ltd., the Canadian International Development Agency, the National Energy Board, the Australian Research Council, and the French Petroleum Institute; Currently Head, Energy Geoscience (formerly Energy and Environment) Subdivision at the Geological Survey of Canada (GSC): Calgary, a Division of Earth Sciences Sector (ESS) in Natural Resources Canada; Also Lead, National organic Geochemistry and organic Petrology Laboratory in ESS’s Scientific Laboratory Network.
csPg actiVities: Assistant Finance Director and Finance Director; Co-Chair of the Technical Luncheon/Program Committee; Convention Technical Program Co-Chair and Convention Committee Member; Associate Editor, Bulletin of Canadian Petroleum Geology (2 terms); Lecturer for CSPG Advantage Educational program; Field trip co-leader for southern Alberta Foothills Field Trips (CSPG, Joint AAPG-CSPG Conventions, CSPG Structure Division); speaker and poster contributor for Technical Luncheons, Gussow Research Conferences, CSPG Division meetings and Annual Conventions. research interests : Petroleum geoscience, natural gas hydrates, petroleum resource assessment, and Arctic geoscience; contributed to both the Canadian Gas Potential Committee national assessment and the Petroleum Technology Alliance of Canada’s unconventional gas technology roadmap.
aWards: Coleman Gold Medal in Geology (University of Toronto); Chevron Scholarship (University of Toronto); CSPG Tracks Awards (1997, 2002); CSPG Service Award (2006); CSPG Hunter volunteer Award (2008); CSPG Annual Convention Best Poster Runner-Up Award; NRCan Earth Sciences Sector and Divisional Merit Awards (3).
education : B.Sc. Honours Geology, University of Alberta (1975); M.Sc. Geology, University of Alberta (1979).


exPerience: Exploration Geologist, HBoG (1977); Senior Geologist, Thomson Jensen Petroleum Ltd. (1982-1987); President, Quarter Point Resources; Senior Staff Geologist, Husky oil (1988-1993); Senior Geologist, Chauvco (1993-1995); Senior Geologist, Startech Energy Ltd. (1995-1998); Senior Geological Advisor, Ulster Petroleum (1998-2000); Exploration Manager, Geotechnical Services, Anderson Exploration and Devon Canada (2000-2002); Exploration Manager, Peace River Arch and Unconventional Resources, Devon Canada (2002-2007); vP Exploration, West Energy Ltd. (2007-2009); vP Exploration, Canada Capital Energy Corporation (2009).
ProFessionaL
memBershiPs: CSPG, AAPG, APEGGA, CWLS, SEPM.
csPg actiVities: Manpower Committee (1981-1985); Short Courses (early 1990s); Technical Co-Chair Convention (1995); Chair, CSPG Trust (2001-2004); CSPG President (2009).
PuBLications: Co-led a variety of CSPG field seminars to Grassi Lakes, Chester Lake, Sawtooth Range, Montana; Co-authored a variety of core workshop presentations, poster, and oral presentations at CSPG conventions on reservoir attributes, stratigraphy, and exploration models; Co-organized several short courses on carbonate reservoirs and porosity development.
aWards: CSPG volunteer Award (2004).

EDuCatiOn: B.Sc. Geology, University of Ottawa (1983); M.Sc. Geology, Washington State University (1985); Ph.D. Geology, University of Alberta (1989).
ExpERiEnCE : Research Scientist, Geological Survey of Canada (1989-1998); Exploration Geologist, Shell Canada Limited (1998-Present)
pROFEssiOnal
MEMbERships: CSPG, APEGGA.
CspG aCtivitiEs: Student Industry Field Trip (SIFT) co-leader (1999-2005); Associate Editor, Bulletin of Canadian Petroleum Geology (2001-03, 2005-07); CSPG Assistant and Outreach Director (2007-2008); CSPG Assistant Finance Director (2009).
publiCatiOns: Papers on Cordilleran and Appalachian geology; conference presentations on oil and gas geology.
awaRDs: CSPG Volunteer Appreciation Award; GSC Service Award.

EDuCatiOn: B.Sc. Engineering, University of Calgary (1982).
ExpERiEnCE : Wellsite Formation Evaluation Operations and Management, Canada, North Sea, N.Africa, Malaysia, Baker Atlas (1983 -1998); Geoscientist, Canada, Baker Atlas (1998); Borehole Imaging (2003); Fractured Reservoir Characterizations (2004); Sales Manager, Canada, Baker Hughes (2006); Division Management, Canada, Baker Hughes (2008-Present).
pROFEssiOnal
MEMbERships: CSPG, CSEG, CWLS
CspG aCtivitiEs: Joint Annual Convention, Finance Chair (2006-2008).
awaRDs: CSPG Service Awards (2007-2009).

EDuCatiOn: B.Sc. Physical Geography, Simon Fraser University (1998); M.Sc. Earth Sciences, Simon Fraser University (2000).
ExpERiEnCE : Geologist, PanCanadian Petroleum (2000-2002); Geologist, EnCana Corporation (2002-Present).
pROFEssiOnal
MEMbERships: CSPG, APEGGA, SEPM.
CspG aCtivitiEs: SIFT Clastic Core Workshop (2001-2003); Sedimentology Division Chair and Co-Chair (2001-2004); Committee on Conventions / JACC (2004-2006, 2009); Joint Annual Convention Technical Co-Chair (2008); CSPG Assistant Program Director (2009).
awaRDs: Graduate Student Award, Best Master’s Thesis (2001); Service Award (2005, 2008); Volunteer Award (2007).

sERviCEs
EDuCatiOn: B.Sc. Geology, University of Toronto (1986); M.Sc. Geology, University of Western Ontario (1989).
ExpERiEnCE : Geologist, Esso Resources Ltd. (1988-1991); Geologist, Interra Petroleum Consulting (1991-1994);Geologist, Ranger Oil Ltd. (1994-1995); Lecturer (p/t), McGill University (1995-1996); Geological Consultant (1995-1997); Geologist, Anderson Exploration (1997-1998); Team Lead, Exploitation Manager, Nexen Inc. (1998-2003); VP Geosciences, Paramount Energy Trust (2003-2006);Exploitation Manager, TransGlobe Energy Corp. (2006-Present).
pROFEssiOnal
MEMbERships: CSPG, AAPG, APEGGA, SPE.
publiCatiOns : Norris has published several articles in CSPG’s Bulletin and SPE on various topics, ranging from Western Canadian stratigraphy and sedimentology to international production issues. In addition, he has presented at the annual CSPG convention on topics covering stratigraphy and sedimentology to geostatistical analysis and modeling.


EDuCatiOn: B.Sc. Geology, University of Calgary (2003); B.A. Minor Applied Energy Economics, University of Calgary (2003).
ExpERiEnCE : Staff Geologist, Coastal Resources Ltd. (2003-2005); Staff Geologist, Shiningbank Energy Trust (2005-2007); Exploration Geologist, NuVista Energy Ltd. (2007-Present).
pROFEssiOnal
MEMbERships: CSPG, AAPG, APEGGA.
CspG aCtivitiEs: Membership Chair (2005-2007); CSPG representative for AAPG Conference (2007); CSPG Assistant and Services Director (2008-2009).

education : B.Sc Honours Geology, London University (1976).
exPerience: Mudlogger/Wellsite Geologist, Geoservices, (1976-1979); Exploration Geologist, PetroCanada (1980-1982); Reservoir Quality Mineralogist, BP Canada (1981-1984); operations Geologist, Home oil (1984-1986); Field Engineer, Delta-P Test Corp. (1987-1988); Geoscience Supervisor, AGAT Laboratories (1988-1995); Geoscience Supervisor, Core Laboratories Canada Ltd. (1995-1997); Rocks Manager, Core Laboratories Canada Ltd. (1997-2001); General Manager, Core Laboratories Canada Ltd. (2001-Present).
ProFessionaL
memBershiPs: CSPG, APEGGA, SPE.
csPg actiVities: Founder, Petrology Division; Reservoir Editor (1994-1999); ICE Convention 2004.
aWards : CSPG Service Award (1996); CSPG Tracks Award (1998).
education : B.Sc. Geology, University of Alberta (1997); M.Sc. Earth and Atmospheric Sciences, University of Alberta (1999); Ph.D. Geological and Environmental Sciences, Stanford University (2006).

exPerience: Development Geologist, Shell Canada Ltd. (1999-2001); Assistant Professor, University of Calgary (2006-2009).
ProFessionaL
memBershiPs: CSPG, AAPG, SEPM, GSA, IAS, EAGE.
csPg actiVities: Sedimentary Geology Division Co-Chair (2007-2009); Annual Meeting Session Chair (2007-2009); Speaker, Honorary Address (2008).
aWards : CSPG Honorable Mention, Best Canadian Petroleum Geology Paper (2003); CSPG Andrew Baillie Award (oral presentation) (2005); CSPG Andrew Baillie Award (poster presentation) (2005); CSPG volunteer Award (2007, 2008); GSA Bulletin, Exceptional Reviewer Award (2008); Dept. of Geoscience, University of Calgary, Excellence in Research Award (2008).
PuBLications : Hubbard has published 25 peer-reviewed scientific papers and is co-author of more than 55 presentations at national and international conferences.
education : B.Sc. Honours Geology, Carleton University (1976); Ph.D. Geology, University of Calgary (2000).

exPerience: Mineral Geologist, Norcen Energy Resources, Phillips Management Inc., Urangesellschaft Canada (1975-1979); Sr. Geologist, Dome Petroleum (1979-1983); Sr. Petroleum Geologist, Geological Survey of Canada (1984-1994); Chief Geologist, Hardy oil & Gas Canada (1994-1995); President, Springtide Energy Ltd. (1995-1996); Regional Geologist, Poco Petroleums/Burlington Resources (1996-2001); Exploration Manager, Ice Energy Limited (2001-2002); Consulting Geologist, Java Energy Inc. (2002–2003); vice-President Exploration, Southpoint Resources Ltd. (2002–2004); Sr. Staff Geologist, Burlington Resources/ ConocoPhillips (2004-present).
ProFessionaL
memBershiPs: CSPG, CWLS, AAPG, GAC, APEGGA.
csPg actiVities : CSPG Stratigraphic Nomenclature Committee (1991 – present); organizing Committee and Technical Program, CSPG Pangea Convention (1993); Co-Chair, Core Conference, CSPG-CSEG-CWLS Convention (2006); Associate Editor, CSPG Bulletin (2005-2007); Chairman Technical Programme, CSPG 75th Anniversary Convention (2002); Chairman and member, Medal of Merit Committee (1997-2006); Douglas Award Nominating Committee, for Dr. Graham Davies (2002); organizing Committee and Chairman Core Workshop, International Congress on the Carboniferous and Permian (1999); CSPG Executive (1996-1997); Critical reviewer of many CSPG and other publications, volunteer mentoring, (1984-present).
aWards : CSPG Best Ph.D. Award (2001); CSPG volunteer Award (2003); CSPG Service Award (2005); ConocoPhillips Special Recognition Award (2007); ConocoPhillips Special Recognition Award (2008).
PuBLications: Barclay has published 34 geological papers. He has given many formal talks, posters, and core displays at conferences. He has also given numerous informal talks at oil companies, universities, and schools.


education : Hons. B.Sc. Geology, University of Waterloo (1982).
exPerience: Exploration/Development Geologist, Gulf Canada Resources Ltd. (1982-1996); Geologist, Canadian Natural Resources Ltd. (1996-2006); Geologist, Crew Energy Inc. (2006-2007, 6 months); Contract Geologist, ProspEx Resources Ltd. (July 2007-2008); Team Leader, Talisman Energy (2008-Present).
ProFessionaL
memBershiPs: CSPG, APEGGA.
csPg actiVities: SIFT Committee (1995-2006), Poster Chair (2001 Convention).
aWards : CSPG volunteer Award, CSPG Service Award, CSPG Tracks Award (2006).


education : B.Sc., General Science, University of New Brunswick (1974); M.Sc., Geology, University of New Brunswick (1977).
exPerience: Exploration Geologist, PanCanadian Petroleum (1979-1994); Exploration Geologist, Ulster Petroleum (1994-1996); Exploration Geologist, Calahoo Petroleum (1996-2000); Exploration Geologist, AEC/EnCana (2000-2004); Exploration Geologist, Trifecta Resources (2004-2006); Consulting Geologist, various clients (2006-Present).
ProFessionaL
memBershiPs: CSPG, AAPG, APEGGA.
PuBLications : Dryer, Stephen and Alan Logan (1978) “Holocene Reefs and Sediments of Castle Harbour, Bermuda,” Journal of Marine Research, vol. 36, No. 3, p. 399-425.
| by Tannis McCartney
CSPG’s Undergraduate Award is designed to recognize outstanding students in their third or fourth year of a geology program at a Canadian university. The primary criterion for this award is enthusiasm and interest in soft rock/petroleum geology.
The applications for these awards included a statement of the student’s interest in soft rock geology and the importance of petroleum geosciences to Canadian society, as well as a signed letter of reference from a professor. Additionally, award winners showed their interest in soft rock and/or petroleum geosciences through summer or term employment, course and thesis choices, research opportunities, and volunteer work.
Any student interested in applying for these awards in the future should join the CSPG as a student member, at no cost, and keep an eye on the Awards postings at your university for further details. one award is available to a student from each accredited undergraduate geoscience program in Canada.
Thanks to the sponsorship of this award by ARC Financial Corp., six students received the Undergraduate Award in 2008-2009. Congratulations to the following students:
Jonathan Menivier – McGill University, Dave Anthony – University of ottawa, Francis Fortin-Morin – Université Laval, Steve Holland – University of Windsor, Joel Shank – University of Western ontario, Daniel Cederwall – University of Saskatchewan.
The CSPG Undergraduate Student Award is sponsored by:
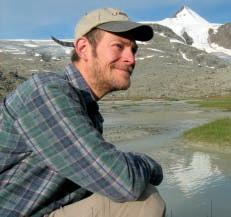


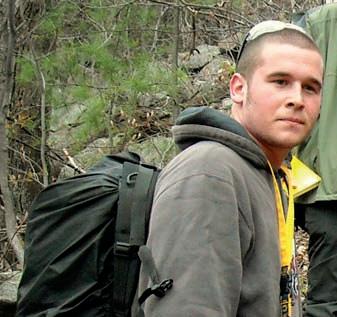
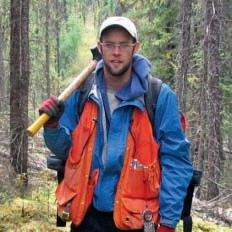
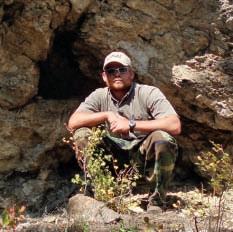
The CSPG and tournament participants would like to thank:
PLATINUM SPONSOR
The CSPG and tournament participants would like to thank:
PLATINUM SPONSOR

GOLD SPONSORS
SILVER SPONSORS
HOLE SPONSORS
Belloy Petroleum Consulting Ltd.
Boyd Petrosearch
CL Consultants Limited
Command Equipment Ltd.
Enseco Energy Services
FirstEnergy Capital Corp.
Nexus Exhibits Ltd.
Pro Geo Consultants
DeGOLYER & MacNaughton Canada Ltd.
RPS Energy Canada Ltd.
Edge Technologies Inc. Sproule
Belloy Petroleum Consulting Ltd.
Boyd Petrosearch
CL Consultants
Command Equipment Ltd.
DeGolyer & MacNaughton
Aramark
Canada Ltd.
DeGolyer & McNaughton Canada Ltd.
Genesis Executive Corporation
Birchliff Energy Ltd.
Edge Technologies
Enseco Energy Services
Global Energy Services Ltd.
GMP Private Client Reinson Consultants Ltd.
Sigma Explorations Inc.
Weatherford


FirstEnergy Capital Corp.
Total Gas Detection Ltd.
Nexus Exhibits Ltd.
Weatherford Labs
Pro Geo consultants
RPS Energy Canada Ltd.
Sproule
Aramark
Birchcliff Energy Ltd.
DeGolyer & McNaughton
Canada Ltd.
Genesis Executive Corporation
Global Energy Services Ltd.
CMP Private Client
Reinson Consultants Ltd.
Sigma Explorations Inc.
Total Gas Detection Ltd.
Weatherford
Weatherford Labs
| by David Caldwell
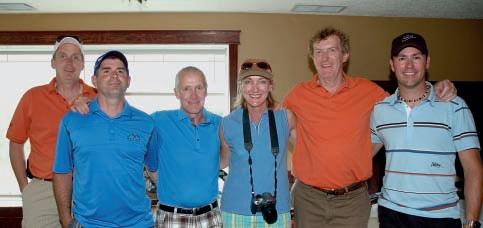
Great weather usually means great golf and this year was no exception as CSPG celebrated its 20th Anniversary Mixed Golf Tournament. For the second year in a row, Lynx Ridge Golf Course hosted the popular social event. Despite the slowdown in the industry, the golf tourney was once again sold out with a few people on the waiting list. Sponsorship was also strong, matching last year’s totals in funds raised and surpassing prize donations from any previous years. While some sponsors had to opt out due to the poor economic conditions in the oilpatch, others were eager to fill the spots.
Canada Brokerlink (formerly FMA Insurance) continued as the Tournament Sponsor for the 20th year in a row. Tucker Wireline continued their support with the traditional Putting Contest. IHS and AGAT hosted tent spots on Par 3s again. Meanwhile, Hotwell Canada, Cougar Consultants, and Sensor Geophysical grabbed the remaining Par 3s to welcome golfers with food and beverages.
o ther large sponsors included GLJ Petroleum Consultants and MJ Systems who sponsored the banquet dinner. Exovo (formerly Bodycote) hosted the Continental Breakfast once again as golfers made their way into the clubhouse to register and buy Mulligans and 50/50 tickets. Logtech (now IHS) hosted the Driving Range where golfers practiced furiously before the big tourney. Schlumberger graciously provided the scoring system from ACE Tournament Services for the second year in a row. geoLoGIC took pictures of teams trying to find the “wackiest team” as they teed off
on Hole 10. Energy Navigator was also a significant contributor to the tournament.
Hole sponsors this year included: Belloy Petroleum Consulting, Boyd Petrosearch, CL Consultants, Command Equipment, DeGolyer & MacNaughton Canada, Edge Technologies, Enseco Energy Services, First Energy Capital, Nexus Exhibits, Pro Geo Consultants, RPS Energy Canada, and Sproule.
Great weather conditions and great golf course conditions allowed for some of the lowest scores in recent tournament history. Low Gross winners of the 20th Anniversary Golf Tournament were Mike Hartwick, Robert Calow, Fraser MacNichol, and David Middleton with a score of 61…three strokes better than last year’s 64. Low Net went to the “Sandbagging” team of Tom Charuk, Rex Brigan, Warren Dublonko, and Dan Krpan
with a score of 55.42. The team that had the most fun with a score of 77 was Travis Nicolle, Scott Thain, Shelley Pawlak, and Andrea Henry.
Highlights of the tourney were quite widespread. Norm Hopkins won the coveted mountain bike prize. Murray Larson put on a short game display at the Tucker Putting Contest knocking in two out of three long putts. Dan Krpan bought the lucky winning card for the large 50/50 prize of almost $1,200 only to share his winnings with 20 eager friends on the patio after the tourney had concluded.
The tourney once again raised significant money through the 50/50 and Mulligan tickets that went towards helping steer students towards careers in earth science. This was helped by the CSPG office handing out sleeves of golf balls as players doled out money for important draws.
A big thanks to the committee who put in countless hours of their own time to help make this 20th Anniversary Tournament the best one yet. Members included Darin Brazel, David Caldwell, Penny Christensen, Norm Hopkins, Brenda Pearson, Dick Willott, and Hugh Wishart. Thanks to Alyssa Middleton and Dayna Rhoads for their help from the CSPG office and to Penny Colton for helping out with CSPG Golf balls and pictures.
We hope to see everyone back next year on Friday August 27th at Lynx Ridge Golf Course.
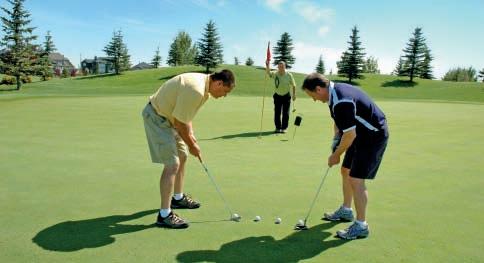
www.cspg.org
www.cspg.org
Thank You to the Generous Sponsors of the 21st ANNUAL CSPG-CSEG
Thank You to the Generous Sponsors of the 21st ANNUAL CSPG-CSEG
Thank You to the Generous Sponsors of the 21st ANNUAL CSPG-CSEG
10K/5K ROAD RACE AND FUN RUN
10K/5K ROAD RACE AND FUN RUN
10K/5K ROAD RACE AND FUN RUN


www.cspg.org ReSurge
ReSurge
www.cspg.org ReSurge


| by Mike Cardell, Road Race Chair
The annual CSPG/CSEG Road Race and Fun Run was held on a very warm September 16th. The record heat may have deterred some, but a very enthusiastic and hardy crowd of 161 runners bolted from the start line. This year marked our second year for the 5 kilometre event and we saw a large increase in participants. Winning Time provided chip timing which makes the finish line volunteering much easier. once again, the course was highlighted using unique distance markers which are based on geologic time. Like every year it was great to see a mix of competitive and first-time runners and from comments overheard, it was a good experience for all. The postrace social was held at The Distillery and the mix of racers and volunteers devoured a large number of pizzas and copious amounts of beer. The evening was topped off with door prizes, awards, and of course our now famous sock toss. Through great sponsorship and participation in a very trying year, we were still able to contribute to the Educational Trust Fund and to the YMCA Strong Kids Foundation!
I would like to thank all the volunteers and sponsors who helped make this event a success! Thank you also to all the runners. It was a pleasure cheering you in at the finish line.
This year’s sponsors were: Platinum: IHS, geoLoGIC systems ltd., and Gord’s Running Store; Gold: Earth Signal Processing, Divestco, Paradigm, and Total E&P Canada; Silver: Paramount Energy Trust, CGGveritas, Devon, Sensor Geophysical, ReSurge, Sproule, and WesternGeco; and Bronze: Arcis, Apoterra Seismic Processing, Belloy Petroleum, Chiropractic Performance and Sports Therapy Centre, Edge Technologies, Continental Laboratories, Pulse Data, AGAT Laboratories, Pro Geo Consultants, Sigma Exploration, RPS Energy, and the Eau Claire YMCA.
Finally I would like to extend a huge thankyou to the group of people on the Road Race Committee that helped me this year: Chris Manion, Matt Hall, Kathy Taerum, Kathy Waters, Jocelyn Frankow, Greg Hayden, Cindy Koo, Mike Cardell, and Alyssa Middleton and Dayna Rhoads at the CSPG office. As well, thank-you to the staff at the Eau Claire YMCA.
For more information on run times and placement, please see www.winningtime.ca.
We look forward to seeing you next year for the 22nd annual run; the race date will be September 15, 2010. Remember to register early next year, to avoid disappointment.
Here are the CSPG winners of the 10K portion. Full race results are on http://www. cspg.org/events/events-social-funrun.cfm.
P: 403-266-8800
Email: rob@rjderkitt associates.com
Ourclient,aggressivelypursuinganumberof“pure”explorationplaysthroughout theBasin,isseekinganexceptionalindividualforitsExplorationTeamasits
Working closely with the Director of Exploration and the team’s Geo-scientists and Engineers, you will be an active participant in the identification, evaluation and execution of new exploration investment opportunities through your Petrophysical assessments and analyses.
A professional Geoscientist or Engineer with advanced training in Petrophysics, the preferred candidate will undertake comprehensive Petrophysical evaluations that define the Expected Ultimate Resource (EUR) of a play trend through log & core analysis. Your industry background will cover the entire range of Petrophysical issues encountered, from exploration to development, including the design of well logging programs, quality control of acquired log data, formation evaluations of critical wells, creating final log curve for input in reservoir models, reservoir characterization, and determining rock properties for seismic models. Familiar with various software packages, you will provide time critical log evaluations for drilling operations while integrating your Petrophysical work with geophysics, geology and reservoir engineering.
Tenacious, analytical and creative, your well-developed interpersonal and communication skills, coupled with strong organizational and project management abilities, will allow you to contribute to and provide your expertise and opinion on a multitude of ongoing plays and prospects. Possessing a pleasant, enthusiastic and mature personality, the ideal candidate will be recognized as being the ultimate team member through his/her ability to share and encourage new ideas and concepts.
Interested candidates confident of their ability to apply their expertise within this well-funded and success-oriented exploration team are encouraged to respond to Rob Derkitt in complete confidence at 266-8800 or by email at rob@rjderkittassociates.com.
| By Philip Benham (Shell Canada) and Heather Tyminski (CSPG Communications Coordinator)
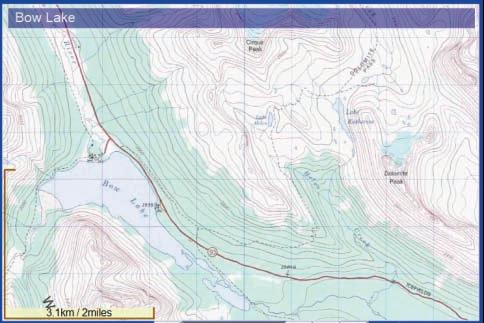
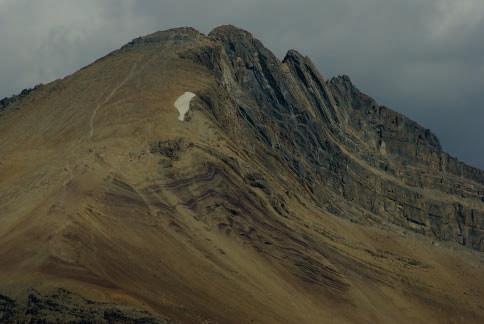
The CSPG Reservoir will be printing a new series of articles on a monthly basis if there are sufficient submissions. The focus of the series is of hikes or short walks that have a destination of interest to geologists. Naturally most of the articles will be on western Canadian hikes but submissions for destinations all over the world are welcome. The topic of the hike can be any aspect of geology; the intent is that these are treks that geologists, and their friends and families might be interested in doing. These instructions are so that articles will have similar format and feel.
The articles should be written to fill two pages of the Reservoir. Articles will have three components: photographs, a map, and text. The bulk of the two pages should consist of photographs that highlight the features of the hike. These photos can be annotated to identify interesting geological features. Each photo shoud have a figure number. Accompanying text describing the photo is encouraged.
The map should contain appropriate location information and scale. The trail route should
be clearly marked. Numbers should be placed on the map to identify the location of the photos. Maps can come from a variety of sources including scanned images. Other options include Google Earth (www.earth. google.com) and www.yellowmaps.com which has topo maps for all of Canada. Map sources should be appropriately credited. For example, Yellowmaps should be credited as “courtesy of Canmaps.com and Department of Natural Resources Canada.”
Text is a small portion of the article but plays a critical role. It should be concise and provide sufficient information to both intrigue and inform the hiker. Hike title should fit on one line. Trailhead location, hike distance, and elevation gain will be contained in a blue box to start the article. The body of the article should ideally be no more than 150 words but could be as much as 250 words if you are willing to sacrifice some photo space. Topics you should cover include the trail itself, best time of year to hike (if relevant), and, of course, the geological highlights. If there are geological field guidebooks or published articles that will be of useful reference to hikers please include them.
The submission can be in Word or PowerPoint and should be in the form that you would prefer the article to appear. Page orientation should be in portrait. All photos should be appropriately annotated. In addition, please submit the non-annotated photos as separate jpeg or tiff files. The editor may need to adjust the article configuration to fit appropriately within the Reservoir. If you want a better idea of format for the articles keep an eye out for “Go Take a Hike” appearing in recent issues of the Reservoir.
If you have a hike that you would like to publish please first contact Philip Benham (Philip.Benham@shell.com or 403-6913343) or Heather Tyminski (heather. tyminski@cspg.org or 403-513-1227). We are coordinating submissions so that there is a variety of topics and no duplication of hikes. Submission deadlines for the Reservoir are prior to the 23rd of every month. Depending on the number of Go Take a Hike articles in the hands of editors your hike could be printed a minimum of two months after submission. All article submissions should be sent to Heather Tyminski.

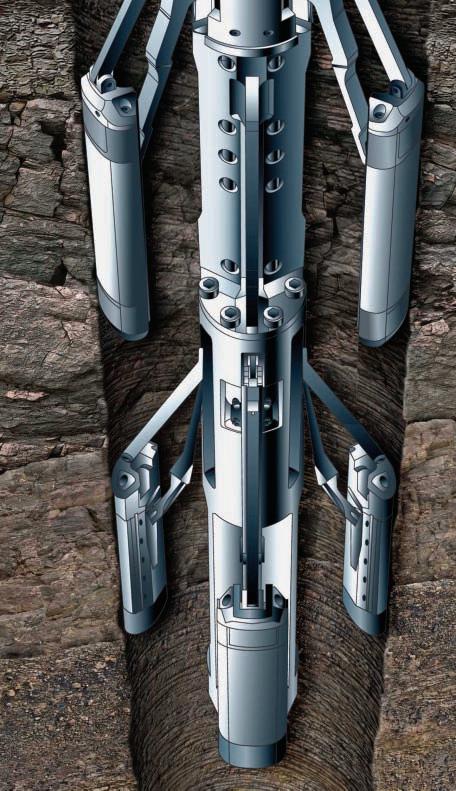

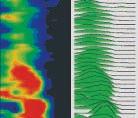

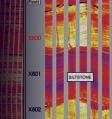

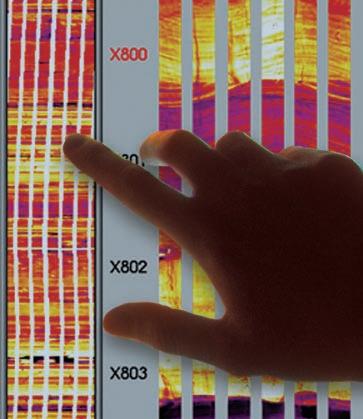
at www.halliburton.com/wireline.

THANK YOU. Without you there, we wouldn’t be leading the way in superior customer service.
Leading the way with customer-driven data, integrated software and services for your upstream decision-making needs.
geoSCOUT | gDC | petroCUBE at www.geoLOGIC.com