


In appreciation of our customers’ continued business, we’re inviting you to Experience Africa with IHS September 17th, 2008 ihs.com/ExperienceAFRICA
In appreciation of our customers’ continued business, we’re inviting you to Experience Africa with IHS September 17th, 2008 ihs.com/ExperienceAFRICA
“As a pioneer AccuMap® client in 1989, our feedback helped produce what’s now a fast, efficient tool. Just like our industry, AccuMap keeps evolving — on a convenient platform, that consistently delivers. Take away our AccuMap and everything would grind to a halt.”
Warren
J. Doenz, P.
Geol. Vice President, Exploration Action Energy Inc.
Visit us at ihs.com/connect and discover how AccuMap can boost your bottom line.

Warren’s right. AccuMap software is the industry-leading SOURCE for E&P data. Continually improving, AccuMap is a tool built for the industry with industry input. Translation? Flexible modules. Superior data. Easy to use. Stable platform.


#600, 640 - 8th Avenue SW Calgary, Alberta, Canada T2P 1G7
Tel: 403-264-5610 Fax: 403-264-5898
Web: www.cspg.org
Office hours: Monday to Friday, 8:30am to 4:00pm
Business Manager: Tim Howard
Email: tim.howard@cspg.org
Communications & Public Affairs: Heather Tyminski
Email: heather.tyminski@cspg.org
Corporate Relations Manager: Alyssa Middleton
Email: alyssa.middleton@cspg.org
Membership Services: Dayna Rhoads
Email: dayna.rhoads@cspg.org
Reception: Kasandra Klein
Email: reception@cspg.org
Joint Annual Convention Committee
Convention Manager: Shauna Carson
Email: shauna.carson@cspg.org
Convention Coordinator: Tanya Santry
Email: tanya.santry@cspg.org
EDITORS/AUTHORS
Please submit RESERVOIR articles to the CSPG office. Submission deadline is the 23rd day of the month, two months prior to issue date. (e.g., January 23 for the March issue).
To publish an article, the CSPG requires digital copies of the document. Text should be in Microsoft Word format and illustrations should be in TIFF format at 300 dpi., at final size. For additional information on manuscript preparation, refer to the Guidelines for Authors published in the CSPG Bulletin or contact the editor.
Technical Editors
Ben McKenzie Colin Yeo (Assistant Tech. Editor) Tarheel Exploration Encana Corporation
Tel: 403-277-4496 Tel: 403-645-7724
Email: bjmck@telusplanet.net Email: colin.yeo@encana.com
Coordinating Editor
Heather Tyminski
Comunications and Public Affairs, CSPG
Tel: 403-513-1227, Email: heather.tyminski@cspg.org
ADVERTISING
Advertising inquiries should be directed to Alyssa Middleton, Tel: 264-5610, Email: alyssa.middleton@cspg.org. The deadline to reserve advertising space is the 23rd day of the month, two months prior to issue date.
The RESERVOIR is published 11 times per year by the Canadian Society of Petroleum Geologists. This includes a combined issue for the months of July and August. The purpose of the RESERVOIR is to publicize the Society’s many activities and to promote the geosciences. We look for both technical and non-technical material to publish. The RESERVOIR is not intended to be a formal, peer-reviewed publication. Additional information on the RESERVOIR’s guidelines can be found in the May 2008 issue (p.46-48; available at http://www.cspg.org/publications/reservoir/reservoir-archive-2008.cfm).
official endorsement or sponsorship by the CSPG is implied for any advertisement, insert, or article that appears in the
Reservoir Engineering for Geologists Part 8C – Monte Carlo Simulation Risk Assessment
by Ray Mireault and Lisa Dean
Deep-Water Channel-Levee Complex of the Neoproterozoic Isaac Formation, Windermere Supergroup, Cariboo Mountains, Western Canada: Part 3. Depositional Evolution Model and Reservoir Implications of a Channel-Levee Complex ..................
by Zishann Khan and R.W.C. Arnott
Sequence
IV. The Material-based Surfaces of Sequence Stratigraphy, Part 1: Subaerial Unconformity and Regressive Surface of Marine Erosion
For more on field seminars and short courses, call 918-560-2650 or visit www.aapg.org/education.
Applied Stratigraphy Of Paleozoic Carbonate Platforms
October 19-22, 2008 / Begins and ends in Las Vegas, NV
John E. Warme, Colorado School of Mines, Golden, CO
Fall Education Conference On Structural Geology
September 15-19, 2008 / Houston, TX
Eight top-notch courses with 10 renowned instructors:
John Lorenz, Ronald Nelson, Martin Traugott, Russell Davies, Vivek Chitale, Paul Elliott, Fred Hilterman, Mark Rowan, David Wiprut, and Steve Boyer
Intro To Petroleum Geology For Students
October 3, 2008 / Houston, TX, with the GSA Annual Meeting
Stephen Bend, University of Regina, Saskatchewan, Canada
Intro To Petroleum Geology For Faculty
October 4-5, 2008 / Houston, TX, with the GSA Annual Meeting
Stephen Bend, University of Regina, Saskatchewan, Canada
Computer Mapping For Petroleum Exploration
October 15, 2008 / Pittsburgh, PA, with Eastern Section Meeting
Hannes Leetaru, Illinois State Geological Survey, Champaign, IL
Deep-Water Salt Tectonics
October 25-26, 2008 / Cape Town, South Africa, with AAPG International Conference & Exhibition
Martin P.A. Jackson, The University of Texas, Austin, TX
Pore Pressure Prediction In Practice
October 30-31, 2008 / Cape Town, South Africa, with AAPG International Conference & Exhibition
Martin Traugott, Consultant, New Orleans, LA
Multi-Component Seismic Stratigraphy
November 8, 2008 / Las Vegas, NV, with SEG Annual Meeting
Bob Hardage, Bureau of Economic Geology, The University of Texas, Austin, TX


CSPG EXECUTIVE
PRESIDENT
Lisa Griffith • Griffith Geoconsulting Inc. lgriffith@griffithgeoconsulting.com Tel: (403) 669-7494
VICE PRESIDENT
Graeme Bloy • West Energy Ltd. gbloy@westenergy.ca Tel: (403) 716-3468
PAST PRESIDENT
Colin Yeo • EnCana Corporation colin.yeo@encana.com Tel: (403) 645-7724
FINANCE DIRECTOR
James Donnelly • ConocoPhillips Canada james.donnelly@conocophillips.com Tel: (403) 260-8000
ASSISTANT FINANCE DIRECTOR
David Garner • Chevron Canada Resources davidgarner@chevron.com Tel: (403) 234-5875
PROGRAM DIRECTOR
Randy Rice • Suncor Energy Inc. rjrice@suncor.com Tel: (403) 205-6723
ASSISTANT PROGRAM DIRECTOR
Christopher Collom • Enerplus Resources Fund ccollom@enerplus.com Tel: (403) 693-5042
SERVICE DIRECTOR
Jen Vèzina • Devon Canada Corporation jen.vezina@devoncanada.com Tel: (403) 232-5079
ASSISTANT SERVICE DIRECTOR
Ayaz Gulamhussein • NuVista Energy Ltd. Ayaz.gulamhussein@nuvistaenergy.com Tel: (403) 538-8510
OUTREACH DIRECTOR
Greg Lynch • Shell Canada Limited greg.lynch@shell.com Tel: (403) 691-2052
ASSISTANT OUTREACH DIRECTOR
Mike DesRoches • DesRoches Consulting Inc. mdesroch@shaw.ca Tel: (403) 828-0210
COMMUNICATIONS DIRECTOR
Peggy Hodgkins • CGGVeritas peggy.hodgkins@cggveritas.com Tel: (403) 266-3225
CORPORATE RELATIONS DIRECTOR
Monty Ravlich • Sanjel Corporation mravlich@sanjel.com
A message from the Assistant Finance Director, David Garner
I have been actively learning the workings of the CSPG Executive Committee and our monthly budget. The CSPG is a nonprofit organization built on the efforts of its many volunteers. We have superb office staff providing human resources and continuity. Tim Howard, our Business Manager, compiles budgets from all the departments and committees into our planned CSPG budget. In my role as Assistant Finance Director, I work with Tim to create the 2009 budget and present it to the Executive for approval. This is almost finalized and I will come back to discuss this. Our fiscal year begins on September 1 when my role transitions and my duty will be to monitor the 2009 living budget each month.
The cost to run the Society has increased by 8% over the last 12 years. We have gone from a $1 million to a $2.6 million operating budget as is shown in the attached graph of annual expenses, revenue, and net income. This increase in the budget is attributable to the Society’s programs and services expanding, as well as the cost of doing business. Our fixed operations are now over $900,000 which includes the cost of the Bulletin and the Reservoir. Additionally, our office and
office staff has expanded over the years in support of our Society’s healthy growth. We are expanding and reaching out across Canada.
We are living in dynamic times with lofty oil prices, increased costs for goods and services, and political activism aimed at the petroleum industry. Creativity and change is part of our professional evolution. Membership in the CSPG is your link to our professional community. Membership fees provide a significant portion of our revenue to operate. And membership will have its privileges. Beginning this fiscal year the price of our flagship technical luncheons will increase slightly to cover the escalating costs of audiovisual technology, the dining hall, and food. The luncheons will have member and non-member pricing which is consistent with many professional luncheon programs. Sponsor companies will capture their members’ discounts with centralized ticket orders.
The Annual Convention, held jointly with the CSEG and CWLS, has been an on-going
(Continued on page 7...)


SPEAKER
Peter M. Duncan MicroSeismic, Inc.
Fall 2008 SEG/AAPG Distinguished Lecturer
11:30 am, Monday, September 15, 2008
Telus Convention Centre, Calgary, Alberta
Please note: The cut-off date for ticket sales is 1:00 pm, Wednesday, September 10, 2008. Ticket Price: $35.00 + GST (for this luncheon only).
Due to the recent popularity of talks, we strongly suggest purchasing tickets early, as we cannot guarantee seats will be available on the cut-off date.

Passive seismic, especially microseismic monitoring, is to conventional seismic as a stethoscope is to a sonograph. It is continuous 4D. It is accomplished by listening carefully to the sounds emanating from the earth and then diagnosing what is happening down there. Passive seismic techniques not only can create an image of the reservoir and its plumbing, but also shed light on how the fluid is flowing through the pipes.
Grasping the completeness of the passive science, one can see that it provides the opportunity to contribute over the lifetime of an oilfield from discovery to abandonment. Passive seismic can accomplish reconnaissance 3D exploration at an attractive cost and lead to new discoveries. Microseismic monitoring of a hydrofrac can and does provide valuable information on completion and development strategy. Gas or fluid injection operations for primary or secondary recovery are prime candidates for passive monitoring to prove regulatory compliance, validate reservoir conformance, and estimate recovery efficiency.
This lecture will present a view on the
history and development of passive seismic techniques, a discussion of state-of-the-art through case histories and a vision on where this technology will play a role in the smart oil field of the future.
Peter M. Duncan is the founding President of MicroSeismic, Inc., a Houston-based geophysical service company. He holds a Ph.D. in Geophysics from the University of Toronto. He began his career as an exploration geophysicist with Shell Canada before joining Digicon Geophysical, first in Calgary then in Houston. In 1987, Duncan helped Digicon found ExploiTech Inc, an exploration and production consultancy. He was named President of ExploiTech when it became a subsidiary of Landmark Graphics in 1989. In 1992, he was one of three founders of 3DX Technologies Inc., an independent oil and gas exploration company where he served as Vice President and Chief Geophysicist. Duncan was 2003-2004 President of the Society of Exploration Geophysicists (SEG)
Sponsored by:

Before drilling your next well, work with CGGVeritas to obtain a superior structural image and experience the advantages of effective collaboration between interpreter and imager.
Expertise
> largest team ofdepth imaging specialists in Canada
> extensive experience processing foothills, deep basin, permafrost, and marine data
> largest in-house geophysical R&D team in Canada
Service
> dedicated imagers, supported by industryrecognized processing experts
> visualization facilities for effective QC and interactive analysis
> leverage communication and teamwork to achieve your goals
Technology
> advanced 2D and3D model building tools
> anisotropic Kirchhoff and other leading technologies designed for land and marine data
> thousands of CPU nodes enable large throughput capacity
ENVISION
Rely on CGGVeritas to maximize your exploration accuracy. You’ll have access to leading seismic imaging technologies, highly sought 3D and 2D data, the most advanced acquisition capabilities and a staff dedicated to helping you succeed.
Focus on Performance. Passion for Innovation. Powered by People. Delivered with Integrity.
SPEAKER
Ian Young
EnCana Corporation
CO-AUTHOR
Colin Yeo
EnCana Corporation
11:30 am
Tuesday, September 30, 2008 Telus Convention Centre Calgary, Alberta
Please note:
The cut-off date for ticket sales is 1:00 pm, Thursday, September 25, 2008.
CSPG Member Ticket Price: $38.00 + GST.
Non-Member Ticket Price: $45.00 + GST.
Due to the recent popularity of talks, we strongly suggest purchasing tickets early, as we cannot guarantee seats will be available on the cut-off date.
Hydrocarbon production in the Western Canada Sedimentary Basin (WCSB) is
currently in decline with the exception of the oil sands. This is typical of many basins that have gone through a series of phases as they progress down the resource pyramid. The earliest exploration in a basin is typically focused on large structural plays. As the basin matures there is a gradual shift towards stratigraphic plays, and later still towards unconventional plays: tight gas, coal-bed methane, shale gas, and tar sands. Each phase requires a different skillset based on the changing nature of the exploration required.
There remain a number of very successful junior companies that continue to explore for conventional plays, but this niche is becoming more specialized and will represent a smaller and smaller fraction of the future activity.
A recent survey conducted by the Canadian Federation of Earth Sciences indicates that 60% of the work conducted by geoscientists in the oil and gas business is now on unconventional plays, and only 10% of the work is related to frontier or international exploration. While the image of the explorationist as a risktaking maverick is a romantic one, the reality is that the petroleum industry in Western Canada is now looking for a different type of geoscientist. Recent major “discoveries” in the WCSB include Abbey-Shackleton, the Deep Basin Montney, Horseshoe Canyon Coal-Bed methane, and the Bakken in the Williston Basin.
sponsored by
None of these discoveries were the result of a traditional, seismically defined wildcat well. In this new phase of exploration in the WCSB, the boundaries between development and exploration can become less defined and the most important “exploration” phase might be a production pilot.
This presentation will show the magnitude of decreased exploration in the WCSB; why large companies are conducting less conventional exploration in Western Canada; and how large-scale development of, and exploration for, low-quality but ubiquitous hydrocarbon reservoirs makes economic sense. I will also discuss the changing requirements for geoscientists to be successful in the WCSB, including a focus on reservoir characterization, geomechanics, identifying and understanding hydrocarbon sweet spots, and working closely with other disciplines to optimize drilling and completion programs. This may not seem romantic, but it is essential to the future of this basin.
Ian Young is currently Vice President, Conventional E xploration and Joint Ventures, for the Canadian Foothills Region of EnCana Corporation. He graduated with a B.Sc. (Honours) in Geology from the University of Calgary in 1985.
He was employed by PanCanadian Petroleum immediately after graduation and was there until December of 1990, when he joined Opinac Exploration. He remained with Opinac until he rejoined PanCanadian in 1993, rising to the level of Exploration Manager. At the merger with AEC in 2002, Young was named Vice-President of the Rangeland Business Unit and was responsible for all cross-functional aspects of EnCana’s business in southern Alberta and Saskatchewan.
In 2006, Young was appointed for a two-year term as President of the Canadian Geoscience Council, which became the Canadian Federation of Earth Sciences (CFES) later that year. CFES is the umbrella group representing Earth Science organizations in Canada; the CSPG, CSEG, and CWLS are all member organizations of CFES.
Young has received diplomas and certificates in business administration from the University of Calgary (1989) and in Canadian Securities from the Canadian Securities Institute (1993). Young was selected as PanCanadian’s representative for the Governor General’s Canadian Studies 2000 Conference (now the Governor General’s Leadership Conference). Young is a member of the CSPG, CSEG, PDAC, AAPG, and APEGGA.
SPEAKER
Shahin Dashtgard
Simon Fraser University
11:30 am
Tuesday, October 7th, 2008
Telus Convention Centre Calgary, Alberta
Please note:
The cut-off date for ticket sales is 1:00 pm, Thursday, October 2, 2008.
CSPG Member Ticket price: $38.00 + GST.
Non-Member Ticket Price: $45.00 + GST.
Due to the recent popularity of talks, we strongly suggest purchasing tickets early, as we cannot guarantee seats will be available on the cut-off date.
Recent work conducted in modern environments suggests that the hydrodynamic processes responsible for morphological and sedimentological characteristics of beaches are much more complex than previously thought. Signifi cant variability in the sedimentology, ichnology, and morphology of these systems can be observed in response to changing hydrodynamic processes –particularly relative tidal energy.
Beaches deposited in strongly tidally influenced settings are wave-dominated. However, these deposits also exhibit both sedimentological and ichnological characteristics akin to sandy tidal-fl at environments. This suggests that beaches and tidal flats comprise end-members along a continuum of depositional environments, with intermediate deposits including tidally modulated beaches and open-coast tidal flats. Both tidally modulated beaches and opencoast tidal flats exhibit sedimentological and ichnological characteristics that are distinctive to these settings. By comparing typical beach-shoreface systems such as occur on the southwest coast of Vancouver Island to beaches present in strongly tidally influenced settings like the Bay of Fundy, it is possible to establish criteria elucidating the distinctions between the typical beach-shoreface setting and tidally modulated beaches. Such criteria should enable reliable differentiation of wave-
dominated beaches from tidally modulated, wave-dominated beaches in the rock record.
As tidal range increases, a distinct change in the morphology and sedimentology of the beach-shoreface system is observed. Sediments deposited in lower to upper shoreface settings at high tide ultimately are exposed in the intertidal zone during low tide. The results of this juxtaposition of environments include subordinate flow indicators, a sharp change in bedding dips in the landward direction, and possible preservation of locally thick shoreface deposits perpendicular to the coastline.
Tidal influence on the depositional character of beach-shorefaces is also observed in the ichnology of a deposit. In a normal beachshoreface system, a Cruziana Ichnofacies to Skolithos Ichnofacies is expected in the lower and upper shoreface, respectively. In strongly tidally influenced settings, sediments laid down in analogous bathymetric settings are characterized by a seaward shift in ichnofacies, generally poor development of the Skolithos Ichnofacies, and an overall decrease in ichnological diversity into subtidal settings. The density of burrowing, however,
is locally higher in strongly tidal settings than for normal shorefaces, although spatial distribution of burrowed and unburrowed zones is not entirely resolved in new depositional models.
Shahin Dashtgard graduated from the University of Alberta with a B.Sc. in Geology in 1998. He worked as a Petroleum Geologist for Fletcher Challenge Energy and Talisman Energy for four years, and returned to university in 2002. He earned his Ph.D. from the University of Alberta in 2006. Following an eight-month work term at the Alberta Geological Survey in Edmonton, Shahin started as an Assistant Professor in the Department of Earth Sciences at Simon Fraser University in Burnaby, British Columbia in January 2007.
His present research interests include modern sedimentological and ichnological studies of beaches and deltas on the southwest coast of British Columbia as analogues to the rock record, as well as reservoir characterization studies of potential CO 2 and acid-gas injection sites in the Western Canada Sedimentary Basin.
• 2D & 3D Processing
• Multicomponent (3C) Processing
• Fracture Detection Analysis
• Projects completed for Mining Companies & Government Agencies
Hart Janssen, B.Sc. Manager, Seismic Processing
Direct: 403-260-3372 Main: 403-237-7711 1300, 736 - 6th Avenue S.W. Calgary, Alberta, Canada T2P 3T7 www.sensorgeo.com
AUHOR
Jessica Krawetz
Canadian Natural Resources
11:30 am
Thursday, October 23, 2008 Telus Convention Centre Calgary, Alberta
Please note:
The cut-off date for ticket sales is 1:00 pm, Monday, October 20, 2008. CSPG Member Ticket price: $38.00 + GST. Non-Member Ticket Price: $45.00 + GST.
Due to the recent popularity of talks, we strongly suggest purchasing tickets early, as we cannot guarantee seats will be available on the cut-off date.
Jessica Krawetz is a recipient of the CSPG Graduate Thesis Award, which is sponsored by Arc Financial.
The Paddy Member of the Peace River Formation and the Walton Creek Member of the Boulder Creek Formation were deposited in the Western Canada Foreland Basin during Cretaceous (Upper Albian) time and form a succession of aggradational coastal plain deposits which undergo an upward transition to increasingly marine facies. Stratigraphic relationships between the marginal-marine Paddy Member in northwestern Alberta, the mainly non-marine Walton Creek Member in northeastern British Columbia, and the marine Joli Fou and Viking Formations in
southern Alberta are unclear. Correlation of wireline logs, core, and outcrop suggest that the Paddy and Walton Creek Members are coeval (therefore from now on will be referred to as the Paddy Member), and that the uppermost Paddy allomember can be correlated southward where it passes laterally into the basal part of the Joli Fou Formation, suggesting that the Viking Formation is younger than the Paddy Member.
The base of the Paddy Member is defined by a subaerial unconformity (disconformity) at the top of progradational shoreface sandstones of the underlying Cadotte Member. This unconformity represents progressively more time eastward, as lower Paddy allomembers prograde eastward from the orogen and successively onlap the top Cadotte. These lower Paddy allomembers are wedge-shaped, indicating a dominant tectonic control on deposition. In contrast, upper Paddy allomembers are more tabular, suggesting that small-scale eustatic cycles may have had a greater infl uence on deposition. The top of the Paddy Member is defined by VE3, a major transgressive erosion surface that can be correlated for hundreds of kilometers throughout the Western Canada Foreland Basin.
Seven non-marine and three marine and marginal-marine facies were recognized in the Paddy Member. The non-marine facies indicate a bimodal system comprising either fi ne-grained fl oodplain deposits or coarse-grained and conglomeratic fluvial valley-fill deposits. The fine-grained floodplain deposits are predominantly dark grey and orange-stained beds that are sideritic and carbonaceous. These beds indicate high water table levels and contain poorly drained paleosols, coals and coaly mudstones, and lake-bottom deposits. Finegrained sandstones represent overbank deposits – including crevasse channels, splays and levees – lake-fill successions, and non-migrating channel fi lls. All of these facies are interstratified and laterally intergradational throughout the western and southern parts of the study area. Finegrained floodplain facies are thought to have been deposited in high accommodation paleoenvironments on a rapidly subsiding coastal plain where base level underwent a relatively constant rise as a result of isostatic subsidence in response to both tectonic activity and sedimentary loads.
The coarse-grained and conglomeratic facies which comprise multi-storey, highly
amalgamated fluvial sandstones have been interpreted to represent high energy, braided river deposits. The coarse-grained facies are interpreted to be temporally and spatially isolated from the fine-grained facies because they have never been observed inter-fingering with or grading laterally into each other. For this reason, they have been interpreted to represent valley-fill deposits. The valleys were cut during periods of negative accommodation on the coastal plain as a result of a base-level fall, probably due to isostatic uplift in the thrust belt. During the valley cutting phase, well developed paleosols formed on the interfluves and newly supplied sediment was confined to the valleys and deposited to the north of the study area. As a result of base-level rise, sediment was trapped in the valleys forming highly amalgamated, multi-storey fluvial deposits.
The marine and marginal-marine facies are primarily confined to the stratigraphically higher part of the Paddy Member and have been divided into western and eastern facies. In the west, in outcrop, the top of the Paddy Member contains a series of gravelly delta deposits that range in thickness from thin beds of granules and pebbles to 12.5 metre thick conglomeratic cliffs. The deltas were probably fed by braided rivers as rocks representing both environments are found laterally equivalent in outcrop. The thickness of the deltaic deposits depends on their proximity to the fluvial feeder systems.
The eastern parts of the Paddy Member constitute a series of bioturbated, stacked bay-fill deposits that range in thickness from 2 to 5 m. Sedimentary structures indicate that these deposits formed in a low energy, marginal-marine environment. Bays filled as distributary channels constructed riverdominated deltas. In the eastern part of the study area, valley-fills with a distinctive estuarine character hang from the VE3 surface and remove up to 25 m of older Paddy strata.
Jessica Rylaarsdam (now Krawetz) received both her Bachelor’s and Master’s degrees in geology from the University of Western Ontario in London. After finishing her Masters, Jessica worked at Anadarko Canada Corporation, and is now working at Canadian Natural Resources as an area geologist.
November3rd-7th,2008
Calgary,Alberta
PROCESSING
8. Seismic Interpretation in the Exploration Domain
16. Understanding Seismic Anisotropy, Hands-On
1. Processing,Inversion and Reconstruction of Seismic Data
PROCESSING
1. Processing,Inversion and Reconstruction of Seismic Data
MauricioSacchi November3-4
2. Seismic Processing Fundamentals
MauricioSacchi November3-4
GaryMargrave November5-7
2. Seismic Processing Fundamentals
GaryMargrave November5-7
3. Parallel Computing – Cluster Computing using MPI/OpenMP in Fortran/C
PhilBording November3-4
3. Parallel Computing – Cluster Computing using MPI/OpenMP in Fortran/C
PhilBording November3-4
4. Computational Seismic Imaging: Theory and Practice
Rob Ferguson November3-5
4. Computational Seismic Imaging: Theory and Practice
INTERPRETATION
Rob Ferguson November3-5
5. Seismic Expression of Devonian Carbonates
INTERPRETATION
GeoffreyFraser/NormKohlhammerNovember5
5. Seismic Expression of Devonian Carbonates
GeoffreyFraser/NormKohlhammerNovember5
6. Sequence Stratigraphy:Principles and Applications
OctavianCatuneanu November5-7
6. Sequence Stratigraphy:Principles and Applications
OctavianCatuneanu November5-7
7. Acquiring,Understanding and Interpreting Gravity GradiometryData
Mark Davies / Phillip Houghton / John LumleyNovember3-4
7. Acquiring,Understanding and Interpreting Gravity GradiometryData
Mark Davies / Phillip Houghton / John LumleyNovember3-4
DonHerron/TimSmithNovember6-7
8. Seismic Interpretation in the Exploration Domain
DonHerron/TimSmithNovember6-7
9. 3D Seismic Attributes for Prospect Identification and Reservoir Characterization
KurtJ.Marfurt/Satinder ChopraNovember 6-7
9. 3D Seismic Attributes for Prospect Identification and Reservoir Characterization
KurtJ.Marfurt/Satinder ChopraNovember 6-7
10. Shallow EM Methods Applied to Oil Sands Investigations
Ted Glenn November6
10. Shallow EM Methods Applied to Oil Sands Investigations
Ted Glenn November6
11. Oil Field Geomechanics – Application to Fracture Permeability
Lisa Dell’Angelo November 3
11. Oil Field Geomechanics – Application to Fracture Permeability
Lisa Dell’Angelo November 3
12. Inversion Boot Camp
ROCK PROPERTIES
John Pendrel / David TimkoNovember 4-5
12. Inversion Boot Camp
John Pendrel / David TimkoNovember 4-5
13. Properties of Pore Fluids for Geophysical Applications
MikeBatzle November4
13. Properties of Pore Fluids for Geophysical Applications
MikeBatzle November4
14. Applied Petrophysics for Geophysicists (and Other Geoscientists)
TadSmith / Peggy HodgkinsNovember6-7
14. Applied Petrophysics for Geophysicists (and Other Geoscientists)
TadSmith / Peggy HodgkinsNovember6-7
15. Rock Physics for Geophysical Reservoir Characterization and Recovery Monitoring
GaryMavko November3-4
15. Rock Physics for Geophysical Reservoir Characterization and Recovery Monitoring
GaryMavko November3-4
LeonThomsen November4-5
BASIC CONCEPTS
16. Understanding Seismic Anisotropy, Hands-On LeonThomsen November4-5
17. Exploration:From Geology to the Seismic Section
BASIC CONCEPTS
BobParker November5-7
18. Seismic Data Basics I JohnFernando November3-4
17. Exploration:From Geology to the Seismic Section BobParker November5-7
19. Seismic Data Basics II JohnFernando November6-7
18. Seismic Data Basics I JohnFernando November3-4
19. Seismic Data Basics II JohnFernando November6-7
DEVELOPMENT GEOPHYSICS
20. Multicomponent Seismic Exploration in WesternCanada
DEVELOPMENT GEOPHYSICS
RichardA.Bale/RobertKendallNovember5
20. Multicomponent Seismic Exploration in WesternCanada
RichardA.Bale/RobertKendallNovember5
21. Velocity Model Building and Depth Conversion
Richard Lee November3-4
21. Velocity Model Building and Depth Conversion
PROFESSIONAL SKILLS
Richard Lee November3-4
22. Quantifying Uncertainty and Risk in Oil and Gas Evaluations
PROFESSIONAL SKILLS
ChrisZinkan November7
22. Quantifying Uncertainty and Risk in Oil and Gas Evaluations
23. You’re Presenting...Are they Listening?
ChrisZinkan November7
Carole Wright November6 or 7
23. You’re Presenting...Are they Listening?
Carole Wright November6 or 7
*Prizedrawto be made from registrations received bythis date. Early BirdRegistration date is September 26. Registration closes October 17.
course details and
SPEAKER
Satyaki Ray
Marathon Oil Canada
12:00 Noon
Monday, September 22, 2008
EnCana Amphitheatre, 2nd Floor East end of the Calgary Tower Complex 1st Street and 9th Avenue SE Calgary, AB
The use of image logs and dipmeters to ge nerate geologically reasonable highresolution geocellular models is an underutilised subject in the world of oilsands and geomodeling in general. The challenges originate from the lack of understanding of these valuable datasets and their relevance in creating models. Often the cycle time for a geomodeling project is so rapid that one is almost tempted to not consider this data because they are either perceived to be too cumbersome to incorporate in the facies models or their incorporation may complicate the picture. The other issue is that not all commercial modeling packages can handle the dipmeter and image log data as an input.
The current thoughts therefore are that if the processed data is available for a geologist
for a pipeline. Wednesday, October 15, 2008
The Mackenzie Corridor of the Northwest Territories has been producing hydrocarbons for nearly eighty years. An anticipated new pipeline will provide access to more. This one-day workshop will present new data on the stratigraphy, structure, and plays of the region, along with a series of core displays.
Location: Geological Survey of Canada (Calgary). Cost: $250
For more information, or to register:

in time and in the required simplistic format, they could probably use it and create models which honour geological heterogeneities such as sub-seismic facies changes in an oil sand reservoir. Image logs also bring new insights which were not available in legacy dipmeter data and the patterns of dips can have a whole new meaning when one compares automated dip tadpoles from a dipmeter to hand-picked dips from an image log. The author will give a historical perspective of the dipmeter and image log technology and will discuss the key elements from a dip and facies log that may be incorporated in geocellular models with relative simplicity. The idea is to make valueadded geomodels which represent nature in a better way when additional data such as the dipmeters are available.
In the last six years there have been considerable acquisition of dipmeters and FMI logs in the SAGD environment and it is time that industry derives full benefits from these underused datasets in the field of geomodeling. The benefits will result in better prediction of reservoir performance and could potentially save money by better well placement and well completion in horizontal SAGD environment.
Satyaki Ray, P.Geol. is Geoscience Advisor at Marathon Oil Canada Corporation. He has 20 years of industry experience ranging in geology, petrophysics, and reservoir modeling. He worked in Canada and internationally in various multidisciplinary team environments in companies like ONGC India, Schlumberger, and ConocoPhillips before moving to his current position. He has worked in oilsands, clastics, carbonates, coals, gas shales, and fractured reservoirs. He has published and presented in CSPG, CWLS, AAPG, and EAGE publications. He likes knowledge-sharing and finds the oil and gas industry a fascinating place with everchanging challenges.
GSC-Calgary, 3303-33rd St NW, Calgary,ABT2L 2A7
email: 403-292-7142
Bernie MacLean bmaclean@NRCan.gc.ca
BASS Division talks are free. Please bring your lunch. For further information about the division, joining our mailing list, a list of upcoming talks, or if you wish to present a talk or lead a field trip, please contact either Steve Donaldson at 403-645-5534, email: Steve.Donaldson@ encana.com or Mark Caplan at 403-532-7701, email: mcaplan@aosc.com or visit our web page at www.cspg.org/events/divisions/basinanalysis-sequence-strat.cfm.


PETREL* SEISMIC-TO-SIMULATION SOLUTION unites the subsurface domains of geophysics, geology, and reservoir engineering.
With Petrel software, asset team members can easily integrate their work —throughout the life of the field. No more over-the-wall data transfers, with the associated inaccuracies and errors. Traditional workflow and software barriers between technical disciplines are eliminated, opening the way for optimal reservoir understanding.
“In new assets and in older fields, leveraging technology is a key element of profitability and adding value for our shareholders. New insights and efficiencies from technologies within the Petrel suite of workflow tools provide significant potential benefits to companies like ours.”— Steve Farris, CEO, Apache Corporation
With Petrel software, all work processes lead to one shared earth model, resulting in faster, better decisions.
www.slb.com/petrel
(...Continued from page 17)
Therefore, deterministic techniques are more suitable for such tasks as identifying specific locations where the ore grade is highest, or finding the best position for a mine pit edge to include as much ore as possible while excluding as much waste as possible. Conversely, deterministic techniques are less suitable for mine extraction or fluid flow simulation, in which a realistic distribution of rock properties is the most important feature regardless of whether those features are modeled in the correct location.
The case study discussion for this talk covers these general issues as well as outlining the specific stochastic modeling process used for Fort Hills. The modeling process applied provides a reliable estimate of in-place resources, and also quantifies the degree of uncertainty for resource volumes. Mine planning was done using the complete set of 100 realizations for purposes where local accuracy was important, or using a single realization selected by a ranking process for purposes that demanded realistic heterogeneity.
Dr. Ned Etris is a professional geologist with 17 years of petroleum industry experience ranging from research to prospecting, with specialization in reservoir characterization and geomodeling. For the past three years, Dr. Etris has been working for Petro-Canada as the lead geologist in the reservoir characterization group, working on oil sands projects for both in situ development and mining, most notably on the Fort Hills mine project. Dr. Etris is a member of CSPG, AAPG, SPE, and APEGGA.
Ned received his Master’s and Doctoral degrees in geology from the University of South Carolina, using quantitative analyses to integrate sedimentology with the petrophysics of core and wireline logs. From 1991 to 1996, Ned worked in exploration & production companies in Calgary, and from 1996 to 2005 he worked in consulting firms, applying geological and petrophysical analyses to develop numerous creative solutions to optimizing production performance and estimating resources and reserves in reservoirs around the world. As a consultant, Ned became involved in studies of unconventional resources, particularly Alberta’s oil sands, working for major oil companies in Calgary. In 2007, Ned completed the Citation Program in Applied Geostatistics from the University of Alberta.
SPEAKER
Tom Sneddon APEGGA
Wednesday, September 24, 2008 12:00-1:30 pm
ERCB Core Research Centre Calgary, Alberta
A move is underway to significantly incr ease the APEGGA registration of persons employed as “Wellsite Geological Supervisors.” Traditionally there have been
a large proportion of people working in this job that did not meet the APEGGA criteria for Professional Geologist status but are well suited for the Registered Professional Technologist (Geological) category. As an “RPT(Geol.),” those practitioners who are qualified can be licensed to perform this professional occupation without direct supervision. There is strong support from the oil and gas industry for this move particularly to achieve consistency in minimum standards of knowledge and training for people working in this capacity.
The purpose of this meeting is to provide an open forum between APEGGA officials and prospective new APEGGA members now working at wellsites as Geological Supervisors/wellsiters/mudloggers and independently at the Core Research Centre doing core and cuttings petrographic analysis.
The forum is intended to provide answers to the standard questions such as:
• What can APEGGA do for me?
• Why do I need this?
• Why now?
• How do I apply?
• How much does it cost?
APEGGA is also keenly interested in hearing from wellsite personnel about their experience with safety issues and interaction with other wellsite disciplines (engineers, wellsite supervisors, drillers, and others).
Lunch will be provided. Please contact Doug Hayden (doug@doughayden.ca), Chair, CSPG Core and Sample Division to confirm your attendance.
In accordance with Article VI,subparagraph (a) of the By-Laws,the Nominating Committee hereby calls for Nominations to Stand for Election to the 2009 Executive Committee of the Canadian Society of Petroleum Geologists.
Nominations can be made in two ways:
1) Formal Nominations are to be made in writing,signed by at least twenty-five members in good standing and endorsed by the nominee who is consenting to stand for office.Candidates nominated in this fashion will automatically be added to the Nomination Slate.Nominations should be forwarded to the CSPG office by September 15,2008.The slate of candidates will be published in the November Reservoir and the election will take place on December 4,2008.
2) Informal Nominations can be made via email or letter;please confirm that the nominee is willing to stand for the office of choice and send to CSPG Office to the attention of the Past President.Candidates nominated in this fashion will be considered for addition to the Nomination Slate by the Nominations Committee.
The following vacancies exist for 2009:
• Vice President• Assistant Program Director• Assistant Outreach Director
• Assistant Finance Director• Assistant Services Director• Assistant Communications Director
Successful candidates for the Directorships will serve two-year terms and the elected Vice President,a third one-year term as Past President.Interested parties should contact the office for details and general requirements of service on the Executive.
SPEAKER J. R. Century
12:00 Noon Friday, September 26, 2008
Aquitaine Building 2nd Floor Conference Room (+15 Level) 540 – 5th Ave SW Calgary, Alberta
An Inconvenient Truth is an Academy Aw ard-winning documentary film by former U.S. Vice-President Al Gore presenting a discussion about global warming and climate change. In the film Mr. Gore offers mainstream science opinion, consequences and politics of the global warming debate.
Alberta Geological Survey (AGS) provides geoscience information and expertise to government, industry and the public to support exploration, development, conservation and regulation of Alberta's energy, mineral and groundwater resources.
Within the AGS Mapping Section, we are creating the rst digital atlas of Alberta’s geology. Additional geologists are needed to map and interpret the lithostratigraphy and sequence stratigraphy of the Western Canada Sedimentary Basin, the Rocky Mountains and the Rocky Mountain Foothills within Alberta. Motivated individuals with expertise in both two-dimensional and threedimensional stratigraphic mapping are required for the positions listed below.
Clastic Stratigrapher: Ph.D. (preferred) or M.Sc.
Carbonate Stratigrapher: Ph.D. (preferred) or M.Sc.
Mapping Geologist: M.Sc. (preferred) or B.Sc.
At AGS, you will have the opportunity to work in a stimulating environment on challenging eld and of ce-based projects, work with advanced technology, and remain current in your eld while making signi cant contributions to your community of practice.
Most climate scientists agree that the film generally “got the science right” but debate continues in some circles.
Training sessions for “An Inconvenient Truth” were held by Mr. Gore in April 2008 in Montreal. In attendance were 250 volunteers from across Canada, including 30 Albertans who were trained as official Presenters of the film and book of the same title. The Canadian organization Mr. Gore established is The Climate Project - Canada, headquartered in Montreal.
Jack Century will present content learned and commitments made by Presenters at the Montreal training sessions. He will review current and future activities of Presenters, focusing on Alberta Issues. These activities include practical, “made in Alberta” solutions to immediately start reducing CO 2 and other greenhouse gas emissions in absolute terms, not just so-called “intensity” levels. This is necessary to avoid the potentially catastrophic consequences of human-induced global warming and climate change within the lifetimes of our children and grandchildren.
Solutions being worked on by the Presenters through education and personal example, include GHG emission reductions, conservation and alternate energy choices being made by individuals, families, small to large businesses and corporations, and by all levels of government. The format of the presentation will be an open discussion in response to questions following the review.
Jack Century has been active as a petroleum, minerals, and environmental geologist for the past 56 years. He earned an M.Sc. in geology from the University of Illinois in 1952. He began his career as a geophysicist and then switched to exploration geology working various western US petroleum basins. Jack moved to Calgary to explore for Devonian reefs with Amoco Canada, eventually leading Amoco’s Geological Technical Group.
INFORMATION
All lunch talks are free and open to the public. Please bring your lunch. For information or to present a talk for the Environment Division please contact Andrew Fox at andrew.fox@ megenergy.com.
FIELD TRIP LEADER
Michael Cooley
Queen’s University
Saturday, October 18, 2008
Living stone Rive Anticlinorium
Southern Alberta Foothills
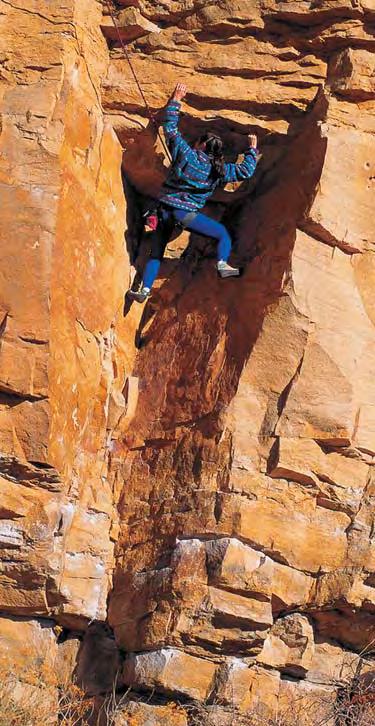
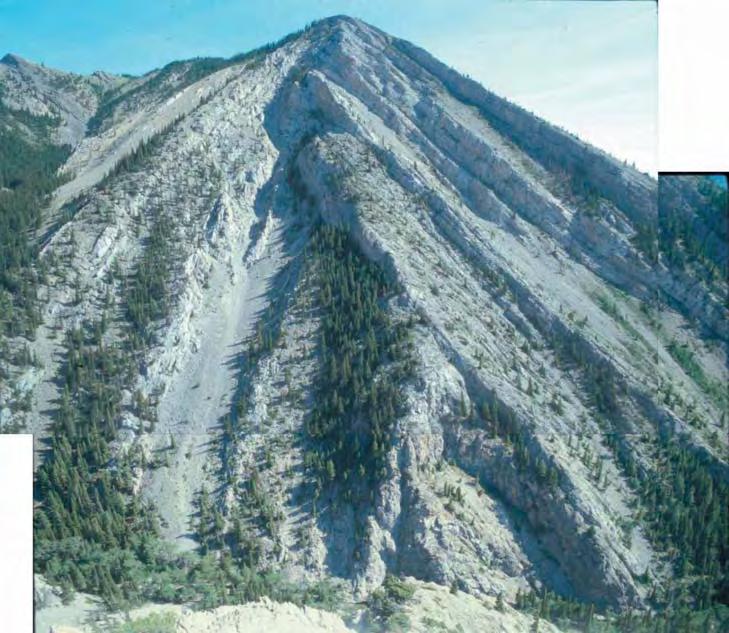
The CSPG Structural Geology Division F all 2008 Field Trip will be led by Michael Cooley to regions within his Ph.D. study area (Ph.D. Queen’s University, 2007. The structural, thermal, and fluid evolution of
the Livingstone Range Anticlinorium and its regional significance to the southern Alberta foreland fold and thrust belt). The Livingstone Range Anticlinorium (LRA) is a spectacularly exposed leading-edge anticlinal structure that developed in the hanging wall of the Livingstone thrust as it cut more than 1 km up-section from a regional detachment in the upper part of the Palliser Formation to a detachment horizon within the Fernie Group. In the southern part of the LRA, several crosscutting creek canyons provide natural cross sections through the Centre Peak anticline, the western-most anticline in this area. The canyons abruptly widen out along the adjacent Green Creek syncline, forming north- and south-terminating box canyons. These provide along-strike views of the core of the Centre Peak Anticline and its internal faults and fractures.
The main destination of the field trip will be a short (<3km) walk up Green Creek canyon at the southern end of the Livingstone Range to look at the chevronstyle Centre Peak anticline and the thrust faults that have propagated out of the back limb of the fold and offset the fold core.
The grade is fairly gentle up the creek valley, but once in the canyon there are some talus slopes that may be climbed to get close to some of the rocks, and to get a spectacular view of the opposite walls of the canyon. Once through the canyon the group can explore the box canyons and look at the cross-cutting fractured zones that cut through the fold core at surprisingly regular intervals.
The group will leave Calgary on the evening of October 17 (Friday) and overnight in the Crowsnest Pass region. There will be a full day in the field on October 18 (Saturday), and the group will return to Calgary that evening. Details of the logistics will be arranged closer to the date of the trip. All members of the CSPG community are invited to participate. This trip is free but you must bring or purchase your lunch and cover expenses for the Friday night. If you are interested in this field trip please email Deborah Sanderson at dsanderson@ suncor.com and provide your name and phone number.
September 8-12, 2008
October 20-24, 2008
*Revised and updatedApril 2008
New microscopes
More samples
New instructor Roberta Peach, B.Sc.
For complete course outline, please refer to our website www.canstrat.com/courses or phone (403) 284-1112


| by Ray Mireault P. Eng. and Lisa Dean P. Geol., Fekete Associates Inc.
The second article (Mireault and Dean, 2008) in the series on Monte Carlo simulation presented an evaluation methodology for Geologist A’s development prospect. This last article extends the methodology to address Geologist B’s exploration prospect.
Geologist B interprets a hydrocarbonbearing reef at approximately 1,500 m depth from the available seismic data. Wrench tectonics and strike-slip faults influence the structural aspects of the play. Underlying shale represents a potential local hydrocarbon source while overlying lime mudstones and calcareous shales form the prospective cap rock.
Core samples and outcrops show up to 30% porosity and are considered to reflect an in situ combination of intra-crystalline and vuggy (moldic) porosity. In situ primary porosity may / may not have been altered over time.
Organic geochemistry suggests a Type II marine algal source charged the reservoir target with light (35-40° API) sweet oil. Reservoir reef and trap geometry are
interpreted to have been in place at the time of oil generation.
Carbonate reef deposits tend to be oilwet systems and this particular prospect is interpreted to sit on basinal material that precludes the existence of a mobile aquifer underlying the reef. Accordingly, water saturation should approach residual values. Solution gas drive is anticipated with primary recovery in the range of 10 to 20%.
From the viewpoint of a Monte Carlo simulation, after an exploration prospect has been discovered it will require development capital to achieve production, just like any other development prospect. Thus an exploration prospect is no more than a development prospect with an additional step. Accordingly, the financial questions to be answered become:
• Does the prospect present sufficient economic potential to proceed with development (assuming it contains the postulated volume of hydrocarbons)? If so,
• How much additional (“risk”) capital is
required to create a high (70%) probability of locating a hydrocarbon-bearing deposit (i.e., how many exploratory wells need to be drilled)?
• Are the prospect economics sufficiently attractive to accommodate both the development and exploration costs?
As with Geologist A’s development prospect, Monte Carlo simulation was used to volumetrically estimate the potential oil-in-place and recoverable oil volumes. Geologist B’s input parameter ranges are in Table 1.
1/B o 81%83%85%
Table 1. Geologist B’s input parameter ranges
As presented in the Volumetric Estimation
article (Dean, 2008), the equations for oil are:
OOIP = A * h * * (1 - S w) * 1/B o
Recoverable Oil = OOIP * Recovery Factor
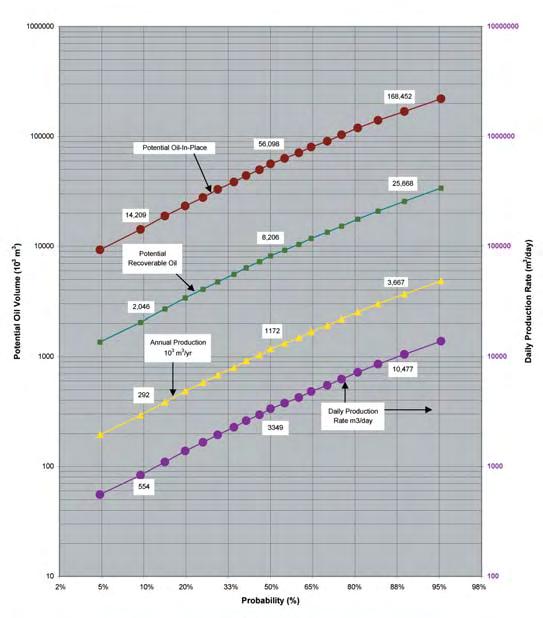
Figure 1 graphically presents the prospect potential based on the foregoing input parameters. Dividing the recoverable oil range by a seven-year rate-of-take provides the initial annual production volume. The initial daily production rate assumes 350 producing days per year.
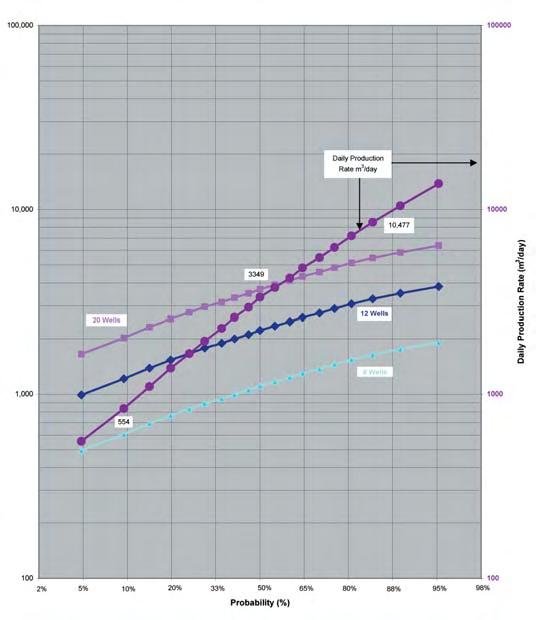
Theoretical estimates of well production capability range between 80 and 320 m3 /day. From the graphical comparison of Figure 2, between 6 and 20 wells will probably be required to achieve the initial target production rate, with 12 wells as a most likely value.
P10P50P90
Oil-in-Place 103m3 14,20956,098168,452
Recoverable Oil 103m3 2,0468,20625,668
Annual Volume 103m3/yr2921,1723,667
Initial Daily Rate m3 /day5543,34910,477
Table 2. Estimated volumes.
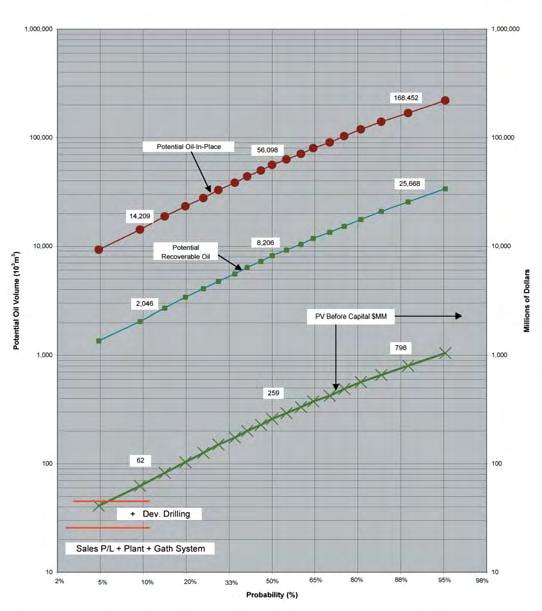
At the time Geologist B’s prospect was evaluated, the present-day (PV) value of a cubic metre of production was estimated to be between $25 and $38/m3. Based on the estimate, the expected PV before capital for the prospect is between $62 MM and $798 MM (Figure 3).
The development capital items and their associated capital costs at the time of the evaluation are summarized in Table 3.
Sales pipeline 3.04.57.0 Plant and Infrastructure101318 Gathering System2.02.53.0
Well
Table 3. Capital Cost Estimates (all values in millions of dollars).
Based on the estimate of between 6 and 20 development wells and the cost estimates for an individual well (and dry hole) Monte Carlo simulation was used to generate the required range of development drilling capital (Table 4). Total Development Costs
Table 5. Cumulative Development Costs (all values in millions of dollars).
By inspection of Figure 3, the P90 limit of total development costs ($44.9 MM) intersects the PV before Capital Curve at about the 6th percentile. Thus, there is in excess of a 94% chance that the prospect, as postulated to exist, would achieve a positive NPV on the development capital. With this chance of success, most companies would give the prospect further consideration.
Table 4. Development Drilling Costs (all values in millions of dollars).
Simulation was also used to generate the cumulative development cost profile for the prospect from the individual capital cost ranges (Table 5).
Unlike development capital, which always generates some cash flow from subsequent production, exploration “risk” capital is spent without any potential for immediate revenue generation. The majority of an exploration prospect’s risk capital consists of:
• The up-front (land) cost for the right to explore for hydrocarbons on specified acreage.
(Continued on page 27...)


Gordon Williams, P.Geol. as President Williams, is the 10th geoscientist to lead APEGGA.
An active volunteer for more than 25 years, Williams has served two terms on Council, was Second Vice-President (99-01) and became President-Elect in 2007. Williams has been a key player in APEGGA’s regulatory function serving on the APEGGA Board of Examiners, Practice Review and Discipline Committee. He has also been a strong advocate for the geoscience community serving on the CSEG/CSPG/APEGGA Liaison Committee, the Task Force on the Future Role of APEGGA, the Nominating Committee and the Geoscience Committee.
Williams played a pivotal role when the CCPG was established. He’s an Honorary Member and Past-President of the CSPG and a Distinguished Fellow of the GAC. Williams received CCPG’s firstever Canadian Professional Geoscientist Award, GAC’s J. Willis Ambrose Medal, CSPG’s President’s Award and APEGGA’s L.C. Charlesworth Professional Service Award.
To share your idea for rocking the role of Geoscientists in APEGGA, contact Williams at president@apegga.org.
APEGGA — geoscience to the core.
“I am honoured and humbled to be president of APEGGA,” says Williams, “I respect the Association’s evolution into the pre-eminent Canadian geoscience and engineering association. APEGGA continues to adapt and I relish the opportunity to participate in its future.”
This ad is the fourth in a series
• Data acquisition (largely seismic) costs to infer the presence of prospect(s).
• Exploration drilling to locate a hydrocarbonbearing deposit.
• For offshore exploration, follow-up delineation drilling to confirm the minimum size of deposit needed for development.
Estimating “land” and seismic acquisition costs is generally straight forward. However, the exploration drilling cost estimate is essentially the number of consecutive dry holes that will be drilled prior to making a discovery times the cost per dry hole. Exploration drilling is evaluated as a component of the total “risk” capital because 80 to 97% of the time, the outcome of an individual drilling attempt is a dry hole. Further, offshore exploration (and delineation) wells are abandoned after testing, irrespective of what they encounter. For onshore evaluations, the successful discovery well can be treated as the first development well, as was done for Geologist B’s prospect, or as a “salvaged” exploration attempt.
Otis and Schneidermann (1997) present the concept of geological success for an exploration well as “having a sustained stabilized flow of hydrocarbons on test.” They estimate the probability of geologic success (Pg ) as the product of the individual probabilities of occurrence for four factors as follows:
Pg = Psource * Preservoir * Ptrap * Pdynamics
where:
Psource is the probability of mature source rock
Preservoir is the probability that reservoir quality rock exists Ptrap is the probability that a trap exists Pdynamics is the probability of appropriate timing for migration and trapping
A neutral assessment is assigned a value of 0.5. Indirect supportive data increases the assigned probability of occurrence while non-supportive data reduces the estimated value. The approach has the advantage that a neutral (50% probability) assignment for all 4 factors yields a 6.25% probability of geologic success. The value compares with the industry perception of about a 5% chance of success on an exploration well.
Fekete has also successfully used a fiveparameter system to estimate the probability of geologic success as follows:
Pg = Psource * Preservoir * Pstructure * Pseal * Pmigration
Note that the individual subscripts can be customized to suit each evaluation. A neutral (50%) assignment for all 5 factors
yields an overall chance of geologic success of 3.125%.
In Fekete’s experience, either a four- or fiveparameter system can be used to evaluate a prospect. Which to use often comes down to which the earth science team that is doing the evaluation is most comfortable with. Fekete has also evaluated prospects with a seven-parameter system (CCOP, July 2000) but when all seven parameters have a neutral (0.5) rating, the chance of geologic success is 0.8%. This does not mean that a seven-parameter system should not be used, but when it is, the evaluators must be aware of the consequence of additional multiplication and adjust the input values relative to the values that would have been used in a four- or five-factor evaluation.
A five-factor system was used for Geologist B’s prospect and values estimated as shown in Table 6.
making at least one discovery. Or we may decide that the drilling locations currently available to the company are not related and the above table reasonably presents the chance with each successive attempt.
The consensus for Geologist B was that even with luck, a minimum of three dry holes would be incurred before making a discovery. The more likely value was six (53% chance of a discovery) but up to ten attempts could be required to tip the odds in the company’s favour. An additional $10 MM was also recommended for additional seismic acquisition (Table 8).
Probability of Geologic Success12%
Probability of Dry Hole 88%
Table 6. Five-factor system parameters.
A 12% chance of success means there is an 88% chance of a dry hole on the first drilling attempt. If the drilling sequence is a random series of events, as the number of consecutive drilling attempts increases, the chance that they will all be dry holes decreases. Table 7 shows the profile, assuming random events.
Table 8. Exploration Costs (all values in millions of dollars).
From Monte Carlo simulation, total dry hole costs, total exploration costs, and cumulative prospect capital cost ranges were estimated as shown in Table 9:
Table 7. Chance of Failure / Success.
In reality, we should learn something about the prospect and play with each drilling attempt, so we may consider that less than 10 wells are required for a 70% chance of
Table 9. Cumulative Prospect Capital Cost Ranges.
With a total exploration and development cost of $60.7 MM and a PV before investment value of $62 MM at the 90th percentile (Figure 3), the prospect has better than a 90% chance of achieving a positive NPV (if the deposit really exists). When presented with this level of economic attractiveness, most companies would seriously consider pursuing Geologist B’s prospect.
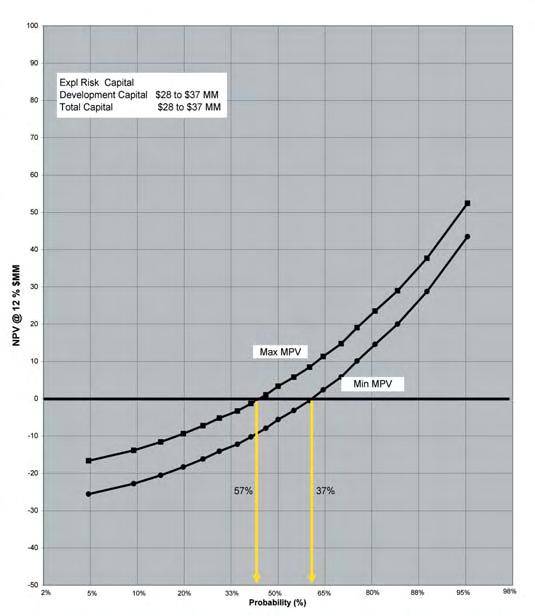
Figure 4 summarizes the financial “picture” for Geologist A’s development prospect. Figure 5 presents Geologist B’s exploration prospect. The Max NPV curve is generated by subtracting the P10 total cost value from the NPV before capital curve. The Min NPV curve is similarly created from the NPV before capital curve less the P90 value for total capital costs.
The chance of realizing a positive NPV on the capital investment can be read from the graph. From Figure 4, upper and lower limits of the NPV curve have a value of zero at about
(Continued on page 28...)
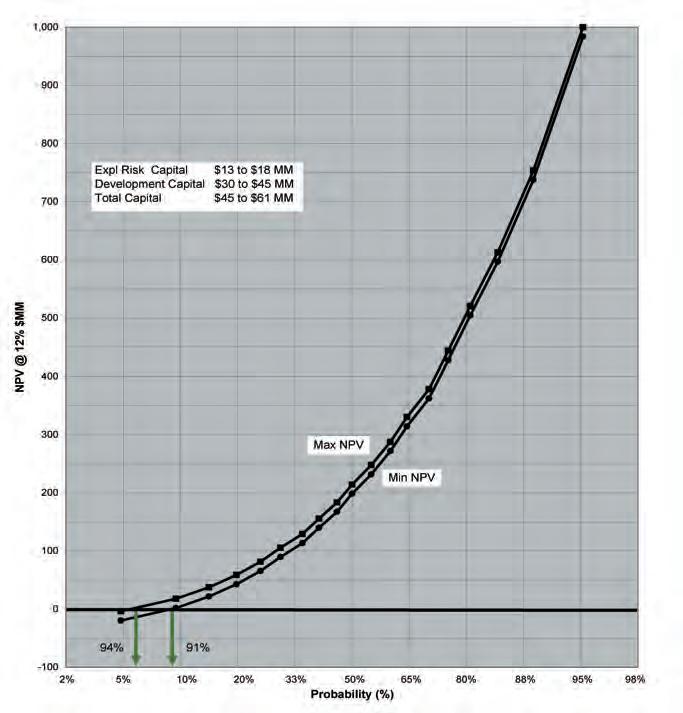
(...Continued from page 27)
the 43rd and 63rd percentiles. The chance of achieving a positive NPV on the capital investment with Geologist A’s development prospect is between 37 and 57%.
In Figure 5, the NPV = 0 axis is intersected at about the 6th and 9th percentiles. If Geologist B’s exploration interpretation is correct, there is between a 91 and 94% chance of achieving a positive NPV on the capital investment.
For any prospect, management needs to know:
• The chances that at least the value of the capital investment will be recovered if the project proceeds.
• How much capital could be lost if events do not turn out as expected.
• The potential gain in economic value if events do unfold as expected.
• t otal capital commitment required to realize production.
Which prospect would you invest in?
RefeR ences
Canadian Institute of Mining, Metallurgy and Petroleum. 1994. Determination of Oil and Gas Reserves, Petroleum Society Monograph Number 1, Chapter 6.
Canadian Institute of Mining, Metallurgy and Petroleum. 2004. Determination of Oil and Gas Reserves, Petroleum Society Monograph Number 1, Chapter 6.
Coordinating Committee for Coastal and Offshore Geoscience Programmes in East and Southeast Asia (CCOP). 2000. The CCOP Guidelines for Risk Assessment of Petroleum Prospects. July, 2000. 35 p.
Expertise in heavy oil & deep basin reservoirs
• AVO / LMR Analysis
• Neural Network Analysis
• PP & PS Registration
• Joint PP & PS Inversion
• Fracture Detection Analysis using Azimuthal AVO
• Spectral Decomposition Time Lapse Analysis
Carmen Dumitrescu
P.Geoph., M.Sc., Manager, Reservoir Geophysics
Direct: 403-260-6588 Main: 403-237-7711
www.sensorgeo.com

Dean, L. 2008. Reservoir Engineering For Geologists, Part 3: Volumetric Estimation. Canadian Society of Petroleum Geologists Reservoir, v. 34, no. 11, p. 20-23.
Mireault, R. and Dean, L. 2008. Reservoir Engineering For Geologists, Part 8b: Monte Carlo Simulation / Risk Assessment. Canadian Society of Petroleum Geologists Reservoir, v. 35, no. 7, p. 14-19.
Otis, Robert M. and Schneidermann, Nahum. 1997. A Process for Evaluating Exploration Prospects. AAPG Bulletin, vol. 81 no. 7. p. 1087-1109.
Watch for our article on Coal Bed Methane in the next issue of the Reservoir. This article was contributed by Fekete Associates, Inc. For more information, contact Lisa Dean at Fekete Associates, Inc.


Manufactured by Grace Industries, the largest manufacturer of ‘stand alone’ pass devices used by fire departments all over the world.
The CSA certified, intrinsically safe LoadTrak™ Panic Alert device is ideal for oil and gas workers who travel alone or work in remote or hazardous areas.
Panic Alert can help your company address potential liability concerns and comply with provincial Lone Worker legislation and guidelines.
Panic Alert devices will not ignite emissions or fumes and have a 300-metre signal radius from an outfitted vehicle.
Lone workers have access to a 24/7 monitoring centre at the push of a button or, if the worker is immobile, an automatic alert is sent using the sensor/man-down mode.
For more information about Panic Alert, or to locate an authorized LoadTrak dealer near you, visit www.loadtrak.com/workalone or call 1-866-323-7418


(...Continued from page 33)
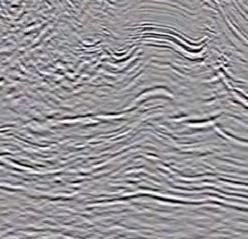
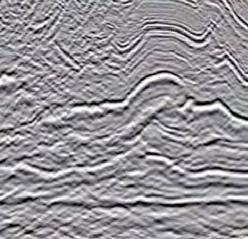
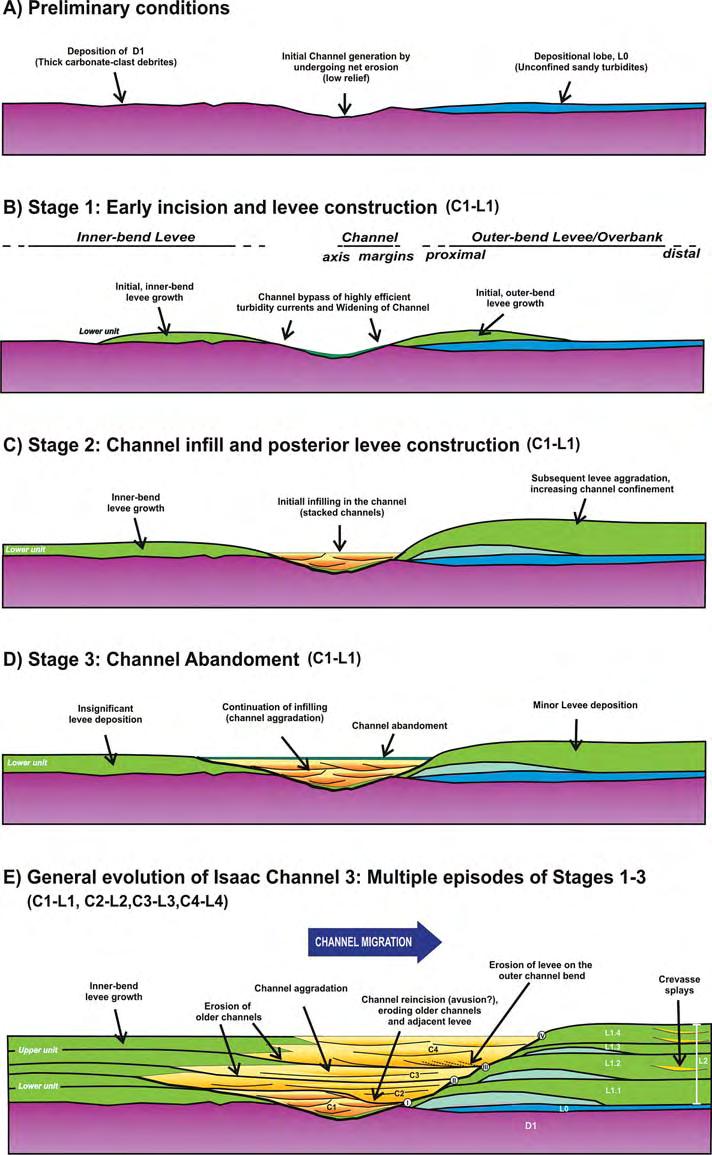
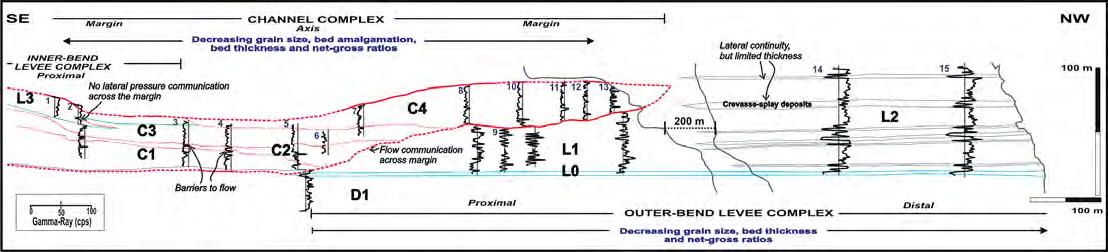
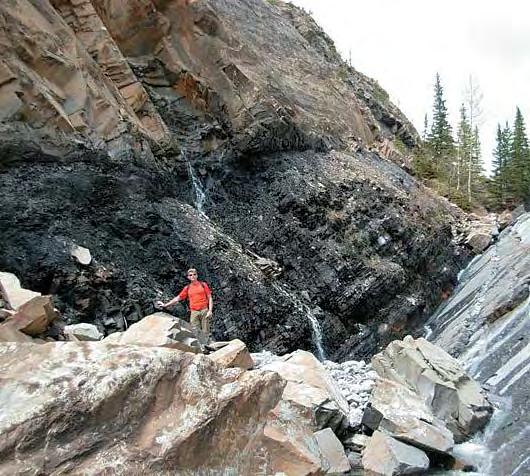
Although seismic, and in particular seismic re solution, have made great advances in recent years, the fact remains that resolution in the deep-water realm remains typically too coarse to identify and differentiate small-scale internal stratal attributes. Therefore, outcrop studies, like this one, can provide important insight into stratal architectures of sub-seismic, reservoir-type facies in channel-levee deposits. Furthermore, sedimentology and stratigraphy of IC3 is comparable to offshore reservoirs in the Arabian Sea, Mediterranean Sea (e.g., Nile Delta), and east coast Canada and, therefore, represents an important analog for predicting and estimating stratal architecture of channel-levee hydrocarbon reservoirs in passive margin settings. Figure 2 illustrates important reservoir characteristics interpreted from outcrop gamma-ray logs of IC3.
ALL THE PIECES FOR SUPERIOR 3D MODELING
ALL THE PIECES FOR SUPERIOR 3D MODELING
Introducing our new Earth Modeling Division
Boyd PetroSearch’s Earth Modeling Division provides engineers, geologists and geophysicists with a powerful new solution for enhanced reservoir and subsurface understanding.
Using best practices in 3D modeling, our senior consultants combine multi-disciplinary data to create a reliable earth model that enables you to:
• Build complex structural models
• Characterize reservoir properties
• Locate new prospects
• Plan well locations
Please call:
Damien Thenin 403.543.5381
Larry Herd 403.543.5362 or visit www.boydpetro.com
• Reduce risk
• Estimate resources
• Manage uncertainty
Global Geophysical Consultants
Channel fills in the axial part of IC3 have high reservoir quality with high vertical connectivity and high net-togross ratios ranging from 80 to 100%. These fills consist almost exclusively of stacked, amalgamated conglomerate and coarse-grained sandstone with a common lack of fine-grained strata. However, laterally continuous, fine-grained strata occur locally at the tops of channel fills, representing local barriers to fluids. Otherwise, mudstone-clast breccias that commonly occur at the base of some channel fills correspond to permeability baffles, which reduce reservoir volume. In spite of this, the overall fluid flow through these strata is perhaps less affected due to good interconnection within sand matrix surrounding loosely packed, mud clasts.
A significant decrease in reservoir quality is observed along the channel margins, especially in the upper channel fills, where a decrease in grain size, bed thickness, bed amalgamation, and net-to-gross ratios (from 93 to 70%) occur. Strata become progressively less amalgamated due to an increase of siltstone interbeds, which negatively affect the vertical and lateral connectivity between sandstone beds.
Volumetrically, overbank deposits are typically the most significant facies type associated with the slope setting of modern and ancient deep-water turbidite systems and have also recently proven to be significant hydrocarbon reservoirs (e.g., Tahoe and Ram / Powell fields in northern Gulf of Mexico). Net-to-gross ratios of the outer-bend levee deposits in IC3 are up to 70%, but decrease laterally to about 45%
PRACTICAL DST CHART INTERPRETATION (Thorough Basic Course) Oct. 6-10, 2008
16 WAYS TO IDENTIFY BYPASSED PAY FROM DST DATA
(More advanced, for those “comfortable” with DST charts) Oct. 16-17, 2008
HYDRODYNAMICS SEMINAR (Oil & Gas Finding Aspects) Nov. 3 -7, 2008
In-house courses available. For course outline visit: www.hughwreid.com 262-1261

Provide certainty for our clients in the highly uncertain oil sands business by uaranting the delivery date of lab testing results and core photos. gee
During our two operation seasons, we delivered all Dean and Stark reports and core photos before the end of April each year. Our clients, including big oil companies, enjoy a plenty of time to make their business decisions. TIMELY!
For more information or lab tours, please contact us @(403)874-4588 or visit http://www.tarcore.com.
| by Ashton Embry
The fundamental building blocks of sequence s tratigraphy are the various sequence stratigraphic surfaces that are defined and used for correlation and for bounding units. As discussed in the first article in this series, sequence stratigraphic surfaces represent changes in depositional trend and this distinguishes them from surfaces of other stratigraphic disciplines which represent changes in different observable properties of strata.
Before describing various surfaces in detail, a few generalities about surfaces are required. First of all, there are two distinctly different types of sequence stratigraphic surfaces in use today – material-based and time-based.
A material-based surface is defined on the basis of observable physical characteristics which include 1) the physical properties of the surface and of overlying and underlying strata and 2) the geometrical relationships between the surface and the underlying and overlying strata.
A time-based surface in sequence stratigraphy is defined on the basis of an interpreted, site-specific event related to a change in either the direction of shoreline movement (e.g., landward movement to seaward movement) or the direction of base level change (e.g., falling base level to rising base level).
Surfaces are also described in terms of their relationship to the interpreted time gap across the surface. A surface across which there is a large, significant time gap as evidenced by the missing stratigraphic surfaces (e.g., truncation, onlap) is called an unconformity. If the time gap is very minor and is inferred mainly on the basis of a scoured and/or abrupt contact rather than on missing surfaces across the contact, the surface is called a diastem . If there is no inferred time loss across the surface, it is referred to as a conformity. Notably, different portions of a single surface type can exhibit different relationships to time (e.g., one portion can be conformable and another portion unconformable with yet another portion being diastemic).
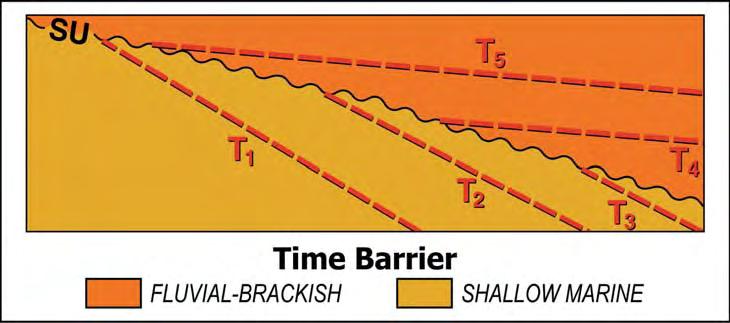
Figure 1. Time surfaces terminate at the unconformity that is a time barrier. The time surfaces below the unconformity are truncated and they onlap on top of the unconformity. All the strata below the unconformity are entirely older than all the strata above.
Finally, surfaces are often interpreted in terms of their relationship to time over parts or all of their extent, that is, the relationship between the surface and time surfaces. If a given surface is conformable and the same age over its entire extent, it is a time surface. However, no material-based, conformable surface is equivalent to a time surface because the generation of such a surface is always dependent in part on sedimentation rate. This factor always varies in space and time, ensuring all conformable, material-based surfaces will develop over an interval of time and will always exhibit some diachroneity (i.e., time surfaces will pass through them).
Surfaces which develop over an extended interval of time such that time surfaces cross them at a high angle are classed as being highly diachronous. Those which develop over a relatively short time interval such that time lines cross them at a low angle are referred to as having low diachroneity. In some cases, time surfaces do not cross a surface but rather terminate against it (e.g., truncation, onlap) (Figure 1). Such a surface is either an unconformity or a diastem and is referred to as a time barrier. Wherever a surface is a time barrier, all strata below it are entirely older than all strata above it.
It must be noted that some unconformities or diastems are diachronous and time surfaces pass through them (offset) rather than terminating against them. Once again, a single surface can exhibit more than one relationship
time over its extent (e.g., a highly diachronous diastem over one portion and a time barrier unconformity over another)
The six, material-based surfaces of sequence stratigraphy (Embry, 1995, 2001) in common use for correlation and/or as a unit boundary are:
1) Subaerial unconformity,
2) Regressive surface of marine erosion,
3) Shoreline ravinement,
4) Maximum regressive surface, 5) Maximum flooding surface, and 6) Slope onlap surface.
Importantly, each of these surfaces is characterized by a combination of observable attributes that allow it to be distinguished from other stratigraphic surfaces and allow for its recognition by objective criteria. In this article, the first two of these surfaces are described and interpreted as to their origin, their relationship to time, and their potential usefulness for correlation and bounding a sequence stratigraphic unit. The remaining material-based surfaces, as well as time-based surfaces, will be discussed in subsequent articles.
The subaerial unconformity is an important, sequence stratigraphic surface and was the surface used to empirically define a sequence in the first place (Sloss et al., 1949). It was first recognized through observation over
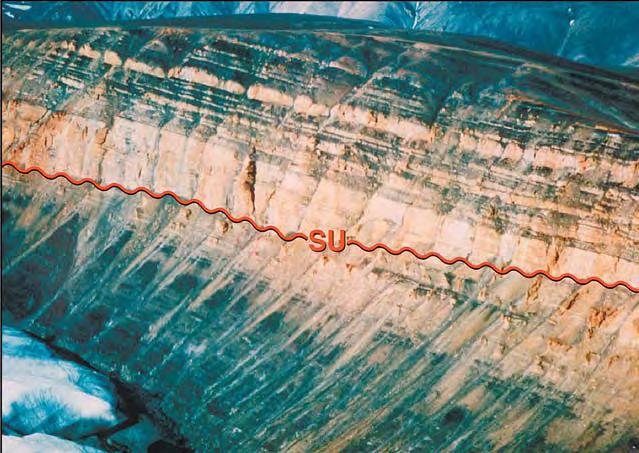
200 years ago and James Hutton’s discovery / recognition of the Silurian / Devonian subaerial unconformity at Siccar Point, Scotland is legendary. The defining attributes of a subaerial unconformity are an erosive surface or weathering zone (e.g., paleosol, karst) overlain by nonmarine/brackish marine strata, and the demonstration that it represents a significant gap in the stratigraphic record (Figure 2). Any type of strata can lie below. Shanmugan (1988) elaborates on the physical characteristics of a subaerial unconformity.
It is worth emphasizing that nonmarine to brackish strata are required to overlie a subaerial unconformity. When marine strata overlie strata that had been formerly exposed and eroded, the surface marking the contact is not a subaerial unconformity. There is little doubt that an SU once overlay the eroded strata but it is no longer present having been eroded during the passage of marine waters over it. Most often the remaining unconformable surface is a shoreline ravinement although other surfaces can potentially erode through and thus replace a subaerial unconformity as the surface marking a major gap in the succession.
The occurrence of a significant stratigraphic gap across a subaerial unconformity is critical for its recognition because this establishes the unconformable nature of the surface. Importantly, this allows a subaerial unconformity to be distinguished from subaerial diastems which are scoured contacts at the base of fluvial channel strata and which are much more common in the record. Such subaerial diastems originate
through channel migration on a flood plain and are highly diachronous, diastemic surfaces which harbour only a very minor time gap at any locality.
To demonstrate the presence of a significant time gap beneath an SU, it is usually necessary to show that truncated strata lie below the surface. The occurrence of onlapping nonmarine strata above the surface adds further support to such an interpretation. These stratigraphic relationships are most readily seen on seismic data integrated with facies data from wells (Vail et al., 1977) although sometimes such seismically determined relationships are not real and are an artifact of the seismic parameters (Cartwright et al., 1993; Schlager, 2005; Janson et al., 2007).
The geometrical relationships (truncation, onlap) which help to delineate an SU can also often be determined on cross sections of well log and/or outcrop data (Figure 3). Data from other stratigraphic disciplines, especially biostratigraphy, can be useful in demonstrating the occurrence of a substantial time gap across a suspected subaerial unconformity.
Barrell (1917) and Wheeler (1958) related the origin of a subaerial unconformity to the movement of base level, which is the conceptual surface of equilibrium between erosion and deposition. Deposition can potentially occur where base level occurs above the surface of the Earth and erosion will occur in areas where it lies below the Earth’s surface. A subaerial unconformity is interpreted to form by subaerial erosional
processes, especially those connected to fluvial and/or chemical erosion, during a time of base level fall (Jervey, 1988). As base level falls beneath the Earth’s surface, subaerial erosion cuts down to that level.
Wheeler (1958) and Jervey (1988) also showed that a subaerial unconformity advances basinward during the entire time of base level fall and reaches its maximum basinward extent at the end of base level fall. It continues to form during subsequent base level rise as it retreats landward and is onlapped by nonmarine to brackish sediment.
In regards to its relation to time surfaces, a subaerial unconformity is commonly an approximate time barrier and time surfaces, for the most part, do not pass through it. In other words, almost all strata below the surface are older than almost all those above.
There are definitely exceptions to this and these can be associated with migrating uplifts (Winker, 2002). Also, some fluvial strata, especially at the base of incised valley fills, may have been deposited during base level fall (Suter et al, 1987; Galloway and Sylvia, 2002; Blum and Aslan, 2006) and are thus older than some of the down-dip strata below the unconformity (Figure 4). In this case, the actual subaerial unconformity would lie on top of fluvial strata deposited during fall. However, such a surface would likely be very hard to identify within a succession of fluvial strata and the basal contact of the fluvial strata is best interpreted as the SU unless compelling data dictate otherwise (Suter et al., 1987).
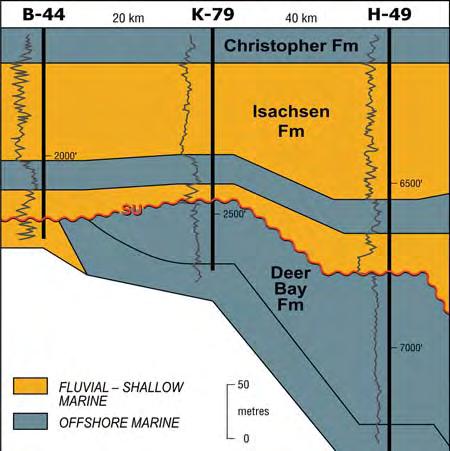
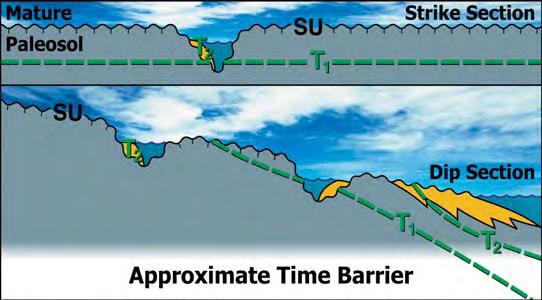
Figure 4. An SU is often an approximate time barrier because fluvial strata deposited during base level fall can be preserved in incised valleys. Such strata (deposited at time T2) are the same age as deltaic strata deposited down dip and which underlie the SU. In this case some strata on top of the interpreted SU are older than some strata below it and it is not a perfect time barrier.
The time-barrier aspect of a subaerial unconformity makes it an important surface for correlation and for bounding genetic units. This surface has been given other names besides subaerial unconformity such as lowstand unconformity (Schlager, 1992), regressive surface of fluvial erosion (Plint and Nummedal, 2000), and fluvial entrenchment / incision surface (Galloway and Sylvia, 2002). However, the term subaerial unconformity has the widest acceptance and is the one I would recommend for this surface.
The regressive surface of marine erosion was first empirically recognized and named by Plint (1988) mainly on the basis of studies on Cretaceous strata in Alberta. Its defining characteristics include being a sharp, scoured surface and having offshore marine strata (usually mid to outer shelf) that coarsen upwards below the surface and coarseningand shallowing-upward shoreface strata above the surface (Figure 5). The underlying shelf strata are variably truncated and the overlying shoreface strata downlap onto the RSME. Sometimes a Glossifungites trace fossil assemblage is associated with the RSME (MacEachern et al., 1992). The surface occurs within an overall regressive succession but is considered a change in depositional trend from deposition to nondeposition and back to deposition.
Plint (1988) interpreted the RSME formed during a time of base level fall when the inner part of the marine shelf in front of the steeper shoreface is sometimes eroded. This area of inner shelf erosion, which can be up to a few tens of kilometres wide, moves seaward during the entire interval of base level fall and is progressively covered by prograding shoreface deposits (Figure 6). Thus the RSME can potentially be quite widespread both along strike and down
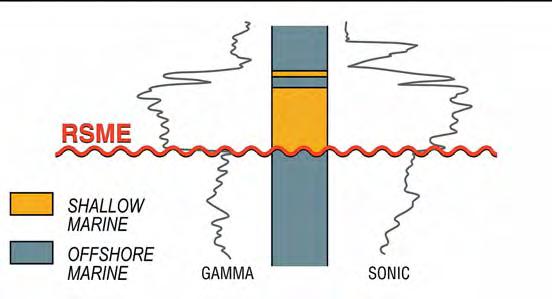
dip. However, it should be noted that in many cases an RSME either has a patchy distribution or does not form at all due to variations in sea floor slope, sedimentation rate, and base level fall rate (Naish and Kamp, 1997; Hampson, 2000; Bhattacharya and Willis, 2001).
In most cases, erosion beneath the RSME is minor and localized and thus it is almost always a diastem and not an unconformity (Galloway and Sylvia, 2002). Sometimes local truncation of strata beneath an RSME can be demonstrated but this requires very close control. However, the potential for more substantial erosion exists and, in a few examples, it has been shown to be an unconformity where it has eroded through a subaerial unconformity (Bradshaw and Nelson, 2004; Cantalamessa and Celma, 2004).
Because the regressive surface of marine erosion migrates basinward during the entire time of base level fall, it is a highly diachronous surface and time lines pass through it (offset) at a high angle (Embry, 2002) (Figure 7). It is not an approximate time barrier like a subaerial unconformity except in the few instances where it has eroded through a subaerial unconformity (e.g., Cantalamessa and Celma, 2004). Because it is most often a highly diachronous, diastemic surface and has a very patchy distribution, the RSME is not suitable for use as a bounding surface for sequence stratigraphic units or for being part of a correlation framework. However, it is important to recognize such a surface when it is present and to use it as part of facies analysis inside the established sequence stratigraphic correlation framework. Galloway and Sylvia (2002) referred to this surface as the regressive ravinement surface. The term regressive surface of marine erosion is most commonly used and is recommended.
Barrell, J. 1917. Rhythms and the measurements of geologic time. Bulletin of the Geological Society of America, v. 28, p. 745-904.
Bhattacharya, J. and Willis, B. 2001. Lowstand deltas in the Frontier Formation, Powder River Basin, Wyoming: implications for sequence stratigraphic models. American Association of Petroleum Geologists Bulletin, v. 85, p. 261-294.
Blum, M. and Aslan, A. 2006. Signatures of climate versus sea level change within incised valley fill successions: Quaternary examples for the Texas Gulf Coast. Sedimentary Geology, v. 190, p. 177-211.
Bradshaw, B. and Nelson, C. 2004. Anatomy and origin of autochthonous late Pleistocene forced regressive deposits, east Coromandel inner shelf, New Zealand: implications for the development and definition of the regressive systems tract. New Zealand Journal of geology and Geophysics, v. 47, p. 81-97.
Cantalamessa, G. and Di Celma, C. 2004. Sequence response to syndepositional regional uplift: insights from high-resolution sequence stratigraphy of late early Pleistocene strata, Periadriatic Basin, central Italy. Sedimentary Geology, v. 164, p. 283-309.
Cartwright, J., Haddock, R., and Pinheiro, R. 1993. The lateral extent of sequence boundaries. In: Williams, G. and Dobb, A. (eds.) Tectonics and sequence stratigraphy. Geological Society London Special Publication 71, p. 15-34.
Embry, A.F. 1995. Sequence boundaries and sequence hierarchies: problems and proposals. In: Steel, R.J., Felt, F.L., Johannessen, E.P. and Mathieu, C. (eds.) Sequence stratigraphy on the northwest European margin. Norwegian Petroleum Society (NPF) Special Publication 5, p. 1-11.
Embry, A. 2001. The six surfaces of sequence stratigraphy. American Association of Petroleum Geologists Hedberg Conference on sequence stratigraphic and allostratigraphic principles and concepts, Dallas. Abstract volume, p. 26-27.
Embry, A.F. 2002. Transgressive-Regressive (T-R) Sequence Stratigraphy. In: Armentrout, J and Rosen, N. (eds.). Sequence stratigraphic models for exploration and production. Society for Sedimentary Geology (SEPM), Gulf Coast SEPM Conference Proceedings, Houston, p. 151-172.
Figure 5. An RSME is interpreted at the base of the sandstone because it is an abrupt contact which is underlain by offshore shelf strata which coarsen-upward (see sonic log) and overlain by coarsening-upward shoreface strata (after Plint, 1988). (Continued


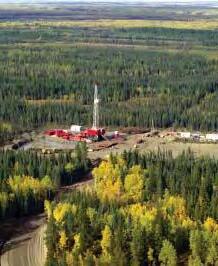


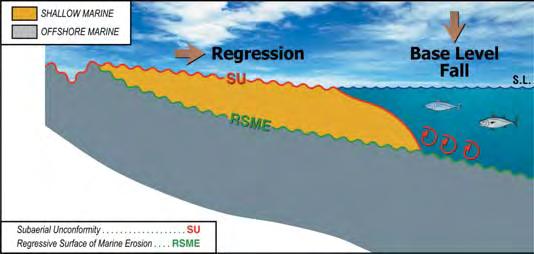
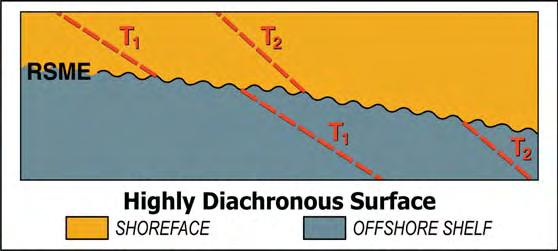
This is a one-day workshop on the geology and reservoir characteristics of these shallow, low-permeability, gas-bearing formations in Alberta, Saskatchewan and Montana. This popular and well-reviewed course has been updated to include many recent developments in unconventional shallow gas exploration.
Topics include:
Stratigraphy, facies, structure, lithological properties and log characteristics of each formation.
Shallow gas production issues, including reserve estimation. The geology of all current play trends.
32 cores from Alberta and Saskatchewan will be shown. There is a newly updated 250 page book of course notes containing many unpublished maps and sections
Course date: Thursday October 9th , 2008
Location: EUB core facility, Calgary. Course Fee: $700
Contact: Shaun O'Connell, Belfield Resources Inc. ph: 403 246 5069; email: belfield@shaw.ca


| by Andre Chow
The CSPG Graduate Student Thesis Award is awarded annually to one M.Sc. and one Ph.D. thesis that makes the most significant contribution to sedimentary and/or petroleum geology in Canada. The award for the top thesis in each category consist of a one-year membership in the CSPG, a framed certificate and a cash prize for the Ph.D. winner of $1,500 and for the M.Sc. winner of $1,000. The award was inaugurated in 1958 with one combined M.Sc./Ph.D. award for the first several years. In 1964 the award was divided into its present format of a separate M.Sc. and Ph.D. award. Over the past 49 years the winners of this award have included some very well known geologists (see below).
Each year the call for theses is initiated with an advertisement in the CSPG Reservoir and an e-mail to all Canadian universities with Geological Sciences graduate programs. In many instances committee members also follow up by contacting individual professors from the Geology departments. Eligible theses are those produced by students who have graduated at the preceding Spring or Fall convocation from a Canadian university, or who have completed research in the same period at a foreign university on a suitable Canadian topic. Theses are sent to the committee chairperson by early September. By midSeptember the committee begins the task of evaluating the thesis. Over the past several years the committee has received on average 12 M.Sc. theses and three or four Ph.D. theses for the competition.
The criteria by which the theses are judged include definition of purpose and success in reaching goals, method and logic of investigation, originality of topic, ideas and content, validity of interpretations and conclusions, completeness of data generation and presentation, contribution to science and industry, depth and thoroughness of research and overall effort as well as organization of chapters, quality of writing and effective use of illustrations. Successful theses will also provide, where appropriate: a full consideration of the economic implications of scientific contributions made from a small study area or topic; and will relate any observations made in modern depositional settings to the ancient record, and vice versa. By
mid-December the winning theses are determined by the committee, and authors and respective supervisors are notified thereafter.
Winning thesis topics in recent years have included studies on the sedimentology of Devonian reefs; detailed stratigraphic and sedimentologic studies of Cretaceous (Paddy), Jurassic (Nordegg), and Neoproterozoic (Upper Kaza Group); detailed analysis of a modern coarse clastic barrier complex; and a re-examination and interpretation of the classical Joggins Formation exposures in Nova Scotia.
The current committee consists of nine members (Andre Chow, Tim de Freitas, Richard Evoy, Tony Hamblin, Sid Leggett, Terry Sami, Martin Teitz, and Michael Webb). In addition Les Eliuk, who up until a couple of years ago had been on the committee for 28 years, still keeps his eye on the activity of our committee from Nova Scotia. In fact he even attended our final meeting this past December. As well Eileen Scott, who has been on the committee for several years, did not participate last year but is still part of our ‘extended committee’. In the past years the committee has had as few as seven members and as many as twelve members.
The only prerequisite for being a member of the committee is a willingness to read and evaluate theses. It is an excellent way to stay current with research at universities. The committee has a couple very dedicated long-serving members. In addition to Les, Tony Hamblin has been on the committee for over 20 years. We do however recruit for new members and anyone who is interested in serving on this committee is certainly encouraged to contact the chairperson – Andre Chow at 403-260-8061. We are always looking for new members for the committee.
CSPG GRADUATE STUDENT THESIS AWARDS PAST WINNERS
YEARBEST
1958 R. G. McCrossan
1959 N. Gale Koch
1960 Eric W. Mountjoy
1961 O. Miedema
1962 Z. E. Peterman
1963 J. E. Klovan
1964J. A. WestgateA. Lissey
1965Ernie E. PelzerW. A. Hogg
1966 Dirk J. Tempelman-Kluit
1967Esther R. JamiesonA. V. Morgan
1968J. E. RobinsonRay A. Rahmani
1969Hugh R. BalkwillDale R. Dolphin
1970F. G. Young Gerry E. Reinson L. K. Vopni
1971
1972M. M. BrookeJoel A. Collins
1973Ray A. RahmaniGeorge Eynon
1974 G. R. Peeling
1975B. I. Chi Fran J. Hein
1976Ashton F. EmbryR. S. Brown
1977Ian A. McIlreathRon M. Bustin
1978R. A. Olsen Pak K. Wong
1979Steven BurnieDoug Stewart
1980Brian D. RickettsBrian R. Pratt
1981Margot E. McMechanBrett Mattes
1982 William B. Styan
1983R. A. FensomeSteven P. Halabura
1984Gary P. Smith
1985David P. JamesDenis Fillion
1986Nancy ChowFran M. Haidl
1987Brian A. ZaitlinAndre M. C. Chow
1988Ian Muir Eric LeGresley
1989Hugh J. Abercrombie
1990Anthony P. HamblinShane M. Pelachaty
1991J. Chris HarrisonPaul Theriault
1992Lavern. StasiukJoerg Wittenberg
1993Carlos BruhnMarjorie Johns
1994Tom D. BoreenKelly J. Arnold
1995Terry Sami Gary Johannson
1996Paul A. BlanchonMark R. Hearn
1997Caroline A. WilliamsElizabeth H. Perez
1998Rudolf MeyerBrad R. Spence
1999E. C. TurnerSusan J. Reid
2000Murray K. GingrasE. Matthew Caddel
2001James E. BarclayM. Scott Leroux
2002 Colin L. Wooldridge
2003Arndt PeterhanselKevin L. Treptau
2004Laurence H. DavisMichele Asgar-Deen
2005 Lori Meyer
2006Michael C. RygelMichael Hay
2007Alex J. MacNeil Jessica Krawetz (née Rylaarsdam)
| by Chris Manion
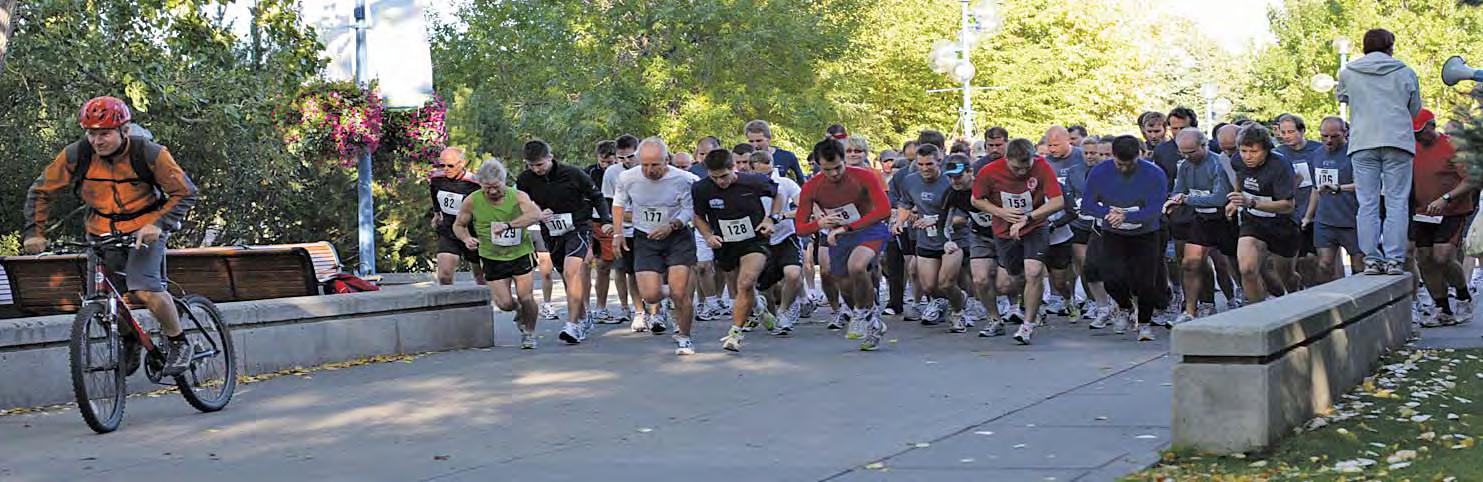
Once again, the CSPG and CSEG will be running the annual Roadrace and Fun Run in September. With some new and exciting changes, the event promises to be better than ever.
This year, we will be offering both a 10 km and a 5 km race. We have secured winning time to provide chip timing and events-online will provide easy on-line registration.
The run will take place on Wednesday, September 10, 2008 beginning at 6:00pm at the Eau Claire YMCA. The route will take you on an out-and-back course along the beautiful Bow River pathways, finishing at the Eau Claire YMCA. Following the race, all racers, volunteers, and guests are invited
to gather at Quincy’s for awards, draw prizes, refreshments, and some friendly camaraderie. So if you are looking for a competitive race or just want to have fun, come join us!
The race is open to all members of the CSPG, CSEG, and CAPL, and the general public, however, space is limited to 200 participants. Register early to avoid disappointment. There will be NO race day registration. For more information or to register, visit our website www.cspg. org\events
To help you, Gord Hobbins of Gord’s Running Store has developed a 10 km race training guide for novice runners. Try it
out and benefit from some expert advice, you may be surprised how easy it can be to gently get yourself in condition for your first race.
GORD’S 12 WEEK TRAINING GU IDE FOR NOVICE RUNNERS Guidance/Tips: For novice runners who wish a do-it-yourself program at your leisure.
• Run for short durations between three and five times per week according to schedule, with your long run days being the key to your training program.
• If your running shoes are giving you some problems, get some which fit and match your gait.
• Guide allows for a gradual increase to a comfortable load; your legs may need some conditioning at first.
• Yes, times are in minutes. The secret is to be regular and not beat yourself up.
• Wear a hat and cool shades. Keep well hydrated. It really helps.
• Gently stretch those calves and quads afterwards.
• Take along a friend and convince them to sign for CSPG, CSEG, and the RoadRace as well.
• There are many running/training groups in town if interested in more.
Many thanks go out to our sponsors and volunteers who make this event possible each year!
We hope to see you there!
Aug
| by Colin Yeo
2005 was the last year that the CSPG held contested elections for Executive positions in the Society. Since then, all candidates for all positions have won by acclamation. Is this such a bad thing? I think not!
Quality candidates who are willing to devote the time and energy serving the Society are difficult to find and holding elections meant that half of our candidate pool was consumed by not being elected to the position they were contending. It is difficult to encourage a defeated candidate to run again and they are lost forever. My experience has been that several candidates will naturally compete for a position if there are opposing views on a subject of interest to our membership. If there is a ‘Big Idea’ that someone wants to implement or a new direction that members want to take, then multi-candidate elections will be held. A crisis or challenge that needs to be addressed will garner competition for votes. Over the last several years, none of these conditions have materialized and our members are quite happy with the Society and the service it provides. There is always room for improvement but, on the whole, members agree with the small, incremental, and continuous improvement that recent and current Executives have provided.
Our recent practice has been to identify and capture members who have the skills, competencies, and attitude necessary to lead the Society, much as corporate boards of directors recruit new board members to replace retiring members. This is done through the one-person Nominating Committee, the Past President, who reviews candidates with the President and Vice President. Once the slate is complete, the entire Executive reviews the candidates. The roster is set aside until after the close of nominations on September 15th. If there are no write-in candidates, all nominees are elected by acclamation.
The last three years have seen capable and dedicated Executive Committee members serve the Society. Each Director has been carefully screened to ensure they understand the purpose, structure, and organization of the CSPG, so that they can be effective in their duties. Dedication to their portfolios and the ability to work collegially with other directors on broad issues are other traits that are used in identifying the candidates, who are carefully targeted and then approached. This year continues the practice and I am pleased to say that, except for one position, there is a full slate of candidates ready for office in January, 2009.
These candidates share some common characteristics. They see the tremendous
value of the Society in advancing and sharing the science of petroleum geology and professionally developing our members, believe in service to the Society, and believe that is the members who should govern such a large enterprise. Often, they have key initiatives that they would like to institute to make the CSPG better.
The general membership has not raised
Executive acclamation as an issue. My sense is that members feel they are being well served despite not casting a ballot for Officers. However, if any member wishes to stand for election for any position, they simply need to nominate themselves in writing accompanied by 25 signatures of members in good standing. We will then hold an election for the position.
Take your pick


There is no wrong answer.
At Divestco, we understand what it means to be a customer. You like to be able to depend on a service provider to act in your best interests, give you exactly what you need, and only what you want. Divestco’s integrated offering for geological professionals gives you the ability to choose from a wide range of geological products and services to suit your unique needs. Pick anything you want, choose a bundled offer or let our experts create a custom solution for you.
Call Jennifer Davies at 403.537.9904 or email jennifer.davies@divestco.com for more information.


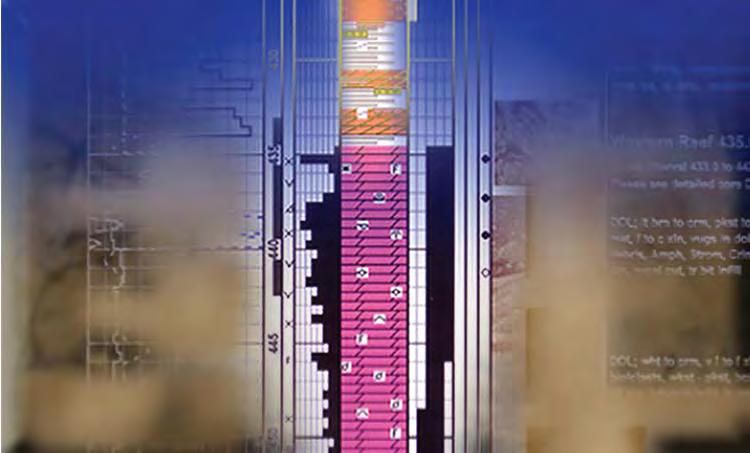


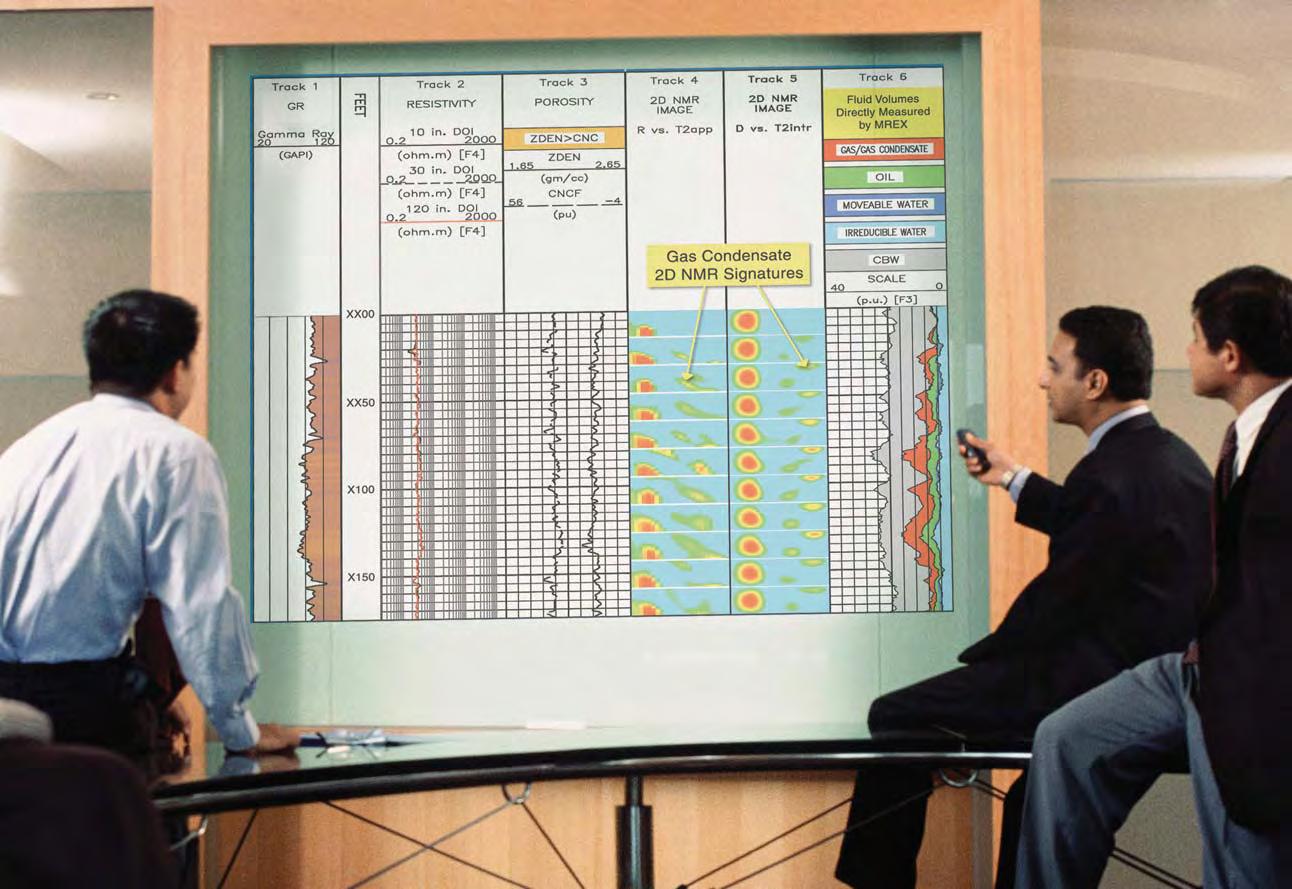
Are you faced with difficult interpretation challenges?
Would you give this zone a second look?
The Triple-combo logs (left side) show no clear indication this zone contains hydrocarbons.
What if you could “see” the fluids contained in this zone to identify fluid type and quantity?
Now you can! The 2D NMR images from the MR ExplorerSM (MREXSM) service in tracks 4 & 5 identify gas condensate in this zone.
Does it contain commercial quantities of hydrocarbon?
The fluid volumetrics measured by the MREX service (in track 6) indicate commercial quantities of hydrocarbon are present in this interval. This was confirmed by formation tests using the Baker Atlas Reservoir Characterization InstrumentSM (RCISM) service.
Image the fluids and know for sure.
The MREX service from Baker Atlas makes direct measurements of fluid type and volume.
2D NMR imaging enables you to “see” the fluids to ensure all potential hydrocarbon zones are identified for maximum recovery on every well.
For direct measurements of reservoir fluid type and volume, contact Baker Atlas today.