


Looking to maximize opportunities in today’s volatile market?
Combine the power of PETRA® and IHS Critical Information including well and log data to define reservoir parameters and determine new opportunities faster and more cost effectively.
Let IHS information solutions improve your decision-making and reduce your risk.
For more information on PETRA visit us at www.ihs.com/reservoirsolutions


#600, 640 - 8th Avenue SW Calgary, Alberta, Canada T2P 1G7
Tel: 403-264-5610 Fax: 403-264-5898
Web: www.cspg.org
Office hours: Monday to Friday, 8:30am to 4:00pm
Executive Director: Lis Bjeld
Email: lis.bjeld@cspg.org
Advertising & Sponsorship Coordinator: Alyssa Middleton
Email: alyssa.middleton@cspg.org
Communications Coordinator: Heather Tyminski
Email: heather.tyminski@cspg.org
Member Services Coordinator: Kasandra Klein
Email: kasandra.klein@cspg.org
Registration Coordinator: Dayna Rhoads
Email: dayna.rhoads@cspg.org
Joint Annual Convention Committee
Convention Manager: Shauna Carson
Email: scarson@geoconvention.org
Convention Coordinator: Tanya Santry
Email: tsantry@geoconvention.org
EDITORS/AUTHORS
Please submit RESERVOIR articles to the CSPG office. Submission deadline is the 23rd day of the month, two months prior to issue date. (e.g., January 23 for the March issue).
To publish an article, the CSPG requires digital copies of the document. Text should be in Microsoft Word format and illustrations should be in TIFF format at 300 dpi., at final size. For additional information on manuscript preparation, refer to the Guidelines for Authors published in the CSPG Bulletin or contact the editor.
Technical Editors
Ben McKenzie Colin Yeo (Assistant Tech. Editor) Tarheel Exploration EnCana Corporation Tel: 403-277-4496 Tel: 403-645-7724
Email: bjmck@telusplanet.net Email: colin.yeo@encana.com
Coordinating Editor
Heather Tyminski
Comunications and Public Affairs, CSPG Tel: 403-513-1227, Email: heather.tyminski@cspg.org
ADVERTISING
Advertising inquiries should be directed to Alyssa Middleton, Tel: 403-513-1233, email: alyssa.middleton@cspg.org. The deadline to reserve advertising space is the 23rd day of the month, two months prior to issue date.
The RESERVOIR is published 11 times per year by the Canadian Society of Petroleum Geologists. This includes a combined issue for the months of July and August. The purpose of the RESERVOIR is to publicize the Society’s many activities and to promote the geosciences. We look for both technical and non-technical material to publish. The RESERVOIR is not intended to be a formal, peer-reviewed publication. Additional information on the RESERVOIR’s guidelines can be found in the May 2008 issue (p.46-48; available at http://www.cspg.org/publications/reservoir/reservoir-archive-2008.cfm).
No official endorsement or sponsorship by the CSPG is implied for any advertisement, insert, or article that appears in the Reservoir unless otherwise noted. The contents of this publication may not be reproduced either in part or in full without the consent of the publisher.
Alberta’s Professional Geoscientists and Engineers provide Albertans with many of the essentials of daily living. The work that they do allows all of us to enjoy warmth, light, power, water and the ability to travel and communicate over distance.
Since 1920, Members of APEGGA, The Association of Professional Engineers, Geologists and Geophysicists of Alberta, have made a difference in the daily lives of millions of Albertans by bringing science and innovation to life.
The P.Geol., P.Geoph., P.Eng., and R.P.T. professional designations represent the highest standards of quality, professionalism and ethics in geoscience and engineering. APEGGA Members can take pride in the role they play and the contribution they make to Alberta.
APEGGA and its over 55,000 Members are committed to public safety and well-being through the self-regulation of the geoscience and engineering professions in Alberta.
Visit www.apegga.org for more information.

Geologists Geophysicists Engineers
CSPG EXECUTIVE
President
Graeme Bloy • Canada Capital Energy Corporation gbloy@capitalenergy.ca Tel: (403) 975-5784
Vice President
John Varsek • EnCana Corporation john.varsek@encana.com Tel: (403) 645-5417
Past President
Lisa Griffith • Griffith Geoconsulting lgriffith@griffithgeoconsulting.com Tel: (403) 669-7494
Finance director
David Garner • Chevron Canada Resources davidgarner@chevron.com Tel: (403) 234-5875
assistant Finance director
Greg Lynch • Shell Canada Ltd. greg.lynch@shell.com Tel: (403) 691-3111
Program director
Randy Rice • Suncor Energy Inc. rjrice@suncor.com Tel: (403) 205-6723
assistant Program director
Scott Leroux • EnCana Corporation scott.leroux@EnCana.com Tel: (403) 645-2000
serVices director
Ayaz Gulamhussein • NuVista Energy Ltd. ayaz.gulamhussein@nuvistaenergy.com Tel: (403) 538-8510
assistant serVice director
Penny Colton • Exploratech Service Ltd. Penny@xploratech.com Tel: (403) 278-8755
outreach director
Mike DesRoches • Talisman Energy Inc. mdesroches@talisman-energy.com Tel: (403) 513-6843
communications director
Peggy Hodgkins • CGGVeritas peggy.hodgkins@cggveritas.com Tel: (403) 266-3225
executiVe director
Lis Bjeld • CSPG lis.bjeld@cspg.org Tel: (403) 513-1228
A message from the CSPG Finance Director, David Garner

This is the 100th year after the discovery of the Burgess Shale...
... fossil deposits in 1909 by Charles Doolittle Walcott, a paleontologist and director of the Smithsonian Institution in the early 20th century. I had the opportunity to visit the Walcott quarry high above Emerald Lake in August with a group of Calgary co-workers. To our benefit, the field trip group was filled out with seven professors, mainly paleontologists, from U.S. institutions. Our two knowledgeable geologist guides were from the Burgess Shale Geoscience Foundation. I must admit, despite having lived so close to this UNESCO World Heritage Site for two decades, it was my first visit.
One visiting paleontologist, Matt James of Sonoma State University, narrated the story of the Burgess fossils discovery. According to the story, Mrs. Walcott’s horse was blocked by a large rock. Walcott got down from his horse to flip the rock out of his wife’s path and discovered the first Burgess fossils. Professor James pointed out that the discovery is due to the fact that “Charles Doolittle Walcott was both a paleontologist and a gentleman, as all paleontologists are!” According to Dr. James there are up to 50 phyla identified in Cambrian sediments. After Cambrian time, he said only about 20 phyla can be identified and these remain today. As I have subsequently read, the identification and exact number of these phyla, past and present, remains a controversy given that we only have glimpses of these evolutionary experiments through the fossil record. The related environmental changes that lead to extinctions easily guide us to a group discussion on climate change, diversity, and adaptability. If you have not taken a Burgess Shale hike, it is well worth putting it in your plans for next summer, the 101th year since this amazing discovery.
What a year it has been for our Society. In late 2008, CSPG turned over its own rock and headed down a path of restructuring. I am writing this article just a week before the CSPG’s fiscal year end, which is August 31. In December, I will report to you on the
results of our Review Engagement for fiscal year 2009. There are a number of changes and highlights that we can cover at this time. The Living Budget from last September 2008 targeted $3MM in revenue and expenses. We typically budget for a small 1-2% surplus to account for operating variances. If it materializes, the surplus is added to a reserve fund after all the moving CSPG parts are taken into account at year end. This fiscal year began with a reserve fund of $1,032,000 on the balance sheet.
In January 2009, we revised the working budget lowering the revenue estimate downward to $2.3MM. The finance committee (Lis Bjeld, Greg Lynch, and I) enacted cost control measures. We, in fact, reacted to the world financial crisis. Membership renewal rates were down. Technical luncheon attendance plummeted. Our estimates of profits from the annual convention and Continuing Education faced a reality check. One visible symptom of this world-wide financial phenomenon that unfolded was that a seemingly healthy organization had an impending cash crunch as cost reduction lagged the revenue drop.
With visions of the reserve fund being spent, all expenses were under scrutiny. Lis identified the big hitter expenses to tackle first, and early warning flags were attached to a long list of items. She systematically coordinated the effort with the Executive Committee and office staff to reduce expenses, which was achieved. With office staffing changes implemented, the next task was bringing efficiencies and further focus on controllable costs and shared staff responsibilities.
Remaining in mind and sight was the goal of delivering broad value to the members. A new server was purchased and set up. Memberships can now be renewed on-line with you printing your membership card and receipt. Technical luncheon tickets can be bought and printed online. We could not have achieved these changes without the incredible support of our (Continued on page 42...)

Glenbow Archives nd_3_4155a (detail).
For more information or to apply for a ConocoPhillips Glen Ruby Memorial Scholarship, visit: www.cspg.org or www.conocophillips.ca
ConocoPhillips Canada is proud to continue the ConocoPhillips Glen Ruby Memorial Scholarships in Geosciences. These scholarships are presented each year to second, third, and fourth years students to promote excellence in petroleum GEOLOGY and GEOPHYSICS.
$2,000 $3,000 $5,000 2nd year geoscience student 3rd year geoscience student 4th year geoscience student
ConocoPhillips Canada is pleased to recognize and honour a pioneer who has had a lasting influence on the Canadian Oil and Gas industry. From 1926 to 1929, Glen Ruby was Vice President and General Manager of Marland Oil’s Canadian partnership, Hudson’s Bay Oil and Gas. While in Alberta he was a driving force behind the inaugural meeting and formation of the Alberta Society of Petroleum Geologists (renamed Canadian Society of Petroleum Geologists in 1972).
Glen Ruby dedicated his life to exploration and has been recognized as one of the great pioneers in the global search for oil and gas. In addition to Canada, he successfully explored for oil in Chile, Alaska, and the US Rocky Mountain basins. At one time he was credited with having made the most northerly and southerly oil discoveries in the world.
Since inception, the Canadian Society of Petroleum Geologists has been a forum for sharing ideas and knowledge about the geology of Western Canada and the Canadian frontiers. This knowledge exchange has played a fundamental role in the successful development of the Canadian oil industry. Glen Ruby’s legacy thrives three-quarters of a century later.
ConocoPhillips has been active in Canada since 1880 through the activities of heritage companies including Continental Oil Company, Marland Oil/ Hudson’s Bay Oil and Gas, British American, Royalite, Asamera, Pennzoil, Stampeder, Mannville, Crestar, Gulf Canada Resources, Poco, Canadian Hunter, Burlington Resources, Conoco Canada, and Phillips Petroleum. We proudly honour Glen Ruby as a pioneer and industry leader and we are pleased that the memorial scholarships will assist in the development of future geoscientists.
CSPG Trust
Geoscientists for our future

APACHE CANADA LTD.
BAKER ATLAS
CONOCOPHILLIPS CANADA LIMITED
DEVON CANADA CORPORATION
ENERPLUS RESOURCES TRUST
geoLOGIC systems ltd.
GEOMODELING TECHNOLOGY CORP.
HUNT OIL COMPANY OF CANADA
HUSKY ENERGY INC.
IHS
IMPERIAL OIL RESOURCES
LARIO OIL & GAS COMPANY
LITTLE ROCK DOCUMENT SERVICES
MJ SYSTEMS
MURPHY OIL COMPANY
NEXEN INC.
PENN WEST PETROLEUM LTD.
PETRO-CANADA OIL AND GAS
PETROCRAFT PRODUCTS LTD.
PROVIDENT ENERGY LTD
RPS ENERGY CANADA LTD.
SHELL CANADA LIMITED
SPROULE ASSOCIATES LIMITED
SUNCOR ENERGY INC
TALISMAN ENERGY INC.
TECK COMINCO LIMITED
TOTAL E&P CANADA LIMITED
TOURMALINE OIL CORP.
AS OF AUGUST 29, 2009
| by Robert MacNaughton and Denis Lavoie
This is our first contribution to the Reservoir as Editors-in-Chief of the Bulletin of Canadian Petroleum Geology and we thank the Society for giving us the opportunity to edit a journal that has more than fifty years of history behind it. In this column, we will offer thanks to our predecessor and update Society members on recent developments at the Bulletin. We will outline our goals for our editorial tenure in a later column.
Glen Stockmal served as Editor-in-Chief from 2003 to 2009 and his service to the CSPG was acknowledged recently when the Society presented him with its Tracks Award. On a personal level, we want to thank him for patiently showing us the ropes of editing the Bulletin, answering our numerous questions, and never being scared to offer an opinion. We hope that we can emulate Glen’s high standard of integrity and his outstanding dedication to scientific inquiry. Glen also helped the Bulletin move into the world of digital publication by adopting online review software and by joining the GeoScienceWorld online aggregation of journals, which has given us a global audience. Thanks to Glen’s high scientific standards, the Bulletin has kept its place as the main Canadian publication on sedimentary basins and associated hydrocarbon resources.
Some months ago, the CSPG Executive decided to move the Bulletin of Canadian Petroleum Geology from being primarily a print journal to primarily an online journal. Members may have noticed that the March issue recently was posted on the public part of the Society’s website. By the time this column is published, the March issue may have been moved to the members-only part of the website and, if not, it will be moved in the near future. Heather Tyminski, the Society’s Communications Coordinator, is working hard at completing this transition and deserves the Society’s thanks for her efforts.
This change in publication format was a major decision by the Executive and, from our perspective, appeared to be driven by the financial challenges faced by the Society. So be it. As Editors-in-Chief, our primary concern is with the scientific content of the Bulletin and, although the main delivery format of the Bulletin has changed, its goals have not. We still aim to be the journal of record for publications dealing with
all aspects of petroleum geology, broadly conceived, with a particularly (though not exclusively) Canadian focus. We will continue to pursue an international presence through GeoScienceWorld and through the quality of the science we publish.
From an author’s point of view, very little in the publication process will change. Frequency of publication will remain the same. Submission and review of manuscripts will continue to be done via Editorial Manager™. Large-format figures (printed, up to now, as fold-outs) will continue to be accepted. And going online brings an advantage, in that colour figures will no longer necessitate extra printing charges. Roughly bound, laser-printed hard copies of each issue will be reposited in subscribing libraries. This will help ensure permanent archiving of the science and also means the Bulletin will remain a valid venue for the publication of new fossil species(Repository copies are a requirement of both the International Code of Botanical Nomenclature and the International Code of Zoological Nomenclature).
For the benefit of members who may not have access to colour or large-format printing, the CSPG office will be able to provide on-demand hard-copy of individual articles at cost. Members wishing to receive laser-printed copies of each issue will be able to obtain them by calling the Society’s office at (403) 513-1227.
This is a big change, and we encourage members to make their views known once they have had a chance to see the new, online delivery in its final form this fall. But change is nothing new at a journal that, since 1953, has evolved from the Alberta of Society Petroleum Geologists News Bulletin to the Journal of the Alberta Society of Petroleum Geologists (1955) and to the Bulletin of Canadian Petroleum Geology (1963). A typewritten, Alberta-focused newsletter has evolved into an online, internationally distributed scientific journal. We hope that the latest changes will encourage members to redouble their efforts in support of scientific publishing by the CSPG.
Robert MacNaughton and Denis Lavoie are the current Editors-in-Chief of the Bulletin of Canadian Petroleum Geology. They are employed by the Geological Survey of Canada, Robert in Calgary and Denis in Québec.
SPEAKER
John Spray Planetary and Space Science Centre University of New Brunswick
11:30 am tuesday, october 13, 2009 telus convention centre, calgary, alberta
Please note: the cut-off date for ticket sales is 1:00 pm, Wednesday, october 7, 2009. csPg member ticket Price: $38.00 + gst. non-member ticket Price: $45.00 + gst.
In the last 25 years we have come to appreciate that Earth has been bombarded by asteroids and comets throughout its history, just like the other planets in our solar system. We can be forgiven for thinking otherwise, as was the case, because plate tectonics, weathering, volcanic activity, and sedimentation have conspired to erase most of our planet’s cratering record. Unlike the Moon and Mercury, the surfaces of which are saturated in craters, and Mars, which has over 40,000 named craters, Earth only has some 175 proven impact structures.
Nevertheless, impact has affected the evolution of our planet, especially in terms of its formation and first 500 million years of activity. Impact has also exerted controls on life, and the development of economic deposits. Impact craters have provided us with exceptional metal deposits, facilitated giant hydro-electric schemes, and generated major oil and gas deposits. We will explore the positive and
SPEAKER
Stephen T. Johnston
School of Earth and Ocean Sciences, University of Victoria
11:30 am
tuesday, october 27, 2009 telus convention centre, calgary, a lberta
Please note: the cut-off date for ticket sales is 1:00 pm, thursday, october 22, 2009. csPg member ticket Price: $38.00 + gst non-member ticket Price: $45.00 + gst.
A long-standing myth regarding the tectonic evolution of the Cordilleran Orogen is that terrane accretion gave rise to the Rocky Mountain fold and thrust belt. The basis for the myth lies in the presence of accreted oceanic terranes, including arc, back-arc basin and forearc, and accretionary prism assemblages,
within the hinterland of the orogen. The oceanic assemblages were emplaced eastward over continental lithosphere in the latest Triassic / earliest Jurassic. Accretion was thick-skinned, resulting in doubling of the crust and ultra-high pressure metamorphism. Extensional collapse and exhumation of the meta-plutonic roots of the orogen was complete by the Middle Jurassic. It is commonly but incorrectly assumed that terrane accretion is linked to and was responsible for the >250 km of thin-skinned shortening recorded in the Rocky Mountain fold and thrust belt. However, fold and thrust belt formation initiated after 80 Ma, more than 100 Ma after terrane accretion.
Terrane accretion, crustal thickening, and subsequent exhumation all went unnoticed by authochthonous western North America, which remained a passive margin that faced west toward a deep and wide ocean characterized by upwelling of cold ocean currents until 152 Ma. At the time of initiation of crustal shortening in the Rocky Mountains, the lithosphere bearing the accreted oceanic terranes was within a northward translating plate located west of North American, and >2,000 km to the south. Cessation of Rocky Mountain shortening was coincident with the final docking of the northward-translating hinterland lithosphere in its current location relative to the foreland. The Rocky Mountain fold and thrust belt is
negative effects of impact, all with an eye for the future and how we might deal with the threat of a large asteroid hitting Earth and destroying our society as we know it.
BIOGRAPH y
Dr. John Spray is Director of the Planetary and Space Science Centre at the University of New Brunswick and manages a research team of 15 people, which includes research scientists, graduate and undergraduate students, and staff. The team’s research activities focus on investigating planetary materials, frictional melting, impact cratering mechanics, the geology of the Moon and Mars, and processes associated with hypervelocity impact and shock effects.
Spray received his B.Sc. in Geology from Cardiff University (Wales) and his Ph.D. in Earth Sciences from Cambridge University (England). He joined the faculty of the University of New Brunswick in 1986 where he now holds the Canada Research Chair in Planetary Materials and is a co-investigator on science teams for NASA’s Mars Science Laboratory and the European Space Agency’s ExoMars rover missions.
sponsored by
not a product of terrane accretion; it is the result of a Late Cretaceous transpressional continental collision. A necessary corollary of a collisional model for the Rocky Mountains is that the continental crust and lithosphere underpinning the oceanic terranes, including the entire Omineca belt, is exotic with respect to North America, and that terrane accretion resulted from tectonic interactions that did not directly involve the North American plate.
BIOGRAPH y
Stephen T. Johnston graduated with a B.Sc. in Geology from McGill University and completed a M.Sc. and Ph.D. at the University of Alberta in structural geology and tectonics. He has worked in exploration and development for Shell Canada Ltd., as a project geologist for the Yukon Geological survey, and as a professor at the University of Durban, South Africa. He has been the Professor of Structural Geology and Tectonics at the School of Earth and Ocean Sciences at the University of Victoria since 1999. Johnston was the Fondation Herbrette Professor of Science at the University of Lausanne, Switzerland in 2005; the Profesor Visitante at the University of Salamanca, Spain in 2008; and the featured geologist in the 2007 CBC episode of the Nature of Things: Geologic Journey on The Rockies. He is the Secretary of the Canadian Geoscience Foundation, the editor of GSA Today, and the Vice-President of the Geological Association of Canada.
SPEAKER
Michael A. Cooley Consultant
11:30 am
t hursday, n ovember 12, 2009 telus convention centre c algary, a lberta
Please note:
the cut-off date for ticket sales is 1:00 pm, Friday, november 6, 2009. csPg member ticket Price: $38.00 + gst. n on- m ember t icket Price: $45.00 + gst.
Due to the recent popularity of talks, we strongly suggest purchasing tickets early, as we cannot guarantee seats will be available on the cut-off date.
Did you know that you can book a table for the Technical Luncheons? To book your company’s table, or to buy individual tickets, visit www.cspg.org.
The Livingstone Range anticlinorium (LRA) is a long (>65 km) narrow (<5 km) structural culmination of linked en-echelon chevron-style thrust-propagation folds that marks a major hanging-wall ramp across which the Livingstone thrust cuts ~1,000 m up-section from a regional décollement in the upper part of Devonian Palliser Formation to a décollement within Jurassic Fernie Formation. It is well exposed and
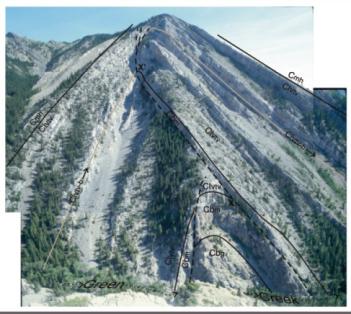
Figure 1. View south at the core of the Centre Peak anticline as exposed on the south side of the Green Creek canyon. The planar limbs of the anticline are separated by a composite, east-verging thrust fault that extends along the hinge zone. The lower segment, at the level of Green Creek, is a near-vertical thrust fault that is sub-parallel with the steep bedding in the micrite unit at the top of the Banff Formation (Cbm) in the forelimb of the anticline but cuts up-section through the sub-horizontal bedding of the Banff Formation grainstone unit (Cbg) and micrite unit in the hinge zone. The footwall and hanging wall cut-offs of the top of the Banff Formation micrite unit along this thrust fault, which are marked by X and X’, respectively, have been offset ~250 metres along this fault.
provides actualistic models for exploration of analogous subsurface structures. More than 30 km of detailed mapping alongstrike reveals generally gradual changes punctuated by abrupt terminations or offsets of structures at NE- and E-trending tear faults, most of which are interpreted to be reactivated basement faults that originally formed during the Carboniferous. Some folds plunge out both northward and southward at tear faults, forming doubly-plunging folds that were once ideal domal petroleum traps. The hinge zones of the chevron-style, flexuralslip, thrust-propagation folds display a distinctive pattern of ramp-flat thrusting comprising stacked detachment thrusts, each of which emerges from a different zone of interbed slip in the backlimb and deflects the hinge zone eastward. Each successively lower detachment thrust dies out in the hinge zone just below an overlying one (Figure 1). Displacements on the detachments, rotation of fold limbs,
and inter-bed flexural slip were integrated kinematically during thrust-propagation folding. Deformation during folding involved a form of cataclastic flow: during large translations and rotations, individual blocks of rock delimited by faults, joints and sheared bedding surfaces underwent small relative displacements, but little or no internal deformation. Pressure solution and vein formation were widespread but minor components of the deformation. Complex fracturing within the anticlines does not involve patterns that can be related to folding or predicted by curvature analysis; the dominant patterns involve widely spaced (~150 m) transverse zones of intense fracturing that transect hinge zones and limbs. These permeable zones are smaller analogues to the tear faults as they likely also originated by reactivation of minor basement faults.
(Continued on page 10...)
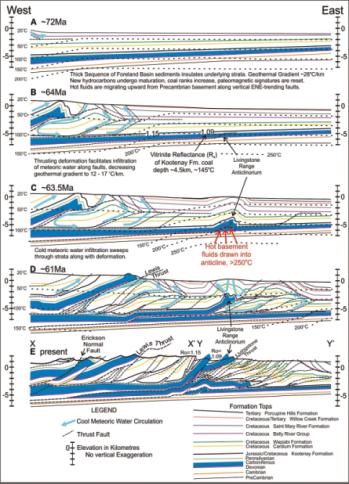
Figure 2. Hypothetical sequential palinspastic reconstruction of a composite cross-section showing the thermal, fluid, and deformation history of the southern Canadian Front Ranges and Foothills. Cross-section X-X’ is modified from Price (cross-section of Fernie map, in preparation). Cross-section Y-Y’ is modified from an unpublished cross-section of Paul Mackay.
(...Continued from page 9)
Thermal Fluid h is T ory
Early syn-folding fluid flow is recorded by dolomite+/-calcite veins with isotopic compositions that are similar to those of host rocks. It occurred along faults related to thrust-propagation folding, and also along many tear faults and larger thrust faults. Oxygen-isotope thermometry of four early syn-folding veins indicates they precipitated at anomalously high temperatures (250 +/-50°C). Most have slightly higher 87Sr/ 86 Sr ratios relative to adjacent host rocks and are interpreted to have formed from a mixture of formation
fluids and hotter basement fluids in a rockdominated system. The youngest episode of fluid flow is recorded by calcite veins with very low 18 O values (-18 to -9‰ PDB), which are interpreted to have precipitated along faults that were active while the LRA was being transported eastward and uplifted by underlying thrust faults, and rapidly cooled by infiltrating meteoric water. The faults along which significant meteoric fluid circulation occurred are marked by visibly altered host rocks that have anomalously low 18 O values and slightly lower 13C values relative to most host rocks.
The structural, thermal, and fluid evolution of the Livingstone Range Anticlinorium began by rapid heating of the Carboniferous and underlying rocks during deposition of more than five kilometres of insulating shale-dominated foreland basin deposits during Late Cretaceous to Eocene. The Livingstone thrust then propagated up through the Carboniferous strata forming the Livingstone Range anticlinorium during the peak of thermal conditions. When the anticlinoirium began to be transported eastward, rapid cooling of the strata occurred by deep infuiltration of cool meteoric water (Figure 2).
Black solid hydrocarbon residues along fault surfaces and between crystals in syntectonic veins, and petroleum-rich fluid inclusions in quartz, calcite, and dolomite in syntectonic veins attest to the presence of hydrocarbons within the Carboniferous carbonate rocks in the Livingstone Range anticlinorium at various stages of deformation.
Bio G ra Phy
Michael Cooley was born in Banff, Alberta in 1967. While growing up Cooley was an avid hiker and very interested in rocks, although by grade 12 one could have told him that the Rockies were granite and he would have believed it. Cooley began an undergraduate degree at the University of Calgary in 1988 with the intention of getting a degree in Business but soon switched to Geology. In first year he learned that he had been mainly hiking in limestones and resolved to see actual granite. Cooley completed a Master’s at Queen’s University in 1997, mapping in high-grade metamorphic rocks of the Quesnel Terrane, which was followed by a few years working in the mineral exploration industry. He began a Ph.D. at Queens University in the winter of 2000, which after getting married in 2001, buying a house, doing extensive home renovation, working for a summer for Shell, and having children, he finally completed in October 2007. Cooley is currently working for several mineral exploration companies as an independent structural geology consultant and loving it.
Cooley is the 2008 recipient of the CSPG Graduate Thesis Award for best Ph.D.
SPEAKER
Tom Brent Geological Survey of Canada - Calgary
11:30 am
m onday, n ovember 23, 2009
c algary telus convention centre
c algary, a lberta
Please note:
the cut-off date for ticket sales is 1:00 pm, Wednesday, november 18, 2009. csPg member ticket Price: $38.00 + gst. non-member ticket Price: $45.00 + gst.
Due to the recent popularity of talks, we strongly suggest purchasing tickets early, as we cannot guarantee seats will be available on the cut-off date.
This presentation summarizes some historical aspects of industry’s seismic exploration effort in the High Arctic. A range of seismic interpretation issues related to both geology and seismic data quality, as seen on different vintages and in various arctic regions, are discussed. Also highlighted are efforts of the Geological Survey of Canada (GSC) since 1984 to preserve and add to the knowledge base of High Arctic geology by using and value-adding to the legacy seismic data. These efforts include the current and planned activities involving seismic and geophysics within the Geo-Mapping for Energy (GEM) program of the current government of Canada.
Petroleum exploration of Canada’s High Arctic began with a well drilled on each of Melville, Cornwallis, and Bathurst islands between1961 and 1963. Seismic exploration however, lagged behind and Panarctic Oils Ltd. did not shoot the first line, north from Marie Bay on Melville Island until 1968. Years of seismic acquisition ensued, encountering challenges of onshore permafrost and
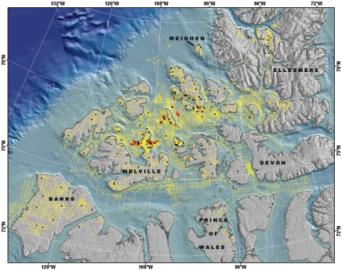
imaging through permanent multi-year sea ice. By 1986, 98,105 km of 2D seismic had been acquired (excluding Baffin Bay marine seismic) and 194 wells had been drilled discovering eight oil and 25 gas pools (Figure 1). The relatively low-fold seismic data, along with the display and interpretation methods of the day, was able to define structural drilling targets both onshore and offshore.
Land-based seismic record quality is largely very good, despite the presence of permafrost. This is primarily because the permafrost in the High Arctic does not often have discontinuities introduced from top melting, or massive ice lenses, such as is the case in the Mackenzie Delta. Because of a lack of permafrost in the offshore High Arctic, processors needed to deal with the rapid decrease of permafrost thickness to zero, at, or near shorelines. Interpreters needed to recognize the resulting velocity anomalies which ranged from a few milliseconds to over 150 ms. This variation is largely a function of the age, porosity, and rock type. Statics were generally not invoked to correct the velocity anomaly, but rather to create a smoothed stack through the relatively narrow transition zone. Prospect maps of the day normally did not have this offshore velocity sag removed and some prospects which resided in permafrost
Unconventional Gas Conference
CALGARY TELUS CONVENTION CENTRE
Platinum Sponsor

Conference
November 18 - 20, 2009
Registration Deadline is Friday, November 13
KEYNOTE PRESENTATIONS
Impacts Of Imports, Government Policy, And Technology On Future Natural Gas Supply. Edith Allison, Exploration Program Manager, U.S. Department of Energy
Unconventional Gas - Challenges for Pipelines and Markets Lyne Mercier, Board Member, National Energy Board
The Future Of Shale Gas In North America. Richard Moorman, Manager Strategic Analysis, Southwestern Energy Company
TECHNICAL SESSIONS
Conference technical sessions will focus on tight gas, shale gas and natural gas from coal and will address geology and engineering aspects of these unconventional natural gas resources. An important panel discussion will be part of the program.
SHORT COURSES
Technical short courses are offered on Friday, November 20 and have been designed to compliment the conference technical sessions. Special pricing is available to conference delegates.
Complex Well Analysis & Reservoir Engineering Methods for Unconventional Gas
Putting it All together - Optimizing Fracture Design
Tight Gas Exploitation from a Geomechanics Perspective (Half Day)
REGISTER at www.csug.ca or www.csugconference.ca
For information contact:
e=mc2 event management inc.
Toll Free: 1.866.851.3517
Phone: 403.770.2698
E-mail: conference@emc2events.com
transition zones were avoided (e.g., N.E. Lougheed Island and Sor Fiord on southern Ellesmere Island). These effects are still contained in currently compiled regional time structure maps illustrated here and although not critical in mapping high structural relief salt-cored features such as the King Christian gas field, are critical for subtler low-relief structures like those of the Maclean and Cisco discoveries. Permafrost-corrections for individual islands will be possible by performing spatial data integration work utilizing digital bedrock geology and frozen/ unfrozen map unit velocity databases being built under GEM Energy.
Water depths in the inter-island channels of the Queen Elizabeth islands range to over 600 m and the geomorphology has been influenced by ocean currents, ice scour, glaciation, and glacio-fluvial processes. Further east in Baffin Bay, seismic indicates the presence of ice-rafted sediments which can produce post-glacial sea-floor armouring. Data quality of offshore seismic profiles can vary greatly due to issues related to recording through variable thickness sea ice. Sea floor and ghosts multiples also can also be problematic depending on the marine environment (i.e., hard sea floor, short water period). Smooth, high impedance, shallow sea floor geomorphology produce the worst multiples and energy penetration. This, combined with variable sea ice thickness, can produce seismic imaging results from very good to dismal. The thinner and smoother the ice, combined with geologic structure dissimilar to sea floor attitude, the better the seismic image. In areas of perennial multiyear ice, Panarctic modified receiver array implementation on ice seismic shooting (e.g., Cisco) beginning in about 1983, calling it “high effort” indicating the additional labour and expense to layout herringbone-style receiver arrays. Re-processing of existing onshore and offshore data will likely provide more information but exploration for stratigraphic play types such as the flanks of Cape Norem structure, and plays under multi-year ice of the offshore Sverdrup rim, will need more consistent seismic imaging quality.
The initial processing and interpretation of this High Arctic seismic dataset largely predated workstation display and inexpensive migration technologies. Interpretation generally produced reliable subsurface maps although detailed stratigraphic breakdowns were not common. Horizons which could be correlated any distance, particularly offshore, were the Triassic Eden Bay or Gore Point Limestones and the Jurassic Sandy Point Formation and Jurassic King Christian
Formation (or equivalent) which was often ghosted above one of the Triassic limestone markers. Regional maps including both new and legacy seismic interpretations have been compiled and form the basis for seismicrelated baseline subsurface products planned as spatial datasets to be published as one of several GSC open files of the GEM Energy program.
Examples shown of profiles from this legacy seismic data feature; Paleozoic through Tertiary geology of the subsurface of Banks island; the Siluro-Ordovician platform carbonates and Neoproterozoic images from Prince of Wales Island, and a variety of images illustrating the Carboniferous through Cenozoic geology of the Sverdrup Basin.
This time-capsule of reflection seismic data remains a critically important asset for the future of hydrocarbon exploration in Canada’s High Arctic. It requires careful review and integration with other re-assessed regional datasets, such as thermal maturity and geochemical data.
Acknowledgments
The author would like to acknowledge continued support of Suncor Energy (PetroCanada), ConocoPhillips Canada, Husky Energy, Imperial Oil Limited, and BP Canada Energy for their permission to show seismic data.
Biogr A phy
Tom Brent is a native Calgarian and currently a Physical Scientist with Natural Resources Canada. Brent attended both S.A.I.T. for Engineering Science (Geophysical) Technology (1975), and the University of Calgary for Geology in 1981. Brent has spent his career to date in Canadian arctic seismic, joining Panarctic Oils in 1975 and working staff geophysicist duties in numerous prospect areas. In 1986, Brent shifted jobs to the I.S.P.G. (now GSC-Calgary) and continued high arctic seismic studies, publishing on Prince Patrick, Meighen, Melville, and Prince of Wales islands as well as Lancaster Sound offshore geology. Brent has also written on high arctic deep permafrost and gas hydrate seismic characterization. Brent is currently working offshore Sverdrup, Ellef Ringnes, and Banks islands, as well as the eastern offshore basins of Northern Canada. As a career GSC database builder, Brent is also currently responsible to manage northern seismic and physiographic data for the GEM Energy database and dissemination project.
Sponsored by:
CGGVeritasiscommittedtoacquiringandprocessingsuperiorqualitydatain thelocationswhereyouoperate.WiththehighestqualitydatalibraryinCanada, you’llhaveaccesstomulti-clientdatainthemostdesirableregionsof AlbertaandNorth-EastBritishColumbia.
CountonCGGVeritastohelpyouexplore,developandproducewithconfidence.
Contact:
Tel:+14032056000
SPEAKER
Rob Vestrum Thrust Belt Imaging
12:00 noon
thursday, october 8, 2009 room LPW-910, Livingston Place West 250 2nd st sW, calgary, a lberta
The objective of the depth imaging was to confirm the existence of the structure in depth, improving the image and obtaining more accurate positioning of the events for an appropriate well trajectory.
We used a collaborative, geologically constrained approach that integrates all available geologic information into the interpretation of the seismic velocity model. Close collaboration between the exploration geologist and the service-company geophysicist found a velocity model that optimized the seismic imaging. This area has interbedded siliciclastic rocks with high dips and vertical and lateral velocity contrasts, giving a considerable lateral movement in the images in depth when we correct for seismic anisotropy and lateral-velocity heterogeneity.
The final anisotropic-depth-migrated image confirms the structure and moves the imaged structured to the east compared to the time image. The position of the structure and dips were confirmed by two wells drilled in the area, which verifies the accuracy of the

interpretive model-building process in this complex-structured area.
BIOGRAPH y
Rob Vestrum received a B.Sc., Geophysics (1992) from the University of Alberta, and M.Sc. (1994) and Ph.D. (2003) degrees from the University of Calgary. He initiated foothills anisotropic depth migration at Shell in 1996, Kelman in 1997, and at Veritas in 2001.
Vestrum’s depth-imaging project experience covers the Western Canada foothills, the Californian thrust belt, the South American Andes, and Central Asia. Recognition of Vestrum’s pioneering work in TTI anisotropic imaging includes the John Kendall Doctoral Thesis Award from the Faculty of Science at the University of Calgary, and the SEG’s J. Clarence Karcher Award for significant contributions to science by a young Geophysicist.
SPEAKER
Alwynne B. Beaudoin
Royal Alberta Museum
7:30-9:30 Pm
Friday, o ctober 16, 2009 m ount royal college, room B108 c algary, a lberta
This year, 2009, is a milestone for all geologists and bioscientists as we celebrate the 200th anniversary of Charles Darwin’s birth and the 150th anniversary of the publication of his best-known book: On the Origin of Species by Means of Natural Selection. Arguably the most influential scholar of the 19th century, Darwin’s work and ideas are at the foundation of modern research in the natural and earth sciences. His participation in the voyage of HMS Beagle and the visits he made to localities in South America and the Galapagos Islands were key events in his intellectual development, especially in formulating his ideas about the cumulative effects of small changes through time.
Simultaneously, he was himself influenced by the new appreciation of deep time that

was emerging in geology. The idea of deep time in relation to earth processes was articulated by James Hutton in the late 18th century, although it became better known through writings by John Playfair in the early 19th century, and was expressed most persuasively by Darwin’s friend and colleague Charles Lyell in his widely read book on the Principles of Geology.
Gradualism in geology became linked to gradualism in biology as Darwin studied and thought intently about the transmutation of species. He understood that small changes
SPEAKER
Dean Rokosh
Alberta Geological Survey
12:00 noon
monday, october 19, 2009 encana a mphitheatre, 2nd Floor e ast end of the calgary tower complex 1st street and 9th avenue se calgary, a lberta
Over the past two to three years our main focus has been gas shale data collection working toward a resource evaluation of the Banff, Colorado Group, Montney, Muskwa, and Duvernay formations. Subsequently, we have released data through a number
of Open File Reports that are publically available for download on the AGS website. Over the next few years our focus is to examine, interpret, and integrate the data, along with prior shale gas information from other sources, toward a resource evaluation of all formations.
Our talk will centre on two areas: 1) the present state of our data examination and interpretation of shale porosity, permeability, and mineralogy using thin sections and SEM images, and 2) the status of our resource evaluation of Alberta shale gas potential using a series of regional maps and cross-sections of the Muskwa and Montney formations.
BIOGRAPH y
Dean Rokosh graduated from S.A.I.T. in 1977 and worked as a geological technologist, landman, and oil scout for 12 years for Hudson’s Bay Oil & Gas, Dome Petroleum, and Amoco Petroleum. In 1990, Rokosh enrolled at the University of Alberta and graduated with a B.Sc. in Geology in 1994
can only have big effects if they operate during immense intervals of time. Hence, the assumption of earth’s great antiquity became an important element underpinning Darwin’s overall argument. As we shall see, the idea of time runs throughout Charles Darwin’s professional life and career.
y
Alwynne Beaudoin is the Head Curator of Landscape Studies at the Royal Alberta Museum. After completing a Ph.D. at the University of Western Ontario, she moved to Alberta to work for the Archaeological Survey in 1986, transferring to the Museum in 1991. Her work concentrates on the investigation of the postglacial landscapes and environments of Alberta, especially as these relate to the province’s human history. This research involves the examination of plant remains, especially seeds and pollen, and the analysis of soils and sediments. Much of her time in 2009 has been taken up with activities related to Darwin200 celebrations.
This event is jointly presented by the Alberta Palaeontological Society, Mount Royal College and the CSPG Paleontology Division. For details or to present a talk in the future please contact CSPG Paleontology Division Chair Philip Benham at 403-691-3343 or programs@albertapaleo. org. Visit the APS website for confirmation of event times and upcoming speakers: http:// www.albertapaleo.org/
sponsored by
and a Ph.D. in Geology in 2000. His Ph.D. topic was loess deposition and paleosol development in north central China; stratigraphy, sedimentation, and paleoclimate. Rokosh spent three years as a research associate in the Department of Physics at the University of Alberta working with Prof. Doug Schmitt in geophysics. Rokosh joined the AGS in 2005 and is a gas shale specialist. He is a member of APEGGA, AAPG, Clay Mineral Society, CSEG, CSPG, CWLS, RMGS, and the SPE.
BASS Division talks are free. Please bring your lunch. For further information about the division, joining our mailing list, a list of upcoming talks, or if you wish to present a talk or lead a field trip, please contact either Steve Donaldson at 403-645-5534, email: Steve.Donaldson@ encana.com or Mark Caplan at 403-532-7701, email: mcaplan@aosc.com or visit our web page at www.cspg.org/events/divisions/basin-analysissequence-strat.cfm.
SPEAKER
Chris Eisinger
Energy & Environmental Systems Group, University of Calgary
12:00 noon Wednesday, october 21, 2009 conocoPhillips auditorium, 3rd Floor 401 9th ave sW, calgary, a lberta
In the Western Canada Sedimentary Basin, deep saline aquifers are an attractive target for the large-scale injection of CO2 Important characteristics include:
1) high potential storage capacity (>4,000 GT CO2 ) and accessibility on a regional scale,
2) minimal likelihood for interference with hydrocarbon-producing fields and plays,
3) limited or non-existent utility of saline water, and
4) abundance in the region at a variety of stratigraphic intervals, allowing for flexibility in drilling and storage.
Characterization and geomodeling of these reservoirs, however, is difficult. Data are often limited – cores sparse, wireline log data patchy or non-existent, and well spacings large. Seismic data, while perhaps locally available, are typically needed over a large areal extent to complete a thorough regional characterization. Accessing, processing, and interpretation of these large data sets, if they exist at all, requires extensive time and financial resources.
The Wabamun Area CO 2 Sequestration Project (WASP) has focused on characterizing the Devonian Nisku for a region southwest of Edmonton, Alberta to assess the feasibility of storing 20 MT-CO 2 /year for a 50-year period. This gigaton-scale storage project would be one to two orders of magnitude larger than the commercial projects now
under study. Different from oil and gas exploration, storativity and injectivity are the critical physical parameters of interest.
With this in mind, a static earth model of the Nisku was created to combine geological facies with thickness, porosity, and permeability estimates. A lack of structural information (i.e., seismic data) meant a simplified workflow for building the geocellular model could be followed:
1) 3D stratigraphic gridding,
2) depositional gridding (Cartesian space),
3) facies modeling,
4) petrophysical modeling, and where necessary
5) upscaling for reservoir flowsimulations.
Traditional oil and gas geomodeling methods were augmented by other approaches to produce the Nisku characterization. The following are two examples:
1) Porosity and permeability estimates had to be derived from wireline resistivity data because these were the most abundant measurements. Even these measurements, however, had to be carefully applied as they represented several vintages of logging equipment. Acoustic logs, while usually available, appeared to underestimate the total porosity in the Nisku carbonates. The density-neutron logs gave better approximations, but were greatly limited in availability.
2) Boolean (object-based) geomodeling may provide a better method for characterizing the Nisku carbonate over a large area where sparse data coverage is a critical issue. While not often used for carbonate systems, object-based modeling allows conceptual geological knowledge to be better incorporated in the form of plausible enhanced porosity objects. The geometry and distribution of these objects, while speculative for the WASP study area, was based on modern analogs or other comparable depositional sequences where parameters have been reasonably well quantified.
With almost no production data from the Nisku aquifer, validation of the models is challenging. Simulated DST comparisons provide some constraints, but with poor quality field DSTs and scarce core permeability data, conclusions are limited.
There will always be room for improvement in reservoir characterization and geomodeling. While much overlap exists between methods used for hydrocarbon exploration and carbon storage, there are some specific improvements that appear more pressing for CO2 storage:
1) reduced dependency on wellborespecific data (e.g., cores and logs),
2) increased robustness to sparse, erroneous data,
3) improved flexibility to data types and vintages, and
4) more quantitative characterizations for carbonate deposits.
ACKNOw LEDGEMENTS
We wish to acknowledge valuable input from Frank Stoakes and Katrine Foellmer (Geology), Don Lawton and Abdullah Alshuhail (Geophysics), and Rob Lavoie.
We are also grateful to our project sponsors: Alberta Energy Research Institute (AERI), Natural Sciences and Engineering Research Council (NSERC), TransAlta, TransCanada, ARC Energy Trust, Penn West Energy Trust, Epcor, Enbridge, ConocoPhillips Canada, Encana, StatOilHydro Canada, Total Canada, Computer Modeling Group, and Golder Associates. We thank Highpine Oil & Gas for sharing wireline log data and Schlumberger for software support.
BIOGRAPH y
Chris Eisinger is currently a research associate at the University of Calgary. He is a geologist by training, with interests in reservoir characterization and the geological storage of CO2 . Before coming to Calgary, he worked in the fields of environmental remote sensing, volcanology, and geohydrology. He has a M.Sc. degree in Geosciences from the University of Calgary, in addition to geology degrees from Colorado College (B.A.) and Arizona State University (M.Sc.).
There is no charge for the division talk, and we welcome non-members of the CSPG. Please bring your lunch. For details or to present a talk in the future, please contact Weishan Ren at (403) 233-3428, e-mail: weishan.ren@ conocophillips.com.
SPEAKER
Elizabeth T. Smith
School of Biological, Earth and Environmental Sciences, University of New South Wales
7:30-9:30 Pm
Friday, october 23rd, 2009
mount royal college, room B108 calgary, a lberta
The first comprehensive palaeontological survey of the middle-Albian opal fields of Lightning Ridge, New South Wales, indicates that this is one of the world’s most productive near-polar fossil localities. Fossils preserved as common opal (‘potch’) or with a precious opal component, occur throughout the opal-bearing claystones and siltstones of the Griman Creek Formation. Over an area of more than 1,500 km2, artificial ‘deposits’ brought to the surface by opal miners (mullock, tailing heaps, and silt tank residues) are vital repositories of palaeontological data. Excavated sediments contain fossil material even after being processed mechanically and searched for opal by miners. Articulated and associated elements of diverse plants and animals are retrieved when sediments that include the smallest fractions are searched methodically.
Opalised fossils provide evidence of a diverse coastal delta assemblage - luxuriant vegetation communities, freshwater aquatic and terrestrial invertebrates and vertebrates, and marine groups. Invertebrates include up to twenty mollusk taxa, with viviparid gastropods that are among the oldest in the world and freshwater crayfish. Vertebrate groups are chondrichthyans; anguilliformes; actinopterygian/ teleost fish and lungfish; Australia’s oldest anuran; ichthyosaurs and freshwater pliosaurid plesiosaurs; crocodylians; pterosaurs; prosauropod, titanosaurid and hypsilophodontid dinosaurs and a Muttaburrasaurus, as well as ornithomimosaurid and dromaeosaurid theropods; and at least two ornithoracine birds. Stegosaurids, spinosaurids, abelisaurids, and an alvarezsaurid may be present. The locality has produced an unprecedented array of four or
five taxa of monotreme mammals, a possible synapsid, and evidence of at least one other mammal group.
Despite the near-polar palaeolatitude (~6570°S), temperate and subtropical biota suggests mild climatic conditions during a period of global warming. High summer rainfall and strong seasonality, cool to very cold winter temperatures and months or weeks of polar twilight or complete darkness indicate a palaeoenvironment without modern equivalent. Endothermy, enhanced optical acuity and electrosensory capabilities in at least three groups that are especially diverse at generic and species level (turtles, hypsilophodontid dinosaurs, and monotreme mammals) may be adaptations to extreme climatic conditions. Biological strategies such as burrowing, aestivation, hibernation, seasonal nomadism, and migration may have been vital. Warmer summer conditions would attract nomadic herbivores, and possibly synchronized seasonal breeding of crayfish, lungfish, turtles, and crocodylians provided an abundant annual food source for aquatic and terrestrial predators, migratory species capable of aquatic hunting, and marine ‘invaders’ of freshwater systems. The fauna is characterized by regional and local endemism, and affinities with ancient southern hemisphere (Pangean) forms, consistent with palaeogeographic isolation in the far eastern provinces of Gondwana.
For more than a century, fossil collection at Lightning Ridge has been incidental to opal mining, and untold numbers of opalised fossil specimens have been destroyed during the mining process. Past collections have been imprecise, biased samplings that do not reflect taxonomic diversity, species composition, or faunal size range. Recent work by palaeontologists from the University of New South Wales, Sydney, indicates that the full extent of taxonomic diversity and an accurate picture of faunal composition over this vast locality are yet to emerge. Opal mining communities are at last becoming aware of the international significance of the ‘black opal zoo’, and a national public collection of the material is now being established at Lightning Ridge.
BIOGRAPH y
Elizabeth Smith is a Research Associate at School of Biological, Earth and Environmental Sciences, University of New South Wales, Australia. She is also author of a book called The Black Opal Fossils of Lightning Ridge.
INFORMATION
This event is jointly presented by the Alberta Palaeontological Society, Mount Royal College and the CSPG Paleontology Division. For details or to present a talk in the future please contact CSPG Paleontology Division Chair Philip Benham at 403691-3343 or programs@albertapaleo.org. Visit the APS website for confirmation of event times and upcoming speakers: http://www.albertapaleo.org/
November is quickly approaching, which means it is almost time to renew your 2010 CSPG membership. Starting November 1 you will be able to renew your membership online and print your own receipt and Membership Card. Here’s how to do it:
1. Log into the Members Only section of CSPG’s website. The Members Login link is in the top right corner of CSPG’s homepage (www.cspg.org).
2. Once you’re in the Members Only section, select Membership Dues from the centre list of options.
3. Your screen will list “Membership Renewal Total” below the Item heading and “$105.00” under the Cost heading (includes GST). Select add to basket
4. Add your Credit Card information (card type, expiry date, card number, card security code, name on card, card owner’s address, etc.). Please note that under the “Credit Card Country” option, leave the space blank if your address is in Canada. Only if you live outside of Canada should you choose your country from the menu.
5. Select the Check-Out button at the bottom of the page. Only click the button once.
6. You will then see the Purchase Detail page, where you’ll be able to print your combined receipt and Membership Card. Select Print Receipt to get the PDF of your combined receipt and Membership Card. The card will include not only your membership information, but also the relevant information for income tax purposes.
If you need help processing your order, call Dayna Rhoads at (403) 513-1230.
Tentative List of Courses:
• Principles of Reservoir Characterization
• Getting Started in Sequence Stratigraphy
• Seismic Stratigraphy & Seismic Geomorphology
• Tight Gas Sands
• Appraising and Developing Coalbed Methane Reservoirs
• Risk and Uncertainty Analysis for Unconventional Resource Plays
• “Old” (Pre-1958) E-Logs: A Quick Review
• Regional Stress and Reservoir Geomechanics
• Image Log Interpretation
• Formation Evaluation of Thinly-Bedded Reservoirs
• Quick Guide to Carbonate Well Log Analysis
(Four concurrent sessions each day - mix and match according to your interests and training needs. Lunch buffet and refreshments included each day.)
Hosted by the Norris Conference Center: 803 Town & Country Lane
Houston, TX 77024
Phone: 713-590-0950
Fax: 713-590-0961
Special AAPG group rates at nearby hotels.
Registration and information:
Toll-free (U.S. and Canada)
888-338-3387, or 918-560-2650
Fax: 918-560-2678
E-mail: educate@aapg.org
Download a registration form at: www.aapg.org/education/wec.cfm
Tuition for the week:
AAPG Members..........................$1595 $1695 Non Members............................$1695 $1795 Individual Courses....................$400/day $450/day
(Your five-day badge can be transferred to a friend or colleague if you can't come all five days.)
| by L.A. Griffith
The 15-part series entitled “Practical Sequence Stratigraphy,” written by Dr. Ashton Embry, is now complete. The series represents a well illustrated and thorough explanation of basic sequence stratigraphic concepts, shaped by and set within a passionate defense of the sequence stratigraphic model Dr. Embry originated and prefers. It is a well known teaching technique to establish a solid understanding of one proposed model so that it can be used as a baseline from which to compare and contrast other models. This series of articles has achieved this framework.
However, other models are best judged by reading the original literature as written by their proponents, rather than as explained by a secondary author. In the case of sequence stratigraphy, because there are at least six differing models, it is a worthwhile but daunting task. Fortunately, a concise and articulate paper entitled “Towards the standardization of sequence stratigraphy” (Earth-Science Reviews 92, 2009, p. 1-33), jointly co-authored by O. Catuneanu, V. Abreu, J. P. Battacharya, M. D. Blum, R. W. Dalrymple, P. G. Eriksson, C. R. Fielding, W. L. Fisher, W. E. Galloway, M. R. Gibling, K. A. Giles, J. M. Holbrook, R. Jordan, C. G. St. C. Kendall, B. Macurda, O. J. Martinsen, A. D. Miall, J. E. Neal, D. Nummedal, L. Pomar, H. W. Posamentier, B. R. Pratt, J. F. Sarg, K. W. Shanley, R. J. Steel, A. Strasser, M. E. Tucker, and C. Winker brings together the views of twenty-eight well known researchers currently working in this field.
“Towards the standardization of sequence stratigraphy” is a ground-breaking paper laying out this group’s consensus on sequence stratigraphic concepts, terminology, and workflow. It is worth reading just on the basis that consensus was reached by 28 geologists! The article advocates for a common workflow that uses as many different datasets as possible (including seismic) to recognize stratal stacking patterns and the surfaces that separate them. How the resulting genetic units are grouped into sequences, and which surfaces are elevated in importance (e.g., the choice of models) is left to the discretion of the interpreter. The paper also compares and contrasts the different models as shown below. I highly recommend that you take the time to read it to become more fully informed on other views on sequence stratigraphy, and so that you can choose the methodology that
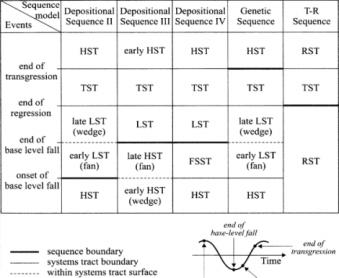
1. Comparison of sequence models (from Catuneanu and Posamentier, 2008 CSPG Convention).
best fits your dataset and the scale at which you are working.
The article is currently available at: http://www.sciencedirect.com/science? _ob=MImg&_imagekey=B6V62-4TRCYJ9
-1-29&_cdi=5802&_user=10&_orig= browse&_coverDate=01%2F31%2F2009 &_sk=999079998&view=c&wchp=dGLz Vzz-zSkzS&md5=4d8cb5ec370bb38124fb334 47dab458b&ie=/sdarticle.pdf
The essential Earth Science Week 2009 (October 11-17) Toolkit enables students, educators, and the public to fully explore this year’s theme “understanding Climate.” The latest edition of this resource is now available through the American Geological Institute (Contact: Geoff Camphire gac@agiweb.org).
The 2009 Earth Science Week Toolkit contains a 12-month school-activity calendar and classroom poster provided by AGI, its Member Societies, and other organizations. Along with these traditional Earth Science Week publications, this year’s Toolkit features a variety of educational climate resources from the u.S. Geological Survey ( uSGS), NASA, and the National Oceanic and Atmospheric Administration (NOAA). A report on the “Ecological Impacts of Climate Change” and a new brochure outlining principles for Earth Science literacy are also included.
Multimedia features this year include NASA’s “Dynamic EARTH” DVD-ROM and a CD-ROM on GIS technology from ESRI. Additional informational materials within the kits include a National Park Service poster highlighting the nation’s glaciers and literature on the National Wildlife Refuge System. Like years past, the 2009 Toolkit contains a genuine field notebook from Rite in the Rain.
These items and much more make the Earth Science Week Toolkit ideal for engaging students and general public to explore the geosciences. The Toolkits are available for the cost of shipping and handling. Bulk pricing is available. To order, visit http://www. earthsciweek.org/materials/.
Earth Science Week is an annual event held the second week of October to promote an understanding and appreciation of the earth sciences. It is organized annually by AGI with support from a number of other geoscience organizations, including the u.S. Geological Survey, NASA, National Park Service, and the American Association of Petroleum Geologists Foundation. To learn more about this event, please visit http://www.earthsciweek.org/.
| by Dr. Marc Villéger
First we should thank Dr. Embry for offering the Reservoir and its readers an exhaustive review of Sequence Stratigraphy and its latest developments.
It was therefore surprising to find some lithostratigraphic remnant in the middle of the July/August 2009 installment. On figure 7, a stratigraphic cross-section of Upper Devonian carbonate strata from the west Pembina area displayed a correlation between a cryptic basinal “well A” and a reef “well B” that pertained to illustrate the concept of Slope Onlap Surface” (SOS) applied to carbonate correlations.
However, in this correlation, the surface artificially separates the “basinal carbonate” in mauve and some overlying shaly mudstones and argillaceous silty wackestones from Cynthia units. Capped by the SOS, these basinal carbonates indiscriminatingly comprise the Bigoray Silt (that overlay a 3rd order Maximum Flooding Surface used to datum the section but not acknowledged as such in the legend) and the log signature of clinoform toes belonging to the Cynthia highstand reef/off reef deposits. Specifically, this correlation fails to recognize the three Cynthia 4thorder sequences I had correlated basinwide, leading to significant discoveries for Gulf Canada in the 1990s and the subject of the following publications:
Villéger, M. and Webb, T. K. 1992. Diachronous reef generation in Alberta. C.R.Acad.Sc. Paris t.315, série II, p. 13811387.
Villéger, M. 1994. Diachronism of Upper Devonian Nisku Formation. C.R.Acad.Sc. Paris t.318, série II, p. 1527-1533.
Villéger, M. 1996. Short-term relative sea-level oscillations in the Nisku Formation. C.R.Acad.Sc. Paris, t.323, série IIa, p. 873-879.
Villéger, M. 1997a. The Upper Devonian Nisku pinnacle reefs of west central Alberta (Canada): Subsurface and outcrop evidence for subtle structural control on reef inception. Bull. Soc. Geol. France. T. 168, n. 4, p. 445-450.
Villéger, M. 1997b. C.S.P.G./S.E.P.M. Joint conference: Short-term relative sealevel oscillations in Nisku Formation and new discoveries (session co-chaired by J. Wendte and E. Montjoy).
Villéger, M. 2002. Comment on Potma, K., et al. 2001: Toward a sequence stratigraphic framework for the Frasnian of the Western Canada Basin in Bulletin of Canadian Petroleum Geology, v. 49, n. 1, p. 37-85. Bulletin Canadian Petroleum Geology, v. 50, n. 2, p. 339-340.
The 1996 and 1997a papers (inspired by Luis Pomar’s detailed carbonate reef/off reef sequence stratigraphy work in Majorca), their presentation during the 1997 CSPG conference, and a 2002 comment in the CSPG Bulletin are all more recent than the Wendte et al. 1995 reference given as a justification for Figure 7. Furthermore and since then, the renewal of the Nisku play has illustrated the diachronous reef margins concept Tobin Webb and I exposed in the initial 1992 paper that inferred the presence of older reef margins in the Rat Creek, Pembina, and Bigoray area, behind the known reef margin.
Albeit small in comparison to giants such as Marcel Leroux in climatology, we all contribute our pebble to Nature’s understanding. I trust in the future Dr. Embry will take advantage of the published, discovery-based Nisku tri-dimensional correlations and reconstruction in his dissertation so he won’t require sending a lithostratigraphic SOS.
Dr. Marc Villéger August 2009
R EPLy TO DR . M ARC V ILL é GER ’ S C OMMENT By A SHTON E MBR y First of all I would like to thank Marc for submitting his comments on Figure 7 in my article on Sequence Stratigraphy and Correlation (Embry, 2009). I want to stress that the figure was chosen to illustrate how sequence stratigraphy can be used to correlate a succession of carbonate strata containing a reefal buildup with a nearby succession that lacks the reef. It was not chosen to open a debate on
detailed correlations of the Upper Frasnian succession in the West Pembina area.
Marc takes exception to the delineation of a slope onlap surface (SOS) separating the off–reef carbonate strata of the Bigoray Member from overlying siliciclastics of the Cynthia Member in well A of Figure 7 of Embry (2009). Marc’s comment draws attention to an important question: What happens to the SOS basinward of the reef slope? The SOS, which marks stratigraphic onlap on the reef flank, will eventually terminate basinward where onlap ceases and will become a conformable, withintrend facies contact (WTFC). In this instance, such a WTFC would be between deep-water carbonate strata (Bigoray) and overlying, deep-water siliciclastics (Cynthia) and would occur within an overall regressive trend. It is always difficult to pinpoint the exact location of the lateral change of an SOS to a WTFC, especially when only two wells are considered. Thus, the SOS of the reef flank may extend to well A as shown on my Figure 7 or it may be replaced laterally by a lithostratigraphic WTFC as Marc suggests. Importantly, the correlation remains the same and the debate concerns only the nature of the correlated surface at well A (SOS or WTFC). With the current data, either interpretation is reasonable and acceptable.
Finally, I would like to emphasize that there is no such thing as a correct correlation. There is only a preferred one and all my correlations are subject to change without notice. I am sure other workers might well propose different sequence stratigraphic correlations for the cross-section of my Figure 7. We can debate alternative sequence stratigraphic correlations of a given cross-section ad infinitum but I hope we won’t debate the main point of the Embry (2009) article: If you want to correlate, use sequence stratigraphy.
Embry, A. F. 2009. Practical Sequence Stratigraphy XIV: Correlation. Canadian Society of Petroleum Geologists, The Reservoir, v. 36, issue 7, p. 14-19.
“NeuraSection is unbelievable! I loaded all my data, started correlating and created cross sections in under an hour! Why haven’t I heard about this application before?”
Steve Jackson, Geophysicist, Texas Standard Oil & Gas, LP

Intuitive and user-friendly tools to construct an integrated evaluation of your prospect. Correlate logs, build multi-layer maps and create presentation cross sections with ease using any data format. NeuraSection is the only geological evaluation solution you will ever need!
• Raster and digital well log correlation
• Structural and stratigraphic cross sections on-the-fly
• Multi-layer structural and net pay mapping
• Proprietary and vendor data support
• Presentation quality montages
See NeuraSection and other Neuralog products at the Calgary Chamber of Commerce
Thursday, October 8, 2009 9 am - 3 pm
Contact Dave Heughan at 403.236.2228 for more information or visit www.neurasection.com

“I love the new NeuraSection, it works the way a geologist thinks.”
Carol Shiels, Geologist, Shiels Engineering
| by Neil Hutton
In the tide of human affairs, perhaps there is nothing more dangerous than a consensus, a point eloquently expressed by Schopenhauer in the 18th Century, “There is no opinion, however absurd, which men will not readily embrace as soon as they can be brought to the conviction that it is generally adopted.” The legitimate concerns regarding the environmental health of the planet have been totally distorted by an evangelistic media and the neo-religious morality of the green environmental activists, who claim that warming will be a disaster. In human history warming never has been a disaster, but the economic effects of attempting to mitigate warming certainly will be disastrous.
By now, in this series of articles, it should be clear that there is no substance to the global warming theory. This is after 20 years of research, four major IPPC assessment reports, and the expenditure of untold billions of dollars in North America and Europe. Estimates indicate expenditures in the region of $30 billion in the United States, and some $15 billion in the United Kingdom (Lawson, 2008). Certainly, with some hindsight, this has been an extraordinary misapplication of capital. However, it pales in comparison to what is contemplated in the misguided approaches to saving the planet by reducing CO2 emissions. In some instances it seems like ‘Alice in Blunderland’ for some of the ideas are really farcical, but politicians are taking this seriously since they believe that is what the public wishes. Nevertheless, in their political hearts and minds they realise that the task is essentially impossible but they must make the gestures with as little real action as possible.
Let us consider the Kyoto accord which Canada ratified in 2002 and in which the signatories undertook to reduce CO 2 emissions by 5.2% below 1990 levels by 2012.
The agreement called for stabilization of CO2 emissions by the year 2000. However, the road to hell is paved with good intentions (or obfuscations). By 2003, although the Canadian Government had allotted $3.7 Billion for climate change related programs; the end result was that CO2 emissions had grown by 24% above 1990 levels and, by 2006, this had grown to 35%.
Assuming that all of the signatories of the Kyoto accord had actually adhered to their commitment, although none have, with the possible exception of Sweden and deindustrialized Russia, this would have resulted
Figure 1. National carbon dioxide (CO2 ) emissions per capita. This shows Canada in fourth place calculated in 2004 at 14.5 million metric tonnes per capita, but currently calculated to be 19 million metric tonnes per capita. Emissions are not usually monitored directly, but are generally estimated using models. Some emissions can be measured with only limited accuracy. Emissions from energy and industrial processes are the most reliable while emissions from agricultural activities present major uncertainties. Source: World Bank online data base: UNEP/GRID Arendal (http://maps.grida.no/go/graphic/national_carbon_dioxide_co2_emissions_per_capita).
in a reduction in the World’s temperature of 0.1°C by the year 2100. This is an insignificant amount to which Canada’s contribution would be so small that it barely mattered. In the real world there has been a drop in global average satellite temperature of 0.5°C. Therefore, the climate has achieved a level five times better than the Kyoto target, while atmospheric CO2 continues to rise significantly. One might think that this would be a wake-up call, if not for the green lobby, at least for the Canadian Government, but they continue to make announcements of additional climate change initiatives as though nothing had changed. Other than preserving an international
high profile as responsible World citizens, Canada’s actual ability to impact CO 2 reduction is negligible. While on a per capita basis, Canadian emissions are relatively high (19 tons per capita, Figure 1) this is a cold country, and we are a major producer of hydrocarbons and coal. We rank fourth in the world on a per capita basis (Figure 1) but, on an overall world basis, Canada accounts for only 2% of total emissions (Figure 2). It is perfectly clear that Canada’s commitment is simply too trivial to be of relevance without the participation of the World community. More importantly, the costs of attempting increased mitigation are formidable and will
Figure 2. This shows the list of countries by emissions in metric tonnes. The world’s total emissions of CO2 are 28 billion tonnes, of which the United States and China produce 42%. These countries, together with the European Union, Russia, India, and Japan account for 71% of the world’s emissions. Canada’s production of only 545 million tonnes accounts for only 2% of the world’s total CO2 emissions. Therefore, Canada’s ability to influence total emissions is negligible. Source: United Nations, Energy Emission Administration.
significantly damage the standard of living and economic activity of the nation.
Perhaps one of the most extraordinary features of the globalwarming frenzy is the fact that governments have committed huge amounts of taxpayers money to investigate and develop technology for carbon capture and sequestration (CCS), but have not spent a penny on any level of due diligence to examine and verify the global warming theory itself. An estimate of funds so far committed to pilot projects and research follows: Canada through the Federal and Alberta Governments – $3 billion, the Department of Energy in Unites States on one project – $2.4 billion, Australia – $4 billion, EU – $12 billion on eight projects, Norway – $600 million, and so on. In new measures before Congress there is a commitment to spend $75 billion over the next 25 years. In Australia, a staggering $22.2 billion is allocated to budgetary assistance for carbon emission-related measures for the next four years.
Initially some studies suggested relatively modest costs per ton for CO2 sequestration (David and Herzog, 2001). A recent study by the Harvard Business School indicates formidable costs of $150.00 per ton to scrub, compress, liquefy, and inject CO2 . This did not include costs for pipeline distribution or storage facilities. This amounted to an additional consumer premium of 10¢/kilowatt-hr, about 2-3 times costs in earlier studies. The U.S. national average for power is 10¢/kilowatt-hr so that CCS including distribution and storage will more than double consumer’s electricity costs.
So we now have commitments by governments, to spend at least $100 billion on CCS, lacking any scientific evidence of the accuracy of anthropogenic Global Warming, other than a series of increasingly inaccurate IPCC forecasts based only on computer climate models. Moreover, the total lack of logic in the whole endeavour is that the CO2 that we are trying to dispose of originated in the atmosphere in the first place, and was sequestered naturally through geological time to the point that the Quaternary period we now live in has an atmosphere with the lowest CO2 levels of all past Geological History. If atmospheric CO2 up to seven times the current levels were not harmful to life in the past, there is no reason to believe that current levels will be now.
The notion that coal and tar sands are dirty energy sources is based on the completely erroneous and completely unproven idea that CO2 will warm the atmosphere. If this had any real scientific basis and the dangers of warming were real, then CCS may have some merit. Beyond CCS we plunge into a series of murky strategies whose benefits are highly questionable and certainly highly susceptible to economic fraud and scams.
Here we refer to the system of Cap and Trade, nicely defined as the tax that dares not speak its name. The concept is that the government will set an absolute cap on national CO2 production, after which companies buy, sell, or are allocated permits to emit CO2 . Over time the cap is reduced to reduce carbon emissions. The US Congressional Budget Office has calculated that the “TAX” would amount to only $175.00 a year for a family of four, but this is in the years up to 2020 and then things really get serious. When our current politicians are drawing their comfortable pensions, the average family of four are facing $1,870 additional electric bills per family. Under the new US Waxman Markey Bill this will rise to $6,800 by 2025. This is an energy price tsunami that the economy simply can not sustain. Furthermore, the pain will not be shared evenly as it is relative to the reliance of states and countries on energy sources with different CO2 emission potentials such as coal, natural gas, hydro, nuclear, and oil. The poor, however, who have to devote proportionately more of their disposable income to energy, have the most to lose.
Although “Cap and Trade” is presented as a market solution to the CO2 emission problem, in practice it is a government-rationing scheme in which the rations can be subsequently traded. The nature of the system is that rations will become scarcer and permits more expensive. This will no doubt result in intense commodity price shocks in the future. From a more realistic and pragmatic perspective, the funds might better be allocated to mitigating and adapting to the effects of warming should they actually occur.
For the “Cap and Trade” market-makers and other middlemen, trading in CO2 emission permits it is an unprecedented bonanza, with no economic value added, which will come with the usual unintended consequences of entrepreneurial schemes and scams. The administrative allocation system does not score highly on transparency, and will lend itself to lobbying, corruption, and abuse of one kind or another. Cap and trade is distortionary, covering mainly emissions coming from the generation of electrical energy and refining and production of hydrocarbons, but not others, such as the entire personal and household sector, including automobiles.
The EU has some experience of such a
scheme, the Emissions Trading Scheme (ETS) that was initiated in 2005 and in its first three years resulted in no drop in emissions. Instead, the facilities under ETS administration, emissions actually increased by 8%. In the first phase, the embarrassing revelation was that more permits had been issued than there was ‘pollution’. Although the ETS administration declares that they have learned their lesson and will tighten up on permit allocations, this can probably not be policed, since member States can ‘import’ external ‘Kyoto credits’ from developing countries in order to meet their target for reductions. This might be acceptable if these represented real emission cuts. However, in many instances, the credits have been shown to be flawed or simply fraudulent, yielding no true emission reduction. As well, many credits are purchased from developing countries that would have credits they don’t need so that there is no reduction but an increase in emissions. The opportunities for malfeasance are endless, while the financial incentives to do so are considerable for both parties. In general, with the exception of those who made money, the ETS is widely regarded as a farce. In order to provide greater transparency it was recommended that all of the permits should be auctioned. The result? The EU decided that 98.5% of the permits should be allocated and a massive 1.5% auctioned. Here a cynic might well

conclude that politicians are unwilling to give up the perk of being lobbied so that campaign funds will be contributed.
Another arrangement under the Kyoto agreement is the Clean Development Mechanism (CDM) under which, a country, that is unable to meet its emissions target, can buy ‘certified emission reductions’ (CERs) from developing countries instead. The certification of the reductions is, in theory, done by the United Nations, but in reality the system is impossible to police. Various newspaper investigations have shown the CDM did not reduce emissions and were little more than a massive scam (Davies, 2007, The Guardian, UK). In this same philosophy was the Joint Implementation mechanism in which countries with emissions below their Kyoto targets can sell ‘carbon credits’ to developed countries unable to meet emission targets. As it happens, Russia is the only developed country in this position. Indeed, it has been suggested that Russia’s late ratification of Kyoto was motivated by the prospect of earning billions of dollars selling ‘carbon credits’, not because of any innovation, but because of the collapse of the old Soviet Military Industrial machine in the 1990s. Now Russia’s emissions are well below the Kyoto 1990 benchmark. Does Russia’s ability to sell credits now really change the level of CO2 emissions?


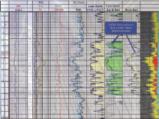


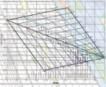


3. The figure demonstrates the variations in wind power of a single 600 kW wind turbine situated very close to the North Sea coast in the Netherlands, as measured over a full year (8,070 hours). Note the highly irregular pulsating nature of the output. It is clear that the kinetic energy of wind makes the prediction of output / production of a wind turbine impossible. It is always guesswork. Source: Halkema, 2006, p. 6, Figure 1.
Figure 4. This figure bears a striking resemblance to Figure 3, which shows output variations for a single wind turbine. However, the figure shows the same pulsatory behaviour despite the fact that in this case the output is from 7,000 wind turbines distributed from the North Sea and Baltic Sea to the German Swiss border. Distributing large numbers of wind turbines over a wide area does not help to prevent random and extreme variations in total wind power. Therefore, it can never provide a reliable supply of consumer electricity. Source: German Eon Netz Wind Report, 2005, after Halkema, 2006, p. 7, Figure 2.
It is unlikely that any of these schemes will make any difference to the climate, but the politicians and scientist have created a climate of anxiety and guilt. And like the medieval church selling indulgences you can now purchase ‘carbon credits’ in order to assuage your guilt by reducing your carbon footprint. This is a private sector response to the emission issue. It has both a personal and corporate dimension: corporations can claim to be ‘carbon neutral’ by claiming to have purchased ‘offsets’ in the form of emission reductions elsewhere, or of CO 2 absorption through the of planting trees. On an individual basis the schemes available usually revolve around the planting of trees. Once again investigative journalism suggests that there
is a high level of fraud involved. The trees allegedly planted, may not have been; if they have been, it was not on the basis of new offsets, or the credit has been double dipped. Either way their carbon absorption is notional, unverified, and at best some years into the future
Descending further into the realm of farce is the revelation that researchers at the University of Alberta are developing cattle that produce significantly less methane per bodyweight than regular cattle. Thus the owners of fart-less herds will be able to sell carbon credits to owners of regular fart-a-lot cattle herds. One wonders what can be achieved here on a personal basis if you have the correct metabolism?
The concerns about the use of fossil fuels has spawned a wide range of alternative energy proposals. To this date none can compete with the use of fossil fuels and without heavy subsidization by government would never be undertaken. First up is wind power, which at first sight would seem like a natural contender and has received considerable attention and investment. The fundamental problem is that the wind does not blow consistently. As well there are physical attributes of wind which are unfavourable. The kinetic energy of wind is determined by the specific mass of air (very light at 1.18 kg/m3) times the cube of the velocity times a constant. That is to say E=C*M*V3. The final term is the one that creates the major problem since velocity cubed creates a variability that makes it impossible to estimate the number of kilowatts that will be generated at any given moment, or the number of kilowatt hours in a given period. Thus it is impossible to provide a production factor / capacity factor for a wind turbine. It will always be guesswork. An additional problem in practical operations is that turbines are shut off from the grid at wind speeds less than 20-30km/ hr, while for safety reasons the units are shut down at speeds over 60km/hr. Maximum efficiency usually occurs in the 50-60km/hr wind speeds (Halkema, 2006).
An excellent illustration of the problem is shown in Figure 3, which shows variations in the power of a single wind turbine. There is clearly seasonality in the wind power but even in the winter months, fluctuations from a maximum 600kw to under 200kw can occur within a few minutes or hours. This is certainly not a reliable supply of consumer electricity. Building of a large number of turbines does not resolve the problem. Figure 4 illustrates the power spectrum from 7,000 wind turbines spread over several thousand square kilometres from the North and Baltic Seas to the Austrian-Swiss border. Variations occur between 0.2 and 38% of the grids daily peak load, creating real problems in establishing a stable electrical grid. It also demonstrates that distributing wind turbines over a wide area does not prevent extreme and random variations in wind power. The fundamental issue is that for every kilowatt of generation by wind requires an equivalent backup of conventional generation. So why increase your capital costs by building wind turbines in the first place?
Shell announced in March this year that they would no longer invest in renewable energy projects such as wind since they are not economic (Tim Webb, The Guardian, UK. 17 March, 2009). Denmark has also indicated that their experience with wind turbines is that, in fact, they increase emissions because they require equivalent backup in
(Continued on page 26...)
conventional generation and provide poor economies in capital costs.
In the United States, Boone Pickens has backed off a major investment in a proposed plan to build the world’s largest wind farm in the Panhandle of Texas. Pickens cites the drop in oil and natural gas prices, difficult credit markets, lack of access to transmission lines, and uncertainties regarding government tax credits. The American Wind Energy Association (AWEA) reported the industry invested $17 billion on new wind energy capacity to create roughly 8,545 megawatts of electricity. This would have the ‘potential’ to meet the needs of 6.8 million American homes provided there is equivalent backup capacity! There has been a major drop in construction as the industry awaits clarification of new tax credit rules by the Obama administration.
The story on renewable energy technologies is rather similar to wind power. Perhaps wishful thinking together with government subsidies is the driving force in these enterprises. The IPCC claimed in its Climate Change 2001 report that “known technological options could achieve a broad range of atmospheric CO2 stabilization levels, such as 550ppm, 450ppm or below over the next 100 years or more…”. The known technological options refer to technologies that exist in operation or pilot stage today. It does not include technologies that will require fundamental technological breakthroughs.
One of the most thorough reviews of the world’s possible energy future appeared in an article by a team of energy scientists drawn from academia, government, and industry: “Advanced Technology Paths to Global Climate Stability” in Science’s Compass Feature in November 2002. The lead author was Martin J Hoffert, a New York University physicist. The conclusion of Hoffert and his team was that cutting CO2 would require Herculean efforts, since CO2 is a key element of modern society that “can not be regulated away.” Furthermore, contrary to IPCC, they conclude that the availability of CO2 emission-free power requirements is not supported by the team’s assessment. In other words, the IPCC has made a supposedly scientific statement that is totally at odds with the realities of energy generation.
The problems of renewable energy sources, according to the Hoffert team, are that they have very low power densities, as we have discussed above in the case of wind. The problem becomes one of land use. The average coal-fired plant of 680-1,500 megawatts requires only a few acres for its construction and production. On the other hand, wind turbines to produce the equivalent
power need up to 1,000 turbines on a spacing of between 50 and 100 acres per turbine, requiring some 100 to 150 square miles of land to produce on an essentially intermittent basis only about 1.5% of the required annual increase to the grid. Wind power is simply feel good window-dressing meeting none of the requirements for CO2 emission-free energy. The backup requirement of wind power together with the capital cost causes a complete nullification of the supposed benefit in emissions and economics.
At the present time global power consumption is about 12 trillion kilowatt-hours per year, of which 85% is fossil-fuelled. Future demand by 2052 could be in the range of 10 to 30 trillion kilowatt-hours per year. The problems for the other renewable energy sources are very similar to wind. The Hoffert team suggests that to produce 10 trillion kilowatt-hours per year from biofuels would require 15 million square kilometres of cropland, which is simply not available. For example the use of America’s high-yielding cornfields to produce ethanol, instead of food, produces a net of only 50 gallons per acre per year after subtracting up front costs for seed, fertilizer, fuel, and processing. Thus in order to meet any significant volume of the US consumption of 134 billion gallons of gasoline per year through the use of corn ethanol, America would have to clear up to 100 million acres of forest land. The recent run-up in world food prices creating a crisis in the developing nations has demonstrated the failure of subsidised ethanol production policy.
The Hoffert team also points out that, with current solar panel technology to produce 10 trillion kilowatt-hours of electricity, another 220,000 square kilometres or so of land to accommodate the photovoltaic arrays together with the land for the associated transmission lines, service roads, maintenance roads, and so on is required. If one adds up the land requirements for the low-density renewable energy technologies, we are looking at continental land areas equivalent to South America (22 million square kilometres), China (10 million square kilometres), and India (3 million square kilometres). It is clear that current alternative energy are not feasible without major technological breakthroughs in solar panel design and efficiency and in biofuel technology, while wind power is simply not economically viable.
Although, probably an unpopular view with the green lobby, the Hoffert team’s conclusion was in support of more intensive technological solutions. In particular, they conclude that the way forward is through nuclear energy. Specifically, these experts want nuclear fission and breeder reactors with the ultimate goal of achieving fusion.
Breeder reactors are currently illegal in the United States because of concerns regarding waste disposal and production of weaponsgrade material. However, the benefits are that breeder reactors can produce more fuel than they consume, and can, after initial start-up, use thorium which occurs in the earth’s crust at a level four times that of uranium. Some believe that the future lies with reprocessing spent fuel and the use of breeder reactors in such a way that fission reactors could be effective for thousands of years.
Unfortunately, an ill-informed public, an irresponsible media, and vote-seeking politicians are diverting public attention and major capital investment from the real priorities for the future. Greater energy efficiencies at all stages of our activities are necessary so that we optimize the use of fossil fuels, abandon the rash uneconomic investments in so-called CO2 emission-free renewable energy, and invest in research into energy solutions that are economic and can meet our future needs for energy. The diversion of intellectual energy and capital investment into the global warming scare will be viewed with astonishment and disbelief in the future. It also stands as a monument to the need for intellectual freedom and the ability to sustain open scientific debate.
Barnes, Greg. 2009. Climate Change Industry Help a Bottomless Pit. Business The Age, May 30, 2009. http://business.theage.com.au.
David, Jeremy and Herzog, Howard. 2001. The Cost of Carbon Capture. Massachusetts Institute Technology, Cambridge, MA, USA. Presented at 5th International Conference on Greenhouse Gas Control Technologies.
Halkema, J. A. 2006. Critique of Windpower and the UK Wind Resource. Energy and Environment, v. 17, no. 4.
Hoffert, M. I. 2002. Science Compass: Advanced Technology Paths to Global Climate Stability: Energy for a Greenhouse Planet. Science, v. 298, p. 981-87.
Lawson, Nigel. 2008. An appeal to reason – a cool look at global warming. Overlook Duckworth, Peter Mayer Publishers Inc. New York, Woodstock, and London.
Malone, Scott. 2009. Pickens’ pullback could signal shift in the wind. Globe and Mail, Globe Investor, July 08, 2009, www.globeinvestor.com.
Singer, S. Fred and Avery, Denis T. 2008. Unstoppable global warming. Rowman and Littlefield Publishers Inc, Lanham, Maryland.


| by Shawn Stasiuk
The energy industry needs an increasingly sophisticated toolbox to help unlock today’s complex unconventional resources. Technology has increased recovery factors in tight gas plays and made profitable what were once marginal fields – in many areas horizontal wells are replacing vertical wells, hydraulic fracture treatments have moved from single stage to multi-stage, and fracture fluids, rates and proppants can all be customized for each reservoir. In turn, these advances in stimulation technology depend on reliable diagnostic information to maximize their effectiveness.
Hydraulic fracture mapping is playing a key role in this optimization process by helping reduce the uncertainty in fracturing. This is especially important since stimulation can represent as much as half of total well costs.
Fracture mapping can make or break the economics of a project. This article is a brief introduction to fracture mapping technology and its value.
Microseismic monitoring typically requires two wells: the treatment well and the observation well. The operator lowers three component geophones (usually 12 tools) into the observation well. Hydraulic fracturing induces stress changes and leakoff related pore pressure increase in the surrounding rock. A microseismic event occurs when these changes cause shear slippages along plains of weakness. These slippages emit directional primary (P) and secondary (S) seismic waves, which are detected by the geophones.
At Halliburton, using Pinnacle’s SeisManTM software, geophysicists calculate the probable location of these microseismic events by measuring the relative arrival times of the P&S waves on the geophones, observing the direction of wave propagation. They also use knowledge of the lithology and calibration microseisms, such as a string shot from a known location, to build a velocity model. Combining the arrival-time observations, velocity model, and directional information help them
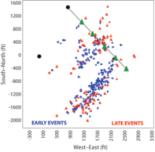
Figure 1. Fracture geometry from a single-stage uncemented completion. Early events (diamonds) were seen mostly around perforation clusters near the middle and toe of the lateral so a series of sand slugs were pumped in an effort to divert fracturing more toward the heel. About half of events (triangles) after the proppant slugs were seen near the middle of the lateral indicating at least partial diversion due to the slugs.
pinpoint the microseism location in all three dimensions. The resulting collection of dots indicates the true location and dimensions of the fractures (Figure 1).
Microseismic mapping shows an operator the height, width, length, and direction of the stimulation treatment. This helps him understand where and how the fracture is growing, enabling adjustments in real time, verifying that all payzones are properly stimulated, adjusting well treatment accordingly, and improving plans for subsequent wells.
By accurately determining fracture azimuth in various parts of a field, drilling engineers can incorporate this information in future well path trajectory plans to ensure that new wells are drilled perpendicular to the fracture orientation. In this manner, operators can adjust the well paths as stresses change from region to region within the field. Slight changes in the well trajectory can help the fracture treatments maximize each well’s stimulated reservoir volume (SRV). For example, depending on permeability, fracture azimuth errors of just 10° can reduce the drainage area. On just this one factor alone, fracture mapping can pay for itself.
Also, operators can optimize well spacing and minimize the number of wells while maximizing SRV by understanding the length and azimuth of the fracture network. The benefit here is to optimize economic development while maximizing reservoir coverage and recovery factors.
Ideally, to maximize results and minimize costs, energy from the fracture should be contained within the zone of interest, as opposed to fracturing out of zone and into formations of no economic value. Height growth can, in part, be controlled by perforation placement, pump rate, treatment volume, and type of fracturing fluid systems. In horizontal wells, the landing depth of new wells can be adjusted to avoid height growth into unwanted zones. Monitoring the effects of fracture completion changes and horizontal well placement on height growth is a key component in the optimization process. With thick pay intervals and multizone completions, perforation stages may be eliminated if mapping shows that the fracture height of one stage has covered the intended interval of subsequent stages. All of these design changes can be addressed from stage to stage or well to well, with constant focus on optimization.
One of the most beneficial aspects of hydraulic fracture mapping is the ability to see results in near real time. Observing fracture dimensions develop as a job is pumped, engineers are able to change parameters on the fly. For instance, if the treatment is growing out of zone, they can suspend pumping or add a diverter, adjusting fluid and proppant placement.
Staging strategies in horizontal wells can be modified, based on the mapping results.
Real-time monitoring of all the commonly used completion techniques can also add value by identifying problems that may require treatment shut-down, such as loss of fluid and proppant into a fault.
Using the Halliburton technology, Landmark’s DecisionSpace ® Stimulation module (as shown in figure 2) can integrate microseismic and other stimulation data with geological and geophysical information
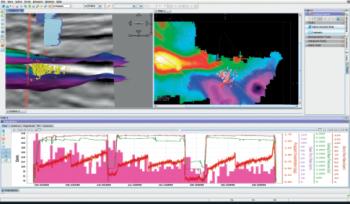
in a 3D earth model to show how the reservoir will respond to stimulation. This represents a step change in real-time fracture optimization.
It is crucial to capture measurements that allow optimization of future wells. Fiber optic DTS systems are one technology that is increasingly used on fracture treatments. DTS monitors a well’s temperature gradient along its entire length via laser, shooting down a series of glass fibers either cemented behind casing or run into the well in a tube or cable. Highly accurate temperature readings can be generated along the entire length of the well, in many cases revealing the precise location of produced fluids and gas.
There are three benefits to this technique. During cementing, the cement top can be monitored, confirming that the well has the designed isolation integrity. During stimulation, continuous temperature monitoring can identify leaking zonal isolation equipment. If this is detected during the job, treatment of the stage can be stopped for plug remediation, which prevents the waste of valuable fracture fluid and proppant. Perforations can also be monitored for flow, so balls or other diverters can be pumped in, redirecting fluid to additional perforations thus maximizing the fracture network developed on each stage.
Once a well goes on production, the same DTS system can be used to generate a virtual production log with zone-by-zone data and identify water breakthrough behind pipe
channels – all without any well intervention work. For existing wells, retrievable fiber optic systems can facilitate taking quick snapshots of a well’s production.
By correlating zone-level production rates with different stimulation treatment options, operators can use their experience to identify which combinations yield the largest return on investment.
The cost of not monitoring can be huge. Imagine pumping a 15-stage frac with no diagnostic technology. The zonal isolation equipment fails on multiple stages, sending most of the stimulation treatment into a single zone. The operator thinks he has a successful job because surface pressure instruments do not show any problems. The operator puts the well into production, but receives only a fraction of the expected production. Is this part of the field different from the rest? Was there something wrong with the fracture fluid or proppant? Was the well landed in the wrong zone? There is no basis for answering these questions, and no evidence of the real cause of the failure.
The operator has few options. They can label this part of the field as non-economic and move on, a choice that would bypass reserves, or they can put down another multi-million dollar well and take some measurements to diagnose the problem. But even then he will have little evidence that the isolation equipment failed on the first well.
Located in remote northeast British Columbia, the Horn River Basin contains one of the most prolific shale plays ever found. Due to its isolated location, however, development costs are high. Successful development will depend on quickly reducing the learning curve so that wells can be drilled with a factory-type process.
High quality fracture mapping data is essential for developing such a construction process. And listening distance, sample rate, array aperture, and number of geophone levels all determine data quality.
Listening distance is crucial. The energy generated from microseisms or microearthquakes can only travel a certain distance before it is attenuated and useless for event location. The optimal vertical location for a monitoring array is straddling the
(Continued on page 30...)

(...Continued from page 29)
formation of interest so that microseismic event energy travels through a minimum number of formation interfaces. Surface techniques, which try to monitor events with surface geophones, are hampered by the relatively large distance of the surface from the microseism.
Sample rate and the number of tools are also important. Faster rates and more tools produce better measurements. For example, the difference in clarity between a ¼ ms sample rate with 12 tools and a 1ms sample rate with eight tools is shown in Figure 3. Longer sample rates result in greater location errors, and azimuth error means lost reserves. Pinnacle’s specialized fiber optic wirelines have the capacity to sample 32 levels at ¼ ms. In cooler formations, this allows for instrument stacking and larger array apertures, all of which reduce microseismic event location errors.
IN INTERNATIONAL SEISMIC ACQUISITION
IN INTERNATIONAL SEISMIC ACQUISITION
Playing a game that is foreign to you can be tough at first. There are many different rules and tactics involved.
Thirty years and some 38 countries later, Boyd PetroSearch has developed extensive seismic acquisition experience around the world.

Trust us to manage your international seismic operation, and ensure the highest degree of professionalism and quality. The next move is up to you…
• Program Design
• Logistics
• Risk Analysis & Mitigation
• Contract Negotiation
Please call:
Malcolm McDonald +1.403.543.5355
• Project Management & Hiring
• Quality and Cost Control
• International Safety Compliance
Hydraulic fracture mapping has been greatly refined over the last decade, and is still being pushed to extract even more information from the data gathered. The key to success going forward will be basing new processing and analysis techniques on the highest quality data. Halliburton has seen numerous companies move into this market space in the last few years, all trying to adapt existing equipment to get microseismic dots on a map. By keeping an eye on how data is being acquired and processed, operators can make sure they are spending their mapping dollars wisely. The real value in fracture mapping is transforming data into information which leads to actionable process improvement decisions. Halliburton technologies and solutions reduce risk and uncertainty, making unconventional resource plays “conventional.”
Shawn Stasiuk is the Canadian Regional Manager for Pinnacle, a Halliburton service. Before taking this post, Stasiuk spent five years working in Australia, New Zealand, and China in a variety of engineering and management roles for Halliburton. Stasiuk graduated with a Bachelor of Science degree from the University of Calgary in 2000.
This article was contributed by Halliburton. CSPG thanks Halliburton for the contribution.
Larry Herd +1.403.543.5362 or visit www.boydpetro.com Global Geophysical Consultants
| By Colin Yeo, P.Geol. and Lionel Derochie, P.Eng.
As technical earth science professionals, we focus almost exclusively on petroleum exploration and development. We are concerned with the key elements of the petroleum system – source, migration, reservoir, trap and seal. Once we have identified a play and a prospect, it is often turned over to the engineers (reservoir, exploitation, development or operations) to be evaluated from an economic perspective. We are then given the news: the prospect is good or it is uneconomic. If it is bad news, we are disappointed and we go back and try to find something better. We assume that means bigger reserves and higher flow rates but that is a tall order to fill in a mature basin that is in decline.
Rather than looking for bigger prospects, what if we challenged our engineering colleagues to reduce operating costs? What kind of royalty credits might be available? What if we suggested that we drill more wells faster and at a reduced cost? What kind of rates and reserves will a horizontal well find? Will our prospect suddenly meet or exceed corporate hurdle rates? And by the way, why is the corporate discount rate higher than the company’s cost of capital?
These are just some of the questions we will investigate in this new series “Petroleum Economics for Geologists.” We will examine the purpose, mechanics and utility of the ubiquitous discounted cash flow (DCF) model that is a cornerstone of our industry. We intend to present an overview of this evaluation methodology, keeping it simple yet accurate. Our intention is to provide the geological practitioner with the knowledge and language necessary to conduct meaningful discussions with those who “crunch the numbers” and pass judgment on our exploration and development efforts.
The purpose of this introductory article is to review the underlying cornerstone of corporate profitability, cash flow, and how it is normalized for time. The article will also consider how cash flow is estimated and how it, and its derivatives, can be used to rate and rank projects.
All companies exist to maximize the wealth of their share or unit holders and they invest money in projects in order to provide their shareholders with a reasonable and
rate of return on their investment. The primary corporate objective of all companies is to enhance the investment of shareholders in the company through the simultaneous goals of profitability, growth, and performance stability. Companies are expected to grow; growth is defined as an annual increase in net income, total assets, and shareholder equity. Companies are also expected to provide stability of performance with a long record of continuous dividend payments and steady year-over-year increases in financial performance. This unrelenting focus on financial performance and growth leads to the concept of cash flow because all profitability measurements are in some way tied to cash flow and the performance of the corporation is directly linked to the performance of its assets and projects. Assets (any property, plant, or equipment that generates income) generate cash flow that is used by a company to grow by increasing production and/or providing
returns to shareholders in the form of dividends or unit distributions.
A company invests in a project with the expectation that the project will generate a return on that investment that is acceptable to the investor. The return on this investment is generally in the form of an income stream over a period of time after the investment is made. This income stream is the “Future Cash Flow” that will provide a rate of return on the investment. In the petroleum industry, producing and selling crude oil and natural gas provides future cash-flow streams. The sale of these commodities generates revenue for the company from which royalties, operating costs, general and administrative overhead, and income taxes are paid. The residual amount is considered to be “Net Cash Flow” and since it will come back to the investor over time, it is defined as “Future Cash Flow”.
(Continued on page 32...)
(...Continued from page 31)
“Time Value of money”: measuring T he Presen T Value of f u T ure Cash flows
Petroleum projects are evaluated using Present Value Theory that says a dollar received today is worth more than a dollar received anytime in the future. This is true because as soon as a given sum of money is received, it can be reinvested to earn even more money and, therefore, the earlier in time it is received, the more valuable it is. The time value of money is critical in assessing whether a given investment is going to meet the investor’s expectation.
Suppose two investors were both going to invest $1,000 at the same point in time and they were going to double their money. Investor #1 is going to receive $400 each year for the next five years and Investor #2 is going to receive $200 each year for the next ten years. In both cases, the investors are going to earn $2,000 from their initial $1,000 investment but Investor #1 is further ahead because the money is received sooner in time.
In this example, Investor #1 made a $1,000 investment to generate a future cash flow stream of $400 per year for the next five years. Another way to look at the concept of time value of money would be to determine how much money would have to be invested today at a given interest rate in order to receive each of the $400 payments over the next five years. For example, at an interest rate of 5% per annum, $381 would have to be invested today in order to yield the first payment of $400 whereas $363 would have to be invested today to yield the second payment of $400. Similarly, amounts of $346, $329, and $313 invested today would yield the third, fourth, and fifth years of payments. This is where the concepts of “Present Value,” “Future Value,” and “Discount Rate” can be introduced. We know that the future value of an investment can be calculated by the equation FV=PV(1+i) n, where FV is future value, PV is present value, i is the interest rate and n is the number of time increments. By rearranging this equation, the present-day value of a future value (like a future cash flow) can be calculated by PV= FV/(1+i) n. In this equation, i is considered to
be the discount rate and the term 1/(1+i) n is called the “Discount Factor.”
In the example above, each of the amounts to be invested today are considered to be the present values of the future payments of $400 for each of the next five years. The $400 payments are considered to be the future values for the amounts being invested today. Each of the invested amounts were calculated by applying a discount factor that is appropriate for a 5% per annum investment rate. A total of $1,732 would have to be invested today in order to generate the cashflow stream described and therefore, the present value of the entire cash flow stream is $1,732 at a 5% discount rate. If we were to go through the same exercise using a 10% per annum investment rate, we would find that $364, $331, $301, $273, and $248 would have to be invested today to generate the same cash-flow stream of $400 per year for the next five years. It follows that the amounts to be invested are lower at higher interest rates and therefore, the present value of this same cash-flow stream at a 10% Discount Rate is $1,517. Whether you use a 5% or 10% discount rate, you can see that the present value of the cash-flow stream is greater than the actual $1,000 original investment, which indicates that the actual rate of return in this example is greater than 10%. It should be noted that the present values of the cash-flow stream that Investor #2 receives are $1,544 and $1,229 for discount rates of 5% and 10% respectively. This shows that getting money back faster enhances the present value of the investment.
In Figure 1 (page 31), the discount factor is plotted as a function of time for various discount rates. For a given discount rate, the discount factor starts at 1 at time 0 and decreases over time for each subsequent time period. For a given time period, the discount factor is lower the higher the discount rates.
Oil and gas production usually declines over the life of a well. A discounted cash flow (DCF) model basically multiplies a production forecast on a year-by-year basis by a forecasted future price and then subtracts operating costs, royalties, and taxes to get a future net cash flow.
Figure 2 shows a typical cash-flow profile for an oil well. The 0% discount rate shows the actual cash-flow profile assuming that the cash flow per barrel is a constant $1. The lines corresponding to the 5, 10, and 15% discount rates show the effect of discounting on the cash-flow stream. By summing the yearly discounted cash flows, you can calculate the present value of the cash-flow stream. These are shown in Figure 3 for each discount rate.
When these discounted cash-flow streams are summed to calculate a present value,
the effect can be significant. In Figure 3, the present value of the cash-flow stream at a discount rate of 15% is only worth 73% of the undiscounted (0%) cash-flow stream. The greater the discount rate is, the less the present value of the project for a given cashflow stream.
Reasonable accuR acy and a ssumptions l ead to betteR decision m aking
Preparing a proper DCF model requires a fairly detailed knowledge of an existing operation or accurate estimates and forecasts on undrilled prospects. Price forecasts, a very important driver of profitability, are notoriously inaccurate. Production forecasting is uncertain and there is always the risk of drilling a dry hole. Capital costs for land, seismic, wells, and facilities can be estimated with some degree of accuracy and operating costs are often well understood and predictable but are still only a forecast. While royalties and taxes are well known at any point in time, we all know they can be arbitrarily changed without notice during the life of a project. When conducting any analytical process, the better the information, the better the result. At the same time, it is important to remember that it is better to be approximately correct than to be precisely wrong. Ranges of estimates and sensitivities provide investors and management with a sense of risk and uncertainty in their investments.
Corporate management carefully selects projects from an inventory that will maximize expected cash flow at a rolled-up, company level by balancing risk, size, and financial return. To aid management in this selection process, analysis and assessment of investment opportunities needs to follow an orderly, methodical, and standardized process so that all critical attributes can be easily compared and projects can be rated and ranked. Management invests its cash flow from existing properties into projects that will continue to meet its corporate objectives of profitability, growth and sustainability. Remember that investors are most happy when they are receiving appropriate and growing dividends or distributions, year over year.
Carefully estimating parameters to be used in an economic evaluation pays off when conducting post investment appraisals on a property. Preparing a cash-flow statement provides a forecast record that can be compared to actual performance. This can be done in either a formal or cursory fashion by management to ensure that future projects continue to deliver expected cash flow. Those projects that are not meeting expectations will likely be unfunded in the future, with money being diverted to more profitable operations
t he gR eat equalizeR
DCF models can be built for any asset that is
Asset Based Approach focuses on the individual assets and liabilities assumes the company will be liquidated
Book Value
Book Value Multiple
Adjusted Book Value
Replacement Value
Comparable Sales
Discounted Cash Flow
Income Based Approach considers the income or cash generating capability assumes the company remains as a going concern
Dividend Discount
Capitalized Earnings
Discounted Cash Flow
Capitalized Cash Flow or Operating Profit
Comparable Sales
Table 2: Difference between an asset based and income based approach in estimating share price. (after Johnston and Johnston, 2006)
producing or will produce a cash-flow stream. It can be an existing producing property; facilities such as pipelines, gas plants, or oil batteries; marketing arrangements; or undeveloped acreage. Using DCF models allows diverse and unrelated assets to be compared for investment purposes by focusing on financial value alone. In this way, management may elect to diversify their income stream and avoid concentration in any one commodity or segment of the petroleum industry. There are many examples of companies that have a balanced oil and natural gas portfolio with both upstream and downstream activities. Such diversification reduces cyclical volatility that is common for the oil and gas industry. However, product or operational diversification beyond the knowledge and capability of management is not recommended as history has shown that these strategies can be disastrous.
coR poR ate Valuations
While company management is using the DCF model to carefully select projects in which to invest, independent financial analysts are using the same technique to determine the fair market value of company shares relative to their trading price (market price) and relative to their competitors. They are looking to spot corporations that are trading far below fair market value with the expectation that the marketplace will eventually recognize the true value of the company and bid up share price. Table 2 shows the two different approaches used to evaluate a company using fundamental analysis techniques.
Because the value of oil and gas reserves in the ground does not always show up on a company’s balance sheet, book value and replacement value are not appropriate for evaluation purposes. Cash flow, and its derivatives, used both in the asset-and income-based approach provide a better proxy for value. There really is no better evaluation technique for petroleum companies than a discounted cash flow model and it explains why a company’s fair market value is usually higher than its market value.
This series on Petroleum Economics for Geologists will examine how a discounted cash flow model is built, what factors need to be considered, what kinds of outputs are useful, and how this information can be used to ensure a company is on track to achieve its goals. Over the next several months, we will look at:
• Price forecasts and hedging,
• Production forecasts and reserves,
• Capital and operating costs,
• Royalties,
• Income tax,
• Discount rates,
• Risk and probability,
• Ratios and metrics, and
• Strategic planning and portfolio management.
We hope to provide readers with an understanding of the importance and impact economics have on their prospects, plays, and companies and the role finance has in shaping exploration and development. If as geoscientists we can understand the financial imperatives of our companies, we can better deliver the type of exploration and development needed to meet and exceed investor expectations.
RefeR ences
Johnston, D. and Johnston, D. 2006.
Introduction to Oil Company Financial Analysis. Pennwell. p. 21-25.
Please note that this article is part of the Petroleum Economics for Geologists series. The series’ second installment will be in the November Reservoir.
Support for this series is provided by Energy Navigator who have reviewed articles, supplied technical consultation, and critiqued manuscripts. CSPG thanks them for their help.


www.cspg.org/education/education-week.cfm
Shale Gas Critical Fundamentals, Techniques and Tools for Exploration Analysis
Instructor: Dr. Basim Faraj, Unconventional Gas Specialist at Talisman Energy
Date: October 26, 2009 Price: $650
Description: This one-day course will introduce the fundamental differences between conventional hybrid and shale gas plays. Source and reservoir rock attributes of shale gas plays will be discussed as well as GIP calculations, water, oil and gas saturations, essential laboratory analysis, and optimum geochemical and mineralogical parameters. Slickwater completion lessons learned from the US will be detailed. Canadian plays will be highlighted and discussed.
Instructor: Ashton Embry, Geological Survey of Canada
Date: October 29-30, 2009 Price: $700
Description: This 2-day course presents the concepts and practical applications of sequence stratigraphy for petroleum exploration. Workshop exercises will emphasize the recognition and correlation of sequence stratigraphic surfaces on well log cross-sections. Following the course, participants will have a clear understanding of the use of sequence stratigraphy for predicting facies types and geometries away from control points.
Stratigraphic Setting of Lower and Middle Triassic Strata
Instructor: Dr. James Dixon, Geological Survey of Canada
Date: October 30, 2009 Price: $375
Description: The objective of this half-day course is to help explorationists understand the regional stratigraphic setting of Triassic rocks and how this can be used in a more local exploration program. The course consists of two lectures, some correlation exercises and an examination of several cores that illustrate various facies types and/or significant stratigraphic surfaces.


Instructor: Dr. Kerrie Bann, Ichnofacies Analysis Inc.
And Dr. Stuart Tye, Husky Energy
Date: October 27-29, 2009 Price: $100
Description: This short course has been designed to teach the basics of logging core clastic intervals, with the inclusion of fundamental introductory ichnological techniques. Identification of facies through the integration of sedimentology and ichnology is crucial in building better stratigraphic and palaeogeographic models of reservoirs.
Instructor: Dr. Octavian Catuneanu, Professor in the Department of Earth and Atmospheric Sciences at the University of Alberta
Date: October 26-28, 2009 Price: $950
Description: This workshop presents the concepts and practical applications of sequence stratigraphy for petroleum exploration and production. All concepts are illustrated with field examples of seismic, well-log, core, and outcrop data. In-class exercises emphasize the recognition of sequence stratigraphy surfaces and systems tracts on well-log cross-sections, seismic lines, and outcrop profiles.
Instructor: Godfried Wasser, M.Sc., Eucalyptus Consulting Inc.
Date: October 27-30, 2009 Price: $100
Description: This 4-day course discusses both conventional (Oil and Gas) and tight gas reservoirs with case histories from the Belly River, Glauconitic, Cardium, and the Nikanassin/Minnes. Also shown is a systematic approach to a reservoir geological evaluation starting with the rock (core and cuttings workshops) and reviewing petrophysics, thin-section analysis (capillary pressures and relative permeability), and some other aspects of reservoir engineering.
Instructor: Hugh Reid, Hugh W. Reid and Associates
Date: October 29-30, 2009 Price: $1200
Description: This 2-day course will give students the skills to identify potential missed pay by examining DST charts and results, using numerous case histories of wells with poor DSTs, which were later completed commercially. The course is designed for those who have already taken a basic DST course, or are familiar with DST charts, not for absolute beginners. ,5 ,4 ,

For a full course description & registration, see www.cspg.org/education/education-week.cfm
For additional information, contact Tina Donkers at or Travis Hobbs at
tinadave@telusplanet.net Travis.Hobbs@EnCana.com

| by Erin Linley, CSPG Outreach Committee
On July 23, 2009, 40 geology students attended a CSPG field trip organized through the CSPG Outreach Committee. The purpose of this field trip was to give students the opportunity to attend an industry-related field trip, to learn the geology in the Calgary area, and to build relationships with other students in the oil and gas industry. Last year the Outreach Committee had its first student trip to Drumheller, Alberta led by Dennis Meloche (senior Geologist of Devon Canada Corporation) where 21 students participated.
This year the field trip was lead by Graeme Bloy (Canada Capital Energy Corporation – and President of the CSPG) and Robert MacDonald (EnCana) both senior geologists and carbonate rock specialists. The field trip took place at Canyon Creek, Alberta at the base of Moose Mountain, Kananaskis, focusing mainly on carbonates of the Mississippian succession. The instructors provided a lecture on the history of drilling activity in the area along with the geology. As the students trekked the canyon, the instructors provided geological descriptions at various Banff, Pekisko, and Shunda outcrops.
We were surprised to see such a large number of students currently in the oil and gas industry and attending this field trip. The students were from various companies including Encana, Devon Canada, Nexen, Enerplus, Talisman, Paramount Energy Trust, Provident Energy, ConocoPhillips Canada, Shell Canada, and Harvest Energy. There were also students from SAIT, University of Calgary, University of Alberta, and University of Regina. During the summer months next year the CSPG Outreach Committee will organize another student trip with a different focus. Each year our goal is to organize different student field trips with various subjects and leaders. Due to the volume of interest in this trip we will be limiting it to geology summer students and new graduates. This trip will be advertised during CSPG luncheons, on the CSPG website, and in the Reservoir.
I want to thank Graeme Bloy and Robert MacDonald for their exceptional leading and for volunteering their time. Also I would like to thank Mark Radomski, Simon Haynes, and Darin McBeath for their help and Dayna Rhoads for helping to organize this successful trip. Also, thank you to all the students for your interest and participation.
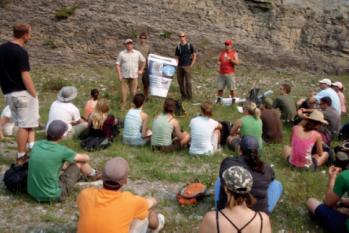
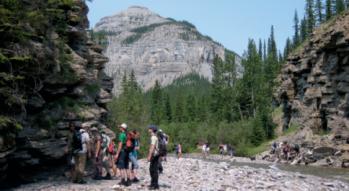
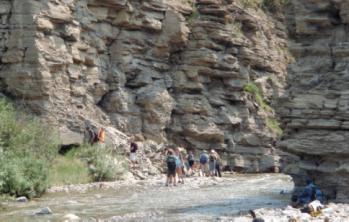
| by Linden Achen, 2009 Honorary Address Committee Chair
Every year the CSPG Honorary Address Committee brings a guest speaker to Calgary, Alberta. The Committee attempts to identify topics that are topical and interesting to our members, the geo-science community, and the general public. The 2009 CSPG Honorary Address in association with the CSEG and APEGGA will hold the talk scheduled for Tuesday, November 3, 2009 at the Southern Jubilee Auditorium. It will celebrate three anniversaries: the bicentennial of the birth of Darwin, the 150th anniversary of the publication of The Origin of Species (which brought to light the natural selection theory), and a local anniversary, the 100th year since the discovery of the Burgess Shale in Yoho National Park.
This year’s topic focuses on a fundamental understanding for all geo-scientists in the petroleum industry as we study and use species assemblages for identifying different and changing environments. When environments change, species will either move towards a more habitable environment, evolve to live within the changing environment, or die. The environment in which a species lives is a strong driving force which directs the need to change or evolve; these could include a position on or around mountain ranges, sediment transport within rivers, or being located on a tropical island.
This year we are pleased to announce our keynote speaker is Brian Keating, Director of Conservation Outreach from the Calgary Zoo. Keating will present his talk “Islands of Time – Adaptation of Life to Local Environments.” This journey will bring the audience to remote and local Canadian landscapes, showing that when environments change, or do not change, it has a direct impact upon species and environment characteristics and relationships. Keating will transport us from Papua New Guinea, Borneo, Madagascar, the Galapagos, and through Canada, reviewing biodiversity as we go.
Our second speaker, Dr. Paul Johnston, Professor in the Earth Sciences Department at Mount Royal College and guide with The Burgess Shale Geoscience Foundation in Field, British Columbia. The audience will be granted a visual tour of the super-rare biotic assemblage that has been found in the Cambrian-aged shale. This find represents a huge range of species that were unheard of prior to its discovery. The preservation of soft tissues during fossilization has preserved species never thought to have existed, and
which could be the super-duper grand infinity squared grandparent of a species living today.
The Committee is always excited to invite 2,400 school children every year to the Jubilee to see the talk in the morning. We hope to excite them about science and introduce them to our excitement of the geosciences. In this way the Honorary Address Committee plays a large role in CSPG’s outreach efforts.
This year’s evening session will begin with doors opening at 5:30 pm to the public. As in the past, our always popular lobby displays will feature many vendors and a silent auction. The silent auction will be raising funds for the CSPG’s outreach efforts. There will also be a cash bar. The talk starts at 7:00 pm sharp, so you should be able to have your children home by 9:30. Tickets are for sale on-line at www.TicketWeb.com, $10 for all; kids under 12 are free. A limited number of tickets will be available for sale at the door for $15 on the day of the talk (November 3rd, 2009).
This is a great way to introduce friends and family to the fascinating and diverse world of geology. We hope to see you all there.
Any questions can be directed to Alex Wright (alex.wright@darianresources.com), Linden Achen (linden@achenresources.com) or Alyssa Middleton of the CSPG (amiddeton@ cspg.org).
Are you looking for a digital copy of the Geological Atlas of the Western Canada Sedimentary Basin? CSPG has posted PDFs of the Atlas on CSPG’s website. You may find it by going to the Publications section of www.cspg.org, or by using the following web address: http://www.cspg.org/ publications/pubs-geologicalatlas.cfm.

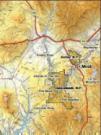


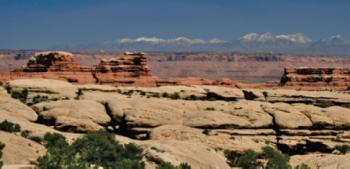
Trailhead: Elephant Hill, Needles District, Canyonlands National Park, UT
Distance: Approximately 23 km (16.3 miles) round trip from Elephant Hill.
• The Needles District is so named because of the many spires of Cedar Mesa Sandstone (Permian) that have been uplifted and fractured by vertical joints to form an extensive area of “needles.”
• Chesler Park is a circular-shaped meadow or grassland about a mile in diameter surrounded by the striped needles of the Cedar Mesa. The striping comes from an alternation of marine (white) and fluvial (red) sediments.
• The Joint Trail, despite what you may think, is a maze of trails through the vertical joints in the rock. It is a perfect place to cool off on a hot day.
• Elephant Canyon follows the bottom of a sandy wash bordered by towers of Needles.
• Druid Arch is located at the head of Elephant Canyon. It is massive. Arches abound in this area due to the combination of rapid uplift of the sandstone and the inherent vertical jointing.
The Reservoir Committee welcomes contributions from our readership to this series. If you wish to offer a submission to Go Take a Hike, on your favourite hike of geological interest, email the Reservoir at heather.tyminski@cspg.org for more information.
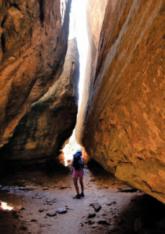

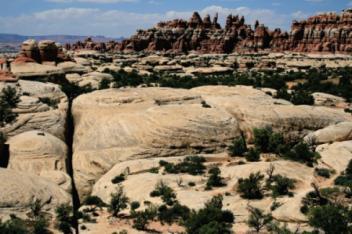
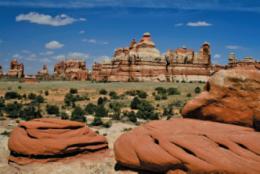


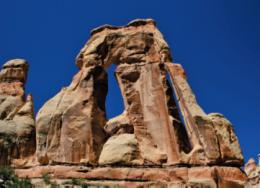
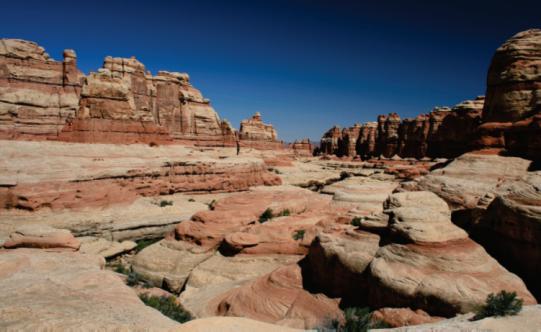


Nautiloid in Ordovician Tyndall (Red River Fm. equivalent) dolomitic limestone; pin-point porosity developed in darker dolomite
Photo by: Bill Ayrton
New geologists, engineers, geophysicists and landmen, as well as summer students entering the industr y for the first time will find the courses a very beneficial introduction to the petroleu m industry . These courses will be extremely useful to nonprofessional and support staff in the oil and gas industry, as w ell as accountants, lawyers, brokerage and financial personnel working primarily alongside the oil and gas industry.
To register or to obtain additional information regarding in-house and upcoming courses, please contact:
Ayrton Exploration Consulting Ltd.
Tel: (403) 262-5440
Email: ayrtonex@telusplanet.net
Or visit our website: www.ayrtonexploration.com
Date: November 3rd & 4th, 2009
Cost: $945 (includes GST)
Instructor: Bill Ayrton
Effective for personnel just joining the oil patch, or for financial, accounting, and information systems personnel.
• Learn about the many facets of the industry.
• Oil finding, land acquisition, drilling, seismic, well completion, jargon and terminology.
Date: November 10th & 11th, 2009
Cost: $945 (includes GST)
Instructor: Bill Ayrton
Effective for geological technicians or administrative staff, or for those who just want a better understanding of geology to appreciate the world around us.
• Learn about earth structure, geologic time-scale and processes, Western Canada geology, and interesting nearby locations.
• Participate in a r ock identification exercise , cross-section project and a mini-field trip in downtown Calgary.
Date: November 24th, 25th, & 26th, 2009
Cost: $1365 (includes GST)
Instructor: Bill Ayrton
Ideal for those who wish to improve their geological understanding of where and how we look for oil and gas fields in Western Canada.
• To visualize what Western Canad a looked like throughout the stages of history, for example, the position of the sea versus land, what sediments were deposited, and what type of life that existed and evolved.
• To review the importance of each major stratigraphic unit, i.e. Devonian, Mississippian, Cretaceous, etc.
• Discuss the geological and seismic expression of typical oil and gas fields in each unit.

| by Ayaz Gulamhussein, 2009 CSPG Services Director
In 2008, the CSPG Executive noticed a shift in the attitudes, concerns, needs, and priorities of the CSPG membership. In an effort to align the direction of the Society with the needs of the membership, it was recommended that the 2009 Executive conduct a new and extensive membership survey. After months of debate, scrutiny, revisions, and review, a final version of the 2009 CSPG membership survey was agreed upon in late April 2009.
An invitation to participate in the new CSPG membership survey was e-mailed to the 3,022 members whose emails were on file in the Society’s database. A link to the survey was also displayed on the homepage of CSPG’s website. The survey opened on May 1st, 2009, and closed on May 31st, 2009.
843, or 28% of the membership, participated in the 2009 CSPG membership survey. 756, or 90% of the participants, finished the survey in its entirety. A statistical confidence of 99% ± 3.8% was attributed to the data, due to the high participation rate.
The summary below briefly outlines responses to 56 of the 82 survey queries. More detailed results of the survey will be available in the Members Only section of CSPG’s website.
The CSPG membership said that they were very satisfied (scores of 4 or 5, on the 5-point scale) with the Society. Only 6% of the membership indicated that they were somewhat or extremely dissatisfied.
Technical information exchange, networking opportunities, and the support of CSPG activities were the top three reasons given by members for belonging to the Society.
61% of members did not support a change in CSPG dues, while 39% of the members supported an increase. 65% of the membership receives full or partial support for their membership from their employer.
56% of members indicated that voting rights were not an important part of their membership.
59% of members indicated that they had contacted the CSPG office over the last 12 months. 96% of those members indicated that their questions and/or concerns were handled to their satisfaction.
78% of the membership indicated that they read every issue of the Reservoir. The primary reasons given for reading the magazine were Technical Luncheon previews, Division Talk previews, and Special Series features like “Reservoir Engineering for Geologists.”
56% of the membership advised that they read the Bulletin every quarter. Only 7% of the membership indicated that they never read the Bulletin. 68% of members told us that they have used the online search engine, at one time or another, to look for past Bulletin articles.
59% of members participated in one or more CSPG social events over the past year. Those who did not attend any events cited lack of time as the primary reason for not participating.
Almost half of all members indicated that they had participated in a CSPG continuing education course within the last five years. 75% of members confirmed that they received corporate support for continuing education courses.
73% of the membership attended at least one technical luncheon over the last 12 months. 86% of those individuals rated their experience as good to excellent. Only 44% of the membership was aware that select Technical Luncheons are available as online web casts.
Greater than 80% of members visit the CSPG website quarterly, or more
frequently. Slightly more than 4% of the Society claim to never use the website. 5% of members felt that the website was difficult to use.
The top five Technical Divisions for attendance are Basin Analysis and Sequence Stratigraphy, Sedimentology, Structural Geology, International, and Heavy Oil & Oil Sands. Members indicated that the top five topics of interest are Sedimentology, Stratigraphy, Clastics, Unconventional Resources, and Carbonates.
Results from the 2009 Membership Survey indicated that a significant number of members were not familiar with many of the CSPG’s awards. Even with their unfamiliarity, 82% of members stated that winning an award from the Society would be an honor for them.
62% of members felt that the CSPG should have a secure online service whereby potential employees can post their resume for prospective employers. 38% of members were either against the idea or were not sure. 67% of members felt it would be useful if the CSPG had an online registry for job postings. 33% of members were either against the idea, or were not sure.
Only 2% of the membership disagreed with the CSPG taking a role in informing the public concerning geoscience and energy issues. The implications of this need to be carefully considered by the Executive, in light of the capacity and capability of the Society.
78% of the CSPG membership affirmed that the Society should generate objective, balanced summaries on the science of global climate change for its members. 68% of members felt that the CSPG should adopt a science-based stance on global climate change (even at the risk of generating controversy).
(Continued on page
(...Executive Comment continued from page 5)
sponsors and advertisers. The CSPG thanks them for their firm support. The CSPG brand is vital to our profession.
Let’s finish this financial drama. The Executive Committee approved a revised budget in March 2009. Today our revenue is coming in at about $2.1MM with expenses of close to $2.3MM. The operational income statement was nearly break-even if we exclude onetime items due to the office changes. The income difference was covered by the reserve fund leaving it standing at $634,000 after expenses and investment losses. Plus our cash position
surplus sits at $150,000, covering near-term operations.
Ultimately the CSPG has a strong balance sheet, leadership, and support. The structural changes in the office were necessary to go forward. Our finances are currently healthy. Although there are still potential revenue risks, there are signposts which will allow us to respond. Now the collective task is to concentrate our efforts on maintaining and growing membership levels and participation, both social and technical. The CSPG is a terrific organization, and I am proud to be a part of it.


(...CSPG Scores High continued from page 41)
81% of members have attended a CSPG convention in the past three years. The top three items of importance according to delegates include the Technical Program, Networking, and the Exhibit Floor.


Approximately half of the CSPG membership has volunteered with the Society at one point or another. The top three reasons that would increase the attractiveness of volunteering with the Society are clear guidelines and time commitments, professional development – technical and leadership, and better communication of available roles. Only half of the current membership believes that the CSPG does a good job of informing members about volunteer opportunities.


97% of the membership supports the CSPG sharing operational costs with other technical societies. The majority of members also support talks from technically related societies, joint conventions with other societies that supplement the existing agreement with the CSEG and CWLS, and sharing offices and related operational costs. The majority of members do not support joint dues with other societies.


Based on this survey, the CSPG Executive will be assessing, prioritizing, and defining responses to gaps and opportunities to programs and services. There may be a role for you to develop and implement new initiatives. There will be more communication about this survey at Technical Luncheons, on the CSPG website, and in the Reservoir.


Finally, the CSPG Executive would like to thank all the members that participated in the survey. The extremely high response rate is indicative of how strongly the membership feels about the future of our Society.


| by Simon Hanmer
In Budget 2008, the Government of Canada described a bold “Vision for a New North” which included a two-year, $34 million investment in Geo-mapping for Energy and Minerals (GEM). This program will provide public geoscience information across the north to help guide investment decisions leading to the discovery and development of new energy and mineral resources. On August 26th, 2008, the Prime Minister announced that GEM would be funded at $100 million over five years (2008-2013). Funding will ramp up from $12 million for 2008-09 to $22 million in succeeding years, until March 31st, 2013.
Natural Resources Canada’s Geological Survey of Canada (GSC) will lead the federal contributions to GEM in collaboration with government geoscience agencies in the provinces and territories, as well as with academic researchers from across Canada. In large areas of the North, there is insufficient public geoscience information to attract and guide effective private sector investment in exploration. While new geological mapping is important across the North, the need is particularly acute in the Territories. For example, adequate geological knowledge to support resource exploration exists for only about one-third of Nunavut. Therefore, at least 75% of federal GEM funds will be allocated for public geoscience in the three Territories. However, the northern economic development goals of GEM are also pertinent in the Provinces, where work will be done on a cost-shared basis with provincial agencies. With the current level of resources, we estimate that it will take 10 years to complete this task. Although geo-mapping activities for energy and minerals are often quite distinct scientifically and geographically, GEM planning and delivery will be centrally coordinated to ensure the public policy goal of ensuring northerners benefit from economic development related to resource exploration and eventual development.
GEM is well underway, having benefited enormously from discussions with the Provinces, Territories, and their industry clients, in support of the Cooperative Geological Mapping Strategies (CGMS) initiative over the past five years. These discussions enabled GEM to be launched
quickly and has already resulted in the successfully completion of seven airborne geophysical surveys across Canada with our collaborators.
GEM projects aimed at energy resources focus on the generation and release of resource assessments to support exploration activity and development of new conceptual plays for under-explored areas, and includes consideration of uranium. Minerals-related GEM projects are designed to target specific commodities with significant exploration potential and cover unknown areas of uncertain or open mineral potential. Thematic methodology development is also a critical component of all GEM research, specifically where it significantly enhances the efficacy of, or accelerates, the geological assessment of resource potential.
Gem e nerG y projects
Yukon and Liard Basin: This project has several major thrusts: 1) public release of data and mapping from GSC and Yukon Geological Survey (YGS), and interpretation of the geology in terms of oil and gas potential in the Liard and Bonnet Plume basins; 2) the oil and gas potential of the Eagle Plains/Peel Plateau; and 3) new surficial mapping for aggregate in support of shale gas exploration in the Horne River area, NE BC.
Mackenzie Corridor and Delta: This project encompasses the Mackenzie Delta and Beaufort Sea, the Mackenzie Plain, and the Mackenzie-Franklin basins and Colville Hills areas. Work will include:
1) the first petroleum assessment of the Mackenzie Corridor; 2) completion and public release of extensive information deriving from recent Beaufort-Mackenzie Delta projects, as well as new work on diagenesis and thermal modelling; and 3) geological mapping and petroleum systems studies of the central Mackenzie Valley to better define factors controlling oil and gas occurrence in this area. In addition the project will bridge between new work planned in the Mackenzie near shore and the western Arctic
Islands in order to tie in the onshore geology between these two areas and better understand the geology of the Beaufort Sea.
Western Arctic Islands: This project will have three components:
1) the geology around the anchor fields on Sabine Peninsula and an integrated surface-subsurface model of the salt dynamics and petroleum systems on Sabine Peninsula and the offshore;
2) the surface and subsurface geology of Ellef Ringnes Island including salt dynamics, petroleum systems, and stratigraphy; and
3) surface geology of northwestern Victoria Island, linking to the subsurface geology of Banks Island and the northwestern rim of the Sverdrup Basin.
The knowledge gained on petroleum systems, conceptual plays, and quantification of associated reservoir properties will link into a new resource assessment of the Arctic Islands.
Eastern Arctic Islands: This project will extend from southwest Ellesmere Island to southern Baffin Island with the intent to identify the distribution of stratigraphic successions favorable for developing petroleum systems. The priority target is the Late Cretaceous to Miocene Lancaster Basin, covering an area equivalent to the entire Beaufort-Mackenzie Delta. Secondary targets include the Bjorne Peninsula, the Jones Sound Basin, the sub-basins along the Baffin Shelf, the Cumberland Basin and the Saglek Basin. The project activities will evolve from a regional remote-sensing RADARSAT analysis to identify active oil seep locations for targeted site surveying and sampling for organic geochemical analysis. Samples from the Eclipse Trough on southern Bylot Island will be analyzed for palynology, macropaleontology, and organic geochemistry to establish the ages and source-rock potential for the strata within the Lancaster Basin. Reflection seismic data will be acquired to tie the stratigraphic mapping to the ODP-645 well, and airborne geophysical data will be acquired to define the regional structural framework. (Continued on page 44...)


(...Continued from page 43)
Hudson Bay and Foxe Basin: This project, principally focused in Nunavut and the northern parts Ontario and Manitoba, will evaluate the petroleum geology of the area, specifically to determine if petroleum systems could be present. If the presence of economic hydrocarbons is established, the project will perform the first detailed resource assessment of the area, and generate new play concepts to encourage exploration. Activities will include:
1) fieldwork to identify possible source and reservoir rocks, and regional thermal maturity mapping;
2) seismic and airborne geophysics acquisition and interpretation; and
3) an assessment of unconventional gas resources.

Rock Well Petroleum Inc. uses the Multi Express* slim, multiconveyance formation evaluation platform to easily access small-diameter wells in Osage field, Wyoming, USA. The compact Multi Express platform combines conveyance flexibility with reliability and efficiency to deliver the log quality of a conventional-diameter platform.
The 2.25-in Multi Express platform provides comprehensive measurements from a wide variety of environments, including coalbed methane wells and air-filled holes.
With the Multi Express platform, you get the answers you need. www.slb.com/multiexpress

Uranium: For the foreseeable future, uranium will be a premium commodity across Canada. Hence this project will operate in the Athabasca and Thelon basins, the northwest Slave perimeter, the Great Bear Lake area, western Labrador, northeast Manitoba, and northern Quebec. Work will principally focus on the acquisition and interpretation of airborne geophysics, metallogeny, and resource assessment.
All projects will involve significant participation by academia, in particular students from junior undergraduates to post-doctoral fellows. Training and mentoring of the next generation of highly qualified geoscience personnel is a top priority for the GSC in all of its Programs, including GEM.
The foregoing is by no means a complete and final listing of GEM projects, but rather a snapshot of a work in progress. Discussions continue between the GSC and its territorial and provincial partners, with input from industry. Project-level planning is still ongoing, and will continue to evolve as new ideas and results arrive. For further information, please monitor the GEM website (http://gsc.nrcan.gc.ca/gem), or contact the head of your territorial or provincial geological survey, or the GSC at the following addresses:
Martin Fowler: GEM Energy Program Manager (mfowler@nrcan.gc.ca)
John Percival: GEM Minerals Program Manager (jpercival@nrcan.gc.ca)
Simon Hanmer: GEM Coordinator (shanmer@nrcan.gc.ca)

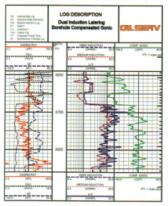

First Iraqi company providing logging services for:
• Open hole services
• Cased hole services
• Perforations
• VSP
• PLT
Unique system, Decades of tools performance and accuracy
The Geological Survey of Canada (GSC) is very pleased to announce that Dr. John Harper will be joining the GSC for the coming year, as Director of GSC – Calgary. Dr. Harper brings extensive and diverse experience in petroleum geosciences to this position. He gained operational, management, and research credentials over the past 40 years in reservoir characterization and basin analysis in Canadian, US, and International onshore and offshore basins with companies such as Shell Development, Shell Oil, Shell Canada, Trend Exploration, Gulf, Conoco, and ConocoPhillips Canada, and through consulting for numerous domestic and international companies.
Dr. Harper holds a reputation as an expert, competent in both carbonates and siliciclastics, and geophysics, who applies state-of-the-art innovative interactive and computerized technical project skills and thorough assessment to problem-oriented exploration. He is quite experienced in field development of reservoirs, reservoir characterization, and reservoir management
on a global basis, having studied basins and reservoirs around the world for the purposes of prospect generation and enhancement of hydrocarbon recoveries. Such expertise led to his involvement with the International Chamber of Commerce in Paris as a technical witness for a significant arbitration suit, and to reviews for legal assessment of liability for oil spills in Canada and the US. His most recent exploration activities have been in the frontiers of the Canadian Mackenzie Delta - Beaufort, Arctic Islands, Scotian shelf and deep water, East and West Newfoundland, and the Grand Banks.
Dr. Harper has expertise in both carbonate and clastic sedimentology in both ancient systems and modern analogues. He has been an instructor for the Belize modern carbonate field trip offered by Burr Silver and has conducted research on modern clastic depositional systems. Clastic reservoir studies in western Canada (noteably Mannville, Viking, and Triassic Montney, Doig, Halfway) have led to new appreciations for the control of hydrocarbons in such settings. Dr. Harper

was a member of the early Shell research team on deepwater reservoirs and has been involved with Californian, Gulf of Mexico, and West African data. He has undertaken successful horizontal drilling projects in the clastics and carbonates of Libya, and reservoir analysis and prospect generation throughout the US Rocky Mountain foreland basin.
For the last seven years, Dr. Harper was a Senior Geological Advisor for ConocoPhillips involved with all their Canadian Frontier onshore and offshore exploration, having successfully bid on Arctic acreages, drilled an East Coast well jointly with Chevron, and assessed acreage in the East Coast and Labrador. His international experience encompasses projects throughout the Pacific, North Africa, Europe, and the Middle East. He was Professor of Petroleum Geology, Director of the Centre for Earth Resources Research, and Principal Investigator for the Global Petroleum Resource Evaluation Group during his tenured ten years at Memorial University of Newfoundland.

Give us an hour for a demo – we know you’ll see the value. Call 403.262.1992 Email info@geoscout.com | Online www.geoscout.com/demo
industry-leading customer service easy & efficient migration of existing data helping clients increase productivity
Another powerful suite of tools from Having everything you need all in one software solution saves your company time and money. It’s also easy-to-use with our Windows-based platform. Thousands of landmen, engineers & geologists use geoSCOUT™ oil and gas mapping and analysis software every day, to make more efficient, informed