


Looking to maximize opportunities in today’s volatile market?
Combine the power of PETRA® and IHS Critical Information including well and log data to define reservoir parameters and determine new opportunities faster and more cost effectively.
Let IHS information solutions improve your decision-making and reduce your risk.
For more information on PETRA visit us at www.ihs.com/reservoirsolutions


#600, 640 - 8th Avenue SW Calgary, Alberta, Canada T2P 1G7
Tel: 403-264-5610 Fax: 403-264-5898
Web: www.cspg.org
Office hours: Monday to Friday, 8:30am to 4:00pm
Executive Director: Lis Bjeld
Email: lis.bjeld@cspg.org
Advertising & Sponsorship Coordinator: Alyssa Middleton
Email: alyssa.middleton@cspg.org
Communications Coordinator: Heather Tyminski
Email: heather.tyminski@cspg.org
Member Services Coordinator: Kasandra Klein
Email: kasandra.klein@cspg.org
Registration Coordinator: Dayna Rhoads
Email: dayna.rhoads@cspg.org
Joint Annual Convention Committee
Convention Manager: Shauna Carson
Email: scarson@geoconvention.org
Convention Coordinator: Tanya Santry
Email: tsantry@geoconvention.org
EDITORS/AUTHORS
Please submit RESERVOIR articles to the CSPG office. Submission deadline is the 23rd day of the month, two months prior to issue date. (e.g., January 23 for the March issue).
To publish an article, the CSPG requires digital copies of the document. Text should be in Microsoft Word format and illustrations should be in TIFF format at 300 dpi., at final size. For additional information on manuscript preparation, refer to the Guidelines for Authors published in the CSPG Bulletin or contact the editor.
Technical Editors
Ben McKenzie Colin Yeo (Assistant Tech. Editor) Tarheel Exploration EnCana Corporation Tel: 403-277-4496 Tel: 403-645-7724
Email: bjmck@telusplanet.net Email: colin.yeo@encana.com
Coordinating Editor
Heather Tyminski
Comunications and Public Affairs, CSPG Tel: 403-513-1227, Email: heather.tyminski@cspg.org
ADVERTISING
Advertising inquiries should be directed to Alyssa Middleton, Tel: 403-513-1233, email: alyssa.middleton@cspg.org. The deadline to reserve advertising space is the 23rd day of the month, two months prior to issue date.
The RESERVOIR is published 11 times per year by the Canadian Society of Petroleum Geologists. This includes a combined issue for the months of July and August. The purpose of the RESERVOIR is to publicize the Society’s many activities and to promote the geosciences. We look for both technical and non-technical material to publish. The RESERVOIR is not intended to be a formal, peer-reviewed publication. Additional information on the RESERVOIR’s guidelines can be found in the May 2008 issue (p.46-48; available at http://www.cspg.org/publications/reservoir/reservoir-archive-2008.cfm). No official endorsement or sponsorship by the CSPG is implied for any advertisement, insert, or article that appears in the Reservoir unless otherwise noted. The contents of this publication may not be reproduced either in part or in full without the consent of the publisher.
For more on field seminars and short courses, call 918-560-2650 or visit www.aapg.org/education.
AAPG Fall Education Conference – The Business of Petroleum Exploration
September 21-25 / Houston, TX
Instructors: 13 expert instructors, 10 in-depth courses
Risk, Uncertainty and Decision-Making in Unconventional Resource Plays
October 10 - 11 / Tulsa, OK, with AAPG Mid-Continent Section Meeting
Instructor: William Haskett, Decision Strategies, Inc., Houston, TX
Optimizing Horizontal Well Applications - The Asset Team Approach
November 2 - 6 / Dallas, TX
Instructor: Bob Knoll, H-Tech. Petroleum Consulting Inc., Calgary, AB, Canada
Fluvial Stratigraphy
November 14 - 15 / Rio de Janeiro, Brazil, with the AAPG International Conference & Exhibition. Instructor: John Holbrook, University of Texas at Arlington, TX
Getting Started in Fluvial Stratigraphy
December 1 / Dallas, TX
Instructor: John Holbrook, University of Texas at Arlington, TX
Lacustrine Basin Exploration
September 13 - 20 / Begins and ends in Salt Lake City, UT
Leaders: Alan Carroll, University Of Wisconsin, Madison, WI; Meredith Rhodes Carson, Geofuels LLC, Madison, WI
Sedimentology and Sequence Stratigraphic Response of Paralic Deposits to Changes in Accommodation: Predicting Reservoir
Architecture, Book Cliffs, Utah
September 24 - October 1 / Begins and ends in Grand Junction, CO
Leaders: Keith W. Shanley, Consultant, Denver, CO; J. Michael Boyles, Shell International E&P, Houston, TX
Modern Terrigenous Clastic Depositional Environments
September 30 - October 7 / Begins in Columbia and ends in Charleston, SC
Leader: Walter J. Sexton, Athena Technologies, Inc., Columbia, SC
Applied Stratigraphy of Paleozoic Carbonate Platforms; Facies, Cycles, Sequences, Reefs, Reservoirs
October 4 - 7 / Begins and ends in the Las Vegas airport
Leader: John E. Warme, Colorado School of Mines, Golden, CO


CSPG EXECUTIVE
President
Graeme Bloy • Canada Capital Energy Corporation gbloy@capitalenergy.ca Tel: (403) 975-5784
Vice President
John Varsek • EnCana Corporation john.varsek@encana.com Tel: (403) 645-2000
Past President
Lisa Griffith • Griffith Geoconsulting lgriffith@griffithgeoconsulting.com Tel: (403) 669-7494
Finance director
David Garner • Chevron Canada Resources davidgarner@chevron.com Tel: (403) 234-5875
assistant Finance director
Greg Lynch • Shell Canada Ltd. greg.lynch@shell.com Tel: (403) 691-3111
Program director
Randy Rice • Suncor Energy Inc. rjrice@suncor.com Tel: (403) 205-6723
assistant Program director
Scott Leroux • EnCana Corporation scott.leroux@EnCana.com Tel: (403) 645-2000
serVices director
Ayaz Gulamhussein • NuVista Energy Ltd. ayaz.gulamhussein@nuvistaenergy.com Tel: (403) 538-8510
assistant serVice director
Penny Colton • Geophysical Service Inc. pcolton@geophysicalservice.com Tel: (403) 514-6267
outreach director
Mike DesRoches • Talisman Energy Inc. mdesroches@talisman-energy.com Tel: (403) 513-6843
communications director
Peggy Hodgkins • CGGVeritas peggy.hodgkins@cggveritas.com Tel: (403) 266-3225
A message from the CSPG President, Graeme Bloy

has the CSPG taken?
The past-presidents and concerned members of the CSPG have suggested that the Executive update the membership as to the financial health of the Society. As you are very aware, the petroleum industry in Calgary has and will be undergoing significant adjustments due to the commodity price fluctuations and the decreased flow of investment dollars particularly for conventional hydrocarbon exploitation. The result of these events has impacted the Society with decreased membership renewals; lower attendance at technical programs, courses, and conventions; and decreased sponsorship and advertising. Thus the Society will have lower actual revenue than forecasted in the 2008/09 budget year (the Society’s budget starts September 1st and ends August 31st).
As a result of these ongoing financial challenges, in the past eight months we, the CSPG Executive, have reorganized the office staff by terminating two positions, the business manager and corporate relations. The responsibilities of these positions have been merged into the executive director position.
The Executive has hired Lis Bjeld as the Executive Director with a contract to December 31, 2010. Lis brings a wealth of experience from the accounting world (as a CMA and FCMA) and as a HR type. Under Lis’s direction the CSPG office now has:
1) A standardized usable accounting system, such that we, the Executive, can be kept up-todate with the finances of the Society including a full disclosure of the operating budget versus forecast budget, with accuracy.
2) Lis has generated a trust with the office staff and has reinvigorated and focused their workflow. Deanna, Heather, Dayna, Kasandra, and Alyssa – the CSPG office staff – are wonderful and hard working individuals who ensure and execute the day-to-day operations of the Society.
3) Lis has also developed a comprehensive sponsorship program with the staff, which is being put into action presently.
4) And not to belabor the point, she has created financial accountability from all sectors of the Society, including the Executive.
With the termination of the two employees, the business manager and corporate relations, the CSPG had to dip into the “rainy-day fund” to cover their severance package costs and associated legal fees. These employees were compensated fairly and generously, without cause. The cost of this extra-ordinary item was $285,000. Funds were taken from the CSPG rainy day fund to cover these unforeseen costs; the fund now sits at ~$656,000 (as of June 30, 2009).
The Society will sit at the end of fiscal year 2009 with a forecasted loss of approximately $150,000 but after extraordinary items will have a loss in excess of $125,000. Last year’s operating loss was $79,417. These losses are acceptable for a $2,350,000 budget for a non-profit organization such as CSPG (Note that the Executive approved a revised budget 2009 during the fiscal year that was instrumental in capping our forecasted losses.). David Garner and Greg Lynch, the Finance Directors of the Society, will bring more clarity to the unaudited 2009 budget year and the forecast budget for 2010 in their executive comment in the Reservoir next month. Review engagement statements for the 2009 budget year will be released in late December 2009.
Suffice it to say the CSPG Executive has planned and approved an executable $2,350,000 breakeven budget for 2010. As a point of interest, office salary and benefits will represent less than 19% and profit from the annual joint convention is projected at $170,000 in this budget.
The CSPG Executive will become more accountable to the membership. We have traversed some very hard terrain on a personnel basis, and are now able to commit to this. We expect all segments of the CSPG business to be accountable to the Executive and Executive Director, as we will be doing hard-time through this period of adjustment in the petroleum industry. We will be counting our dollars and cents.
Finally, the CSPG is very strong technical society. We are fiscally responsible and in good health, with a very large volunteer base and a committed office staff supporting and providing a large number of services to its members.
CGGVeritasiscommittedtoacquiringandprocessingsuperiorqualitydatain thelocationswhereyouoperate.WiththehighestqualitydatalibraryinCanada, you’llhaveaccesstomulti-clientdatainthemostdesirableregionsof AlbertaandNorth-EastBritishColumbia.
CountonCGGVeritastohelpyouexplore,developandproducewithconfidence.

Contact:
Tel:+14032056000
CORPORATE MEMBERS
APACHE CANADA LTD.
BAKER ATLAS
CONOCOPHILLIPS CANADA LIMITED
DEVON CANADA CORPORATION
ENERPLUS RESOURCES TRUST
geoLOGIC systems ltd.
GEOMODELING TECHNOLOGY CORP.
HUNT OIL COMPANY OF CANADA
HUSKY ENERGY INC.
IHS
IMPERIAL OIL RESOURCES
LARIO OIL & GAS COMPANY
LITTLE ROCK DOCUMENT SERVICES
MJ SYSTEMS
MURPHY OIL COMPANY
NEXEN INC.
PENN WEST PETROLEUM LTD.
PETRO-CANADA OIL AND GAS
PETROCRAFT PRODUCTS LTD.
PROVIDENT ENERGY LTD
RPS ENERGY CANADA LTD.
SHELL CANADA LIMITED
SPROULE ASSOCIATES LIMITED
SUNCOR ENERGY INC
TALISMAN ENERGY INC.
TECK COMINCO LIMITED
TOTAL E&P CANADA LIMITED
TOURMALINE OIL CORP.
AS OF JULY 29, 2009
Engineers Canada is the national organization of the 12 provincial and territorial associations that regulate and license the practice of engineering (and in some cases, like Alberta, geoscience) in Canada. APEGGA, a Constituent Member of Engineers Canada, is the association that licenses engineers and geoscientists in Alberta.
On June 17 in Calgary and June 25 in Edmonton, Engineers Canada conferred Fellowships on 218 Professional Engineers and Geoscientists. Of these, 20 were Professional Geologists and 15 Professional Geophysicists. Three of the Professional Geologists honoured – Alice Payne, Bill May, and Dr. Gordon Williams – are Past Presidents of the CSPG.
Engineers Canada Fellowships may be conferred upon individuals who have given noteworthy service by serving the engineering or geoscience profession in a volunteer capacity for at least 10 years with either APEGGA or Engineers Canada. Dr. Williams further qualifies for this honour by being the President of APEGGA in 2008-2009.
Geologists receiving this award are given the privilege of using the designation “Engineers Canada Honorary Fellow” – Hon. FEC –before their professional designation.
Recipients of the Engineers Canada Honorary Fellowship are:
David Bardwell, P. Geol.
Alan Blackie, P. Geol.
John Browning, P. Geol.
Donald Currie, P. Geol.
Michael Day, P. Geol.
Dr. Johannes Den Boer, P. Geol., P. Geoph.
Dr. David Devenny, P. Eng., P. Geol.
Dr. Philippe Erdmer, P. Geol.
Dr. Darcie Greggs, P. Geol.
Dr. Judith Lentin, P. Geol.
William May, P. Geol.
Neil O’Donnell, P. Eng., P. Geol.
Dr. Reg Olsen, P. Geol.
Alice Payne, P. Geol.
Don Peel, P. Geol.
Diana Purdy, P. Geol.
Maureen Rangitoheriri, P. Geol.
Laurie Slezak, P. Geol.
Keynote Speakers: Arve Næss, StatoilHydro Remi Eschard, IFP Sedi Body PG Poster_1.qxd 16/7/09 16:08 Page 1
Dr. Gordon Williams, P. Geol.
Brenda Wright, P. Geol. Convenors:
International Conference: Sediment Body Geometry and Heterogeneity: Analogue Studies for Modelling the Subsurface 21-23 October 2009
The Geological Society,Burlington House,Piccadilly,London

John Howell (Univ. of Bergen)
David Alsop (Shell)
Tony Reynolds (BP)
Allard Martinius (StatoilHydro)
Colin Daly (Schlumberger)
Andy Gardiner (Heriot-Watt University)
REGISTRATION IS NOW OPEN
Advances in the collection, analysis and application of datasets derived from analogues (outcrop, flume, seismic) to modelling reservoir properties for predicting subsurface fluid flow.
Themes:
• Analogue analysis techniques: outcrop, flume tank studies, seismic studies, minipermeametry, data analysis.
• Analogue studies from all depositional environments
• Application of analogues via geological models to reduce subsurface uncertainties
• New geological modelling methods - process-based and hybrid process - geostatistical methods
For further information about this conference, please contact: Steve Whalley,Event Co-ordinator: +44 (0)20 7432 0980 or email: Steve.whalley@geolsoc.org.uk
At the forefront of petroleum geoscience www.geolsoc.org.uk/petroleum
B. J. Rostron
Department of Earth and Atmospheric Sciences, University of Alberta
11:30 am
tuesday, september 15, 2009 telus convention centre calgary, a lberta
Please note: the cut-off date for ticket sales is 1:00 pm, t hursday, september 10, 2009. csPg member ticket Price: $38.00 + gst. n on- m ember t icket Price: $45.00 + gst.
Due to the recent popularity of talks, we strongly suggest purchasing tickets early, as we cannot guarantee seats will be available on the cut-off date.
Did you know that you can book a table for the Technical Luncheon? To book your table, or to buy individual tickets, visit www.cspg.org or call CSPG’s office at (403) 264-5610.
During petroleum exploration and production operations the question often arises “Is the fluid recovered during well testing pure formation water or contaminated with drilling fluid?” A variety of water chemical techniques (e.g., Stiff diagrams) have historically been used to answer this question. However, standard chemical fingerprinting techniques can be problematic or ambiguous, especially when working in environments with evaporites (hence, brine formation-water), or in shallow (fresh formation-water) settings. A new fingerprinting technique using stable isotopes of hydrogen, oxygen, and strontium in formation waters has been developed that overcomes many of the problems with previous methods.
An ongoing sampling program has collected several thousand samples from producing wells and drillstem tests, initially in the Williston Basin (Canada-USA) and more recently in the Alberta Basin. These data have led to the creation of an isotopic database of formation waters that has enabled the use of isotopic fingerprinting techniques in a variety of exploration and production operations, including:
1) During drillstem testing and swabbing operations to determine if
the recovered fluid is formation water, and hence the validity of collected fluid sample(s).
2) As a production monitoring tool, to determine if produced fluids are originating in the perforated zone (versus ‘leaking’ into the wellbore from other formations). Repairing wells producing “out of zone” water can extend their life.
3) As an aid to exploration, by enhancing understanding of reservoir continuity.
These techniques are relatively fast and inexpensive, and have proven very useful to the petroleum industry.
BIOGRAPHY
Ben Rostron is an Associate Professor in the Department of Earth and Atmospheric Sciences at the University of Alberta. He has a B.Sc. in Geological Engineering (Waterloo), and an M.Sc. and Ph.D. in Geology (Alberta). His research is focused on mapping and numerical simulation, of the large-scale movement of subsurface fluids (oil, gas, water) in geologic basins.
Rostron is a member of CSPG, AAPG, and GSA and is registered as a P.Eng. / P.Geol. with APEGGA and APEGS.


SPEAKER
Dr. John Harper
Harper Consulting International Inc.
11:30 am
t hursday, s eptember 24, 2009 telus convention centre c algary, a lberta
Please note: the cut-off date for ticket sales is 1:00 pm, monday, september 21, 2009. csPg member ticket Price: $38.00 + gst. non-member ticket Price: $45.00 + gst.
Due to the recent popularity of talks, we strongly suggest purchasing tickets early, as we cannot guarantee seats will be available on the cut-off date.
Did you know that you can book a table for the Technical Luncheons? To book your company’s table, or to buy individual tickets, visit www.cspg.org.
Avalanches! The word conjures up images quite familiar to Canadians in winter, especially those in mountainous regions, although avalanches occur wherever snow can build up an accumulation. In reality, in geologic terms, avalanches are turbidity currents, and their deposits are snow turbidites. Avalanches are all about the instability of snow sediment overload. Instability occurs as a result of snow overloading on steepened slopes on which there occur defined slide surfaces. Sediment overload is the result of heavy snowfall or wind loading (cornices are generally in evidence). Slope angles corresponding to instability range from about 30° to 50°. At higher angles, it is difficult for the snow to accumulate and hold. At lower angles, the snow stabilises very rapidly and holds in place. Interestingly a slope angle of 18° is considered steep by most skiers. Doubleblack runs tend to be in the high 20°s and steeper. Defined slide detachment surfaces result from extended periods of freeze and thaw, or rain and freeze, or sun melt and freeze.
Comparisons with modern deep-sea slides and slumps are presented which identify identical avalanche morphologies of fracture
lines, slide scars, flow valleys, and runout fans. The main difference is scale. Whereas avalanches tend to run less than a kilometre, but occasionally can go much further, deepsea slumps set off huge gravity mass flows, which in the case of the Bengal Fan can run as far as 2000 km. The end products are similar in many cases; being debris flows, slab avalanches or slides, sluffs, channelized deposits, leveed margins, distal fans, meandering channels, and spillover lobes.
To watch an avalanche is to see a flume study in motion. The huge plume reacts in air as it does in flume water studies. The internal motion of the plume is identical to that seen in the water versions. The slide initiates at an uppermost fracture line of varying height depending on how much of the sediment load is involved, whether it is only a surface slide or it fractures to the underlying ground. In the latter case significant volumes of rock can become incorporated; so much so that geologic studies after melt have tried to characterize the fabric, texture, and bed-stacking relationships of the sediments. Almost instantaneously, after the fracture line initiates, a huge area downslope of the fracture detaches and the deposit begins to move as a mass of snow blocks of all sizes, loose snow, maybe rocks, and trees, and too often humans and their skis or snowmobiles, down the chutes and bowls, over the rock cliffs, and channelized around bends. The front of the flow begins to mix with the air, thereby creating the plume. Flow lobes race and spurt out in front of the main flow, picking up and incorporating downslope snow in the avalanche’s body. Velocities can reach as high as 200 km/hour. Outer bends, base of slope fans, and accumulation lows are where the bodies commonly are deposited. As the flow begins to slow, it fans into its proximal and distal portions that are commonly defined by channels and levees, just as are the marine equivalents.
Once caught in the mass flow, unless trapped at the margin, there is absolutely no chance of escaping other than trying to keep as near to the surface as possible by swimming with the current. Mouth and nose become filled with snow in an instant – almost before the individual is aware of what has happened. Every attempt has to be made to retain one’s senses, to hold one’s breath, keep one’s mouth closed, protect the face, and to preserve an air pocket once the avalanche “quick phases,” whereby it essentially converts to a rigid immoveable mass as the finer-grained snow metamorphoses and freezes. Once having been entombed, the
trapped individual suffocates from either the packed snow or the subsequent ice mask which forms as exhaled air melts the surface of the pocket and then freezes.
Recognition of conditions and potential dangers (risk analysis is something to which we are accustomed) can be addressed at many levels from Google imagery to use of Canadian Avalanche Association area reports to Alberta Environment snowfall (snow pillow) records to use of the “Avaluator” to awareness of local conditions and to analysis of snow pits. Training courses and the purchase of appropriate rescue equipment is imperative. Of course once it is necessary for you to have to use the equipment it almost too late anyway. So the best advice is to exercise restraint in exuberant situations and not become a victim. In a risk sense the equipment is necessary “once you get on the curve.” The trick is to avoid getting on the curve!
I would like to extend my thanks to the producers of the avalanche film “The Fine Line” which won awards at the Banff film festival, and for which they gave permission for use of the leader I use to introduce this talk. The film which is a superb training tool can be purchased at www. rockymountainsherpas.com, or at MEC here in Calgary for nominal cost, as can the “Avaluator.”
John D. Harper, PhD, P. Geol., FGSA, FGAC: previously Senior Geological Advisor, ConocoPhillips Canada Ltd.; Retired Full Professor, Petroleum Geology, and the first Director of the Centre for Earth Resources Research at Memorial University of Newfoundland to Jan 1, 1998, and Adjunct Professor to 2002; formerly with Shell Development, Shell Oil, Shell Canada, and Trend Exploration. He has operational, management, and research credentials over the past 38 years in reservoir characterization and basin analysis for Canadian, US, and International onshore and offshore basins.
For 40 years Harper was a member of the Canadian Ski Patrol System and related organizations (National Ski Patrol System, Ventura County Sheriff’s Search and Rescue, Rhode Island Civil Air Patrol rescue training) holding a variety of positions from Patroller to Instructor to National VP – Training. He has held courses in Winter Survival for the Newfoundland and Labrador Junior Forest Ranger Instructors.
SPEAKER
John Spray Planetary and Space Science Centre University of New Brunswick
11:30 am tuesday, october 13, 2009 telus convention centre, calgary, alberta
Please note: the cut-off date for ticket sales is 1:00 pm, Wednesday, october 7, 2009. csPg member ticket Price: $38.00 + gst. non-member ticket Price: $45.00 + gst.
In the last 25 years we have come to appreciate that Earth has been bombarded by asteroids and comets throughout its history, just like the other planets in our solar system. We can be forgiven for thinking otherwise, as was the case, because plate tectonics, weathering, volcanic activity, and sedimentation have conspired to erase most of our planet’s cratering record. Unlike the Moon and Mercury, the surfaces of which are saturated in craters, and Mars, which has over 40,000 named craters, Earth only has some 175 proven impact structures.
Nevertheless, impact has affected the evolution of our planet, especially in terms of its formation and first 500 million years of activity. Impact has also exerted controls on life, and the development of economic deposits. Impact craters have provided us with exceptional metal deposits, facilitated giant hydro-electric schemes, and generated major oil and gas deposits. We will explore the positive and
SPEAKER
Stephen T. Johnston
School of Earth and Ocean Sciences, University of Victoria
11:30 am
tuesday, october 27, 2009 telus convention centre, calgary, a lberta
Please note: the cut-off date for ticket sales is 1:00 pm, thursday, october 22, 2009. csPg member ticket Price: $38.00 + gst non-member ticket Price: $45.00 + gst.
A long-standing myth regarding the tectonic evolution of the Cordilleran Orogen is that terrane accretion gave rise to the Rocky Mountain fold and thrust belt. The basis for the myth lies in the presence of accreted oceanic terranes, including arc, back-arc basin and forearc, and accretionary prism assemblages,
within the hinterland of the orogen. The oceanic assemblages were emplaced eastward over continental lithosphere in the latest Triassic / earliest Jurassic. Accretion was thick-skinned, resulting in doubling of the crust and ultra-high pressure metamorphism. Extensional collapse and exhumation of the meta-plutonic roots of the orogen was complete by the Middle Jurassic. It is commonly but incorrectly assumed that terrane accretion is linked to and was responsible for the >250 km of thin-skinned shortening recorded in the Rocky Mountain fold and thrust belt. However, fold and thrust belt formation initiated after 80 Ma, more than 100 Ma after terrane accretion.
Terrane accretion, crustal thickening, and subsequent exhumation all went unnoticed by authochthonous western North America, which remained a passive margin that faced west toward a deep and wide ocean characterized by upwelling of cold ocean currents until 152 Ma. At the time of initiation of crustal shortening in the Rocky Mountains, the lithosphere bearing the accreted oceanic terranes was within a northward translating plate located west of North American, and >2000 km to the south. Cessation of Rocky Mountain shortening was coincident with the final docking of the northward translating hinterland lithosphere in its current location relative to the foreland. The Rocky Mountain fold and thrust belt is
negative effects of impact, all with an eye for the future and how we might deal with the threat of a large asteroid hitting Earth and destroying our society as we know it.
BIOGRAPHY
Dr. John Spray is Director of the Planetary and Space Science Centre at the University of New Brunswick and manages a research team of 15 people, which includes research scientists, graduate and undergraduate students, and staff. The team’s research activities focus on investigating planetary materials, frictional melting, impact cratering mechanics, the geology of the Moon and Mars, and processes associated with hypervelocity impact and shock effects.
Spray received his B.Sc. in Geology from Cardiff University (Wales) and his Ph.D. in Earth Sciences from Cambridge University (England). He joined the faculty of the University of New Brunswick in 1986 where he now holds the Canada Research Chair in Planetary Materials and is a co-investigator on science teams for NASA’s Mars Science Laboratory and the European Space Agency’s ExoMars rover missions.
sponsored by
not a product of terrane accretion; it is the result of a Late Cretaceous transpressional continental collision. A necessary corollary of a collisional model for the Rocky Mountains is that the continental crust and lithosphere underpinning the oceanic terranes, including the entire Omineca belt, is exotic with respect to North America, and that terrane accretion resulted from tectonic interactions that did not directly involve the North American plate.
Stephen T. Johnston graduated with a B.Sc. in Geology from McGill University and completed a M.Sc. and Ph.D. at the University of Alberta in structural geology and tectonics. He has worked in exploration and development for Shell Canada Ltd., as a project geologist for the Yukon Geological survey, and as a professor at the University of Durban, South Africa. He has been the Professor of Structural Geology and Tectonics at the School of Earth and Ocean Sciences at the University of Victoria since 1999. Johnston was the Fondation Herbrette Professor of Science at the University of Lausanne, Switzerland in 2005; the Profesor Visitante at the University of Salamanca, Spain in 2008; and the featured geologist in the 2007 CBC episode of the Nature of Things: Geologic Journey on The Rockies. He is the Secretary of the Canadian Geoscience Foundation, the editor of GSA Today, and the Vice-President of the Geological Association of Canada.

SPEAKER
Peter B. Jones International Tectonic Consultants Ltd.
CO-AUTHOR
David Clark
12:00 n oon
Wednesday, s eptember 16, 2009 conocoPhillips a mphitheatre, 3rd Floor West e nd of g ulf c anada s quare 401 – 9th avenue s .W., c algary, a lberta
The Hampshire Basin is a topographic depression in southern England, some 3,500 km 2 in area. It extends about 140 km from west to east and up to 40 km from north to south. Geologically it is a half-graben, with normal faulting along its north edge and the Purbeck monocline forming a hanging wall rollover fold along the south edge. Starting in the nineteenth century, the structural history of the region had been described in terms of midCretaceous rifting followed by Tertiary
(Alpine) compression. The 1973 discovery of the Wytch Farm oilfield in Mesozoic sediments provided well and seismic data leading to a new model for the evolution of the area through the mechanism of inversion tectonics. That model postulated Cretaceous rifting with normal faults that became inverted during the Tertiary to form supposedly Alpine-related folds and reverse and thrust faults.
Our study supports neither the original interpretation nor the inversion tectonic model. There is no evidence for compressive folding and repetition in the shallow basin section, nor evidence that Cretaceous normal faults in the deeper reservoir section became reactivated and inverted in the Tertiary to form “Alpine” compressional structures in the shallow section. Instead, we propose that the present-day structure is a result of large-scale, sub-horizontal southward movements along blind beddingplane detachments in over-pressured and mobile Upper Cretaceous and Jurassic clays and Triassic salt, with emphasis on the vital role of the Upper Cretaceous Gault Clay as a lubricant for large-scale bedding-plane slippage. This mechanism is consistent with a structural model of Miocene or later extension, driven by southward gravity collapse along blind detachment faults, a process proved through marine seismic profiles of large-scale gravity collapse structures along the continental margins edges of the equatorial Atlantic Ocean.
Removal of “Alpine” deformation implicit in older versions of the structural evolution of the Hampshire basin suggests that its development can be related to the catastrophic opening of the English Channel, some 450,000 years ago. The conclusions of this study radically alter
earlier views of the Wytch Farm and regional petroleum system, suggesting the need for detailed review of burial history, hydrocarbon maturation, and migration, which will lead to renewed exploration.
BIOGRAPHY
Peter Jones (B.Sc., F. G. S., FGSA, P. Geol., Academician of Russian Academy of Natural Sciences) is a consulting geologist, specializing in petroleum exploration in areas of complex structures and deformed belts.
Jones formed International Tectonic Consultants Ltd. in 1980 to specialize in petroleum exploration in areas of complex structures, primarily associated with thrust and fold belts. He has worked all over the world including the U.S.A., UK, Former Soviet Union, China, the Far East, and South America.
INFORMATION
There is no charge. Please bring your lunch. The facilities for the talk are provided complimentary of ConocoPhillips Canada and refreshments by Geochemtech Inc.
Structural Division Information
If you are interested in joining the Structural Division e-mail listing which currently provides luncheon reminders and a few other notices of interest to the structural community, if you care to suggest a technical topic or present a talk to the division, or if you have a field trip idea, please contact Darcie Greggs at (403) 691-3111 or darcie.greggs@shell.com.
International Division
For further information or if you would like to give a talk, please contact Bob Potter at (403) 863-9738 or ropotter@telusplanet.net or Trent Rehill at (403) 606-6717 or trehill@ kulczykoil.ca.
7:30-9:30 P m Friday, s eptember 18th, 2009 m ount r oyal c ollege, r oom B108
The Alberta Palaeontological Society (APS) welcomes CSPG members, families, and the general public to their Open House and Fossil Clinic. APS members and guests will have specimens on display and resident experts will be on hand to help identify fossils that are brought in to the clinic. Fossils found on the summer’s field trips and expeditions will also be presented and discussed.
This event is jointly presented by the Alberta Palaeontological Society, Mount Royal College, and the CSPG Palaeontology Division. For details or to present a talk in the future, please contact CSPG Palaeontology Division Chair Philip Benham at (403) 691-3343 or programs@albertapaleo. org. Visit the APS website for confirmation of event times and upcoming speakers: http:// www.albertapaleo.org/.

Win $2,500.00 and a framed certificate; and a one-year membership with the CSPG for: the Doctoral thesis that makes the most significant contribution to Canadian sedimentary geology in 2009.
Win $2,000.00 and a framed certificate; and a one-year membership with the CSPG for: the Master’s thesis that makes the most significant contribution to Canadian sedimentary geology in 2009.
Winning thesis topics in recent years have included: detailed integrated studies of the Falher, Paddy, and
Dunvegan; structural re-interpretation of the Livingston Range anticlinorium; a stratigraphic re-interpretation of the Alexandra Reef Complex, which has lead to new insights into the nature of Devonian reefs; new thoughts about the classic Carboniferous section at Joggins, Nova Scotia; and a detailed sedimentologic study on the Upper Kaza group of the Windermere Supergroup.
Deadline for submissions is September 18, 2009 Submitted theses will be returned in late January 2010 after judging.

Eligible theses are either produced in a Canadian university, regardless of project location, or deal with a Canadian sedimentary/petroleum geology topic, regardless of the university of origin. Theses entered for the 2009 awards must have been submitted to a recognized university inside or outside Canada, and must have formed part of the requirements for degrees awarded at the Fall 2008 or Spring 2009 convocations. Candidate theses must be well written, clearly and adequately illustrated, and properly bound.
PLEASE SEND ThESiS SubmiSSioNS for juDgiNg To: Canadian Society of Petroleum Geologists (CSPG) Graduate Thesis Awards Committee c/o Andre Chow Pengrowth Corporation 2100, 222 – 3rd Avenue SW Calgary, AB T2P 0S4
Phone: (403) 213-3713 • Fax: (403) 234-6886
Email: Andre.Chow@pengrowth.com
Proud Sponsor of the CSPG Graduate and Undergraduate Theses Awards.
C. Willem Langenberg Long Mountain Research
Tijmen (Tim) Hartel Suncor Energy Inc.
saturday, september 26, 2009 the rise and Fall of turtle mountain southern alberta Foothills
The Turtle Mountain Anticline is a modified fault-propagation fold, formed by folding and thrusting, which resulted in an east-verging anticline with an overturned forelimb of competent Paleozoic carbonates, with softer Mesozoic shales, sandstone, and coal below and in front of it. Subsequent uplift and differential
erosion created a very steep slope which eventually collapsed in April 1903. The resulting rock slide destroyed the southern edge of the town of Frank; hence its name: “The Frank Slide.” Many combinations of factors have been proposed as a possible trigger for the Frank Slide: slope angles with respect to bedding and/or joint
surfaces, the weather, footwall erosion, earthquakes, and coal mining.
The main destination will be a short but steep hike halfway up to “North Peak” to a splay of the Turtle Mountain Thrust. Participants will have to be in good physical condition and willing to get wet feet (river crossing involved – bring old sneakers and dry socks!). Furthermore we will visit a reference section of the Mount Head formation and the Frank Slide boulder field, which contains Mississippian carbonates with layer-parallel chert bands, offset by centimeter-scale ‘normal faults’ (see photo).
The group will leave Calgary on the evening of Friday September 25, and overnight in Blairmore (~210km drive). We will have a full day in the field on Saturday September 26, and return to Calgary that evening. Participants only have to cover their own food (breakfast / lunch) and the hotel cost on Friday night. The group will be limited to 25 CSPG members. If you would like to participate in this field trip, please e-mail Jean Chatellier at JChatellier@talismanenergy.com.
SPEAKER
David L. Garner Chevron Canada Resources Ltd.
CO-AUTHORS
Paul Broughton and Amanda Woo Chevron
Canada Resources Ltd.
12:00 noon monday, september 28, 2009
conocoPhillips auditorium, 3rd Floor 401 9th ave sW, calgary, a lberta
The McMurray Formation in the Athabasca basin varies from a fluvio-estuarine to a shoreface shelf deposit with areas of marine and tide-dominated influence. Prior to geomodeling, a 1D electrofacies model was developed using core description and co-located well logs, and subsequently applied to all well logs in the field area. The electrofacies represent a link to the depositional description, to reservoir quality, and are useful 1D characterizations of heterogeneity for conditioning the geostatistical models.
Detailed core facies descriptions provide the training data for discriminant analysis and are used as an interpretive guide for mode mapping. Initially, a non-supervised method with rules was used to clean core facies inputs, followed by a non-parametric supervised method to probabilistically assign facies to logs such as gamma ray, neutron, density, and effective porosity.
Discriminant methods assume input data accuracy, although the data types are imperfect due to facies interpretation, depth shifts, and measurement scale differences between logs and cores. To screen and compare models, direct and cross validations are useful to check the prediction of the input training data. The 1D model results are checked to ensure a consistent reproduction of input facies proportions after assignment to all the logs. Assignment probabilities are initially equi-probable and are adjusted to weigh facies toward high or low proportions. The electrofacies models are non-unique and require visual checking. Critical interpretive assessment of the electrofacies results by
the geologist is an important step. The result ensures the electro-facies model supplies distinctly useful facies heterogeneity and associated petrophysical model.
The subsurface team uses electrofacies for seismic attribute studies, core analysis, 3D geological modeling, and engineering rock types accounting for capillarity and saturation endpoints. An effective 1D facies model can enhance the results of the broad subsurface effort. These classification techniques can generally be applied to many geological settings.
Facies curves are used as the 1D conditioning data for 3D facies geological models. Studies assume the 1D facies are hard data for the purposes of data analysis and integration of external data with facies. It behooves us to be vigilant in choosing a 1D facies model and understand the impact on our subsequent efforts. The facies modeler provides the first stage of capturing geological heterogeneity for static models and simulation studies. The 1D Facies model is used for 3D model parameterization to introduce useful variations in reservoir properties. Static facies are related to rock types in the dynamic simulator. The benefit is to provide the ability to apply reservoir concepts of capilarity, relative permeabilities, thermal properties, or geomechanical effects – all by rock type.
Practitioners from different disciplines define the facies variable from their viewpoints. Among the examples are lithofacies, electrofacies, petrofacies, rock types, depostitional facies, ichnofacies, and lithotypes.The terms overlap in meaning and context. For the integrated reservoir team and for modeling purposes, these terms refer to the 1D facies-type curve data that begins the 3D modeling.
To develop the electrofacies model from logs and core using statistical classification methods, there are database choices, quality checks, and data assumptions to be assessed. Described facies can be grouped based on similar reservoir properties, or they may be kept separate where there is location dependence. Understanding assumptions and limitations can act as a guide for data selection, lumping, splitting and cleaning. Communication among the subsurface team members can ensure the electrofacies model provides the best use of facies information to constrain reservoir property spatial
distributions. Checks are performed on the electrofacies model results. Combined with a stratigraphic-structural interpretation, the modeler captures key reservoir elements in the 3D layering. Combined with seismic attributes as discrete bivariate distributions, the facies proportion trends can be further constrained in the interwell space.
Davis, John. 1986. Statistics and Data Analysis in Geology, 2nd Edition, New York, John Wiley & Sons, 646 p.
Garner, D. 2006. Strategies for Effective Geomodeling for Thermal Recovery in Oilsands. Presented at the Canadian Heavy Oil Association (CHOA) Beer and Chat, October 26. (Presentation available on the CHOA website)
Nivelet, P., Fornier, F., and Royer, J. J. 2001. Propagating Interval Uncertainties In Supervised Pattern Recognition for Reservoir Characterization. SPE 71327, presented at the SPE Annual Technical Conference and Exhibition, New Orleans, USA, 30 September-3 October.
ACKNOw LEDGEMENTS
The authors would like to acknowledge and thank Chevron Canada Resources, Shell Canada, and Marathon Canada for supporting this work; Geovariances for Isatis Software support; and Beicip-Franlab/IFP for Easytrace Software support.
BIOGRAPHY
David Garner is a Senior Advisor for Geological Modeling at Chevron Canada Resources. Previously, he worked for ConocoPhillips Canada. For TerraMod Consulting he worked on a variety of international reservoir studies and offered geostatistics training courses. He holds two geophysics degrees, a B.Sc. from Washington and Lee University and an M.Sc. from Cornell University. He received a Citation in Geostatistics from the University of Alberta. Garner is the current CSPG Finance Director and a member of the Geomodeling Technical Division committee.
There is no charge for the division talk, and we welcome non-members of the CSPG. Please bring your lunch. For details or to present a talk in the future, please contact Weishan Ren at (403) 233-3428, e-mail: weishan.ren@ conocophillips.com.
SPEAKER
Rob Vestrum Thrust Belt Imaging
12:00 noon thursday, october 8, 2009 room LPW-910, Livingston Place West 250 2nd st sW, calgary, a lberta
The objective of the depth imaging was to confirm the existence of the structure in

depth, improving the image and obtaining more accurate positioning of the events for an appropriate well trajectory.
We used a collaborative, geologically constrained approach that integrates all available geologic information into the interpretation of the seismic velocity model. Close collaboration between the exploration geologist and the service-company geophysicist found a velocity model that optimized the seismic imaging. This area has interbedded siliciclastic rocks with high dips and vertical and lateral velocity contrasts, giving a considerable lateral movement in the images in depth when we correct for seismic anisotropy and lateral-velocity heterogeneity.
The final anisotropic-depth-migrated image confirms the structure and moves the imaged structured to the east compared to the time image. The position of the structure and dips were confirmed by two wells drilled in the area, which verifies the accuracy of the interpretive model-building process in this complex-structured area.
Rob Vestrum received a B.Sc., Geophysics (1992) from the University of Alberta, and M.Sc. (1994) and Ph.D. (2003) degrees from the University of Calgary. He initiated foothills anisotropic depth migration at Shell in 1996, Kelman in 1997, and at Veritas in 2001.
Vestrum’s depth-imaging project experience covers the Western Canada foothills, the Californian thrust belt, the South American Andes, and Central Asia. Recognition of Vestrum’s pioneering work in TTI anisotropic imaging includes the John Kendall Doctoral Thesis Award from the Faculty of Science at the University of Calgary, and the SEG’s J. Clarence Karcher Award for significant contributions to science by a young Geophysicist.

Alberta’s Professional Geoscientists and Engineers provide Albertans with many of the essentials of daily living. The work that they do allows all of us to enjoy warmth, light, power, water and the ability to travel and communicate over distance.
Since 1920, Members of APEGGA, The Association of Professional Engineers, Geologists and Geophysicists of Alberta, have made a difference in the daily lives of millions of Albertans by bringing science and innovation to life.
The P.Geol., P.Geoph., P.Eng., and R.P.T. professional designations represent the highest standards of quality, professionalism and ethics in geoscience and engineering. APEGGA Members can take pride in the role they play and the contribution they make to Alberta.
APEGGA and its over 55,000 Members are committed to public safety and well-being through the self-regulation of the geoscience and engineering professions in Alberta.
Visit www.apegga.org for more information.
Geologists Geophysicists Engineers
| by Ashton Embry
The delineation and correlation of sequence stratigraphic surfaces allows one to build an approximate time stratigraphic framework, which is essential for determining facies relationships. This is perhaps the primary use of sequence stratigraphy and it was described in the last article of this series (Embry, 2009). Once the sequence stratigraphic framework has been established and the facies relationships resolved, the depositional history of the succession can be interpreted in terms of base level changes because the sequence stratigraphic surfaces were generated by changes in base level as discussed in Embry (2008).
For example, the recognition and correlation of a subaerial unconformity allows one to interpret that a base level fall occurred over the entire extent of the unconformity. If an unconformable shoreline ravinement is mapped, it leads to the interpretation that the area underwent base level fall followed by a rapid base level rise. Thus a sequence stratigraphic correlation framework not
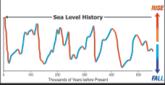
Figure 1. Eustatic sea level curve for the past 500 kyr based on oxygen isotopes. The eustatically driven, base-level cycles are about 100 kyr-long and have long intervals of base level fall and short intervals of rise.
only allows the facies relationships to be established but it also provides a means of interpreting depositional history in terms of base level movements. When interpretations of base level changes are made, it is also worthwhile to try to determine which external factor was responsible for the recognized base level changes. This will enhance the understanding of the depositional history of the succession and will improve predictions of facies distributions and potential stratigraphic traps.
Three, external (allogenic) factors –tectonics, sea level (eustasy), and climate – have the potential to drive changes in base level as was first described by Barrell (1917) (see also Embry, 2008, in press). An important question regarding the base level history of a given sequence is “Which of the three variables was the main driver of the base level transit cycle recorded by that sequence?” Climate change tends to result in local, minor base level changes and is not a viable driver for any sequence of regional extent and / or large magnitude. Consequently this factor is not considered further herein.
Both tectonic activity and eustasy are potentially viable drivers for sequence development at any scale. It is always reasonable to ask if the subaerial unconformities and / or unconformable shoreline ravinements which bound a given sequence on the basin flanks were the product of tectonic uplift followed
(Continued on page 18...)
Wednesday, September 16, 2009 at 6 pm SHARP
Race is capped at 200 participants, so register early to avoid disappointment!
Registration Deadline is 4:00 pm, Friday, September 11, 2009
NEW THIS YEAR: 5 KM RUN AND CHIP TIMING.
For more information or to register, visit www.cspg.org, select Events in the menu bar and follow the path to 10K Road Race and Fun Run registration.
RACE PACKAGE PICKUP: Saturday, September 12
Monday, September 14
Tuesday, September 15 12-2 pm 11:45 am - 1:15 pm 11:45 am - 1:15 pm
Gord’s Running Store Eau Claire YMCA Eau Claire YMCA 919 Centre Street NW
There will be no race day package pick up. Please no dogs or strollers.
Race The race begins and ends at the Eau Claire YMCA, and is an out Course: and back route along the Bow River pathway. There is a 75-minute
Prizes: All participants receive a commemorative t-shirt. Awards will be given to the 10 km category only. Join us after the race at Quincy’s on Seventh (609- 7 Ave. SW) for our post-race Pizza and Beer Party; we will have lots of great prizes!
Cost: Members (CSPG/CSEG/CAPL): $35
Non-Members: $45 Student: $25
Extra meal tickets: $20

by collapse or were generated by eustatic fall followed by rise.
The debate of whether tectonics or eustasy is the main driver of the base level changes recorded by sequence stratigraphic surfaces has been going on since the surfaces were recognized in the 19th century. The debate got quite heated in the 1930s when the origin of Pennsylvanian cyclothems (synonymous with depositional sequences) was considered (Weller, 1930; Wanless and Shepard, 1936). The interpretation that these small-scale, depositional sequences were generated by eustasy driven by the waxing and waning of Gondwana glaciers is now widely accepted (e.g., Heckel, 1986).
Sloss et al. (1949) defined the term sequence for very large-magnitude units with bounding unconformities that stretched over most of the North American continent. Sloss (1963) clearly demonstrated that such unconformities were tectonic in origin. In 1977, when Exxon scientists published their revolutionary papers on seismic / sequence stratigraphy (Vail et al., 1977), eustasy was appealed to as the main factor for generating all sequences, large and small. This interpretation was based mainly on the observations that the same age sequences occurred on different continental margins.
Some researchers now simply assume that eustasy is responsible for all sequence boundaries and have published sea level curves for parts or all of the Phanerozoic on the basis of this assumption and on scattered observations around the world (Haq et al., 1987; Hardenbol et al., 1998; Miller et al., 2005; Haq and Schutter, 2008). The validity of such curves is highly questionable given the great uncertainty of the underlying assumption, not to mention the limited observations. Below, both eustatic and tectonic mechanisms for sequence boundary generation are discussed. Also, suggestions are offered for how one can distinguish a tectonically generated sequence boundary from a eustatically driven one.
There can no doubt that in some cases eustasy is the main factor in sequence generation. Given that sequence-bounding unconformities are generated over relatively short intervals of time regardless of their magnitude, the only reasonable phenomenon for creating a sequence-bounding unconformity by eustasy is through changes in sea level caused by changes in terrestrial ice volumes. Rates of tectono-eustatic change (changing volume of the ocean basins) are far too slow to generate a sequence boundary.
Ice volume-related, eustatic changes are well documented and are due mainly to climate cycles driven by changes in orbital parameters, the so-called Milankovitch cycles (Hays et
al., 1976). There are three main types of Milankovitch cycles and each has a characteristic periodicity – precession of the equinoxes (~ 20 kyr), axis tilt or obliquity (~ 40 kyr), and orbit eccentricity (100 kyr and 400 kyr). It would appear that such climate-driven cycles have operated on Earth at least from Proterozoic onward (Grotzinger, 1986). Amplitudes of sea level changes associated with these cycles have varied from over 100 metres when extensive glaciers were present in both hemispheres (e.g., Pleistocene) to perhaps 10 metres or less when only mountain glaciers were present (e.g., Devonian). Other climate-related factors, such as temperature-related water volume change and varying, land-based, water storage also contributed to sea level changes but were minor compared to changing ice volumes.
Figure 1 (page 17) illustrates the interpreted sea level changes over the past half million years based on oxygen isotope data. A base level transit cycle during this time was about 100 kyr long (eccentricity) and had an amplitude of about 120 metres. Note that a base level cycle during this time is dominated by a long interval of overall base level fall which is broken by a few, very short intervals of minor rise. The main interval of base level rise for each cycle comprises only about 20% of the cycle time and is characterized by relatively high rates of rise (four times faster than fall rates). The question becomes, “What observable features would be expected to characterize sequence-bounding unconformities generated by eustatically driven base level transit cycles?” First of all, in a downdip direction, the angle between the unconformity and the truncated beds would be very low, being slightly greater that the dip of the sea floor (< 1°). On strike, there would be no angularity. Secondly, there would be no change in sedimentary or tectonic regime across such an unconformity although changes in sediment composition might occur, given the possibility of new drainage systems being established.
Furthermore, given the high frequency of the eustatic cycles, sequences would be relatively thin in shelfal areas and numerous, very similar-looking sequences would be stacked upon each other. Finally, one would expect to find the same unconformities on all the basin flanks. In theory, such unconformities would potentially be correlatable worldwide but, as Miall (1991) has elegantly demonstrated, the lack of precision of dating techniques prevents the reliable correlation of high frequency, eustasy-driven sequence boundaries from one basin to another.
It must be noted that a few authors (e.g., Miller et al., 2003) have postulated that rare
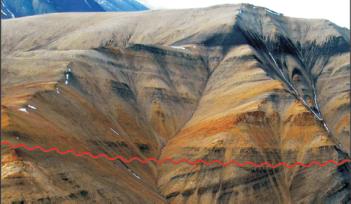
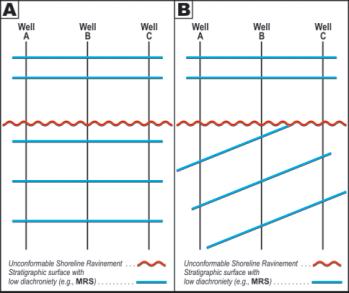
Figure 4. The “tilt-test” for an unconformity (Embry, 1997, p.418). Such a stratigraphic geometry test is best done in areas of similar subsidence rate so as to eliminate geometric effects of differential subsidence. A possible eustatically driven unconformity is illustrated in Figure 4A. The sequence stratigraphic surfaces both above and below the unconformity parallel both each other and the unconformity. In this case, base level fall was equal at all localities which would fit a eustatic origin, although a tectonic one cannot be ruled out.
In Figure 4B, the stratigraphic surfaces below the unconformity parallel each other (equal subsidence rate) but are at a substantial angle to the unconformity (differential uplift). The stratigraphic surfaces above the unconformity are parallel to the unconformity and to each other (equal subsidence rate restored). Such stratal geometries can only be generated by tectonics and thus the demonstration of such geometries provides excellent evidence for the occurrence of a tectonically generated unconformity (e.g., Figure 3).
The unconformity (unconformable shoreline ravinement,
unconformities would exhibit the first two criteria mentioned above but closely spaced unconformities would not be expected.
There are numerous examples of sequences which exhibit the above characteristics in the literature and their eustatic origin is widely accepted. For the most part, they are high frequency sequences found in successions deposited during “Icehouse” conditions of the Carboniferous – Early Permian and Late Paleogene – Recent. Parasequences and highfrequency, low-magnitude sequences, which characterize successions deposited during “Greenhouse” intervals also may well be the product of eustasy-driven base level change as evidenced by their boundary characteristics. However, as demonstrated by Catuneanu et al. (1997), not all high-frequency, low-magnitude sequences are of eustatic origin. Finally, some low-frequency, large-magnitude sequence boundaries in Greenhouse successions may also be of eustatic origin (Miller et al., 2003) but this interpretation is still very much open to debate.
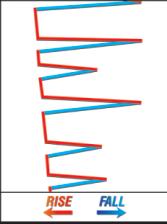
Tectonics also provides a viable mechanism for the generation of sequences. However, unlike eustasy, we don’t have a reliable, actualistic curve shape for a tectonically driven, base-level cycle. I suggest that tectonic activity at various scales would be similar to faulting (i.e., fractal relationship) with short intervals of intense activity separated by long intervals of quiescence. Figure 2 illustrates a tectonically driven curve based on this model of tectonism. The curve consists predominantly of relatively long intervals of base level rise (80+% of the time) which characterize the times of relative quiescence. It is punctuated by relatively short intervals of tectonic uplift followed by tectonic collapse which represent the times of greatly increased tectonic activity. Such a model is empirically supported by observations on the stratigraphic geometries of low-order, Mesozoic sequences of the Sverdrup Basin (Embry, 1990) as well as by the work of (Gawthorpe et al., 1994 and 2003) on faultdriven, base-level changes in rift basins.
the
and Middle Triassic successions marks a major change in both subsidence rate and sedimentary regime. These characteristics point to a tectonic origin for the unconformity.
intervals of substantial glaciation may have occurred during Greenhouse times (e.g., midPermian – Early Paleogene). Such infrequent glacial intervals would be responsible for
the occurrence of sporadic unconformities which record base level falls of up to 60 m. This is an intriguing hypothesis that needs to be properly tested. In these cases, such
Large, low-frequency, tectonically driven, base-level changes would generate widely spaced, large-magnitude (low-order) sequence boundaries overlain by a thin interval of transgressive strata deposited during the collapse phase and overlain by thick intervals of prograding strata deposited during slow base-level rise related to thermally driven subsidence. However, it must be noted, tectonic activity can occur on a variety of scales and thus it is possible for high-frequency, tectonically driven sequence boundaries to be developed in tectonically active settings such as foreland basins (e.g.,
(Continued on
Catuneanu et al., 1997; Plint, 2000) and rift basins (e.g., Gawthorpe et al., 1994).
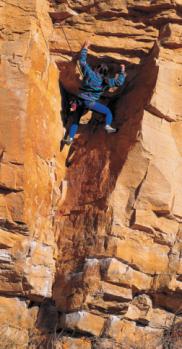
Once again, the over-riding question becomes “What are the characteristics of tectonically driven sequence boundaries that would allow them to be reliably distinguished from eustasy-driven ones?” Perhaps the most reliable indicator for recognizing a tectonically generated unconformity is the presence of substantial angularity between the unconformity and underlying sequence stratigraphic surfaces. Figure 3 (page 18) illustrates an outcrop example of such an angular unconformity which was undoubtedly generated by tectonic uplift as opposed to sea level fall. Such angularity beneath an unconformity can be demonstrated in subsurface successions with seismic and closely spaced well data (e.g., Embry, 1997, figure 6; Dixon, 2009, figure 31). In general, anytime an angularity of a few degrees or more can be determined beneath an unconformity (SU, SR-U), especially over an area of little to no differential subsidence, there can be little doubt as to the tectonic origin of the unconformity (Figure 4, page 19).
Other characteristics of a depositional sequence boundary that indicate it was generated by tectonics are:
• There are major changes in depositional regime across the boundary.
• There are major changes in sediment composition and direction of source areas across the boundary.
• There are significant changes in tectonic regime and subsidence rates across the boundary.
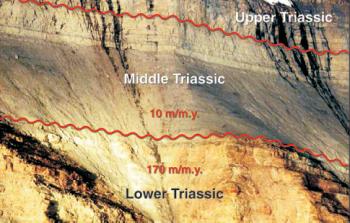
Figure 5 (page 18) illustrates Lower to Upper Triassic strata on the flank of the Sverdrup
Basin of Arctic Canada. A large magnitude (2nd-order) unconformity separates the Lower and Middle Triassic strata (Embry, 1988 and 1991) and significant changes in both depositional and tectonic regime occur across this boundary. The Lower Triassic succession consists mainly of braided stream strata and was deposited in a high subsidence regime (170 mm/myr). The overlying Middle Triassic strata consist of offshore marine shale and siltstone and were deposited under low subsidence conditions (10 m/myr). The subsidence rate decreased by more than 90% across the unconformity, a clear indication of a tectonic origin for the unconformity.
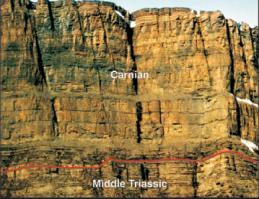
Figure 6 illustrates the sequence boundary between Middle Triassic strata below and Upper Triassic strata above. Once again this is a large magnitude boundary (2ndorder) and is interpreted to be tectonic in origin in part due to the dramatic shift in depositional regime across the boundary. The Middle Triassic strata consist of siliciclastic sandstone, siltstone, and shale whereas the overlying Upper Triassic strata consist mainly of shelf carbonates. Notably there is also a significant shift in source area across this boundary (Embry, 1988) as well as a notable change in subsidence rate.
Another unconformity of interpreted tectonic origin is illustrated in Figure 7. It separates Norian (early Late Triassic) strata from Rhaetian (late Late Triassic) strata and there is an abrupt change in sediment composition between the Norian sandstones (quartz, chert, rock fragments) and Rhaetian sandstones (highly quartzose), Furthermore, up to 500 m of Norian strata are truncated beneath the unconformity in some areas, removing any doubt as to the tectonic origin of the unconformity.
Tectonically generated depositional sequence boundaries have been commonly described in the literature beginning with the continent-wide ones of Sloss (1963, 1988). In general, it appears that most large-magnitude boundaries, which are often assigned to a 1st-, 2nd-, or 3rd-order level in a hierarchy, are tectonic in origin. In almost all cases, they exhibit two or more of the criteria listed for tectonically generated unconformities. As discussed above, smaller magnitude boundaries (4th-, 5th-, and 6th-order) are often of eustatic origin but in some cases are tectonic.
One point of contention has been that some large-magnitude unconformities that have the above-described signature of tectonic boundaries have been interpreted as being eustatic in origin because they are recognized in basins on different continents. For example, the sequence boundary which approximates the Middle / Late Triassic boundary (Figure 6) has been recognized in a number of basins around the world and consequently was interpreted to be the product of eustasy (Biddle, 1984). However, there is little doubt that this major sequence boundary is primarily the product of tectonic movements (Embry, 1997). As discussed by Sloss (1991, 1992) and Embry (1990, 1997, 2006), a reasonable case can be made for the generation of similar age, tectonically generated sequence boundaries in basins throughout the world by appealing to plate tectonic mechanisms (see also Collins and Bon, 1996). The bottom line is the boundary characteristic of occurrence in different basins throughout the world is not a valid criterion for differentiating eustatically driven sequence boundaries from tectonically generated ones.
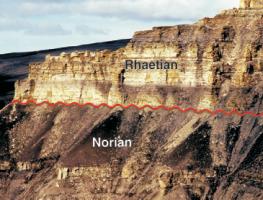
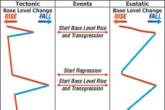
Figure 8. A comparison of a tectonically driven baselevel curve (dominated by rise with a short, fast fall) with a eustatically driven one (dominated by fall with a short, fast rise). In both cases the start of base-level rise coincides with the start of transgression because of initial high rates of rise. This results in superficial similarities between sequences generated by tectonics compared with those generated by eustasy. However, the two sequence types can be differentiated on the basis of a variety of specific characteristics (see text).
Either eustasy or tectonics can be the main forcing function for sequence boundary development. Each of these external factors has a characteristic base level curve shape (Figure 8) with tectonics being dominated by slow rise and punctuated by short intervals of rapid fall followed by rapid rise. A eustatic curve is dominated by long, slow falls and short intervals of fast rise. As illustrated on Figure 8, the start of base level rise will nearly coincide with start transgression for both driving factors and thus a eustatically generated sequence boundary will often superficially resemble a tectonically generated one.
However, a eustatically generated sequence boundary has a number of different characteristics in comparison to a tectonically driven one. It is most important to determine the degree of angularity beneath a basinflank unconformity in both dip and strike directions and to determine the amount of change, if any, in sedimentary regime, tectonic regime and sediment source area across each boundary. With such data, a reasonable and reliable interpretation of the origin of a given sequence boundary can be made. Such an interpretation can be useful for predicting facies development, stratigraphic geometries, and potential traps.
SEqUENCE STRATIGRAPHY AND PETROLEUM E XPLORATION
An important task in petroleum exploration is the construction of stratigraphic crosssections on which correlations are made and facies relationships determined. The success of a play involving the delineation of a stratigraphic trap depends on the reliability of the correlations and the subsequent facies analysis within the framework. As has been demonstrated, sequence stratigraphy involves the recognition and correlation of a variety of stratigraphic surfaces that are used to form an approximate time (chronostratigraphic) framework. These surfaces include subaerial unconformity, unconformable shoreline
ravinement, maximum regressive surface, slope onlap surface, and maximum flooding surface (Embry, 2009). A very detailed framework can be constructed with these surfaces, especially when small-scale surfaces are correlated.
A sequence stratigraphic framework is essential to guide facies analysis and one of the key objectives of such analysis is to identify porous facies that may act as petroleum reservoirs. For siliciclastics, such facies are usually sand bodies of nonmarine, shoreline, shallow shelf, and deep marine origin. Each systems tract can be seen as an approximate time stratigraphic unit that contains a variety of facies from nonmarine to deep marine. These will occur in a predictable lateral and vertical order within the systems tract. For example, if a subaerial unconformity is identified and it rests on offshore marine shale, one can predict that a potentially porous, shoreface sandstone unit lies basinward of that locality at the basinward termination of the unconformity.
Another example would be when an unconformable shoreface ravinement is identified, it can be concluded that incised valleys that preserve the subaerial unconformity and a section of mainly transgressive, non-marine strata may occur in the area. Incised valleys can contain a variety of porous facies and be completely surrounded by impermeable strata such as offshore shales. Once the facies within an incised valley are documented at one locality, predictions can be made regarding facies changes within the valley succession both landward and seaward of that locality. Of course, major base level falls that resulted in an exposed shelf edge allow a prediction of the occurrence of sand-prone slope channel fills and submarine fans in the adjacent deepmarine basin area.
Sequence analysis also helps to predict how and where porous strata pinch out laterally. Within a regressive systems tract (RST), a shoreline sandstone unit sometimes disappears landward due to truncation by the sequence bounding unconformity and pinches out basinward due to facies change to impermeable offshore shale and siltstone. Impermeable shelf strata of the overlying transgressive systems tract (TST) of the next sequence can seal such strata. Thus a fairway that has a high potential to contain porous, shoreline sandstone within a given RST can be delineated with the available control. Seismic data can be used to reveal specific prospects along the fairway.
In other cases a shoreline sandstone will pinchout landward due to facies change to impermeable coastal plain facies that can also provide a top seal. Similar fairways of
(Continued on page 22...)


Keynote 1 - Impacts Of Imports, Government Policy, And Technology On Future Natural Gas Supply. Edith Allison, Exploration Program Manager, U.S. Department of Energy
Keynote 2 - Unconventional Gas - Challenges for Pipelines and Markets Lyne Mercier, Board Member, National Energy Board
Keynote 3 - The Future Of Shale Gas In North America. Richard Moorman, Manager Strategic Analysis, Southwestern Energy Company
Conference technical sessions will focus on tight gas, shale gas and natural gas from coal and will address geology and engineering aspects of these unconventional natural gas resources. An important panel discussion will be part of the program.
Technical short courses are offered on Friday, November 20 and have been designed to compliment the conference technical sessions. Special pricing is available to conference delegates.
Short course 1 - Complex Well Analysis & Reservoir Engineering Methods for Unconventional Gas
Short course 2 - Putting it All togetherOptimizing Fracture Design
Short course 3 - Tight Gas Exploitation from a Geomechanics Perspective (Half Day)
November 18 - 20, 2009 Register before August 21 for early bird pricing REGISTER at www.csug.ca or www.csugconference.ca For information contact: e=mc2 event management inc. Toll Free: 1.866.851.3517
Phone: 403.770.2698
E-mail: conference@emc2events.com

porous, nearshore sandstone can sometimes be delineated for TSTs and, in this case, the sandstone will often pinchout landward due to onlap onto a shoreline ravinement. Such sandstone is usually well sealed by overlying shale and siltstone that were deposited as transgression progressed.
There can be no doubt that the proper interpretation of depositional facies is critical for successful exploration. The same sentiment applies to the surfaces of sequence stratigraphy and an incorrect interpretation of a given surface can lead to misdirected exploration. Often only mechanical logs are available for a sequence interpretation and in this situation an unconformable shoreline ravinement can be easily be mistaken for a maximum regressive surface and viceversa. On a gamma log, both surfaces are drawn at the change from a shallow marine, coarsening-upward succession (RST) to a shallow marine, fining-upward one (TST). If the underlying coarsening-upward succession terminates in shaly, mid-shelf sandstone, the explorationist would naturally want to locate potentially porous, shoreface sandstone in that RST. If the surface encountered in the control point is a maximum regressive surface, then a shoreface sandstone unit would occur landward of the control well. However, if the surface is an unconformable shoreline ravinement then the shoreface sandstone unit
would occur basinward of the control well, in exactly the opposite direction as was dictated by the MRS interpretation. As illustrated by this example, the correct interpretation of sequence stratigraphic surfaces is critical for exploration success.
This article wraps up the Practical Sequence Stratigraphy series, which has covered the main topics of sequence stratigraphy including historical development, the surfaces of sequence stratigraphy, the linkage between base level and sequence stratigraphic surfaces, the units of sequence stratigraphy, and more general topics of sequence hierarchies, correlation, and sequence boundary origin.
Sequence stratigraphic analysis is a core methodology in petroleum exploration. If it is applied in an objective, pragmatic manner with the use of a material-based surfaces and units, it can greatly enhance petroleum exploration and exploitation. The method involves:
• Identification of sequence stratigraphic surfaces in a succession,
• Correlation of the surfaces over the study area,
• Determination of the facies distribution within the sequence stratigraphic framework,
• Interpretation of the depositional history of the succession in terms of tectonic and/or eustatic base level changes,
• Construction of facies maps at both the approximate time of maximum regressive and the approximate time of maximum transgression for each sequence.
With the adoption of this methodology, sequence stratigraphy becomes a valuable addition to the explorationist’s tool kit.
Barrell, J. 1917. Rhythms and the measurements of geologic time. GSA Bulletin, v. 28, p. 745-904.
Biddle, K. 1984. Triassic sea level change and the LadinianCarnian stage boundary Nature, v. 308, p. 631-633.
Catuneanu, O., Sweet, A., and Miall, A. 1997. Reciprocal architecture of Bearpaw T-R sequences, uppermost Cretaceous, Western Canada Sedimentary Basin. Bulletin Canadian Petroleum Geology, v. 45, p. 75-94.
Collins, J. F. and Bon, J. 1996. Mantle origin of global sealevel fluctuations and geomagnetic reversals: evidence from non-linear dynamics. In: C. Caughey et al. (eds.), International Symposium on Sequence Stratigraphy in SE Asia. Indonesian Petroleum Society, p. 91-128.
Dixon, J. 2009. Triassic stratigraphy in the subsurface of the plains area of Dawson Creek (93P) and Charlie Lake (94A) map areas, northeast British Columbia. Geological Survey of Canada, Bulletin 595, 78 p.
Embry, A. F. 1988. Triassic sea-level changes: evidence from the Canadian Arctic Archipelago. In: C. Wilgus, B. Hastings, C. Kendall, H. Posamentier, C. Ross, and J. Van Wagoner (eds.), Sea-level changes – an integrated approach. SEPM Special Publication 42, p. 249-259.
In accordance with Article VI, subparagraph (a) of the By-Laws, the Nominating Committee hereby calls for Nominations to Stand for Election to the 2010 Executive Committee of the Canadian Society of Petroleum Geologists.
Nominations can be made in two ways:
1) Formal Nominations are to be made in writing, signed by at least twenty-five members in good standing and endorsed by the nominee who is consenting to stand for office Candidates nominated in this fashion will automatically be added to the Nomination Slate Nominations should be forwarded to the CSPG office by September 11, 2009. The slate of candidates will be published in the November Reservoir and the election will take place on December 9, 2009.
2) Informal Nominations can be made via email or letter; please confirm that the nominee is willing to stand for the office of choice and send to CSPG Office to the attention of the Past President. Candidates nominated in this fashion will be considered for addition to the Nomination Slate by the Nominations Committee.
The following vacancies exist for 2010:
• Vice President • Assistant Services Director• Assistant Communications Director
• Assistant Finance Director• Assistant Outreach Director• Communications Director*
• Assistant Program Director
Successful candidates for the Directorships will serve two-year terms and the elected Vice President, a third oneyear term as Past President. Interested parties should contact the office for details and general requirements of service on the Executive.
*1 year term
Embry, A. F. 1990. A tectonic origin for third-order depositional sequences in extensional basins implications for basin modeling. In: T. Cross (ed.), Quantitative Dynamic Stratigraphy. Prentice Hall, p. 491-502.
Embry, A. F. 1991. Mesozoic history of the Arctic Islands. In: H. Trettin, (ed.), Innuitian Orogen and Arctic Platform: Canada and Greenland: Geological Survey of Canada, Geology of Canada No. 3 (also GSA, The Geology of North America, v. E), p. 369-433.
Embry, A.F. 1997. Global sequence boundaries of the Triassic and their recognition in the Western Canada Sedimentary Basin. Bulletin Canadian Petroleum Geology, v. 45, p. 415433.
Embry, A. F. 2006. Episodic Global Tectonics: Sequence Stratigraphy Meets Plate Tectonics. GEO Expro, v. 3, p. 2630.
Embry, A. F. 2008. Practical Sequence Stratigraphy VII: The base level change model for material-based sequence stratigraphic surfaces. Canadian Society of Petroleum Geologists, Reservoir, v. 35, issue 11, p. 31-37.
Embry, A. F. 2009. Practical Sequence Stratigraphy XIV: Correlation. Canadian Society of Petroleum Geologists Reservoir, v. 36, issue 7, p 14-19.
Embry, A. F. In press. Correlating Siliciclastic Successions with Sequence Stratigraphy. In: K. Ratcliffe and B. Zaitlin, (eds.), Application of Modern Stratigraphic Techniques: Theory and Case Histories, SEPM Special Publication 94.
Gawthorpe, R., Fraser, A., and Collier, R. 1994. Sequence stratigraphy in active extensional basins: implications for the interpretation of ancient basin fills. Marine and Petroleum Geology, v. 11, p. 642-658.
Gawthorpe, R., Hardy, S., and Ritchie, B. 2003. Numerical modeling of depositional sequences in half-graben rift basins. Sedimentology, v. 50, p. 169-185.
Grotzinger, J. 1986. Upward shallowing platform cycles: a response to 2.2 billion years of low-amplitude, high-frequency (Milankovitch band) sea level oscillations. Paleoceanography, v. 1, p. 403-416.
Hardenbol, J., Thierry, J., Farley, M., Jacquin, T., De Graciansky, P. and Vail, P. 1998. Mesozoic and Cenozoic Sequence Chronostratigraphic Framework of European Basins. In: P.C. de Graciansky, J. Hardenbol, T. Jacquin, and P. Vail (eds.), Mesozoic and Cenozoic sequence stratigraphy of European basins, SEPM Special Publication 60, p. 3-14.
Haq, B., Hardenbol, J., Vail, P. 1987. Chronology of fluctuating sea levels since the Triassic (250 million years ago to present). Science, v. 235, p. 1156-167.
Haq, B and Schutter, S. 2008. A Chronology of Paleozoic SeaLevel Changes. Science, v. 322. p. 64-68.
Hays, J., Imbrie J., and Shackleton, N. 1976. Variations in the Earth’s Orbit: Pacemaker of the Ice Ages. Science, v. 194. p. 1121-1132.
Heckel, P. 1986. Sea-level curve for Pennsylvanian eustatic marine transgressive-regressive depositional cycles along midcontinent outcrop belt, North America. Geology, v. 14, p. 330-334.
Miall. A. 1991. Stratigraphic sequences and their chronostratigraphic correlation. Journal of Sedimentary Research, v. 61, p. 497-505.
Miller K., et al. 2003. Late Cretaceous chronology of large, rapid, sea-level changes: Glacioeustasy during the greenhouse world. Geology. v. 31, p. 585-588.
Miller, K., et al. 2005. The Phanerozoic Record of Global Sea-
Level Change. Science, v. 310, p. 1293-1298.
Plint, A. 2000. Sequence stratigraphy and paleogeography of a Cenomanian deltaic complex: the Dunvegan and lower Kaskapau formations in subsurface and outcrop, Alberta and British Columbia, Canada. Bulletin Canadian Petroleum Geology, v. 48, p. 43-79.
Sloss, L. 1963. Sequences in the cratonic interior of North America. GSA Bulletin, v. 74, p. 93-113.
Sloss L. 1988. Tectonic evolution of the craton in Phanerozoic time. In: L. Sloss (ed.), Sedimentary Cover – North American Craton: U.S. The Geology of North America, D2, Geological Society of America, p. 25-51.
Sloss L. 1991. The tectonic factor in sea level change: a countervailing view. Journal Geophysical Research, v. 96, p. 6609-6617.
Sloss L. 1992. Tectonic episodes of cratons: conflicting North American concepts. Terra Nova, v. 4, p. 320-328.
Sloss, L., Krumbein, W., and Dapples, E. 1949. Integrated facies analysis. In: C. Longwell, (ed.). Sedimentary facies in geologic history. Geological Society America, Memoir 39, p. 91-124.
Vail, P. et al. 1977. Seismic stratigraphy and global changes in sea level. In: C. Payton, (ed.), Seismic stratigraphy: applications to hydrocarbon exploration, AAPG Memoir 26, p. 49-212.
Wanless, H. and Shepard, F. 1936. Sea level and climatic changes related to late Paleozoic cycles. GSA Bulletin, v. 47, p. 1177-1206.
Weller, J. M. 1930. Cyclic sedimentation of the Pennsylvanian period and its significance. Journal of Geology, v. 38, p. 97135.


| by Neil Hutton
Edward Lorenz was a pioneering mathematician meteorologist at MIT. He began to study weather patterns by developing a series of simplified equations that he ran on an early, primitive computer. He had some success in representing weather patterns, but in a classic piece of scientific serendipity he decided to rerun one of his programs and continue it over a longer period. He was amazed to find that the rerun initially matched the first run but then diverged completely (Figure 1). Lorenz at first believed the problem was with the computer, but when everything was reexamined, it turned out that the problem was a rounding error. The computer operated to six decimal places but, to facilitate data entry, Lorenz had rounded the data to three decimal places. According to conventional thinking, small initial changes of one /ten thousandth to one / millionth should have commensurate consequences, but as Lorenz eventually deduced, even although the change was tiny, it had profound effects. This phenomenon is known as sensitive dependence on initial conditions, or more popularly the butterfly effect. The name deriving from Lorenz’s 1979 address to the American Association for the Advancement of Science entitled, “Predictability: Does the Flap of a Butterfly’s Wings in Brazil set off a Tornado in Texas.” Lorenz concluded that since it was impossible
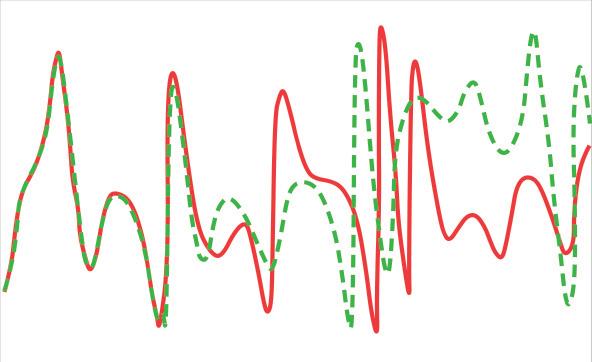
Figure 1. The Lorenz Experiment: The Father of Chaos Theory’s first experiment indicating sensitivity dependence on initial conditions. The difference in the starting values of the two curves is only 0.000127. Nevertheless, this very small departure results in a very large change in the end result: the butterfly effect (after Stewart, I., 2002, Figure 57, page 128; source: http://www.imho.com/grae/chaos/chaos.html).
to assess initial conditions to the accuracy required, then there was no means to provide weather forecasts for more than a few days. Lorenz suggested it required a grid of one-meter-square sensors throughout the globe, otherwise deterministic forecasts were impossible. Currently – even with satellite observation, radar, infrared, and other coverage – weather forecasts are limited to five days, but commonly decay within 48 hours. Thus, even now, when we predict the weather even 24 hours before it arrives, accuracy is limited. A reasonable conclusion is that, if not possible to forecast the weather a week forward, how can it be possible to forecast climate 100 years forward?
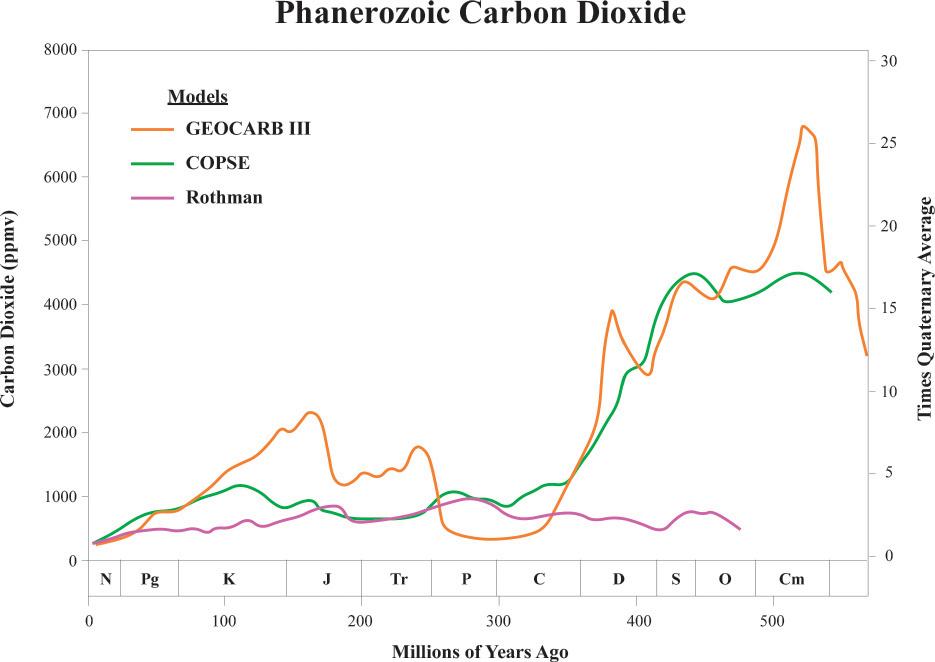
Figure 2. Phanerozoic CO2 : CO2 concentrations for the last 600 million years, in parts per million on the left axis and as multiples of current concentrations on the right. The past 400,000 years is highly contracted on the left. It is perfectly clear that the current CO2 concentrations are at the lowest levels in geological history. On this basis, current levels of only 385 ppmv do not present any particular hazard to human existence (after Singer, S. F. 2008. Figure 24, page 24; source: http://www.heartland. org/custom/semod_policybot/pdf/22835.pdf).
There is an argument presented by climatologists that weather and climate differ. That is to say that weather is an initial value problem (“the butterfly effect”) limiting reliable forecasts to 5-10 days. Climate on the other hand is a “boundary value problem”! In climate forecasting, an examination is made of how changes in the rules by which climate systems operate can change the average weather. There appears to be a non sequitur here, since climate is an iteration through time of weather. We average over time conditions to classify climates into major zones and subzones, such as equatorial, tropical, dry (arid and semi-arid), Mediterranean, maritime temperate (oceanic), and so on. Climate, therefore, is fundamentally a derivation of the weather continuum over time. Furthermore, the only change in the “rules” that has been examined is the addition of CO2 since the industrial revolution. The first problem in comprehending the rules is that CO2 represents such a tiny fraction of the atmosphere that it, in itself, can not exert a significant influence. This problem is generally conceded by climatologists. They, therefore appeal to an unproven assumption that the tiny amount of warmth generated by CO2 molecules will induce more cloud in a positive feedback cycle which the alarmists suggest could result in a runaway greenhouse effect destroying the planet. That this is the most arrant nonsense is easily demonstrated
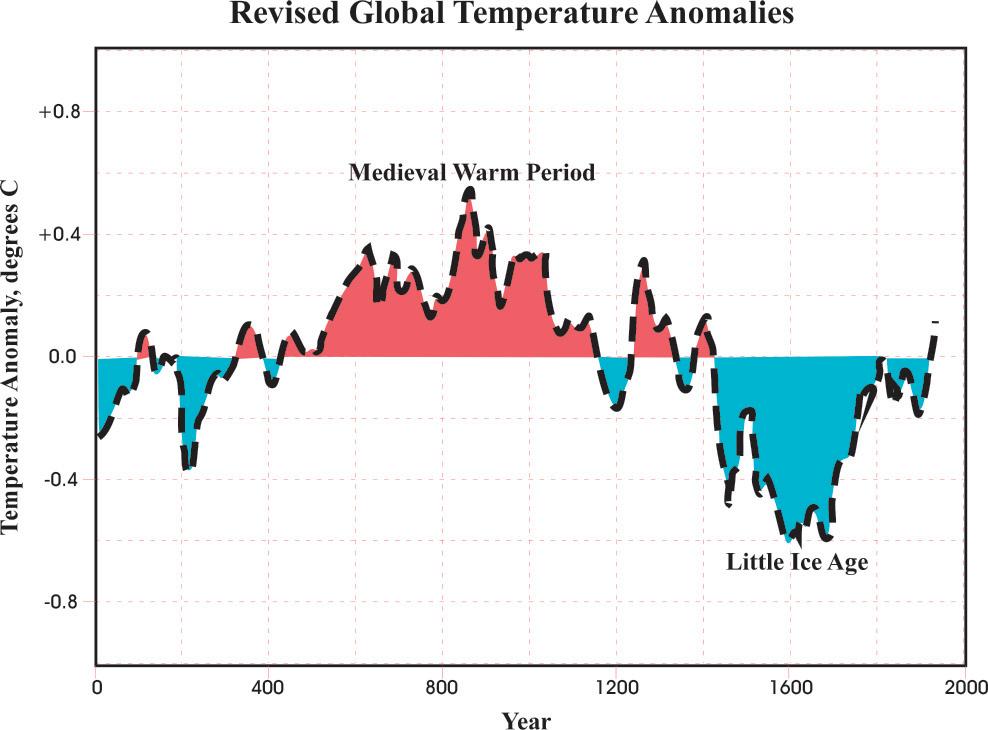
Figure 3. Global Temperature Anomalies: This figure is based on the Loehle and McCulloch study of eighteen 2,000-year-long proxy studies from around the world, excluding tree ring studies (which have inherent problems). The evidence for these climatic cycles is of very high quality with the Medieval Warm Period recording higher average temperatures than the Modern Warming (after Loehle and McCulloch, 2008, Figure 2, page 97).
by the fact that at the present time CO2 levels are at their lowest levels in the Earth’s history (Figure 2). If the alarmist theories were correct life would never have evolved on the planet.
What then are the climate models attempting to show? Climate models are simply strings of computer code or algorithms which attempt to simulate the behaviour of the atmosphere. If the model does not match reality, they require modification. From a scientific perspective, a climate model is a hypothesis in search of validation by observed data. Normally, in developing atmospheric climate models, it would be a standard procedure to hindcast the model performance against historic climate data. If a good match was attained for historic climate, the reliability of forecasts would be more credible. In fact, this has never been done. This is because climate models depend entirely on CO2 as their climate change driver. However, according to the orthodox global warming theory, preindustrial levels of CO2 were monotonously low and constant, as indicated by several ice cores from the Antarctic (Hutton, 2009a, Figures 1-5) This presents a serious problem to the modelers because there is a vast published literature (www.co2science.org) documenting cycles of warming and cooling coeval with the ice core data (Figure 3). The incontrovertible conclusion is either the ice core data is wrong, or CO2 has no role whatsoever in climate variability. We have argued previously that the proxy CO2 values in ice core data are depleted, and are not representative of contemporaneous atmospheric CO2 (Hutton, 2009a, p. 40). Here, fundamentally, is the disproof of the
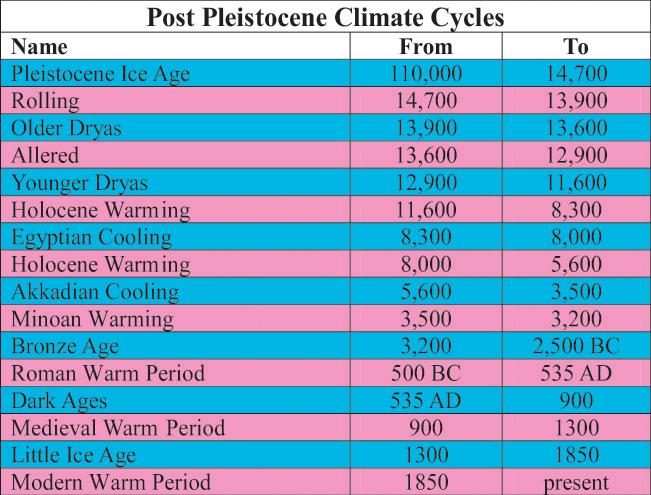
Figure 4. Post-Pleistocene Climate Cycles since the end of the last glaciation. There are 16 climate oscillations, with the warm cycles shown in pink and cold in blue (source: http://www.co2science.org/articles/V11/N5/C1.php).
entire global warming by CO2 theory. If the ice core proxy atmospheric CO2 values were plugged into current climate models it would show continuous cooling from the Little Ice Age (1650-1750) to the Holocene, some 10,000 years ago. From a wide range of geological, archaeological, and historical data in literally hundreds of peer-reviewed papers, this is wrong. The climate was cyclical through a series of warm and cold periods (Figure 4) with many instances of temperature exceeding our current maximum.
How is it that Global Circulation Models (GCM) have become the super stars of climate research and are presented as evidence for the effects of warming even when contradicted by real data observations? The GCM are three-dimensional computer models that attempt to integrate and project into the future all of the major influences of climate. The list is extensive and the problem is so complex and massive that programs can only be run on supercomputers, which
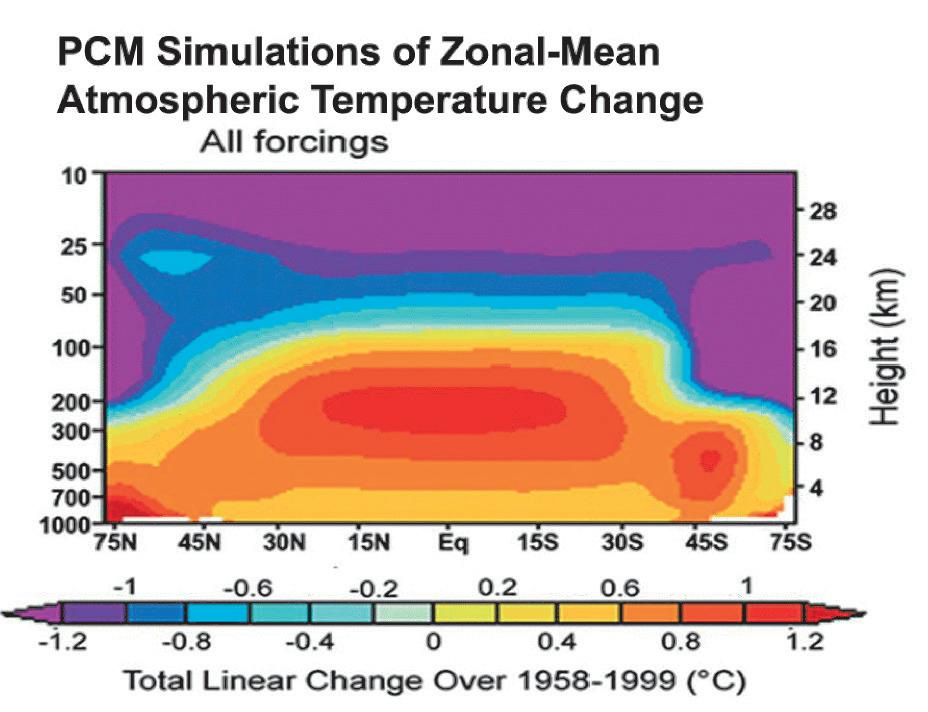
Figure 5. Greenhouse-model-predicted temperature trends versus latitude and altitude presented in IPCC-AR4, (2007, p. 675). The figure shows a predicted increased temperature trend in the tropical mid-troposphere of 1.2°C. In thirty years of satellite observations, this trend has never been observed (source: http://www.heartland.org/custom/semod_policybot/ pdf/22835.pdf).
means that only wealthy nations can afford to run them. The major centers are Britain’s Hadley Centre, NASA, Goddard Institute for Space Studies (GISS), the National Centre for Atmospheric Research (NCAR), and the National Oceanic and Atmospheric Administration’s (NOAA) Geophysical Fluid Dynamics Laboratory. The models attempt to work from first principles using fundamental physical laws, thermodynamics, fluid dynamics, the carbon cycle, the water cycle, and so on. In turn, the first principles are converted to mathematical equations or more empirical algorithms for a vast threedimensional array of grid boxes representing the global surface and atmosphere. The computer generates new values for each grid box as the model steps forward in time by an assigned interval – 0.5-1.0 hour – again and again through the simulated time period. The projected climate change is assessed by re-running the models with different levels of greenhouse gases, aerosols, or other factors assumed to be involved in climate change. The complexity of such an undertaking is certainly overwhelming. On the other hand, what is astonishing is the data (listed below) fundamental to climate analysis that is not included. What this is analogous to is having a gigantic toy in which fundamental parts, like the batteries at Christmas, are not included.
In fine print on the side of the GCM toy box we find:
• The Sun spot cycle – Not Included;
• The dimensions and strength of the Heliosphere – Not Included;
• The AP progression Index (a measure of solar wind) – Not Included;
(Continued on page 26...)
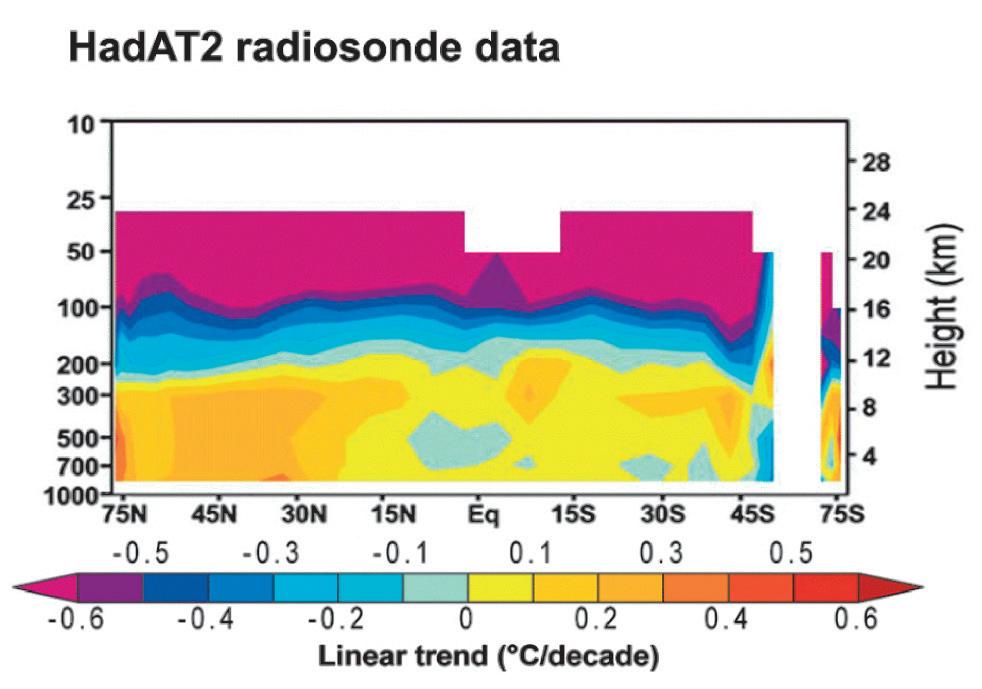
Figure 6. Actual data observations from radiosonde balloons versus latitude and altitude. The trends are derived from the Hadley Centre, Climate Research Unit and are an excellent match for similar US analyses. Notice that there is no warming trend in the tropical mid-troposphere but a slight cooling (source: http://www.heartland.org/custom/ semod_policybot/pdf/22835.pdf).
• The strength of cosmic ray flux – Not Included;
• The experimentally demonstrated and observationally recorded nucleation of low cloud by cosmic rays – Not Included;
• The natural heat flux of the Earth – Not Included;
• The heat flux through the oceans of some 64,000kms of spreading centres and unrecorded subsea volcanoes and fumaroles – Not Included;
• Ability to understand the cause and effect of the major oceanic cycles, such as the North Atlantic Oscillation, the Pacific Decadal Oscillation, or – the most profound of these – the El Nino Southern Oscillation – Not Included.
Would you be prepared to buy this toy and rely on its forecasts? Unfortunately we already have. But what is the track record of forecasts developed by the GCMs. We have already described forecasts which are contradicted by observed data, such as the predicted increase in Asian Monsoon variability and strength contradicted by Kripilani’s (2003) study, (Hutton, 2009d, p. 3), and IPPC models of predicted sea level change not supported by observed satellite data (Hutton, 2009c, p. 5).
The most recent Intergovernmental Panel on
Climate Change reports depend almost totally on computer modeling, and the projections are presented as validated science, rather than poorly constrained projections for which the assumptions are obscure and certainly inadequate. A fundamental projection of the Anthropogenic Global Warming Hypothesis is that the addition of CO2 to the atmosphere will result in an increasing warming with altitude, peaking at roughly 10km at about twice the surface value. The model results are presented in Figure 5 (page 25) as shown in the IPCC report (IPCC-AR4, 2007, p. 675). If the theory is valid, then measured observational data should confirm the model simulation. They do not. Satellite data have never confirmed the projection illustrated in Figure 5. In contrast, observed temperature trends from the analysis of radiosonde data show the reverse, a slight cooling trend with altitude (Figure 6, page 25). If we were dealing with objective scientific analysis, this result would definitively falsify the theory. It has not. The IPCC cling grimly to one single line of evidence, the weak correlation between atmospheric CO2 and the global average surface temperature and that only since 1850, while the planet was recovering from the depths of the Little Ice Age. The inconvenient cyclical nature of the entirety of Earth’s prehistory is ignored.
The situation is similar if we consider the projections for future climate from IPCC
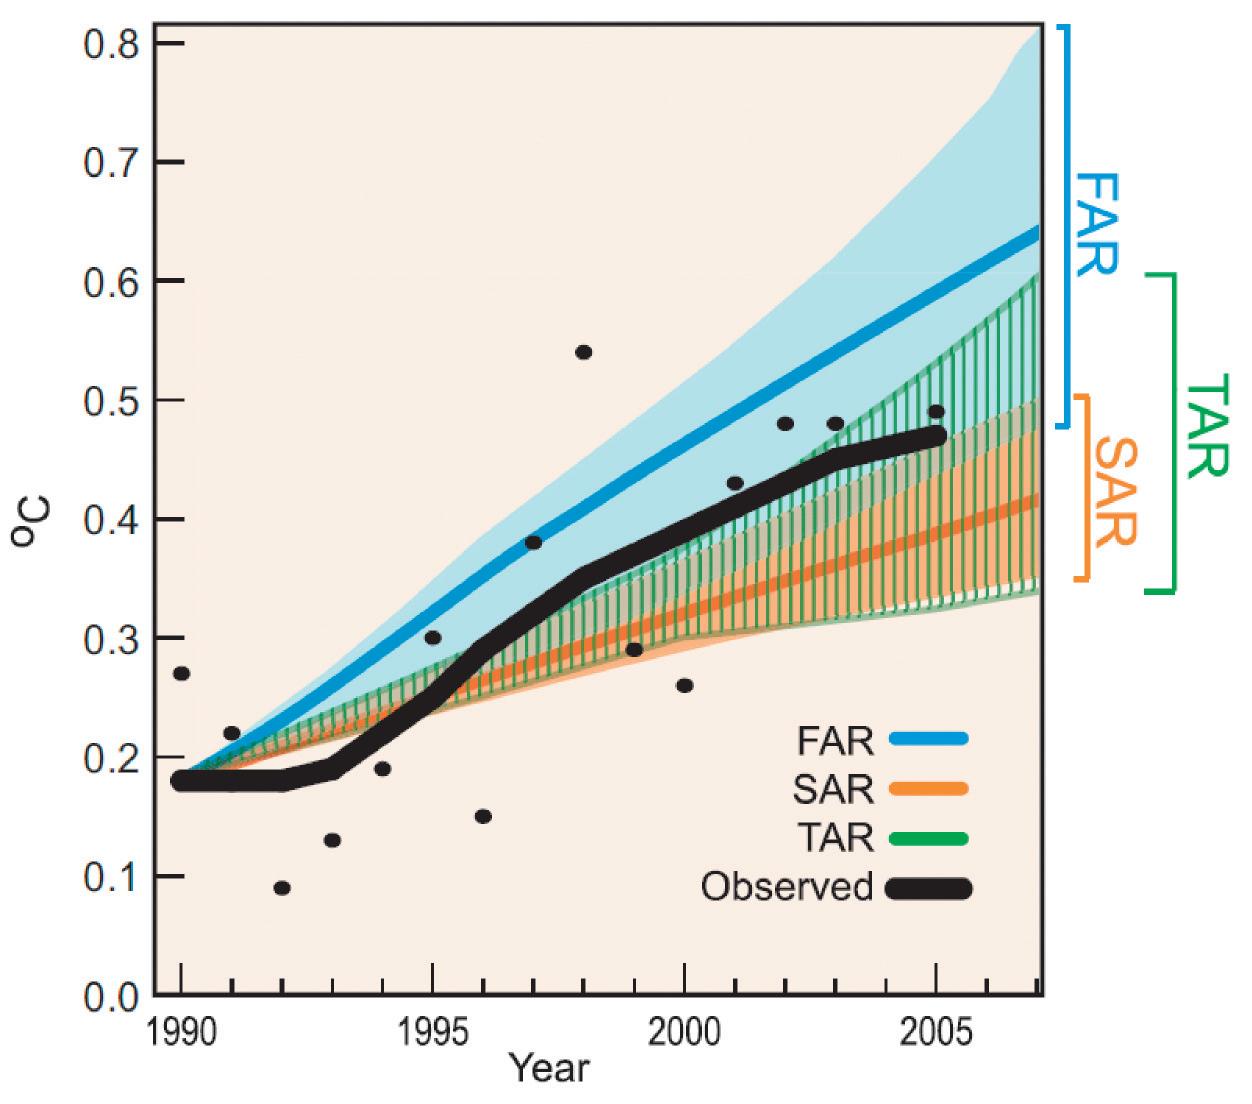
Figure 7. Yearly average global surface temperature observations versus the projections from the First (1990 FAR in blue), Second (1996 SAR in orange), and Third Assessment Reports (2001 TAR in green vertical stripes) as shown in the IPCC-AR4,2007, “Historical Overview of Climate Science,” p. 98, Figure1.1. The best estimates for FAR and SAR are in solid lines, but this estimate was not provided in the TAR. The annual mean observations are provided by the heavy black dots which show little or no relationship to the model projections. The observed data is dominated by cooling from the Pinatubo volcanic eruption in 1992, and the very strong El Nino warming in 1998. The heavy black line is a smoothed version of the decadal variation which shows a poor correspondence with any of the forecasts (source: http://www.ipcc.ch/pdf/assessmentreport/ar4/wg1/ar4-wg1/chapter1.pdf).
models in each of the assessments reports (First Assessment Report, 1990; Second Assessment Report, 1996; and Third Assessment Report, 2001) as shown in Figure 7 (IPPC, 2007, Historical Overview of Climate Science, p. 98, Figure 1.1). Most observers would conclude that the IPPC projections do not correlate very well with the observed data. It gets worse when future scenarios are added. In Figure 8, the same data from Figure 7 is repeated, but now includes IPPC forecasts out to 2025. These forecasts, now designated as scenarios, are essentially straight line projections of the earlier observed trend and the projected increase in CO2 . The computer models used lack any climate variable other than CO2 so they can accommodate no other trend. The orange trend signifies a theoretical climate variability with no additional greenhouse gases (CO2 ) or aerosols. The observed temperature projection (heavy black) extends to 2005 and shows a flattening curve. The further cooling of about 0.15°C from 2005 to 2009 will cause the extension of observed data to intersect the predicted orange curve. The conclusion is clear: the IPCC scenarios are wrong. Dr. Syun Akafosu of the University of Alaska has made an analysis in which he documents the control of the multi-decadal oscillation on 20th century climate. His projection is illustrated with the current downward cooling trend of observed data (Figure 9). The IPCC scenarios are
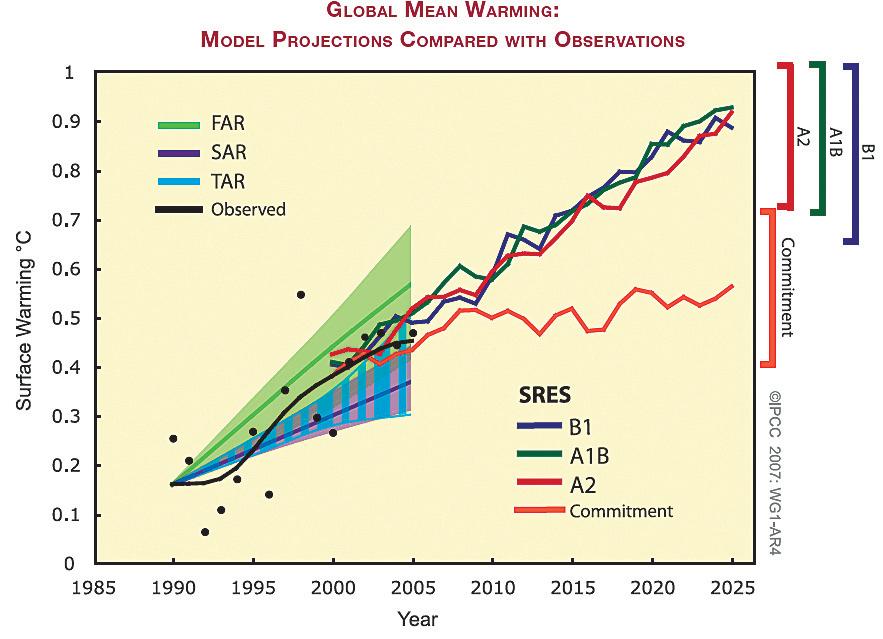
Figure 8. Compares the data from Figure 7 with the addition of predicted scenarios derived from IPCC-AR4 (Ch. 10, Figure 10.4) to the year 2025. Multi-model mean projections from the report are shown from 2000-2025 with the scenarios B1 in blue, A1B in green, and A2 in red with the range of uncertainty displayed in bars to the right. The orange (commitment) scenario reflects a projection of temperature with no further greenhouse gases or aerosols. The heavy black is the observed temperature, but extends only to 2005, since which time there has been 0.15°C of cooling. This will cause the observed trend to drop and intersect the orange projection assuming no CO2 or aerosols. This result invalidates the IPCC projections completely, demonstrating that CO2 is not the primary climate driver (source: http://rankexploits.com/musings/ wp-content/uploads/2008/07/ar4tarsar.gif).
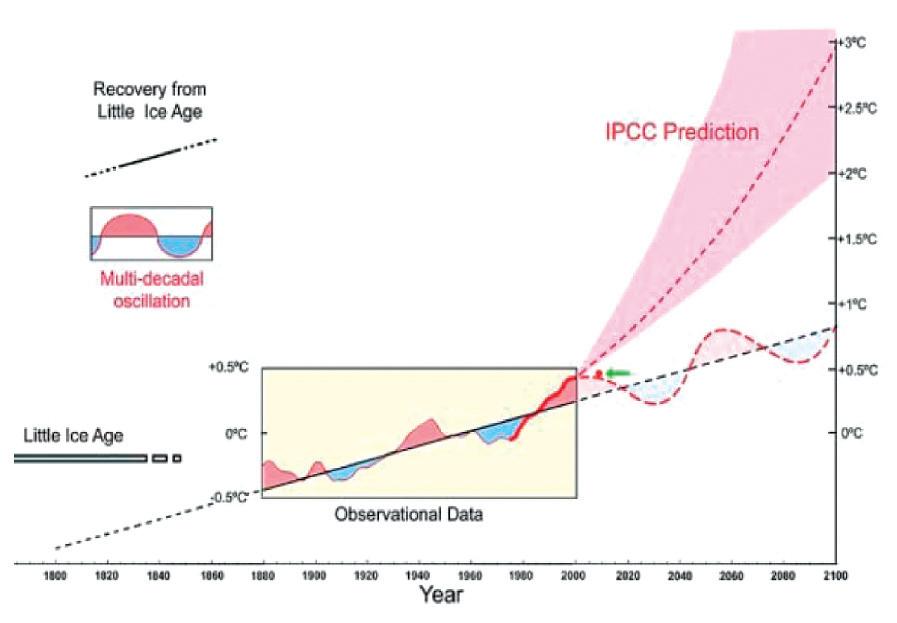
Figure 9. This diagram based on a critique by Dr. Syun Akafosu again illustrates the inadequacy of IPPC computer model scenarios, which are essentially straight line projections into the future based on increasing atmospheric CO2 . The reality is quite different. The red dot with the green arrow is where the observed temperature currently stands. From variations in the temperature record such as the decline from 1940-1975, when CO2 was actually increasing, Akafosu interprets a multi-decadal oscillation which shows the climate now entering a cooling period (source: http:// wattsupwiththat.com/2009/03/20/dr-syun-akasofu-on-ipccs-forecast-accuracy).
clearly unsupportable as scientific evidence.
At this point it would be reasonable to consider if forecasts, scenarios, or storylines, as they have been variously termed in IPCC reports, are science. The standard for an acceptable scientific hypothesis, over the last 300 years of scientific enquiry, requires that the hypothesis makes predictions that can be subsequently tested. Hendrik Tennekes has
argued, following Edward Lorenz of the “butterfly effect,” that meteorology was heading into an unsolvable dilemma since the nature of the atmosphere and the complexity of the climate system could not be resolved. No matter the refinement of the observation network, or the increase in power of computers, the average useful forecast is still in the range of a few days.
In addition to the sensitivity to initial conditions issue, is the fact that computer modeling is about the incremental linearization of a nonlinear dynamic system – one that is not in global thermodynamic equilibrium either within itself or with its surroundings. The linear modeling negates the reality of unconstrained turbulent flow. In an attempt to overcome these difficulties the approach is to use ensemble forecasting and multi-model forecasting. The
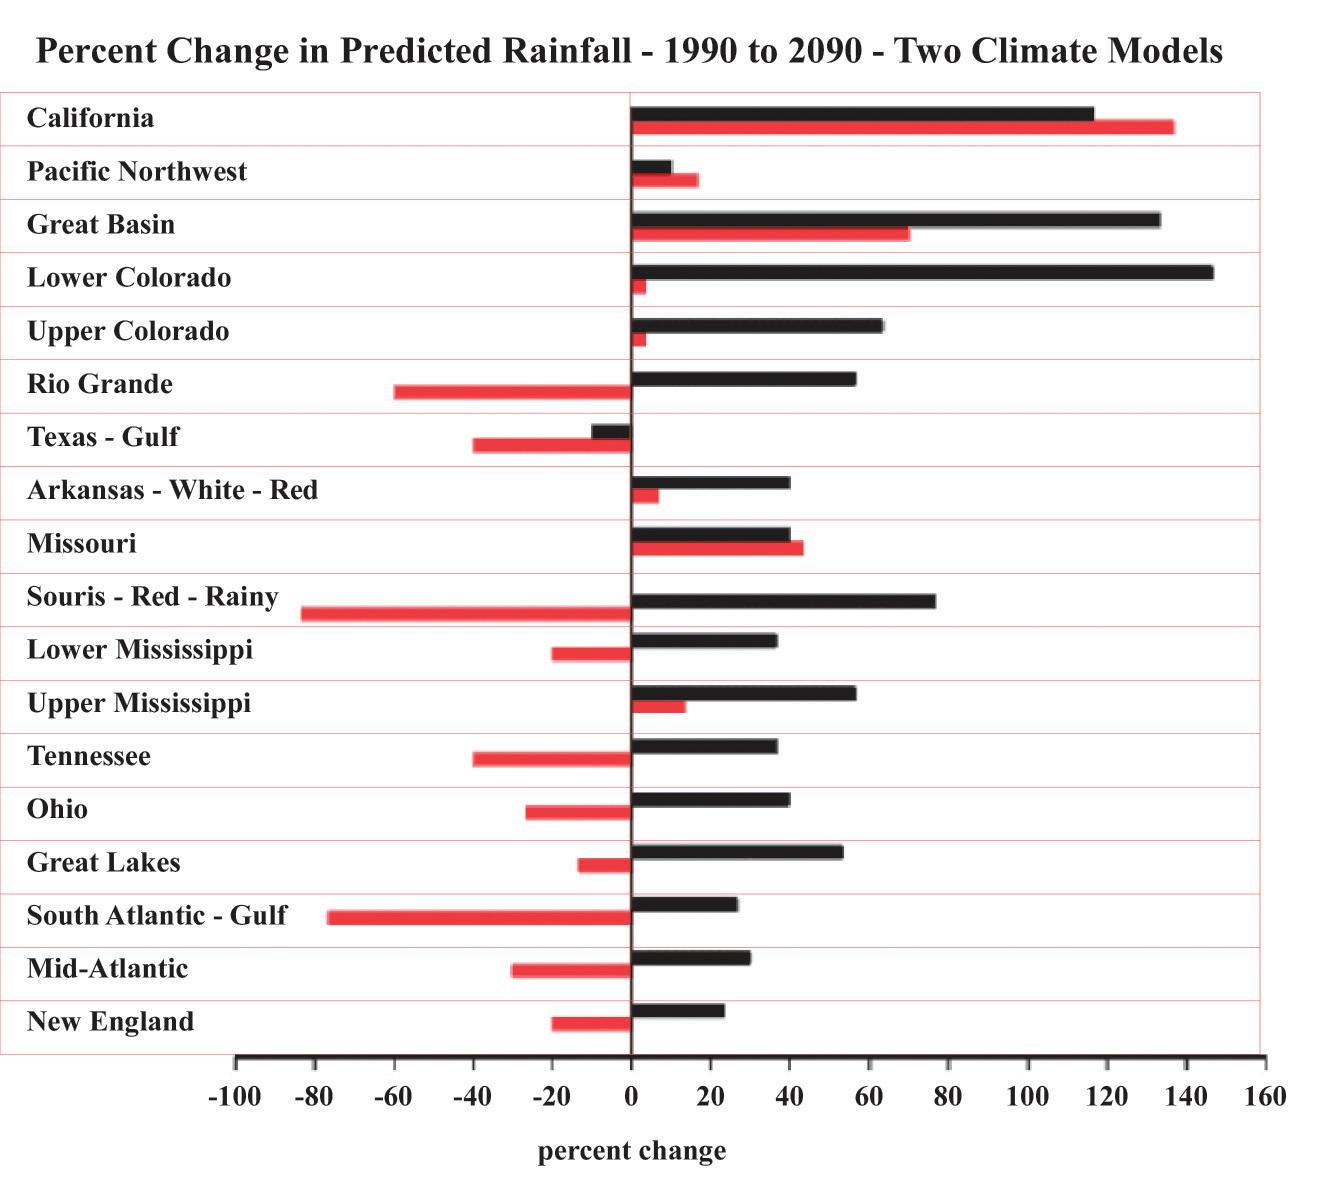
Figure 10. The inadequacy of Computer Climate models is demonstrated by an example from the U.S. National Assessment of Climate Change (NACC, 2000). The diagram shows the predicted rainfall for 18 regions of the U.S. These results come from two models. Note the huge differences between model results in magnitude and even sign. For example, the Dakotas (Souris-Red-Rainy) is either a swamp or a desert depending on which model is used. It demonstrates how removed from reality the modelers are when they present results from which the only conclusion is that the models are worthless (source: http://www..heartland.org/custom/semod_policybot/ pdf22835.pdf).
same difficulties exist within the models, and whether any one of the ensemble reflects a representation of the real world can not be established as there is no means to confirm its reliability or accuracy. Karl Popper, one of the 20th Century’s leading scientific philosophers, takes issue with this deterministic approach, which he regarded as false, dangerous, and leading to arrogant, undisciplined, and (worst of all) unfalsifiable predictions masquerading as science – a statement which fairly describes the entirety of the IPCC case for global warming.
Popper’s philosophy is that a scientific proposition or hypothesis must be “falsifiable.” This restraint requires that every scientific claim include, at least implicitly, a clear notion of what evidence would be required to prove that the proposition is untrue. This requires some scientific rigor and integrity that the IPCC clearly has not shown, preferring to ignore contrary data as we have described above.
The realizable danger, as we see in climate studies now, is that we are presented with unfalsifiable theories that seem like science. According to Tennekes in a speech in 1986, “No forecast is complete without a forecast of Forecast Skill.” In other words the models must be able to reproduce a known data set within a defined level of
(Continued on page 28...)
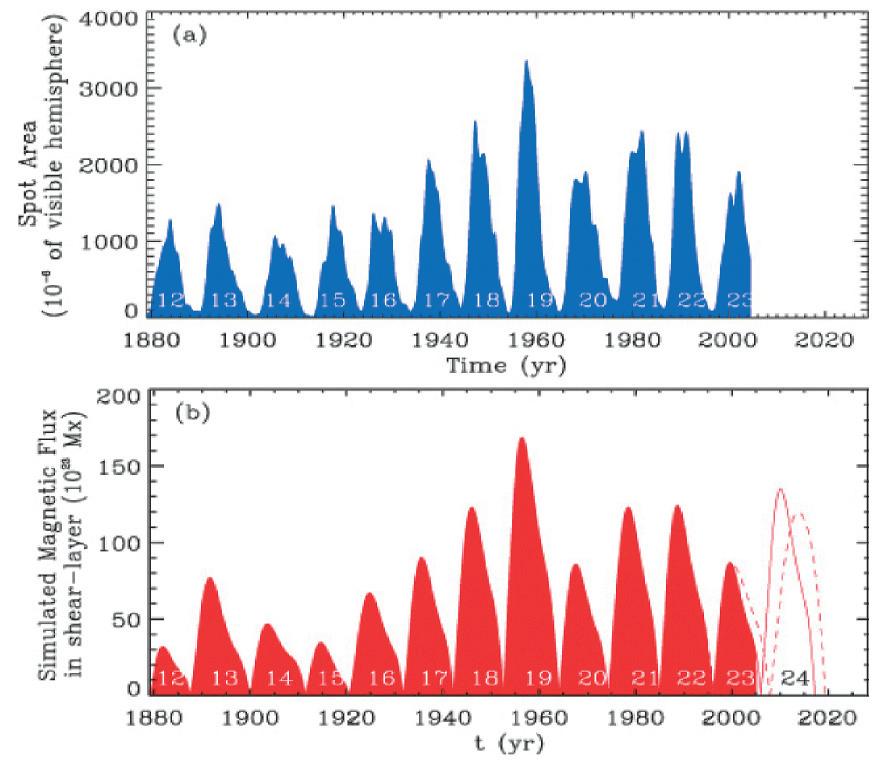
Figure 11. Here is clear proof of the dangers of computer modeling even when it includes the requisite estimate of forecast skill. The figures compare observations of the past twelve sunspot cycles (upper figure in blue) with computer simulation of solar processes developed by NCAR scientists (lower panel in red). The fit is almost perfect (98%) and from this a forecast was made for cycle 24 that it would be 30-50% more intense than cycle 23, peaking in 2012 with a sunspot number of 160 plus or minus 25%. In fact, cycle 23 is still in a minimum phase with minimal cycle 24 activity. Far from being more intense, we are now at 637 sunspot free days, a minimum not seen since the 19th Century, and it is unlikely that cycle 24 will peak before 2014 with a sunspot number less than 50 (source: http://wattsupwiththat.com/2009/05/30/ scientists-issue-unprecedented-forecast-of-next-sun-spot-cycle).
accuracy without which the forecast is simply a guess. Climate is such a complex, dynamic, nonlinear, out-of-equilibrium system with so many approximations required that models, based on their observed performance, are useless as predictive devices. Tennekes has pointed out that without the ability to predict changes in precipitation we cannot possibly predict future climate. In figure 10 (page 27) are presented some forecasts from various models of predicted precipitation. There are huge differences in the models, not only in magnitude but also sign such that some areas could be either a desert or a swamp. The models are inadequate in simulating regional effects, particularly when it comes to precipitation.
General circulation models necessarily ignore fundamental issues, partly out of complexity and partly out of lack of understanding of systems such as cloud behaviour or Sun cycles. As a result, models in ensemble forecasts lacking proper parameterization of fundamental processes are compared with models that necessarily ignore the same issues. If several such models that are incomplete in fundamental ways are seen to show some agreement, then this deemed to be an acceptable result, which we are expected to believe.
Supposedly highly sophisticated climate models have been running for twenty years now at tremendous expense. It has become evident that they have no predictive value whatsoever. In this regard, even when there appears to be a forecast skill of 98%, the outcome can still be wrong. The National Center for Atmospheric Research produced a model which replicated the last 12 sunspot cycles from 1880-2006 (Figure 11, page 27). On this basis, cycle 24 was predicted to be the most active in recorded history, 30-50% more intense than the current cycle 23. Not only is this forecast wrong, it could be majorly wrong if the Sun continues in its quiescent state. So far cycle 23 has the lowest minimum since the 19th Century and is likely to have a very weak maximum: less than 50 sunspots versus a forecast by NASA of greater than 160. Clearly the assumptions that went into the model neglected a fundamental cyclical element in the generation of sunspots.
Here the comments of Freeman Dyson, one of the world’s outstanding physicists, seem particularly prescient, “The models are full of fudge factors that are fitted to the existing climate, so the models agree more or less with the observed data. But there is no reason to believe that the same fudge factors would give the right behaviour in a world
with different chemistry, for example with increasing CO2 in the atmosphere. Models do not begin to describe the real world we live in nor have they been able to describe our climate history.”
It might appear that we have regressed to a situation analogous to the oracle at Delphi where the ululating sound emanating from the rock were interpreted by the high priests as they prophesied the future of the citizens and the country. Are the General Circulation Modelers now the oracular priests prophesying global warming?
Akasofu, Syun-Ichi. 2008. Is the Earth Still Recovering from the ‘Little Ice Age’. International Arctic Research Center, University of Alaska Fairbanks, http://people.iarc.uaf.edu/sakasofu/ pdf/Earth_recovering_from_LIA_R.pdf.
Dyson, Freeman J. 2005. Winter Commencement Address, University of Michigan. U. of Michigan News Service, www.umich.edu/news/index. html?Dyson WinCom05.
Essex, C., McKitrick, R., and Andresen, B. 2007. Does a global temperature exist? Journal of Non-Equilibrium Thermodynamics, v. 32, no. 1, p. 1-27.
Hutton, A. Neil. 2009a. CLIMATE CHANGE III: Carbon Dioxide. Canadian Society of Petroleum Geologists Reservoir, v. 36, issue 3, p. 38-43, Figs. 1-5.
Hutton, A. Neil. 2009b. CLIMATE CHANGE V: Here Comes the Sun. Canadian Society of Petroleum Geologists Reservoir, v. 36, issue 5, p. 31-39.
Hutton, A. Neil. 2009c. CLIMATE CHANGE VI: Fearmongering. Canadian Society of Petroleum Geologists Reservoir, v. 36, issue 6, p. 24-28.
Hutton, A. Neil. 2009d. CLIMATE CHANGE VII: The Spin Cycle. Canadian Society of Petroleum Geologists Reservoir, v. 36, issue 7, p. 21-25.
Intergovernmental Panel on Climate Change –AR4. 2007. Climate Change: The Physical Science Basis, Contribution of the Working Group 1 to the Fourth Assessment Report. Geneva Switzerland IPPC -TAR, 2001, Climate Change: The Scientific Basis. Contribution of Working Group 1 to the Third Assessment Report. Cambridge University Press, Cambridge.
Intergovernmental Panel on Climate Change – SAR. 1996. Climate Change: The Science of Climate Change. Contribution of Working Group 1 to the Second Assessment Report. Cambridge University Press, Cambridge.
Intergovernmental Panel on Climate Change – FAR. 1990. Scientific Assessment of Climate Change. Contribution of Working Group 1 to the First Assessment. Cambridge University Press, Cambridge.
Kripilani, R. H., et al. 2003. Indian Monsoon Variability in a Global Warming Scenario. Natural Hazards, v. 29, p. 189-206.
Loehle, C. L. and McCulloch, J. H. 2008. Correction to: A 2000-year global temperature reconstruction based on non-tree ring proxies. Energy and Environment, v. 19, no. 1, p. 93-100.
Lorenz, Edward, N. 1963. Deterministic Non Periodic Flow. Journal of Atmospheric Sciences, v. 20, p. 130-141.
Lorenz, Edward, N. 1979. Predictability: Does the Flap of a Butterfly’s Wings in Brazil set off a Tornado in Texas. American Association for the Advancement of Science, Annual Meeting, December, 29th 1979.
Michaels Patrick, J. 2007. Meltdown, The Predictable Distortion Of GLOBAL WARMING by Scientists, Politicians, and the Media. Cato Institute Washington, D.C.
Pieser, Benny. 2007. The Scientist As Rebel: An Interview With Freeman Dyson. CCNet, March 14 2007.
Singer, S. F. (ed.). 2008. Nature, Not Human Activity, Rules the Climate. The Heartland Institute. 40 p.
Solomon, Lawrence. 2008. The Deniers. Richard Vigilante Books, USA. www.staff.livjm.ac.uk/spsbpeis/Freeman-Dyson. htm.
Stewart, I. 2002. Does God Play Dice: The New Mathematics of Chaos. Blackwell Pulishing. 420 p.
Tennekes, Hendrik. 1986. No Forecast is Complete Without a Forecast of Forecast Skill. European Centre for Medium-range Weather Forecasts. www.sepp.org/Archive/NewSEPP/ Climate%20models-Tennekes.htm.
Tennekes, Hendrik. 1992. Karl Popper and accountability of Numerical Weather Forecasting. Weather, v. 47, p. 343-346. http://climatesci.org/ files/popper.pdf.
Tennekes, Hendrik. Undated. A Skeptical View of Climate Models. Royal Netherlands Meteorological Institute, www.sepp.org/Archive/ NewSEPP/Climate%20models-Tennekes.htm.

Tel: 403.284.1112
Cel: 403.862.3319
Fax: 403.284.1115
anne.hargreaves@canstrat.com www.canstrat.com


26 Years of exploration, development, acquisition and divestiture expertise and knowledge in the Canadian oil and gas business.
Call (403) 510-4461 or Email rmusial@telus.net


www.rpsgroup.com/energy


| by Scott Hilling
Unconventional reservoirs demand new technologies and new strategies to develop profitably. In North America, geologists continue to discover oil and gas plays where horizontal multistage stimulation is the most effective development option.
Unconventional reservoirs vary in structure and composition; no single solution or standard stimulation design will be right for all reservoirs in all areas. And, since fracture stimulation accounts for up to half of total well costs in unconventional developments, profitability often hinges on optimizing the completion design.
Optimizing well productivity requires reservoir development planning that starts with the completion strategy and works backwards. That is, every aspect of the well design and placement has to be chosen to produce a well that can be successfully completed for maximum production. This also applies to completion design in long horizontals with multiple stages – it has to be right for the intended stimulation.
Reservoir characterization and offset well information are also important pieces of the puzzle. Seismic data, core data, and log information enable stimulation engineers to more accurately simulate, design, and develop optimized treatment solutions for any given formation.
Fracture geometry can significantly affect the selection of optimal completion and stimulation designs. Two basic types of fracture geometry are most common: single-plane and complex (dendritic) fractures.
Single-plane fractures extend out radially from the wellbore initiation point, propagating along a single-failure plane. With this fracture type, the orientation and spacing of the fracture become critical to horizontal completion design. The fracture plane can be transverse to the well azimuth, or longitudinal, i.e., growing in the same direction as the wellbore.
Horizontal well azimuth is often chosen so that fractures will propagate perpendicular to the wellbore (Figure 1). When dealing with single-plane fracturing, this orientation aids completion efficiency. This configuration can be very efficient in exposing large areas of formation to the producing wellbore and maximizing production.
Fracture size, conductivity and spacing along the horizontal are key elements of completion design. Potentially, fractures that are too far apart will reduce recoverable reserves and production. Fractures placed too close together are an unnecessary expense and reduce the return on the invested capital.
Pressure applied during the fracturing process can also alter local stress regimes. If fractures are too closely spaced, the stress field is altered, and this changes the orientation of subsequent fractures. The result is less-effective stimulation, and, ultimately, less hydrocarbon recovery. To address these issues, Halliburton developed the Sigma® process – a comprehensive, iterative, multi-well approach to well design that optimizes fracture size and placement to help produce the most effective completion possible for a given reservoir.
Longitudinal hydraulic fractures run along the axis of the wellbore. They are initiated when the horizontal wellbore is drilled in the direction of maximum principal stress. Longitudinal fractures are usually less beneficial than transverse fracturing because the fracture area is smaller.
Complex fracture systems are multiple intersecting fractures in a matrix-like pattern. In naturally fractured formations, such a system can have multiple longitudinal and transverse fractures and fissures. While these formations offer challenges for treatment design and proppant placement, they also offer the opportunity to access larger areas of rock face and significantly improve production potential. Ultimately, complex fractures can open up the potential to exploit reservoirs with permeability in the range of nanodarcies –truly unconventional reservoirs.
Traditionally, geologists have not worked with detailed data on fracture types in the reservoir. Instead, they have relied on general knowledge of the area. Now, fracture types and orientations can be discovered and monitored using Pinnacle microseismic and tiltmeter arrays. Microseismic fracture mapping provides an image of the fractures by detecting microseisms (micro-earthquakes) that are triggered by shear slippage on bedding planes or natural fractures adjacent to the hydraulic fracture. Results from microseismic fracture mapping can be used to “calibrate” fracture growth models. This information is critical in planning completions, stimulation, and well placement.
T ECHNOLOGY
Fracture stimulation design should result in an optimal fracture area and corresponding conductivity distributed along the length of the horizontal wellbore. It must also be economically efficient, but merely selecting the cheapest technology is rarely the best approach. One must carefully balance the total well cost against the total production to find the best return on investment. Approaching each well with an open mind will yield the best results.
The following will indicate some of the available technologies and the situations where they are most appropriate.
F OR OPENHOLE wELLBORES w ITH C OMPLEX F RACTURE GEOMETRIES
OPENHOLE BULLHEAD T REATMENTS
Openhole bullhead treatments typically result in fracture clusters. This can be the optimal solution in cases where fracture clusters adequately connect the reservoir rock to the wellbore. However, when fracture clusters are concentrated in and around the heel of the wellbore, bullhead treatments usually provide little additional production benefit, as large portions of the wellbore can remain unstimulated. Pinnacle microseismic and tilt array data are often important factors in deciding if this completion type is right for the reservoir.
I SOLATION S YSTEMS , AND DELTA S TIM® SLEEVES
These systems and tools help isolate sections of the open hole between packers placed on the external surface of the casing, and, via Delta Stim ® sleeves, these systems allow fractures to initiate within
selected openhole sections between the packers (Figure 2). Intervals with complex fracturing systems can benefit from this technology, as Delta Stim sleeves have few limitations of treating rate and pressure. This completion method allows the operator to effectively stimulate the entire horizontal section with speed and efficiency while maximizing connectivity. Typically, the costs associated with the maximum number of intervals that can be stimulated are the factors determining its selection.
The SurgiFrac ® process is an openhole, pinpoint stimulation service that uses dynamic fluid movement to divert flow to specific points in the wellbore. This technique can be very cost-effective where there is transverse single-plane fracturing, but it may not be as suited for formations with longitudinal or complex fracturing. Halliburton’s SurgiFrac service has the added benefits of not requiring permanent mechanical isolation equipment and leaving the wellbore free of obstruction.
(Continued on page 32...)


Improve your exploration odds with Divestco. At Divestco we want the odds to be in your favor so we have given you a whole deck of geological products and services to choose from. Divestco’s integrated offering for geological professionals gives you the ability to choose from a wide range of geological products and services to suit your unique needs. Pick as many individual cards as you want or let our experts deal you a winning hand.


Call us at 403.537.9904 or email sales@divestco.com for more information.


(...Continued from page 31)
F OR C ASED AND C EMENTED wELLBORES
PERF AND PLUG T ECHNOLOGY
Perf and plug technology is a common completion technique for cased and cemented horizontal sections. It is uncomplicated and reasonably certain in its ability to isolate fracture stages. However, in long horizontal wellbores, this technology has a significant risk of sticking or prematurely setting plugs, which can escalate costs dramatically. Another important consideration is the time and cost required to drill out plugs at the end of the well stimulation.
With the Cobra Frac® H process, the entire horizontal section is perforated over the intervals of interest, after which stimulation occurs down coiled tubing. Each perforation set is straddled, isolated and stimulated individually. For horizontal wellbores where increasing the number of discrete fractures placed has a greater effect on production than increasing fracture size, the Cobra Frac service has proven to be an excellent economic solution as compared with perf and plug technology and Delta Stim sleeve completions.
The CobraMax ® H service uses coiled tubing that remains in the well during the entire stimulation process. The coiled tubing performs hydrajet perforating and places sand plugs for isolation between fracture stages (Figure 3). The CobraMax service is suitable in long cemented horizontal sections where 100-150 meters of minimal fracturing spacing is adequate. In addition, it provides
excellent economic value in wells with moderate fracturing pump rates and where more than five fracture stages are desired.
HIGHLIGHTS
MONTNEY SHALE G AS
A wide variety of horizontal multistage stimulation techniques have been used in northeast British Columbia’s Montney shale play, including perf-and-plug methods, openhole packers, and CobraMax services. A major Canadian operator with significant Montney assets turned to Halliburton’s CobraMax completion system when its year-end goals were being threatened by time constraints. The speed and efficiency delivered by the CobraMax service allowed the operator to complete the program on time and on budget.
Halliburton has used the CobraMax H process successfully in 102 wells; it has proven to be the most efficient and economic completion method to date. With this service, removing sand plugs is efficient, the cleanout operation is simple and the time needed to get the well on production is greatly reduced.
In shale formations such as the Bakken / Torquay play in southeastern Saskatchewan, and in similar plays, openhole packers with Delta Stim sleeves have been the primary completion strategy. This method is easy to deploy, efficient, and cost-effective.
However, openhole packer and ball-drop completion methods, which are limited to 8-10 intervals per wellbore, are now giving way to Halliburton’s Cobra Frac H process.
Even though this technology requires a cased, cemented, and perforated horizontal wellbore, the Cobra Frac H service can achieve efficient stimulation of the entire reservoir by stimulating 20-30 intervals in one wellbore. In light-oil-shale formations, more intervals mean more production and better wellbore economics.
This process also has potential application in emerging plays such as the Cardium oil development in central Alberta, where horizontal wellbores are enabling reservoirs to be profitable It has the added benefit of leaving the wellbore free of jewelry and more accessible for future remedial work.
As the industry increasingly pursues a wealth of resources from unconventional reservoirs, asset managers will need a variety of stimulation solutions to optimize production in difficult formations. Effective solutions will depend on integrating all aspects of resource exploitation and recovery. Well planning, drilling, and completions, along with stimulation, must be part of a holistic design and execution process. Halliburton, a service company with expertise in all aspects of well design and construction, is a leader in providing integrated stimulation solutions that meet the technical and financial needs of operators and investors.
Scott Hilling, P. Eng., is the technical professional lead for Halliburton’s Completion and Production Division in Canada. His previous Halliburton experience included engineering work in western Canada, Texas, and Colorado. He graduated from the University of Saskatchewan in 2004 with a Bachelor of Science degree in mechanical engineering.
This article was contributed by Halliburton. CSPG thanks Halliburton for the contribution.
| by Mike Cecile, Mike Jones, and David Greenwood

Even with the uncertainty of a recession the 2009 CSPG CSEG CWLS Convention “Frontiers + Innovation” held at the Calgary Stampede Roundup Centre May 4 to 8, 2009 was a success both in terms of attendance and finances.
More than 3,700 delegates came out to hear new ideas, meet their peers, challenge new concepts, and to prepare themselves for new ways of exploring and working in an ever changing environment. Overall attendance numbers were down 18% from 2008 but can still be considered a success under the circumstances. There were 215 oral presentations, 66 posters, 9 core displays, 123 exhibitors with 62 session chairs and 49 student volunteers. With an expected decline in registration we had to make some adjustments to the budget. In the end we generally met our commitments to our societies who rely on conference revenues. Details of the budget audit will be in society reports at year end.
Planning for the meeting was a little bit disrupted by the fact that we were initially notified that the Roundup Centre was
not making Hall A (east half of the typical Exhibits area) available to our Convention. This changed in early 2009 when we were given Hall A, but did cause some delays in setting out the technical program and created a little more work for the committee.
Two great presentations were held: one of pure entertainment by Stuart Maclean, of the CBC’s Vinyl Café fame, and the second on a more serious note by Sheila WattCloutier, Nobel Prize Nominee, who gave her impressions of the effects of climate change on northern communities. Her presentation generated much interesting discussion.
T ECHNICAL PROGRAM & P OSTERS
This program was distinctly different to other years with a real frontier and innovation focus that included more geophysics than usual and a lot of company participation in frontier talks. Also, we experimented with a plenary session which was quite successful and hopefully will be a standard aspect of the future conventions.
Despite the early date for the convention, which put us in competition with US trade shows and despite the recession, we still had an outstanding Exhibit Floor. We also experimented with a passport program, which invited delegates to visit various preselected booths scattered around the floor

and featured a gift certificate from WestJet. This program was successful and will likely be repeated in the future.
S OCIAL PROGRAMS
Despite budget cuts, the Geoconvention Gala, Beer & Bull, and CSEG Challenge Bowl were all well attended, and featured great food and networking opportunities (and of course Shale Ale!). CSPG also held the 9th Annual Long-Time Members Reception as well as an onsite Awards Reception.
C
In spite of the fact we only had nine core displays, the core area was buzzing with activity. The smaller number of cores allowed for the presenters to show much more of their material, and it allowed for a better viewing in general. In addition, the core video presentations were again a highlight with showings both at the ERCB and the adjacent Geological Survey of Canada building.
The Core Meltdown also went well, even with a late torrential downpour pushing everyone in under the tents to get a little cosier!
F
The biggest plus of the whole conference for us was the committee – their dedication, hard work, efficiency, and camaraderie made everyone outstanding. The heart and soul of our societies are our volunteers and there is nothing more rewarding than working with such a talented and dedicated group!

October 26 - October 30, 200

www.cspg.org/education/education-week.cfm
Instructor: Dr. Basim Faraj, Unconventional Gas Specialist at Talisman Energy
Date: October 26, 2009 Price: $650 Early Bird Price: $585
Description: This one-day course will introduce the fundamental differences between conventional hybrid and shale gas plays. Source and reservoir rock attributes of shale gas plays will be discussed as well as GIP calculations, water, oil and gas saturations, essential laboratory analysis, and optimum geochemical and mineralogical parameters. Slickwater completion lessons learned from the US will be detailed. Canadian plays will be highlighted and discussed.
Instructor: Ashton Embry, Geological Survey of Canada
Date: October 29th-30th, 2009 Price: $700 Early Bird Price: $630
Description: This 3-day course presents the concepts and practical applications of sequence stratigraphy for petroleum exploration. Workshop exercises will emphasize the recognition and correlation of sequence stratigraphic surfaces on well log cross-sections. Following the course, participants will have a clear understanding of the use of sequence stratigraphy for predicting facies types and geometries away from control points
Instructor: Dr. James Dixon, Geological Survey of Canada
Date: October 30th, 2009 Price: $375 Early Bird Price: $337.50
Description: The objective of this half-day course is to help explorationists understand the regional stratigraphic setting of Triassic rocks and how this can be used in a more local exploration program. The course consists of two lectures, some correlation exercises, and an examination of several cores that illustrate various facies types and/or significant stratigraphic surfaces.
Instructor: Hugh Reid, Hugh W. Reid and Associates
Date: October 29-30th, 2009 Price: $1200 Early Bird Price: $1080
Description: This 2-day course will give students the skills to identify potential missed pay by examining DST charts and results, using numerous case histories of wells with poor DSTs, which were later completed commercially. The course is designed for those who have already taken a basic DST course, or are familiar with DST charts, not for absolute beginners.

Instructor: Dr. Kerrie Bann, Ichnofacies Analysis Inc. and Dr. Stuart Tye
Date: TBA Price: TBA Early Bird Price: TBA
Description: This short course has been designed to teach the basics of logging core clastic intervals, with the inclusion of fundamental introductory ichnological techniques. Identification of facies through the integration of sedimentology and ichnology is crucial in building better stratigraphic and palaeogeographic models of reservoirs.
Instructor: Dr. Octavian Catuneanu, Professor in the Department of Earth and Atmospheric Sciences at the University of Alberta
Date: October 26th-28th, 2009 Price: $950 Early Bird Price: $855
Description: This workshop presents the concepts and practical applications of sequence stratigraphy for petroleum exploration and production. All concepts are illustrated with field examples of seismic, well-log, core, and outcrop data. In-class exercises emphasize the recognition of sequence stratigraphy surfaces and systems tracts on well-log cross-sections, seismic lines, and outcrop profiles.
Instructor: Godfried Wasser, M.Sc., Eucalyptus Consulting Inc.
Date: October 27-30th, 2009 Price: TBA Early Bird Price: TBA
Description: This 4-day course discussed both conventional (Oil and Gas) and tight gas reservoirs with case histories from the Belly River, Glauconitic, Cardium, and the Nikanassin/Minnes. Also shown is a systematic approach to a reservoir geological evaluation starting with the rock (core and cuttings workshops) and reviewing petrophysics, thin-section analysis (capillary pressures and relative permeability), and some other aspects or reservoir engineering.
Instructor: Peter Cockcroft, Chairman of Blue Energy
Date: Price: TBA Early Bird Price: TBA
Description: This course will be valuable to all explorationists and managers who are involved with farm-ins and farm-outs. With the vast increase in the number of companies active internationally during the past five years, and the resulting intensive acquisition and divestment “deal flow”, this course on the real-world aspects of farming-in and farming-out will appeal to explorationists, commercial, and legal personnel. Emphasis is on the practical aspects of the farm-out process, including the negotiating and dealing with joint venture partners. Attendees will gain a practical knowledge of initiating, the ensuing process, the economics, and negotiating farm-ins and farm-outs of exploration and production assets. TBA

Be ST GeOLOGICAL ORAL
PRe S enTATIOn
Middle to Late Permian Sedimentation in the Sverdrup Basin, Canadian Arctic: A 40-Year Old Stratigraphic Problem Resolved
Benoit Beauchamp,* Charles Henderson, and Steve Grasby
HOnOuRABLe MenTIOn –
GeOLOGICAL ORAL PRe S enTATIOn
Oil Fingerprinting for Production Allocation: Exploiting the Natural Variations in Fluid Properties Encountered in Heavy Oil and Oil Sand Reservoirs
Barry Bennett,* Jennifer J. Adams, and Stephen R. Larter
HOnOuRABLe MenTIOn –
GeOLOGICAL ORAL PRe S enTATIOn Correlation of Sequences and the Global Eustasy Paradigm: A Review of Current Data
Andrew D Miall*
Be ST GeOLOGICAL POSTe R
High Resolution Sedimentology of the Upper Jurassic Nikanassin Formation in the Grande Cache area of Alberta
Jon Noad* and Torrie Turner
HOnOuRABLe MenTIOn –
GeOLOGICAL POSTe R
Shallow Unconventional Cretaceous Shale Gas in Southwestern Manitoba
Michelle P.B. Nicolas* and James D. Bamburak
HOnOuRABLe MenTIOn –
GeOLOGICAL POSTe R
The Dynamic Interplay of Oil Charge, Basin Dynamics, Caprock Leakage, and Gas Generating Biodegradation Produces Heavy and Super-Heavy Oil Fields: Examples from Western Canada
Jennifer Adams,* Haiping Huang, Barry Bennett, and Steve Larter
Be ST STu DenT GeOLOGICAL ORAL
PRe S enTATIOn
The Formation of a Miocene Deepwater Erosional Unconformity and the Effects on Subsequent Deposition Patterns on the western Scotian Slope, Canada
Calvin Campbell,* David Mosher, Mark Deptuck, and Grant Wach
HOnOuRABLe MenTIOn –
STu DenT GeOLOGICAL ORAL
PRe S enTATIOn
Unraveling the Complexities of Deltaic Strata
in the Lowermost Nikanassin Group, NW
Alberta: Insights into Reservoir Architecture and Palaeogeography
Brett Miles* and Stephen Hubbard
HOnOuRABLe MenTIOn –
STu DenT GeOLOGICAL ORAL
PRe S enTATIOn
New Insights into Early Permian Paleogeography of the Fosheim-Hamilton sub-basin, Ellesmere Island, Nunavut
Michael L. Wamsteeker,* Benoit Beauchamp, and Charles M. Henderson
Be ST STu DenT GeOLOGICAL
POSTe R An D An DRe W D. BAILLIe AWARD
Geometry and Kinematic Interpretation of a Triangle Zone in the Central Alberta Foothills Josgre Salazar,* Deborah Spratt, and Don Lawton
HOnOuRABLe MenTIOn –
STu DenT GeOLOGICAL POSTe R
Synkinematic Channel Depositional Architecture in Active Fold and Thrust Belt Revealed by 3D Seismic Visualization, Example from Deepwater South East Asia
Erlangga Septama*
HOnOuRABLe MenTIOn –
STu DenT GeOLOGICAL POSTe R
Point Bar Modeling, Middle McMurray Formation, Alberta
David J. Patruyo,* Haiping Huang, Stephen Hubbard, and Ron Spencer
Be ST GeOPHySICAL ORAL PRe S enTATIOn
Using Timelapse Seismic to Monitor the THAI Heavy Oil Production Process
Rob Kendall*
HOnOuRABLe MenTIOn –GeOPHySICAL ORAL PRe S enTATIOn Efficiency and Accuracy Enhancement for One-Way Wave Equation Migration through Improved Mapping Function in the Time-Shift Imaging Condition
Mark Ng*
HOnOuRABLe MenTIOn –
GeOPHySICAL ORAL PRe S enTATIOn Applying the Phase Congruency Algorithm to Seismic Data Slices – A Carbonate Case Study
Brian Russell,* Dan Hampson, and John Logel
HOnOuRABLe MenTIOn –
GeOPHySICAL ORAL PRe S enTATIOn
Converted Wave Receiver Statics from First Break Mode Conversions
Kristof De Meersman* and Marcelo Roizman
Be ST GeOPHySICAL POSTe R
An Azimuthal-AVO-Compliant 3D Land Seismic Processing Flow
David Gray*, Darren Schmidt, Nirupama Nagarajappa, Charles Ursenbach, and Jon Downton
HOnOuRABLe MenTIOn –GeOPHySICAL POSTeR
Regime Rays: Visualizing the Fermat/Snell Loci in Homogeneous Anisotropic Media
William J. Vetter*
HOnOuRABLe MenTIOn –GeOPHySICAL POSTeR
Borehole Microseismic Monitoring to Optimize Hydraulic Fracturing and Re-Fracturing Treatments
Joël H. Le Calvez,* John Daniels, Stewart Taylor, and Meredith Appelt
Be ST STuDenT GeOPHySICAL ORAL PReS enTATIOn AnD
An DReW D. BAILLIe AWARD
Making FX Interpolation more Robust by Spectrum-Guided Reconstruction Mostafa Naghizadeh* and Mauricio Sacchi
HOnOuRABLe MenTIOn –
STuDenT GeOPHySICAL ORAL
PReS enTATIOn
Geostatistics with Locally Varying Anisotropy
Jeff Boisvert* and Clayton V. Deutsch
HOnOuRABLe MenTIOn –
STuDenT GeOPHySICAL ORAL
PReS enTATIOn
Seismic Wave Attenuation due to Scattering and Leaky Mode Mechanisms in Heterogeneous Reservoirs
Jun-Wei Huang,* Gilles Bellefleur, and Bernd Milkereit
Be ST STuDenT GeOPHySICAL
POSTeR
Thermal Models Across the Central Nova Scotia Slope Basin Constrained by New Marine Heat Flow Measurements
Eric Negulic,* Keith Louden, P.K. Mukhopadhyay, and Mladen Nedimovic
HOnOuRABLe MenTIOn –
STuDenT GeOPHySICAL POSTeR Impedance Inversion of Blackfoot 3D Seismic Dataset
Abdulsalam Swisi* and Igor Morozov
HOnOuRABLe MenTIOn –
STuDenT GeOPHySICAL POSTeR
Rock Physics Models for the Seismic Velocity of Cracked Media
Zimin Zhang* and Robert R. Stewart
Be ST PeTROPHySICAL ORAL
PReS enTATIOn
A New Quantitative Method for Analysis of Drill Cuttings and Core for Geologic, Diagenetic, and Reservoir Evaluation
Jon Sliwinski,* Michael Le Strat, and Murray Dublonko
Be ST CORe PReS enTATIOn
Stratiform Carbonate Breccias of the Grosmont Formation, Alberta Part B: Petrography and Origin
Kent Barrett* and John Hopkins
HOnOuRABLe MenTIOn – CORe PReS enTATIOn
Update on the Bakken in Southeast Saskatchewan: Stratigraphic Relationships, Sedimentology, and Diagenesis Explored Erik Nickel* and Dan Kohlruss
Be ST STuDenT CORe
PReS enTATIOn
A Stratigraphic Framework for the JurassicCretaceous Nikanassin Group, Northwestern Alberta, Canada
Brett D.Miles,* Stephen Hubbard, Keegan Raines, Ross B. Kukulski, Robert M. Fisher, and John-Paul Zonneveld
HOnOuRABLe MenTIOn –STuDenT CORe PReS enTATIOn
Depositional Setting of the Upper DevonianLower Mississippian Bakken Formation of Subsurface Saskatchewan: Integrating Sedimentologic and Ichnologic Data
Solange Angulo* and Lois Buatois

The Stanley Slipper Medal is the CSPG’s highest Honour.
“This pioneer and explorer in geology, engineering and natural gas technology bequeathed a fundamental knowledge, years ahead of his time and was considered by many a virtual Leonardo da Vinci of the Petroleum Industry. Slipper, our first President, deserved the honour (unbeknownst to him) of our highest award in the Canadian Society of Petroleum Geologists” (Aubrey Kerr).
The medal is presented annually by CSPG for outstanding contributions to oil and gas exploration in Canada. The contributions of the winner of this award should encompass a number of activities related to aspects of petroleum exploration. Such activities include: initiating and or leading exploration programs, significant discoveries on new or existing exploration trends, teaching and or training of explorationists, and
involvement in and leadership within geological societies and professional organizations.
The Committee is currently calling on the CSPG membership to provide additional nominations for this prestigious award. The Award winner must be a CSPG member and should be able to attend the awards presentation to be held in 2010.
Please include an updated bibliography and letters in support of your nominee.
Nominations should be mailed, faxed or emailed before Friday October 2nd, 2009 to:
CSPG Stanley Slipper Committee
600, 640 – 8th Avenue SW Calgary, AB Canada T2P 1G7
Email: kklein@cspg.org Phone: 403-264-5610
| by Bob Mummery and Penny Colton

The AAPG Imperial Barrel Award (IBA) program is a unique opportunity for teams of students from Universities around the world to analyze real geologic, geophysical, land, economic, and production data. Teams participated in AAPG Section and Region IBA competitions in March and April 2009 to earn the right to represent their Section or Region in the Global IBA competition at the AAPG Annual Convention in Denver, Colorado June 5 and 6, 2009. A total of 88 teams competed worldwide to participate for their region or section at the finals where 10 teams battled for the prizes.
Four teams from Canadian universities competed in Calgary on April 3, 2009 for the right to represent the Canada Region at the competition in Denver. There were two teams from Alberta and two teams from the
East Coast. The teams were composed of five geoscience M.Sc. students and assisted by a faculty advisor.
The University of Alberta team from Edmonton included students Andrew La Croix, Jesse Schoengut, Jamie Craft, Greg Nieuwenhuis, Chelsea Fefchak, and faculty advisor Dr. Murray Gingras. The University of Calgary team included students Greg Godek, Keegan Raines, Melissa Newton, Farshid Forouhideh, David Patruyo, and their advisor Dr. Stephen Hubbard. The two East Coast teams represented Dalhousie University in Halifax Nova Scotia, and Memorial University in St. Johns Newfoundland. The Dalhousie team included students Virginia Brake, Shawn Goss, Michael Giles, Clarke Campbell, Cody MacDonald, and advisor Dr. Grant Wach. The Memorial team included students Adam Gogacz, Tiffany Piercey, Burcu
Gascal Isley, Jennifer Cranshaw, and advisor Dr. Elliott Burden.
Judges for the Calgary competition included Mike Rogers – Manager, Professional Development, Nexen; Craig Lamb – Chief Geoscientist, Husky; Graeme Bloy – VP Exploration, Canada Capital Energy and CSPG President; and Bob Mummery – President, Almandine Resources and AAPG Canada Region Representative. Sponsors for the Calgary event included Nexen Inc., Husky Energy, Talisman Energy, Imperial Oil, Devon, CSPG, AAPG, and the AAPG Canada Region.
The team from Memorial University won the right to represent Canada at the Global IBA Finals competition in Denver, and all expenses were covered for their trip. The Memorial team representing Canada came in third winning the Stoneley Medal and $5,000 for their university. First place (the Imperial Barrel Award and $20,000) went to Moscow State University (Europe Region) and second place (the Selley Cup and $10,000) was awarded to University of Nebraska (midcontinent section).
Canadian universities have done well in the two years they have competed as one of the 10 teams in the finals. Last year the University of Alberta team came in fourth. We are hoping that even more universities from Canada will be competing next year for the opportunity to go the finals in New Orleans Louisiana. More information about the IBA competition can be found at http:// www.aapg.org/iba.

Whatever new technology the future holds, we’ll need plenty of energy to power it. At Shell we’re working on all sorts of ideas to meet the growing demand. And we need ambitious graduates to help us tackle the challenge. Join a company that values diversity, and gives you training, support and career choices to develop your potential. Surround yourself with some of our most accomplished problem solvers. And together we can help build a responsible energy future.
Think further. Explore student and graduate opportunities at www.shell.ca/careers
Shell is an equal opportunity employer.
| by Thérèse Lynch
The 2009 Student Industry Field Trip (SIFT) was a tremendous success. The CSPG’s SIFT committee hosted 31 students in Calgary, Alberta for the first two weeks in May. The 31 students, mostly in their third year of study, were from all of the universities across Canada with geology departments. The students are studying in several fields including geology, geophysics, and petroleum engineering, though most are future geologists. The goal of SIFT is to introduce university students, who might not otherwise have an opportunity, to the Canadian petroleum industry through classroom lectures, core workshops, an exploration game, several field trips, and a variety of opportunities to talk to professionals who work in our industry.
In order to successfully run such a tremendous program year after year, SIFT has phenomenal industry support from the 16 volunteers on the organizing committee to the many industry professionals who volunteer their time as session lecturers and especially from the companies who support us financially. Shell, Encana, ConocoPhillips, Imperial Oil, Devon, Talisman, and Suncor were our major industry sponsors this year.
Over the course of the two-week program the students were exposed to all aspects of the petroleum industry. They attended many talks which covered topics including sequence stratigraphy, geophysics, international and frontier exploration, oil and gas production technology, and well logging. They also spent two days at the EUB core research facility learning about siliciclastic and carbonate depositional environments and what they look like in core, as well as learning about heavy oil and oilsands. The students also went to Dinosaur Provincial Park for a one-day field trip and had the opportunity to visit parts of the park that are not open to the general public, looking at the clastic depositional environments exposed in the
park and, of course, looking for dinosaur bones. They also spent an exciting four days traveling through the Rocky Mountains by tour bus, learning about Western Canadian geology from industry experts Peter Fermor, Kevin Root, and David Repol. Their final outing this year was a tour of the drilling rig at SAIT, giving them the opportunity to view the actual equipment that they have been learning about in some of their SIFT lectures.
In the evenings, the students participated in the Exploration Game, where they were divided into teams of three or four students. During the course of the two weeks, the students drilled wells, bought land, made farm-in and other land deals with the other teams, and learned how to read well logs, and construct stratigraphic and structural cross-sections as well as isopach and structure maps. On the final evening of the game, the teams presented their geological interpretations and explained their exploration strategies to a panel of veteran industry judges in the hope of winning either of the coveted financial or technical awards available from the judges. This year’s winners of the Larry Strong Financial Award were Harun Idris from Acadia University, Nadia Bruemmer from
University of Alberta, Colin Sproat from Brandon University, and Kelsey Uhrynuk from Brock University. This year’s winners of the Bill Ayrton Technical Award were Steve Christie from University of Regina, Maureen Hill from University of Toronto, Jamar Regis from St. Mary’s University, and Farisa Zaffa from University of Western Ontario.
The students were kept very busy by the SIFT Committee through the two weeks but they also had the opportunity to bond with one another and share their many new experiences. They have created a Facebook page for their group and have persuaded some of the non-Facebook users to sign up just so that they can maintain contact with everyone as well as share their photos. Many of the students formed friendships and connections that will last for the rest of their lives and a number of them will hopefully also find jobs in Canada’s petroleum business in future years and will become part of our big team, looking for oil and gas, wherever it may be hiding.


2009 Gussow Geoscience Conference
October 5-7, 2009
Banff, Alberta, Canada
| by Steve Larter, 2009 Gussow Chair
Low-carbon-emission energy sources are urgently needed to support and develop society in a sustainable manner but the timescales of technology replacement mean that fossil fuel carbon, including oil sands bitumen, will be burnt for decades, as energy is needed to support the developed world and to rescue billions from poverty in the developing world. Against this scenario play the conflicting demands of rapidly mitigating any humanimpacted climate change, the reality of carbon markets, and Homo sapiens’ penchant for business as usual, despite the dangers evident. How do we finesse rapid change to low-carbon-emission energy sources while providing continuing economic activities for changing industry sectors through this transition period and permitting continued use of cleaned fossil fuels for the foreseeable future? It is within this complex nexus of social and technical change that will rapidly unfold in the next decade that the oil sands industry must operate in and respond to.
The 2009 CSPG Gussow Geoscience Conference, “Engineering Sustainable Oil Sands Development,” will bring together geoscientists, engineers, environmental scientists, regulators, and policy makers worldwide who are working on the complex technical and environmental issues related to energy recovery from heavy oil and bitumen deposits.
This year the conference focuses on discussion of the complex technical and environmental issues related to energy recovery from heavy oil and bitumen deposits in the context of the restricted
economic climate and public concern over carbon emissions and safe disposal of carbon dioxide.
The conference aims to allow all the key players in the business to report on their activities, make recommendations about next steps, and brainstorm cutting edge solutions or avenues for research in an effort to reduce exploration and production costs and maximize recovery of increasingly remote and heterogeneous heavy oil resources in a sustainable manner.
The program couples a look at the bounding environments of regulation, policy, and economics on oil sands developments with a session called “Routes to Cleaner Energy Recovery from Heavy Oil and Bitumen Resources – The Environmental, Regulatory, Technology and Capital Credit Crunch.”
Many of the issues of recovery efficiency, energy usage, and even the size of the recoverable resource are controlled by a complex interplay of engineering solutions with one of the most complex reservoirs and complex fluid property systems of any oil reserve on Earth. This complexity is enormous and our skills at predicting reservoir and fluid variability pre-drill are reviewed in a session entitled “The Origin and Prediction of Key Rock and Fluid Heterogeneities in Oil Sands, Carbonate Bitumen, and Heavy Oil Resources.”
The dramatic impact of the geological and fluid property heterogeneities on recovery processes and routes to the
innovative engineering solutions needed are discussed in a session called “Impact of Geological Heterogeneities on Recovery Processes and Engineering Solutions to more Sustainable Energy Recovery from Oil Sands.”
While geological heterogeneity is a major factor in oil sands and bitumen carbonate reservoir developments, water usage and management is an equally important issue. Leading figures from the water management sector will look at the past, present and future of water management during bitumen and heavy oil production in the session “Water Management (supply, disposal) during Heavy Oil/Bitumen Production.”
Management of carbon during petroleum production is environmental and economic reality today and with burgeoning carbon markets and societal concern over emissions will become an even larger part of the future development plans of the energy sector. Covering all aspects of carbon management from sources, capture technologies, and storage options we have a session called “Carbon Management during Heavy Oil/Bitumen Production.”
No Gussow Conference would be complete without a field trip and core conference focusing on key issues for industry and research and thus we have a Field Trips and Core Conference program.
Details for the program and conference registration can be found at http://www. cspg.org/conventions/Gussow2009/index. cfm. We hope to see you there.

| by Markus Ebner/Pratt Barndollar
The Kids in Science Program (KISP) hit the joint CSPG/CSEG/CWLS convention floor running again this year on the morning of May 5, 2009. The KISP program hosted 170 grade 8 and 9 students from Our Lady of Peace and Sir John Franklin Junior High Schools. The goal of the program is to give the kids information about the earth sciences in a fun and interactive way. As a symbiotic-side effect, the kids also liven up the atmosphere across the floor!
Small groups with up to six students visited 25 corporate and professional society exhibit booths over a three-hour period. At each booth the kids saw a short presentation by the host exhibitor followed by a questionand-answer worksheet session related to the host’s technical or industry role. Students were accompanied by 29 “guides” – industry volunteers who answered general questions and kept the procession moving in tune and on time around the convention floor.
Following the visit to the exhibit floor, the students, teachers, and volunteer guides enjoyed lunch in the Stampede Blue Room, followed by a rousing game of “Geo-Pardy,” where they had the opportunity to test their geoscience knowledge in friendly competition. David Moore and Markus Ebner did an excellent job as co-hosts, announcers, and judges.
In the weeks before the convention trip, students attended informal, interactive, inschool presentations on geology, geophysics, and paleontology. These presentations offered hands-on exposure to rocks and fossils and to the tools used by modern industry, combined with some one-on-one time with professional geoscientists. The Burgess Shale fossils and a “seismograph” were popular interactive experiences.
Feedback received from the students, teachers, volunteer guides, and the hostexhibitors has been unanimously positive. The students loved the exhibit floor –some were overheard during the lunch proclaiming that they were changing their future profession choice from rock star to geologist. The guides and exhibitors enjoyed the interaction and energy of a captive young crowd. A number of host-exhibitors’ feedback forms mentioned that volunteering with the KISP program actually increased traffic to their booths with professionals wanting to know what the ‘buzz’ was about around their booths. Teachers are using the question sheets prepared on the trip to incorporate geoscience instruction into their programs.
KISP is sponsored by the Burgess Shale Geoscience Foundation and Imperial Oil; the CSEG and APEGGA graciously donated funding this year. Our professional societies have hosted convention visits to students in the past, but KISP in its present form was developed by Randle Robertson, Director of the Burgess Shale Geoscience Foundation, and Dave Middleton, former CSPG Outreach Director. Robertson and Middleton recognized that junior and senior high school curricula are generally lacking earth science units at a time when students are formulating their future career decisions.
Exposure to the wide variety of geoscience opportunities available to them may influence their career choice. During their lifetimes, these students will face critical issues on power generation, water supply, waste disposal, air quality, and food supply. It is important to give them the knowledge necessary to make appropriate decisions, even if they do not go on to become professional earth scientists.
The objectives of KISP are:
1) to re-introduce Earth Sciences into the science curricula for junior high school students and teachers in Alberta;
2) to expose students to various career options and appropriate levels/types of education in the geological sciences;
3) to create an interest among junior high school students to pursue post-secondary studies in the earth sciences;
4) to provide students with the knowledge to make informed decisions on management of diminishing resources; and
5) to inform students about the significance of the Burgess Shale UNESCO–World Heritage Site.
The Burgess Shale Geoscience Foundation, Imperial Oil, the CSEG, and APEGGA wish to thank all of the volunteers, students and teachers who participated in KISP 2009, with a special thanks to the host-exhibitors and to the KISP Committee members. Even in these times of temporary economic uncertainty in our industry, it was clear that the enthusiasm and support for excellent programs such as KISP have not wavered. The KISP organizing committee would like to offer a heartfelt thank-you to everyone that contributed their time, energy, and resources to make this program a continued success once again this year.
The KISP organizing committee is working on an expanded initiative for next year’s GeoCanada 2010 convention and will be calling for more volunteers. Please contact Markus Ebner at m.ebner@shell.com or (403) 691-3764 for more information.

Glenbow Archives nd_3_4155a (detail).
For more information or to apply for a ConocoPhillips Glen Ruby Memorial Scholarship, visit: www.cspg.org or www.conocophillips.ca
ConocoPhillips Canada is proud to continue the ConocoPhillips Glen Ruby Memorial Scholarships in Geosciences. These scholarships are presented each year to second, third, and fourth years students to promote excellence in petroleum GEOLOGY and GEOPHYSICS.
$2,000 $3,000 $5,000 2nd year geoscience student 3rd year geoscience student 4th year geoscience student
ConocoPhillips Canada is pleased to recognize and honour a pioneer who has had a lasting influence on the Canadian Oil and Gas industry. From 1926 to 1929, Glen Ruby was Vice President and General Manager of Marland Oil’s Canadian partnership, Hudson’s Bay Oil and Gas. While in Alberta he was a driving force behind the inaugural meeting and formation of the Alberta Society of Petroleum Geologists (renamed Canadian Society of Petroleum Geologists in 1972).
Glen Ruby dedicated his life to exploration and has been recognized as one of the great pioneers in the global search for oil and gas. In addition to Canada, he successfully explored for oil in Chile, Alaska, and the US Rocky Mountain basins. At one time he was credited with having made the most northerly and southerly oil discoveries in the world.
Since inception, the Canadian Society of Petroleum Geologists has been a forum for sharing ideas and knowledge about the geology of Western Canada and the Canadian frontiers. This knowledge exchange has played a fundamental role in the successful development of the Canadian oil industry. Glen Ruby’s legacy thrives three-quarters of a century later.
ConocoPhillips has been active in Canada since 1880 through the activities of heritage companies including Continental Oil Company, Marland Oil/ Hudson’s Bay Oil and Gas, British American, Royalite, Asamera, Pennzoil, Stampeder, Mannville, Crestar, Gulf Canada Resources, Poco, Canadian Hunter, Burlington Resources, Conoco Canada, and Phillips Petroleum. We proudly honour Glen Ruby as a pioneer and industry leader and we are pleased that the memorial scholarships will assist in the development of future geoscientists.
CSPG Trust
Geoscientists for our future


First Iraqi company providing logging services for:
• Open hole services
• Cased hole services
• Perforations
• VSP
• PLT
Unique system, Decades of tools performance and accuracy

| by Tannis McCartney
A new school year is underway at postsecondary institutes across Canada, making it a good time to highlight some of the programs offered by the University Outreach Program. The program’s mandate is to link university students with both the CSPG and the petroleum industry, provide forums for learning and promote careers in the geosciences. This happens through programs such as the lecture tours, student geological conferences, and CSPG Student Chapters.
The University Outreach Committee sponsors lecture tours annually. It is a chance for selected CSPG members to speak at geology departments across Canada. The students benefit from hearing about what working in the petroleum industry is really like, and get valuable tips on how to plan their own careers.
Each year, three student geological conferences are held across Canada: the Advances in Earth Science Research Conference (AESRC), the Atlantic Universities Geological Conference


(AUGC), and the Western Inter-University Geosciences Conference (WIUGC). In addition to sponsoring awards at these conferences, the University Outreach Committee has a booth at all three.
Geosciences students at any accredited Canadian university, college, or technical institute can start a CSPG Student Chapter with at least five members in second year or higher. The benefits to students who start and join a student chapter are enormous. Student Chapters receive copies of CSPG publications – the monthly Reservoir and the quarterly Bulletin of Canadian Petroleum Geology. Students have the chance to attend technical luncheons, the annual convention, and field trips. There are additional opportunities for student members to connect with people already working in industry at both technical and non-technical events.
If you are a student, or know of a student, interested in getting a CSPG Student Chapter started at your college or university, here
are the people you can contact for more information:
Student Chapters – West: Mark Radomski, Talisman Energy mradomski@talisman-energy.com
Student Chapters – Ontario: Cole Webster, EnCana Cole.Webster@encana.com
Student Chapters – east: Denise Hodder, Hibernia Development & Management Corporation denise.n.hodder@exxonmobil.com
Student Chapters – Québec: Marianne Molgat, Talisman Energy mmolgat@ talisman-energy.com
For general inquiries about the University Outreach Program, including sponsoring various programs, please contact Simon Haynes, Shell Canada Limited, simon.haynes@shell.com
Engineering Sustainable Oil Sands Development
October 5 – 7, 2009
Banff, Alberta, Canada
Please join us October 5 – 7, 2009 at the Banff Centre for the Gussow Geoscience Conference.
The Gussow Geoscience Conference is delivered by world-renowned specialists and will focus on the energy environment interface yielding a better understanding of the complex impact of geological heterogeneity in bitumen reservoirs on feasible routes to sustainable energy recovery from heavy oil and bitumen reservoirs.
Register online at: http://www.cspg.org/conventions/Gussow2009/
$800 registration fee includes conference sessions, accommodation, meals and parking.
Register now to guarantee a room at the world-renowned Banff Centre!
| by Susan R. Eaton
One hundred years ago, on Mount Burgess in Yoho National Park, British Columbia, Dr. Charles Doolittle Walcott, former head of the Smithsonian Institute and the United States Geological Survey, discovered the world’s most important fossilized animals.
In May, the Burgess Shale Geoscience Foundation (BSGF) and Big Rock Brewery launched “Shale Ale,” a historical twist on Big Rock’s Traditional Ale. A limited edition beer made exclusively for BSGF, the Shale Ale label depicts Dr. Walcott surrounded by the 505-million-year-old Burgess Shale fossils, famous for their amazing diversity, bizarre life forms, and out-of-this-world appendages.
Shale Ale was launched in Calgary – to great acclaim – at the Gala of the annual technical convention of the Canadian Society of Petroleum Geologists, the Canadian Society of Exploration Geophysicists, and the Canadian Well Logging Society. In fact, Shale Ale stocks ran out during the Gala, as the 3,700 geologically savvy attendees enthusiastically saluted Walcott’s monumental discovery –the empties with their amazing artwork labels, were taken home as collectors’ items.
“This is the champagne of beers to celebrate the contribution that geologists have made to science,” said Randle Robertson, executive director of the BSGF. “Shale Ale kicks off our 1909-2009 Centennial Celebrations which are designed to engage the public in geology, climate change, and the history of exploration and discovery in the Rocky Mountains.”
During the past 14 years, the BSGF, a not-forprofit, geoscience educational organization based in Field, British Columbia, has guided more than 45,000 clients from all over the world, to the Burgess Shale-Walcott Quarry and Mt. Stephen. These two fossil locales in Yoho National Park were protected, in 1981, when they were declared UNESCO World Heritage Sites.
“We are pleased to support the Burgess Shale Geoscience Foundation, to promote its vision to inspire appreciation for the earth and life sciences, and to continue to find ways to educate the public on the importance of current and future environmental issues,” said Jim Button, Vice President Corporate and Community Affairs for Calgary-based Big Rock Brewery. Button, new to the Burgess Shale, was ‘gob-smacked’ by the geological community’s passion for Shale Ale which

captured the imaginations of geologists, from across Canada, the United States, and Australia.

“Certainly beer and geologists are a natural fit, and, as such, Shale Ale was very well received at the conference,” said David Brown, a senior petroleum geologist with the Canada-Nova Scotia Offshore Petroleum Board. “As a marketing tool it certainly highlighted the Burgess Shale, and the efforts of the BSGF to enlighten the public about this geological treasure.”
Many years ago, Brown had a rare opportunity to view the Burgess Shale specimens in the Royal Ontario Museum’s collection vaults. “It was a humbling experience to marvel at these jewels of creation, and the bizarre forms that life displayed so long ago, a ‘limited’ edition” much like Shale Ale!”
Brown’s comments were echoed by Dr. Clint Tippett, a principal regional geologist with Calgary-based Shell Canada Energy.
“Geologists tend to be a bit more beeroriented than most, partly by reputation and partly because socializing is central to the discussion of new ideas and the sharing of results in the geological community.” Tippett volunteers as an instructor for the BSGF’s annual science teachers’ workshop, a four-day crash course on Geology 101 that uses the Canadian Rockies as its teaching platform.
“Shale Ale raises the BSGF’s profile because it is a topic of conversation.” Added Tippett, “It obviously helps when the beer is a good one.”
“Shale Ale has an immediate connection and charm for geologists,” said Philip Benham, a staff geologist at Shell Canada Energy who also assists in the annual science teachers’ workshop. “My friends who are not geologists are intrigued by the label, and I have had give them lectures on the Burgess Shale creatures.” Added Benham, “Clearly, the image designed for the label has captured their imagination; it has served to educate the public about the anniversary and significance of the Burgess Shale more than I could have expected. So, as a marketing tool, I can’t imagine a better idea – good thing we registered the image.”
For more information on the BSGF and its extensive 2009 Centennial Celebrations, visit: www.burgess-shale.bc.ca.
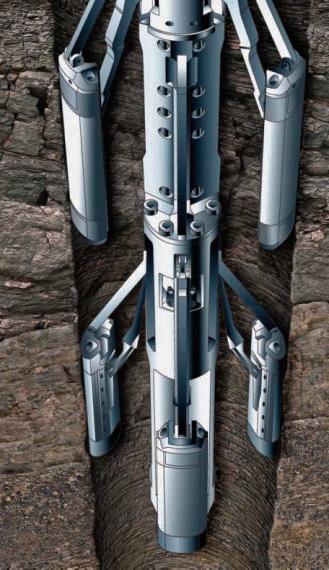
Susan R. Eaton (susaneaton@shaw.ca) is a Calgary-based geologist, geophysicist, and freelance writer. Susan is also a volunteer with the Burgess Shale Geoscience Foundation.


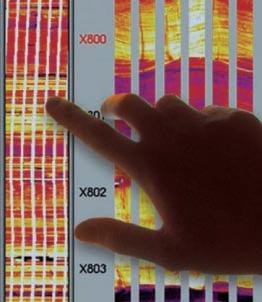
www.halliburton.com/wireline.

customer service