Please submit RESERVOIR articles to the CSPG office. Submission deadline is the 23rd day of the month, two months prior to issue date. (e.g., January 23 for the March issue).
To publish an article, the CSPG requires digital copies of the document. Text should be in Microsoft Word format and illustrations should be in TIFF format at 300 dpi., at final size. For additional information on manuscript preparation, refer to the Guidelines for Authors published in the CSPG Bulletin or contact the editor.
Technical Editors
Ben McKenzie Colin Yeo (Assistant Tech. Editor) Tarheel Exploration EnCana Corporation
Tel: 403-277-4496 Tel: 403-645-7724
Email: bjmck28@shaw.ca
Coordinating Editor
Email: colin.yeo@encana.com
Caitlin Young, Publications Coordinator, CSPG
Email: caitlin.young@cspg.org
ADVERTISING
Advertising inquiries should be directed to Caitlin Young, email: caitlin.young@cspg.org. The deadline to reserve advertising space is the 23rd day of the month, two months prior to issue date.
The RESERVOIR is published 11 times per year by the Canadian Society of Petroleum Geologists. This includes a combined issue for the months of July and August. The purpose of the RESERVOIR is to publicize the Society’s many activities and to promote the geosciences. We look for both technical and non-technical material to publish. Additional information on the RESERVOIR’s submission guidelines can be found at http://www.cspg.
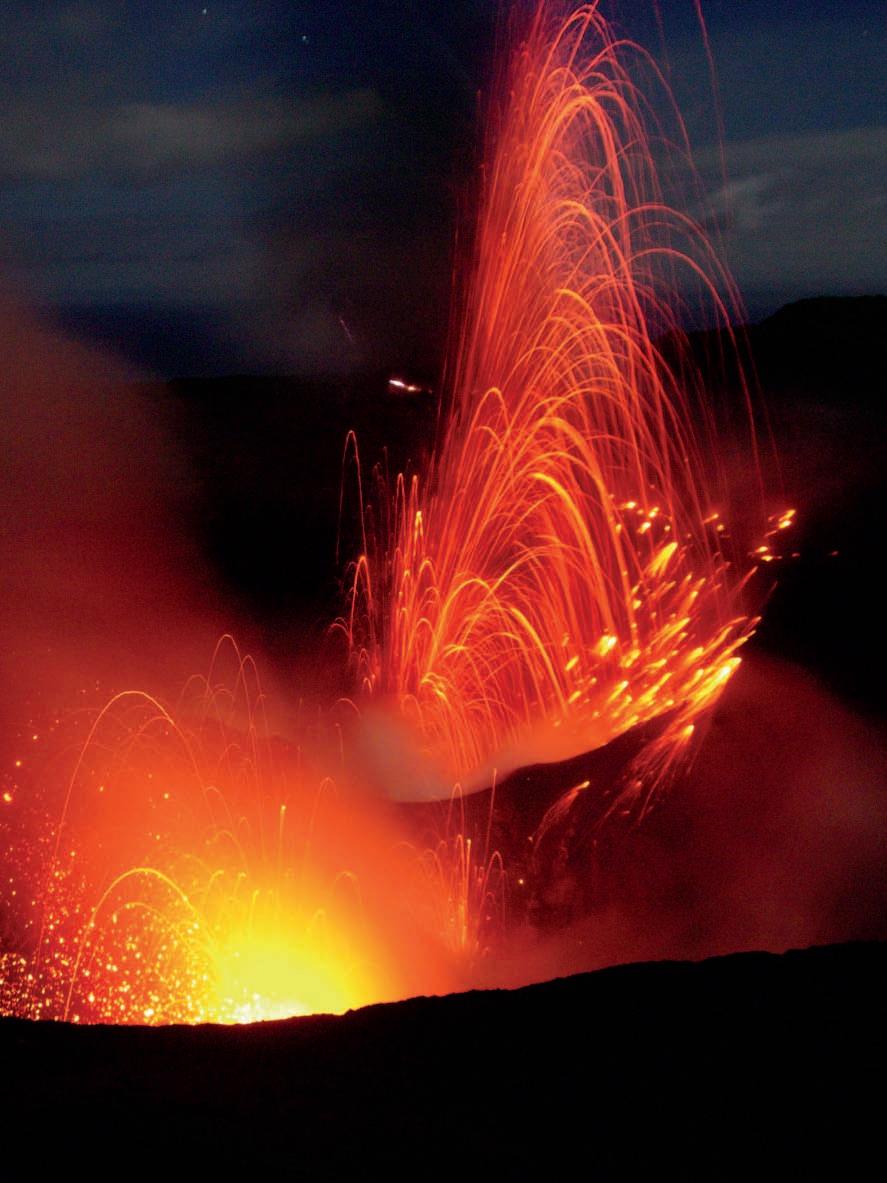
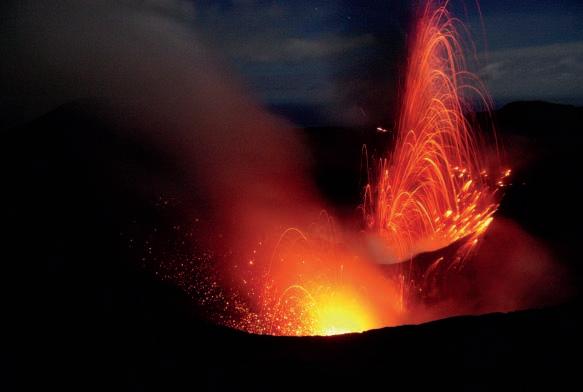
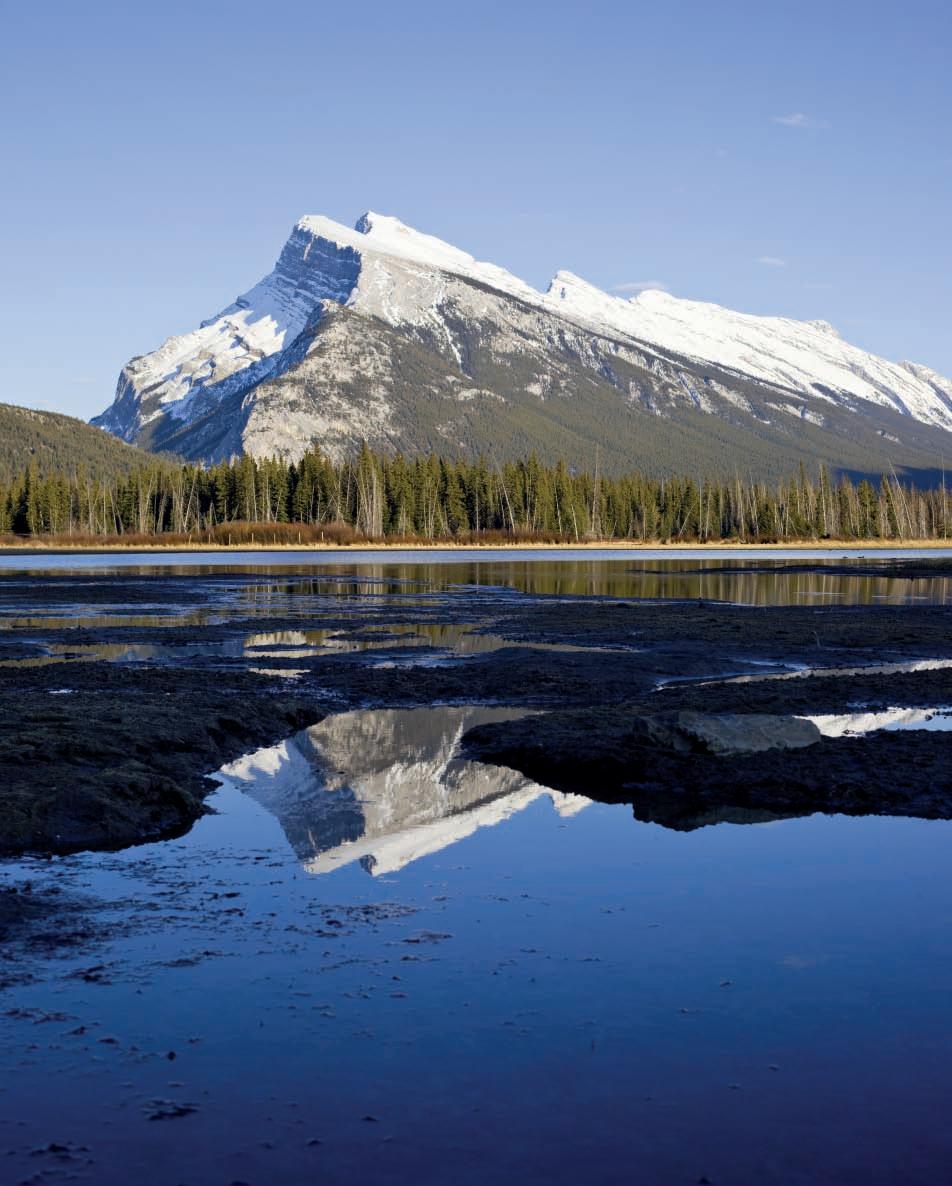
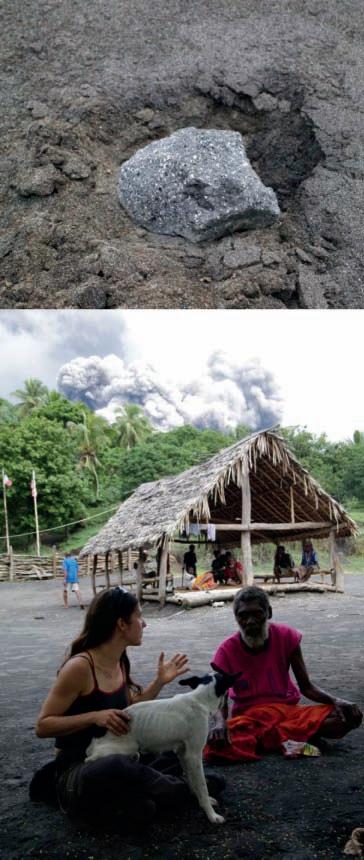
Photo by Philip Benham.
Theme: Unconventional Resources – Focus on Shales
Five Great Days of the Finest Geoscience Training for One Low
Courses will include:
• Reservoir Characterization & Production Properties of Gas Shales—Miller
• Understanding Heterogeneity in US Shale Plays—Salter and Lewis
• Shale Gas Geophysics for Non-Geophysicists —Close and Perez
• Seismic Attributes for Shale Plays - Focus on the Niobrara Shale—Ouenes
• Log Analysis of Shaly Sands—Asquith
• Recognizing Unconventional Pay from Wireline Logs: Case Studies—Stambaugh
• Introductory Geochemistry for Shale-Gas and Tight Oil—Laughrey
• Basic Tools for Shale Exploration—Bridges
• The Bakken Petroleum System of the Williston Basin—Sonnenberg
• Exploration in the Niobrara Shale—Sonnenberg
• Risk, Uncertainty and Decision-Making in Unconventional Resource Plays—Haskett
Hosted by the Norris Conference Center 803 Town & Country Lane Houston, TX 77024
Phone: 713-590-0950
Fax: 713-590-0961
Special AAPG Group Rates at Nearby Hotels! (Three concurrent sessions each day – mix and match according to your interests and training needs. Buffet Lunch and refreshments included each day.)
Registration and information:
Toll-free (U.S. and Canada) 888-338-3387, or 918-560-2650
Fax: 918-560-2678
E-mail: educate@aapg.org
Download a registration form at: www.aapg.org/education/fec.cfm
A message from the CSPG Outreach Director, Steve Dryer
Most people think oil comes from big underground caves...
...and that oil companies rank right up there with politicians and everyone wants cheap gasoline.
We have a few challenges when we are out there talking about our industry and profession. As we are able to inform people about our science and industry, we start to change these misconceptions. This is Outreach.
CSPG Outreach has two broad target audiences and success with each one has different outcomes. The first
target audience is the general public. Our objective is to engage and educate about geology, the petroleum industry, and geosciences in general. These people are interested in knowing more about their world and how it operates but are probably not directly involved in our profession. We want them to know what we are about, for example, oil and gas comes from tiny holes (usually) in the rock, not caves. We want them to know we care about our environment and are continually trying to improve
(Continued on page 7...)
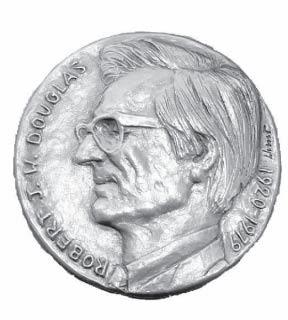
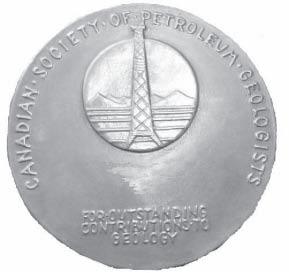
RJWDOUGLASMEDAL CALLFORNOMINATIONS
The RJW Douglas Medal is awarded annually by the Canadian Society of Petroleum Geologists for outstanding scientific contributions to the understanding of sedimentary geology in Canada, commending major contributions to regional tectonics, petroleum, and structural geology.
The award is open to all geologists who follow the example of Bob Douglas in contributing to the development of Canadian sedimentary, petroleum, and structural geology.
Nominations for the award of the medal must be endorsed by at least three members of the CSPG. Nominations may be proposed at any time, but to be considered for a particular year, they must be received by the Society before September 1
5.
The sponsors of a nominee for the award should supply:
A curriculum vitae (outling the nominee’s career and previous honours or distinctions).
A list of publications by the nominee.
A summary of the nominee’s achievements in a form suitable for use as a citation for the award.
An analysis of the nominee’s achievements, highlighting the contributions for which he or she is being recognized, and relating these to the appropriate publications in the bibliography.
The last item of information is a key part of the nomination and should convey the magnitude and scope of the nominee’s scientific contributions, with comments on the influence that these contributions have had on others. An example of a submission may be provided on request.
Completed nominations should be sent to:
Margot McMechan
CSPG Douglas Medal Committee Chairman, c/o Margot McMechan
GSC – Calgary
3303, 33rd Street NW, Calgary, Alberta T2L 2A7
Telephone (403) 292-7154
Email: mmcmecha@nrcan.gc.ca
Since 1927...
CORPORATE SPONSORS
DiamonD
IHS
geoLogIC SyStemS Ltd.
SCHLumberger Canada Ltd.
Platinum agat LaboratorIeS CenovuS
ConoCoPHILLIPS
nexen InC.
taLISman energy
PoggenPoHL
GolD aPegga
CSPg eduCatIonaL truSt Fund devon Canada
enCana
ImPerIaL oIL
SHeLL
WeatHerFord LaboratorIeS
Silver
arC FInanCIaL CorPoratIon roxar
Bronze ParadIgm
geovarIanCeS
CSeg FoundatIon
rPS boyd PetroSearCH
HaLLIburton energy ServICeS
tuCker WIreLIne ServICeS
(...Continued from page 5)
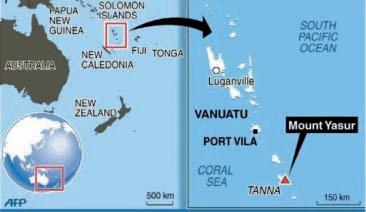
our practices. t his audience is served by such CSP g programs as the Honorary address where a speaker (or speakers) is brought to the Jubilee a uditorium to talk on a topic of scientific interest. t his year we have two speakers who will present on glaciation and volcanism. t his is timely, given the volcanic activity in Iceland. a nother major initiative is our involvement with e arth Science for Society ( e SFS) where, during this year’s a nnual Convention, around 2,000 Junior High students and 600 members of the public were able to interact with a variety of exhibits about the geosciences.
reaching our second target audience will have more of a direct benefit to the CSP g. t his target group is the young people we want to attract to the field of geology, specifically petroleum geology. We want High School students to know about what we do so they will consider studying geology. We want to be in contact with those who do make that choice so they have good connections with the petroleum
industry. We have two committees working directly with students: u niversity o utreach and SIF t (Student Industry Field trip). If we are successful in attracting young people to our industry, we may not be able to provide cheap gasoline but we will help insure that we don’t run out.
k nowing who we want to communicate with is only the first part. I’ve mentioned a few of our programs, but there are many more and there is opportunity for involvement on your part. that involvement can be in the organizational stage or in direct participation, or both. a s your o utreach d irector, I want to find those of you who are interested in being a part of this. t he CSP g needs those people who want to communicate their passion for our science. We are looking for you but don’t be shy…contact us.
AS OF JUNE 10, 2011
technicaL Luncheons SEPTEMBER LUNCHEON
Drumheller
revisited:
Insights into reservoir architecture and compartmentalization prediction
in marginal marine
systems
SPEAKER
Professor Bruce a insworth Australian School of Petroleum, University of Adelaide
11:30 am tuesday, s eptember 13, 2011 c algary, te L us c onvention c entre c algary, a lberta
Please note: the cut-off date for ticket sales is 1:00 pm, thursday, september 8, 2011 csPg member ticket Price: $42.00 + gst. non- member ticket Price: $45.00 + gst.
Each CSPG Technical Luncheon is 1 APEGGA PDH credit. Tickets may be purchased online at https://www.cspg.org/eSeries/source/ Events/index.cfm.
Stratigraphic architecture at a subparasequence scale controls fluid flow and compartmentalization in many marginal marine reservoirs. However, this scale falls below the resolution of current sequence stratigraphic techniques and, as such, there is no rigorous methodology or classification to describe these deposits. To address this issue, new concepts have been developed for the classification of depositional processes and stratigraphic architecture in both modern and ancient marginal marine systems. This methodology facilitates collation and cross-applicability of geometrical data from modern to ancient systems, and viceversa. The new architectural classification system is hierarchical in nature and works on five different spatial levels. The levels correspond to different scales of
observation and are required to describe properly the stratigraphic variability in the subsurface.
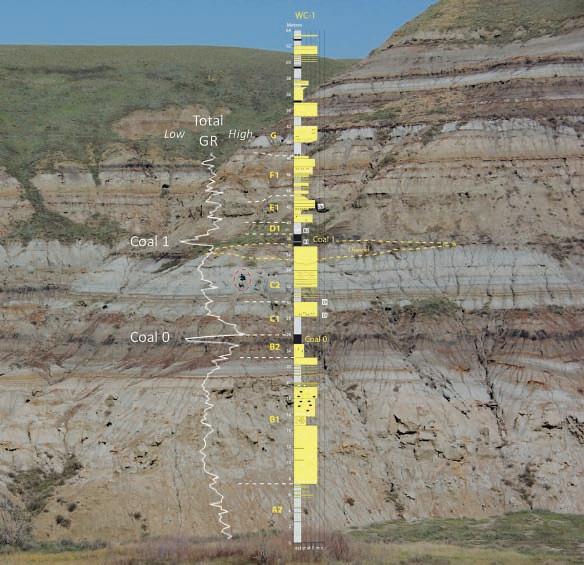
The new classification schemes have direct applicability to complex, mixed-process marginal marine systems; shorelines where the interactions of wave, tide, and fluvial processes are significant factors in determining sand body architecture. The Campanian, Bearpaw to Horseshoe Canyon Formation transition in the d rumheller area, Alberta, is a classic example of a mixed-process marginal marine system. Outcrop sedimentary logging along the Red d eer River Valley (Figure 1) has been combined with core descriptions from four wells close to the outcrop.
The outcrop sedimentary log data has been calibrated to the core data and then the core data to the wireline log data acquired in the cored wells. Spectral gamma ray data has also been gathered
Webcasts sponsored by
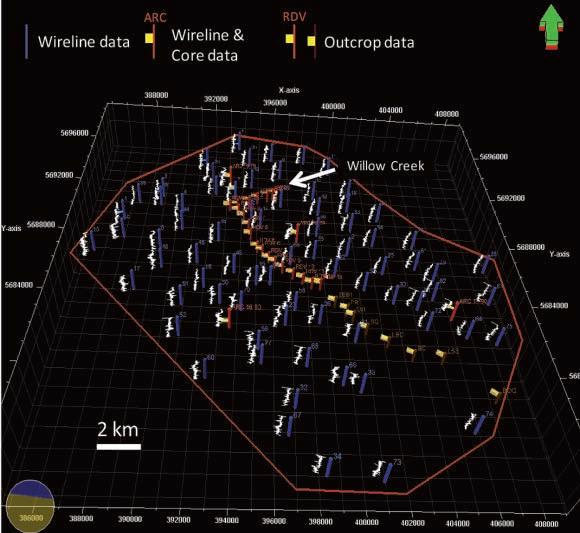
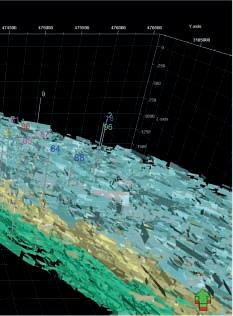
from outcrop locations (Figure 1). This has then permitted interpretation of over 70 well log suites around the outcrop belt and the generation of outcrop, core, and wireline log-constrained, threedimensional (3 d ) reservoir models of the area surrounding the outcrops (Figure 2).
The d rumheller study has been utilised as a test case for the new classification techniques. The talk will demonstrate how the application of these new methodologies can result in improved selection of depositional analogues and geometrical data for 3 d reservoir modelling studies, and improved prediction of stratigraphic compartmentalization potential in marginal marine reservoirs.
BIOGRAPHY
Bruce Ainsworth holds the South Australian State Government Chair of Petroleum Geology at the Australian School of Petroleum, University of Adelaide. He re-
Figure 1. Willow Creek sedimentary log (64 metres thick) and associated outcrop total gamma log (GR). Person circled in red for scale. Bearpaw to Horseshoe Canyon transition, near Drumheller, Alberta. See Figure 2 for Willow Creek location.
(RARG; http://www.asprg.adelaide.edu.au/ RARGwww/rarg_index.html) and the leader of the WAVE Consortium (http://www. asprg.adelaide.edu.au/WAVE/index.htm), an industry-sponsored research collective that focuses on reservoir heterogeneities in mixedprocess (wave/fluvial/tidal) sandbodies.
Bruce has a B.Sc. from Imperial College, UK, an M.Sc. from McMaster University, Canada, and a Ph.D. from the University of Liverpool, UK. He is a member of the American Association of Petroleum Geologists (AAPG); the International Association of Sedimentologists (IAS); the Society for Sedimentary Geology (SEPM); The Geological Society, London; and the Petroleum Exploration Society of Australia (PESA).
joined academia in 2007 following fifteen years of industry experience with Shell International Exploration and Production Company. Bruce worked for five years in Shell Research Laboratories in the Netherlands and gained ten years practical experience in exploration and production companies around the globe. He has work experience
of geological systems from fourteen countries and has niche expertise in sedimentology, seismic and sequence stratigraphy, and the application of the inherent uncertainties in these data and interpretations to multiplescenario three-dimensional reservoir modelling. Bruce is currently the leader of the Reservoir Analogues Research Group
Figure 2. 3D visualization of well, core, and outcrop data utilized for 3D geocellular modelling of the Bearpaw to Horseshoe Canyon transition area in the Red Deer Valley, Drumheller, Alberta. Gamma Ray logs in white. Image courtesy of Changhwan Lee. Well log data courtesy of IHS and AccuMap.
technicaL Luncheons SEPTEMBER LUNCHEON
Canadian Broadcasting Corporation’s Geologic Journey
– World: bringing geology to the nation’s living room
SPEAKER
n ick e yles
University of Toronto
11:30 am m onday, s eptember 26, 2011 c algary, te L us c onvention c entre c algary, a lberta
Please note: the cut-off date for ticket sales
is 1:00 pm, Wednesday, september 21, 2011. csPg member ticket Price: $42.00 + gst. non- member ticket Price: $45.00 + gst.
Each CSPG Technical Luncheon is 1 APEGGA PDH credit. Tickets may be purchased online at https://www.cspg.org/eSeries/source/Events/ index.cfm.
This talk will explore the scientific and logistical challenges of bringing the story of ‘How planet Earth works’ to a wide public television audience. The story of Geologic Journey – World is organized around the life cycles of oceans and supercontinents; the basic cycle of Earth’s long history. It commences in the East African Rift and Red Sea areas, which are examples of incipient and young oceans, respectively, travels on to Iceland where the spreading centre of a mature ocean can be walked over, and examines the tectonically troubled Pacific Rim where oceanic crust is being subducted below encroaching land masses as the next supercontinent (Pangea II) begins to form. The Himalayas are the remains of a dead ocean. The talk also touches on
GeoEdges Inc.
Webcasts sponsored by
the peoples that live in tectonically active areas and the tectonic threat to the world’s emerging megacities.
BIOGRAPHY
Nick Eyles, Ph.D., D.Sc., P.Geo., is Professor of Geology at the University of Toronto and completed graduate work in glaciology and glacial geology at Memorial University in Newfoundland, and at East Anglia in UK. His subsequent research career has taken him across Canada, around the world and also back in time through Earth’s 4-billionyear history exploring its glacial climates. His other interest is in urban environmental issues. He is a prolific award-winning author of best-selling books such as ‘Ontario Rocks’ and ‘Canada Rocks’ (with Andrew Miall) and Canadian Shield: The Rocks that made Canada. He was chief scientific advisor to the Canadian Broadcasting Corporation’s highly successful series ‘Geologic Journey-Canada’ in 2007 and the host of the five-part ‘Geologic Journey – World,’ which aired on ‘The Nature of Things’ in 2010, CBC’s most widely viewed documentary series to date.
Detailed and accurate geology at your fingertips in Petra, GeoGraphix, ArcGIS, AccuMap, GeoScout and other applications for information contact:
Western Canada: Slave Point, Swan Hills, Leduc, Grosmont, Jean Marie, Horn River Shales, Elkton, Shunda, Pekisko, Banff, Mississippian subcrops and anhydrite barriers in SE Sask., Bakken, Three Forks, Montney, Halfway, Charlie Lake, Rock Creek, Shaunavon, BQ/Gething, Bluesky, Glauconitic, Lloyd, Sparky, Colony, Viking, Cardium, Horseshoe Canyon and Mannville CBM, Oilsands Areas, Outcrops
Northern US Rockies & Williston Basin Geological Edge Set
Western Canada Geological Edge Set
Appalachian Basin Geological Edge Set
North American Shales Geological Edge Set
US Rockies & Williston: Red River, Mississippian subcrops & anhydrite barriers (Bluell, Sherwood, Rival, etc), Bakken, Three Forks, Cutbank, Sunburst, Tyler, Heath, Muddy, Dakota, Sussex, Shannon, Parkman, Almond, Lewis, Frontier, Niobrara, Mesaverde shorelines, Minnelusa, Gothic, Hovenweep, Ismay, Desert Creek, Field Outlines, Outcrops
North American Shales: Shale plays characterized by O&G fields, formation limit, outcrop, subcrop, structure, isopach, maturity, stratigraphic cross-sections. Includes: Marcellus, Rhinestreet, Huron, New Albany, Antrim, Utica-Collingwood, Barnett, Eagleford, Niobrara, Gothic, Hovenweep, Mowry, Bakken, Three Forks, Monterey, Montney, Horn River, Colorado
-bi-annual updates and additions to mapping -technical support
UNICORNS IN THE GARDEN OF GOOD AND EVIL: Part 9 – Tight Oil Reservoirs
| By E. R. (Ross) Crain, P.Eng.
Unicorns are beautiful, mythical beasts, much sought after by us mere mortals. The same is true for petrophysical models for unconventional reservoirs. This is the ninth in a series of review articles outlining the simple beauty of some practical methods for log analysis of the unusual.
T IGHT OIL R ESERVOIR B ASICS
m ost of us are familiar with tight gas reservoirs – clean, low-porosity sandstones or siltstones that look unattractive on log analysis, at least by the conventional wisdom of the 1960s. By the end of the 1970s, we had overcome these hang-ups and exploitation in tight sands developed rapidly, along with the fracturing technology needed to make them economic.
Further progress in drilling and fracturing of horizontal wells brought us to shale gas, although most such plays are not really shales, but low-porosity siltstones or laminated shaly sands. m any are radioactive due to uranium and look like shale on logs, hence the continued reference to “shale”.
Siltstones are a mixture of quartz and other minerals, predominately dolomite and calcite, but many others may be present. They are characterized by low permeability, usually less than 1 millidarcy. When filled with gas, we think of these as “tight gas” reservoirs. A conventional complex lithology log analysis model is used and such reservoirs are not considered “unconventional”.
When shale volume increases, these reservoirs become shaly silts or silty shales; they may have sufficient organic content to become a self-sourcing reservoir. Then we use the shale gas model described in an earlier article.
The same revolution is occurring in oil exploration. Tight oil or “shale oil” is the current hot topic. Again, most such plays are siltstones or mudstones without a lot of clay in the reservoir. Siltstones with oil are a different story; “tight oil” is considered to be an “unconventional” reservoir, requiring horizontal wells and massive hydraulic fracture jobs to perform economically. Some siltstones are sufficiently sandy to produce oil in vertical wells, usually after a decent stimulation.
Conventional shale-corrected complex lithology log analysis models are used, even in shaly silts. However, a total organic carbon (TOC) assessment might also be made over the nearby source rocks and the reservoir interval.
m any siltstones are radioactive because of uranium. It pays to run a spectral gamma ray log to distinguish between uranium and clay content.
The Bakken Formation in the Williston Basin of Saskatchewan, m anitoba, and n orth d akota is a classic silt and sandy silt. It is low resistivity due to high-salinity formation water with high irreducible water saturation (caused by very fine-grain size), and the lithology is a mix of quartz and dolomite (and sometimes calcite).
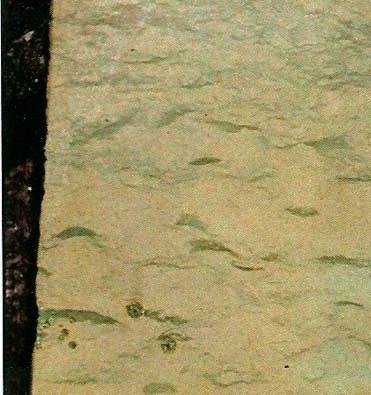
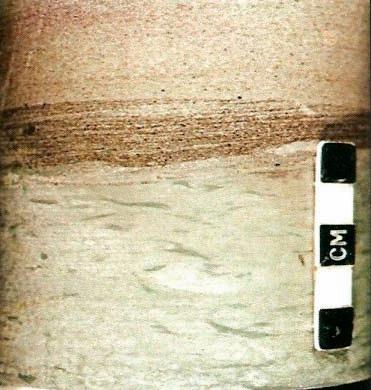
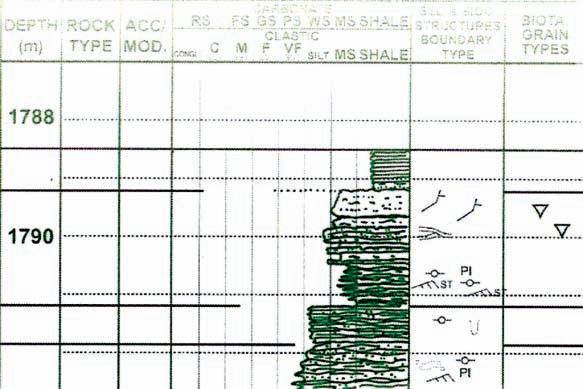
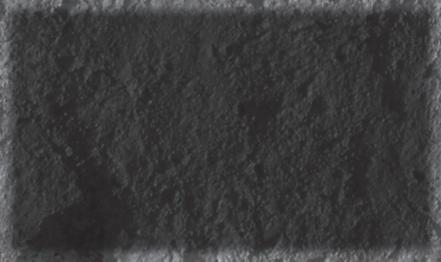
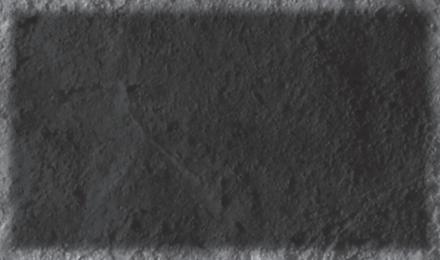
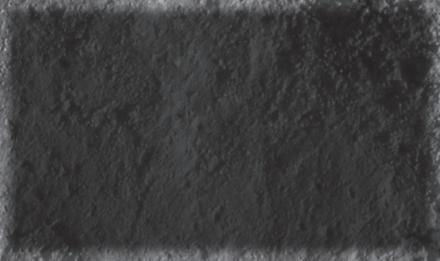
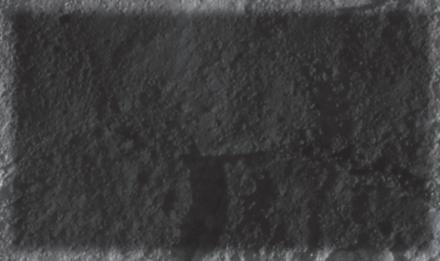
In Alberta and m ontana, the Bakken equivalent, the Exshaw, and adjacent formations (Banff / Lodgepole and Big Valley / Three Forks) are “Tight Oil” prospects, as are the d uvernay, Second White Specks, n ordegg, and other formerly unattractive low-porosity reservoirs. In Saskatchewan, the naturally low resistivity in Bakken pay zones is further aggravated by thin clay laminations, clay-filled burrows, laminated porosity, and dispersed pyrite (Figures 1,2).
Even more confusing is the water resistivity variation on the northwest and northeast edges of the Basin. Here, wet wells have higher resistivity than oil wells further south because the water resistivity is 5 to
20 times higher than deeper in the Basin. This results from fresher water recharge from the Black Hills of n orth d akota. An adequate production testing program is the only solution to this issue, as there is no log analysis model that will predict water resistivity in this reservoir.
Water salinity in the deeper n orth dakota wells reaches 325,000 ppm, making for exceedingly low water resistivity. In Saskatchewan, salinity is usually at 200,000 ppm or more, but can be as low as 25,000 ppm in the recharge area. Pore geometry in the deeper parts of the basin is more intergranular in texture and irreducible water saturation is lower than in Saskatchewan.
Typical Sw in Saskatchewan averages 50%, grading southward to about 30% in the deeper n orth d akota wells. Very low apparent Sw in Saskatchewan usually means fresh water recharge, possibly with some residual oil. The “best-looking” wells are actually water producers, but have measured resistivity values 2 to 4 times higher than productive oil wells. Water resistivity values are sparse, so any water recovery should be sent to the lab and analyzed.
The low resistivity, high radioactivity, large density-neutron separation caused by dolomite and pyrite, and the high PE value (near 3) conspire to make the zone look like shale on logs. Worse, some literature
(Continued on page 12...)
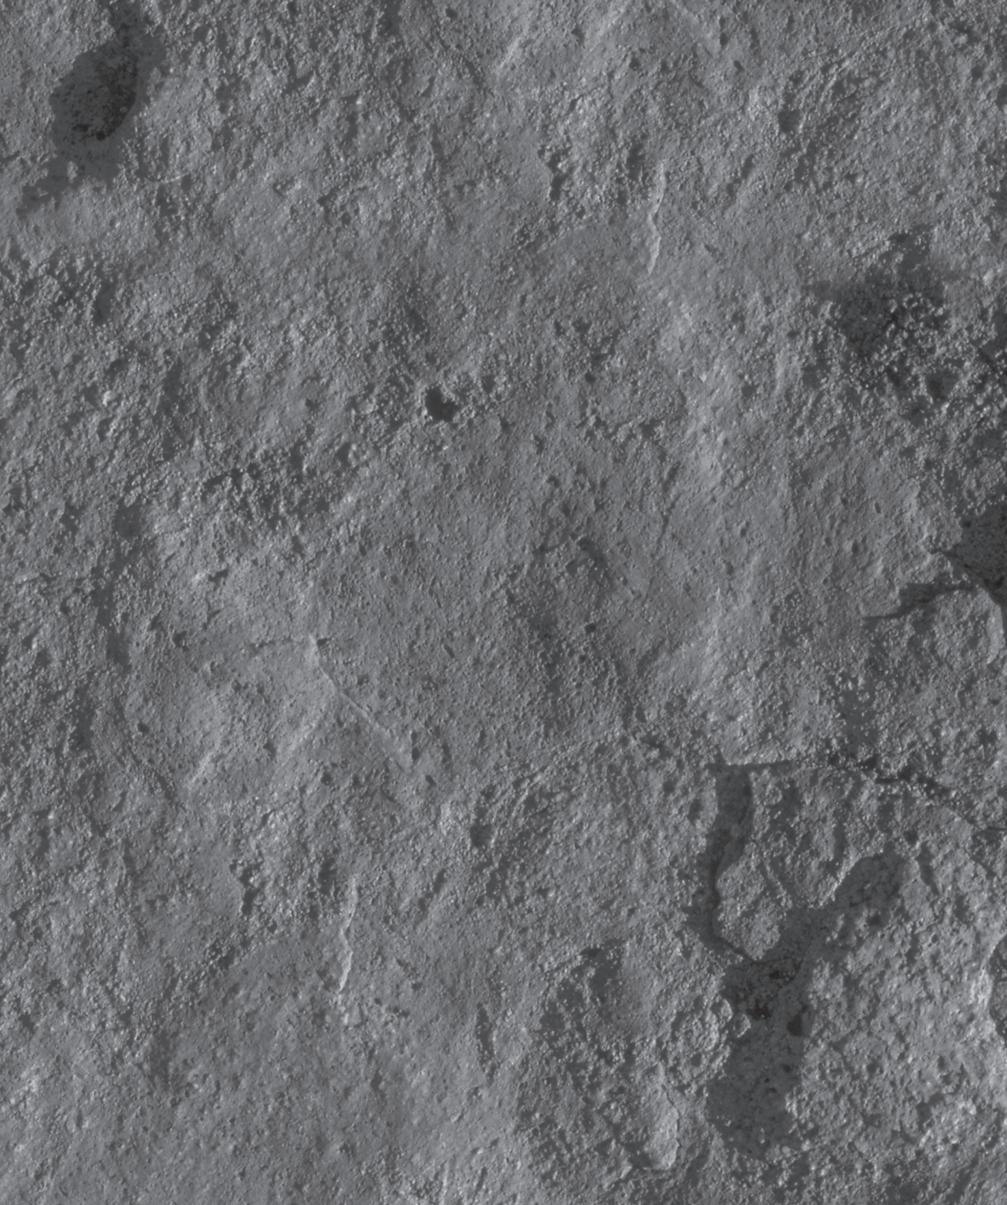
Figure 1. Core photo of Middle Bakken burrowed siltstone.
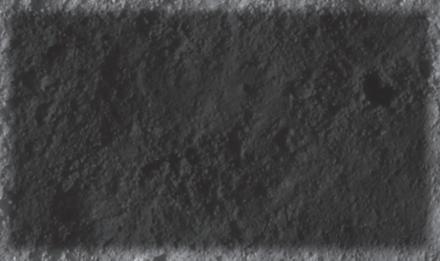
Figure 2. Core photo of Middle Bakken laminated fine-grained sandstone.
(...Continued from page 11)
continues to name the producing zone the Bakken Shale, even though we know the m iddle Bakken is a radioactive dolomitic sand or siltstone. These conflicts in the conventional data suggest strongly that some special core analysis should be done – namely electrical properties, capillary pressure, x-ray diffraction, thin-section mineralogy, and anything else that can help explain the petrophysical response to these complex rocks.
The Bakken is now the biggest oil play in n orth America, and may ultimately be the largest ever found, even larger than the Alaska n orth Slope. It is sometimes termed an “unconventional” reservoir, due to the low permeability of the siltstone intervals. In n orth d akota, it is also called a “resource” play because the oil was formed in place (from the Upper and Lower Bakken Shales). In Saskatchewan, the oil migrated from the deeper parts of the basin, and is not, strictly speaking, a resource play there. Alberta and m ontana is also probably a resource play, but few facts have been published to date, so it is hard to tell.
Vertical wells are not overly prolific due to the low intrinsic permeability of the silty sand, but most horizontal wells perform reasonably well. In the deep, hot, overpressured region in n orth d akota, some wells are flowing 1,000 to 2,000 barrels of oil per day.
B AKKEN GEOLOGY
Oil in the Bakken in southeastern
Saskatchewan has migrated from mature Bakken source rocks in n orth d akota and m ontana. The best reservoir is associated with the Upper m iddle Bakken Sandstone Facies (BF4). Average porosity ranges from 14% to 16% and permeabilities are 20 to 80 millidarcies. The unconventional siltstone reservoir (BF2) averages 9% to 12% porosity and 0.01 to 1.0 millidarcies. In the deeper n orth d akota wells, porosity is somewhat lower but permeability may be higher. All facies types have been exploited in different parts of the Basin.
These facies were deposited during the late devonian and early m ississippian in what was then a tropical setting. The sediment is believed to have an aeolian source and was blown into the marine environment from the adjacent arid landmass to the east and reworked into the various marine facies. The organic-rich Upper and Lower Bakken shales are the source rocks for the sand and silt reservoirs.
The sands and silts are highly dolomitic, averaging about 50% dolomite. In deeper wells, calcite may replace some of the dolomite or infill some porosity.
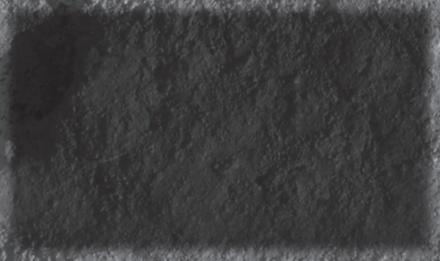
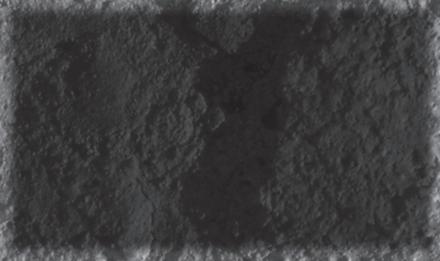
m any of the dominant features of the Bakken are below the resolution of logging tools and are best seen in core photos and core logs, as shown in Figure 3.
B AKKEN C ALCULATION
MODEL
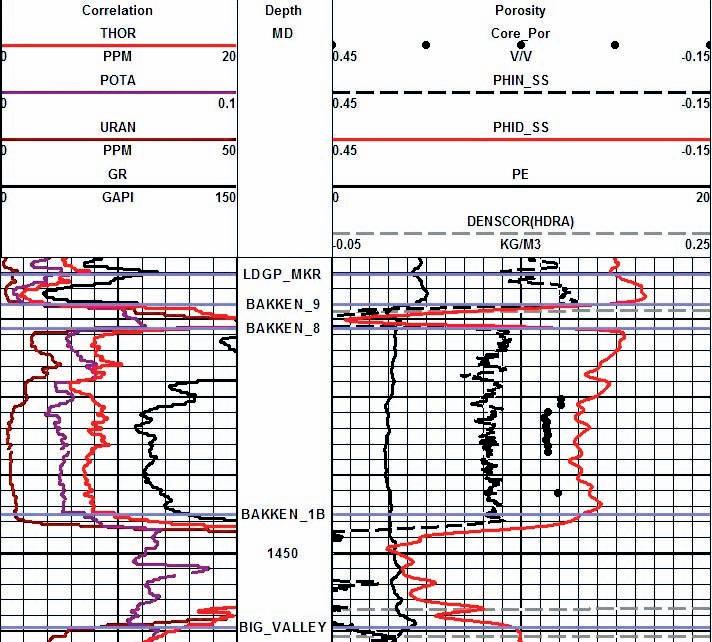
The Bakken is radioactive due mainly to uranium that migrated with the oil. This can be identified with a spectral gamma ray log and it should always be run when
penetrating radioactive sands. Sadly, it is often not requested, even though the service is cheap and costs no extra rig time.
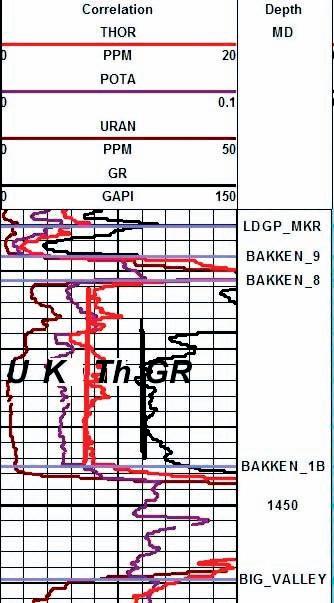
The thorium curve is best for shale volume calculations. The SP is flat and useless. density-neutron separation is mostly due to dolomite, so it cannot be used. The gamma ray can be used in the absence of the Thorium curve by assuming uranium content is constant.
1: VSHth = (TH - TH0) / (TH100 - TH0)
2: VSHgr = (GR - GR0) / (GR100 - GR0)
The clean lines TH0 and GR0 are easy to pick (red and black lines in Figure 4). Shale lines are harder as they are often off-scale to the right or buried under a plethora of backup curves. In the absence of a good pick from the log, use:
3: TH100 = TH0 + 25
4: GR100 = GR0 + 150
Adjust the constants to suit your local knowledge.
POROSITY CALCULATIONS
Even though the Bakken is a complex mixture of quartz, dolomite, calcite,
Figure 3. Core photos and core description show the detail that logs can’t see. Illustrations courtesy Graham Davies Geological Consultants and Canadian Discovery Ltd.
Figure 4. Spectral gamma ray log shows Uranium (U), Potassium (K), Thorium (Th), and standard gamma ray (GR). Red vertical line is TH0, the clean line for the Thorium curve, and the black vertical line is GR0, the clean line for the GR curve. Bakken 8 is top of sand and Bakken 1B is base of sand.
and sometimes pyrite, with a little clay, the standard density-neutron complex lithology crossplot model works well:
5: PHIdc = PHI d – (Vsh * PHI dSH)
6: PHInc = PHI n – (Vsh * PHI n SH)
7: PHIe = (PHInc + PHIdc) / 2
For porosity values greater than 0.05 fractional, this is an adequate representation of the crossplot; some software packages will use more complicated math to fuss with that third decimal place.
ROCK SHOP
Equation 7 is equivalent to Crain’s Rule #1: “Porosity is halfway between the density and neutron curves in clean zones” regardless of mineralogy, provided logs are on compatible porosity scales.
WATER SATURATION CALCULATIONS
Since there is little clay, the Archie model can be used, although it costs nothing extra to use a shale-corrected saturation equation such as Simandoux or d ual Water. Electrical properties variations between facies and with depth or diagenesis are
not published. This lab work is worth the effort, as considerable increases in oil-inplace are possible with small reductions in m and n values. Fresh water recharge in the north can confuse log analysis results, so a production test is essential before drilling any horizontal wells.
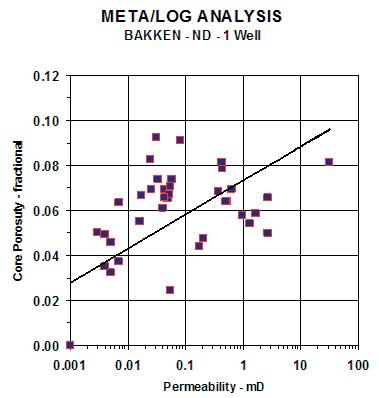
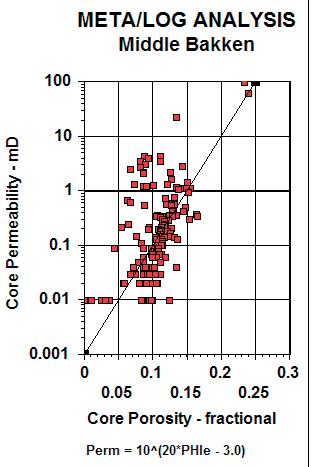
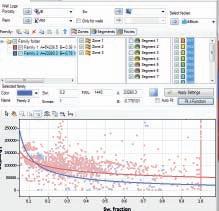
PERMEABILITY CALCULATIONS
no strong correlation between porosity and permeability has been seen. Figures 5 and 6 show the scatter is large. The Wyllie (Continued on page 15...)
Figure 5. Permeability versus porosity scatter plots for a North Dakota well The scatter suggests microfractures.
Figure 6. Permeability versus porosity scatter plots for a Saskatchewan well. The scatter suggests microfractures.
FARHATHYDERI,P.Geol President 226CopperfieldBlvd.S.E. Calgary,ABT2Z4R6 Tel4037260666 Fax4034515380 Cell4038192516 farhat@sableconsultants.com SABLECONSULTANTS.COM
SABLEPETROLEUM CONSULTANTSINC.
WELLSITEGEOLOGICAL SUPERVISION
(...Continued from page 13)
Rose equation gives rational values and can be tuned to fit smoothed core data:
8: k max = 100 000 * (PHIe^6) / (SWir^2)
L ITHOLOGY CALCULATIONS
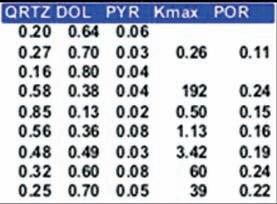
How do we know which minerals to use in the petrophysical log analysis? detailed sample descriptions are a good start (Figure 7). Both x-ray diffraction data and thin-section point counts can be used. Both methods are considered semi-quantitative and come from tiny samples compared to the volume measured by logs. As a result, we don’t get too excited about obtaining a close numerical match.
Standard three-mineral models using PE,
density, and neutron data are used with appropriate parameters for the selected minerals. multi-mineral solvers can be used if spectral gamma ray data is available. In this case, shale volume would be derived also.
PYRITE CORRECTIONS
Pyrite is a conductive metallic mineral that may occur in many different sedimentary rocks. It can reduce measured resistivity, thus increasing apparent water saturation. The conductive metallic current path is in parallel with the ionic water conductive path. As a result, a correction to the measured resistivity can be made by solving the parallel resistivity circuit. Although the math is simple, the parameters needed are not well known. The two critical elements are the volume of pyrite and the effective resistivity of pyrite. Pyrite volume can be found from a two- or three-mineral model, calibrated by thin-section point counts or x-ray diffraction data.
The resistivity of pyrite varies with the frequency of the logging tool measurement system. Laterologs measure resistivity at less than 100 Hz, induction logs at 20 k Hz, and LW d tools at 2 m Hz. Higherfrequency tools record lower resistivity than low-frequency tools for the same
concentration of pyrite. The variation in resistivity is caused by the fact that pyrite is a semiconductor, not a metallic conductor. It is nature’s original transistor, and formed the main sensing component in early radios.
Typical resistivity of pyrite is in the range of 0.1 to 1.0 ohm-m; 0.5 ohm-m seems to work reasonably well. The effect of pyrite is most noticeable when Rw is moderately high and less noticeable when Rw is very low.
The math is easiest when conductivity is used instead of resistivity:
10: CO nd pyr = 1000 / RESpyr
11: CO ndcorr = 1000 / RES d - CO nd pyr
* Vpyr
12: RES dcorr = 1000 / CO ndcorr
The corrected resistivity can be plotted versus depth, along with the original log. Corrected water saturation will always be lower or equal to the original Sw. If CO ndcorr goes negative, lower Vpyr or raise RESpyr.
Figures 8 and 9 on page 16, and Figure 10 on page 17 are Bakken Log Examples.
Figure 7. Mineral and core analysis summary for a Bakken reservoir.
ACKNOWLEDGEMENTS
Thanks to Dave Hume of Canadian Discovery Ltd. for his help in clarifying geological concepts on this and many other of my petrophysical projects.
ABOUT THE AUTHOR
E. R. (Ross) Crain, P.Eng. is a Consulting Petrophysicist and a Professional Engineer with over 45 years of experience in reservoir description, petrophysical analysis, and management. He has been a specialist in the integration of well log analysis and petrophysics with geophysical, geological, engineering, and simulation phases of oil and gas exploration and exploitation, with widespread Canadian and Overseas experience.
His textbook, “Crain’s Petrophysical Handbook on CD-ROM” is widely used as a reference to practical log analysis. Mr. Crain is an Honourary Member and Past President of the Canadian Well Logging Society (CWLS), a Member of Society of Petrophysicists and Well Log Analysts (SPWLA), and a Registered Professional Engineer with Alberta Professional Engineers, Geologists and Geophysicists (APEGGA).
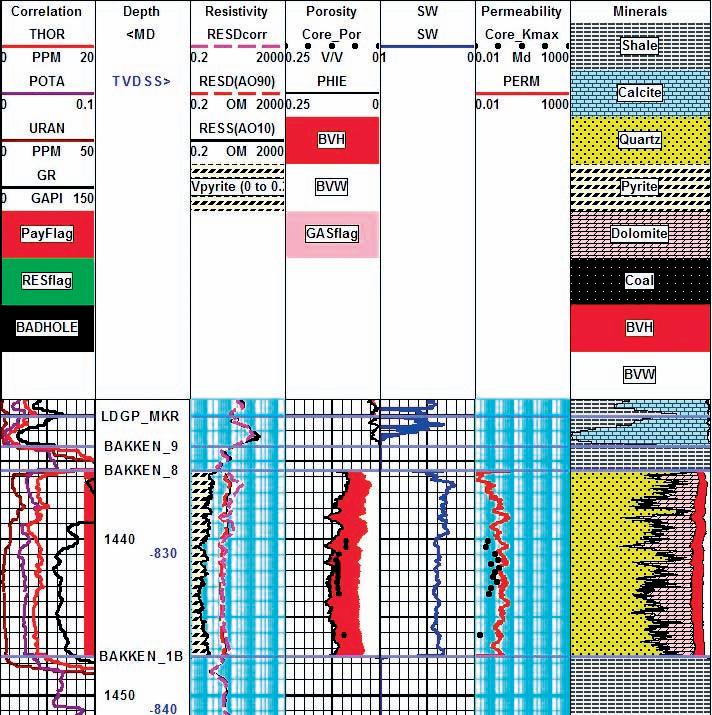
Figure 8 Density-neutron logs on low resistivity, radioactive, dolomitic Bakken sand. Note high apparent porosity (almost coal values) in upper and lower shales. Density-neutron separation and PE show a 50-50 mix of quartz and dolomite with a few percent pyrite. XRD and sample descriptions confirm this analysis.
Figure 9. The answer plot illustrates the mineral mix and the match to core porosity and permeability that was achieved. The curves in the correlation track are, from left to right, uranium, potassium, thorium, total gamma ray.
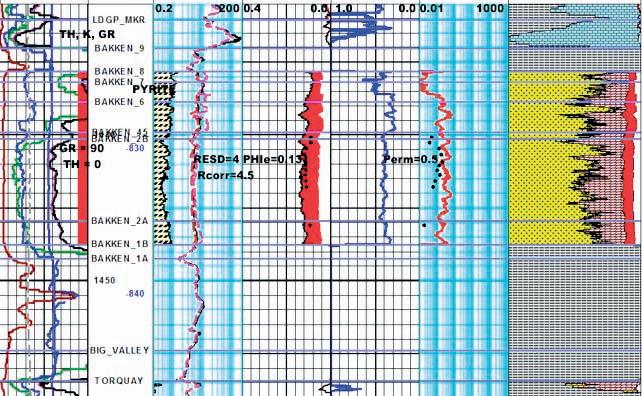
Figure 10. Here is a different well with the pyrite correction applied to the resistivity log. The before and after versions of the resistivity are shown in Track 2, along with the pyrite fraction determined from a 3-mineral model using PE-density-neutron logs. The correction raises the resistivity about 0.5 ohm-m and reduces water saturation by about 10%. Making the pyrite more conductive would raise RESD further, but as yet no one has provided any public capillary pressure data in this area to calibrate Sw. The Swir from an NMR log would also help calibrate this problem.
T HE ANALYSIS OF FRACTURES IN PETROLEUM RESERVOIRS : Part 2
| By Paul A. MacKay
FRACTURE A NALYSIS
As the pursuit of fractured reservoirs develops and intensifies, the boundary between reservoir geology and reservoir engineering becomes blurry. The challenge for geoscientists is to discuss fractures in quantitative terms rather than in qualitative terms. The challenge for reservoir engineering is to move away from the simplistic view of linear flow within a reservoir and to develop tools that can simulate the complexity of fractured reservoir.
There are many components to fracture analysis. To fully describe the fracture network it is necessary to describe the orientations of the fractures, the connectivity of the fractures, the extent and aperture of the fractures, and their ability to conduct fluid (both quantity and type). The intensity or density of the fracture system is also important, both in terms of fluid conductivity and in terms of fluid storage. Ultimately, what is of greatest use to the reservoir analyst is how the fractures hydraulically connect the reservoir to the wellbore.
Fractures are the primary conduit that connects the reservoir to the wellbore in many petroleum systems. As such, it becomes important to know which fractures are open and the orientation of these fractures. The determination of open fracture networks is difficult. Boundaries in reservoirs determined from pressure response are based on the assumption of linear flow, which is likely to be a crude approximation; however, they do give some insight into the reservoir. more reliable tools are image logs that directly observed the fracture planes. The assumption in image log analysis is that the fractures are planar – as a first-order approximation, this is likely acceptable. Another assumption is that the resistivity contrast required to observe the fracture is the result of drilling fluid invasion into the fracture plane. This would suggest that only open fractures will appear on the resistivity image log. In reality, there are a range of resistivity responses on image logs, which can be interpreted as variations in fracture aperture. Fractures that are mineralized (and assumed closed) often appear on image logs as the mineralization has a different resistivity response than the rock matrix. It may be wise to consider that fractures of small aperture may not
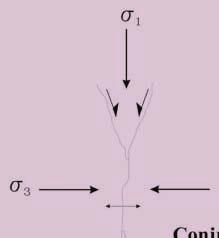
Figure 9. Conjugate fracture systems consist of two shear-fracture surfaces acting with opposite senses of motion and a single extensional fracture oriented perpendicular to the minimum stress direction.
show up on the image log as the drilling mud molecules are too large to invade the
natural fracture. These fractures may be quite effective in passing small hydrocarbon molecules (gas), but resist the invasion of the larger molecules associated with drilling mud.
Outcrop studies are an excellent way to physically view fractures in three dimensions and observe the fracture-to-rock relationships. However, it should be taken into context. The outcrop has undergone stress release and, as such, is not under the same confining stress that would be expected in the subsurface. The outcrop has been modified by the powerful forces of erosion and may no longer truly reflect the fracture conditions within the earth. Given these concerns, the outcrop does still provides excellent insight into fractured systems and remains one of the better methods in fracture analysis as an analogy to the subsurface. As a caution, aperture analysis from outcrop is flawed due to the stress relaxation at surface and the general opening of most fracture surfaces.
FRACTURE ORIENTATION
d iscussions on fracture orientation must begin with describing the reference
(Continued on page 20...)
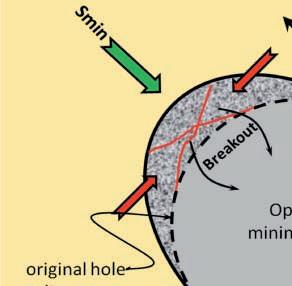
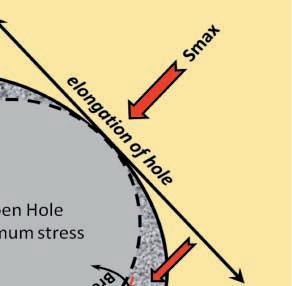
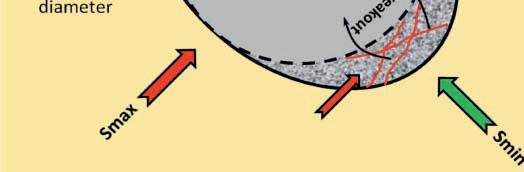
Figure 10. Determination of SHmax from wellbore breakout patterns.
(...Continued from page 19)
coordinates. In sedimentary rocks, structural geologists tend to use bedding as the reference surface; however, as teams become integrated and multi-disciplinary, the reference is often the surface of the earth (horizontal) to accommodate the different disciplines. In general this is not a problem, as in most areas where hydrocarbons occur bedding is sub-horizontal, so there is little distinction between the two reference systems. In structurally complex areas, this distinction can lead to confusion, but these are generally hybrid concerns that are solved by clear communication.
A more significant problem in fracture orientation analysis lies with the sampling technique. The nature of sampling fractures along a scan line (such as a well) will lead to an under-estimation of the total fracture intensity unless the line is oriented perpendicular to the dominant fracture direction. Careful orientation of the scan line will still yield inaccurate analysis for any secondary fracture system that is not oriented perpendicular to the scan line. It is possible to correct this issue using a relatively simple trigonometric function, but it should be noted that fractures tend to be underestimated due to the limitation.
natural fractures tend to form perpendicular to bedding in sedimentary rocks. There is some discussion over this observation. If fracture generation is, in part, a product of the alteration of organic material to hydrocarbons, it would be expected that the fractures in shales might be horizontal to mimic the bedding parallel orientation of the organic-rich layers. However, most fracture analyses at surface or in the subsurface tend to be dominated by vertical (bedding perpendicular) fracture sets. This observation may be a product of the maximum depth of burial of the rock and the intrinsic anisotropy of the rock caused by bedding. The result is that it is exceptionally difficult to intersect and analyze vertical fractures with a vertical wellbore. The petroleum industry has
adjusted to this issue by drilling horizontal wells. The concept is to drill perpendicular to the dominant fracture orientation with the expectation that this will be the direction
that is likely to best connect to the reservoir via the natural fracture system.
The most common method for predicting fracture orientation ahead of the drill bit are model-based predictions that take into account the geological setting and the existing stress conditions. most model-based predictions are based on the concept of conjugate fracture sets. A conjugate system (Figure 9) is a combination of two shear fracture orientations and one extensional fracture orientation. The shear fractures have opposite senses of motion such that shortening in the maximum compressive direction can be accommodated if both shears are simultaneously active (the definition of conjugate). The maximum horizontal compressive stress direction bisects the
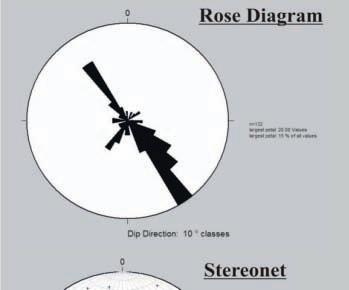
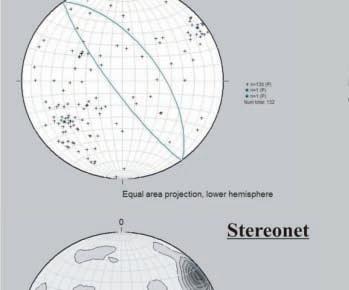
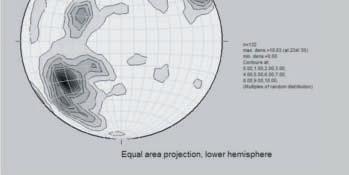
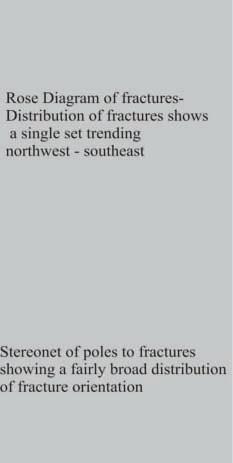
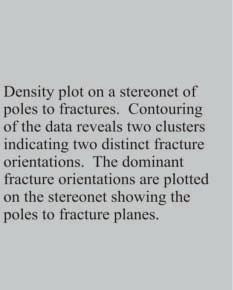
Figure 12. Fracture data from a well shows different display techniques. All plots are using the same data. The rose diagram shows the dominant strike of the fractures, but gives no insight into the dip of the fracture plane. The stereonet is good to observe the scatter of the data, but can be difficult to group populations. A density plot of the data shows two dominant groups of fractures and helps with analysis.
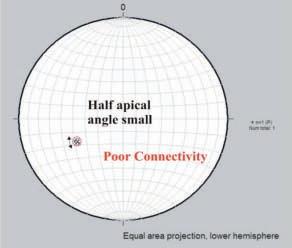
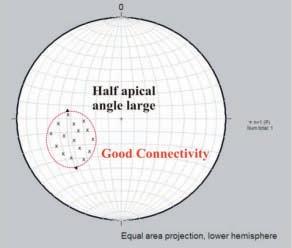
Figure 11. A stereonet is an effective tool for fracture analysis. In this case the tightness of the cluster gives insight into the connectivity.
angle between the two shears; hence, the conjugate model ties the stress direction to the fracture pattern. This is a useful concept as it is possible to predict the maximum stress direction. It is the extensional fracture that is of the greatest interest to the connection to the reservoir. Extensional fractures form as a result of the two shear surfaces. The shear surfaces form a wedge that pries the rock apart to form the extensional fracture. much like an axe splitting wood, the extensional crack propagates some distance in front of the shear-formed wedge. The extensional fractures are most likely to be open, form perpendicular to the least compressive horizontal stress, and will likely pass fluid along its surface. It is these cracks that allow the wellbore to connect to the reservoir and the orientation of the horizontal wellbore is generally designed to intersect the maximum number of these fractures.
As stated previously, fractures tend to form perpendicular to bedding. In the case of most resource plays the beds are near horizontal so the maximum horizontal stress (SHmax) needs to be determined so that the extensional fracture system orientation may be predicted. note that the maximum compressive stress ( s1) orientation is not essential at this stage. most sedimentary rocks are well bedded, which creates a strong anisotropic fabric in the rock with respect to material strength (rock properties). This anisotropy steers the fracture orientation to vertical, hence the need to determine the SHmax rather than s1. There are several techniques to determine SHmax. Wellbore breakout patterns, induced fractures from drilling, and microseismic analysis are some of the tools that can be used to resolve SHmax (Figure 10, page 19).
Another aspect of fracture orientation that should be considered is the connectivity of the fractured system. If all fractures were rigorously parallel then the connectivity in the reservoir would be poor. Similarly, if all the fracture orientations were random, the connectivity in the reservoir would be good and, in concept, the random fracture distribution with large fracture intensity would emulate a conventional linear flow reservoir. It is possible to estimate the connectivity of the fracture system within the reservoir using a stereonet. Plotting the poles of the fractures on a stereonet will give insight into the connectivity of the fracture system (Figure 11). If the poles form a tight cluster then the fractures are sub-parallel to each other and the fractures have poor connectivity for a given fracture intensity. If the poles have a broad cluster, then the fractures are at angle to each other and are (Continued on page 22..)
(...Continued from page 21)
likely to have better connectivity.
most fractured reservoirs have one or more dominant fracture orientations. m ultiple sets of open fractures create good fluid conductivity in the reservoir. Figure 12 (page 20), shows fracture data taken from an image log and plotted on a Rose diagram and stereonet, respectively. note that on the Rose diagram the data looks like a single population of fractures trending northwestsoutheast, indicating poor connectivity. Plotting the same data on a stereonet, there is a great scatter of fractures (suggesting superior connectivity). In some areas on the stereonet, there appears to be a concentration of poles. Creating a density plot of the poles to fractures is an effective means of identifying population peaks within the data. The density plot reveals two dominant orientations of fractures within the data, which was not reflected in the Rose diagram. The Rose diagram can only reveal the strike of the fracture, but not the dip.
Fracture connectivity also affects the permeability in a reservoir. Fracture connections form a line (the intersection of two planes). Along this line, permeability is greatly increased due to the significant decrease in friction. The result is that the fracture connections become preferred fluid conduits and many fracture intersections will greatly increase the fluid flow within a reservoir. In a typical flat-lying reservoir where the fractures are dominantly vertical, the fracture intersections will be dominantly vertical. As the dip on the fractures deviate from vertical, the fracture intersections become increasingly more horizontal. The result is that for a given fracture system with a set aperture, the permeability of the system is affected by the connectivity. This permeability enhancement created by connectivity can greatly affect the drainage area of a well.
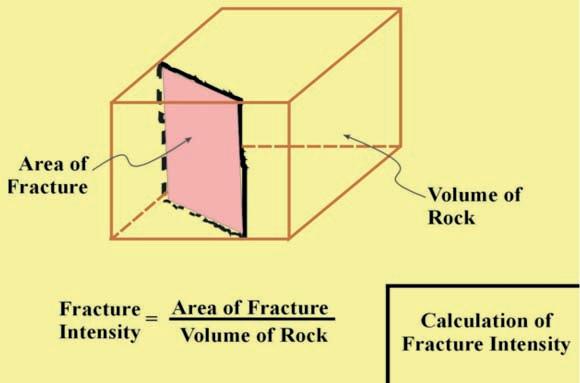
FRACTURE INTENSITY
The term fracture intensity refers to the sum of the area of all fracture planes in a given volume of rock (Figure 13). This term carries with it units of number of fractures per unit distance, the sum of the area (length2) divided by volume (length3). In practice, it is difficult to measure the area of every fracture in a given volume of rock. A means of approximating this value would be to measure a surface within the rock and measure the line length of every fracture intersection on that surface. Although possible in outcrop studies, this can be a tedious process. note that the units remain the same (fractures per unit distance) with this approximation as the measurement is now intersection length divided by area
Figure 13. The calculation of fracture intensity.
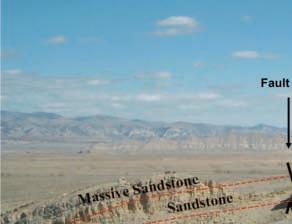
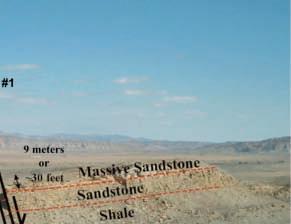
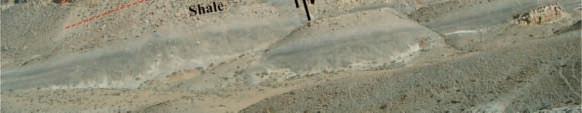
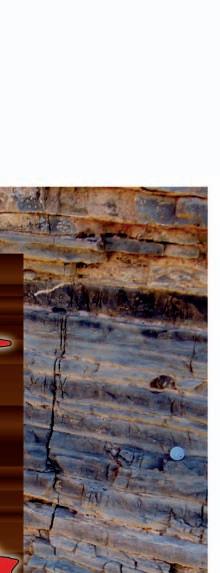
Figure 14. Outcrop of mid-Cretaceous Frontier Formation at Blue Draw, Wind River Basin, Wyoming. A scan line was laid at the base of the sandstone and every fracture was measured (strike, dip, and height) at the intersection point with the fracture.
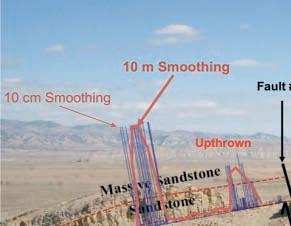
Figure 15. Comparison of different smoothing curves (amplitudes standardized) along the fracture distribution at a Frontier Formation outcrop in the Wind River Basin, Wyoming.
(length2). The more common approach is to take a scan line through a rock volume and count the number of fracture intersections per unit distance. Again, the units for this approach remain the same (number of fractures per unit distance) This method is used in both outcrop studies and in subsurface studies but it should be noted that it has an inherent bias based on the scan direction.
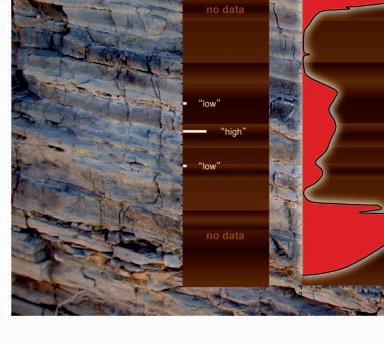
The result of the scan line approach is to develop a comb function marking each fracture at its position along the scan line. An attribute of the fracture can be assigned at each fracture position and from this different functions can be created. For instance, in wells with image logs the amplitude of the resistivity response may be assigned giving some inference into fracture aperture. In outcrop studies, the length of each fracture may be assigned. Whatever attribute is assigned; the effect is to create a comb function for analysis.
In the Wind River Basin of Wyoming several excellent exposures of mid-Cretaceous-aged sandstones of the Frontier Formation can be found (Figure 14). The outcrop is analogous to a producing fractured reservoir in the Frontier Formation, which is part of the madden Field lying in the northeastern portion of the Wind River Basin. A scan line was laid out along this outcrop approximately 1.5 kilometres long, and fracture measurements were taken along the scan line noting the strike, dip, fracture height, and position on the scan line for each fracture. From this, a function was developed comparing fracture height against the x-position along the scan line.
Initial analysis of the data consists of a series of summing operations run along the scan line. The concept behind the summing operation is to treat fractures in close proximity to each other as contributory, but keep solitary fractures isolated. The summing curve was created by taking a window in the data of set aperture and adding the lengths of all fractures in that window. This value is assigned to the mid-point of the window. The window is then moved forward one sample (in this case one centimetre) and the calculation is repeated. The summing window is moved along the scan line in incremental steps until the entire scan line has been processed. Windows of different lengths (aperture) can be run through the data to see at what window size the fracture swarms along the scan line begin to coalesce with each other (Figure 15). The resultant curve is essentially a profile of the potential fluid flow from the reservoir.
The length of the window that is required (Continued on page 24...)
(...Continued from page 23)
to show the meshing of the fracture swarms gives some insight into the reservoir flow characteristics. In a rock with no matrix permeability and only fracture permeability, it would be expected that a shorter summing curve would be more reflective of the potential fluid flow. A rock with a reasonable amount of matrix permeability would be reflective of a longer summing window. This would suggest that although matrix permeability is not a significant contributor to initial flow from the well it is likely important to the effective drainage and dictates which fracture swarm will have the greatest longterm effect on the productivity of the well.
The summing curves may also reflect the connectivity of the fracture system. Fracture
systems with good connectivity will behave more like the long window analysis whereas wells with poor connectivity would be more likely reflected in the shorter window summations.
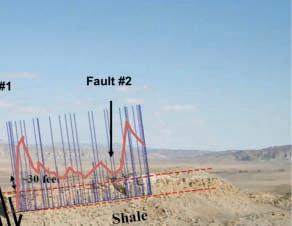
determination of the window length requires manipulation of the data and comparison to production data. In the case of the Frontier outcrops in the Wind River Basin, windows of 10 cm, 100 cm, and 1,000 cm were run on the data. Comparison of the curves showed that the data were very spiky at the shorter lengths but at the longer window length of 1,000 cm, a waveform developed in the data (Figure 15). The waveform for the full outcrop is displayed in Figure 16. Here, it can be seen that there is some type of relationship with the amplitude of the waveform relative to proximity to the local faults where the local faults appear to have a correlation with fracture intensity.
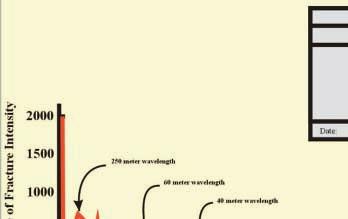
The shape of the waveform can be of great value in the analysis of the fracture distribution and the production of the reservoir. A waveform is the sum of a series of mono-frequency waves of different amplitude and phase. Any given waveform can be transformed into the amplitude and phase for each given frequency within the bandwidth of frequencies represented in the function. This transformation is done using a Fourier Transform. The result is to take the waveform plotted in amplitude vs. distance and create two new plots of amplitude vs. frequency and phase vs. frequency. The frequency in this case is spatial and is designated as k (not to be confused with permeability) with units of cycles/metre. Analysis of the amplitude for each frequency shows the dominant frequency (Figure 17). This is a significant number in that it is a statistical analysis indicating the dominant period for fracture development within the
rock. This is the period (1/frequency) at which it would be expected that fractures would occur.
Using the Fourier Transform, it is possible to statistically predict the dominant period of fracture swarms within the reservoir in the direction of the scan line and begin to estimate the distances a well must be drilled to intersect a set number of fractures. For example, if it was determined that the dominant frequency in the Fourier Transform was 0.004 m-1, the period would be 250 metres. The prediction would be that approximately every 250 metres there should be a fracture swarm within the reservoir. If it was deemed that a minimum of four fracture swarms were needed to make a successful well, then the length on the horizontal section within the well would need to be at least 1,000 metres.
The phase component of the transform is a more difficult concept to deal with and is probably of little use at this stage of sophistication of the approach. Phase is related to the position of the trigger mechanism that created the waveform. Previously, the concept of fractures as strain within the rock has been addressed. Strain is a response to energy imparted into the system and as such the fractures will have some memory of the failure event that created the crack, a nearby fault, a bending moment in a beam, or some other event that has released energy into the rock and has formed fractures. The position of this event relative to the fracture will have some effect on the phase analysis. Since fractures are the product of many such events over geologic time, the phase information is a series of imprints that becomes difficult to deconstruct. Information is locked in the phase component of the curve but at this
(Continued on page 26...)
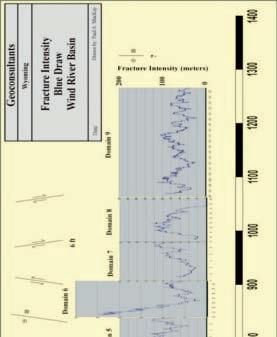
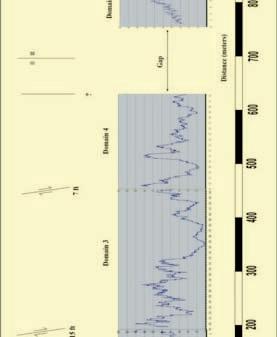
Figure 16. Profile of the fracture distribution of the Frontier Formation at Blue Draw with the 1,000cm summing window applied.
Figure 17. Fourier Analysis of the fracture distribution at Blue Draw based on a summing window of 10 metres.
2011 CSPG STANLEY SLIPPER GOLD MEDAL
“This pioneer and explorer in geology, engineering and natural gas technology bequeathed a fundamental knowledge, years ahead of his time and was considered by many a virtual Leonardo da Vinci of the Petroleum Industry. Slipper, our first President, deserved the honour (unbeknownst to him) of our highest award in the Canadian Society of Petroleum Geologists” (Aubrey kerr).
The medal is presented annually by CSPG for outstanding contributions to oil and gas exploration in Canada. The contributions of the winner of this award should encompass a number of activities related to aspects of petroleum exploration. Such activities include: initiating and or leading exploration programs, significant discoveries on new or existing exploration trends, teaching and / or training of explorationists, and
involvement in and leadership within geological societies and professional organizations.
The Committee is currently calling on the CSPG membership to provide additional nominations for this prestigious award. The Award winner must be a CSPG member and should be able to attend the awards presentation to be held in 2012.
Please include an updated biography, bibliography and letters in support of your nominee.
nominations should be emailed before Thursday, September 15, 2011 to:
Email: clinton.tippett@shell.com and kasandra.klein@cspg.org (please send your nomination to both addresses)
Phone: Clint Tippett, Chairman, 403.691.4274 or kasandra klein, member Services Coordinator 403.264.5610
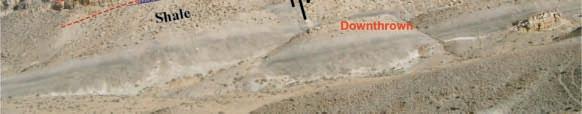
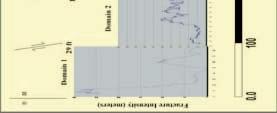
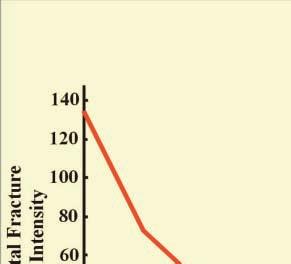
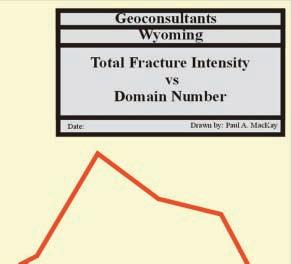
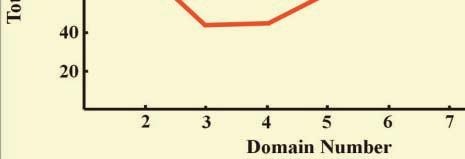
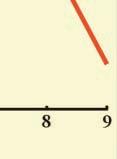
The Frontier Formation outcrop in Wyoming is segmented by a series of low-displacement, near-vertical normal faults. These faults divide the outcrop into a series of different domains (Figure 16, page 24). Individual Fourier Transforms were made for each domain and the total fracture intensity was calculated for each domain (Figure 18). Plotting the total fracture intensity shows a decrease in fracture intensity away from the left boundary of domain 1. At this boundary, there is a larger displacement strike-slip fault. The exception to this pattern is between domains 5 and 6, where there is another relatively large strike-slip fault. The fracture intensity analysis is giving a quantitative description for how fracture intensity decreases away from faults.
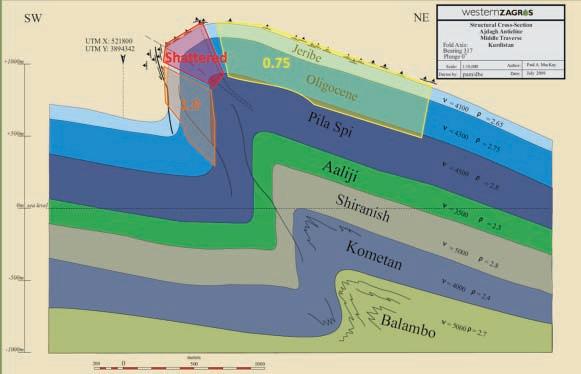
Another application of this approach was done in the Zagros mountains of kurdistan, where fractured Tertiary carbonate strata has been folded. Figure 19 is a cross-section across a fold in the Zagros mountains in the southern portion of kurdistan near the city of Sulymanyehah. A series of scan lines measured fractures on both the forelimb and the backlimb. Analysis of these scan lines using Fourier Analysis shows that the fracture intensity on the front of the limb is 2.5 times greater than the backlimb. Where previously the fracture intensity was described qualitatively (intensely fractured, saturated, moderately fractured, poorly fractured, etc.), using this method allows qualitative values to be assigned with the recognition that these values are relative to each other.
K X VS. KY TRANSFORM
(...Continued from page 24)
stage of development it remains a mystery.
The Fourier Analysis does not give one single dominant frequency, but has several spikes in the data showing that other sub-dominant frequencies exist, suggestive of a much more complex process. Fracture patterns are not simply a product of far-field stress. The observed pattern is a complex relationship of several different variables over time and, as such, it should not be a surprise to find many different frequencies within the data.
There is more information that can be mined from the frequency analysis. If the
transform represents the amplitudes for the range of frequencies then the integral of the curve (the area under the curve) is the summation of all of those amplitudes or, phrased differently, is the total fracture energy within the rock volume. This means that the total fracture intensity for the scan line (or a portion of the scan line) may be calculated. In this way a quantitative value may be assigned to the scan line for the potential of the fractures. This allows comparison of scan line values from one area to another. This can be a powerful tool for the analysis of multiple wells in an area or for comparing wells in one area to another.
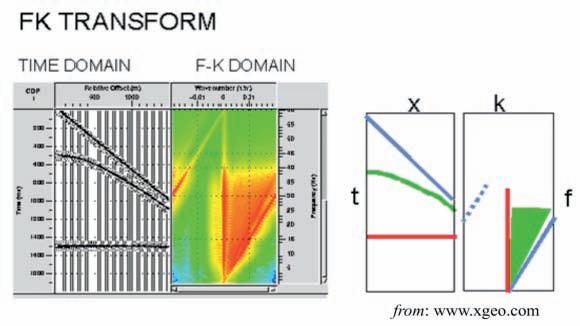
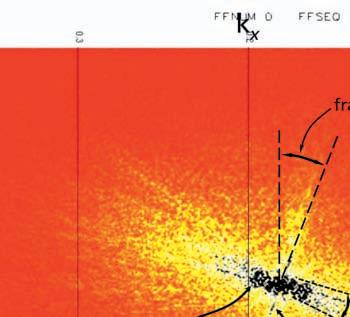
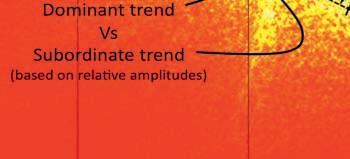
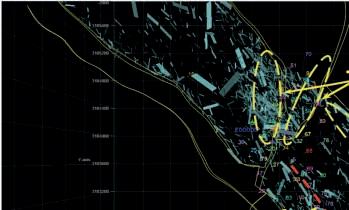
A k x vs. ky transform is a means of analyzing surfaces for linear events, such as the trace of a fracture on an outcrop surface. much like the analysis of scan lines are greatly improved with a Fourier Transform, the k x vs. ky transform aids in the analysis of surfaces. The concept is similar to Fk Transforms used to analyze seismic records (Figure 20). In this case the seismic record is in time vs. distance. The transform converts the data from time vs. distance into temporal frequency (F) vs. spatial frequency ( k). The slope of the line on an Fk transform has units of time vs. distance and represents velocity. In the case of a k x vs. ky transform the surface is spatial frequency in the x-direction vs. the spatial frequency in the y-direction. Thus a linear event does not have units (it is dimensionless) but it does have directionality.
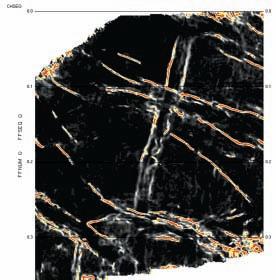
An example of this technique can be seen in Figure 21. In this case, the surface is a curvature surface from a 3d seismic survey. The high-contrast lines are assumed to be minor faults that approximate fracture
Figure 18. Calculation of total fracture intensity for each individual domain at Blue Draw.
Figure 19. A cross-section across the Ajdagh Anticline in southern Kurdistan with fracture intensity overlaid onto the fold. Note that the front limb has approximately 2.5 times more fractures than the backlimb based on outcrop analysis.
trends. The surface could be analyzed by measuring each event but the k x vs. ky transform is a more elegant solution and gives more insight into the system due to the statistical approach.
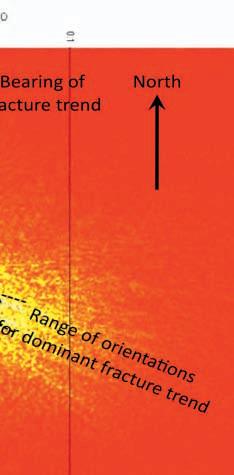
The k x vs. ky transform may be analyzed by looking at the amplitude of the events (Figure 22, page 28). The most dominant fracture system will have the largest amplitude on the transform. The spread on the linear events on the transform is a direct indication of the range in orientations of the lines. The actual dominant trend of the event may also be determined. The units of the trend lines are dimensionless, but are pointing in the bearing direction of the fracture trend. note that this is a method of looking at a surface that intersects fractures; it is not a direct method of measuring the fracture surface. The technique is made especially useful with seismic data as it can be used to compare one part of a surface to another, or one slice of the data to another, or finally, one area of one data set to another slice from another data set. Using this method, it is possible to build a series of volumes with information on the fracture system. A volume of dominant fracture orientations can be calculated. In this way, areas that have a spread of orientations can be highlighted as suggestive of areas with greater connectivity.
MODELING
Three-dimensional models are an important process in the analysis of reservoirs. The building of a model is a complicated process that requires the input from a range of different disciplines. A critical step in the modeling is the scaling of the data into discrete cells and assigning values to these cells. Values such as porosity, thickness, water saturation, and structural position can be assigned to each cell. The scaling requires averaging of some types of data
and upscaling for other types of data. The scaling of the model is difficult for a number of reasons, but some of these problems are inherent with data collection. The advantage to this approach lies in the development of
reservoir models that can take into account the fracture development within the model and the variation in fracture development throughout the model.
Geologic data is biased. The data is collected in discrete areas that are controlled by biasing processes such as outcrop data where the position and distribution of the outcrop (and resultant sampling) is controlled by erosion. In the subsurface, the sampling is also biased, such as mines that are excavated along specific seams or wells that are drilled to target specific “anomalies”. The model generation is plagued by this bias sampling and as such carries the error that comes from poorly sampled (biased) data.
Another issue with input data for a model is the inconsistent sampling in terms of sample
(Continued on page 28...)
The NEW plug-in for Petrel
Blueback Reservoir Engineering Toolbox
- speed up and expand your Petrel RE workflows
The Blueback Toolbox suite of Petrel* plug-ins is a large collection of innovative & unique plug-ins, containing functionality features not available in standard Petrel.
The Toolbox suite contains 4 different modules: Geophysics, Geology, Project Management and the brand new Reservoir Engineering Toolbox.
Reservoir Engineering module:
• SW modeling calculator
• 3D grid QC tools
• Interactive well picker
• Contact back calculation
• RelPerm generator
• Auto generate RE plots from multiple cases
*Mark of Schlumberger
Learn more?
sales@blueback-reservoir.com
+1 403 538 4799
www.blueback-reservoir.com
www.blueback-reservoir.com
Figure 20. FK Transform of a seismic record from time vs. distance into temporal frequency vs. spatial frequency.
Figure 21. A surface from a curvature volume of a 3D seismic data set.
(...Continued from page 27)
interval. Some aspects of the sampling are handled at very small intervals such as well data where well logs may sample at a rate of every decimeter. In other cases, the sampling is made at very large intervals, such as seismic data (tens of metres) or potential field data. The result is that the three-dimensional model contains significant flaws. despite these flaws, models serve a useful service in that specific parameters may be adjusted to see how the resultant model changes. In this way, the relative importance of specific parameters may be evaluated.
One of the most significant steps in a reservoir model is the assignment of permeability as a characteristic of each cell. This is a difficult process when dealing with conventional reservoirs and the reliance on laboratory measurements of core plugs to assign a permeability value. With the recognition of the significance of fractures to fluid transmission within the reservoir, the task of assigning a permeability value to each cell is fraught with assumptions and potential error.
discrete Fracture networks ( dFn ) models have been developed to help deal with the issue of fracture systems within a reservoir. different software is available to build the model, but essentially a probabilistic predictive algorithm is used to populate a given volume with fracture surfaces. The size of the fractures, orientation and distribution of the fractures, aperture of the fractures, and density of the fractures are determined by sophisticated probabilistic curves determined by the reservoir team and used to predict the fracture model of a given reservoir.
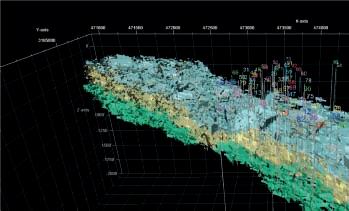
Figure 23 is one such model developed for a miocene-aged carbonate heavy oil reservoir in Egypt along the west flank of the Gulf of Suez. In this case, there were numerous vertical wells with image logs acquired so that the fracture model could be built. The resultant dFn model is difficult to interpret visually in that there appears to be a mass of plates within the model with little appearance to fracture systems observed in nature. In essence, the model does not look like nature and so the logic in the model is suspect. Rather than throw away the model and try again, further refinement of the model can be applied to bring the results closer to what is observed.
In this case, the fracture data was further analyzed and it was determined that all horizontal or sub-horizontal fractures would not be used as: (i) they were likely over-represented in the data due to the sampling of vertical wells (vertical wells will over-sample horizontal surfaces relative to
Figure 22. k x vs. ky transform of the surface from Figure 20.
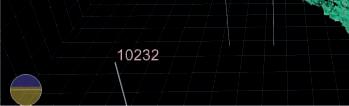
Figure 23. DFN model developed for Issaran Oil Field based on fracture data from image logs.
Figure 24. DFN model after spatial filter applied based on assumption that fractures are related to the faults.
vertical surfaces) and (ii) any horizontal fractures were more likely to be partially or completely closed due to the vertical overburden stress acting on the surface. Another process was to discard all closed fractures or partially closed fractures. The basis for determining if the fracture is open or closed was determined from the resistivity response on the image logs.
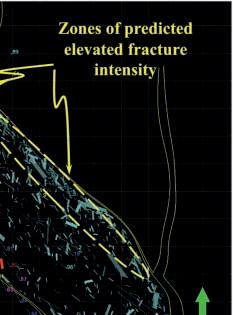
Another significant filter on the fracture data was based on the faults. In the model, several normal faults were defined using well data and a 3d seismic volume acquired over the area. An assumption was made that the fracture system was controlled by the faults and the fracture response would be a function of proximity to the faults. The logic behind this statement is that the faults are the trigger mechanism for the fractures and that the fractures are part of the strain response of the faults. Given this assumption and recognizing that strain is a form of stored energy in the rock volume a filter is designed for the fracture intensity. The predicted fracture response in the dFn model is filtered by 1/ r2, where r is the distance of the cell from the fault defined from the interpretation of the 3d seismic data volume. This process was consistent with the observations made on in the Frontier Formation in the Wind River Basin. This function is equivalent to an energy-spreading loss where the fault is the release point of the energy and the energy (or strain) exponentially decreases as a function of distance from the fault. The results of the filter can be seen in Figure 24. In this case the fracture distribution is a superior reflection of the geology.
In wells drilled into the field, it is observed that the fracture intensity in the downthrown block is greater. This observation is consistent with what is observed in outcrop in other areas. The model also shows an elevated fracture intensity response where a fault was not observed in the seismic data volume, highlighted in red. Although no fault was observed in the seismic data volume, production data predicted a boundary that behaved like a fault. The correlation between the predictive model and the well results gives greater confidence in the model and should result in more reliable information with respect to the reservoir simulation.
CONCLUSIONS
Fractures are a key component to the understanding of how fluid moves through the earth’s crust. Techniques have been developed that allows the reservoir technician to quantitatively analyze fracture systems. Orientation and intensity are key characteristics of fracture systems and these attributes of the fracture network can
now be described by quantitative means. However, fracture analysis is in its infancy. As the importance of fractures to the understanding of fluid flow through the crust continues to be recognized, new techniques will develop to quantify fracture systems. The merits of these techniques will be tested by how closely they reflect the natural systems and how effective models may be built to predict other fracture zones and estimate the resource potential within the rock volume.
ACKNOWLEDGEMENTS
This discussion is the results of years of contemplation of fracture systems and their analysis. Numerous colleagues have been involved in discussions
of fractured systems and the implications that these systems have on hydrocarbon recovery, ground water transport, nuclear waste disposal, metamorphic reactions, heat flow, geodynamics, rock properties, etc. These conversations were critical to the development of the ideas within this manuscript. Any errors are specifically from the author and most good ideas were hatched with the gracious help of a colleague. Specific contributions were made by Satindar Chopra, Malcolm Lamb, Dennis Quinn, William Matthews, Hutch Jobe, and Randy Herr. The author received support from numerous corporations as this work progressed, specifically from Burlington Resources, Rally Energy, Tanganyika Resources, Western Zagros Exploration, General Reef Corp., and Triangle Resources.
www.cspg.org
Canadian Society of Petroleum Geologists
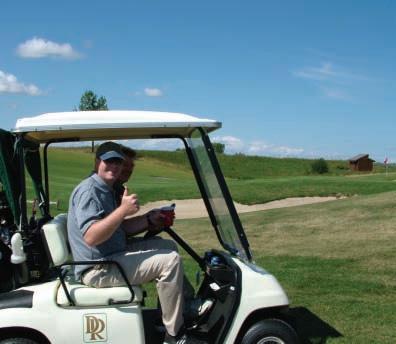
22nd ANNUAL MIXED GOLF TOURNAMENT
FRIDAY, AUGUST 26, 2011 - LYNX RIDGE GOLF
CLUB
Format: Modified Texas Scramble , shotgun start at 8:00 am. Teams will be assigned according to handicap or average score . This is a fun tournament open to both men and women. Registration includes a Continental Breakfast, Dinner, Green Fees and Power Car ts.
Registration Deadline August 5, 2011 (Priority will be given to CSPG Members).
CSPG Members: Register online at http://www.cspg.org/events/events-social-golf.cfm Non-Members and Guests: Mail or fax your form to CSPG’s office (contact information below).
CSPG - Member # Non Member
Name:
Company:
Address:
Phone (daytime):
Email:
Male Female
Phone / Cell (evening):
Club Handicap or average 18 hole score:
Guest Name: (One guest allowed per CSPG Member)
Male Female
Club Handicap or average 18 hole score:
Please note: A Waiver must be signed by EACH par ticipant 5 business days prior to the Mixed Golf Tournament. A waiver form will be distributed to you once your registration form has been processed. If a waiver is not signed prior to the tournament, your registration will be removed from the tournament All registrations must be accompanied by full payment All Cancellations or Amendments to registrations must be received in writing via email to Brenda Pearson at bpearson@birchcliffenerg y.com Phone requests will not be accepted The Cancellation or Amendment must be received by 4:00 pm on August 12, 2011. A 15% Cancellation and Administration fee will apply.
For more information, contact Brenda Pearson at 403-206-3339 or David Caldwell at 403-852-5571.
$ 90.00 Member
$ 130.00 Non-Member / Guest
ying guests Maximum 10 spots; first-come , first served.)
GST # 118836295)
Expiry:
Signature:
Canadian Society of Petroleum Geologists
Attn: Mixed Golf Tournament
600, 640 – 8 Avenue SW Calgary, Alberta T2P 1G7
Phone: 403.264.5610
Email: dayna.rhoads@cspg.org
Photos are taken during the tournament and are sometimes used for promotional purposes in CSPG publications. Your consent is needed to publish a photo where you are identi able in the picture. Please contact our o ce if you do not consent to your photo being used for promotional purposes
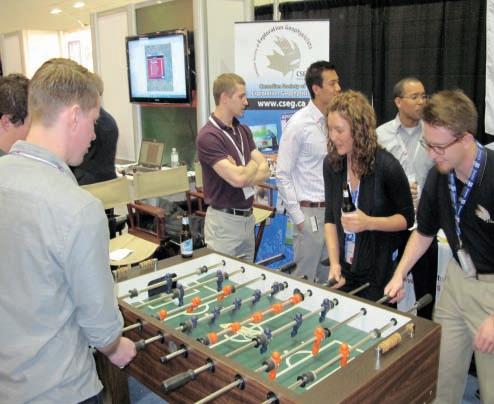
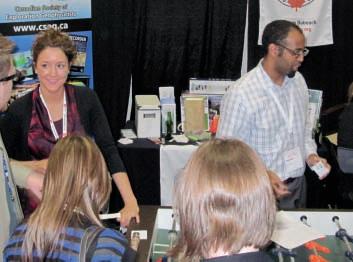
A STRONG UNIVERSITY OUTREACH Presence at Recovery 2011
| By Darin McBeath
Another convention has come and gone and the CSPG/CSEG University Outreach Committees were busy on the convention floor and at the surrounding social events. The Committees took part in nearly every aspect of the convention’s offerings. The week consisted of booth activities, evening socials, a student pub night, the luncheon with guest speaker John Furlong, and finally the core meltdown at the ERCB Core Research Centre.
The University Outreach Committees from both the CSPG and CSEG worked together throughout the week to welcome students to the industry and provide them an area to meet and mingle. Our booth had a foosball table, music, and food. Students met with CSPG/CSEG representatives, fellow students, and industry professionals in comfortable surroundings. They signed up for student memberships and summer field trips, got information about bursaries and
The student pub night was yet again a great success. Over 70 students from across the country came to Local 522 to mix and mingle with industry professionals and each other. A few drinks were downed and some great food and music was taken in while everyone socialized in a relaxed atmosphere. The winners of the CSEG’s challenge bowl were announced (Chris Bird and Peter Gagliardi of the U of C) and names were also drawn for tickets to attend the luncheon with John Furlong (CEO VAnOC). Six lucky students joined darin mcBeath and Jacey Seebach (of the CSPG University Outreach Committee) at the luncheon the next day and listened to an inspirational speech from mr. Furlong about the Olympics and our great country.
The final day at the convention floor booth we drew the name for the winner of the iPad 2. There was quite a bit of interest in this and several students came to the booth specifically for the moment when the The lucky student was Ahmed Alhani of the University of Alberta, who had these kind words for us afterwards:
“I’d like to extend my gratitude to the CSEG and CSPG and their sponsors for organizing all the student events at the convention. The Challenge Bowl was very enjoyable and beneficial to all of us. The University Booth and mixers helped everyone meet more students and network with some professionals. I won the iPad at the convention and would like to also thank you for it, it’s a great incentive for students to attend conventions and events when such prizes are offered.”
Thanks, Ahmed Alhani
The week wrapped up with yet another social event at the Core meltdown. Throughout the week, much-sought-after core meltdown tickets were awarded to students. The event was blessed with nice sunny weather, cold beer, and great food, a nice way to culminate the busy week.
I would like to thank all the volunteers from both the CSPG and CSEG who helped organize the University Outreach booth and made the week happen. The week’s activities were enjoyable and the students enjoyed having a space for them during the convention. See you next year!
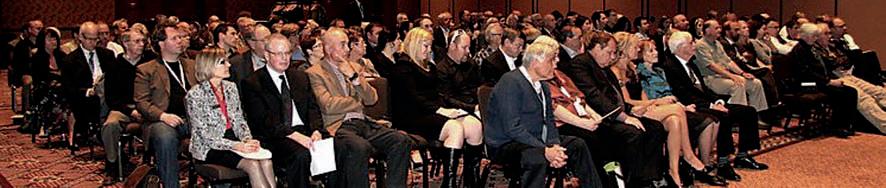
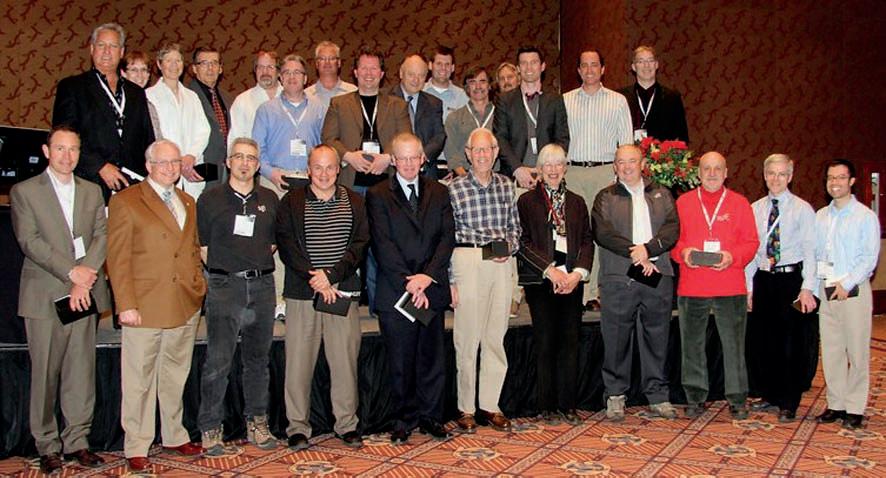
2011 AWARDS CEREMONY
The Canadian Society of Petroleum Geologists annually recognizes members for their dedicated volunteerism and technical contribution to advances in Petroleum Geology.
The 2011 Awards Ceremony was held during geoConvention: recovery 2011. The 2010 CSPG Award recipients, Award Committee Chairs, various members of the CSPG Executive Committee and guests met at the Hyatt Regency, Calgary to celebrate these achievements. In attendance were over 160 people.
The 2010 awards were presented by CSPG President kirk Osadetz, with assistance from Past President John Varsek, Richard Thom, and Award Committee Chairs Ian kirkland and Lloyd Freeman.
Volunteers are the backbone of the Society and CSPG simply would not exist without their help. The following 2010 Volunteer Awards were presented at the 2011 Award Ceremony:
PreSIDenT’S awarDS for Outstanding Service by a CSPG Member mark Cooper and Colin Yeo
TraCkS awarDS for Members Who Have Set New Standards of Excellence Denise Hodder and Vic Panei
ParTnerSHIP TraCkS awarDS for Non-CSPG members or Non-Geologists Who Have Made Outstanding Contributions to CSPG John Cuthbertson and annette milbradt
SerVICe awarDS
- 98 recipients
(a list of recipients can be seen at http://www.cspg.org/ awards/index.cfm)
VolunTeer awarDS
- 60 recipients
(a list of recipients can be seen at http://www.cspg.org/ awards/index.cfm)
CSPG recognizes excellence in advancing the science of geology, especially as it relates to petroleum, natural gas, and other fossil fuels. In doing so, we also recognize those who promote the technology of exploration for finding and producing these resources. The 2010 Technical Award winners presented are as follows:
STanleY SlIPPer GolD meDal for Outstanding Career Contributions to Oil and Gas Exploration in Canada norman Fischbuch
r .J.w. DouGlaS meDal for Outstanding Contributions to the Understanding of Sedimentary Geology in Canada Deborah Spratt
HonorarY memBerSHIPS
michael Cecile and George Pemberton were acknowledged and were presented with their awards the following night at the 11th Annual Long-Time Members Reception.
lInk awarD for Best Presentation Technical Luncheon Series Jen russell-Houston
meDal oF merIT for Best Paper Related to Canadian Petroleum Geology Jack wendte, David Sargent, alan Byrnes, and Ihsan al- aasm.
kirk Osadetz also recognized the following volunteers: Technical Luncheon speakers, Technical division speakers, Short Course instructors, Field Seminar leaders, Public Outreach speakers, SIFT field trip leaders and industry judges, Bulletin of Canadian Petroleum Geology authors, and Reservoir authors and contributors.
Special thanks went to the Awards committees and Chairs, Educational Trust Fund Trustees, the 2011 Executive Board of directors, and all of the volunteers who helped make geoConvention: recovery 2011 a success.
We look forward to the next Awards Ceremony in 2012, which will honor the 2011 CSPG Award Recipients.
CSPG Continuing Education
Upcoming Short Courses and Education Week
Writing for Earth Scientists (Matt Hall)
The Architecture of Fluvial Reservoirs (Andrew Miall)
Subsurface Methods in Clastic Sediments (Doug Cant)
Log Analysis in Unconventional Reservoirs (Ross Crain)
Practical Geomechanics for Unconventional Oil and Gas (Pat McLellan)
Sequence Stratigraphy; Principles and Applications (Octavian Catuneanu)
Structural Interpretation and Analysis of Fractured Reservoirs (Paul MacKay)
Mannville Stratigraphy, Sedimentology, and Petroleum Geology (Doug Cant)
Optimization of Fractured Well Performance of Horizontal Wells (Ruhul Amin)
Rock Creek Stratigraphy, Sedimentology, and Petroleum Geology (Doug Cant)
Register TODAY to take some of the sold out 2011 Convention courses and other additional courses : September 22 and October 19 - 28, 2011
For full course details and dates, go to: www.cspg.org/education/education-week.cfm
If you are interested in running a short course, contact: Tina Donkers at tinadave@telusplanet.net
Early bird registration deadline: September 16, 2011.
Basic Core Logging with Integrated Ichnological Techniques (Kerrie Bann & Stuart Tye)
Horizontal Well Drilling and Hydraulic Fracturing in Tight Sands (Saad Ibrahim)
Registration closes: October 17, 2011
The 2011 CSPG Awards Ceremony at the Hyatt Regency Calgary
2011 SERVICE AND VOLUNTEER AWARDS
Volunteers are essential to the services and programs offered by CSPG and without them the organization would not exist. CSPG recognizes the extraordinary team of volunteers yearly through Service and Volunteer Awards. These awards were presented at the 2011 CSPG Awards Ceremony on m ay 9th, 2011 during geoConvention: recovery 2011.
Service Awards are presented to members of CSPG who have contributed to the Society through committee or other volunteer work. They are generally awarded for five or more years of service and to exiting committee chairs.
Volunteer Awards are presented every year to CSPG members who have demonstrated significant service to the Society through
volunteer work. They have served on a CSPG committee for a minimum of two years, although many have been with the Society for several years.
For a complete list of the 2010 Service and Volunteer Award recipients, please refer to the February 2011 Reservoir or the following webpage: http://www.cspg.org/awards/ index.cfm.
2011 Volunteer Award Recipients
23RD ANNUAL CSPG-CSEG 10KM /5KM
Road Race and Fun Run
On your mark! Once again, the CSPGCSEG will be running its annual Road Race and Fun Run this September. Building on last year’s format, the event promises to be better than ever!
We will be offering both a 10km and a 5km race. We have secured Winning Time to provide chip timing and Events-on-Line will provide easy on-line registration.
The run will take place on Wednesday, September 14, 2011. Start time 6:00pm just north of the Eau Claire ym CA. The route will take you on an out-and-back course along the beautiful Bow River pathway, finishing at the Eau Claire ym CA. Following the race, all racers, volunteers, and guests are invited to gather at the Calgary Curling Club, just north of Prince’s Island for awards, draw prizes, refreshments, and some friendly camaraderie. So if you are looking for a competitive race or just want to have fun, come join us!
The race is open to all members of the CSPG, CSEG, and CAPL, and the general public, however, space is limited to 200 participants. So register early to avoid disappointment! There will be n O race day registration. For more information or to register, visit our website www.cspg. org\events. For sponsorship opportunities please contact m ike Cardell at 403-781-1426 or mcardell@arcis.com
To help you prepare, Gord Hobbins of Gord’s Running Store has developed a 10km race training guide for novice runners. Try it out and benefit from some expert advice, you may be surprised how easy it can be
to gently get yourself in condition for your first race.
G ORD ’S 12 W EEK T RAINING GUIDE FOR NOVICE RUNNERS
Guidance/Tips: For novice runners who wish a do-it-yourself program at your leisure.
• Run for short durations between three and five times per week according to schedule, with your long-run days being the key to your training program.
• If your running shoes are giving you some problems, get some that fit and match your gait.
• Guide allows for a gradual increase to a comfortable load; your legs may need some conditioning at first.
• Yes, times are in minutes. The secret is to be regular and not beat yourself up.
• Wear a hat and cool shades. Keep well hydrated. It really helps.
• Gently stretch those calves and quads afterwards.
• Take along a friend and convince them to sign up for CSPG, CSEG and the Road Race as well.
m any thanks go out to our sponsors and volunteers who make this event possible each year!
We hope to see you there! m ike Cardell, Race director.
GO TAKE A HIKE
Yasur Volcano, Tanna Island, Vanuatu
| By Philip Benham and Ulla Lohmann
TL: Map of Vanuatu from AFP (Agence France-Presse).
Centre Left: close-up of andesite volcanic bomb, note large plagioclase crystals.
Trailhead: yasur volcano can be accessed from the various lodges or small villages surrounding the volcano. Accommodations are rustic. Local guides are aware of the eruptive patterns and know the safe viewing areas. note that volcanic activity is unpredictable and risk is moderate to high depending on the level of activity.
Distance: The volcano can be climbed from most directions. It takes less than two hours to ascend the road from Jungle Oasis lodge to the parking lot within 300m of the vents. The less athletically inclined can take a very bumpy drive to the top. 7.5 km return trip and 350m gain if sticking to the roads.
The remote South Pacific islands of Vanuatu sport many active volcanoes fueled by subduction of the Australian-Indian Plate beneath the Pacific Plate. The island of Tanna is composed of Pliocene to recent subaerial and subaqueous lavas, lahars, scoria cones, and lapilli tuff interspersed with minor reef sequences. On the island, the active yasur Volcano has formed on the nE flank of the much larger Pleistocene Tukosmeru Volcano. yasur is a 350m tall unvegetated scoria cone with a 400m diameter summit crater. Tectonic activity has uplifted the nearby Port Resolution Harbour over 20m in the last century.
The Reservoir Committee welcome contributions from our readership to this series. If you wish to offer a submission to Go Take a Hike on your favourite hike of geological interest, email the Reservoir at caitlin.young@cspg.org for more information.
The volcano was first reported by Captain Cook in 1774, but the Strombolian-style eruption has likely been continuing for over 800 years. In periods short as minutes it vents (with the roar of a jet airplane) SO2 and other noxious gases, or explosively expels ash and partially molten rock. The mouths of all the vents glow incandescent with the heat. The best time to view the eruptive activity is at night when the glowing orange ejecta tumbles in broad arcs through the dark sky against a backdrop of stars. Adding to the excitement are the discharges of lightning generated by the ash particles rubbing together. normally, the volcanic bombs are ejected a few hundred metres, but during periods of higher activity are vented beyond the crater walls onto the flanks or even the ash plain below. The more molten bombs flatten like cow patties upon impact. The vented material is composed of andesite with large plagioclase crystals. This composition of magna occurs in volcanoes prone to caldera-forming explosions (Allen, 2005). yasur itself sits within a 20,000 year-old oval caldera about 24 km2 in area.
yasur emits SO2 gas at a rate of up to 7.9kg/sec; about 2% of the global volcanic total (Bani, 2007). The vented SO2 mixes with water droplets creating an acidic volcanic fog (vog) and contributing to sulphuric acid rain, which damages local crops. The vog stretches for over 1,000km and is thick enough to be viewed by satellite. Regular ashfall also hinders crops and harms livestock such as cows, whose ruminant digestive process increases the damage caused by ingested shards of ash. The John Frum cargo cult village of Lenakel lives at the foot of the volcano and they have incorporated it into their daily lives and oral histories.
references: Allen S.E. 2005. Bull Volcanol. v.67, p.27-41. Bani, P. 2007. Geophys. Res. Lett. 34(20), p.6-9.
Photo
BL: At Lenakel Village, with Yasur erupting in the background. BR: Incandescent bombs reach 1km in height during a particularly active phase of the eruption. The blobs of semi-molten rock leave streaks on the slope as they roll back to the vent.
As dusk falls the incandescent nature of ejecta is revealed.
This several-minute-long exposure reveals the “moonscape” of ash and bombs atop Yasur. Several of the vents ejected bombs during this exposure.
The scoria cone lies in the middle of an ash plain. The constant ash fall and the acid rain make it difficult for the lush jungle present on the rest of the island to take hold.
The semi-molten bombs change shape or split into fragments as they fly through the air.
A large explosion sends ash several km into the air. The unusual shape of the clouds is related to particle fallout.
This timed exposure shows three vents and bombs (left), ash (right) and bluish SO2 fumes (centre). For updates on volcanic activity visit http://www.geohazards.gov.vu/
Even at a distance the ash affects crops and flowering plants such as this hibiscus.
Since 1927...
CORPORATE MEMBERS
APACHE C AnAdA LTd.
BAkER ATLAS
CAnAdIAn nATURAL RESOURCES LTd
C ASE y & A SSOCIATES
COnOCOPHILLIPS C AnAdA LIm ITE d
dEVOn C AnAdA CORPORATIOn
EnERPLUS CORPORATIOn
GEOLOGIC SySTE mS LTd.
GEOSTRATA RESOURCES InC.
HUnT OIL COm PAny OF C AnAdA
HUS ky E nERGy InC.
IHS
Im PERIAL OIL RESOURCES
kkd OIL SAndS PARTnERSHIP
LITTLE ROCk dOCU mEnT SySTE mS
m J SySTE mS
m URPHy OIL COm PAny
nE xE n InC.
PE nn WEST PETROLEU m LTd.
PETROCRAFT PROdUCTS LTd.
PLUSPETROL S.A
RPS EnERGy C AnAdA LTd.
S HELL C AnAdA LIm ITE d
S PROULE A SSOCIATES LIm ITE d
SUnCOR EnERGy InC.
TALIS mAn EnERGy InC.
TOTAL E&P CAnAdA LTd.
TOURmALInE OIL CORP
AS OF JUNE 10, 2011
CSPG welcomes our 2011 Corporate Members! The benefits of being a corporate member include:
• Recognition in the monthly Reservoir and quarterly Bulletin
• One associate membership
• Reserved tables at the technical luncheons with your company logo
• One free pass to the CSPG Core Conference …and more! Contact Kasandra Klein at Kasandra. klein@cspg.org to be a corporate member today!
C ONTINUING E DUCATION at the 2011 Convention
CHaI
r: Carrie Jeanes
e xeCuTIV e m em B er S: Brett norris and Jon noad
oFFIC e: dayna Rhoads
Comm ITTee m em B er S: Ali Beken, Amanda mitander, Andrew Riben, Edlyn Bruni, debbie Legaspi, Ryan Cook, Samantha Etherington, Tina donkers
The 2011 Convention was a great success. We ran 67.5% of the Short Courses and Field Seminars that were advertised. We had a much higher run percentage for the Short Courses (78%), compared to the Field Seminars (25%).
The CSPG introduced a new Instructor Payment Scheme this year, which attracted a wide range of Instructors for this year’s Convention. If you would like more information on the new Payment Scheme please see: http://www.cspg.org/education/ docs/CSPG_Instructor_Payment_ Structure.pdf
FIELD SEMINARS:
This Convention, the CSPG ran two out of the eight field seminars advertised. The two Field Seminars that ran were entitled:
1) Contrasting the Reservoir of Braided vs. meandering depositional Systems and
2) SAGd Fundamentals – Application of Outcrop Analogues, Geology, Geophysics, and Geochemistry to Oil Sands Recovery. The attendance was 10 participants for each Field Trip for a total of 20 participants for Field Seminars.
SHORT COURSES:
The CSPG ran 25 out of the 32 short courses advertised for the Convention. The Short Courses ranged from a half a day up to four days in length. The most popular courses were:
1) SAGd Fundamentals – Applications of Core, Geology, Geophysics, and Geochemistry to Oil Sands Recovery,
2) Subsurface methods – Core Work and Log Correlation in Clastic Sediments,
3) Seismic Exploration for nonGeophysicists,
4) Log Analysis of Unconventional Reservoirs
5) m annville Stratigraphy, Sedimentology, and Petroleum Geology, and
6) Petroleum Geomechanics for developing Unconventional Resources.
Convention Short Course attendance ranged from 4-35 per course, with a total of 417 Short Course participants. The participant feedback was overall very positive.
Thank you to the instructors for their time, energy, and enthusiasm.
The CSPG Continuing Education Committee runs Short Courses and Field Trips all year for the CSPG. If you are interested in running a Short Course or Field Trip through the CSPG, please contact Carrie Jeanes at: Carrie.Jeanes@Cenovus.com
Pursuing Advanced Training in your Professional Field?
Upcoming Short Courses and Education Week
Canadian Society of Petroleum Geologists Continuing Education program provides relevant, quality educational programming geared to you and taught by industry professionals.
REGISTER TODAY: CSPG CONTINUING EDUCATION WEEK
See our exciting selection of courses on page 33
Class size is limited, register early! www.cspg.org/education/education-week.cfm
Call 403-264-5610 or email dayna.rhoads@cspg.org for more information
Need a solution that will take you to oil faster?
Accelerate
Introducing the DecisionSpace® Desktop unified workspace
Now your entire asset team can collaborate in real time using one unified workspace.
Accelerate analysis and interpretation by sharing a common subsurface framework. Reduce cycle time and improve accuracy by examining more scenarios faster. Improve your returns in the field and in the office with industry-leading science and unmatched usability. Learn more at halliburton.com/decisionspacedesktop