20 Deep-Water Channel-Levee complex of the Neoproterozoic Isaac Formation
24 Practical Sequence Stratigraphy III Historical Development of the Discipline
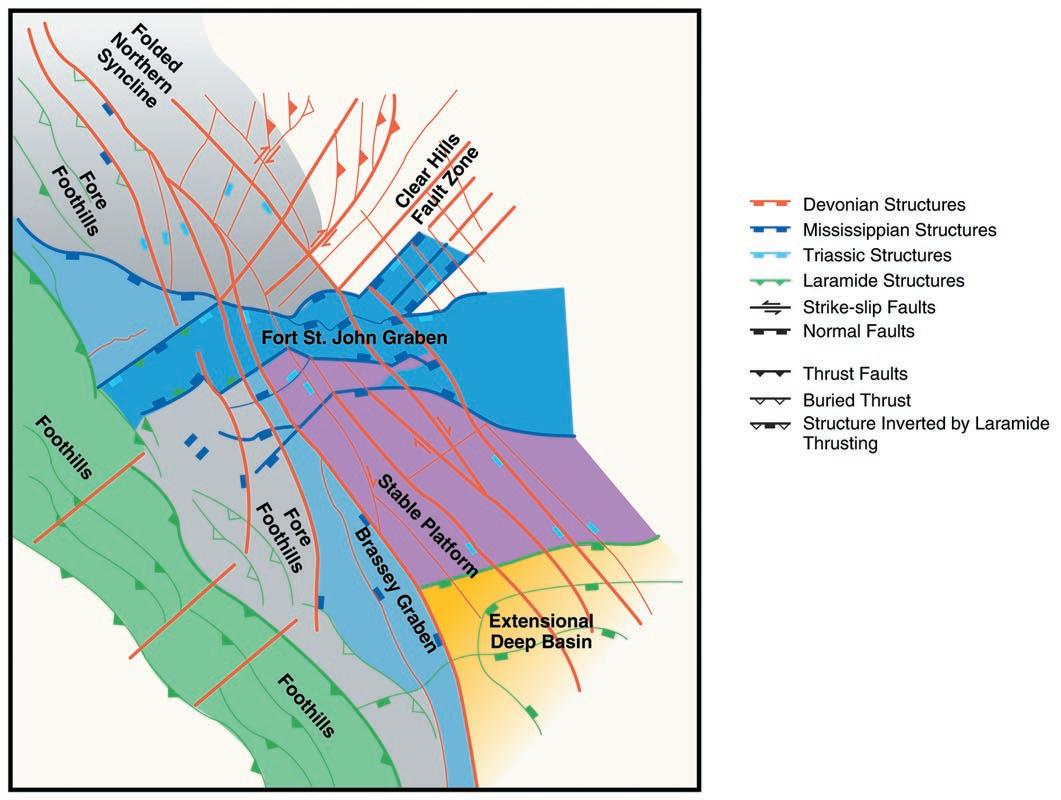
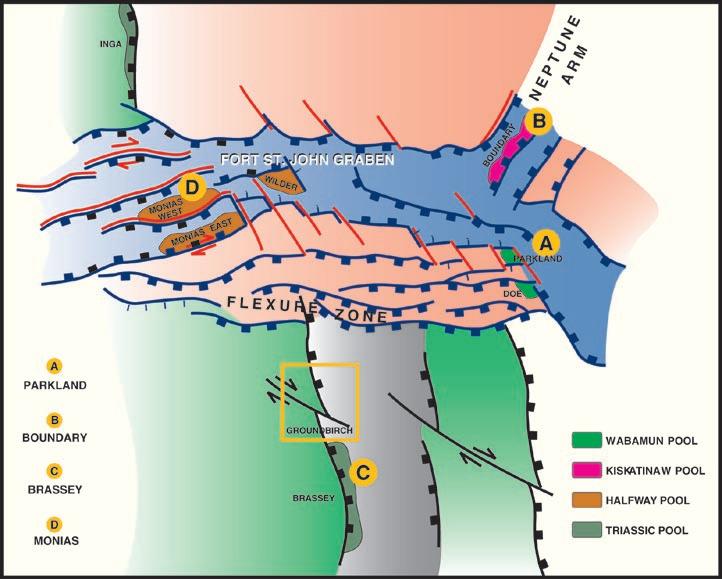
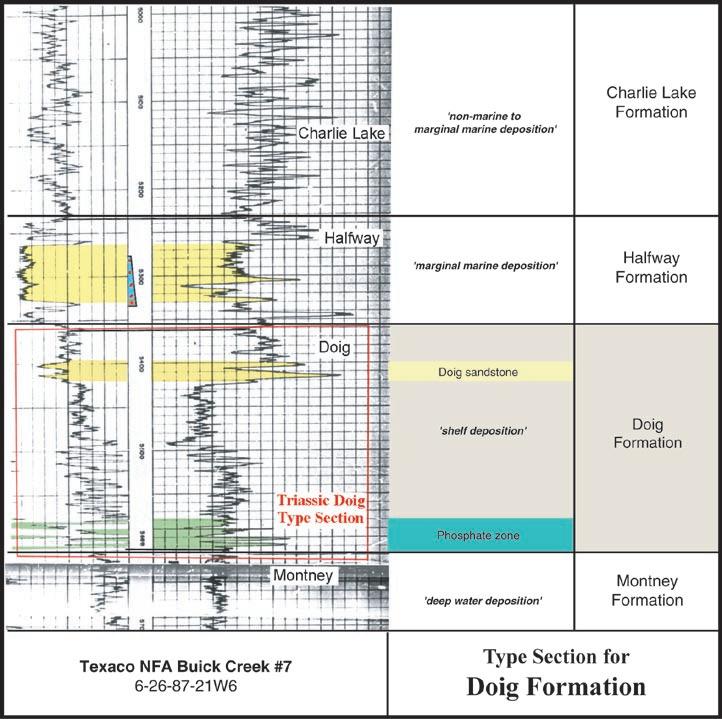
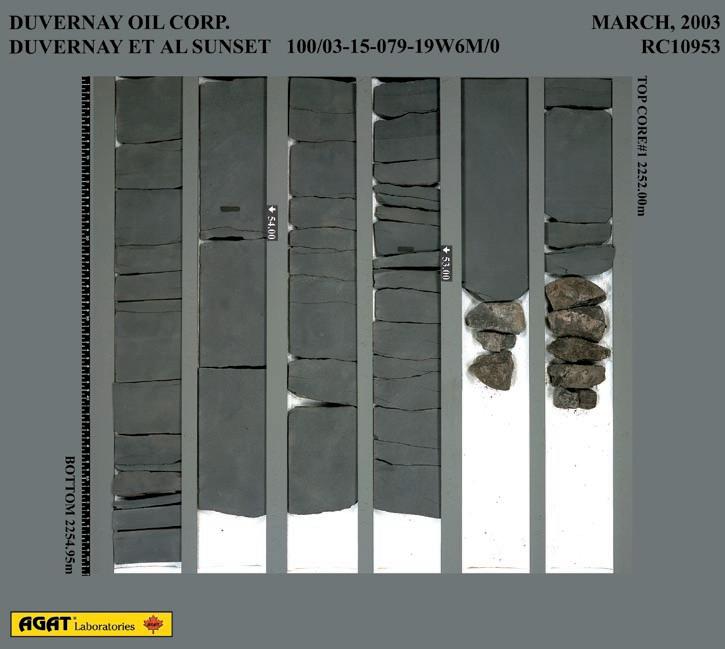
32 The Doig Formation in Peace River Country
38 CSPG Awards
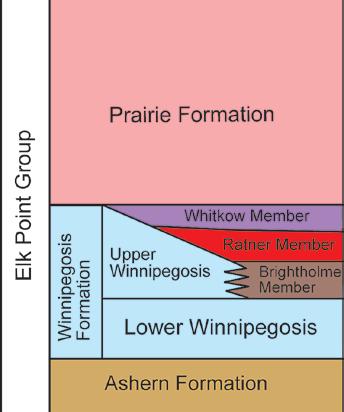
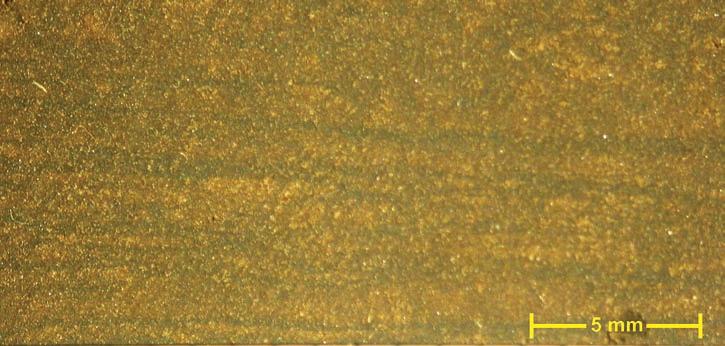
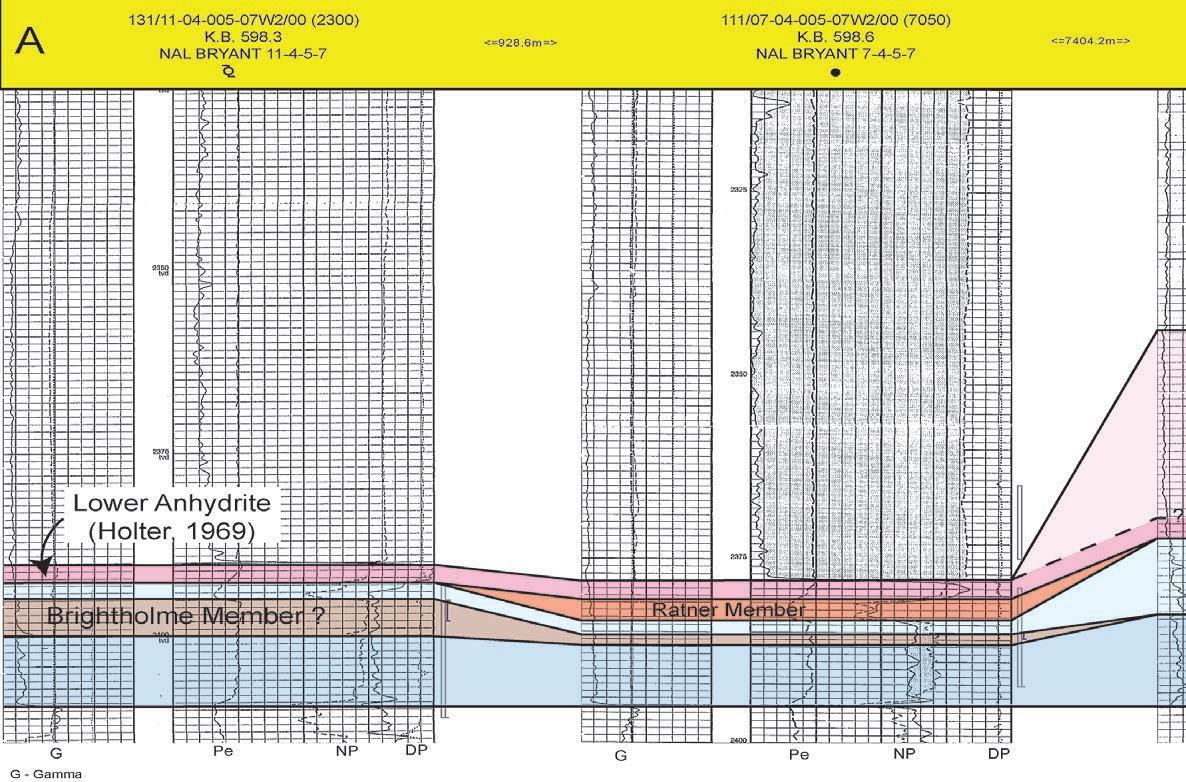
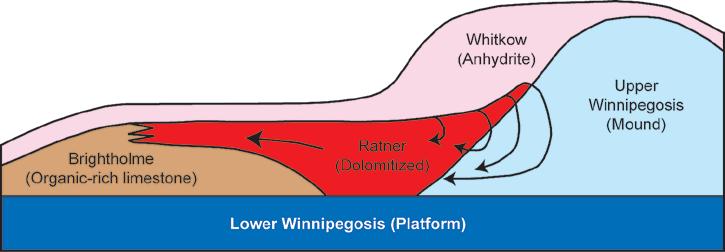
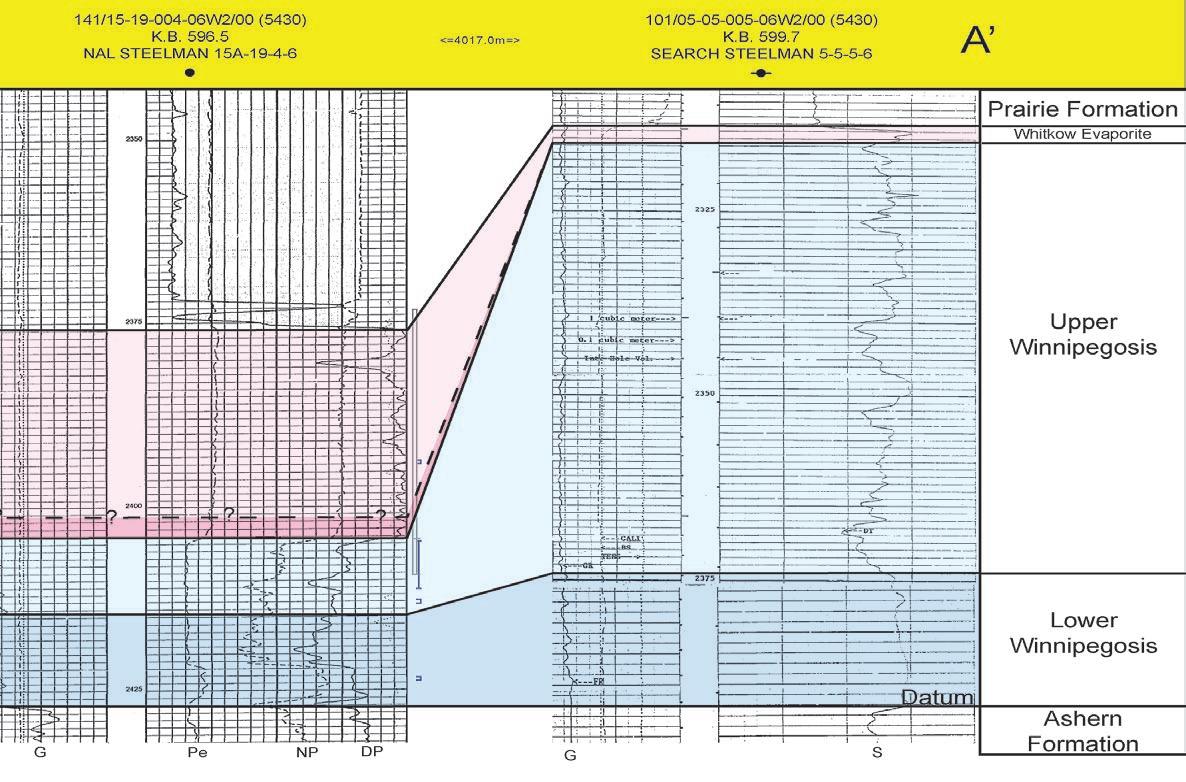
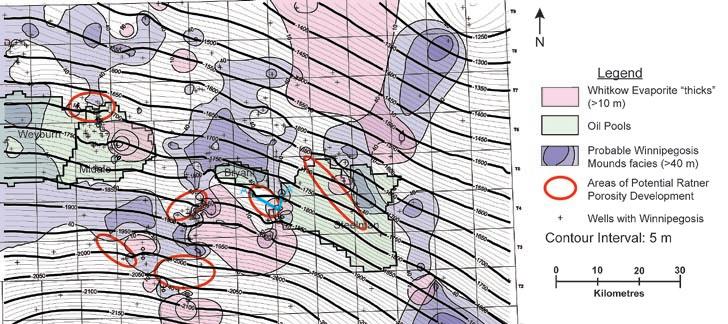
43 The Ratner Laminites Porous dolostone in an “inter-reef ”setting
Conduct your search for oil & gas with clarity and confidence.
“IHS data and PETRA: the beauty is in the integration of data, software and disciplines. With PETRA we can bring it all together; making it do what we need it to. It’s that simple.”
Tom Perkins Chief Geologist, Ivanhoe Energy
PETRA provides multi-discipline reservoir management teams with the analysis tools needed for today’s exploration, exploitation and acquisition challenges.
CSPG OFFICE
#600, 640 - 8th Avenue SW
Calgary, Alberta, Canada T2P 1G7
Tel: 403-264-5610 Fax: 403-264-5898
Web: www.cspg.org
Office hours: Monday to Friday, 8:30am to 4:00pm
Business Manager: Tim Howard
Email: tim.howard@cspg.org
Communications & Public Affairs: Heather Tyminski
Email: heather.tyminski@cspg.org
Corporate Relations Manager: Alyssa Middleton
Email: alyssa.middleton@cspg.org
Membership Services: Dayna Rhoads
Email: dayna.rhoads@cspg.org
Programs & Services Manager: Lori Humphrey Clements
Email: lori.humphreyclements@cspg.org
Reception: Kasandra Klein
Email: reception@cspg.org
Joint Annual Convention Committee
Convention Manager: Shauna Carson
Email: shauna.carson@cspg.org
Convention Coordinator: Tanya Santry
Email: tanya.santry@cspg.org
EDITORS/AUTHORS
Please submit RESERVOIR articles to the CSPG office. Submission deadline is the 23rd day of the month, two months prior to issue date. (e.g., January 23 for the March issue).
To publish an article, the CSPG requires digital copies of the document. Text should be in Microsoft Word format and illustrations should be in TIFF format at 300 dpi., at final size. For additional information on manuscript preparation, refer to the Guidelines for Authors published in the CSPG Bulletin or contact the editor.
Technical Editors
Ben McKenzie Colin Yeo (Assistant Tech. Editor) Tarheel Exploration Encana Corporation
Comunications and Public Affairs, CSPG Tel: 403-513-1227, Email: heather.tyminski@cspg.org
ADVERTISING
Advertising inquiries should be directed to Alyssa Middleton, Tel: 264-5610, Email: alyssa.middleton@cspg.org. The deadline to reserve advertising space is the 23rd day of the month, two months prior to issue date.
The RESERVOIR is published 11 times per year by the Canadian Society of Petroleum Geologists. This includes a combined issue for the months of July and August. The purpose of the RESERVOIR is to publicize the Society’s many activities and to promote the geosciences. We look for both technical and non-technical material to publish. The RESERVOIR is not intended to be a formal, peer-reviewed publication. Additional information on the RESERVOIR’s guidelines can be found in the May 2008 issue (p.46-48; available at http://www.cspg.org/publications/reservoir/reservoir-archive-2008.cfm).
No official endorsement or sponsorship by the CSPG is implied for any advertisement, insert, or article that appears in the Reservoir unless otherwise noted. The contents of this publication may not be reproduced either in part or in full without the consent of the publisher.
Reservoir Engineering for Geologists Part 8b – Monte Carlo Simulation Risk Assessment ..
by Ray Mireault and Lisa Dean
Deep-Water Channel-Levee Complex of the Neoproterozoic Isaac Formation, Windermere Supergroup, Cariboo Mountains, Western Canada:
2. Architectural Analysis of Overbank Deposits
Khan and R.W.C. Arnott
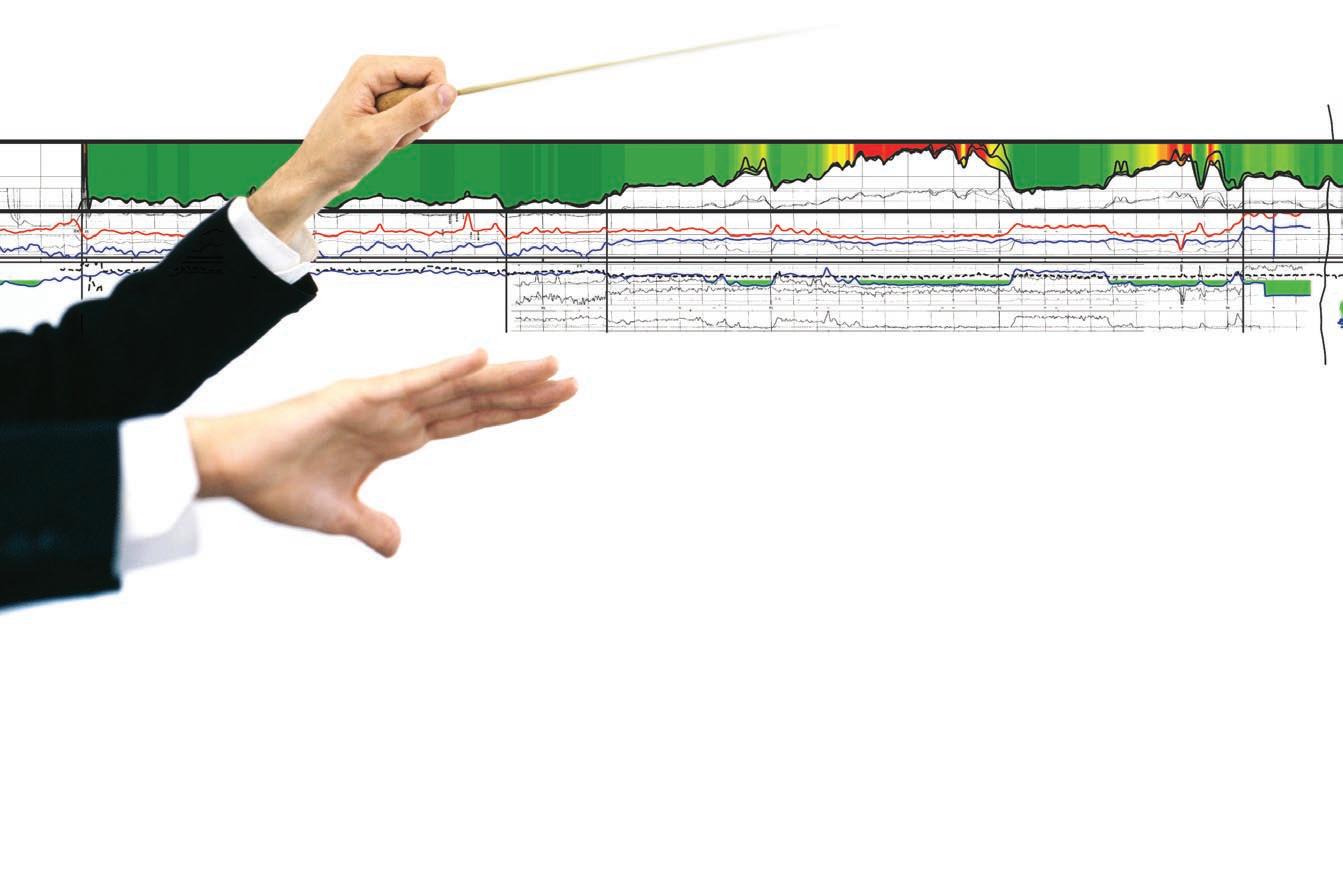
FRONT COVER
Coyote Buttes, Utah/Arizona. Water and wind erosion have exposed the Jurassic Navajo sand dune deposits. Photo by Earl Fawcett.
Fast and Permanent Color Logs
NeuraLaserColor International, Inc., is the latest technology* for log printing in the E&P industry.
At last - fast, permanent, clean color logs are a reality.
· Continuous length color and b&w laser log prints
· 7” per second color, 8.7” per second b&w
· High quality, long lasting prints
· Automated paper handling
· Partnership of industry leaders
CSPG EXECUTIVE
President
Lisa Griffith • Griffith Geoconsulting Inc. lgriffith@griffithgeoconsulting.com Tel: (403) 669-7494
Vice President
Graeme Bloy • West Energy Ltd. gbloy@westenergy.ca Tel: (403) 716-3468
Past President
Colin Yeo • EnCana Corporation colin.yeo@encana.com Tel: (403) 645-7724
Finance director
James Donnelly • ConocoPhillips Canada james.donnelly@conocophillips.com Tel: (403) 260-8000
assistant Finance director
David Garner • Chevron Canada Resources davidgarner@chevron.com Tel: (403) 234-5875
Program director
Randy Rice • Suncor Energy Inc. rjrice@suncor.com Tel: (403) 205-6723
assistant Program director
Christopher Collom • Enerplus Resources Fund ccollom@enerplus.com Tel: (403) 693-5042
serVice director
Jen Vèzina • Devon Canada Corporation jen.vezina@devoncanada.com Tel: (403) 232-5079
assistant serVice director
Ayaz Gulamhussein • NuVista Energy Ltd. Ayaz.gulamhussein@nuvistaenergy.com Tel: (403) 538-8510
A message from the Assistant Program Director, Christopher Collom
For those of you who religiously read the contributions in this column of the Reservoir,
you’ve no doubt noticed a strong theme in the most recent installments. A major effort is underway at all levels of the CSPG to increase our membership and profile Canada-wide. To achieve professional recognition from coast to coast has turned out to be an elusive goal, but one that significant stride can be made towards with hard work and dedication.
Much of that effort will, of course, be coming from volunteers. Few are surprised to know this includes all members of the CSPG executive committee. What might actually surprise you is that there are several members now, and many in past years, that do volunteer work in addition to their regular CSPG duties to help the earth sciences gain recognition in the general public. Our belief is that if these programs can achieve results in Alberta, then there is no reason they couldn’t also be effective in Vancouver, or Winnipeg, or Halifax. Let me provide an example.
At the 2007 CSPG CSEG Convention and 2008 CSPG CSEG CWLS Convention, many of you may have noticed supervised troops of junior high school students in nearly every corner of the exhibition hall lugging around bags full of the various cool freebies handed out by industry representatives and exhibitors. These students were asking lots of questions and absorbing lots of facts. In general, they were being inspired by the technology used in our field.
No, these students weren’t skipping class to hang out with their oil and gas business heroes; the students are select participants in an exciting program known as KISP. This acronym stands for “Kids in Science Program” and is open to students in grades 7-9. The program is cooperatively run by the Calgary School Boards (Public and Catholic), with the cooperation of other geosciencesfocused groups, such as the Burgess Shale Geoscience Foundation (BSGF). All the great contributing organizations cannot be
listed here, but their participation is critical to keeping this still-young initiative alive and offered year after year.
Coordination of the program thus far has largely been accomplished by Randle Robertson, director of the BSGF in Field, BC. With the dedicated assistance of a host of co-conspirators (the writer included), Randle has been working for years to get the message of the earth sciences into mainstream education. There have been successes along the way, but many challenges remain provincially, and on a larger scale.
Timed to occur each spring during the CSPG’s annual convention in Calgary, KISP begins with in-school visits by several professionals from the hydrocarbon industry. This happens about a week prior to the convention’s icebreaker. In both 2007 and 2008 we have been invited to bring rocks, fossils, geophones, and all manner of geological and geophysical paraphernalia into the science classrooms of Sir John Franklin Junior High School in NE Calgary. At least half-a-day is spent giving presentations on different aspects of the oil and gas industry to packed rooms of teenagers (some virtually abuzz with excitement on the topic, while some sound asleep right at their desks!). At times the experience can feel like loosely controlled chaos, but there are no dull moments to be sure!
This year we were also invited to Our Lady of Peace Junior High School (SW Calgary) to give our traveling road show and 15minute PowerPoint presentations. This means there was even more young folks, all with a keen interest in a career involving rocks and black, goopy oil.
Students who obtained permission slips from their parents were then added to the list of those that would be brought down to (Continued on page 7...)
Proudly
Geoscience and Engineering
Alberta’s Professional Geoscientists and Engineers provide Albertans with many of the essentials of daily living. The work that they do allows all of us to enjoy warmth, light, power, water and the ability to travel and communicate over distance.
Alberta’s Professional Geoscientists and Engineers provide Albertans with many of the essentials of daily living. The work that they do allows all of us to enjoy warmth, light, power, water and the ability to travel and communicate over distance.
Since 1920, Members of APEGGA, The Association of Professional Engineers, Geologists and Geophysicists of Alberta, have made a difference in the daily lives of millions of Albertans by bringing science and innovation to life.
Since 1920, Members of APEGGA, The Association of Professional Engineers, Geologists and Geophysicists of Alberta, have made a difference in the daily lives of millions of Albertans by bringing science and innovation to life.
The P.Geol., P.Geoph., P.Eng., and R.P.T. professional designations represent the highest standards of quality, professionalism and ethics in geoscience and engineering. APEGGA Members can take pride in the role they play and the contribution they make to Alberta. APEGGA and its over 47,000 Members are committed to public safety and wellbeing through the self-regulation of the geoscience and engineering professions in Alberta.
The P.Geol., P.Geoph., P.Eng., and R.P.T. professional designations represent the highest standards of quality, professionalism and ethics in geoscience and engineering. APEGGA Members can take pride in the role they play and the contribution they make to Alberta. APEGGA and its over 47,000 Members are committed to public safety and wellbeing through the self-regulation of the geoscience and engineering professions in Alberta.
Visit www.apegga.org for more information.
Visit www.apegga.org for more information.
CORPORATE MEMBERS
ABu DHABI OIL CO., LTD. (JAPAN)
APACHE CANADA LTD.
BAKER ATLAS
BG CANADA ExPLORATION & PRODuCTION, INC
BP CANADA ENERGY COMPANY
CANADIAN FOREST OIL LTD.
CANETIC RESOuRCES TRuST
CONOCOPHILLIPS CANADA
CORE LABORATORIES CANADA LTD
DEVON CANADA CORPORATION
DOMINION ExPLORATION CANADA LTD
DuVERNAY OIL CORP
ENERPLuS RESOuRCES FuND
FuGRO AIRBORNE SuRVEYS
geoLOGIC systems ltd.
GRIZZLY RESOuRCES LTD
HuNT OIL COMPANY OF CANADA, INC
HuSKY ENERGY INC.
IHS
IMPERIAL OIL RESOuRCES LIMITED
LARIO OIL & GAS COMPANY
MJ SYSTEMS
MuRPHY OIL COMPANY LTD.
NExEN INC
PENN WEST PETROLEuM LTD
PETRO-CANADA OIL AND GAS
PETROCRAFT PRODuCTS LTD.
PROVIDENT ENERGY LTD
RPS ENERGY CANADA LTD.
SHELL CANADA LIMITED
SPROuLE
SuNCOR ENERGY INC
TALISMAN ENERGY INC
TAQA NORTH LTD
TOTAL E&P CANADA LIMITED
WEATHERFORD CANADA PARTNERSHIP
AS OF MAY 29, 2008
(...Continued from page 5)
the Round-up Centre for the convention. Between the two schools, nearly 185 girls and boys were registered! A limit of six students were allowed to be with each volunteer guide (there’s that V-word again), so we had to have a virtual army of eager, brave, and ever-so-patient industry people come out and lead their inquisitive groups. After visiting about three pre-designated sponsors’ booths, the student groups all met at the Stampede Agriculture building for lunch and a rousing round of “Geo-Pardy”.
Based on the TV game show Jeopardy, this fun and frantic game allowed the brightest of these select kids to represent their groups and try to win the top prize (usually just playground bragging rights that they were smarter than so-and-so). I’ll admit that it was a lot of fun. David Moore and I read off the answers, after which there was often a cacophony of voices trying to be first to respond. There were probably about a dozen or so times we had to admonish the “council of 185” to put a lid on it and quiet down – or else! Were we that loud as kids? Maybe, but I still can’t wait until next year.
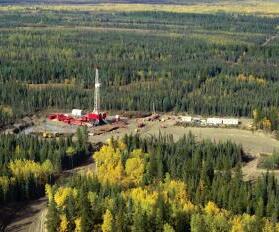
So, does the average thirteen-year-old even know how seismic waves are generated and recorded? Could they point to a drilling rig off the side of Hwy 22 and identify it as such and what it was doing? How important is it for members of our modern society to understand where gasoline, plastics, petrochemicals come from? These are not easy questions to answer (even if you are older than 13). Odds are that the kids who sat through the presentations, and definitely those that attended the convention would know or could start to formulate a response. One of the more frequently asked questions they have is “How many years of university do I have to take before I can start working downtown, or at a refinery, or in the field?”
Talk about chomping at the bit!
It is recognized that the majority of students are influenced in making career decisions during their junior high school grades. At this stage of their formal education, students are also being directed into matriculation or technical programs. Every opportunity should be made to expose junior high school students to the variety of career choices and study programs that are available to them in the sciences. I will not repeat the well-worn statistics on the documented decline of Canadians choosing careers in the sciences, particularly those directly involved with the hydrocarbon industry. While alarming, such trends can be slowed and even reversed – again with lots of (you guessed it) hard work and
dedication. The fate of our industry is at stake, so this isn’t just a side issue we’re talking about here.
Outreach can be exhausting work. The temptation exists to lament the lack of pay – but to know that these efforts are going a long way in ensuring that future generations of responsible geologists, geophysicists, and engineers are potentially being recruited is payment enough in my book. In fact, that is worth more than any amount of cash. If we want to have a hydrocarbon industry in our country fifty or a hundred years from now that is staffed, at least in part, by Canadians then we’ll all have to pitch in and contribute sooner rather than later. What are needed are your time, enthusiasm, and willingness to explain to young people why you have chosen specifically your profession, rather than become a professional in a different trade. Ever thought about it in that light? The very fact that you’re even reading this message probably means you are a geologist, geophysicist, or engineer (or the spouse of someone that left their Reservoir copy out on the kitchen counter).
Back to the theme of facilitating the spread of CSPG across Canada, KISP is just one of many programs currently underway to increase awareness and education on all things related to the earth sciences. It is literally putting the Earth back into the sciences. We’ve got it pretty good here in Calgary (and Edmonton) when it comes to the profile of our field in the eyes of the general public. If we can use the experience gained from in-school programs such as KISP, then we may already be on our way to winning the biggest battle in the campaign to gain nationwide exposure to our industry: get them while their young. By ensuring a continuous flow of students through the elementary and secondary education system into declared majors in geosciences and engineering at colleges and universities, then the groundwork will be more effectively laid for the CSPG to gain a foothold from the Atlantic to Pacific. And let’s face it – this isn’t going to be achieved overnight.
Now that all the troops have been alerted to the cause (ad nausium, some might say), we’ll be working towards this goal for years to come. Who knows, maybe some young guy or gal who first had the spark lit for a career in oil and gas during last year’s or this year’s KISP curriculum will be Program Director or CSPG President when we finally can say that the Canadian Society of Petroleum Geologists has become an inextricable part of the exploration and development industry in our wee corner of North America.
It is once again time to plan your ticket orders for the CSPG Technical Luncheons, they are scheduled 19 times for the 2008/2009 season with the addition of 1 joint CSEG and CSPG technical lunch. This year a few changes have been made to the Technical Luncheon Ticket program:
1) The price of CSPG Member tickets has increased from $35.00 to $38.00 to cover increasing operating costs, and 2) We have also introduced a new Non-Member ticket price of $45.00. So if you are not yet a CSPG Member now is a fantastic time to become one!
This year the CSEG and the CSPG will be holding their first ever Joint Luncheon. Mr. Peter Duncan will be delivering his talk on “Microseismic Opportunities over an Oilfield’s Life” on Monday, September 15th, 2000 at the Telus Convention Center. Mr. Duncan is a SEG/ AAPG Distinguished Lecturer. Tickets for this luncheon will be $36.75 (including GST) for all members and non-members.
There are three options to purchase your Technical Luncheon Tickets; they are as follows:
1) CORPORATE MEMBERS:
CSPG Corporate Members may pre-order tickets for each Technical Luncheon, which will be couriered back to you along with an invoice each month. The same number of tickets must be purchased for each luncheon and tickets are not refundable or exchangeable. The following month’s tickets will be sent out once payment for the previous months invoice has been received. Any changes to your standard ticket order must be made one week prior to the technical luncheon date. Additional tickets may be ordered for any luncheon by contacting us at 264-5610. Tickets are $39.90 (including GST) per lunch.
2) CSPG MEMBERS –NON CORPORATE MEMBERS:
If you are not a CSPG Corporate Member, you may elect to pre-purchase a set number of tickets for the 19 Technical Luncheon talks in the 2008-2009 season. Payment is required upon registration for this program. Tickets are $39.90 (including GST) per lunch.
3) NON-MEMBERS:
If you are not a CSPG Member, you also may elect to pre-purchase a set number of tickets for the 19 Technical Luncheon talks in the
2008-2009 season. Payment is required upon registration for this program. Tickets are $47.25 (including GST) per lunch.
If you wish to use any of the above ticket options you must register with the office by August 31, 2008. If you do not wish to use either of these ticket purchase options, tickets can be purchased from the CSPG office, via cheque, cash, debit, Visa or MasterCard. Technical Luncheon tickets are $39.90 (including GST) for members and $47.25 (including GST) for non-members and are available for purchase two months in advance.
Please watch your Reservoir or visit www. cspg. org for Technical Luncheon abstracts. If you have any questions please feel free to contact the CSPG office at 264-5610 or via email us at reception@cspg.org.
If you are interested in becoming a CSPG Corporate Member or learning more about our corporate member program please contact Alyssa Middleton at (403) 513-1229 or Alyssa. Middleton@cspg.org.
To become a CSPG Member please contact the office at 264-5610.
tic K et re Presentati V e registration F orm
COMPANY NAME:
TICKET REPRESENTATIVE NAME:
ADDRESS (including Postal Code):
PHONE #: FA x #:
E-MAIL:
OPTION 1 – CSPG CORPORATE MEMBERS ONLY
N u MBER OF TICKETS FOR EACH Lu NCHEON
For Ticket Orders of less than 10 tickets per luncheon, a $5/month Handling fee will be added to your invoice.
OPTION 2 – PREPAYMENT
N u MBER OF TICKETS FOR EACH Lu NCHEON
Prepayment due: Tickets x $39.90 (incl. GST) x 19 (Total # of luncheons) = $
If less than 10 tickets per luncheon ordered, a handling fee of $53.00 ($5.00 plus GST per month) is included in this payment.
OPTION 3 – N ON -M EMBERS
N u MBER OF TICKETS FOR EACH Lu NCHEON
Prepayment due: Tickets x $47.25 (incl. GST) x 19 (Total # of luncheons) = $
If less than 10 tickets per luncheon ordered, a handling fee of $53.00 ($5.00 plus GST per month) is included in this payment.
CSEG/CSPG JOINT TECHNICAL LUNCHEON
Tickets x $36.75 = $
TOTAL PREPAYMENT ENCLOSED IS:
$ (TICKETS) + $ (HANDLING FEE) = $
We accept Visa, MasterCard, or cheque as payment. If paying by credit card:
Card #:
Signature:
Expiry Date:
technical luncheons SEPTEMBER LuNCHEON
The development of northern energy resources and Canadian Arctic sovereignty and
security
SPEAKER
Rob Huebert university of Calgary
11:30 am tuesday, september 9, 2008 telus convention centre calgary, alberta
Please note:
the cut-off date for ticket sales is 1:00 pm, thursday, september 4, 2008. ticket Price: $38.00 + gst non- member ticket Price: $45.00 + gst
Due to the recent popularity of talks, we strongly suggest purchasing tickets early, as we cannot guarantee seats will be available on the cut-off date.
The Canadian Arctic is transforming; the twin processes of climate change and resource development will fundamentally change the North. There are many opportunities that come with these developments, but there will also be great challenges. It has only been very recently that Canadian Governments have shown any inclination to spend the resources necessary to find out what is happening in the North and to act when necessary. With the coming resources development, it is now necessary to increase these efforts.
This presentation will begin by considering what is meant by the term “Arctic Sovereignty and Security.” While this term is widely used, it contains many meanings. The second task of the presentation will be to examine the current threats to Canadian Arctic Sovereignty and Security. The last section of this talk will then look to the future. What impacts will the new economics of the North have on the Canadian North?
BIOGRAPHY
Rob Huebert is an associate professor in the Department of Political Science at the University of Calgary. He is also the associate director of the Centre for Military and Strategic Studies. Dr. Huebert has also taught at Memorial University, Dalhousie University, and the University of Manitoba.
His area of research interests include: international relations, strategic studies, the Law of the Sea, maritime affairs, Canadian foreign and defence policy, and circumpolar relations.
He publishes on the issue of Canadian Arctic Security, Maritime Security, and Canadian Defence. His work has appeared in International Journal; Canadian Foreign Policy; Isuma: Canadian Journal of Policy Research, and Canadian Military Journal. He was also a co-author of the report To Secure a Nation: Canadian Defence and Security into the 21st Century; and co-editor of Commercial Satellite Imagery and United Nations Peacekeeping and Breaking Ice: Canadian Integrated Ocean Management in the Canadian North. He also comments on Canadian security and Arctic issues in both the Canadian and international media.
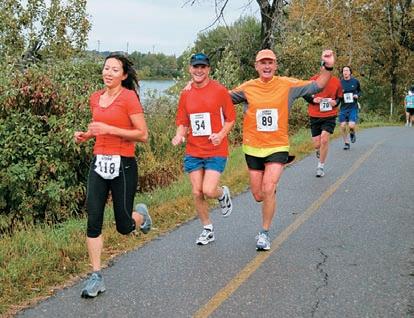
20th ANNUAL CSPG-CSEG 10K/5K ROAD RACE AND FUN RUN
Wednesday, September 10, 2008 at 6 pm SHARP
Race is capped at 200 participants, so register early to avoid disappointment! There is no race day registration.
Race is capped at 200 participants, so register early to avoid disappointment! There is no race day registration.
NEW THIS YEAR: 5 km RuN ANd CHIp TImINg.
NEW THIS YEAR: 5 km RuN ANd CHIp TImINg.
For more information or to register, visit www.cspg.org, select Events in the menu bar and follow the path to 10k Road Race and Fun Run registration.
For more information or to register, visit www.cspg.org, select Events in the menu bar and follow the path to 10k Road Race and Fun Run registration.
RACE pACkAgE pICkup:
Saturday, September 6 monday, September 8 Tuesday, September 9 12-2 pm 11:45 am - 1:15 pm 11:45 am - 1:15 pm
RACE pACkAgE pICkup: Saturday, September 6 monday, September 8 Tuesday, September 9 12-2 pm 11:45 am - 1:15 pm 11:45 am - 1:15 pm
Gord’s Running Store Eau Claire YMCA Eau Claire YMCA 919 Centre Street NW
Gord’s Running Store Eau Claire YMCA Eau Claire YMCA 919 Centre Street NW
There will be no race day package pick up. Please no dogs or strollers.
There will be no race day package pick up. Please no dogs or strollers.
Race The race begins and ends at the Eau Claire YMCA, and is an out Course: and back route along the Bow River pathway. There is a 75-minute cut-off time.
Race The race begins and ends at the Eau Claire YMCA, and is an out Course: and back route along the Bow River pathway. There is a 75-minute cut-off time.
Prizes: All participants receive a commemorative t-shirt. Awards will be given to the top finishers and the top geologists, geophysicists, and landmen for the 10 km category only. Join us after the race at Quincy’s on Seventh (6097 Ave. SW) for our post-race Pizza and Beer Party; we will have lots of great prizes!
Prizes: All participants receive a commemorative t-shirt. Awards will be given to the top finishers and the top geologists, geophysicists, and landmen for the 10 km category only. Join us after the race at Quincy’s on Seventh (6097 Ave. SW) for our post-race Pizza and Beer Party; we will have lots of great prizes!
Cost: Members (CSPG/CSEG/CAPL): $35
Cost: Members (CSPG/CSEG/CAPL): $35
Non-Members: $45
Non-Members: $45
Extra meal tickets: $20
Extra meal tickets: $20
technical luncheons SEPTEMBER LuNCHEON
Aggressively passive: microseismic opportunities over an oilfield’s life
SPEAKER
Peter M. Duncan
MicroSeismic, Inc.
Fall 2008 SEG/AAPG Distinguished Lecturer
11:30 am, m onday, september 15, 2008 telus convention centre c algary, a lberta
Please note: t he cut-off date for ticket sales is 1:00 pm, Wednesday, september 10, 2008. t icket Price: $35.00 + gst (for this luncheon only).
Due to the recent popularity of talks, we strongly suggest purchasing tickets early, as we cannot guarantee seats will be available on the cut-off date.
Passive seismic, especially microseismic monitoring, is to conventional seismic
calendar OF EVENTS
19th Annual CSPG Mixed Golf Tournament
Thursday, August 21, 2008
Lynx Ridge Golf Course
Calgary, Alberta
The CSPG Mixed Golf Tournament is a social tournament and is an opportunity to network and socialize with your colleagues and peers from industry, and provides mix and meet opportunities for geoscientists, industry, and consultants.
For more information, visit www.cspg.org
as a stethoscope is to a sonograph. It is continuous 4D. It is accomplished by listening carefully to the sounds emanating from the earth and then diagnosing what is happening down there. Passive seismic techniques not only can create an image of the reservoir and its plumbing, but also shed light on how the fluid is flowing through the pipes.
Grasping the completeness of the passive science, one can see that it provides the opportunity to contribute over the lifetime of an oilfield from discovery to abandonment. Passive seismic can accomplish reconnaissance 3D exploration at an attractive cost and lead to new discoveries. Microseismic monitoring of a hydrofrac can and does provide valuable information on completion and development strategy. Gas or fluid injection operations for primary or secondary recovery are prime candidates for passive monitoring to prove regulatory compliance, validate reservoir conformance, and estimate recovery efficiency.
This lecture will present a view on the history and development of passive seismic techniques, a discussion of state-of-the art through case histories and a vision on where this technology will play a role in the smart oil field of the future.
BIOGRAPHY
Peter M. Duncan is the founding President of
MicroSeismic, Inc., a Houston-based geophysical service company. He holds a Ph.D. in Geophysics from the University of Toronto. He began his career as an exploration geophysicist with Shell Canada before joining Digicon Geophysical, first in Calgary then in Houston. In 1987, Duncan helped Digicon found ExploiTech Inc, an exploration and production consultancy. He was named President of ExploiTech when it became a subsidiary of Landmark Graphics in 1989. In 1992, he was one of three founders of 3DX Technologies Inc., an independent oil and gas exploration company where he served as Vice President and Chief Geophysicist. Duncan was 2003-2004 President of the Society of Exploration Geophysicists (SEG)
Sponsored by:
20th Annual CSPG CSEG 10k/5k Road Race and Fun Run
Wednesday, September 10, 2008 – 6pm SHARP
Eau Claire YMCA
Calgary, Alberta
The race will begin and end at the Eau Claire YMCA and will be an out and back route along the Bow River Pathway. Awards will be given to the top finishers in the 10 km category.
For more information, visit www.cspg.org.
Ore Gangue 75th Reunion
March 19-21 2009
Saskatoon, Saskatchewan
For more information on the Ore Gangue 75th Anniversary Reunion, visit www.oregangue.org.
Full Cycle Multicomponent
CGGVeritas brings full cycle integrated experience to your multicomponent project, from acquisition through processing and reservoir characterization.
Acquisition
> extensive experience with over 150 multicomponent projects (2D, 3D and 4D) conducted since 2001
> over 11,000 multicomponent digital sensor units available
> innovative field solutions for multicomponent recording
ENVISION SUCCESS
Processing
> reliable results: processing teams with substantial experience in 3C, converted wave and 4D processing
> exclusive Adaptive Polarization Filtering process improves P-wave data by leveraging the full-wavefield recording
> pre-stack migration for both PP and PS data
Reservoir Characterization
> PP and PS data to characterize reservoir lithology, fluid type, and fracturing
> improved density estimates from joint inversion, for heavy oil
> fracture estimation from shear-wave splitting
Rely on CGGVeritas to maximize your exploration accuracy. You’ll have access to leading seismic imaging technologies, highly sought 3D and 2D data, the most advanced acquisition capabilities and a staff dedicated to helping you succeed.
Focus on Performance Passion for Innovation Powered by People Delivered with Integrity
2008 CALL for Ph.D. and m.Sc. TheSeS
Win $2500.00 and a framed certificate; and a one year membership with the CSPG for: the Doctoral thesis that makes the most significant contribution to Canadian sedimentary geology in 2008.
Win $2000.00 and a framed certificate; and a one year membership with the CSPG for: the Master’s thesis that makes the most significant contribution to Canadian sedimentary geology in 2008.
Deadline for submissions is September 15, 2008.
Submitted theses will be returned in late January 2009 after the completion of judging.
Winning thesis topics in recent years have included studies of: Ichnology and neoichnology, detailed studies of Cretaceous (Falher, Basal Colorado) and Carboniferous (Kiskatinaw) reservoirs, modern channel bar sand geometry, epeiric carbonate platform deposition and an integrated sedimentological, ichnological, paleoenvironmental and paleoecological study of submarine fans.
Eligible theses are either produced in a Canadian university, regardless of project location, or deal with a Canadian sedimentary/petroleum geology topic, regardless of the university of origin. Theses entered for the 2008 awards must have been submitted to a recognized university inside or outside Canada, and must have formed part of the requirements for degrees awarded at the Fall 2007 or Spring 2008 convocations. Candidate theses must be well written, clearly and adequately illustrated and properly bound.
Canadian Society of Petroleum Geologists (CSPG) Graduate Thesis Awards Committee
Proud Sponsor of the CSPG Graduate and Undergraduate Theses Awards.
technical luncheons SEPTEMBER LuNCHEON
The changing face of exploration in the Western Canada Sedimentary Basin
SPEAKER
Ian Young EnCana Corporation
CO-AUTHOR
Colin Yeo EnCana Corporation
11:30 am tuesday, september 30, 2008 telus convention centre calgary, alberta
Please note: the cut-off date for ticket sales is 1:00 pm, thursday, september 25, 2008. ticket Price: $38.00 + gst. non- member ticket Price: $45.00 + gst.
Due to the recent popularity of talks, we strongly suggest purchasing tickets early, as we cannot guarantee seats will be available on the cut-off date.
Hydrocarbon production in the Western Canada Sedimentary Basin (WCSB) is currently in decline with the exception of the oil sands. This is typical of many basins that have gone through a series of phases as they progress down the resource pyramid. The earliest exploration in a basin is typically focused on large structural plays. As the basin matures there is a gradual shift towards stratigraphic plays, and later still towards unconventional plays: tight gas, coal-bed methane, shale gas, and tar sands. Each phase requires a different skillset based on the changing nature of the exploration required.
There remain a number of very successful junior companies that continue to explore for conventional plays, but this niche is becoming more specialized and will represent a smaller and smaller fraction of the future activity.
A recent survey conducted by the Canadian Federation of Earth Sciences indicates that 60% of the work conducted by geoscientists in the oil and gas business is now on unconventional plays, and only 10% of the work is related to frontier or international exploration. While the image of the explorationist as a risk-taking maverick is a romantic one, the reality is that the petroleum industry in Western Canada is now looking for a different type of geoscientist. Recent major “discoveries” in the WCSB include Abbey-Shackleton, the Deep Basin Montney, Horseshoe Canyon Coal-Bed methane, and the Bakken in the Williston Basin.
None of these discoveries were the result of a traditional, seismically defined wildcat well. In this new phase of exploration in the WCSB, the boundaries between development and exploration can become less defined and the most important “exploration” phase might be a production pilot.
This presentation will show the magnitude of decreased exploration in the WCSB; why large companies are conducting less conventional exploration in Western Canada; and how large-scale development of, and exploration for, low-quality but ubiquitous hydrocarbon reservoirs makes economic sense. I will also discuss the changing requirements for geoscientists to be successful in the WCSB, including a focus on reservoir characterization, geomechanics, identifying and understanding hydrocarbon sweet spots, and working
closely with other disciplines to optimize drilling and completion programs. This may not seem romantic, but it is essential to the future of this basin.
BIOGRAPHY
Ian Young is currently Vice President, Conventional Exploration and Joint Ventures, for the Canadian Foothills Region of EnCana Corporation. He graduated with a B.Sc. (Honours) in Geology from the University of Calgary in 1985.
He was employed by PanCanadian Petroleum immediately after graduation and was there until December of 1990, when he joined Opinac Exploration. He remained with Opinac until he rejoined PanCanadian in 1993, rising to the level of Exploration Manager. At the merger with AEC in 2002, Young was named Vice-President of the Rangeland Business Unit and was responsible for all cross-functional aspects of EnCana’s business in southern Alberta and Saskatchewan.
In 2006, Young was appointed for a two-year term as President of the Canadian Geoscience Council, which became the Canadian Federation of Earth Sciences (CFES) later that year. CFES is the umbrella group representing Earth Science organizations in Canada; the CSPG, CSEG, and CWLS are all member organizations of CFES.
Young has received diplomas and certificates in business administration from the University of Calgary (1989) and in Canadian Securities from the Canadian Securities Institute (1993). Young was selected as PanCanadian’s representative for the Governor General’s Canadian Studies 2000 Conference (now the Governor General’s Leadership Conference). Young is a member of the CSPG, CSEG, PDAC, AAPG, and APEGGA.
R ESERVOIR E NGINEERING FOR GEOLOGISTS
Part 8b – Monte Carlo Simulation/Risk Assessment
| by: Ray Mireault P. Eng. and Lisa Dean P. Geol., Fekete Associates Inc.
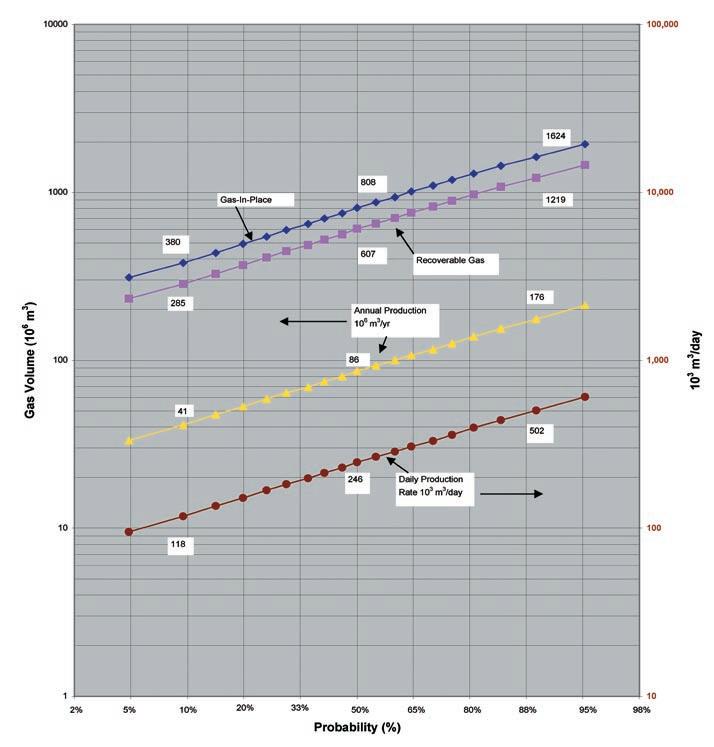
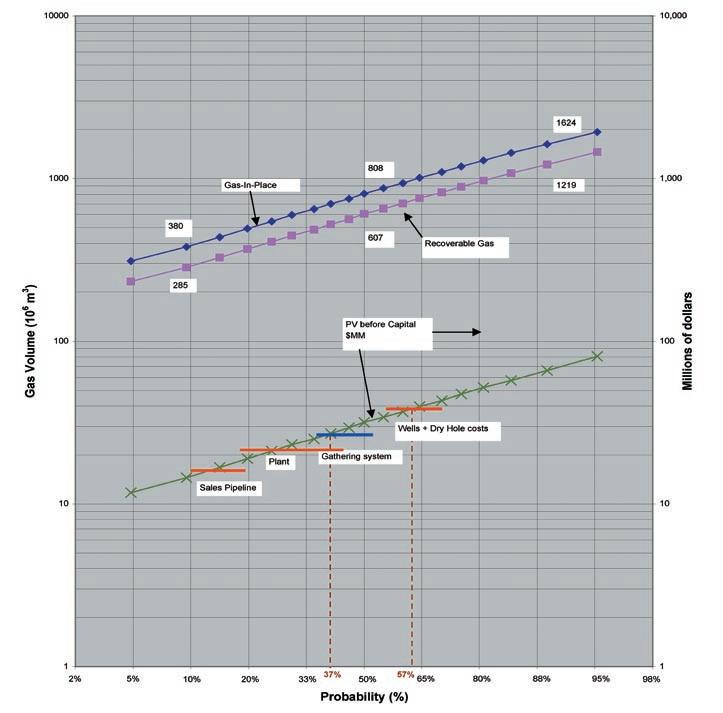
In the introductory article (part 8a), recoverable gas from Geologist A’s development prospect was estimated to be between 285 and 1,219 106m3 of gas.
What is this gas worth? The first factor to consider is the time value of production. The following chart presents the present day value of $100 of future year’s production at a 12% discount rate. Year 1
While $100 received today is worth $100, next year’s production is only worth 88% of today’s value. In year five it is only worth 52.77%; in year ten, 27.85% and in year 20, 7.76%. Clearly, we would like to produce the gas as quickly as possible to maximize its value but there is a limit. Each incremental increase in production rate requires more wells and larger, more costly facilities so that eventually the incremental value of further acceleration cannot offset the increased capital requirement.
What should we assume for a depletion rate? In Fekete’s experience, a seven-year rate-of-take provides a starting point for a production profile with good economic value. Note that the calculation provides an estimate of the annual produced volume during the initial one-to-three years of production. Since well productivity declines over time, it will take between 10 and 15 years to produce the prospect to depletion but about half the gas will be recovered during the initial five years.
Dividing Geologist A’s recoverable gas range by seven yields an initial annual production volume of between 41 and 176
10 6 m3 /yr (Figure 1). A daily production rate of between 118 and 502 10 3m3 /day (also Figure 1) was obtained by dividing the annual volume range by 350 producing days per year.
With an estimated daily rate and knowledge of the gas composition, the type and size of the central facilities can be determined. Since the gas contains mostly methane and ethane with no H 2 S and a low concentration of other nonhydrocarbon gases, only dehydration and compression will be required to treat the raw gas to sales gas specifications. If the design capacity of the facilities is set at 236 10 3m3 /day of raw gas, a plant with a (typical) 2:1 turndown ratio will be able to operate down to about 118 103m3 /day.
By inspection of Figure 1, 118 103m3 /day corresponds to the 10th percentile of the
daily production rate curve and 236 103m3 / day is about the 47th percentile. The plant is the correct size for the lower 37% of the range and thus capital and operating costs for the central facilities can be estimated. If development drilling ultimately proves that larger facilities are required, increased gas revenues will more than offset the incremental cost of larger facilities.
Geologist A’s prospect also requires a 70 km sales gas pipeline to connect to the nearest sales point. The central facility design rate can similarly be used to estimate the size and associated capital and operating costs of the sales gas pipeline. Accounting for processing shrinkage and fuel gas consumption, the 236 10 3m3 /day raw gas production rate equates to 217 10 3m3 /day of sales gas.
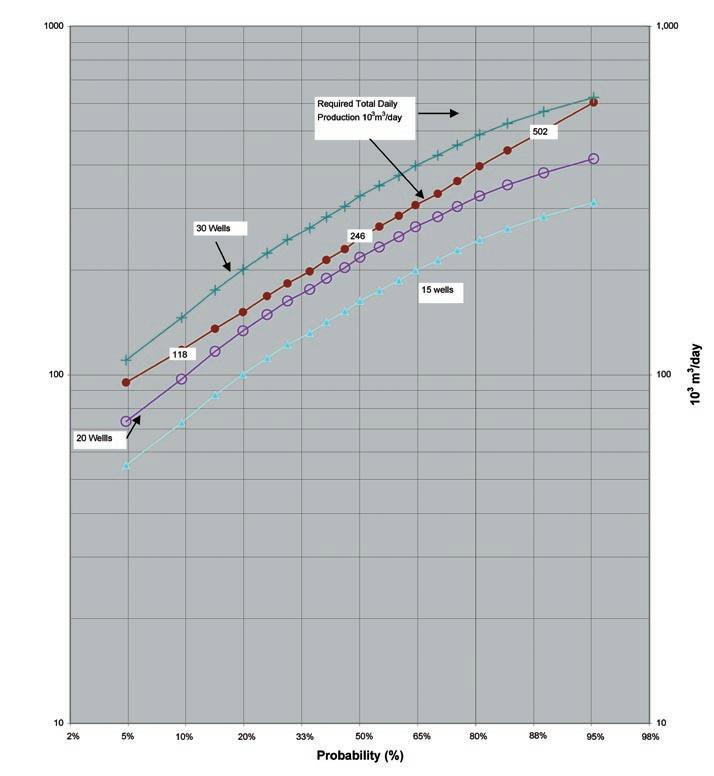
The next issue is the number of wells
Figure 1. Probability Chart, Gas Development Prospect.
required to produce at the desired rate. From the available test information, a well’s 1st year average production rate, based on the year’s production volume, could range from 3 to 21 10 3m3 /day but most likely will be about 8.5 10 3m3 /day. Multiplying the range for an individual well by the number of wells yields deliverability curves for the selected numbers of wells. From inspection of Figure 2, about 22 wells will most likely be required to provide the required deliverability for the prospect but as few as 15 or as many as 30 wells may be needed.
Knowing the number of wells, a scoping level layout of the well locations and the production gathering system can be undertaken. The scoping plan addresses issues such as the timing and sequencing of well drilling, drilling and completion design, surface access, the required wellsite facilities, and wellsite layouts. The level of effort expended is just sufficient to develop three-point estimates for the capital and operating costs of system components.
Contractual terms are obtained from the
licence/lease agreement while a price forecast(s) for the production period may be obtained from a variety of sources. At this point, estimate ranges have been developed for all the inputs necessary to evaluate the economics of the prospect. The general calculation sequence is:
• Calculate the net cash flow for each year’s production, NCF=(Sales Volume*Sales Price) - RoyaltiesOperating Costs - Taxes - Capital
• Discount each year’s net cash flow to
its present day value
• Sum each year’s discounted value to arrive at the prospect net present value
NPV = {Yearly NCF*Yearly Discount Factor} (See table 1.)
The calculations are amenable to spreadsheet analysis (Table 1) and Monte Carlo simulation. Since no two prospects are exactly alike, the calculations and their presentation can and should be modified to fit the details of each particular situation.
Although the final goal of Monte Carlo is to generate the expected NPV range for Geologist A’s prospect, Fekete has found it useful to calculate some intermediate values as follows:
• Calculate the cash flow for each year’s production before capital investment, CF=(Sales Volume*Sales Price)Royalties - Operating Costs - Taxes
• Discount each year’s cash flow to its present day value (PV)
• Sum each year’s discounted value to arrive at the prospect present day value PVCF = {Yearly CF*Yearly Discount Factor}
• Categorize each year’s capital investment and discount it to its present day value
• Calculate the net present value NPV = PVCF -PVcapital
The mathematical manipulation generates the same NPV range for a prospect. But additionally, the present day value of a unit of production can be estimated by dividing the prospect’s present day value before capital (highlighted in blue) by the projected total gas sales volume (in pink).
In Fekete’s experience, the uncertainty
(Continued on page 18...)
Figure 2. Probability Chart, Gas Development Prospect Number of Wells Required.
CSPG Education Continuing
2nd Annual Education Week
October 27 - October 31, 2008
www.cspg.org/education/education-week.cfm
Registration Opens July 2, 2008
Shale Gas Critical Fundamentals, Techniques, and Tools for Exploration Analysis
Instructor: Dr. Basim Faraj, Unconventional Gas Specialist, Talisman Energy
Date: 1-day course the week of October 27-31, 2008
Description: This one-day course will introduce the fundamental differences between conventional hybrid and shale gas plays. Source and reservoir rock attributes of shale gas plays will be discussed as well as GIP calculations, water, oil and gas saturations, essential laboratory analysis, and optimum geochemical and mineralogical parameters. Slickwater completion lessons learned from the US will be detailed. Canadian plays will be highlighted and discussed.
Architecture of Fluvial Reservoirs
Instructor: Andrew Miall, Professor of Geology, University of Toronto
Date: October 27-28, 2008
Description: The focus of this two-day lecture course will be on the reservoir architecture and sequence stratigraphy of fluvial systems and will contain descriptions of fundamental basinal controls on fluvial systems. Information and ideas presented in the course will contribute to the development of fluvial sandstone production and exploration models.
Practical Sequence Stratigraphy: Concepts and Applications
Instructor: Ashton Embry, Geological Survey of Canada
Date: 2-day course the week of October 27-31, 2008
Description: This two-day course presents the concepts and practical applications of sequence stratigraphy for petroleum exploration. Workshop exercises will emphasize the recognition and correlation of sequence stratigraphic surfaces on well log cross-sections. Following the course, participants will have a clear understanding of the use of sequence stratigraphy for predicting facies types and geometries away from control points.
Stratigraphic Setting of Lower and Middle Triassic Strata
Instructor: Dr. James Dixon, Geological Survey of Canada
Date: ½-day course October 31, 2008 (Can sign-up for either the Morning or Afternoon)
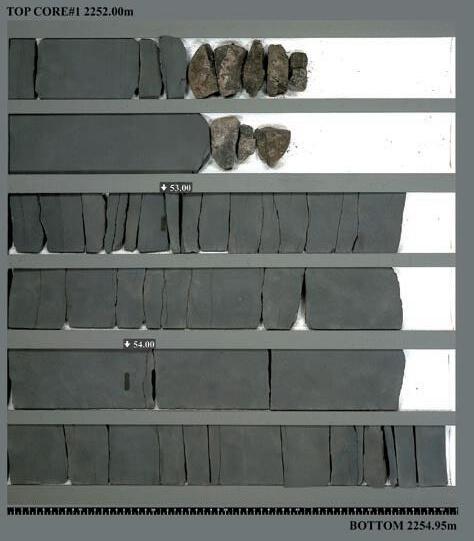
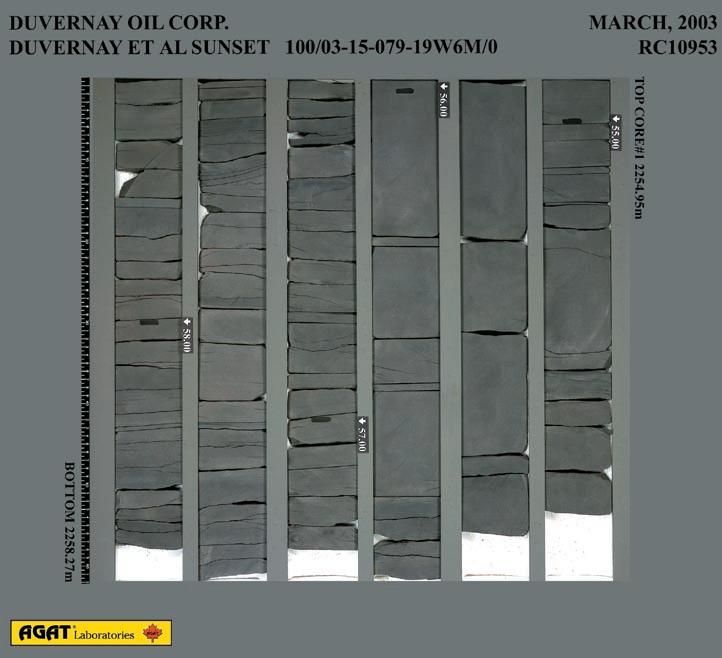
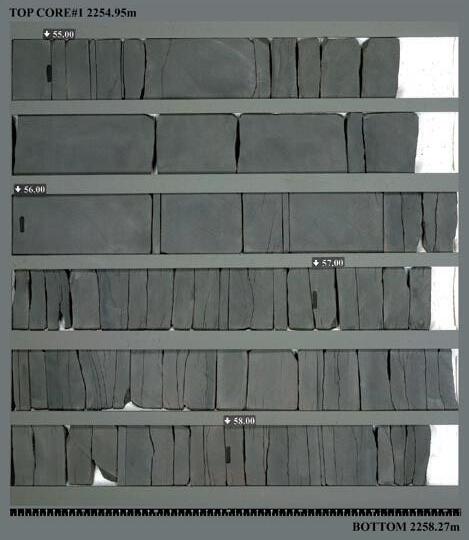
Description: The objective of this half-day course is to help explorationists understand the regional stratigraphic setting of Triassic rocks and how this can be used in a more local exploration program. The course consists of two lectures, some correlation exercises, and an examination of several cores that illustrate various facies types and/or significant stratigraphic surfaces.
Concepts, Models, and Case Studies of Dolomitization with Applications to Hydrocarbon Exploration and Development
Instructors: Dr. Hans Machel, Professor, Dept. of Earth and Atmospheric Sciences, University of Alberta and Dr. Jay Gregg, Professor and Head of Boone Pickens School of Geology, Oklahoma State University
Date: 2-day course the week of October 27-31, 2008
Description: This course summarizes the major advances and current controversies in dolomite research. It begins with a brief review of the chemical (thermodynamic and kinetic) conditions that favor dolomitization, including mass balance considerations for the generation of massive dolostones. Classifications for dolomite textures and pore spaces in dolostones are presented, which serve as a basis for a discussion of the porosity evolution during or as a result of dolomitization.
Sequence Stratigraphy: A Practical Understanding of Basinal Controls in Mapping and Exploration
Instructor: Andrew Miall, Professor of Geology, University of Toronto
Date: October 29-30, 2008
Description: A practical course designed to assist the petroleum geologist in the identification of different types of sequence, based on generating mechanisms. The sequence architecture in a given basin may reflect the action of several simultaneous processes interacting locally to globally over a wide range of time scales.
Basic Core Logging with Integrated Ichnological Techniques
Instructor: Dr. Kerrie Bann, Ichnofacies Analysis Inc.
Volunteer Instructor: Dr. Stuart Tye
Date: 2-day course the week of October 27-31, 2008
Description: This short course has been designed to teach the basics of logging core clastic intervals, with the inclusion of fundamental introductory ichnological techniques. Identification of facies through the integration of sedimentology and ichnology is crucial in building better stratigraphic and palaeogeographic models of reservoirs.
Petroleum Exploration in Fold and Thrust Belts
Instructor: Peter Jones, D.Sc., F. G. S., FGSA, P. Geol.
Date: 3-day course the week of October 27-31, 2008
Description: This 3-day course is designed to develop the skills needed to create new plays and prospects from old and new data worldwide. These techniques include the ability to visualize in three dimensions and to examine traditional and current concepts and styles of interpretation.
Workshop on Dipmeter Interpretation in Fold and Thrust Belts
Instructor: Andrew C. Newson, B.Sc., P. Geol., Moose Oils Ltd.
Date: October 27-29, 2008
Description: This exciting workshop will allow participants to develop a practical working knowledge of the techniques used to develop a detailed structural model around vertical or horizontal wells. The software allows an interactive approach to the interpretation of the digital output from a dipmeter and image log interpretation. The computers and software for this course will be provided.
Sequence Stratigraphy Principles and Applications
Instructor: Dr . Octavian Catuneanu, Professor, Dept. of Earth and Atmospheric Sciences, University of Alberta
Date: 3-day course the week of October 27-31, 2008
Description: This workshop presents the concepts and practical applications of sequence stratigraphy for petroleum exploration and production. All concepts are illustrated with field examples of seismic, well-log, core, and outcrop data. In-class exercises emphasize the recognition of sequence stratigraphy surfaces and systems tracts on well-log cross-sections, seismic lines, and outcrop profiles.
Time and Meeting Management - How to Get Control of Your Day, Life, and Career
Instructor: Bruce Lee, President and Founder of Encore Seven Inc.
Date: ½-day course the week of October 27-31, 2008
Description: This fast-paced session combines the best of time management strategies and the most critical templates to measure, track, and improve your productivity along with the best attributes of coaching and leadership that focus on creating results. The bottom line - moving careers ahead by doing the right things at the right time.
Self Coaching Skills to Solve the Employee Training, Motivation, and Retention Challenge
Instructor: Bruce Lee, President and Founder of Encore Seven, Inc.
Date: ½-day course the week of October 27-31, 2008
Description: This content-loaded session will show you how to turn good employees into great employees - how to fast-track careers from a leadership perspective. This presents all the soft skills of inspired personal development and leadership along with what truly motivates people. Includes self-tests to check your interpersonal, leadership, and coaching skills.
An Integrated Approach to the Analysis of Fractured Reservoirs
Instructor: Paul MacKay, Geoconsultant and Malcolm Lamb, Schlumberger
Date: 2.5-day course the week of October 27-31, 2008
Description: This course will take an integrated, multi-discipline approach to recognizing, and designing development strategies for fractured reservoirs.
For a full course description & registration, see www.cspg.org/education/education-week.cfm
For additional information, contact Tina Donkers at or Travis Hobbs at
tinadave@telusplanet.net Travis.Hobbs@EnCana.com
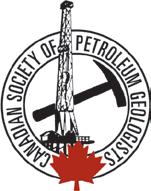
range on the present day value of a unit of production is relatively small compared to the uncertainty range of the input parameters. The reason is because increased sales revenue, due to higher production volumes and/or gas prices tends to be offset by increased royalties, operating costs, and taxes. Conversely, lower revenue scenarios have reduced royalties, operating costs, and taxes.
At the time that Geologist A’s prospect was evaluated, its unit of production PV was estimated to be between $35.50 and $71 per 10 3m3 ($1 to $2/Mcf). u sing Monte Carlo simulation to multiply the unit PV by the recoverable gas estimate yields the present day value of the prospect before capital investment. As shown in Figure 3, there is an 80% probability (P10 to P90 values) that Geologist A’s prospect has a present day value before capital of between $12 and $66 Million.
While the PV before investment range looks promising, it must be compared with the required capital investment to know if the prospect has economic potential. The present value capital costs for the prospect were estimated for each category as follows:
Monte Carlo simulation can be used to successively add the cost range for each category and estimate the total capital cost range for the project. Cost estimates for well costs and wellsite facilities that were provided on a per well basis were added together and then multiplied by the distribution for the expected number of development wells to determine the total cost range for the development well category.
The development well category should also include the cost of the dry holes that will be encountered. The number of dry holes can be estimated by dividing the number of wells required by the drilling success rate to yield the total number of drilling attempts that must be undertaken. Multiplying by the chance of
a dry hole (between 15 and 30%) yields the number of dry holes that are likely to be encountered. Multiplying by the cost per dry hole yields an estimated range of values for total dry hole cost. The updated capital cost table follows:
As can be observed, the sales pipeline and the wells are the two largest capital cost categories. Monte Carlo simulation is once more used to add the separate cost distributions and estimate the range of total costs for the project. In Fekete’s experience it is useful to track the effect of each successive cost category on the total cost profile as follows:
From Figure 4 (pg 19), the P10 (blue line) and P90 (upper red line) values of the capital cost range intersect the PV before capital investment curve at about the 43rd and 63rd percentiles. Thus the prospect has between a 37 and 57% chance of achieving a positive NPV. The graph also illustrates that even at the upper end of the reserve range we cannot do any better than double the value of the capital invested and that the sales pipeline and well costs have the greatest impact on financial performance.
Should a prospect with these financial characteristics be developed? One company may choose to develop the prospect because this is the best investment opportunity available at the time. Another may determine that its time has not yet come and choose to wait until the price of gas rises sufficiently and/or other developments in the area reduce the distance and cost of the sales pipeline. Either way, a consistent Monte
Figure 3. Probability Chart, Gas Development Prospect Present Value (PV).
Carlo evaluation methodology helps management make informed decisions.
Can Monte Carlo simulation also evaluate Geologist B’s exploration prospect? We’ll show you how in the next issue of the Reservoir.
R EFERENCES
Mackay, Virginia (ed.). 1994. Determination of Oil and Gas Reserves. Petroleum Society Monograph No. 1, p. 106-119.
Otis, Robert M. and Schneidermann, Nahum 1997. A Process for Evaluating Exploration Prospects, AAPG Bulletin, v. 81 p. 10871109.
Pallisade @ Risk Guide. Version 4.5 November, 2005
This article was contributed by Fekete Associates, Inc. For more information, contact Lisa Dean at Fekete Associates, Inc.
Figure 4. Probability Chart, Gas Development Prospect PV vs. Capital.
DEEP-wATER CHANNEL -L EVEE COMPLEX OF THE N EOPROTEROz OIC ISAAC FORMATION, wINDERMERE SUPERGROUP, C ARIBOO MOUNTAINS, w ESTERN C ANADA :
Part 2. Architectural Analysis of Overbank Deposits
| by Zishann Khan and R.W.C. Arnott
Overbank deposits are volumetrically the most significant facies type associated with many modern and ancient deep-water channel-levee systems and have also recently proven to be significant hydrocarbon reservoirs (e.g., Tohoe and Rom/Powell Fields in the Gulf of Mexico, Clemenceau et al., 2000; Kendrick, 2000). Consequently, detailed studies of overbank strata are essential in order to better understand their lithological make-up and stratal architecture in mud-rich and mixed sand-mud turbidite fan systems. One of the most useful techniques available for gathering these data, especially their small-scale sedimentological attributes, is through outcrop studies. Nevertheless, there is currently a lack of such studies in the literature. The most likely reason for this is that in most places fine-grained overbank deposits are typically poorly exposed in the ancient rock record due to surface weathering and vegetation cover. Conversely, periglacial exposures of Isaac Channel 3 (IC3) of the Windermere turbidite system (Castle Creek study area) provides an excellent example of a deep-water, sinuous channel-levee system wherein levee strata are well exposed along both channel margins making it possible to study these deposits in immense detail.
In the June issue of the Reservoir, details of the channel-fill portion of IC3 were given (Navarro and Arnott, 2008). The objective of this paper is to discuss the overbank facies and stratal architecture of IC3 and describe the processes responsible for their deposition. Although both outer- and innerbend levees are well preserved, the lateral extent and stratigraphic control of the outer-bend is far better and therefore will be the primary focus of this paper; however, a brief description of the inner-bend levee will be included (Figure 1 of Navarro and Arnott, 2008).
OUTER BEND OVERBANK DEPOSITS
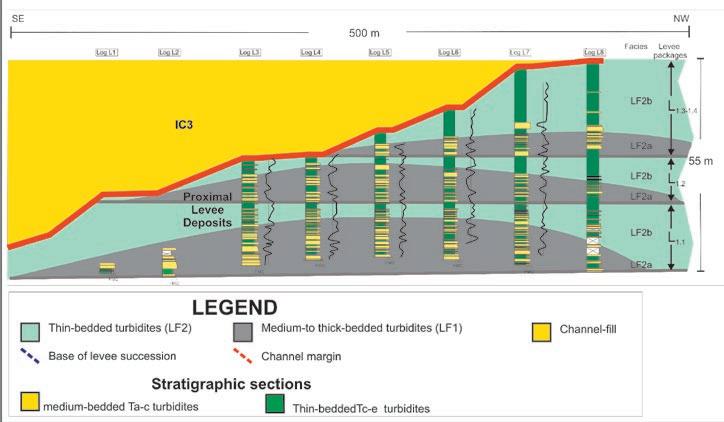
Figure 1 in Part 1 (ibid.) shows the overall architecture of IC3. The channel-fill portion of IC3 is 80 m thick and narrows upwards from 1.5 km to 0.4 km wide. Strata cropping out along the outer-bend channel margin
are divided into proximal and distal levee deposits based on facies characteristics and proximity to the channel-fill. Proximal levee strata immediately adjacent to the channel margin are exposed continuously over 600 m laterally, beyond which, strata are covered for 200 m by a glacial moraine. The succession ranges from 0 m, where it is truncated by IC3, and thereafter thickens to 70 m at the moraine. On the opposite side of the moraine, distal levee strata are exposed for up to 300 m laterally before being covered by a glacier that is 1 km wide along that particular stratigraphic horizon. unlike the proximal levee, stratal thickness in the distal levee varies little laterally and is consistently about 80 m thick.
I NCIPIENT OVERBANK SPLAY DEPOSITS
The basal 2-3 m (L0 in Figure 1 of part 1) of the outer bend levee complex consists mostly of medium- to very coarse-grained
sandstone ranging from 0.5-1.5 m thick. This depositional element is truncated along the channel margin and extends laterally away from the channel for up to 2 km. L0 is interpreted to be an incipient overbank splay deposit that was deposited during the earliest stages of channel development when channel confinement was limited. These conditions enabled flows to spill uninhibitedly into the adjacent areas and create a network of splay deposits similar to the sand distributive complex described by Beobouef (2004) in the Cerro Terro Formation.
OUTER-BEND LEVEE – PROXIMALTO -DISTAL T RANSECT
Immediately adjacent to the outer-bend channel margin, L0 is abruptly overlain by proximal levee deposits that comprise four distinct packages (L1.1-L1.4 , Figure 1). units L1.1-L1.3 range from 10-15 m thick and share common upward and lateral
Figure 1. Correlation panel showing the detailed architecture of proximal levee deposits. Proximal levee deposits comprise four distinct packages that are divided into a sand-rich, medium-bedded turbidite interbedded with thinly bedded turbidite lower part (facies LF2a and LF2b) and a more siltstone-rich, thin-bedded upper part (facies LF2b). Note the “semielliptical” geometry associated with the lower parts of levee packages. The sandier lowermost parts of these packages are interpreted to have been deposited during periods of low channel confinement enabling the lower, more concentrated portion of through channel flows to overspill. Alternatively, the finer-grained uppermost parts of the levee packages are interpreted to have been deposited by the upper, more dilute portion of through-channel flows during periods of increased channel confinement. These packages migrate in the same direction as the adjacent channel, suggesting they are associated with the progressive shifting of the channel axis over time. Proximal levee strata (specifically LF2a strata) commonly thicken then thin laterally. After appreciable thinning, beds persist as LF2b strata. This lateral trend is reflected in the rapid decrease in sand-percentage away from the channel margin.
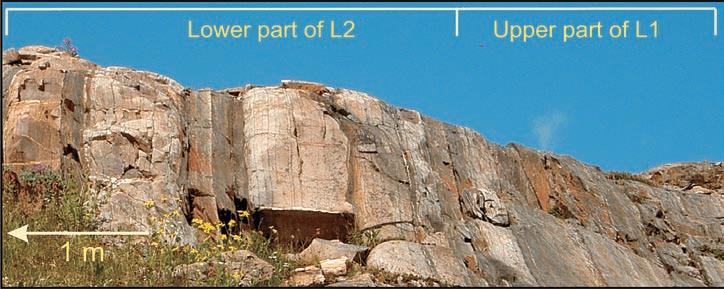
Figure 2. Proximal levee packages showing distinct upper and lower divisions. The lower part (in photo corresponds to the lowermost portion of the second levee unit L1.2 ) consists of medium- to thick-bedded (up to 1 m), fine- to medium-grained sandstone turbidites (Ta-e Bouma sequences). The uppermost part (in photo corresponds to the uppermost portion of the first levee unit L1.1 ) consists predominantly of thin-bedded (< 15 cm), very fine- to finegrained sandstone and siltstone Tcde turbidites.
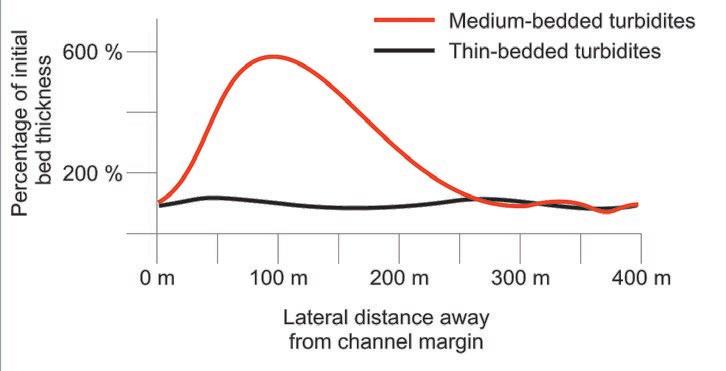
Figure 3. The lateral trends of beds in proximal levee measured from the outcrop shown in Figure 1 of part 1(Navarro and Arnott, 2008). Medium-bedded turbidites thicken initially and after reaching a maximum, thin rapidly laterally. Thin-bedded turbidites show negligible lateral thinning trends.
trends. The lower portion of each package is composed of medium- to thick-bedded, fine- to medium-grained sandstone Tbc and Tc turbidites (facies LFa) interbedded with less common thin-bedded, very fine- to fine-grained sandstone and siltstone Tcde turbidites (facies LFb). The upper portion of levee units L1.1-L1.3 on the other hand, range from 3-7 m thick and consists almost exclusively of fine-grained strata (facies LFb). Figure 2 shows the upper and lower portions of levee packages L1.1 and L1.2 , respectively. The uppermost levee unit L1.4 is 15 m thick and is composed entirely of facies LF2b and is differentiated from underlying units by the absence of a sandrich basal unit.
Beds occurring in the proximal levee (both LFa and LFb) are laterally continuous with the exception of some rare, thick (>1 m) Tab and Ta beds that pinch-out in less than 40 m from the channel margin. Although lateral pinching-out of beds is rare, lateral thinning is common to all beds and the rate of lateral thinning is related to bed thickness. Specifically, very fine- to
fine-grained sandstone turbidites (facies LFb) show negligible lateral thinning over 100’s of meters. Conversely, medium to thick Tbc and Tc turbidites (facies LFa) thicken initially over lengths of about 100 m and then thin rapidly over lengths less than 200 m, after which they persist as thin-bedded (<15 cm), very fine- to fine-grained sandstone turbidites (facies LFb) with negligible lateral thinning. This results in an overall “semi-elliptical” crosssectional levee package geometry. Figure 1 schematically represents the distinct lateral thinning trends associated with the lower portions of the levee packages whereas Figure 3 graphically illustrates the relationship that exists between the rate of lateral thinning and bed thickness. In addition, lowermost parts of packages L1.1 to L1.3 are progressively laterally offset toward the northwest, a trend that is especially evident when comparing strata in the lower part of L1.3 with those in the underlying L1.2 package. This suggests a strong association with the lateral and upward migration of the channel system (Navarro and Arnott, 2008).
As a consequence of the lateral fining and thinning trends of proximal levee strata, LFb is the most common facies observed in the distal levee. These lateral changes also control N:G ratios where sand percentage in the most proximal levee regions is as high as 70% but over a distance of 500 m decreases to less than 40% in the distal levee.
A common facies association observed in the distal levee are 2–4 m thick units consisting of amalgamated, normally graded to planar and cross-stratified, mediumbedded, medium-grained sandstone turbidites (facies LFc, Figure 1 part 1, ibid.) encased by thinly bedded turbidites. These units extend at least 1 km laterally; however, individual beds within units are laterally discontinuous. As a result, these units comprise a complex arrangement of sandstone turbidites that commonly offlap and onlap one another, locally creating high N:G within the predominantly muddy distal levee. These units are interpreted to be areally restricted overbank splays that were formed by turbulent flows that overtopped the channel margin, expanded, and consequently deposited rapidly (Posamentier and Kolla, 2003).
DEPOSITIONAL PROCESS OF OUTERBEND DEPOSITS
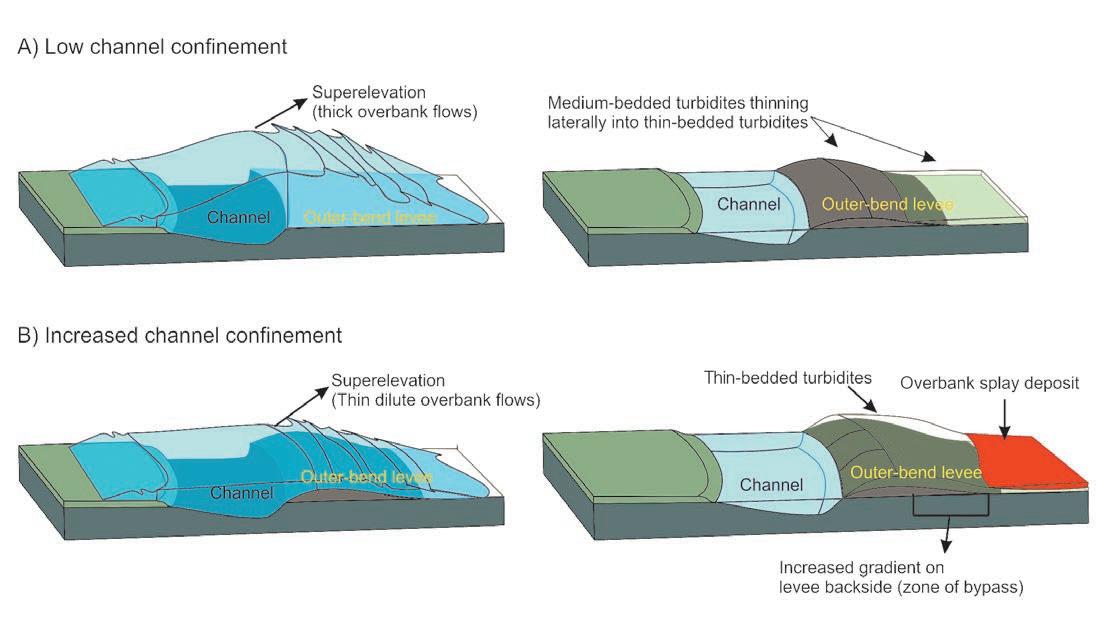
Facies LFa occurring in the lower part of proximal levee packages is interpreted to have been deposited by high- to intermediate-concentration turbidity flows that easily overbanked the weakly confined channel. Low channel confinement along with super-elevation of turbidity currents as they rounded the bend, aided in the overspill of the lower (intermediate- to high-density or concentration) part of highly stratified flows along the outer channel bend (Figure 4A, p. 23). Deposition of facies LFb in the lower parts of levee packages was similarly deposited under conditions of low channel confinement, however through-going channel flows were significantly more dilute and most probably less vertically stratified compared to those that deposited facies LFa sandstones. In contrast, deposition of LFb in the upper part of levee packages in the proximal levee settings were associated with an increase in channel confinement that enabled only the upper, more dilute part of flows to overspill (Figure 4B, p. 23). Lateral waning and thinning of flows resulted in a loss of competence and deposited facies LFb in more distal levee settings.
Overbank splay units occurring in the distal levee are believed to have been deposited as a consequence of high levee relief, which effectively created a significant levee backside
(Continued
slope. It is interpreted that high velocity, sand-rich turbidity currents that overspilled at times of high levee relief were able to overcome the high frictional conditions associated with the rapid thinning of the flows as they quickly became unconfined. As a result, flows accelerated down the backside of the proximal levee, essentially making the proximal levee area a zone of by-pass. A decrease in slope in more distal levee settings reduced flow velocity and competence, resulting in the deposition of splays (Figure 4B).
I NNER-BEND LEVEE
Deposits along the southeast levee of IC3 consist predominantly of very fine-grained sandstone and siltstone Tcde turbidites (facies LF2b). Strata in the lower 15 m of the inner-bend levee truncate against the channel margin. These strata also fine and thin upward from up to 25 cm near the base to less than 5 cm thick at the top. Furthermore, the thicker basal beds fine and thin away from the channel margin over a distance of less than 50 m, whereas the thinner beds, like those on the outerbend, show negligible lateral thinning or fining. Strata in the upper 40 m of the levee have a very different overall geometry to
those stratigraphically lower. Here thickbedded, amalgamated channel-fill deposits in the axial channel area grade laterally over 150 m into fine-grained, thin-bedded turbidites on the inner-bend levee. The physical continuity between channel-fill and levee strata indicates a rapid lateral facies change during discrete depositional events. This stratal continuity contrasts markedly conditions observed on the outer-bend levee. A brief discussion concerning the depositional processes associated with the inner bend-levee is included in Part 3 of this paper (next issue).
R EFERENCES:
Beaubouef, R .T. 2004. Deep-water leveedchannel complexes of the Cerro Toro Formation, Upper Cretaceous, southern Chile. AAPG Bulletin, v. 88, p. 1471-1500.
Clemenceau, G.R., Colbert, J., and Edens, D. 2000. Production results from levee-overbank turbidites sands at Ram/Powell Field, deepwater Gulf of Mexico, in P. Weimer, ed., Deep-water reservoirs of the world. Gulf Coast Section, SEPM 20th Annual Research Conference, p. 241-251.
Kendrick, J .W. 2000. Turbidite reservoir architecture in the Northern Gulf of Mexico
deepwater: insights from the development of Auger, Tahoe, and Ram/Powell Fields, in Weimer, P., Slatt, R.M., Coleman, J., Rosen, N.C., Nelson, H., Bouma, A.H., Styzen, M.J., and Lawrence, D.T., eds., Deep-Water Reservoirs of the World. Gulf Coast Society of the Society of Economic Paleontologists and Mineralogists Foundation, p. 450-468.
Navarro, L. and Arnott, R.W.C. 2008. Deep-water Channel-Levee Complex of the Neoproterozoic Isaac Formation, Windermere Supergroup, Cariboo Mountains, western Canada: Part 1. Architectural Analysis of Channel Deposits. Canadian Society of Petroleum Geologists Reservoir, Vol. 35, Issue 6, p. 29-32.
Posamentier, H.W. and Kolla, V. 2003. Seismic geomorphology and stratigraphy of depositional elements in deep-water settings. Journal of Sedimentary Research, v. 73, p. 367-388.
ACKNOw LEDGEMENTS
Our ongoing research of the WSG is funded by the industry members of the Windermere Consortium (Anadarko Petroleum, Canadian Natural Resources Ltd., Devon Petroleum Ltd., Husky Energy, Encana Corp., Nexen Inc., and Shell) and an NSERC Collaborative Research and Development Grant.
Figure 4. Relationship between channel confinement and levee deposition. A) Low channel confinement results in the overspilling of thicker and denser flows that in turn deposit medium-bedded turbidites (LFa) on the proximal outer-bend levee. B) Increased channel confinement enables only the uppermost dilute part of a channel flow to overspill. This results in thinner and less concentrated flows that in turn deposits thin-bedded turbidites (LFb). Increased levee aggradation results in an increase in the gradient of the levee backside. This area is zone of bypass for sandier flows (some rare sandy flows that are still able to overspill even during high channel confinement) that will ultimately deposit in the areas of decreased slope (distal levee).
Historical Development of the Discipline: The Last 20 Years (1988-2008)
| by Ashton Embry
In the last article in this series, I looked at the first 200 years (1788 to 1988) of the development of sequence stratigraphy as a useful stratigraphic discipline for correlation, mapping, and interpreting depositional history. By 1988 we had a revised definition of a sequence which was a stratigraphic unit bounded by unconformities or correlative conformities (Mitchum et al, 1977). Because this definition was based mainly on observations from seismic data, there was considerable confusion as to what specific types of stratigraphic surfaces constituted a sequence boundary, especially the correlative conformities. The veil was lifted in 1988.
T HE E XXON SE qUENCE MODEL
In 1988, the first, comprehensive sequence stratigraphic model was described in a series of papers authored by researchers from Exxon Corporation. These papers appeared in SEPM Special Publication 42Sea level Changes: An Integrated Approach (Wilgus et al., 1988) and they presented Exxon’s methods, models, classification systems, and terminology for sequence stratigraphy. These papers also made clear how Exxon scientists delineated and correlated a sequence boundary from basin edge to basin centre. The Exxon work was based on a combination of theoretical modeling and empirical observations from seismic records, well-log cross-sections, and outcrop data.
The paper by Mac Jervey (Jervey, 1988) presented a quantitative, theoretical model for sequence development and it greatly expanded the concepts on the interaction of sedimentation and base level change which had been first explored by Barrell (1917) and Wheeler (1958). Jervey’s model used sinusoidal sea level change, subsidence which increased basinward, and a constant sediment supply as its input parameters. The model predicted that, during a cycle of base level rise and fall (see Jervey, 1988, fig. 9), three different sedimentary units would be sequentially developed and that these would constitute a sequence. These were an initial, progradational (regressive) unit deposited during initial slow base level rise, a middle, retrogradational (transgressive) unit deposited during fast base level rise
and an upper, progradational (regressive) unit deposited as base level rise slowed and during the subsequent interval of base level fall.
DEPOSITIONAL SE qUENCE B OUNDARIES
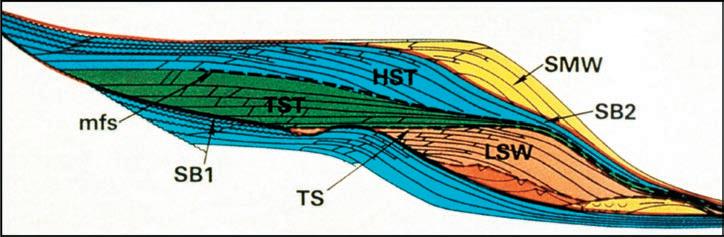
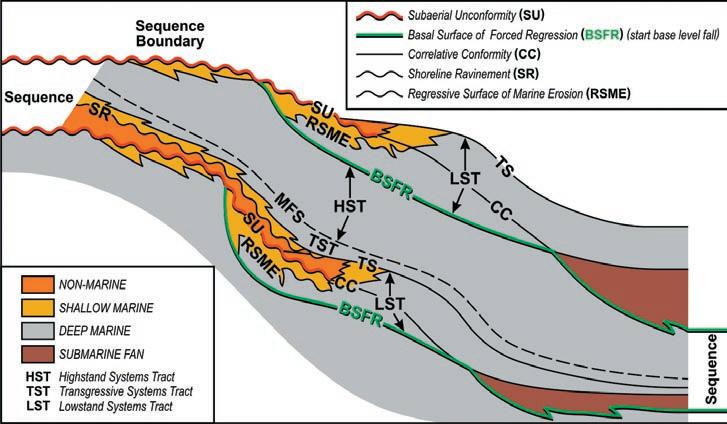
On the basis of Jervey’s concepts and the stratigraphic geometries observed on regional seismic profiles, Exxon scientists (Baum and Vail, 1988; Posamentier et al., 1988; Posamentier and Vail, 1988) developed a theoretical sequence stratigraphic model for a shelf/slope/basin depositional setting (Figure 1). In this model, a depositional sequence is bound by subaerial unconformities on the basin margin and by correlative surfaces farther basinward.
Two types of depositional sequence boundaries, originally defined by Vail and Todd (1981), were included in the Exxon model. A Type 1 sequence boundary encompassed a major subaerial unconformity which extended from the basin edge, past the shelf margin and onto the upper slope. Basinward, the boundary was called a correlative conformity (see Baum and Vail, 1988, fig. 1) and was extended along the base of the turbidite facies which occupied the basin floor and onlapped the lower slope (Figure 1).
A Type 2 sequence boundary comprised
a relatively minor subaerial unconformity which did not reach the shelf edge. It was confined mainly to the proximal portion of the shelf often within nonmarine strata (Posamentier and Vail, 1988, fig. 18). The basinward extension of the Type 2 sequence boundary (correlative conformity) was along a chronostratigraphic surface equal to the time of start base level rise (time of maximum rate of eustatic fall) (Baum and Vail, 1988, fig. 1; Van Wagoner et al., 1988, fig. 4; Posamentier et al., 1988, fig 6).
S YSTEMS T RACTS
The depositional sequence was divided into three component units which were termed systems tracts. These approximated the three units that Jervey (1988) had deduced as being part of a sequence that develops during a sinusoidal, base level rise/fall cycle. The lower unit was called the lowstand systems tract (LST) and it consisted of a basal unit of turbidites overlain by a progradational wedge which onlapped the upper slope portion of the sequence bounding unconformity. The LST was bound by the sequence boundary below and the transgressive surface above (Figure 1). The transgressive surface, as defined by the Exxon workers, marks the change from progradational sedimentation below to retrogradational sedimentation above. The LST was interpreted to have developed during most of base level fall and the early part of rise.
Figure 1. The Exxon depositional sequence model of 1988. The lower boundary is a Type 1 sequence boundary (SB1) and it coincides with a subaerial unconformity on the shelf and upper slope and with the base of submarine fan deposits in the basin. The upper boundary is a Type 2 boundary (SB2) and it coincides with a subaerial unconformity on the shelf and with a time surface (clinoform) equivalent to the start base level rise farther basinward.
The transgressive surface (TS) and maximum flooding surface (mfs) occur within the sequence and allow it to be subdivided into three systems tracts – lowstand (LSW), transgressive (TST) and highstand (HST). The systems tract which directly overlies a Type 2 sequence boundary is called a shelf margin systems tract (SMW). Modified from Baum and Vail (1988, fig.1).
The middle unit was called the transgressive systems tract (TST) and it consisted of retrogradational sediments that overstepped the LST and onlapped the shelfal portion of the subaerial unconformity. The TST was bound by the transgressive surface below and the maximum flooding surface (MFS) above (Figure 1). The MFS was defined as the surface of sequence stratigraphy that marks the change from retrogradational sedimentation below to progradational sedimentation above. The transgressive systems tract was interpreted to have developed during high rates of base level rise.
The upper systems tract was termed the highstand systems tract (HST) and it consisted of progradational sediments which were capped by a subaerial unconformity (sequence boundary on the basin flanks and by the correlative surfaces farther basinward (Figure 1). The HST was interpreted to have developed during the waning stage of base level rise and during the early portion of base level fall. The wedge of strata above the Type 2 sequence boundary and below the next transgressive surface was called the shelf margin systems tract (SMW) (Figure 1).
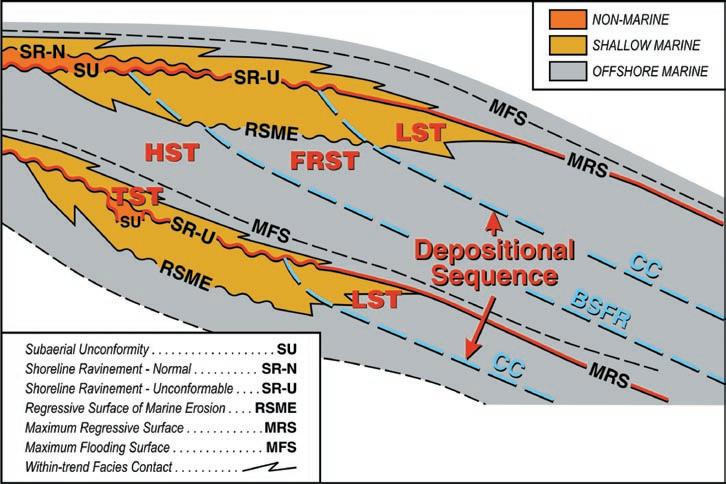
Figure 2. This schematic cross-section illustrates the boundaries of both the genetic stratigraphic sequence (GSS) of Galloway (1989) (MFS boundary) and the T-R sequence of Embry (1993) (composite SU/SR-U/MRS boundary). Both of these sequence types are based solely on empirical observations and this contrasts with the 1988 Exxon depositional sequence model which is substantially derived from theoretical deduction. Embry (1993) subdivided a T-R sequence into a transgressive systems tract (TST) and a regressive systems tract (RST) on the basis of the enclosed MFS. These systems tracts can be readily applied to a GSS.
Van Wagoner et al., (1988) applied the same terminology to siliciclastic sediments deposited in a ramp setting (see their fig. 3). In this case the sequence boundary was
extended basinward from the termination of the unconformity along the facies contact between shallow water sandstones above
(Continued on page 26...)
ConocoPhillips is pleased to announce the recipients of the ConocoPhillips Glen Ruby Memorial Scholarships in Geoscience for 2007.
Mark Dahl
Ross Kukulski
Cr ystle Zarich
ConocoPhillips would like to wish all applicants the best of luck in their studies and future endeavors.
Figure 3. The depositional sequence and component systems tracts of Hunt and Tucker (1992). Hunt and Tucker (1992) advocated for the utilization of two time surfaces – the basal surface of forced regression (BSFR) (equals start base level fall) and the correlative conformity (CC) (equals start base level rise) for delineating sequence and systems tract boundaries. Their depositional sequence boundary is a composite of the subaerial unconformity on the basin flank and the correlative conformity time surface farther basinward. Note that the forced regressive systems tract (FRST), which was defined by Hunt and Tucker (1992), is bound by both time surfaces and represents all the strata deposited during base level fall. The other systems tracts are lowstand (LST), transgressive (TS) and highstand (HST).
(...Continued from page 25)
and marine shales below and then into the offshore shales. Van Wagoner et al., (1988) also defined a small-scale sequence stratigraphic unit termed a parasequence. It was defined as a relatively conformable succession of genetically related beds or bedsets bound by marine flooding surfaces. A marine flooding surface was defined as a surface which separates older from younger strata across which there is evidence of an abrupt deepening.
There can be no doubt that the Exxon sequence stratigraphic work was a very significant and important contribution to sedimentary geology because it transformed sedimentology from a static discipline which focused on facies models to a dynamic discipline in which facies developed in a framework of shifting base level. It also provided a comprehensive classification system for sequence stratigraphy and elucidated the linkage between changing base level and the development of specific surfaces of sequence stratigraphy and the units they enclosed. Thus it is not surprising the model was enthusiastically embraced by the industrial and academic sedimentary geology communities.
The Exxon sequence model, and accompanying methods and classification systems were the product of a combination of theoretical deduction and empirical observations. Most of the stratigraphic
surfaces employed in their work were material-based surfaces which were defined on the basis of physical criteria. However the model also included an abstract time surface equated with the start of base level rise. As will be discussed in future articles, the inclusion of a chronostratigraphic surface has caused some problems. Their 1988 sequence model has a few other inconsistencies and these also will be discussed in subsequent articles.
GENETIC S TRATIGRAPHIC SE qUENCE
The next contribution to sequence stratigraphic classification came with Galloway’s (1989) proposal that a sequence be bound by maximum flooding surfaces (“downlap surfaces”), the prominent stratigraphic surface at the top of the TST of Exxon (Figure 2). Such a sequence was a completely different stratigraphic entity from the depositional sequence of the Exxon model, although it did fit Mitchum et al.’s (1977) general definition of a sequence because the distal portion of a MFS is often an unconformity produced mainly by sediment starvation. The conformable, proximal portion of the MFS is a suitable correlative conformity of the sequence boundary. Galloway (1989) named a sequence bounded by MFSs a genetic stratigraphic sequence (GSS).
In contrast to the Exxon depositional
sequence, which was in part based on Jervey’s (1988) deductive model, Galloway’s genetic stratigraphic sequence was purely an empirical construct based on his extensive work on the Tertiary strata of the Gulf Coast and the observation that MFSs are usually the most readily recognizable sequence stratigraphic surfaces in marine successions.
R EVISION OF THE E XXON MODEL
Hunt and Tucker (1992) were the first authors to modify the original 1988 Exxon sequence model and they focused on the placement of the Type 1 depositional sequence boundary. In the Exxon model, strata deposited during base level fall were placed below the unconformable sequence boundary on the basin flanks and above the sequence boundary in more basinward localities. Hunt and Tucker (1992) correctly asserted that the depositional sequence boundary in the basin must lie on top, rather than below, the strata deposited during fall (i.e., the submarine fan turbidites) to ensure a single, through-going sequence boundary is delineated. Notably Jervey (1988, fig. 20), in his deductive model of sequence development, also put the turbidite facies below the sequence boundary rather than above it. In their modification of the Exxon model, Hunt and Tucker (1992) proposed that the basinward extension of the sequence boundary be along the time surface at the start of base level rise which they called the correlative conformity (CC) (Figure 3).
They also added a fourth systems tract in the uppermost portion of a sequence and called it the forced regression systems tract (FRST). Their FRST was bound above by the sequence boundary (S u on the flank, CC in the basin) and below by the newly defined, “basal surface of forced regression” (BSFR) which equated to a time surface equal to the time of start base level fall (Figure 3).
With such a definition, the FRST encompassed all the strata deposited during base level fall. The LST of Hunt and Tucker (1992) was restricted to the strata between the CC below and the transgressive surface above and represented the progradational strata deposited during the initial phase of slow base level rise which occurred in the Jervey model (Figure 3). Thus the LST of Hunt and Tucker (1992) was equivalent to only part of the LST of the Exxon Type 1 sequence but was entirely equivalent to the SMW of the Exxon Type 2 sequence.
(Continued on page 28...)
ROCK SHOP
Figure 4. The depositional sequence boundary of Posamentier and Allen (1999). This proposed sequence boundary consists of only part of the subaerial unconformity (SU) and is extended basinward along the basal surface of forced regression (the time surface at the start of base level fall). Note that a substantial portion of the subaerial unconformity lies within the sequence. The sequence is divided into the same three systems tracts as recognized for the 1988 Type 1 sequence model of Exxon.
(...Continued from page 26)
To complicate matters even more, Nummedal et al., (1993) referred all strata deposited during basin level fall as the falling stage systems tract (FSST). The four systems tract, sequence model of Hunt and Tucker (1992) was elaborated on and clearly illustrated by HellandHansen and Gjelberg (1994) who ably demonstrated the theoretical logic of such a classification system.
T-R S E qUENCE
In 1993, due to my inability to objectively apply the Exxon sequence stratigraphic methods and classification system to very well exposed strata of the 9 km-thick Mesozoic succession of the Sverdrup Basin of Arctic Canada, I suggested another possible combination of surfaces which would satisfy the basic definition of a sequence boundary (Embry, 1993; Embry and Johannessen, 1993).
Following the work of Wheeler (1958) and Exxon (Posamentier et al., 1988), a subaerial unconformity (S u ) was used as a sequence boundary on the basin flank with the proviso that in many settings the S u is partially or totally replaced by a shoreline ravinement (SR- u ) which represents the landward portion of the transgressive surface of Exxon workers. The sequence boundary was extended basinward from the termination of the basin flank unconformity (S u /SR- u ) along the maximum regressive surface (MRS) which represents the basinward, conformable portion of the transgressive surface (Figure 2, p. 25).
Such a boundary was theoretically reasonable because the landward termination of the maximum regressive surface joins the basinward termination of the shoreline ravinement. Thus the composite of the S u , SR- u and MRS forms one, single through-going sequence boundary which can be recognized with objectivity from basin edge to basin centre. The unit bound by this newly defined sequence boundary was called a T-R sequence because the sequence boundary separated strata deposited during regression below from transgressive strata above.
The T-R sequence was divided into two systems tracts: a transgressive systems tract (TST) bounded by the sequence boundary below and the MFS above and a regressive systems tract (RST) bounded by the MFS below and the sequence boundary above (Figure 2). Notably, like Galloway’s (1989) GSS, a T-R sequence was entirely an empirical construct based on observations of subsurface sections and extensive, very well exposed outcrops.
A NOTHER DEPOSITIONAL S E qUENCE B OUNDARY
Another proposal for defining a depositional sequence boundary was made by Posamentier and Allen (1999). They suggested using only a portion of the subaerial unconformity as the sequence boundary and then extending the boundary basinward along the time surface at the start of fall; the BSFR as defined by Hunt and Tucker (1992) (Posamentier and Allen, 1999, fig. 2.31) (Figure 4).
As illustrated by Posamentier and Allen (1999), the juncture between the S u and the BSFR occurs well landward of the basinward termination of the S u (Figure 4). They subdivided such a sequence into three systems tracts – LST, TST, and HST – and these were defined essentially in the same way as those used for the Exxon Type 1 sequence of Posamentier and Vail (1988). Posamentier and Allen (1999) also suggested that the concept of a Type 2 sequence (boundary) be abandoned.
S UMMARY
In summary, over the past 20 years, different models for sequence boundary delineation and for the subdivision of a sequence into systems tracts have been proposed. This has resulted in considerable confusion and miscommunication as different authors apply different sequence models and terminology in their study areas. In some cases the same term is used for different entities (e.g., the LST of Posamentier and Allen (1999) versus the LST of Hunt and Tucker (1992)). In other cases different terms are used for the same entity (e.g., the FRST of Hunt and Tucker (1992) and the FSST of Nummedal et al., (1993) for all strata deposited during base level fall). Such nomenclatural chaos is not conducive for effective communication.
Most importantly, the different proposals for sequence models and classification systems have not been comprehensively compared so as to determine the relative pros and cons of each one. Such a review would help workers select the most appropriate sequence stratigraphic classification system for their studies.
In following articles in this series, I will build sequence stratigraphic methods and classification systems from the bottom up. I will also review a variety of classifications systems with regards to applicability to real world situations encountered by petroleum geologists. In the next few articles we will look at the various surfaces of sequence stratigraphy which have been defined and each will be evaluated in terms of their usefulness for correlation and for bounding sequence stratigraphic units.
R EFERENCES
Barrell, J.1917. Rhythms and the measurements of geologic time. GSA Bulletin, v. 28, p. 745-904.
Baum, G. and Vail, P. 1988. Sequence stratigraphic concepts applied to Paleogene outcrops, Gulf and Atlantic Basins. In: Sea
level changes: an integrated approach. C.Wilgus, B.S. Hastings, C.G. Kendall, H.W. Posamentier, C.A. Ross, and J.C. Van Wagoner (eds.). SEPM Special Publication 42, p. 309-327.
Embry, A.F. 1993. Transgressive-regressive (TR) sequence analysis of the Jurassic succession of the Sverdrup Basin, Canadian Arctic Archipelago. Canadian Journal of Earth Sciences, v. 30, p. 301-320.
Embry, A.F. and Johannessen, E.P. 1993. TR sequence stratigraphy, facies analysis and reservoir distribution in the uppermost Triassic-Lower Jurassic succession, western Sverdrup Basin, Arctic Canada. In: Arctic Geology and Petroleum Potential. T. Vorren, E. Bergsager, O.A. Dahl-Stamnes, E. Holter, B. Johansen, E. Lie, and T.B. Lund (eds.). NPF Special Publication 2, p.121-146.
Galloway, W. 1989. Genetic stratigraphic sequences in basin analysis I: architecture and genesis of flooding surface bounded depositional units. AAPG Bulletin, v. 73, p. 125-142.
Helland-Hansen, W., and Gjelberg, J. 1994. Conceptual basis and variability in sequence stratigraphy: a different perspective. Sedimentary Geology, v. 92, p. 1-52.
Hunt, D. and Tucker, M. 1992. Stranded parasequences and the forced regressive wedge systems tract: deposition during base level fall. Sedimentary Geology, v. 81, p. 1-9.
Jervey, M. 1988. Quantitative geological modeling of siliciclastic rock sequences and their seismic expression, In: Sea level changes: an integrated approach. C.Wilgus, B.S. Hastings, C.G. Kendall, H.W. Posamentier, C.A. Ross, and J.C. Van Wagoner (eds.). SEPM Special Publication 42, p. 47-69.
Mitchum, R, Vail, P., and Thompson, S. 1977. Seismic stratigraphy and global changes in sea level, part 2: the depositional sequence as the basic unit for stratigraphic analysis, In: Seismic stratigraphy: application to hydrocarbon exploration. C. Payton (ed). AAPG Memoir 26, p. 53-62.
Nummedal, D., Riley, G., and Templet, P. 1993. High resolution sequence architecture: a chronostratigraphic model based on equilibrium profile studies. In: Sequence stratigraphy and facies association. H.Posamentier, C.Summerhayes, B. Haq, and G. Allen (eds). International Association of Sedimentologists, Special Publication 18, p. 55-68.
Posamentier, H. Jervey, M., and Vail, P. 1988. Eustatic controls on clastic deposition I: conceptual framework. In: Sea level changes: an integrated approach. C.Wilgus, B.S. Hastings, C.G. Kendall, H.W. Posamentier, C.A. Ross, and J.C. Van Wagoner (eds.). SEPM Special Publication 42, p. 109-124.
Posamentier, H. and Vail, P. 1988. Eustatic controls on clastic deposition II- sequence and systems tract models. In: Sea level changes: an integrated approach. C.Wilgus, B.S. Hastings, C.G. Kendall, H.W. Posamentier, C.A. Ross, and J.C. Van Wagoner (eds.). SEPM Special Publication 42, p. 125-154.
Posamentier, H. and Allen, G. 1999. Siliciclastic sequence stratigraphy – concepts and applications. SEPM Concepts in Sedimentology and Paleontology, # 7, 210 pp.
Vail, P. and Todd, R. 1981. Northern North Sea Jurassic unconformities, chronostratigraphy and sea-level changes from seismic stratigraphy. In: Petroleum Geology of the Continental Shelf of Northwest Europe. L. Illing and G. Hobson (eds.). Heyden and Son, Ltd., London, p. 216-236.
Van Wagoner, J.C., Posamentier, H.W., Mitchum, R.M., Vail, P.R., Sarg, J.F., Loutit, T.S., and Hardenbol, J. 1988. An overview of the fundamentals of sequence stratigraphy and key definitions. In: Sea level changes: an integrated approach. C.Wilgus, B.S. Hastings, C.G. Kendall, H.W. Posamentier, C.A. Ross, and J.C. Van Wagoner (eds.). SEPM Special Publication 42, p. 39-46.
Wheeler, H.E. 1958. Time stratigraphy. AAPG Bulletin, v. 42, p.1208-1218.
Wilgus, C., Hastings, B.S., Kendall, C.G., Posamentier, H.W., Ross, C.A., and Van Wagoner, J.C. (eds). 1988. Sea level changes: an integrated approach. SEPM Spec. Pub. 42, 407 p.
Reservoir Characterization
Expertise in heavy oil & deep basin reservoirs
• AVO / LMR Analysis
• Neural Network Analysis
• PP & PS Registration
• Joint PP & PS Inversion
• Fracture Detection Analysis using Azimuthal AVO
• Spectral Decomposition Time Lapse Analysis
Carmen Dumitrescu
P.Geoph., M.Sc., Manager, Reservoir Geophysics
Direct: 403-260-6588 Main: 403-237-7711
www.sensorgeo.com
JOIN US FOR THE CSPG’S 19th Annual Mixed Golf Tournament
This years’ tournament will be held on Thursday, August 21, at Lynx Ridge Golf Course in the north west of Calgary. This is a change of date, from the normal Friday to a Thursday, and a change in venue.
Once again, the Mixed Golf Committee, David Caldwell, Penny Christensen, Carter Clarkson, Norm Hopkins, Kim MacLean, Alyssa Middleton, David Middleton, Brenda Pearson, Dick Willott, and Hugh Wishart will bring together a first-class tournament for all participants.
The CSPG Mixed Golf Tournament is a fourperson best-ball tournament with an 8:00 am shotgun start. Golfers’ average scores/ handicaps are used to create balanced teams so everyone has a chance to contribute.
The CSPG Mixed Golf Tournament is a social tournament, intended for fun, and is an opportunity to network and socialize with colleagues and peers from industry. The tournament also provides mix and meet opportunities for geoscientists, industry, and consultants. We look forward to the return of our sponsors for this fun event, and will continue our support of the CSPG Trust “Geoscientist’ for the Future” fundraising efforts.
Entry deadline for the tournament will be Friday, August 1, with non-members accepted in date priority until the tournament is filled. Questions about registration can be directed to Brenda Pearson at (403) 2063339 or bpearson@birchcliffenergy.com.
This year we are using the on-line registration services of Events Online to collect the registration information and charge members and guests the registration fees. As the tournament chairs, we are completely satisfied that Events Online will provide a safe and secure method for registration payment. Your information will not be sold or distributed to anyone by using the registration site.
If you have any questions, please phone or email either of the CSPG Mixed Golf co-chairs.
David Middleton middletn@petro-canada.ca
David Caldwell dave22@shaw.ca
Canadian Society of Petroleum Geologists
19th ANNUAL MIXED GOLF TOURNAMENT
THURSDAY, AUGUST 21, 2008 - LYNX
RIDGE GOLF CLUB
Format: Modified Texas Scramble, shotgun start at 8:00 am. Teams will be assigned according to handicap or average score. This is a fun tournament open to both men and women. Registration includes a Continental Breakfast, Dinner, Green Fees, and Power Carts.
Registration Deadline August 1, 2008 (Priority will be given to CSPG Members). Register online at http://www.cspg.org/events/events-social-golf.cfm
□ CSPG - Member # □ Non Member
Name:
Company:
Address:
Phone (daytime):
Email:
Phone / Cell (evening):
□ Male □ Female Club Handicap or average 18 hole score:
Guest Name: (One guest allowed per CSPG Member)
□ Male □ Female Club Handicap or average 18 hole score:
Please note: A waiver must be signed by EACH participant 5 business days prior to the Mixed Golf Tournament. A waiver form will be distributed to you once your registration form has been processed. If a waiver is not signed prior to the tournament, your registration will be removed from the tournament. All registrations must be accompanied by full payment. All cancellations or requests will not be accepted. The cancellation or amendment must be received by 4:00 pm on August 8, 2008. A 15% cancellation and administration fee will apply.
85.00 Member
$ 125.00 Non-Member / Guest $ 25.00 Extra Meal Ticket (Non-playing guests. Maximum 10 spots; first-come, first served.) TOTAL (GST Included. GST # 118836295)
□ Cheque/Money Order (Payable to CSPG)
Phone: (403) 264-5610 Fax: (403) 264-5898 amendments to registrations must be received in writing via email to Brenda at bpearson@birchcliffenergy.com. Phone ,
Expiry:
Signature:
Canadian Society of Petroleum Geologists
Attn: Mixed Golf Tournament
600, 640 – 8 Avenue SW Calgary, Alberta T2P 1G7
THE DOIG FORMATION in Peace River Country
| by Canadian Discovery
This article is condensed from a more in-depth review by Canadian Discovery Ltd. For information on products offered by CDL, please visit www.canadiandiscovery.com or call 269-3644.
In May 2004, Duvernay Oil Corp. announced that it had developed its Triassic Doig gas play at Groundbirch in northeastern British Columbia. Duvernay described the play as being 80 km long and 3 km wide. The most important aspect of Duvernay’s announcement is however, that this Doig play is very different from the more conventional ones and, as such, represented a new potential gas source in the Western Canada Sedimentary Basin (WCSB). This play demonstrates how easily commercial zones can be overlooked, and how ultimate potential of an area can be undervalued.
Figure 1. Structural framework of the Fort St. John region.
Fault Patterns of the Fort St. John Graben
Fault Patterns of the Fort St. John Graben and Surrounding Region.
In 1994, the Geological Survey of Canada (Bulletin 483) recommended the “Halfway/ Doig Shelf (Peace River Structure) – Monias” Play, characterized by diagenetically variable fine-grained sandstones structurally draped over block faults, as one of the best prospects in the WCSB for gas in the Triassic. In the Fort St. John / Dawson Creek vicinity of NE B.C., the major structural feature is the generally east/west-trending Fort St. John Graben. A wide variety of faults are present regionally, some faults being episodically reactivated at various times, including during the Middle Triassic deposition of Doig and Halfway sediments.
Various interpretations have been made of the structural nature of the Fort St. John Graben. The structural framework map at the top of Figure 1 shows the east/west-trending Fort St. John Graben with its twin arms on the eastern side. The southern side of the graben has a series of east/west-trending normal faults associated with a ‘flexure zone’. The most notable feature is a north/south-trending ‘graben feature’, which would appear to have the Brassey production area associated with the downthrown block. Groundbirch is located on this map and is shown to be close to the western margin of the graben. A more regional interpretation is shown at the bottom of Figure 1. (pg. 32)
The predominantly clastic part of the Triassic succession in the Peace River Arch region forms a generally regressive ‘megasequence’ consisting of the Lower Triassic Montney Formation deep water deposits, the Middle Triassic Doig Formation shelf deposits, the overlying Halfway Formation marginal marine deposits, and the non-marine to marginal marine members of the Middle to u pper Triassic Charlie Lake Formation (Figure 2). The basal portion of the Doig Formation is the well-known ‘Phosphate Zone’, one of the best source rocks in the WCSB, and a potential shale gas target. Above this basal zone, the Doig becomes generally sandier upward.
The first indication of Doig sand potential came in 1980 when Canadian Reserve Oil and Gas drilled a NFW to the Belloy in Groundbirch 8-6-79-20W6. The 8-6 well drilled through a moderately to poorly developed Halfway sand section, which was unsuccessfully open hole tested, and into a Doig section that had two discrete sands. The upper Doig sand was successfully tested, however the sand appeared to have no effective porosity or permeability, and no gas flow resulted. The lower sand did flow at low rates (165 mcf/d) prompting Canadian Reserve to case the well, and
assign Doig production potential to it.
The first reported Doig gas production in the region came from a NFW test drilled, in December 1997 by Canadian Occidental Petroleum, south of the Canadian Hunter 148 test. The Canadian Occidental and Imperial Groundbirch 14-10-79-19W6 wellbore was perforated in a very ‘atypical’ section of the Doig Formation. Logs would suggest that the completed interval is very argillaceous, or relatively radioactive. Gas flowed from the completed zone at rates of up to 1 mmcf/d.
In March 2001, Berkley Petroleum drilled an Outpost well to the Halfway Formation about 1.5 miles southwest of the Canadian Occidental 14-10 Doig discovery, at a location in Groundbirch 10-4-79-19W6. Berkley stopped drilling at the top of the Halfway sand, so the well was re-entered by Duvernay in October 2002, and drilled an additional 69 metres. Duvernay completed the same ‘atypical sand’ as Canadian Occidental in 14-10, however the flow rates were disappointing, averaging only 340 mcf/d. Duvernay followed the deepening of 10-4 with an Outpost location in Groundbirch 11-3-79-19W6. Again the same type of ‘sand’ was completed in the 11-3 wellbore. However, at this location, the initial flow rates were substantial at just over 2.6 mmcf/
d of gas. Duvernay then moved north of the original 14-10 discovery and drilled an Outpost in 3-15-75-19W6. That well flowed gas at rates of up to 2.9 mmcf/d from the same ‘atypical’ zone. Fortunately, Duvernay cored the reservoir interval in the 3-15 well (Figure 3, p. 35). The reservoir sandstone is described as a very fine-grained litharenite. Combined with the core data available from 10-4/02, there appear to be features of a storm-dominated shelf setting (e.g., fine lamination; sharp-based, coarser event beds). Core analyses indicate porosities of 2 to 7% and permeability of 0.03 to 0.06 mD, qualifying this as ‘tight gas’ (<0.1 mD).
Identifying the pay zone in these ‘atypical sands’ is challenging owing to the unconventional well log response. At Groundbirch, the gas-bearing horizon in the upper Doig Formation is defined by well logs with gamma ray profiles of apparently shaly strata, and only minor crossover of the density and neutron porosity log profiles. (In some cases, the porosity curves only meet or closely approach.) This interpretation of ‘apparently shaly strata,’ compared to the clean sandstone units of the uppermost Doig and overlying Halfway Formation, can be incorrect because parts of the Doig Formation, including this gas-bearing pay
(Continued on page 35...)
Figure 2. Log character of the Triassic Doig Formation.
BIG BANG BLAMED
Avoid system-wide consequences from upgrading your geoscience software.
KINGDOM, from SMT, gives you the best in technology today without requiring that you abandon existing solutions.
It’s easy to use – getting you productive quickly. In fact, 9 of 10 customers surveyed say KINGDOM is easier to use than the competition. And that includes upgrading!
KINGDOM coexists with your current software –so you don’t lose access to older projects. Whether you use SMT native connectors or OpenSpiritTM technology, SMT services can get you connected.
KINGDOM provides cutting edge functionality –and scales to the largest of data sets. Support for SQL Server and Oracle, and groundbreaking use of the GPU to offload seismic rendering, allows SMT customers to manage terabytes - in a single project.
No wonder KINGDOM is the industry leader for PC-based interpretation. And our reputation is…expanding.
KINGDOM
(...Continued
zone, contain an abundance of phosphatic material, which in turn contains significant amounts of uranium, thus producing a ‘highly’ radioactive sandstone.
A natural gamma ray spectroscopy log, if available, can resolve the phosphatic, radioactive, ‘sandstone-that-looks-like-ashale’ problem. The spectral gamma log measures the radioactivity of the individual thorium, uranium, and potassium components, and provides a compensated gamma ray (CGR) log that selectively removes the radioactive effect of the uranium content.
The CGR profile of the pay zone in 10-479-19W6 is not that of a ‘clean sand’, and (for both the gamma ray and porosity logs considered here) there is the likely problem of the non-resolution of very thin beds. Core photos show that parts of the pay zone horizons are thinly layered mixtures of sandstone and shale (alternating sandy and muddy beds or laminae, with accessory shelly and phosphatic material), so there has probably been an averaging out of log responses among the numerous beds that are each only centimetres thick.
From the cluster of producing wells centered in 79-19W6, Duvernay’s drilling has extended its Doig gas zone south into the Sundown area, where the b-37-B/93-P-10 well tested Doig gas at 3.5 mmcf/d, and also north into the Saturn area in T81, R20W6. This linear, north-northwest trending band of Doig gas discoveries which outlines a large fairway about 80 km long and 3 km wide, appears to be along, or close to, the western margin of the ‘Brassey Graben’ shown on some structural maps. This suggests some structural influence on the fairway (syndepositional, post-depositional, or perhaps both).
Regional variability in formations such as the Doig suggests that there may be a range, or overlapping continuum, of types of gas reservoirs to explore for in areas such as northeastern British Columbia. These might vary from conventional stratigraphic traps such as thick shoreface sandstones in proximal settings (Buick Creek) to tighter, thin sands in more distal shelf deposits (Groundbirch). Fault-related structural traps offer other potential reservoir scenarios where postdepositional faults or fracture systems create local ‘sweet spots’ of improved permeability, or where syndepositional growth faults act as hinge lines for slumping and intra-shelf sand accumulations.
Acknowledgements: Informative discussions with Jim Dixon (Geological Survey of Canada), Jim Barclay (Southpoint
Resources), Richard Evoy (Petro-Canada), and Mike Rose (Duvernay Oil) aided in the preparation of this article and are greatly appreciated.
Figure 3. Doig reservoir interval at 3-15-75-19W6.
CALGARY’S MINERAL TREASURE
| by Marc Charest
Tucked away on the fourth floor of downtown Calgary’s Glenbow Museum is literally a treasure of world-class mineral specimens collected the world over (with a focus on western Canada), mostly by Mr. Michael “Mike” Evick. Mr. Evick, who was the museum’s last Curator of Mineral Collections and retired from the Glenbow in 1992. Since that time, this outstanding collection has not grown. Much of it is on exhibit in display cases, with an emphasis on the aesthetic appeal of the specimens. Visitors of all ages continue to report that the Mineralogy Gallery is a favourite.
In an effort to bring the collection to its full potential as a public information tool while still delighting the eye, an initiative was recently launched through the Calgary Mineral Exploration Group Society (Calgary MEG), whose mandate “is to foster a recognition of the importance of mineral exploration and the development
of mineral resources to the province of Alberta.” In the context of its recent 17th annual mining forum held here in Calgary, the Calgary MEG organized a soirée among Glenbow’s mineral collection on April 14, 2008. The only ones dressed up on this informal beer, cheese, and pizza occasion were the minerals! A fundraiser as well as a raiser of awareness, that pleasant evening introduced (or re-introduced) about 150 participants to one of Canada’s premier collections of mineral specimens, with private tours of the collection’s public displays as well as a behind-the-scene peek at what one organizer called the “inner sanctum” of the curator’s rooms, one housing the minerals of the world and the other containing samples from various mines. The participants were fortunate in having Mr. Evick as an exclusive guide, with his unique insight into the collection and decades of anecdotes to tell.
E XHIBIT “R ENAISSANCE ”
This exhibit deserves our time and our resources. Let’s all lend a hand and revitalize the collection. Doing this may be seen as ambitious, but it’s achievable. It’s time to create a more dynamic and interactive exhibit, which will be sure to stimulate and inform the 21st century visitor. The use of techniques such as touch screens, audio wands, handheld devices, and visible storage of mineral specimens in combination with dramatic lighting effects and short interpretive texts, would breathe new life into our Glenbow Mineralogy Collection and will be more effective at communicating the importance of minerals in our modern economy.
The plan to revitalize could look like this: first, the collection would be researched and catalogued into Glenbow’s collection management database, while a conceptual exhibit plan is developed. Designers would then be invited to develop exhibit proposals. Following de-installation of the present exhibit, the new displays and communication media would be constructed and installed.
Mike Evick’s involvement with the Glenbow’s mineral collection goes back precisely to October 1964. Mr. Eric Lafferty Harvie, founder of the Riveredge Foundation as well as Glenbow Museum, started the collection with a batch purchase of specimens. Through the decades that ensued Mr. Evick collected the bulk of the collection (over 20,000 specimens!), through excursions
in the field at various mine sites, selected purchases, and gifts. Mr. Evick mentioned how it is becoming more and more difficult to obtain top quality samples, especially now that minerals are recognized as natural works of art. In the last several years, increased wealth in the world has created a demand for rare and exquisite specimens and prices have correspondingly soared. Many key field collecting localities are now exhausted or inaccessible.
A MONG THE T OP IN THE C OUNTRY
Glenbow Museum’s mineral collection is one of the most comprehensive collections in North America and one of the largest in Canada, according to information gleaned from the museum’s website. The Canadian rival collections include that of the Royal Ontario Museum in Toronto and the Museum of Nature in Ottawa. Some specimens are considered the best of their kind in Canada: an example is a green pyromorphite specimen on display, a member of the apatite phosphate group, from the North Star Mine in Kimberly, B.C. Some Glenbow specimens even top examples found in the Smithsonian National Museum of Natural History in Washington D. C.!
The collection comprises a wide variety of gemstones, both in cut and uncut form including diamonds, opals, amethysts, sapphires, and rubies. For the evening fundraiser, a special display was assembled and on show; this collection of 27 rare and wonderful gem specimens was whisked back to the vault at the end of the evening. Most mineral samples are grouped by class in the various, well-lit display cases. Classes such as native elements
(gold is always the favourite here), silicates, oxides and halides, and carbonates are tastefully displayed in cases each with a distinct coloured background. The coloured background was Mr. Evick’s idea, which made the display that much more appealing to the public. Some specimens are grouped and displayed in themes: petrified wood, ornamental stone carvings, fluorescent minerals. An interpretive text can also be found with each display. Mr. Evick said that it took 14 years to get all of the texts ready and mounted in the cases!
T IME FOR A C HANGE
Museum philosophies change with time. Subjects become popular then fall out of favour. Priorities change too and sources of funding flow and ebb. The museum already reaches out to the public with its present mineral exhibits and the availability of portable museokits. The time has come, however, to take the bull by the horn(blende) and bring
Calgary’s fantastic mineral collection into the new century. There is so much in this unique, long-neglected assemblage that can be used to both delight and inform modern visitors to the Glenbow. The initiative to re-invent and showcase one of the museum’s most unique collection deserves to be encouraged and supported. Who knows how many earth sciences careers have been and will continue to be launched because of a visit to Glenbow’s mineral collection?
If you would like to contribute to the revitalization of Glenbow’s mineralogy collection, contact Glenbow Museum’s Debbie Stahl at 403.268.4189.
CSPG AwARD
Honorary
Membership
A. N EIL H UTTON
Neil Hutton has enjoyed a long and very successful career as a petroleum geologist and executive and has well served our profession through his active involvement with CSPG. He is a very worthy recipient of Honorary Membership.
Neil was born in Strathaven, Scotland in 1934 and grew up in Glasgow, where he attended the u niversity of Glasgow and obtained a B.Sc. in Geology in 1956. On graduation, Neil joined the Ghana Geological Survey and was involved in mapping the African Shield and searching for commercial mineral deposits. In 1960 Neil returned to the u niversity of Glasgow and graduated with a Ph.D. with a specialty in Carboniferous foraminifera and carbonate petrology in 1965.
calling all ore ganguesters
The oldest student society at the university of Saskatchewan, the illustrious Ore Gangue geological society, is gearing up to celebrate its 75th anniversary! For any who are not familiar with it, the Ore Gangue is a u of S student-run society. It was conceived as a means of promoting interaction amongst students as well as disseminating knowledge of the geosciences. Over the years the Ore Gangue has morphed into a larger entity, yet it has stayed true to its roots. With a current membership of over 130 students (90 of whom are geosciences students), the Ore Gangue provides socialization opportunities for its members, organizes field trips, donates to local charities, and promotes networking amongst practicing alumni and student members.
The 75th Ore Gangue Reunion is slated for March 19th to 21st, 2009 in Saskatoon. Further information can be obtained at www.oregangue.org, the official alumni website. All Ore Gangue members and alumni are invited to attend. One can be certain that the reunion will reflect and uphold the traditions of the Ore Gangue, and that both young and old fellows will be reunited with a sense of camaraderie and revelry reminiscent of those past university days of legend.
Hope to see you there!!!
Neil came to Canada in 1966 and obtained a position with Texaco Exploration supervising and developing the company’s exploration research capabilities. In 1970 Neil became District Geologist for Northwest Territories and the Arctic Islands, a challenging position involving an extensive array of structural and stratigraphic plays as well as undertaking some of the last field programs run by the Company in the Arctic and the Yukon. In 1975 Neil was appointed Assistant Chief Geologist with responsibilities for the Western Canada Basin, New Play Development, and Exploration Research including heavy oil pilot projects. He became Assistant Exploration Manager for New Play Development in 1979 but left shortly thereafter to become a partner in Petrel Consultants.
Petrel was initiated as an innovative, multidisciplinary consultancy to provide integrated geological and geophysical studies including data processing and modeling. In 1982 Neil became President of the company’s u S operations developing field templates and high-resolution techniques to define deep subtle stratigraphic traps in the Powder River and North and South Park Basins. In 1987 Neil negotiated a merger with Robertson Research, becoming Chairman of the merged Petrel Robertson Ltd., adding
core analysis and carbonate petrography to the range of services. Neil was bought out by the Junior Partners in 1993 and continued to consult independently until his retirement in 1999.
Neil has also been active in the community with his involvement centred on children and adults with learning disabilities. He was President of the Calgary Association from 1976-79, the Alberta Association in 1980, and on the board of the Canadian Association for Children with Learning Disabilities for two years. In 1979 he was the founding Chairman of the Calgary Learning Centre, an integrated community project to provide research and practice to meet the needs of children and adults with learning difficulties.
Neil’s initial involvement with CSPG was with the first Joint CSPG-CSEG Convention, “Exploration u pdate 1975” on the program committee and in 1978 organized a session for the Fiftieth Anniversary Convention. In 1979 Neil was Co-Chair of the 1979 Exploration u pdate Conference, a very successful event from both technical and financial perspectives. Neil was elected Vice President in 1981, assumed the Presidency in 1982, and was host President for the 1982 AAPG Convention. As Past President, he was chair of the nominating committee and served on the board of the 50th Anniversary Trust Fund from 19841986. He also served on the nominating committee for the Stanley Slipper Award for three years.
Neil has enjoyed a rewarding and innovative career in the petroleum industry and the CSPG has played a central role in networking and friendships. It is with pleasure that we accept Neil Hutton as an Honorary Member of CS PG.
DR . PHILIP S TEVEN SIMONY
Over the past 45 years Dr. Phil Simony has taught thousands of students the principles of structural geology and has led a comprehensive research program on the structural evolution of the Rocky Mountains. Perhaps more importantly, Phil is one of the nicest and most thoughtful human beings one could ever hope to know and he is held in high regard by everyone who knows him. It is with great pleasure that we welcome Phil as an honorary member of CSPG.
Born in 1936, Phil obtained a B.Sc. (Hon. Geol.) in 1958 as well as an M.Sc. in Geology in 1960 from McMaster u niversity. In the summer of 1956 he worked for Triad Oil (now Talisman) in an area west of Grand Cache, Alberta and his eyes were opened to structural geology.
ROCK SHOP
In September 1960 he married Vera and began his doctoral studies at the Imperial College, London. His thesis, based on two six-month field seasons of very detailed mapping in northwest Scotland demonstrated the tectonic interleaving of thin sheets of Archean basement with a thick clastic succession. The work led to a Ph.D. in 1963 and was later published by the Geological Society of London.
In September 1963, Phil was appointed to the new Geology Department at the u niversity of Alberta at Calgary (now u niversity of Calgary) and continues to work there despite officially retiring in September 2002. His main teaching responsibilities were structural geology, field mapping courses, regional tectonics, and engineering geology. Starting in 1976, he developed an advanced course in structural geology that emphasized 3D structural analysis methods applicable to exploration and development. More than 700 students graduated after taking this course and applied their learning in the Canadian oil and gas industry as well as in coal exploration. For many years, Phil made his structural geology course available to industry geologists by teaching in the late afternoon and by offering a special night course. Phil also taught a number of special courses for oil and gas companies.
u pon the advice of several senior petroleum geologists in Calgary, Phil initiated a program of detailed mapping in the ranges west of the Rocky Mountains and in the western Rockies. The aim was to improve understanding of the stratigraphy at the western fringes of the WCSB and to figure out the complex structure. This became Phil’s life work
and involved the research of 40 graduate students, most of whom are now finding oil, gas, and CBM.
Following Tom Oliver and Fin Campbell, Phil served for five years as department head of the Geology (now Geoscience) department at the u niversity of Calgary. He also served for seven years on the APEGGA Board of Examiners. In 1993 he was recognized by the CSPG with the Robert Douglas medal and in 1998, by the Graduate Students Association with a Graduate Teaching award.
Stories of Phil’s field exploits and his love of sardines are legendary as is his never-ending generosity. On a number of occasions he lent graduate students money to ensure they got by until their next meager cheque arrived from the university. Phil Simony continues to serve the geological community and to offer words of wisdom and encouragement to all those he works with. Phil is a most worthy recipient of CSPG honorary membership.
CSPG AwARD R.J.W. Douglas Medal
The R.J.W. Douglas Medal is awarded annually by the Canadian Society of Petroleum Geologists for outstanding contributions to the understanding of sedimentary geology in Canada, commending major contributions to regional tectonics, petroleum, and structural geology. This year’s Medal was presented to Dr. Ed Landing, State paleontologist and Curator of Paleontology with the New York State Museum in Albany, at the May 6th Technical Luncheon at the Telus Convention Centre. Awarding the 2007 R. J. W. Douglas Medal to the American paleontologist Dr. Ed Landing is truly appropriate. He has published on almost all of the provinces, with 46 (of 115) peer-reviewed articles and four field trips (to the Levis area, Quebec; eastern Newfoundland and southern New Brunswick; and Jasper National Park) dedicated to the Canadian Ediacaran–Middle Paleozoic.
Ed found Early Paleozoic rocks and fossils particularly interesting as an undergraduate at the u niversity of Wisconsin-Madison,
and indulged this interest at the u niversity of Michigan, Ann Arbor, with an M.Sc. thesis on Early Ordovician conodonts from the Taconic overthrust, eastern New York. After beginning a Ph.D. on the Middle Devonian paleoecology of southern Ontario, he changed his thesis back to Early Paleozoic biostratigraphy. His field areas included the south shore of the St. Lawrence from Levis to Cap des Rosiers; southern New Brunswick; and the Cow Head area, western Newfoundland.
After completing a Ph.D. at Michigan, Ed
was a post-doc under Chris Barnes at the u niversity of Waterloo where he completed a report on the Early Ordovician of Devon Island. Godfrey Nowlan of the GSC sent him samples from the Antigonish area of Nova Scotia. These samples yielded the first Early Cambrian microfossils from Avalonian North America, and led to Ed’s long-term work on what he argues comprised the non-Gondwanan, Early Paleozoic Avalon microcontinent. Following a post-doc with the u.S.G.S. in Denver, he did a third postdoc with Rolf Ludvigsen at the u niversity of Toronto on the Cambrian-Ordovician boundary interval in Jasper Park, Alberta.
Alberta Geological Survey
Ed’s employment since 1981 at the New York State Museum has allowed him to return repeatedly to Canada for field work. In 1987, he proposed, with Guy Narbonne (Queens u niversity) and Paul Myrow and Michael Anderson (both then at Memorial u niversity), a global stratotype for the Precambrian-Cambrian boundary at Fortune Head, eastern Newfoundland. This candidate prevailed over Russian and Chinese proposals, and was accepted as the global standard in 1992. Ed’s work on this project included describing the oldest skeletal fossils in southeast Newfoundland (a report that won the Paleontological Society’s Best Paper Award in 1989). At about this same time, a global standard for the Cambrian-Ordovician boundary was being developed at a site in western Newfoundland. This global standard, adopted in 2001, uses the lowest occurrence of a species of Iapetognathus, a conodont genus named by Ed from western Newfoundland rock samples. Most recently, Ed proposed that the lowest part of the Cambrian, actually about half of the Cambrian older than the oldest trilobites, be known worldwide as the “Terreneuvian Series.” This was formally accepted in 2007, with “Terreneuvian” derived from the old name for the French colony in the Burin Peninsula, eastern Newfoundland.
Ed notes that much of his career has been based on the generosity and collegiality of Canadian colleagues – a long history that has extended from post-doctoral appointments to his nomination for the 2007 R.J.W. Douglas Medal. And, of course, there’s just that variety of Canadian geological history that he’s still writing up.
CSPG AwARD Volunteer & Service Award – 2007 Annual Convention
Volunteers are essential to the services and programs offered by the CSPG, especially our Annual Convention. Through the dedication of our Committee Volunteers and Chairs, the Annual Convention is truly a world-class technical event. The CPSG recognizes our extraordinary team of volunteers through Service and Volunteer Awards. These additional awards for the Convention positions were presented at the May 20th Technical Luncheon.
Service Awards are given to individuals who have contributed to the welfare of the society through committee or other volunteer work and are generally awarded for 5-10 years of service on a committee, service on multiple committees, or service of retiring committee chairs. Congratulations to the following listed Committee Chairs for receiving 2007 Service Awards.
Volunteer Awards are presented every year to individuals who have demonstrated
significant service to the society through volunteer work with service for at least two years of service on a committee, recognizing committee members who have demonstrated commitment to the Society’s needs. Congratulations to the listed Committee members for receiving 2007 Volunteer Awards.
For a complete list of the 2007 Service and Volunteer Award recipients, please visit www.cspg.org.
SERVICE AWARDS
Jeanette Watson
Andrea Hood
VOLUNTEER AWARDS
Joanne Lanteigne
Ellie MacInnes
Suzan Moore
Natalie Hachey
Graham Carter
David Mitrovica
Stephanie Billenko
Victor Irwin
Lyndsey Nicholas
Marcia Rempe
Joanna Tittemore
Darren Aldridge
John Cody
Mike Perz
Flo Reynolds
Terry McCoy
Learn the science of moving up the ladder.
For more on field seminars and short courses, call 918-560-2650 or visit www.aapg.org/education.
FIELD SEMINARS
Lewis & Clark Geotour: Marias River To Gates Of The Mountains, Montana
September 9-14, 2008 / Begins and ends in Great Falls, MT
William B. Hansen, Jireh Consulting Services, Great Falls, MT http://www.aapg.org/education/fieldseminars/details.cfm?ID=19
Modern Terrigenous Clastic Depositional Environments
September 25-October 2, 2008 / Begins in Columbia and ends in Charleston, SC
Walter J. Sexton, Athena Technologies, Inc., Columbia, SC http://www.aapg.org/education/fieldseminars/details.cfm?ID=60
Applied Stratigraphy Of Paleozoic Carbonate Platforms
October 19-22, 2008 / Begins and ends in Las Vegas, NV
John E. Warme, Colorado School of Mines, Golden, CO
October 3, 2008 / Houston, TX, with the GSA Annual Meeting
Stephen Bend, University of Regina, Saskatchewan, Canada http://www.aapg.org/education/shortcourse/details.cfm?ID=13
Intro To Petroleum Geology For Faculty
October 4-5, 2008 / Houston, TX, with the GSA Annual Meeting
Stephen Bend, University of Regina, Saskatchewan, Canada http://www.aapg.org/education/shortcourse/details.cfm?ID=169
LAST CHANCE – DON’T MISS THESE SUMMER OPPORTUNITIES
Application Of Structural Geology In Prospecting In Thrusted And Extensional Terrains
August 4-8, 2008 / Jackson Hole, WY
Charles Kluth, Consultant, Denver, CO; Ronald Nelson, Consultant, Cat Spring, TX http://www.aapg.org/education/shortcourse/details.cfm?ID=44
Fractures, Folds And Faults In Thrusted Terrains
August 18-22, 2008 / Begins and ends in Great Falls, MT
William Hansen, Jireh Consulting Services, Great Falls, MT; Steve Boyer, Consultant, Tacoma, WA; Charles Kluth, Consultant, Denver, CO; Jim Sears, University of Montana, Missoula, MT
This article is reprinted with permission from the Prospect Saskatchewan Informational Brochure series. The series is intended to highlight prospective areas in order to further develop the oil and natural gas resources of Saskatchewan. Further information may be obtained by emailing: prospectsask@ir.gov.sk.ca.
STRATIGRAPHIC SETTING
The Middle Devonian Winnipegosis Formation in southeastern Saskatchewan is subdivided into Lower and upper members (Figure 1). The Lower Winnipegosis is mainly a non-porous, often organic-rich, lime mudstone and dolomudstone deposited in an open-marine platform setting.
The upper Winnipegosis can be subdivided into two units: i) carbonate build-ups that have been variably referred to as banks, mounds, or reefs; and ii) inter-reef deposits.
i) The carbonate build-ups are characterized by widely varying amounts of pelletoidalbiofragmental carbonate, branching corals, bryozoa, crinoids, blue-green algae, and stromatoporoids in a dominantly carbonate mudstone matrix.
ii) There are two types of inter-reef deposits. One is characterized by organic-rich limestone laminites which typically occur in lagoonal areas between mounds. First informally named the Brightholme Member by Stoakes et al. (1987), it is considered to be the basinal equivalent to upper Winnipegosis build-ups (Kendall, 1975; Stoakes et al., 1987; Campbell, 1992). The other type of inter-reef deposit comprises finely laminated carbonate mudstone overlain by interbedded to interlaminated carbonates and anhydrites, and is commonly referred to as the “Ratner Laminites.”
The Ratner is found developed within inter-bank/inter-reef areas proximal to the carbonate build-ups. It conformably overlies the Lower Winnipegosis, and where present, the Brightholme Member. Originally, the Ratner was considered to be of Winnipegosis age by Jones (1965) and Reinson and Wardlaw (1972). Later researchers argued that the Ratner is not genetically related to the upper Winnipegosis in terms of depositional environment and are younger deposits (Kendall, 1975; Jin and Bergman, 2001). Jin and Bergman (2001) raised the Ratner to Formation status.
Capping the entire upper Winnipegosis and Ratner is an anhydrite/halite unit of varying thickness called the Whitkow Member of the Prairie Evaporite (Holter, 1969; Reinson and Wardlaw, 1972) referred to here as the Whitkow Evaporite. The Whitkow Evaporite is generally overlain by thick halite and lesser potash deposits of the Prairie Formation except in areas where these have been dissolved.
T HE R ATNER R ESERVOIR
The Ratner porous zone, (Figure 2), has been dolomitized to a granular/sucrosic texture with intergranular porosity. In the Bryant well 111/7-4-5-7W2 (Figure 3), core analyses and logs indicate 13 to 19% porosity with permeability up to 26 mD. A uniform light
to medium brown oil stain is present over the entire three-meter-thick porous zone. In 2001, a test of the Ratner porous zone in this well produced highly pressurized gas-cut oil to surface. Later, a horizontal well (191/0704-005-07W2) drilled in the Ratner porous zone on the same section had an initial production of 89 m3 /day and subsequently attained a cumulative production of over 14,000 m3 before it was shut in four years later in July, 2006.
Porosity development within the Ratner Member is related to the degree of dolomitization present. A sucrosic dolostone reservoir facies is identified within the Ratner near the flanks of the Winnipegosis mounds (Nimegeers, 2005), and proximal to thick anhydrite deposits of the Whitkow Evaporite (Figure 3, p. 44). Where developed, the Whitkow Evaporite and an interbedded to interlaminated sequence of carbonate and anhydrite near the top of the Ratner provide a competent caprock to the reservoir facies.
Potential source rocks for the oil in the Ratner include the organic-rich limestones of the Brightholme Member which occur farther from Winnipegosis mound flanks, and possibly the Lower Winnipegosis. Lateral transition from the Ratner to the non-porous organic-rich facies of the Brightholme takes place over less than 1 km in the cross-section in (Figure 3 p. 44.)
R ESERVOIR FORMATION
u nderstanding the mechanisms involved in the dolomitization of the Ratner Laminites is important to developing an effective
(Continued on page 44...)
Figure 1: Generalized stratigraphic chart of the Winnipegosis Formation and related units in southeastern Saskatchewan.
Figure 2: Photomicrograph of porosity and oil staining in the Ratner Laminites in 111/7-4-5-7W2 at 2,383 mKb.
Figure 3: Cross-section showing the porous Ratner in the 111/7-4-5-7W2 well in relation to the more distal, organic-rich limestone-dominated (Brightholme?) Upper Winnipegosis to the west, and the thick mound and anhydrite units toward the southeast.
Figure 4: Model for dolomitization of the Ratner Laminites, arrows indicate inferred Mg-rich fluid flow paths downward in the mounds, then along bedding planes in the Ratner.
(...Continued from page 43)
predictive model for exploration programs within the Ratner. Seepage reflux related to thick accumulations of Whitkow Evaporite has been proposed in the literature as the most likely model for dolomitization in the Ratner (Kissling and Slingsby, 1999). As shown in Figure 4, the reefs act as conduits to allow for the flow of Mg-rich fluids downwards and along bedding planes in the Ratner. Farther away from the mounds and the thick anhydrite section of the Whitkow Evaporite, the Ratner appears to be less dolomitized and the organic-rich Brightholme limestone may be
present (Figure 3). It is noteworthy that the development of sucrosic dolostone reservoir facies as found in the Ratner Bryant 111/7-4-5-7W2 producing well (Figure 3) is located proximal to a Winnipegosis mound and a thick Whitkow Evaporite section.
u sing this dolomitization model, in combination with the associated stratigraphy, a map can be made of prospective areas for Ratner dolomitization. In the map in Figure 5, potential Winnipegosis “mound” facies were mapped using an arbitrary isopach cut-off of 40 m or greater. Whitkow
Evaporite “thicks” (>10 m) are also shown. Some areas between Winnipegosis mounds (as mapped), yet proximal to thick Whitkow Evaporite accumulations have been identified with red ovals. Further work to identify the presence of porous Ratner dolostone in conjunction with structurally ‘high’ regions would be beneficial.
SUMMARY
Reservoir: Diagenetic porous dolostones in the Ratner Formation.
Trap: Structural/Stratigraphic
Seal: Evaporites at the top of the Ratner
Oil Source: Brightholme Member and Lower Winnipegosis Formation limestones.
R EFERENCES
Campbell, C.V. 1992. Upper Elk Point Megasequence. In: Devonian-Early Mississippian Carbonates of the Western Canada Sedimentary Basin: A Sequence Stratigraphic Framework. J. Wendte, F.A. Stoakes, and C.V. Campbell (eds.), Society of Economic Paleontologists and Mineralogists, Short Course 28, p. 145-162.
Holter, M.E. 1969. The Middle Devonian Prairie Evaporite of Saskatchewan. Saskatchewan Dept. Min. Res. Report 123, 134 p.
Jin, J. and Bergman, K. 2001. Revised stratigraphy of the Middle Devonian (Givetian) Winnipegosis carbonate-Prairie Evaporite transition, Elk Point Group, southern Saskatchewan. Bulletin of Canadian Petroleum Geology, v. 49, p. 441-457.
Jones, H.L. 1965. The Middle Devonian Winnipegosis
ormation in Saskatchewan. Saskatchewan Dept. Min. Res. Report 98, 101 p.
Kendall, A.C. 1975. The Ashern, Winnipegosis and Lower Prairie formations of the commercial potash areas. In Summary of Investigations, 1975, p. 62-65.
Kissling, D.L. and Slingsby, A. 1999. Reservoirs in Winnipegosis basin laminites (Ratner Member), Williston Basin. Seventh International Williston
Basin Horizontal Well Workshop, Regina, Saskatchewan, 10 p.
Nimegeers, A. 2005. Hydrocarbon potential in the Middle Devonian Ratner dolostone: southeastern Saskatchewan. Saskatchewan Geological Society Core Workshop Volume 2005, SGS Special Publication #17, p. 37-48.
Reinson, G.E. and Wardlaw, N.C. 1972. Nomenclature and stratigraphic relationships, Winnipegosis and Prairie Evaporite formations, central Saskatchewan. Bulletin of Canadian Petroleum Geology, v. 20, p. 301-320.
Stoakes, F., Campbell, C., Hassler, G., Dixon R., and Forbes, D. 1987. Sedimentology and Hydrocarbon Source Potential of the Middle Devonian Winnipegosis Formation of Southeastern Saskatchewan. Stoakes Campbell Geoconsulting Report (unpublished internal report), 98 p.
A DDITIONAL INFORMATION
To download this and other documents related to hydrocarbon resources of Saskatchewan, visit: http://www.ir.gov.sk.ca/Default.aspx?DN=3442, 3440,3385,2936,Documents or email: prospectsask@ir.gov.sk.ca
Figure 5: Map of potential Upper Winnipegosis mounds facies (> 40m isopach) shown in blue/grey, and thick Whitkow Evaporite sections(>10 m) shown in pink. Examples of areas where Ratner dolomitization is more likely to occur are outlined with red ovals. Cross-section A-A’ (Figure 3) is also located on this map.
CANMORE MUSEUM and Geoscience Centre
| by Rick Green, President, Centennial Museum Society of Canmore
The Centennial Museum Society of Canmore (Society) operates the Canmore Museum and Geoscience Centre. The Society began in 1984 to collect coalmining and railroad memorabilia after the closing of the coalmines in 1979. The museum moved into the new Canmore Civic Centre in June 2004. This was a big change for the Society as it was a much nicer facility. We received “Registered Museum” status last November. This opens doors to more funding opportunities with the Alberta Museums Association.
The Town of Canmore is a major sponsor of the facility giving us the space and providing funding for core staff. We contracted with the Town of Canmore to be open every day of the year except Christmas. Three Sisters Mountain Village, a resort real estate company, was a major sponsor of the move to the new digs in 2004. Last year, Lafarge Canada Inc. and ATB Financial became significant sponsors of the facility.
A geoscience committee was set up in June 1998. The committee has been working away now for almost 10 years. The Society has been running a Stones and Bones summer geoscience program since 2001. PromoScience (NSERC) has been the main sponsor of the program (2001–2003, 2005–2007). In 2008, Talisman Energy Inc. came forward with funding when we lost funding (hopefully only temporarily) from PromoScience. The CSPG has been a sponsor since 2001. Current sponsors also include the CSEG, CAGC, HRSDC, APEGGA, and CGGVeritas. We are currently looking for additional sponsors to help us expand our program throughout the year.
The Stones and Bones Summer program includes manning a booth at the CSPG/ CSEG/CWLS convention in mid-May, doing a Geoscience Outreach program with grade 7 students from the Lawrence Grassi Middle School (4 classes for 1½ hour each) in late
May, organizing an annual Geoscience Open House (July 19), running 3 Stones and Bones week-long summer day-camps for 10 – 12 year olds ($125 each) and 4 two-hour “I Dig Rocks” geology sessions for 6 – 9 year olds ($25 each). The camps are on the following weeks: July 14-18, July 28 – August 1, and August 11-15. The “I Dig Rocks” sessions are: July 10, July 24, August 21, and August 29 (10:00am – noon). Other times are possible.
Please visit our facility and consider becoming a member of our society. Help us explain geoscience to kids and the general public. Call 403-678-2462 or email info@cmags.org for further information or visit our website at www.cmags.org.
industry-leading customer service
easy & efficient migration of existing data helping clients increase productivity
We know that almost everyone who tries geoSCOUT™ wants to use geoSCOUT. So, why hasn’t everyone already switched to geoSCOUT? Probably because, in general, people don’t like change. But, in this case, change is good – very, very good.
Just ask the thousands of landmen, engineers & geologists currently using geoSCOUT oil and gas mapping and analysis software to make solid decisions every day. Give us an hour for a demo – we know you’ll see the value. Call 403.262.1992 | Email info@geoscout.com | Online www.geoscout.com/demo Another powerful suite of tools from geoLOGIC
Seeing is believing!
Are you faced with difficult interpretation challenges?
� Would you give this zone a second look?
The Triple-combo logs (left side) show no clear indication this zone contains hydrocarbons.
� What if you could “see” the fluids contained in this zone to identify fluid type and quantity?
Now you can! The 2D NMR images from the MR ExplorerSM (MREXSM) service in tracks 4 & 5 identify gas condensate in this zone.
� Does it contain commercial quantities of hydrocarbon?
The fluid volumetrics measured by the MREX service (in track 6) indicate commercial quantities of hydrocarbon are present in this interval. This was confirmed by formation tests using the Baker Atlas Reservoir Characterization InstrumentSM (RCISM) service.
Image the fluids and know for sure.
The MREX service from Baker Atlas makes direct measurements of fluid type and volume.
2D NMR imaging enables you to “see” the fluids to ensure all potential hydrocarbon zones are identified for maximum recovery on every well.
For direct measurements of reservoir fluid type and volume, contact Baker Atlas today.