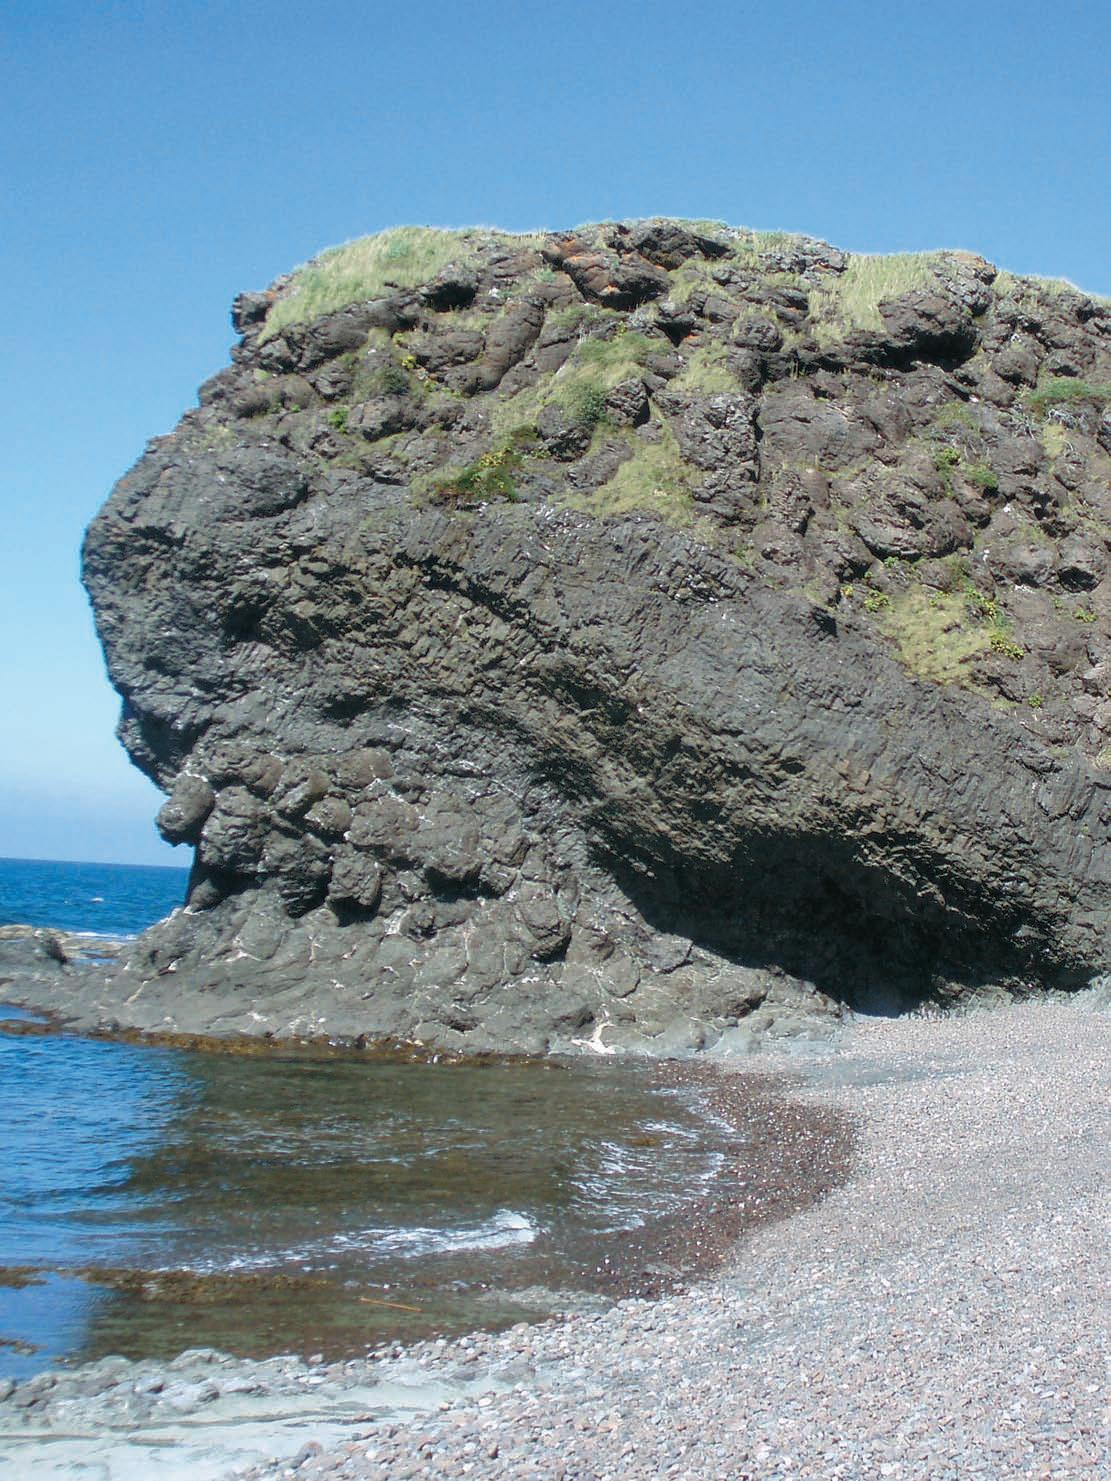
Define Reservoir Parameters with Confidence
Looking to maximize opportunities in today’s volatile market?
Combine the power of PETRA® and IHS Critical Information including well and log data to define reservoir parameters and determine new opportunities faster and more cost effectively.
Let IHS information solutions improve your decision-making and reduce your risk.
For more information on PETRA visit us at www.ihs.com/reservoirsolutions


#600, 640 - 8th Avenue SW Calgary, Alberta, Canada T2P 1G7
Tel: 403-264-5610 Fax: 403-264-5898
Web: www.cspg.org
Office hours: Monday to Friday, 8:30am to 4:00pm
Executive Director: Lis Bjeld
Email: lis.bjeld@cspg.org
Advertising & Sponsorship Coordinator: Alyssa Middleton
Email: alyssa.middleton@cspg.org
Communications Coordinator: Heather Tyminski
Email: heather.tyminski@cspg.org
Member Services Coordinator: Kasandra Klein
Email: kasandra.klein@cspg.org
Registration Coordinator: Dayna Rhoads
Email: dayna.rhoads@cspg.org
Joint Annual Convention Committee
Convention Manager: Shauna Carson
Email: scarson@geoconvention.org
Convention Coordinator: Tanya Santry
Email: tsantry@geoconvention.org
EDITORS/AUTHORS
Please submit RESERVOIR articles to the CSPG office. Submission deadline is the 23rd day of the month, two months prior to issue date. (e.g., January 23 for the March issue).
To publish an article, the CSPG requires digital copies of the document. Text should be in Microsoft Word format and illustrations should be in TIFF format at 300 dpi., at final size. For additional information on manuscript preparation, refer to the Guidelines for Authors published in the CSPG Bulletin or contact the editor.
Technical Editors
Ben McKenzie Colin Yeo (Assistant Tech. Editor) Tarheel Exploration EnCana Corporation Tel: 403-277-4496 Tel: 403-645-7724 Email: bjmck@telusplanet.net Email: colin.yeo@encana.com
Coordinating Editor
Heather Tyminski
Comunications and Public Affairs, CSPG Tel: 403-513-1227, Email: heather.tyminski@cspg.org
ADVERTISING
Advertising inquiries should be directed to Alyssa Middleton, Tel: 403-513-1233, email: alyssa.middleton@cspg.org. The deadline to reserve advertising space is the 23rd day of the month, two months prior to issue date.
The RESERVOIR is published 11 times per year by the Canadian Society of Petroleum Geologists. This includes a combined issue for the months of July and August. The purpose of the RESERVOIR is to publicize the Society’s many activities and to promote the geosciences. We look for both technical and non-technical material to publish. The RESERVOIR is not intended to be a formal, peer-reviewed publication. Additional information on the RESERVOIR’s guidelines can be found in the May 2008 issue (p.46-48; available at http://www.cspg.org/publications/reservoir/reservoir-archive-2008.cfm). No official endorsement or sponsorship by the CSPG is implied for any advertisement, insert, or article that appears in the Reservoir unless otherwise noted. The contents of this publication may not be reproduced either in part or in full without the consent of the publisher.
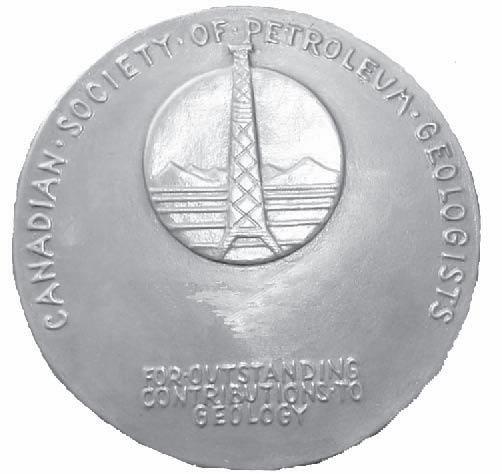
RJWDOUGLASMEDAL CALLFORNOMINATIONS
The RJW Douglas Medal is awarded annually by the Canadian Society of Petroleum Geologists for outstanding scientific contributions to the understanding of sedimentary geology in Canada, commending major contributions to regional tectonics, petroleum, and structural geology.
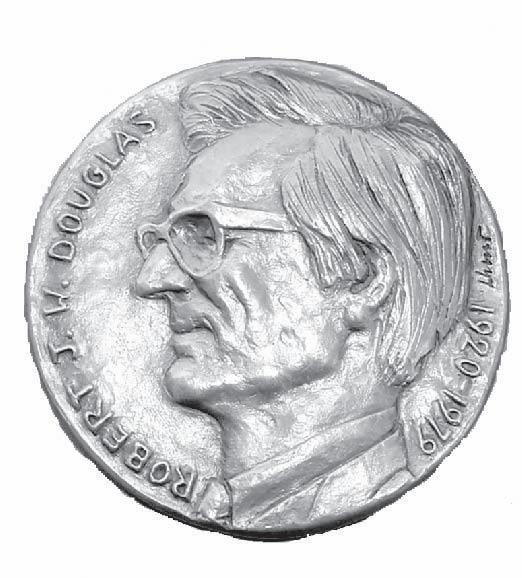


The award is open to all geologists who follow the example of Bob Douglas in contributing to the development of Canadian sedimentary, petroleum, and structural geology.
Nominations for the award of the medal must be endorsed by at least three members of the CSPG. Nominations may be proposed at any time, but to be considered for a particular year, they must be received by the Society before September 1.
The sponsors of a nominee for the award should supply:
A curriculum vitae (outling the nominee’s career and previous honours or distinctions).
A list of publications by the nominee.
A summary of the nominee’s achievements in a form suitable for use as a citation for the award.
An analysis of the nominee’s achievements, highlighting the contributions for which he or she is being recognized, and relating these to the appropriate publications in the bibliography.
The last item of information is a key part of the nomination and should convey the magnitude and scope of the nominee’s scientific contributions, with comments on the influence that these contributions have had on others. An example of a submission may be provided on request.
Completed nominations should be sent to:
Margot McMechan
CSPG Douglas Medal Committee Chairman, c/o Margot McMechan
GSC – Calgary
3303, 33rd Street NW, Calgary, Alberta T2L 2A7
Telephone (403) 292-7154
Email: mmcmecha@nrcan.gc.ca
Since 1927...

CSPG EXECUTIVE
President
Graeme Bloy • Canada Capital Energy Corporation gbloy@capitalenergy.ca Tel: (403) 975-5784
Vice President
John Varsek • EnCana Corporation john.varsek@encana.com Tel: (403) 645-2000
Past President
Lisa Griffith • Griffith Geoconsulting lgriffith@griffithgeoconsulting.com Tel: (403) 669-7494
Finance director
David Garner • Chevron Canada Resources davidgarner@chevron.com Tel: (403) 234-5875
assistant Finance director
Greg Lynch • Shell Canada Ltd. greg.lynch@shell.com Tel: (403) 691-3111
Program director
Randy Rice • Suncor Energy Inc. rjrice@suncor.com Tel: (403) 205-6723
assistant Program director
Scott Leroux • EnCana Corporation scott.leroux@EnCana.com Tel: (403) 645-2000
serVices director
Ayaz Gulamhussein • NuVista Energy Ltd. ayaz.gulamhussein@nuvistaenergy.com Tel: (403) 538-8510
assistant serVice director
Penny Colton • Geophysical Service Inc. pcolton@geophysicalservice.com Tel: (403) 514-6267
outreach director
Mike DesRoches • Talisman Energy Inc. mdesroches@talisman-energy.com Tel: (403) 513-6843
communications director
Peggy Hodgkins • CGGVeritas peggy.hodgkins@cggveritas.com Tel: (403) 266-3225
EXECUTIVE COMMENT
A message from the Outreach Director, Mike DesRoches
Updating CSPG Outreach
As CSPG’s latest Outreach Director, having recently inherited the position from Greg Lynch after spending 2008 as the Assistant Director, I am busy trying to familiarize myself with the many worthwhile and popular Outreach programs being supported by CSPG. As well, I have been getting to know and learn from the numerous energetic and committed volunteers that are making these programs work so well. Most Outreach initiatives are operating well and are well received by their intended audiences, though one or two could use some shoring up. This I will discuss in more detail below.
Unless one has been living under a large rock for the last year, or perhaps on a desert island, we are all only too familiar with the significant and dramatic – mostly negative –changes that have recently occurred within our beloved petroleum industry. These changes go far beyond our relatively limited scope into the general economy of Canada and that of much of the rest of the world.
As CSPG President, Graeme Bloy, detailed in his comments in the February issue of the Reservoir, things have changed, a lot. The last year or so has been vastly different from the heady days of early 2008 when commodity prices seemed to have nowhere to go but up and we were often worrying that most things seemed to be going way too fast. In the April Reservoir, CSPG Program Director Randy Rice delved even deeper into discussing the negative impacts that those of us old enough to remember experienced in previous down cycles of the petroleum business in Canada over the last couple of decades. Suffice to say that not many people enjoyed those difficult times and this latest downturn isn’t looking much better.
However, the slump our industry is presently mired in is no longer news to anyone and we’ve all heard about it far too much lately, so enough about that. It’s only a matter of time before the good news starts rolling in
again – I’m sure of it. The good news from CSPG is that CSPG Outreach is alive and well. Our committees are intact and strong and are well into planning for their various programs for 2009. We’re not immune to the downturn though and are certainly feeling some of the effects, particularly in the area of program funding. Rather than cutting out entire programs though, where possible and practical, we have trimmed the budgets of some of the committees with the goal of keeping the core of the programs alive, but postponing any new initiatives or not funding low-impact components until the fortunes of the patch improve again.
The flagship program of CSPG Outreach has to be the Student Industry Field Trip, or SIFT, which recently took place for the 32nd consecutive year, over the first two weeks of May. As I write this comment in late April, the tireless SIFT committee is in the final stages of planning for a very busy two-week program for the 31 students from across Canada that will be arriving in Calgary next weekend. As you read this note in late May though, the students will have frantically learned all they possibly could about the oil industry in western Canada over two jammed-packed weeks of excitement, not very long ago, and will most likely still be catching up on their sleep, having flown back to wherever they call home.
The SIFT committee has not only been hurriedly putting the finishing touches on the program planned for the students but has also been very diligent about doing everything possible to reduce their costs for running SIFT 2009. Their recent estimates indicate that they have been able to trim nearly 15% from what they anticipated at budget time last year that they would need to spend to run SIFT 2009 - great work by all in tough times. Above all though, the SIFT committee and CSPG want to express our gratitude to the corporate sponsors of SIFT 2009, for without their generous (Continued on page 7...)

The 4th Annual AAPG Fall Education Conference September 21-25, 2009 / Norris Conference Center / Houston, Texas
10 GREAT COURSES ON THE BUSINESS OF PETROLEUM EXPLORATION.
• Risk Analysis & Decision Making in E&P
• Petroleum Resources & Reserves: An Overview of Recommended Geological Practices
• Decision Methods and LNG Value Chain
• Creativity in Exploration
• Knowledge Transfer in the Multi-Generational Workplace
• Keys to Complex Well Economic Success
• Think on Your Feet—The Importance of Clarity, Brevity and Impact™
• The Energy Industry from the Investor’s Perspective: How will the new policies affect investment strategies?
• Exploration Success and Failures from Pore Pressure Assumptions
• Farm-ins and Farm-outs for Explorationists
www.aapg.org/fec
Since 1927...

CORPORATE MEMBERS
APACHE CANADA LTD.
BAKER ATLAS
CONOCOPHILLIPS CANADA LIMITED
DEVON CANADA CORPORATION
ENERPLUS RESOURCES TRUST
geoLOGIC systems ltd.
GEOMODELING TECHNOLOGY CORP.
HUNT OIL COMPANY OF CANADA,
HUSKY ENERGY INC.
IHS
IMPERIAL OIL RESOURCES
LARIO OIL & GAS COMPANY
LITTLE ROCK DOCUMENT SERVICES
MJ SYSTEMS
MURPHY OIL COMPANY
NEXEN INC.
PENN WEST PETROLEUM LTD.
PETRO-CANADA OIL AND GAS
PETROCRAFT PRODUCTS LTD.
PROVIDENT ENERGY LTD
RPS ENERGY CANADA LTD.
SHELL CANADA LIMITED
SPROULE ASSOCIATES LIMITED
SUNCOR ENERGY INC
TALISMAN ENERGY INC.
TECK COMINCO LIMITED
TOTAL E&P CANADA LIMITED
TOURMALINE OIL CORP.
AS OF APRIL 29, 2009
(...Continued from page 5)
help in these difficult times, running the SIFT program would be much more difficult for all involved. The 2009 SIFT sponsors are: (Platinum) ConocoPhillips, EnCana, and Shell; (Prime) Devon and Imperial Oil; (Gold) Suncor Energy and Talisman Energy; (Silver) Canadian Center for Energy Information, Canadian Natural Resources, Sundog Printing, Weatherford International, and Green Bean; (Bronze) AGAT Laboratories, Albertan Energy Utilities Board, Angle Exploration, Apache, Ayrton Exploration Consulting Ltd., Bonavista Energy Trust, Canext Energy, Ember Resources, Enerplus Resources Fund, Golder Associates, Harvest Energy, Husky Energy Inc., MGM energy Corp, Neo Exploration, Nexen, OPTI Canada, Palliser Oil & Gas, Paramount Energy, Rigstar Communications, Royal Tyrell Museum, SAIT, Spearpoint Energy, and University of Calgary.
The University Outreach Committee is another busy and dedicated group of volunteers working in the Outreach portfolio. University Outreach for this committee means helping to run a wide variety of interesting activities, all directly benefiting university geology students at schools across the country. By supporting, attending, and providing modest cash awards to the best papers given at the three annual inter-university conferences: the AUGC, WIUGC, and AESRC, the University Outreach Committee is helping improve our future geoscientists’ awareness of the Canadian petroleum industry.
This committee also sponsors CSPG student chapters at a number of universities across Canada, providing the students with a modest subsidy to host a few social events to bolster the local geology clubs and linking them to the many CSPG activities. At present, only about a third of the universities with geology programs across the country are actively participating in this initiative, so it is the goal of this committee to find ways to solicit more groups to join as chapters in future years.
Another very popular program organized by the University Outreach Committee is the visiting lecturer program. Knowledgeable scientists, mostly from the Calgary area, are sent to a number of different universities to speak to the students on topical issues, usually relating to petroleum geology. This program has proved to be very popular and is well received and appreciated by the students and their professors alike.
We have recently bid adieu to Erin Crerar, the
excellent University Outreach Committee Chair for the last several years so that she could take some time off to see the world. The chair position has been assumed by the very capable Simon Haynes. He and his hard-working committee of volunteers have continued along without missing a beat.
Another tireless CSPG group that has successfully run their annual public outreach event for many years now is the Honorary Address Committee. The Honorary Address in 2008 was held on October 28th at the Jubilee Auditorium, in Calgary, Alberta. The topic of “The Science of Big Wave Surfing” was a bit of a change from the usual and more locally related subject matter (I haven’t seen too many surfers trying out the breakers of Chestermere Lake in the last year or two) but it proved to be very interesting for all and lots of fun too. The talk was attended by around 1,800 school kids during the day and another 1,000 members of the public in the evening, so the outreach aspect worked out extremely well. The Honorary Address Committee has written an excellent summary of the event which can be found on CSPG’s website at www.cspg.org/events/eventshonorary.cfm. Access to webcasts of the talks and a few other interesting tidbits are also available there.
The Committee has already managed to secure Brian Keating of the Calgary Zoo, a very popular and interesting speaker who is guaranteed to give a highly entertaining and interesting talk, for the 2009 Honorary Address. This will be given on either November 2nd or 3rd of 2009, so stay tuned.
Last but not least, the remaining dedicated Outreach committees include the Graduate Thesis Awards Committee, the 100 Student Jobs Committee, KISP/K-12, and the Regional Graduate Scholarships Committee. While perhaps smaller in scope than the larger committees described above, these groups are no less important to our ongoing Outreach efforts at CSPG. For that reason I’m making it a priority to become more familiar with the activities of these groups so that I can better understand what they do and how they are helping CSPG reach out to individuals outside of our Society.
Thank you to all of the many hard-working volunteers serving in the committees of CSPG’s Outreach portfolio, with which I feel fortunate to be entrusted.
technicaL Luncheons JuNE
Synchrotron light in the earth sciences: applications to the petroleum geosciences
SPEAKER
Jeff Cutler Canadian Light Source Inc. University of Saskatchewan, Saskatoon, SK
11:30 am thursday, June 11, 2009 telus convention centre calgary, alberta
Please note: the cut-off date for ticket sales is 1:00 pm, monday, June 8, 2009.
csPg member ticket Price: $38.00 + gst non- member ticket Price: $45.00 + gst
Due to the recent popularity of talks, we strongly suggest purchasing tickets early, as we cannot guarantee seats will be available on the cut-off date.
Did you know that you can book a table for the Technical Luncheon? To book your table, or to buy individual tickets, visit www.cspg.org or call CSPG’s office at (403) 264-5610.
As applied research moves into the 21st century, scientists are discovering that traditional analytical techniques are not answering all of their questions. For example, new materials are being developed daily that may have significantly different properties but are chemical indistinguishable using current analysis techniques. It is important for researchers to understand these differences and be able to go back to the laboratory and impart those unique properties to new products or processes. Therefore, today, scientists are turning to new tools to shed light on old and new questions. One such tool is synchrotron light-based analysis, which is now being seen as the enabling technology that will help answer many of these difficult questions.
In particular, application of synchrotron light in the earth sciences has proved to be extremely beneficial for physical, mineralogical, and chemical characterization of complex geologic systems such as:
• micron-scale, crystalline intergrowths;
• elements (S, N) and phases (CH 4 , CO2 ) in geomacromolecules (kerogen, asphaltenes) and fluid inclusions; and
• neoformed low-temperature, semiamorphous minerals.
Primarily, these involve application of synchrotron light in the areas of X-Ray Diffraction (S-XRD), X-Ray Absorption Spectroscopy (XANES/XAFS), X-Ray Fluorescence (S-XRF), and Computed Micro-Tomography (S-CMT).
The Canadian Light Source (CLS), a 2.9 GeV synchrotron facility located at the University of Saskatchewan, is a multi-faceted research tool where intense beams of light are generated to help probe the nature and structure of matter. Opened in October 2004, this centre is in routine operation (24 hours a day / 5 days a week) with users, both academic and industrial, coming to Saskatoon from around the world. Twentytwo beamlines (with very heavy involvement from the Canadian scientific communities) are now in various stages of operation, commissioning, construction, and planning. These beamlines and associated endstations will be extremely useful for research in the petroleum geosciences – using infrared spectroscopy and spectromicroscopy, soft and hard x-ray imaging, μ-XAFS, single crystal diffraction, and small- and wide-angle scattering. This presentation will report on the current status of the Canadian Light Source and some insight into the future of the facility.
BIOGRAPHY
Jeffrey Cutler is the Director of Industrial Science at Canadian Light Source Inc. and an adjunct professor in the Department of Chemistry at the University of Saskatchewan. Through his various roles at the CLS, Dr. Cutler is building the overall scientific program at the synchrotron by introducing industry to the power of synchrotron light as an R&D tool.
Dr. Cutler received his Ph.D. from the University of Western Ontario, Canada in physical inorganic chemistry and prior to coming to the Canadian Light Source, spent several years working for the United States Air Force as a research scientist.
In 1981, Dr. Cutler was presented the Gold award of the Duke of Edinburgh’s award by His Royal Highness Prince Phillip.
Canadian Light Source Inc. (CLSI) operates the Canadian Light Source, Canada’s national synchrotron research facility. Located at the University of Saskatchewan in Saskatoon, the CLS is a world-class, state-of-the-art facility that is advancing Canadian science, enhancing the competitiveness of Canadian industry, and contributing to the quality of life of people around the world.
technicaL Luncheons JuNE LuNCHEON
The sedimentology of ancient mangroves: swamped with hydrocarbon potential
SPEAKER
Jon Noad Shell Canada
11:30 am thursday, June 18, 2009 telus convention centre calgary, alberta
Please note:
the cut-off date for ticket sales is 1:00 pm, monday, June 15, 2009. csPg member ticket Price: $38.00 + gst non- member ticket Price: $45.00 + gst.
Due to the recent popularity of talks, we strongly suggest purchasing tickets early, as we cannot guarantee seats will be available on the cut-off date.
Did you know that you can book a table for the Technical Luncheons? To book your company’s table, or to buy individual tickets, visit www.cspg.org or call CSPG’s office at (403) 264-5610.
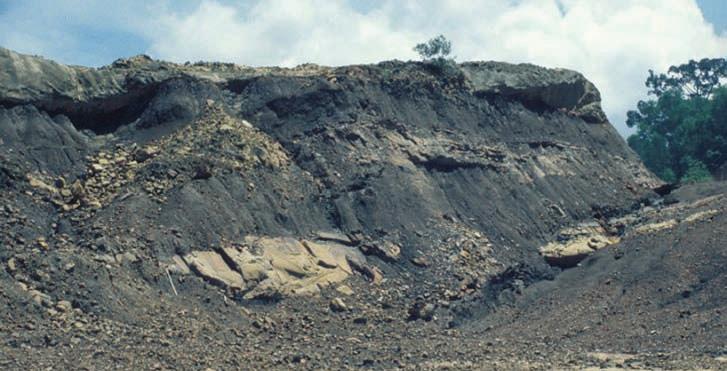
Fossil mangrove deposits have received relatively little attention in the published literature, despite their significant potential as hydrocarbon-prone source rocks. Recent fieldwork examining both ancient and modern deposits suggests that mangroves may also host significant oil deposits. Fossil mangroves can be classified as either humid or arid mangroves. The former are clastic in character, comprising shales encasing both channelised and sheet-like sandstones. Detailed sedimentological analysis of Miocene coastal clastic deposits in the Sandakan region of eastern Borneo has identified several well preserved mangrove systems, and enabled the development of new criteria enabling the recognition of these facies in other locations. Ancient arid, or carbonate mangroves, were studied in Mallorca.
Unpublished data from Brunei suggests that mangrove mudstones may provide a significant
source of oil, sourced mainly from the waxy cuticles of mangal species. Using analogue data to give an indication of the lateral extent of the fossil mangrove sandbodies, plays can be developed invoking stratigraphic traps sourced from the associated organic-rich mudstone deposits. Both arid (carbonate) and humid (clastic) fossil mangroves show great potential as self-sourcing hydrocarbon reservoirs, and may indeed already be producing oil from misidentified or unrecognised ancient mangroves.
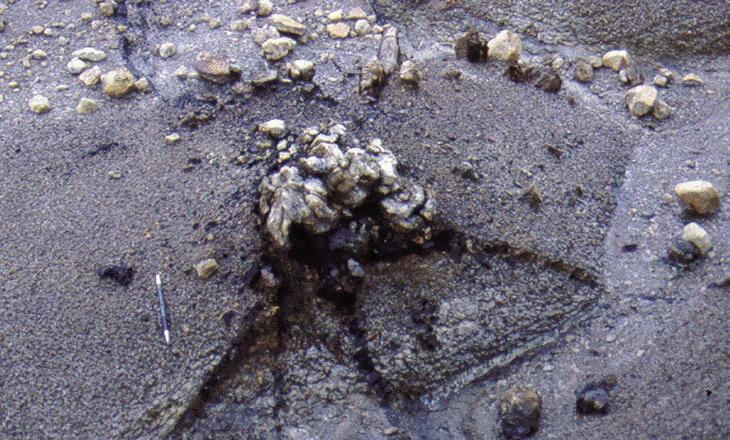
Several morphologically distinct sandbody classes within the successions from Borneo have been assigned to channel and intermangrove broads, based on analogues from both the Everglades of Florida and modern Bornean mangroves. The channelised sandstones have extremely steep banks and appear to accrete vertically, thought to be due to the constraining mangrove
root systems. The sheet-like sandstones are massive with rare rooted intervals, and are interpreted as shallow extensive broads, open areas within the mangrove system. All of these sandbodies are potential reservoirs. A variety of beautifully preserved plant and animal fossils support these interpretations.
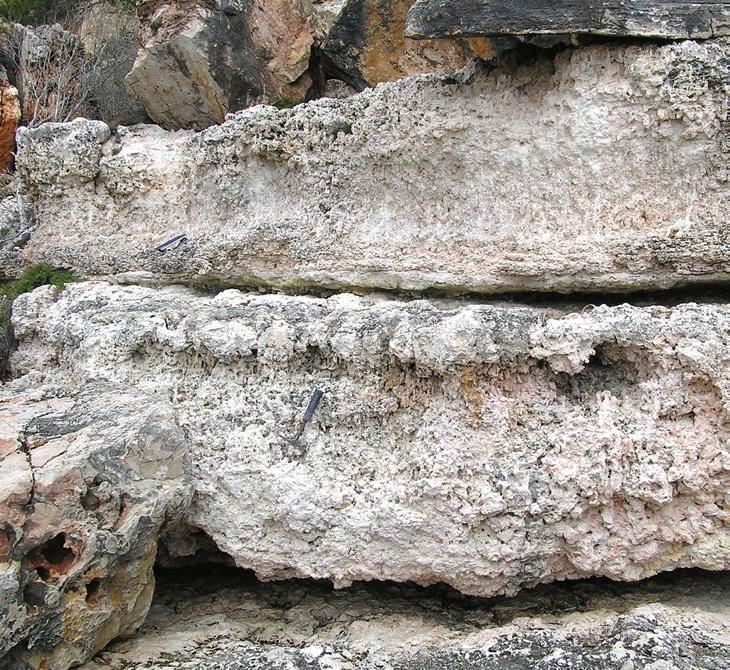
Arid mangrove systems share some of the features of clastic mangrove systems, but are dominantly carbonate in character. Interpreted mangrove deposits from the Miocene of eastern Mallorca, Spain were studied by Coppes (unpublished M.Sc. thesis, Delft University, 2005), who recorded a variety of limestone beds encased in carbonate muds. These are typically heavily rooted, with fenestra and an absence of large channels. Well developed soil horizons form key marker beds within the stratigraphy. They are commonly associated with reefal and (Continued on page 10...)
Series of steep-sided mangrove channels, incised into mudstones bearing rooted trees, from eastern Borneo.
Rooted mangrove tree, from eastern Borneo.
tidally influenced, stromatolitic carbonates. Coppes created a three-dimensional reservoir model of these high vertical permeability deposits in Petrel and simulated production from fossil mangroves at a scale previously unrecorded, with impressive results, which will be presented here.
BIOGRAPHY
Jon Noad works for Shell Canada as an exploration geologist in basin-centred gas. He began his career in gold and platinum mining in South Africa after graduating in 1985 from Imperial College, London. Returning to the UK he joined British Telecom as their first marine geologist, responsible for routing and burial of international subsea telecommunications cables. He also completed a Masters in Sedimentology at evening classes, with a thesis project based in Dinosaur Provincial Park here in Alberta, leading on to a full-time Ph.D. at University College London. There he worked on the sedimentary evolution of eastern Borneo, kindling a lifetime interest in fossil mangroves. He joined Shell in 1998, based in Holland, and worked mainly on Middle Eastern exploration before moving to Canada in 2006. He also taught at Delft University for two years half-time. Jon is currently President of the British Sedimentological Research Group.

Loring Tarcore Labs
Heavily rooted limestone beds, separated by thin, laterally persistent palaeosol horizons, from Mallorca.


Do more exploring collaborating carbon capturing pushing the envelope team building subsurface subsea subanywhere smiling geosteering globe-trekking horizontal drilling ecothinking biking technology leading project leading industry leading groundbreaking digital mapping remote sensing rock sampling rock climbing relaxing on the weekends playing creative thinking stress reducing parenting mud logging well logging caring for our environment life balancing family bonding skiing hockey playing initiative grabbing challenging yourself


Revisiting the East Georges Bank Basin, offshore Nova Scotia: what the explorationists
saw two decades ago
SPEAKER
Tako Koning
Advisor, Tullow Oil, Luanda, Angola and Residential Representative, Yme Foundation Angola
12:00 n oon
tuesday, June 23rd, 2009 e ncana a mphitheatre, 2nd Floor e ast e nd of the c algary tower complex 1st street and 9th avenue s . e . c algary, a lberta
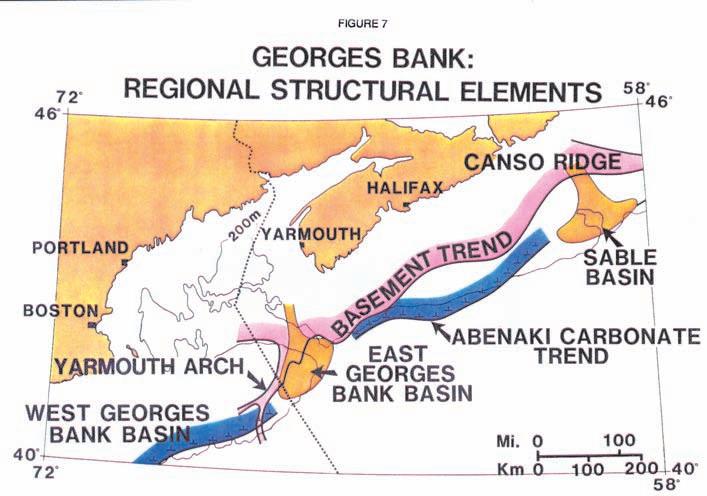
The East Georges Bank Basin is located offshore Nova Scotia on the southeastern Canadian continental shelf. The basin covers 10,000 square kilometers (2.5 million acres) and is one of the last undrilled basins in North America.
The geological understanding of this basin is based on 16,000 km of seismic data, which was studied and interpreted in the early to mid-1980s by Texaco Canada’s geoscientists. The first public presentation of the interpreted data was at a CSPGGAC-MAC conference in 1988 in St. John’s, Newfoundland and thereafter the geological and geophysical interpretations were presented at a number of oil industry conferences worldwide, including the Conjugate Margins Conference at Dalhousie University in 2008. This presentation is a re-presentation of the 1988 and subsequent papers. In 1988, the government placed an oil activity moratorium on Georges Bank. No activity such as seismic surveying has taken place since that time. Therefore, although this presentation is based on old seismic data, it must be viewed as up-to-date since no new data has been acquired on the bank for over twenty years.
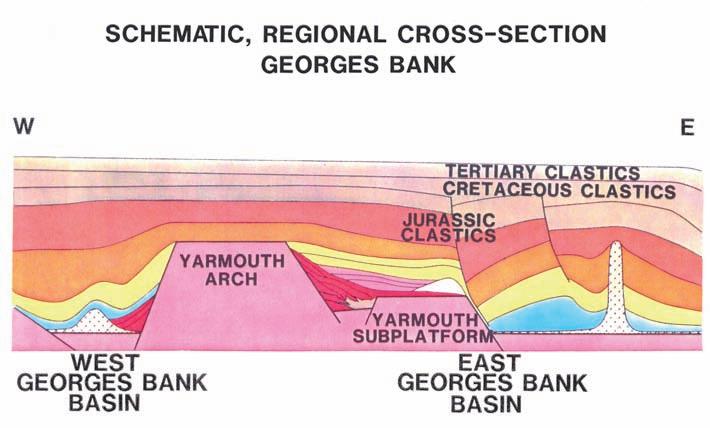
The overall Georges Bank Basin formed during the Triassic when the landmass of Pangea began separating along rift zones. A prominent Paleozoic basement high, the Yarmouth Arch, separated the East Georges Bank Basin from the West Georges Bank Basin, and had a dominant influence on sedimentation until Middle Jurassic. During the Middle Jurassic, major growth faulting and halokinesis commenced in the basin.
The structural and stratigraphic evolution of the East Georges Bank Basin has resulted in the development of a variety of seismically defined prospects. The Geological Survey of Canada (GSC) published in 1983 (Proctor et al.) that the average hydrocarbon expectation of the basin was 168 x 10 6m3
barrels oil (1.0 billion barrels) and 150 x 109m3 natural gas (5.3 TCFG). The GSC’s speculative estimate for the basin was 350 x 106m3 barrels of oil (2.1 billion barrels) and 307 x 109m3 gas (10.8 TCFG). Since 1983 when these reserve estimates were made by the GSC, drilling has proven up significant reserves of natural gas in various fields on the Scotian Shelf and this would seem to indicate that on a regional basis the likely hydrocarbon that may occur in the East Georges Bank Basin would be gas rather than oil.
In order to gain more insight into the interpreted geology of the East Georges Bank basin, in 1992 the author visited (Continued on page 38...)


exploring collaborating
project leading technology leading industry leading subsurface subsea subanywhere smiling geosteering globe-trekking horizontal drilling ecothinking biking team building carbon capturing pushing the envelope groundbreaking digital mapping remote sensing playing family bonding creative thinking stress reducing


rock sampling rock climbing skiing hockey playing


mud logging well logging caring for our environment life balancing parenting relaxing on the weekends initiative grabbing challenging yourself


F ROM THE BRAIN SCAN TO THE W ELLBORE: MRIL® Applications in Tight Gas
| by Bruce Keen
The recent development of new enabling technologies in the energy services industry has fueled additional interest in unconventional gas – especially tight gas formations. These new gas plays are far more challenging to develop than conventional resources; technology for understanding these complicated reservoirs is essential for operators to unlock their potential.
Tight gas reservoirs are nano-Darcy formations that were once thought of as seals; now they are considered reservoirs of the future. With discoveries made in Canada in the Montney and the Horn River Basin, technology that will yield knowledge of permeability, porosity, fluid identification, and horizontal placement is needed to delineate the zones of productivity. The days when operators could rely solely on conventional logging methods are long gone; now, geologists and geophysicists require new and better methods to unlock the mysteries of these vast pools of hydrocarbons. In particular, operators need accurate permeability measures to optimize horizontal placement and completion design, minimize water cuts, plan fracture stimulation, and generally lower costs and increase production.
N UCLEAR M AGNETIC R ESONANCE
Nuclear Magnetic Resonance (NMR) technology has moved from the medical lab to the wellbore to help provide the reservoir knowledge tight-gas operators need. Understanding the science behind NMR technology will help to show the value of NMR data to tight-gas development. The physics involved with the NMR are on the nuclei scale. Hydrogen nuclei undergo nuclear resonance when exposed to a magnetic field; protons align or polarize themselves to a powerful magnet. An oscillating magnetic field tips the protons enabling the measurement of the polarization and decay times. The time distribution measurement from NMR can be used to analyze the fluids within the pore space in the reservoir (Coates, Xiao, and Prammer, 1999). Specified pulses provide a spin-echo train and associating echo wait times yield raw NMR data. From these physics, Halliburton’s Magnetic Resonance Imaging Logging (MRIL®) service offers information about the quality of the fluids in the rock, properties of these fluids, and attributes related to the size of pores that contain these fluids (Coates, Xiao, and Prammer, 1999). The MRIL service provides data on:
• Total NMR porosity ;
• Total bound fluids, micro-clay bound water, and capillary bound water;
• Free Fluid Index;
• Effective porosity;
• Permeability estimates; and
• NMR fluid typing.
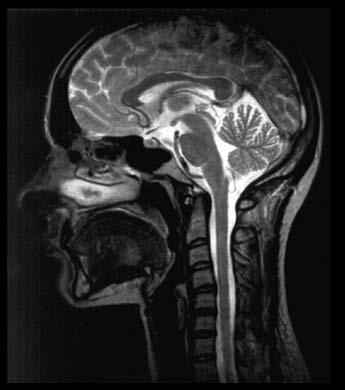
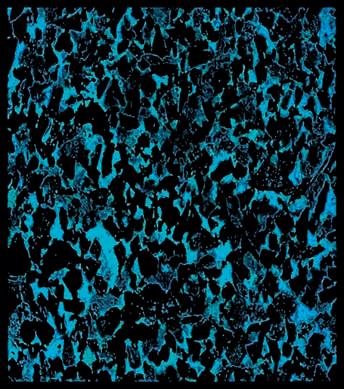
Figure 1 illustrates the NMR measurement in a brain scan versus a cross-section of rock.
T1, T2 , AND DIFFUSION VALUES
The MRIL tool measures the polarization or the magnetization buildup (T1) and the decay or the magnetization decay (T1) of hydrogen (Balliet, 2008). Where T2 is affected by diffusion, T1 is used as a simple and direct method to evaluate light hydrocarbons. As the hydrogen protons become polarized, the MRIL tool can measure the time to align the hydrogen protons to the tool’s magnetic field, yielding a T1 distribution and porosity (integration of the area under a T1 distribution curve). T2 is measured simultaneously by acquiring a large number of spin echoes during the last T1 build-up time measurement. Generally, bound or immovable fluids have short T1 and T2 times with a small diffusion value (D) resulting from the smaller pore size (Coates, Xiao, and Prammer, 1999). Free or moveable fluid T1, T2 times and D values are larger, while hydrocarbon values vary depending on diffusivity and viscosity. While T1 responds from two mechanisms, surface and bulk T1, T2 has three decay mechanisms which contribute – surface, bulk, and diffusion. As the MRIL sensor contains a well characterized, consistent magnetic field gradient, the effect of diffusion is used with T2 measurements to
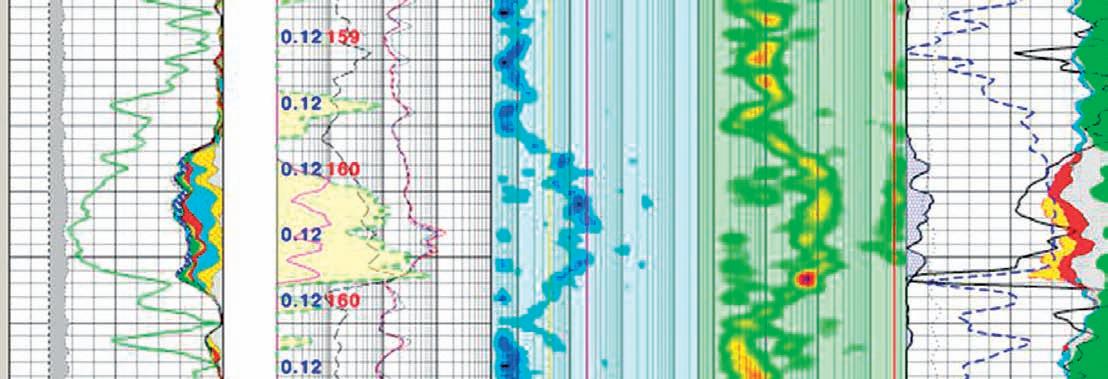
describe fluids and as a contrast to T1, which contains no diffusion. Light oil has long T1 and T2, where heavier oils have shorter T1 and T2 values; increased viscosities can behave like a solid (oil sands ranging in the 100,000+ centipoise range). The T1 gas signal occurs later in time, as seen in track 4 of Figure 2, where the T2 gas signal smears amongst the water signal in track 3. T1 can differentiate gas diffusivity from water. The red line on the T1 log indicates theoretical methane, based on reservoir temperature and pressure.
MRIL SERVICE P OROSITY AND PERMEABILITY
Halliburton’s MRIL service porosity measurement is independent of rock matrix; instead, the measured porosity is a function of the fluid volume occupying the pore space. Using multiple echo spacings (0.6 ms and 1.2 ms) and simultaneous T1-T2 measurements, the MRIL service can fractionalize porosity into total porosity (MSIG), effective porosity (MPHI), free fluid index (MFFI), and claybound water (MCBW). Because the MRIL measurement is independent of matrix, the tool is not affected by grain density, which can sometimes be challenging in a siltstone or shale formation such as the Montney in northeastern British Columbia. Due to the factors affecting density porosity, total porosity can be compromised as a result of grain density uncertainty. A density sandstone matrix of 2.65 g/cc might yield an invalid bulk density and / or porosity value when formation grain density is actually 2.74 g/cc or higher, resulting in pessimistic reservoir estimations.
Figure 1. NMR Brain Scan vs. NMR Rock Thin Section. Hydrogen-rich brain tissues are visible to NMR. Bone is dark and is not seen by NMR. Hydrogen atoms are visible to NMR. Rock Material is not seen by NMR.
NMR Porosity is fractionalized into bin porosities based on T1 and / or T2 times, dividing them into Bulk Volume Irreducible (BVI), Micro-Clay porosity, effective porosity, and total MRIL porosity measurement. Bound and moveable fluid cutoffs are utilized for both T1 and T2 distribution; a spectral bound-fluid method is also used.
The determination of MRIL service permeability is based on the Coates permeability equation when either a singlephase or multiphase formation fluid system containing water and / or hydrocarbon exists. A continuous qualitative permeability estimate is available in real time. The Coates permeability equation is extremely flexible and may be tuned to NMR core measurements to produce a quantitative permeability estimate. The Coates permeability equations offer advantages over the T2 geometric mean model, which is best applied only in single-phase fluid systems. Equation (1) shows the Coates equation for a multiphase formation.
= Porosity
= Free Fluid Index
= Bulk Volume Irreducible
Constant
MRIL SERVICE
HYDROCARBON TYPING
When understanding the physics of the T1, T2 and diffusion measurements, inferences can be drawn on their respective distribution to assist in hydrocarbon typing. Fractionalizing the NMR porosity into free fluid, BVI, and micro-porosity is a large differentiator from other porosity measurements. The use of a resistivity-based, dual-water-saturation model, MRIANTM (MRI-Analysis), can identify water saturations in the virgin formation
(Coates, Xiao, and Prammer, 1999). NMR reduces the reliance on resistivity-based measurements, which can compromise potential pay in a low-resistivity pay zone or where a fresh Rw exists. Combining T1, T2 , and diffusion values with the resistivity model can strengthen reservoir characterization and certainty.
MRIL SERVICE IN TIGHT GAS
Tight gas optimization is challenging, and a technology that can characterize these emerging resources plays can be the
differentiator on final production numbers. Typically, tight gas reservoirs in the Montney Formation can vary from a poor 0.1 mD to a fair 1.0 mD, depending on location. Porosity values range between 3 p.u. to 6 p.u. depending on formation. Varying grain densities can affect the density tool readings, skewing bulk density and densityderived porosity values. With NMR porosity measurement independent of matrix and using the T1 distribution for gas identification, geologists and geophysicists can acquire a
(Continued on page 17...)
Hydrogeologist – Carbon and Energy Management
The Carbon and Energy Management (CEM) group works with national and international companies to proactively address greenhouse gas issues. A focus of the group is the assessment and characterization of suitable sites for the geologic storage of CO2 and for other subsurface clean energy technologies such as geothermal energy.
As a Hydrogeologist you will apply hydrogeological methods to analyze and interpret the flow and characteristics of potable groundwater, formation brines and injected CO2 at various scales. The successful candidate should possess the ability to employ quantitative methods to understand the system response to stresses brought on by fluid and/or CO2 extraction and injection.
The ideal candidate will possess at minimum a Masters degree in Hydrogeology/Geology and suitable experience. Field experience and a wide range of capabilities such as hydrogeological modeling, data management, site assessment and groundwater monitoring would be a definite asset. Proficient use with graphical and data manipulation software programs is required. The individual must be able to work and conduct research independently as well as part of a multi-disciplinary team. Well-developed communication skills are essential.
For more details and to apply, please visit our website at www.arc.ab.ca
Figure 2. T2 Gas Diffusivity vs. T1 Distribution.
Proudly brought to you by Professionals in Geoscience and Engineering
Geoscience and Engineering
Alberta’s Professional Geoscientists and Engineers provide Albertans with many of the essentials of daily living. The work that they do allows all of us to enjoy warmth, light, power, water and the ability to travel and communicate over distance.
Alberta’s Professional Geoscientists and Engineers provide Albertans with many of the essentials of daily living. The work that they do allows all of us to enjoy warmth, light, power, water and the ability to travel and communicate over distance.
Since 1920, Members of APEGGA, The Association of Professional Engineers, Geologists and Geophysicists of Alberta, have made a difference in the daily lives of millions of Albertans by bringing science and innovation to life.
Since 1920, Members of APEGGA, The Association of Professional Engineers, Geologists and Geophysicists of Alberta, have made a difference in the daily lives of millions of Albertans by bringing science and innovation to life.
The P.Geol., P.Geoph., P.Eng., and R.P.T. professional designations represent the highest standards of quality, professionalism and ethics in geoscience and engineering. APEGGA Members can take pride in the role they play and the contribution they make to Alberta.
The P.Geol., P.Geoph., P.Eng., and R.P.T. professional designations represent the highest standards of quality, professionalism and ethics in geoscience and engineering. APEGGA Members can take pride in the role they play and the contribution they make to Alberta.
APEGGA and its 54,000 Members are committed to public safety and well-being through the self-regulation of the geoscience and engineering professions in Alberta.
APEGGA and its 54,000 Members are committed to public safety and well-being through the self-regulation of the geoscience and engineering professions in Alberta.
Visit www.apegga.org for more information.
Visit www.apegga.org for more information.
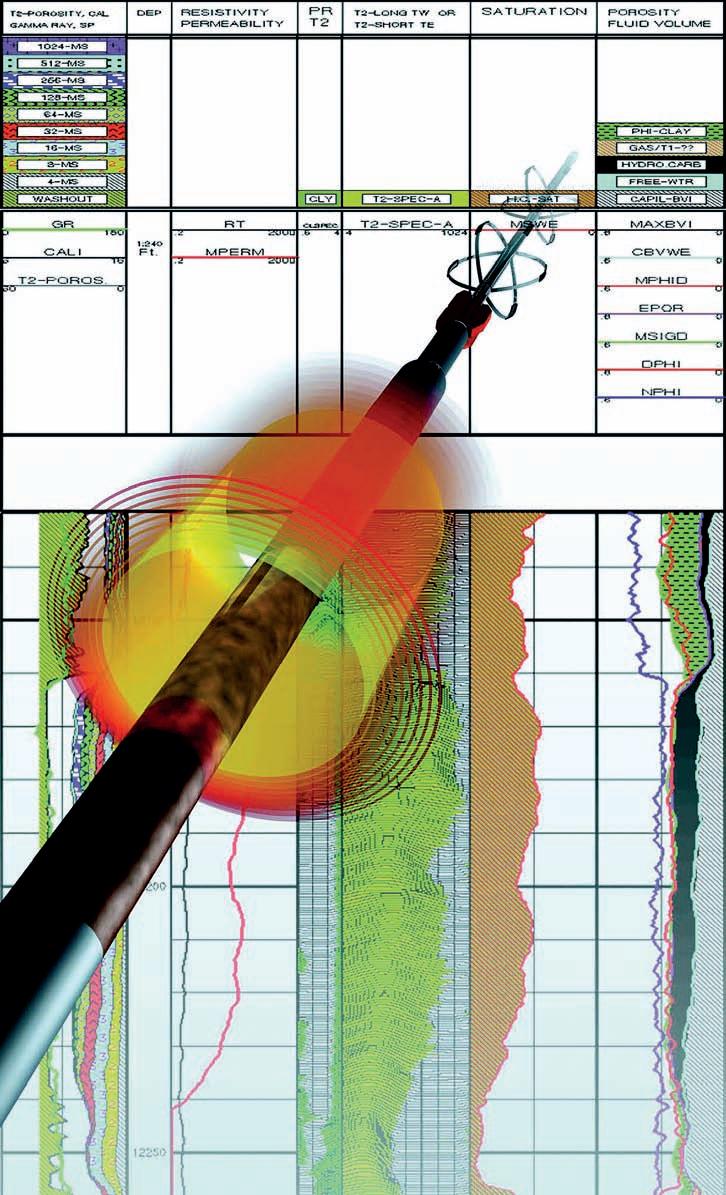
Figure 3. MRIL® Tool Illustration. Halliburton Magnetic Resonance Imaging Logging (MRIL®) tool provides a measurement using nine frequencies with simultaneous dual wait times and echo spacing. Sensitive volume is paramount in an environment dominated by low porosity. This sensitive volume is the MRIL® tool’s differentiator in a tight gas reservoir where statistics affect the measurement. Tight gas reservoirs pose many challenges to the operator, and understanding these variables results in better decisions. NMR technology in tight gas can offer an understanding of bound fluid versus moveable fluids, identification of reservoir intervals and quality, continuous permeability, and fluid identification and quantification. T1 logging answers the diffusion question that enables gas versus water identification.
(...Continued from page 15)
more accurate understanding of reservoir quality and potential. Further, the MRIL service can resolve porosity values in the 3 to 6 p.u. range as a result of the sensitive volume measurement capabilities and the strength
of the magnet increasing signal response. The continuous qualitative and quantitative permeability measurement offers reservoir indicators that will influence the testing or the completion of the well. Horizontal placement and completion can be effectively
implemented with the MRIL service, which helps identify lower water cuts, and higher porosity and permeability values. The MRIL service also helps enable fracture planning, optimizing the effectiveness of each stage reducing cost and increasing productivity.
SUMMARY
MRIL service is a technology that provides some of the crucial metrics for reservoir characterization – measurements that are unavailable from other technologies. Understanding permeability in a tight environment is essential to the producibility of the well. Porosity independent of matrix and a simultaneous T1 and T2 measurement enables better decisions that ultimately affect the bottom line. In a cost-sensitive market where investors demand results, accurate information and complete reservoir cognizance is crucial. Porosity, permeability, fluid identification, and horizontal placement are the keys to unlocking these challenging reservoirs. NMR technology has helped unlock some of the mysteries of the brain; today it is helping to unlock the potential of Canada’s tight gas reservoirs.
A BOUT THE AUTHOR
:
Bruce Keen is a business development representative for Halliburton’s Open Hole Wireline services in Canada, where he served as a member of the startup team introducing these services into Canada in 2007. Bruce has spent five years as a wireline field engineer prior to taking on a business development role. He has worked in Australia and the United States. Bruce is a Hydrogeological Engineering graduate from the Northern Alberta Institute of Technology and is currently completing a Bachelor of Science degree.
ACKNOWLEDGEMENT:
Bruce Keen would like to thank Ron Balliet, Halliburton’s MRIL® Champion, for guidance and review with this paper.
R EFERENCES
Balliet, R. 2008. NMR Technology and Applications. Halliburton Energy Services, Open Hole Petrophysics Workshop, Houston, TX.
Coates, R., Xiao, L. and Prammer, M. 1999. NMR Logging: Principles & Applications. Halliburton Energy Services, Halliburton Energy Services Publication H02308.
This article was contributed by Halliburton. CSPG thanks Halliburton for the contribution.
PRACTICAL SE qUENCE STRATIGRAPHY XIII: Sequence Boundary Hierarchy
| by Ashton Embry
INTRODUCTION
The various surfaces and units of sequence stratigraphy have been described in the previous articles of this series. It is most important that sequence stratigraphic surfaces be assigned to a hierarchy if numerous sequence stratigraphic surfaces are used for regional correlation or if individual sequences are delineated and mapped (Embry, 1993, 1995). The main reason for this is that very many sequence stratigraphic surfaces of greatly varying magnitude occur in a given
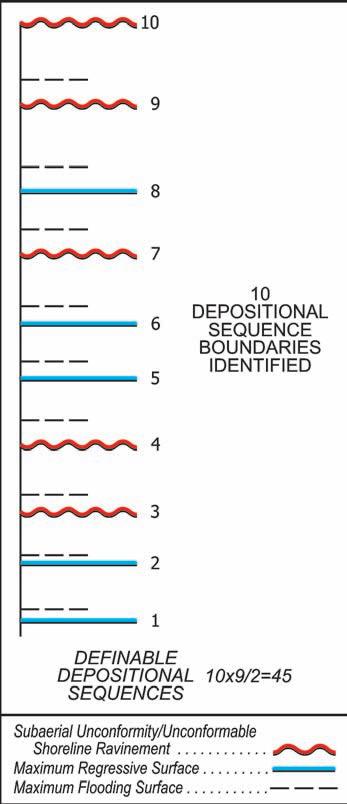
Figure 1. Because a depositional sequence is defined as a unit bound by subaerial unconformities and correlative surfaces, it is essential that a hierarchy of sequence boundaries be defined. If a hierarchical system is not used, up to 45 sequences could be defined in the above schematic succession with 10 recognized sequence boundaries (e.g., 1-2 1-3, 1-4, 1-5, etc.). Such a chaotic and unacceptable situation is avoidable only by separating the sequence boundaries into different classes (orders) and arranging them into a hierarchy.
succession and, without a hierarchy, any two recognized sequence boundaries, regardless of their magnitude, (e.g., two MFSs in the case of genetic stratigraphic sequences and any combination of two SU, SR-U, or MRSs in the case of a depositional sequence) could, in theory, be used to form the boundaries of a sequence (Figure 1). This would result in a huge number of potential sequences and the only way to escape such chaos is to establish a hierarchy of surfaces.
It is widely recognized that there is a great variation in the magnitude of sequence stratigraphic surfaces and that there is a need to separate large magnitude sequences / sequence boundaries from much smaller-scale ones. This is a natural consequence of the recognition that sequence boundaries and the enclosed sequences are not scale dependent. Notably, two very different methodologies for developing such a hierarchy of sequences and sequence boundaries have been proposed – a theoretical, model-driven method and an empirical, data-driven method.
MODEL -DRIVEN HIERARCHY
The model-driven approach has been championed by Exxon scientists (e.g., Vail et al., 1977; Mitchum and Van Wagoner,
1991; Vail et al., 1991; Posamentier and Allen, 1999). Such an approach is based on the hypothesis that sequence stratigraphic surfaces are generated by eustasy-driven, sinusoidal base-level changes and that such eustatic cycles increase in amplitude with decreasing frequency. Thus, very large amplitude changes, driven by tectono-eustasy (changes in volume of ocean basins), occur rarely and the resulting sequence boundaries are assigned to either a 1st or 2nd order category. Such orders are usually referred to as low-order boundaries although a few authors refer to such boundaries as highorder boundaries. I follow the practice of referring to 1st, 2nd and 3rd order boundaries as low-order boundaries and 4th, 5th and 6th order boundaries as high-order boundaries.
In the model-driven hierarchy, high-order boundaries are related to climate-driven, Milankovitch cycles, which drive high frequency, eustatic changes in the 20,000 year to 400,000 year band. In such a modeldriven approach, a sequence is assigned to a given order based on the amount of time represented by the sequence – that is, the amount of time which lapsed between the development of each of its bounding surfaces.
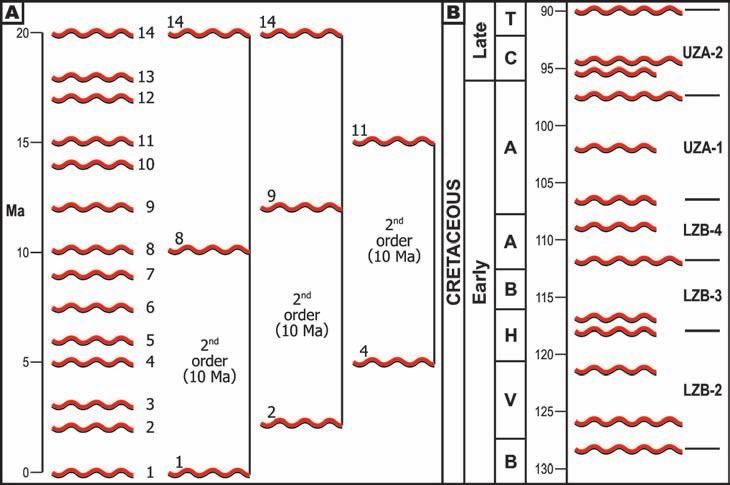
Figure 2a. A schematic diagram illustrating the faulty logic of using boundary frequency for the establishment of a sequence hierarchy. In a succession which spans 20 Ma and contains 14 sequence boundaries, many combinations of boundaries (only three shown) can be used to create second-order sequences with a 10 MA year frequency.
Figure 2b. A diagram from Haq et al. (1988) that illustrates the use of the concept of boundary frequency to define a series of second-order sequences (LZB-2, etc.). The boundaries of the second-order sequences have been subjectively selected to fit the desired result (sequences of 10 Ma duration).
This model-driven approach culminated in a publication by Vail et al. (1991) in which six orders of boundaries were defined solely on boundary frequency. The six orders and their characteristic boundary frequencies in this hierarchical scheme are:
1st order – ≥50 MA
2nd order – 3-50 MA
3rd order – 0.5-3 MA
4th order – 0.08-0.5 MA
5th order – 0.03-0.08 MA
6th order – 0.01-0.03 MA
Such a model-driven approach to establishing a hierarchy of sequences is highly prone to circular reasoning. Because any given stratigraphic section contains numerous depositional sequence boundaries (unconformities and MRSs), any desired frequency of boundary occurrence can be determined simply by selecting only the boundaries that fit the desired result. For example, if fourteen sequence boundaries were recognized within a succession spanning 20 MA, there are many combinations of boundaries that could be chosen to delineate a sequence with a boundary frequency of 10 MA (Figure 2a). As shown in Figure 2b, Haq et al. (1988) applied such a methodology for the delineation of 2nd order cycles on their global sequence charts. The boundaries of the second order cycles (sequences) on the charts have been subjectively selected to fit the desired result (sequence duration of ~ 10 MA).
The fundamental flaw of the above, modeldriven methodology is that you can’t determine the frequency of occurrence of an entity or a phenomenon until you have a clear definition of the entity or phenomenon. It simply comes down to the premise that, if one wants to determine the frequency of 2nd order sequence boundaries, one must be able to empirically recognize 2nd order boundaries in the first place. Boundary frequency is a conclusion that can be only be reached once the different orders of boundaries are defined with reasonable objectivity. Duration is not an observable characteristic of a sequence.
DATA-DRIVEN HIERARCHY
Embry (1993, 1995) advocated for the use of an empirical, data-driven methodology for establishing a hierarchy of sequence stratigraphic boundaries and enclosed units. Such an approach is based on reasonably objective scientific criteria rather than on a priori assumptions and untested hypotheses, as is the case for the model-driven approach described above.
In the data-driven approach, a hierarchy
of boundaries is established on the basis of the interpreted relative magnitude of the boundaries. The interpreted relative magnitude of a boundary would reflect the magnitude of base-level shift that generated the boundary in the first place. A baselevel change of 500 m is going to result in a relatively large magnitude sequence boundary that has different attributes than a smaller magnitude sequence boundary that was generated by a base level change of 10 m or less. In a given basin, the largest magnitude boundaries (i.e., the sequence boundaries generated by the largest interpreted base level changes) are assigned to the 1st order category in the hierarchy and the smallest magnitude boundaries recognized (i.e., those generated by the smallest interpreted base level changes) would be assigned to the highest order established (e.g., 4, 5, or 6).
To apply such a methodology, it is necessary to find observable, scientific criteria which
allow the characterization of the relative magnitude of a sequence boundary. Such criteria would reflect the magnitude of the base level change which generated the boundaries. The attributes of a sequence boundary I have found useful to estimate the relative magnitude of a sequence boundary, and indirectly the amount of base level change that generated the boundary in the first place, are listed below. Such observable characteristics are placed in order of their importance for assessing the relative magnitude of a given depositional sequence boundary with the first one being most important.
1) The degree of change of the tectonic setting across the boundary.
2) The degree of change of the depositional regime and sediment composition across the boundary.
3) The amount of section missing below
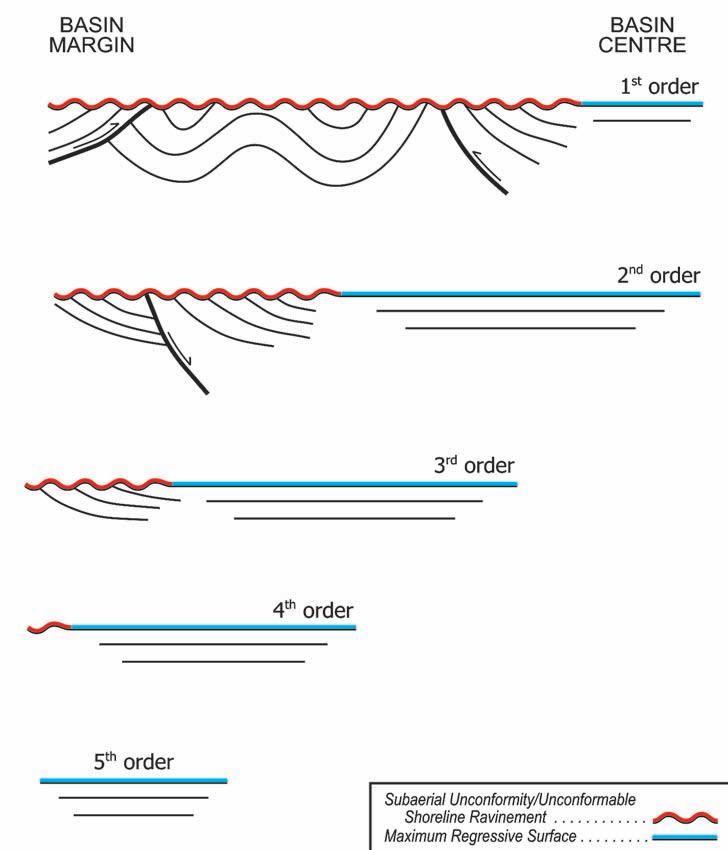
Figure 3. A schematic depiction of five orders of sequence boundaries which are determined by observable criteria, such as degree of tectonic regime change and penetration of the unconformity into the basin. The criteria needed to build such a hierarchy must reflect the amount of base level change which resulted in the formation of the sequence stratigraphic surfaces.
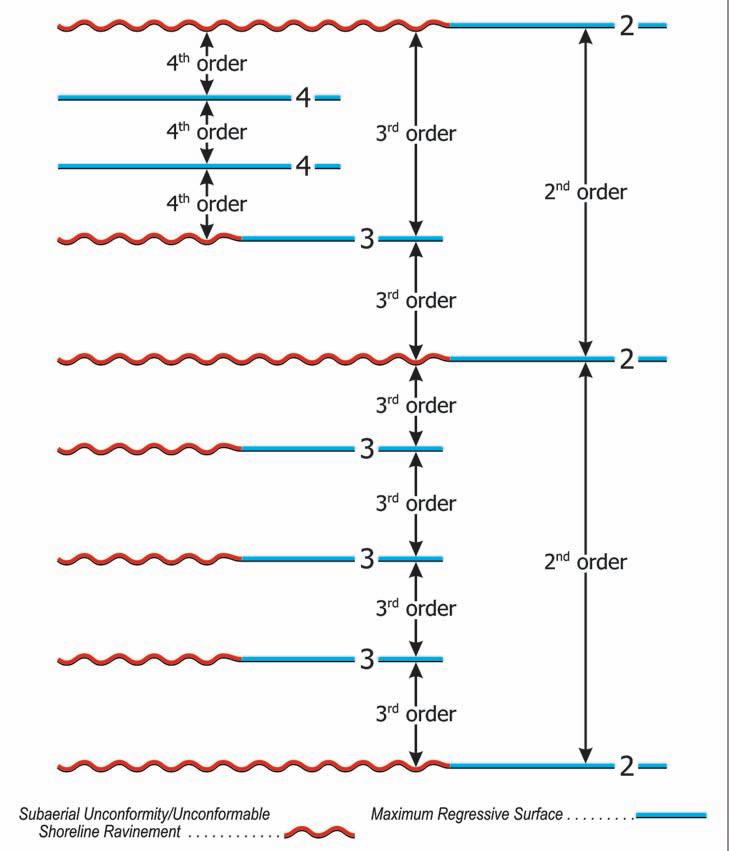
Figure 4. Principles of determining the order of a sequence based on hierarchical rules. A sequence cannot contain a sequence boundary with the same or larger magnitude (same or lower order) as its smallest magnitude (highest order) boundary. Thus a 2nd order sequence cannot contain any 1st or 2nd order boundaries. In this way the chaos illustrated in Figure 1 can be avoided.
(...Continued from page 19)
the unconformity at as many localities as possible. Localities close to the basin edge are very helpful.
4) The estimated amount of deepening at the maximum flooding surface above the sequence boundary where it is an unconformity.
5) How far the subaerial unconformity and associated shoreline facies penetrate into the basin.
It is important to note that not all these characteristics can be applied for each boundary, but in many cases most of them can be. In many instances, the largest magnitude boundaries in a basin, which would be 1st order boundaries for that basin, mark a significant change in tectonic and sedimentary regime and are associated with large amounts of erosion and significant deepening. The unconformity and shoreline facies usually penetrate far into the basin.
Such sequence boundaries are most often readily apparent and correlatable and would bound 1st order depositional sequences. Because of the tectonic and sedimentary regime changes, there is little doubt that such boundaries were generated by tectonics (Figure 3) and denote very large, base-level changes both within the basin and in the surrounding hinterlands.
2nd order boundaries also mark a change in the tectonic and depositional regimes, as well as large changes in base level. Similar to 1st order boundaries, they are mainly driven by tectonics as evidenced by the tectonic regime change across the boundary. Evidence of tectonic movements including faulting, folding, and tilting can often be discerned beneath 1st and 2nd order boundaries. 2nd order boundaries differ from 1st order ones in that the amount of baselevel change is distinctly less as evidenced by less erosion and basinward penetration of
the unconformities. Also the magnitude of tectonic regime change is significantly less. The separation of 1st order boundaries from 2nd order ones can be somewhat subjective, but in most instances the two orders can be consistently differentiated from each other within a basin.
3rd order boundaries exhibit no tectonic regime change but do have a noticeable change in sedimentary regime across them. Once again it is likely that tectonics is the main driver of 3rd order boundaries because it is very difficult to explain the noticeable change in sedimentary regime on the basis of eustasy. The amount of erosion and basin penetration of the unconformable portions of 3rd order boundaries, as well as the subsequent deepening during the following transgression, are less than that for 1st and 2nd order boundaries (Figure 3). Notably 1st, 2nd, and 3rd order boundaries can usually be correlated throughout most or all of a basin and are the main ones recognized on seismic sections.
Sequence boundaries which exhibit no change in tectonic or depositional regime, are associated with little erosion and subsequent drowning, and the unconformity and shoreline facies do not extend past the basin margin, would be high-order, low-magnitude boundaries (e.g., 4th,5th, and 6th order) (Figure 3). Parasequence boundaries would constitute the highest order, lowest magnitude boundaries in the hierarchy and they reflect little to no base level change. Correlation of these high-order boundaries is usually limited to local areas with widespread correlation being possible only if control points are close and numerous (e.g., WCSB).
For sequence boundaries generated during “Greenhouse” conditions (i.e., no continental glaciers), there tends to be a consistency for each of the five criteria to point to the same result in regards to assignment of an order to boundaries. In these cases, the magnitude of the boundary correlates closely with the basinward extent the unconformity, with the amount of section eroded and with the amount of subsequent deepening. Those large magnitude boundaries in which the unconformity extends far into the basin and for which significant erosion and subsequent drowning are present almost always have a significant change in depositional regime, if not also tectonic regime.
Problems with assignment sometimes occur for sequence boundaries formed during “Icehouse” conditions when continental glaciers were intermittently present. During such times, relatively large base level changes
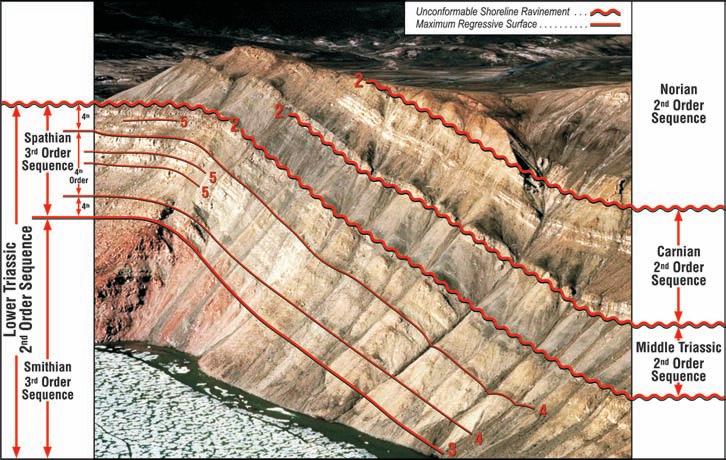
5. An outcrop of Triassic siliciclastic strata on Greely Fiord Ellesmere Island. Three 2nd order depositional sequence boundaries are present. These are unconformable shoreline ravinements across which there are major changes in tectonic and depositional regimes. Substantial erosion occurred beneath each boundary. A 3rd order boundary occurs within the Lower Triassic 2nd order sequence and 4th and 5th order boundaries (MRSs) are indicated.
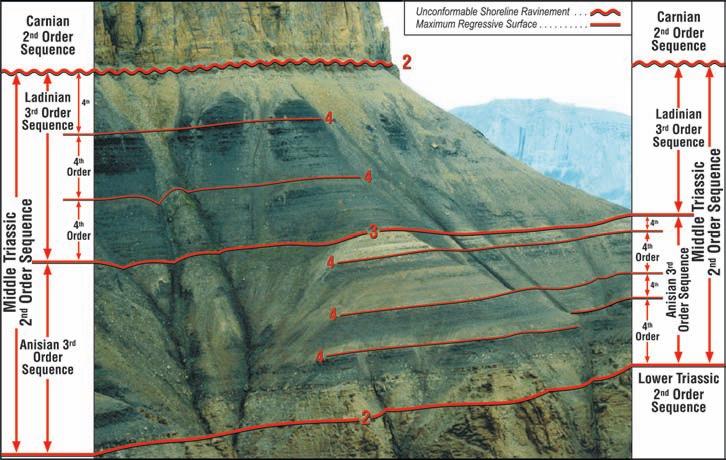
6. An outcrop of the Middle Triassic 2nd order sequence at the head of Otto Fiord, Ellesmere Island. The sequence is bound by a 2nd order boundary, a maximum regressive surface at the base, and an unconformable shoreline ravinement at the top. Once again significant changes in tectonic and depositional regimes occur across these boundaries. A prominent 3rd order boundary (MRS) occurs with this 2nd order sequence and subdivides it into two 3rd order sequences. Smaller magnitude 4th order boundaries are delineated in each 3rd order sequence. Unlike the 2nd and 3rd order boundaries, no change in depositional regime occurs across these 4th order boundaries
(up to ~ 120 m) due to climate-driven, eustatic sea level changes were often accompanied by essentially no change in depositional and tectonic regimes. In general, changes in these latter two criteria most often reflect major base-level-change episodes and should be used as the final arbiters for recognizing the greatest magnitude, low-order boundaries. Thus a boundary with a substantial amount of change of depositional regime and /or tectonic regime would be ranked higher (lower order) than one with no change in these regimes, even if it seemed that the one
with no regime change had similar properties on the basis of the last three criteria.
It must be emphasized that for each basin the interpreter must establish his or her own hierarchy based on the listed criteria. Thus there is no characteristic, generic first-order sequence boundary that can be defined. First-order boundaries in a given study are those that are interpreted to have the largest magnitude in the basin. Thus, a first-order boundary recognized in one basin may be somewhat different from a
first-order boundary recognized in another. Once a hierarchy has been established for a basin, that is, each recognized order has been assigned a specific set of characteristics, the assignment of a given boundary to a given order can involve some subjectivity but in most cases can be done with reasonable consistency and objectivity.
This methodology emphasizes the establishment of a hierarchy based on the interpreted relative magnitude of the depositional sequence boundaries. Thus, if one wants to establish a hierarchy for sequences rather than boundaries, the various sequence boundaries must be ranked first. The order of a sequence is equal to the order of its lowest magnitude (highest order) boundary. Thus a sequence with a fourthorder boundary at the base and a first-order boundary on top is a fourth-order sequence.
This brings us back to our original problem of trying to avoid a chaotic delineation of sequences in a succession with multiple sequence boundaries of varying magnitude. With the establishment of a hierarchy of sequence boundaries as described above, one simple rule of hierarchies now allows us to recognize a sensible and orderly succession of sequences. This rule states that a sequence cannot contain within it a sequence boundary that has an equal or greater magnitude (equal or lower order) than that of its lowest magnitude (highest order) boundary. For example, a second-order sequence cannot contain a second- or first-order boundary. It can contain many higher order (3rd – 6th) boundaries. This is of most importance and is the only way that an orderly delineation of sequences can be produced (Figure 4).
Figure 5 illustrates an outcrop of Lower to Upper Triassic strata on the eastern flank of the Sverdrup Basin of Arctic Canada along the north side of Greely Fiord, Ellesmere Island. Three large-magnitude, 2nd order depositional sequence boundaries are present and consist of prominent, unconformable shoreline ravinements. They separate sequences which have different tectonic and depositional regimes and they record major falls of base level followed by large rises. In various areas of the basin, tectonic tilting is present beneath these unconformities (Embry, 1991, 1997). A third-order boundary is delineated in the Lower Triassic 2nd order sequence and it separates red-weathering, fluvial strata of the Smithian 3rd order sequence from the grey-weathering, shallow marine strata of the Spathian 3rd order sequence. Fourth- and fifth-order sequence boundaries (MRSs) can be delineated in the 3rd order Spathian sequence (Figure 5).
(Continued on page 22...)
Figure
Figure
Figure 6 (page 21) illustrates an outcrop of the Middle Triassic 2nd order sequence in the Sverdrup Basin at the head of Otto Fiord on north-central Ellesmere Island. The sequence is bound by two 2nd order boundaries, a maximum regressive surface at the base and an unconformable shoreline ravinement at the top. Large base-level changes are represented by these boundaries and they are readily correlated over the entire basin. On the basin margins they are associated with tectonic tilting. Substantial changes in subsidence rate (> 5X) also occurred across both these large magnitude boundaries. A 3rd order sequence boundary (MRS) occurs within the 2nd order sequence and subdivides it into two 3rd order sequences. Both 3rd order sequences contain 4th order sequence boundaries which at this locality are maximum regressive surfaces.
Figure 7 illustrates the correlation of various orders of sequence boundaries in the Middle Triassic 2nd order sequence of the Sverdrup Basin in the subsurface of the Lougheed Island area. Notably this area is about 650 km southwest of the outcrop section of Figure 5 and the same boundaries are present. Two 2nd order unconformable shoreline ravinements bound the Middle Triassic sequence and a 3rd order unconformable shoreline ravinement occurs within it. A number of 4th order boundaries (MRSs) occur within each 3rd order sequence.
SUMMARY
It is necessary to assign the recognized sequence boundaries and other associated sequence surfaces of a basin to a hierarchy so as to allow the delineation of various orders of sequences. Such a hierarchy is best generated by the use of observable criteria that relate to the magnitude of base level change that resulted in the generation of the sequence surfaces. The largest magnitude sequence boundaries within a basin are assigned to the first order and sometimes up to six orders of boundaries can be determined.
REFERENCES
Embry, A. F. 1991. Mesozoic history of the Arctic Islands. In: Innuitian Orogen and Arctic Platform: Canada and Greenland. H.P. Trettin (ed.). Geological Survey of Canada, Geology of Canada no. 3 (also GSA, The Geology of North America, v. E), p. 369-433.
Embry, A. 1993. Transgressive-regressive (T-R) sequence analysis of the Jurassic succession of the Sverdrup Basin, Canadian Arctic Archipelago. Canadian Journal of Earth Sciences, v. 30, p. 301-320.
Embry, A. 1995. Sequence boundaries and sequence hierarchies: problems and proposals. In: Sequence stratigraphy on the northwest European margin. R.
Steel, et al. (eds.). NPF Special Publication 5, p. 1-11.
Embry, A. F. 1997. Global sequence boundaries of the Triassic and their recognition in the Western Canada Sedimentary Basin. Bulletin Canadian Petroleum Geology, v. 45, p. 415-433.
Haq, B., Hardenbol, J., and Vail, P. 1988. Mesozoic and Cenozoic chronostratigraphy and cycles of sea level change. In: Sea level changes: an integrated approach. C. Wilgus, B. S. Hastings, C. G. Kendall, H. W. Posamentier, C. A. Ross, and J. C. Van Wagoner (eds.). Society of Economic Paleontologists and Mineralogists, Special Publication 42, p. 40-45.
Mitchum, R. and Van Wagoner, J. 1991. High frequency sequences and their stacking patterns: sequence stratigraphic evidence for high frequency eustatic cycles. Sedimentary Geology, v. 70, p. 131-160.
Posamentier, H. and Allen, G. 1999. Siliciclastic sequence stratigraphy – concepts and applications. Society of Economic Paleontologists and Mineralogists Concepts in Sedimentology and Paleontology, # 7, 210 p.
Vail, P. et al. 1977. Seismic stratigraphy and global changes in sea level. In: Seismic stratigraphy: applications to hydrocarbon exploration. C. Payton (ed.). American Association of Petroleum Geologists Memoir 26, p. 49-212.
Vail, P. et al. 1991. The stratigraphic signatures of tectonics, eustasy and sedimentology – an overview. In: Cycles and events in stratigraphy, G. Einsele, et al. (eds.), Springer-Verlag, New York, p. 611-159.
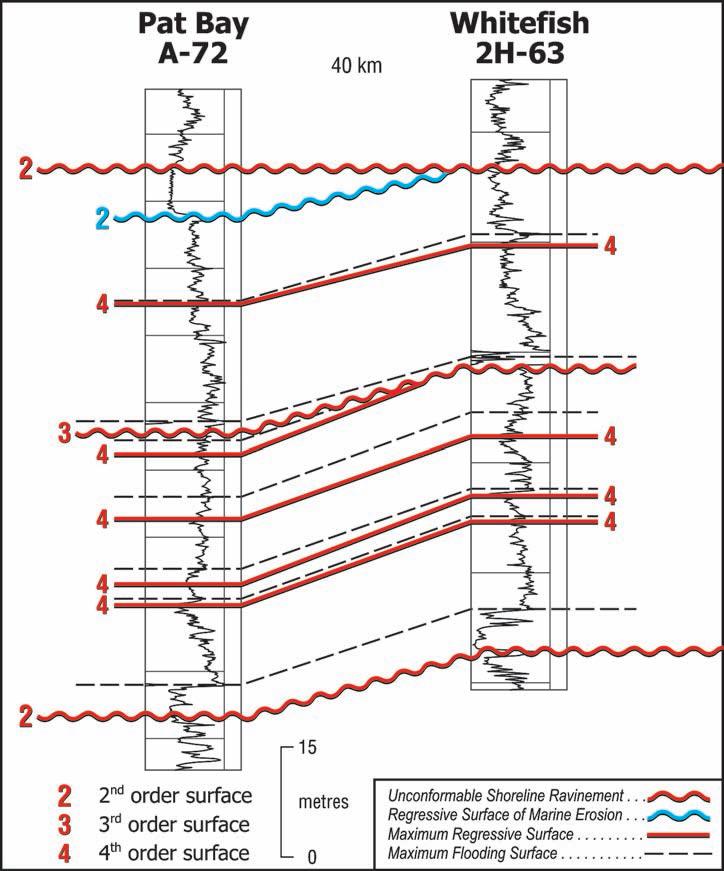
Figure 7. The 2nd order unconformable shoreline ravinements that bound the Middle Triassic 2nd order sequence are correlated between two wells in the Lougheed Island area of the western Sverdrup Basin using gamma ray logs. This is the same sequence illustrated in Figure 6 but this locality is 650 km to the southwest. The 3rd order boundary within the sequence is a significant unconformable shoreline ravinement in contrast to the maximum regressive surface which formed this same 3rd order sequence boundary on Figure 6. Tilt related truncation is apparent on this boundary indicating that tectonics was the primary driver of boundary formation. More subtle, lower magnitude, 4th order boundaries occur within both 3rd order sequences.
Superior Quality
CGGVeritas is committed to acquiring and processing superior quality data in the locations where you operate. With the highest quality data library in Canada, you’ll have access to multi-client data in the most desirable regions of Alberta and North-East British Columbia.
Count on CGGVeritas to help you explore, develop and produce with confidence. Contact:
CLIMATE CHANGE VI: Fearmongering
| by Dr. A. Neil Hutton
There is an endless litany of misinformation disseminated by those espousing human induced warming. So much so that it will not be possible to refute all of the erroneous claims within this article. The list is long: melting icecaps, retreating glaciers, rising sea level, and ocean acidification; “the spin cycle”
of more hurricanes, tornadoes, and cyclones; desertification and droughts; floods and torrential rains; animal extinction; and finally, spreading disease and death. The worst offenders in all of this are our media, (print, wireless, and visual) who happily regurgitate every sensationalized and exaggerated claim

attributed to the cause of anthropogenic global warming.(AGW) The data, if the media was alert and competent, is only a few mouse clicks away, so that, with very little effort, the facts can be easily checked. Much of the information is a matter of public record, and the vast majority of the claims can easily be discredited. The remainder is grossly exaggerated.
Perhaps one of the most egregious sources of misinformation is the Gore documentary, “An Inconvenient Truth.” Very recently, the British High Court decided that the film was unsuitable to be shown in the British Schools because of at least nine errors of fact, and the high level of misleading and exaggerated statements. Nonetheless, our public broadcaster, CBC, has this year seen fit to screen the Gore film without disclaimer or any presentation of balance to the exaggerated claims. In the plethora of misleading hype in the media, Gore’s movie hit on all of them, no fewer than 35 false or erroneous claims documented by Moncton (2007) following the High Court case.
Pick a card, any card
Improve your exploration odds with Divestco. At Divestco we want the odds to be in your favor so we have given you a whole deck of geological products and services to choose from. Divestco’s integrated offering for geological professionals gives you the ability to choose from a wide range of geological products and services to suit your unique needs. Pick as many individual cards as you want or let our experts deal you a winning hand. Call us at 403.537.9904 or email sales@divestco.com for more information.
DVT www.divestco.com
The National Geographic Magazine is a fine publication but it is equally as guilty as Gore in producing seriously misleading articles on Climate Change. An article in the June 2007 issue is a case in point. Entitled “The Big Thaw,” the article retreads all of the unwarranted claims contained in the Gore movie:
“A Global Retreat: Ice is on the run in its mountain and polar strongholds. As the ice sheets on Greenland and Antarctica shrink in the next few centuries, seas could rise 20 ft. (6.1 m). The shrinkage of mountain glaciers will dry up rivers and alter landscapes.”
The first problem is the assumption that climate should not change when in reality it is continuously cyclical, with well documented historic warm periods in which temperatures matched or significantly exceeded our current warmth. The kind of apocalyptical claims made above simply are not supported by the evidence.
Also, the cyclical advance and retreat of glaciers with climate is well documented from historical and archaeological records. It is very clear that the Earth has been in a warming cycle since the end of the Little Ice Age in the
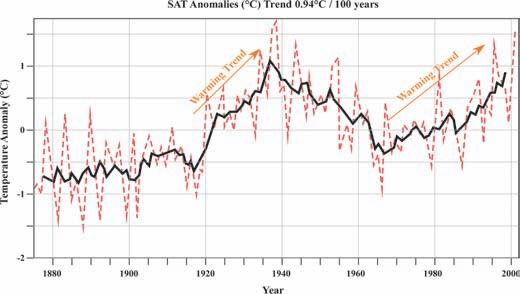
Figure 1. The bold line is the six-year running mean of Arctic temperature (after Polykov et al. 2003). The dashed line is the annual temperature. Two distinct warming periods are clearly evident from approximately 1915 to 1945 and from 1970 to 2000. Compared to the global and hemispheric temperatures, the Arctic temperature increase was stronger in the late 1930s and early 1940s than in recent decades. The warming of the 1930s occurred at a time before greenhouse gases could have caused significant warming.
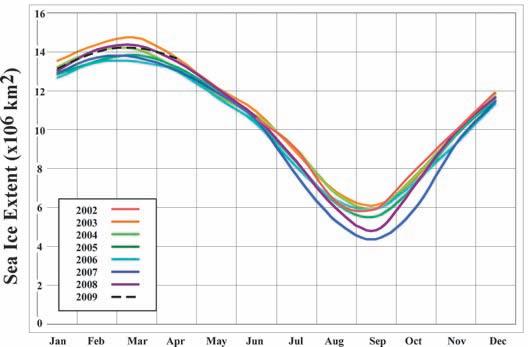
Figure 2. A graphical presentation of the areal extent of sea ice in the Arctic Ocean. The maximum this century occurred in 2003 and the minimum in 2007. The sea ice area has been increasing since 2006, and 2009 appears on trend likely to exceed all years since 2004. As of April 2009, the sea ice extent matched the levels of 2002 and 2003. (data summarized from NASA Earth Observatory)
middle of the nineteenth Century. We should expect that glaciers will retreat after 150 years of warming – this is natural and cyclical, and is well illustrated by the Schnidejoch Glacier in the Swiss Alps (Svensmark and Calder, 2007). Artifacts have been recovered in the pass as the Glacier retreats indicating that during warm periods the Schnidejoch Pass was used by travelers to cross the Swiss Alps. The earliest artifact is a birch quiver dated to the close of the Holocene Climate Optimum (4,700 years ago), and more than 300 items indicating extensive use of the pass in the Roman and Medieval Warm Periods. Warming and associated glacial retreat are natural processes and are not in themselves an indication of adverse or human-induced climate change.
The history of the Schnidejoch Glacier’s advance and retreat is replicated for glaciers throughout the world. While people are being told that they are responsible for glacial retreat, consider the dread of people in
the path of advancing glaciers during the Little Ice Age:
“The year was 1645, and the glaciers in the Alps were on the move. In Chamonix at the foot of Mont Blanc, people watched in fear as the Mer de Glace glacier advanced. In earlier years they had seen the slowly flowing ice engulf farms and crush entire villages.”
The people turned to the Bishop of Geneva for help, and, at the ice front a rite of exorcism was performed. Little by little the flow ceased and, the glacier receded. Similar dramas unfolded throughout the Alps, Scandinavia and Iceland during the late 1600s and early 1700s” (Smithsonian Archives).
Nevertheless, the hype continues. The New York Times, 19th February, 2001 edition had an article stating:
“The icecap atop Mount Kilimanjaro, which for thousands of years floated like a cool beacon over the shimmering plain of Tanzania is retreating at such a pace that it will disappear in less than fifteen years, according to new studies.”
This is a classic overstatement from the press. What the study actually showed was that between 1912 and 1953, when surveys were completed, the snow cap lost 45% of its areal extent. This snow loss occurred during a period of warming before the industrial output of CO2 could have had any significant role (Thompson et al., 2002). At this rate of loss (10% per decade) it would be fair to say that by the year 2000 the snow cap would be gone. However, the snows of Kilimanjaro remain and the rate of loss has declined considerably. Satellite
data, since 1979, indicate that the mountain temperature as recorded by accurate satellite data has declined by 0.22°C. Nevertheless, the glaciers continue to retreat. In order to maintain a glacier’s areal extent, there has to be a balance between winter precipitation such that added snow cover will equal summer melt. The decline in Kilimanjaro’s ice cap is the result of a significant decline in precipitation in the last Century, not global warming.
The Great Arctic Meltdown, as reported in the National Geographic Magazine quoted above and also in the New York Times states, “Arctic Ice is Melting at Record Levels, Scientists Say”. Of course all of this is attributed to AGW. There is abundant data to demonstrate that the reported conditions are not without precedent. Arctic temperatures were significantly warmer in the 1930s and 1940s as shown by Polykov et al. 2003 (Figure 1). Although Arctic Ice cover has been decreasing in recent decades, especially in the summer of 2006, there has been a significant rebound subsequently. It is difficult to explain this behaviour on the basis of Arctic air temperature, which has shown no significant variation in summer temperatures since 1958 (Polykov et al., 2003). A mild trend of warming has been identified in the winter but this has no effect since it is much too cold at that time for ice to melt. To achieve this rapid melt of Arctic pack ice requires changes in oceanic circulation.
Polykov and Johnson (2000) identify several oscillatory modes in Arctic Climate. The decadal Arctic Oscillation and an associated Low Frequency Oscillation with a time scale in the range of 60-80 years are both strongly linked to the North Atlantic Oscillation. These climate oscillations result in fluctuations in the thermohaline circulation between the Arctic basin and the North Atlantic with a strong impact on Arctic ice pack variability. In the winter of 2008-2009, the Arctic Ice pack returned to the same levels observed in 2001.
The threat of losing the Polar Ice Pack was raised in the Gore Film and was also made in the Third Assessment Report of IPCC, where it was claimed that there had been a 40% decline in the thickness of polar pack ice. This conclusion was based on a profile of 29 measurements taken by US Nuclear Submarines (Rothrock et al., 1999).
As it turned out, the profile, through the central Arctic, was conducted at a time when prevailing winds and ocean currents had moved the ice out of the profile areas such that the extrapolation of the limited data
(Continued on page 26...)
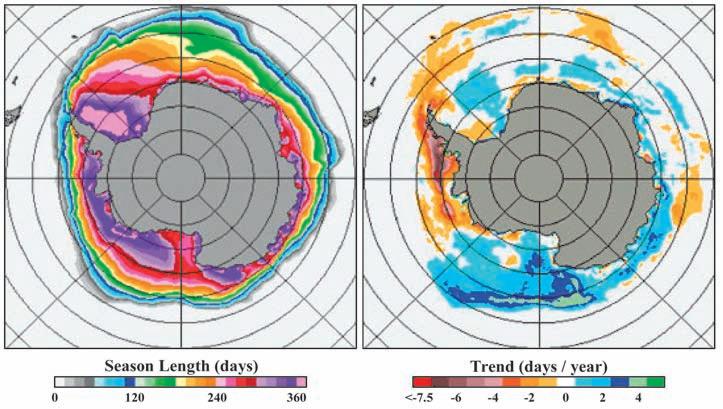
Figure 3. Figures documenting increasing sea ice around Antarctica after Parkinson (2002). The left-hand figure illustrates the length of the sea ice season for a period of 21years (1979-1999). Purple areas indicate annual cover, while light blue are limits of winter ice. The right-hand panel indicates trends where ice days are increasing (blues) and locations where they are decreasing. Parkinson points out that this is inconsistent with global warming theory.
(...Continued from page 25)
to the entire Arctic grossly exaggerated the ice loss. Subsequent research by Holloway and Su in The Journal of Climate (2002), demonstrated that because of the biased sampling the ice loss was not 40%, as trumpeted by the media, but only 15%. This remarkable recovery of the Arctic Ice mass received no media coverage whatsoever. Meantime, the Gore documentary continues to be shown – claiming a 40% ice loss. It is not stated, but implied, that this would elevate sea level. The fact is that even if the Arctic Ice disappeared entirely it would not affect sea level.
In order to change sea level, to any significant degree, it is necessary to actually melt the land-fast ice caps of Greenland and Antarctica. For both of these land masses, the temperature records show that they are not warming. A very thorough study by Hanna and Cappelin (2003) shows that the surface records in southern Greenland, potentially the most sensitive area of the Ice Cap, have been cooling since 1958, and the sea surface temperature demonstrates a similar trend. In fact, the southern coastal stations of Greenland show a drop of 1.27°C. Nevertheless, in the June 2007 National Geographic article, it is claimed that ice sheets covering Greenland are shrinking unexpectedly fast and the outlet glaciers that carry ice to the sea are accelerating. Shrinking and accelerating are contradictory terms so far as glaciers are concerned. The outflow from a glacier is not dependant on air temperature but on the accumulation of snow pack at the highest elevation of the glacier. Krabill, in 1980, indicated a thickening of up to seven feet on the Greenland ice cap and, again in 2000, with a number of coauthors,
reported that the main mass of the glacier above 6,500 feet is rising at about 0.2 inches per year. Part of this may be attributable to isostatic rebound, due to the unloading of the continental ice sheet, of which Greenland was a part. But the conclusions of Krabill and his colleagues was that the whole region has been in balance.
Glaciers flow under their gravitational load so that the flow rate is a function of the accumulation of the snow pack. If precipitation is high the glacier will accelerate but if it decreases then the glacier flow will slow. At its termination the movement of the glacier is a function of the ambient air temperature. If summer temperatures are high, and glacial advance is slow, then the glacier will retreat. If the glacier advances, it implies that the load of the snow pack at high elevations is greater than the rate of melting. Therefore, the Greenland Ice Sheet would appear to be in a healthy balance. Also, warming can have a contrary effect on an ice cap, since it may actually increase the amount of precipitation as warmer air encounters subzero temperatures of the ice cap at high elevations.
The suggestion in the National Geographic article is that, during summer melt, the high levels of surface water – temporary ponds and surface lakes – will fracture the ice and drain down through to the glacier base and lubricate its flow. The authors of this idea do not seem very familiar with the erosive power and characteristics of an active glacier. The base of a glacier is charged with rocks and debris stripped from its base and frozen into the ice mass so that it resembles a giant rasp constantly tearing, grinding, and eroding its base and the sides of the valley. Meltwater
simply can not reach the frozen base of the glacier before becoming so charged with debris and rock flour that it flows within the ice-forming internal stream deposits above the rock floor.
As glaciers retreat they leave extensive deposits of fluvio-glacial material, eskers (stream deposits), kames (internal deltas), and terminal and lateral moraines. The U-shaped valleys and the mass of these deposits is a testament to the erosive power of the glacier. The downward motion of the glacier is the result of the relentless power of gravity which comes from the elevation of the snowfield accumulation area over the exit point, which, in this case, is sea level. Moreover, the base of the glacier is a zone of permafrost extending into the underlying soil and rock. There is no potential slip or glide plane that can lubricate the glacier’s movement. The actual glacier flow velocity is still controlled by the vertical mass of ice above the glacier’s baseline. If the velocity of flow of the terminal portion of the glacier somehow exceeds the normal gravitational flow rate, it should result in a large crevasse or series of major crevasses at the transition from the natural upper glacier flow, to the so-called accelerated water-lubricated zone. This has never been reported.
The entire thrust of the claims of Greenland Ice Cap accelerated melting are advanced in order to support extremely exaggerated claims of sea level rise – 20 feet (6.1 meters) in the National Geographic article above. Greenpeace has trumpeted levels of 5-7 meters (16-23 feet), potentially correct if the entire ice sheet were to disappear, but even the IPCC do not subscribe to this level of loss. The Third Assessment Report attributes only -0.02 to 0.09 meters (-0.78 to 3.5 inches) in the next 100 years, Therefore, IPPC recognized the possibility that melting of the Greenland Ice Cap may actually reduce sea level. As Krabill’s research indicates, the ice loss on Greenland is a mere 0.13mm/ year or only 1.3 centimeters (0.5 inches) after 100 years. This is a very far cry from the Greenpeace and National Geographic exaggerated claims of 20ft (6.1m), which would require 4 millennia to achieve at present melt rates.
In Antarctica, a very similar picture exists – temperatures have been declining since the 1960s as reported by Doran (2002), Jones (1995), and Sansom (1989). Since 1979 the microwave sounder units on NASA satellites record declining temperatures. Nevertheless, Gore and others have made much exaggerated claims regarding glacial calving in blocks the size of Rhode Island from the west Antarctic Peninsula. The peninsula is
like a thumb trending northwest towards Argentina. Because of past sea level rise, the ice is anchored only on a small number of islands. It is underlain by ocean and so is less stable than the main mass of Antarctica. The west peninsula does not show the same range of cooling as east Antarctica but, as we have discussed, air temperature in itself, does not determine glacial behaviour. It is a simple matter to review the ice areal extent maps showing the ice is expanding and thickening (Figure 3). Currently, the ice mass is at record levels (see http://arctic.atmos. uiuc.edu/cryosphere/). What is the evidence for the National Geographic statement: “If vulnerable parts of the ice that blankets Greenland and Antarctica succumb, rising sea levels could flood hundreds of thousands of square miles – much of Florida, Bangladesh, the Netherlands – and displace tens of millions of people”. What credibility can be given to this extraordinary claim? The critical word is “if” but what is the real probability? The Greenland Ice Cap has survived the previous warming cycles and is still well beyond its position at the time of the Danish settlements in the Medieval Warm Period (Tkachuck, 1983, p.2). The evidence shows that Antarctica is cooling but it seems that the less evidence there is, the more shrill and exaggerated are the claims. A case in point is the fact that Michael Mann (the author of the now-discredited temperature hockey stick) and colleagues are now attempting to show, by statistical manipulation, that Antarctica is actually warming, a premise of which even other global-warming activists are skeptical.
Sea level rise is always a good subject to get people’s attention, especially with the number of heavily populated coastal cities. Aside from the hysteria of improbable sevenmeter increases, what is really known? In 1990, the IPCC predicted that man-made warming would result in an increase of 30 to 100 cm, (12 to 39 inches) but by 2001 this estimate was lowered to 9-88 cm, (3.5 to 34.6 inches) and by 2007 in the IPCC fourth assessment, given the oceans’ lack of response, was reduced to 18 and 59 cm, (7 to 23.2 inches), an approximately 50% reduction in the estimate from 1990. However, these estimates are not actually based on real observations, but on unverified model results – in other words, guesswork!
What do scientists report who actually specialize in sea level? According to these specialists there is no way to predict, scientifically, any sea level rise in the 21st Century. The International Union for Quaternary Research (INQUA) is a 75-yearold scientific organization dedicated to researching global environments and climatic changes over the last two million years.
INQUA has harshly criticized the IPCC for its handling of sea level forecasts: ignoring the scientists who produce most of the data and observations related to sea level and relying instead on unproven model results. Nils Axel Morner, who until recently was the president of INQUA’s Sea Level Commission, states that sea level shows no trend at all over the past three hundred years, and satellite telemetry shows virtually no change in the last decade. Therefore, the IPCC models are totally without scientific objectivity or relevance. According to Morner, there is no fear of any massive future flooding as claimed in most global warming scenarios.
A constant drumbeat of alarmism is maintained in the media, and once again, as an example we can turn to the National Geographic Magazine in the November, 2007 issue (The Acid Threat, p. 113). Having attempted to convince us that we will drown in a new Noah’s flood, this article suggest that by the end of the next century the oceans will be so acidic they will be devoid of life. The IPCC argue that only a trivial amount of CO2 can be dissolved in the oceans, but, on the other hand, maintain this is enough to cause a catastrophe by dissolving all the calcium carbonate in the sea! The IPCC hypothesis (Continued on page 28...)

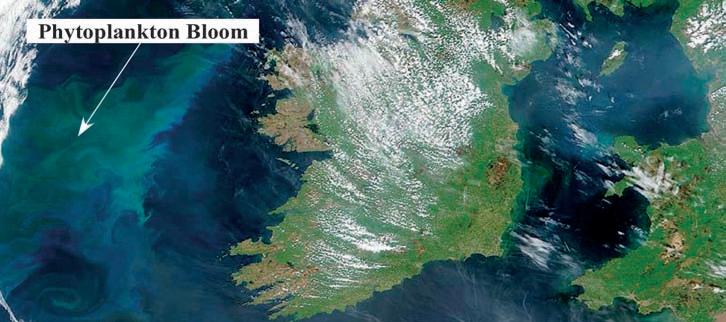
Figure 4. A major phytoplankton bloom off the west coast of Ireland covering thousands of square kilometers. It is probable that this bloom is caused by the coccolithophore, Emiliani huxleyi, one of the most prolific forms in the modern oceans. Conservative estimates suggest that coccoliths are one of the largest calcite producers in modern oceans. Very conservative estimates suggest that they contribute calcium carbonate in excess of 1.5 million tons per annum. In light of the chlorophyll distribution in the world’s oceans (Figure 5) the estimate seems very low. However, it provides another indication of the capacity of the world’s oceans to buffer CO2
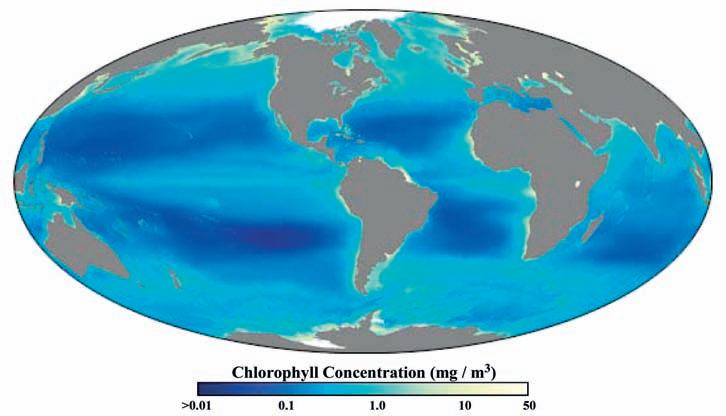
Figure 5. Contrary to the “Acid Threat” promoted in National Geographic, here is an actual observed measurement of the life in our oceans. This is an image from a satellite sensor indicating the distribution of chlorophyll in the world’s oceans. This is a measure of the distribution of phytoplankton, which use chlorophyll in the same manner as terrestrial land plants. At least half the Earth’s source of oxygen is generated by phytoplankton in the oceans, and not, as one might expect, the equatorial rain forests. Chlorophyll is shown in milligrams / cubic meter with the greatest concentrations in yellow while the deep blue indicates where nutrients are too scarce to promote phytoplankton growth, in contrast to the cold CO2 -rich polar oceans.
(...Continued from page 27)
requires very long residence times for CO2 in the atmosphere of 50-200 years, although there are numerous publications of isotopic analyses that indicate an average residence time of only 5-6 years (Segalstad, 2009).
The National Geographic article is based on pseudo-science lacking any proper comprehension of physicochemical or biochemical nature of the oceans. In a very crude experiment, ocean water was acidified by adding carbon dioxide until tiny, calcareous shells of dead copepods became corroded. This was then presented as evidence that the oceans would be totally acidified if no steps were taken to curb the emission of CO2 . The fact that this was totally without relevance to the real world’s oceans, even as illustrated in this particular issue of National
Geographic, was ignored. Warming oceans give up CO2 as it becomes less soluble, not the opposite as implied by the “Acid Threat” article. Even when the errors within the article were identified in detail, there was no response from National Geographic, nor any corrective acknowledgement. This is a classic form of censorship exerted by media generally, in which only alarmist material is presented and those of us who retain our critical faculties are ignored.
On page 109 of the November 2007 article is an absolutely superb photograph of a living pteropod. This very tiny planktonic organism appears with its calcareous shell completely surrounded by ectoplasm, the living tissue of the organism. It is within the ectoplasm that the pteropod secretes its supportive shell, not in contact with the sea water. In the
biochemistry of these organisms, the fixing of carbonate ions comes from absorption of carbonic acid. The article also illustrates the incredible biological richness of a drop of sea water, representing only a tiny fraction of the zooplankton and phytoplankton in ocean waters. The illustrations demonstrate the great abundance of cyanobacteria that, at the base of the food chain, fix carbon dioxide by photosynthesis, converting it to oxygen and sugars required to construct and nourish the organism. Even more astonishing, in the light of the “Acid Threat Article,” are satellite images of extensive coccolithophore blooms off the coast of Ireland (Figure 4). Here we have another example of the tremendous capacity of the live ocean to fix carbon dioxide and deliver the calcium carbonate to ocean sediments. Coccolithophore blooms are not rare. They are widespread in the world’s oceans and now, because of satellite imagery, we have evidence of their extent and capacity to fix CO2 . Blooms in the North Atlantic are recorded covering areas of 200,000 square miles, and this is only one of a rich variety of planktonic microorganisms which have the capacity for photosynthesis and incorporation of carbon dioxide, often in the form of carbonic acid, to construct their internal carbonate structure. A visual assessment of world photosynthesis by phytoplankton is illustrated in Figure 5 showing chlorophyll concentration in the world’s oceans.
The approach of the IPCC is to consider the oceans as if they were dealing with a beaker of lifeless brine lacking any biological or sedimentological content. The live oceans have an almost infinite buffering capacity as a result of biological and sedimentological processes. We can show that all of the calcium carbonate, as calcite or aragonite, deposited in the oceans is mediated by organic activity with an immense capacity to buffer atmospheric CO 2 . There are other extensive oceanic buffers resulting from sedimentological diagenesis which will result in the stabilization of oceanic pH. For example, anorthite felspar is typically reduced to kaolinite, releasing aqueous calcium ions available for absorption with CO 2 into exoskeletons of mollusks and crustaceans of the ocean shorefaces. In clay rich waters, CO2 is absorbed releasing silica which may result in chert diagenesis but also provides silica for the endoskeletal structure of diatoms and silicoflagellates. The former are very abundant planktonic organisms forming extensive deposits in some deep marine environments. They absorb CO 2 during photosynthesis and contribute to the very large buffering capacity of the oceans. Since the oceans have the capacity to absorb
(Continued on page 38...)
ROCK SHOP
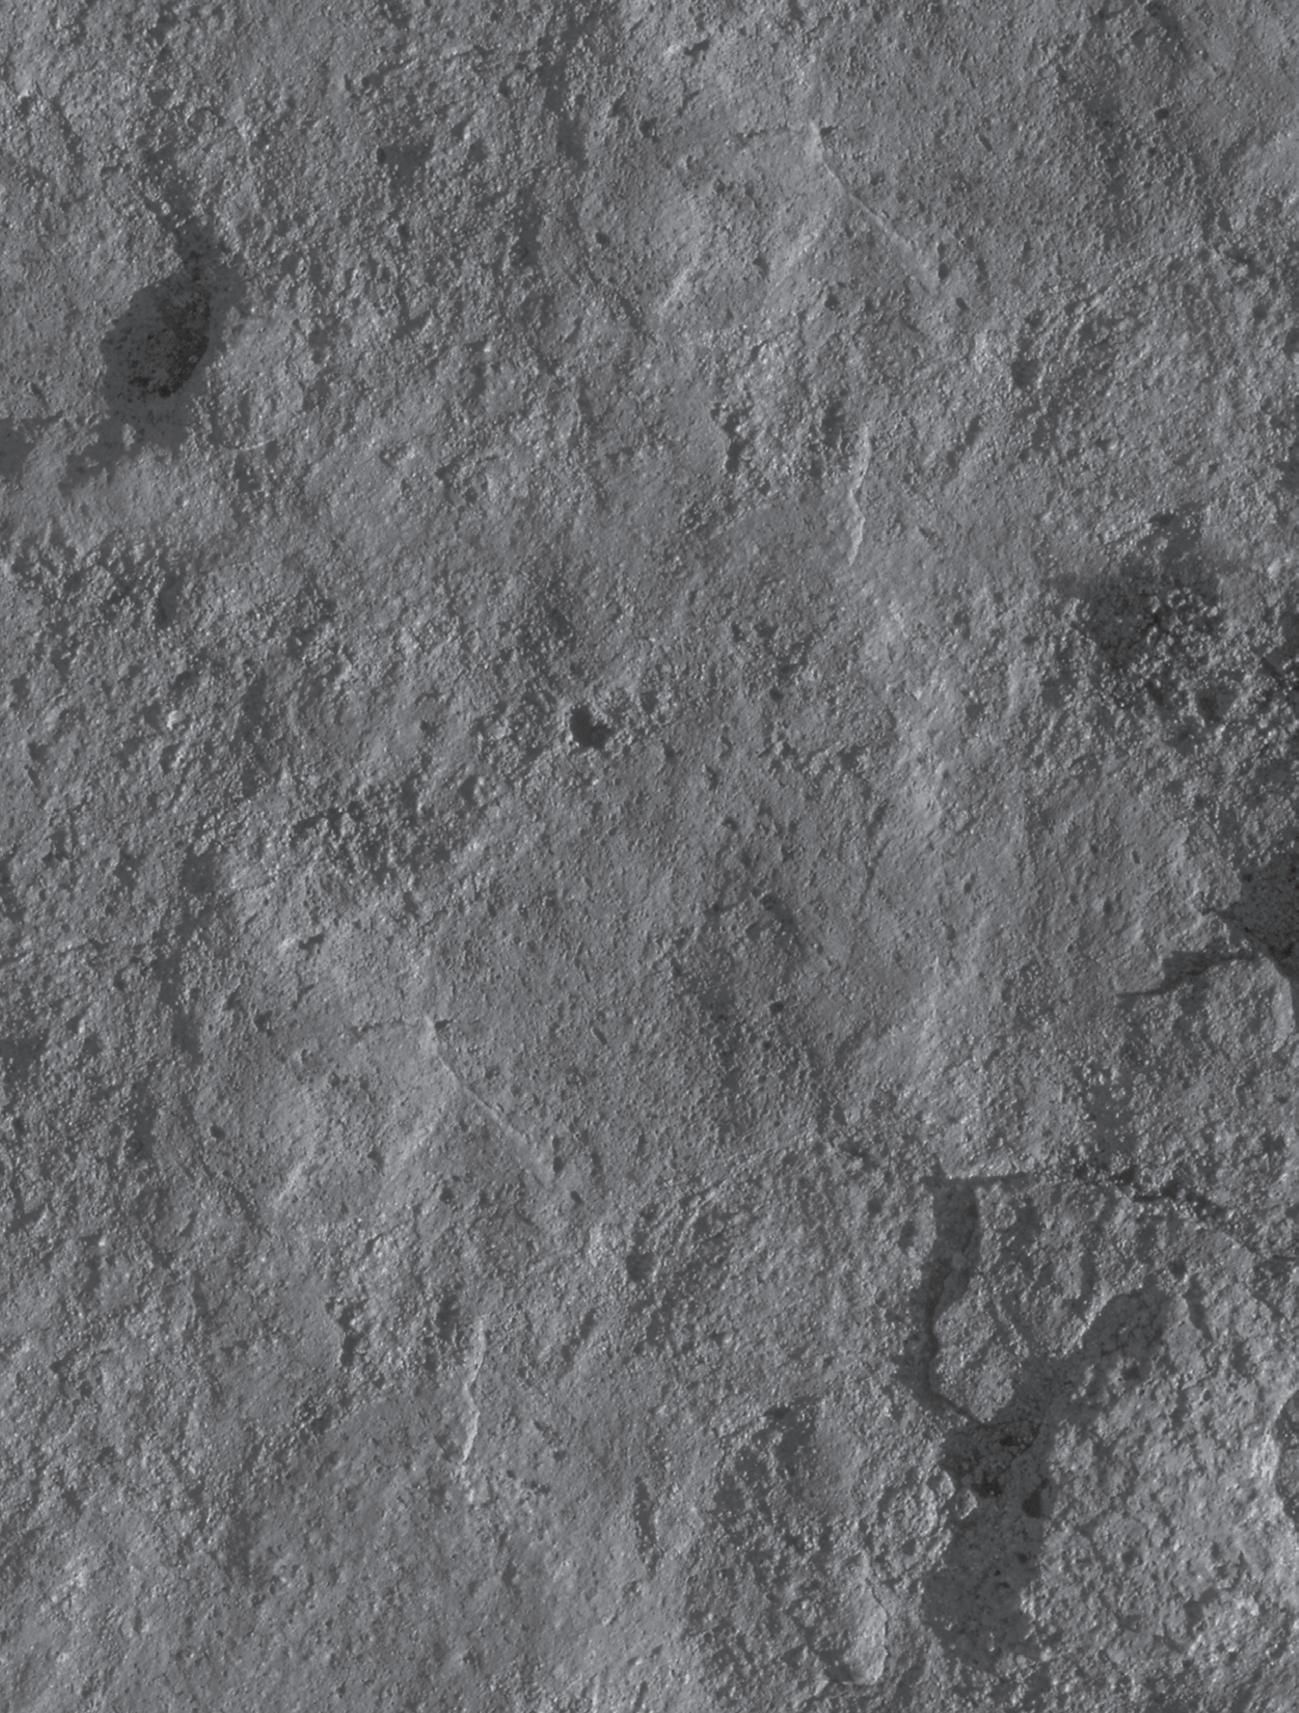


GRADUATE T HESIS AWARDS
| Sponsored by
The CSPG Graduate Thesis Awards are presented annually for the best Ph.D. and M.Sc. theses either originating from a Canadian university, regardless of project location, or dealing with a Canadian sedimentary / petroleum geology topic, regardless of university location.
CSPG gratefully acknowledges and appreciates the continued support from ARC Financial Corporation in their sponsorship of the Graduate Thesis and Undergraduate Awards programs.
GRADUATE STUDENT THESIS AWARD – Best Ph.D.
The winner of the 2008 Graduate Thesis Award – Best Ph.D. is Michael A. Cooley, for his thesis entitled “The structural, thermal, and fluid evolution of the Livingstone Range anticlinorium, and its regional significance to the Southern Alberta Foreland Thrust and Fold Belt” (supervised by Professor Ray Price at Queen’s University).
Cooley’s thesis is an investigation of outcrops in southwestern Alberta, mainly in the Livingstone Range, an area that is well known in industry circles for prolific Devonian and Mississippian gas wells. The region has a long history of coal mining, oil and gas exploration, and even some titanium mining. Part of the Livingstone Range was first mapped in 1946-1947 by R.J.W. Douglas. This famous geologist was well known for his detailed geological mapping practices and for producing remarkably advanced
structural interpretations in times when data collection was physically demanding and laborious. Like Douglas, Cooley also recognized the fault-fold relationships and distinctive chevron-style, flexural-slip thrust-propagation folds. However, Cooley found that these folds contain unusual sinuous axial planes that resulted from out-of-sequence thrusting along trailing, bedding parallel faults. Those industry workers involved in horizontal wells in folded carbonate reservoirs would be well advised to consider these fold-solution possibilities in the subsurface. Cooley illustrates these folds nicely in a series of structural cross- sections and detailed geological maps.
While collecting regional structural data, Cooley also recognized the occurrence of many carbonate-filled fractures, some of which are associated with tear faults. The geochemistry of the vein calcite and dolomite suggests a pre-thrusting, deep basement origin for carbonate emplacement. Cooley speculates that the early fractures could have developed along preexisting basement faults, related in some way to the “Vulcan Low,” a regional magnetic anomaly in southwestern Alberta. Basement-derived hot fluids then moved along the fracture/fault-enhanced permeability pathways, emplacing base metals, calcite, dolomite, and bitumen. Early fractures appear to have become active again during contraction deformation and now form transverse structural discontinuities within the fold belt. The occurrence and predictability
of the transverse structural-diagenetic features have implications for carbonate reservoir development in many parts of the overthrust belt.
GRADUATE STUDENT THESIS
AWARD – Best M.Sc.
The winner of the 2008 Graduate Thesis Award – Best M.Sc. is Aaron J. Desroches for his thesis entitled “Integrated Ichnology, sedimentology and stratigraphy of the lower Falher Member, Spirit River Formation, northeastern British Columbia and central Alberta” (supervised by Professor James MacEachern at Simon Fraser University).
Desroches’ work is one of a series of CSPG award-winning theses on basincentered gas accumulations in the British Columbia-Alberta border area. He studied 40 cores and over 200 geophysical well logs and integrated ichnology, sedimentology, and stratigraphic analyses in order to complete a comprehensive study of the lower Falher Member. Desroches divided the lower Falher Member into 11 facies and six recurring facies associations. These rock types were deposited in wave- and storm-dominated strandplain and contemporaneous deltaic settings. The recognition of distinct, yet subtle, sedimentological and ichnological features in each facies or facies assemblages is an essential part of any exploration model, particularly in the search for elusive deltaic reservoir conglomerates. Desroches’ thesis is an excellent synthesis of subsurface core and well log data, and it is very well written and illustrated. The study will be of great interest to the CSPG membership, since it encompasses several important producing pools, including Hiding Creek, Wapiti, Elmworth, and Gold Creek.
GRADUATE STUDENT THESIS
AWARDS – Ph.D. Honorable Mentions
Two honorable mentions were given in the Ph.D. category to Xavier RocaArgemi (University of Western Ontario, supervised by Professor Guy Plint) for his thesis entitled “Tectonic and eustatic controls on the allostratigraphy and depositional environments of the lower Colorado Group (upper Albian) central
foothills and adjacent plains of Alberta, Western Canada Foreland Basin” and to Daniel J. K. Ross (University of British Columbia, supervised by Professor Marc Bustin) for his thesis entitled “Investigation into the importance of geochemical and pore structure heterogeneities for shale gas reservoir evaluation.”
Roca-Argemia’s regional stratigraphic study builds on earlier work of Jessica Krawetz (née Rylaarsdam), the winner of last year’s M.Sc. Thesis Award. His study area encompasses the overthrust belt and western part of the undeformed basin in British Columbia and Alberta, an area which has been burdened by a somewhat confusing stratigraphic nomenclatural scheme. A large dataset was used to establish new chronostratigraphic, allostratigraphic, and depositional interpretations for the lower Colorado Group, including the Viking and Paddy/Cadotte formations. Roca-Argemia used 161 cores and 34 outcrop sections to support detailed paleo-environmental and paleogeographic interpretations. In addition, an extensive cross-section grid, comprising 50 well/outcrop sections, was used to delineate problematic stratigraphic relationships. Further interpretations on
tectonism and eustacy are supported by numerous allomember ispach maps. His research is a substantial contribution to the regional understanding of the lower Colorado Group in a structurally complicated part of the basin. Anyone working in this area would certainly benefit from reading Roca-Argemia’s well illustrated work.
Ross’ thesis focuses on Jurassic, Mississippian and Devonian shales of the Western Canada Sedimentary Basin. It is timely research that adds considerable analytical detail to potential shale gas exploration targets. Key findings documented in this thesis show that shale pore structure is a function of organic content, mineralogy, and thermal maturation, and that methane sorption capacity increases with increasing total organic content (TOC). The sampled Mississippian and Devonian shales are shown to adsorb more gas on a weight percent TOC basis than do Jurassic shales, possibly making them attractive exploration targets. Quartz-rich Devonian shales display tight-rock characteristics, small median pore diameters, and low permeability. This suggests the need for detailed study in order to optimize hydraulic
fracture design to enhanced commercial gas production. Shale gas explorationists will find the subsurface geochemical data, adsorption capacity measurements, mineralogy content, and rock property data very useful. In addition, the data may supplement an existing, costly in-house shale sampling and analysis program.
The full Graduate Thesis Award citations appear in the March 2009 issue of the Bulletin of Canadian Petroleum Geology.
Many thanks are extended to all the members of the Graduate Thesis Awards committee for their dedication and time in otherwise very busy schedules. Also thanks are extended ConocoPhillips Canada and ARC Financial for their financial support.
The committee is always looking for members interested in reading and judging theses. Participation provides members with an opportunity to keep up to date with current university research. If you are interested in serving on next year’s committee, please contact Andre Chow (andre.chow@pengrowth.com) for additional details.
CANADIAN SOCIETY OF PETROLEUM GEOLOGY CALL FOR NOMINATIONS 2010 EXECUTIVE COMMITTEE
In accordance with Article VI, subparagraph (a) of the By-Laws, the Nominating Committee hereby calls for Nominations to Stand for Election to the 2010 Executive Committee of the Canadian Society of Petroleum Geologists .
Nominations can be made in two ways:
1) Formal Nominations are to be made in writing, signed by at least twenty-five members in good standing and endorsed by the nominee who is consenting to stand for office Candidates nominated in this fashion will automatically be added to the Nomination Slate . Nominations should be forwarded to the CSPG office by September 11, 2009. The slate of candidates will be published in the November Reservoir and the election will take place on December 9, 2009.
2) Informal Nominations can be made via email or letter; please confirm that the nominee is willing to stand for the office of choice and send to CSPG Office to the attention of the Past President. Candidates nominated in this fashion will be considered for addition to the Nomination Slate by the Nominations Committee.
The following vacancies exist for 2010:
• Vice President
• Assistant Services Director• Assistant Communications Director
• Assistant Finance Director• Assistant Outreach Director• Communications Director
• Assistant Program Director
Successful candidates for the Directorships will serve two-year terms and the elected Vice President, a third one-year term as Past President. Interested parties should contact the office for details and general requirements of service on the Executive.
E VENTS ASSOCIATED WITH THE 100TH A NNIVERSARY of the Discovery of the Burgess Shale Fauna
| by Philip Benham and Randle Robertson
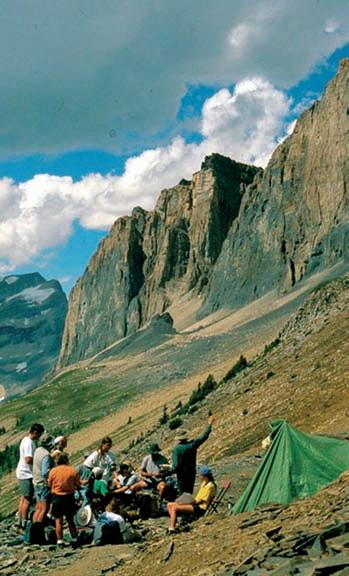
2009 is an auspicious year for paleontology. Not only is it the 200th anniversary of the birth of Charles Darwin, but it is also the 100th anniversary of the discovery of the Burgess Shale Fauna. In late summer of 1909, Charles Walcott encountered amazingly preserved Cambrian fossils near Burgess Pass in what is now Yoho National Park. The site is important for its preservation of soft parts, diversity of species, and its occurrence so early in the Phanerozoic. The five-eyed Opabinia, truly bizarre Hallucigenia, and the top predator of the Cambrian seas, Anomalocaris, are now all part of the science and lore associated with the Burgess Shale. They and well over a hundred other genera give us an early picture into the development of metazoan lineages.
In 1981 The Burgess Shale was designated as a UNESCO World Heritage Site in 1981, and three years later was integrated into the Canadian Rocky Mountain Parks UNESCO World Heritage Site. The anniversary of
the Burgess Shale discovery gives us an opportunity not only to celebrate scientific discovery but also engage the public.
In the hundred years since Walcott first stumbled upon the imprint of Marella splendens, what is the state of earth science in our high school programs? Sadly, the junior and senior school curricula are nearly void of any geology / earth science. The students are not aware of what career choices or what programs are available to them at the post secondary levels of study. This comes at a time when the leaders of tomorrow will be faced with maintaining adequate petroleum and mineral resources, sources of water, dealing with climate change, clean air issues, and population growth. Earth sciences will be required more than ever to help resolve these problems.
For many years now, the responsibility for providing public access to the Burgess Shale has fallen to the not-for-profit society known as Burgess Shale Geoscience Foundation. Each summer and early fall, hikers make the pilgrimage to the fossil site in the capable hands of volunteers (most of them CSPG members) who focus on providing a safe and informative adventure. Besides administering the educational hikes, the mandate of Foundation is to: integrate earth sciences into the curricula from kindergarten to grade 12; and to interest high school students in pursuing post-secondary studies in the earth sciences.
With this in mind, and on the occasion of the multiple anniversaries, the Burgess Shale Geoscience Foundation has organized a number of events focused on promoting science to the general public. Participate, volunteer, get the word out. Let’s put Earth back in the sciences.
R
EGULAR E VENTS:
Educational Hikes: Burgess Shale, Mount Stephen Trilobite Beds. Climate Change / Iceline Trail. Weather permitting, hikes begin in late June and last into mid September. Spots are limited and fill up very quickly.
The tenth annual Earth Science Professional Development Workshop for High School
Teachers (August 15-20th).
SPECIAL EVENTS:
July 14th Centennial Kickoff event: “The Fossil and the Astronaut” by Dr. Roberta Bondar at the Calgary Telus Convention Centre.
June 30th to September 14th: Chautauqua series; paired science talks and hikes. The nineteen lecture topics range from the Galapagos finches to a geologist’s bicycle tour of Iceland.
Geo-Paleo Art for Families on July 22nd: Canmore Geoscience Centre, Alberta and July 23rd Field Elementary School, July 26th Community Spirit Square in Golden, B.C.
August 3-7th Presentations on the Life of Mary Vaux and Charles Doolittle Walcott by Henry Vaux in Field, Golden, and Canmore.
August 21st Geological Survey of Canada Re-union. Field Elementary School.
September 4-5th; Centennial reenactment of Walcott’s ride by horse to the site of the quarry. BBQ, dance, and silent auction to follow.
For more information and a schedule of these events please visit http://burgessshale.bc.ca/.
We would also like to mention the International Conference on the Cambrian Explosion, to be held in Banff August 3-8th, 2009. Many of the top researchers will be attending and presenting at this event. For more information on this event visit: http:// burgess-shale.info/.
Philip Benham is CSPG Paleontology Division Chair and an active volunteer for the Burgess Shale Geoscience Foundation (BSGF). He codesigned and helps lead the annual Earth Science Professional Development Workshop for High School Teachers, which is run by the BSGF. Randle Robertson is director of the Burgess Shale Geoscience Foundation.
A view of the Burgess Shale quarry site with a scenic background. The photographer is Wally Randall and the image is owned by The Burgess Shale Geoscience Foundation.
APEGGA HONORARY L IFE M EMBERSHIP AWARD
| This is a reprint from the APEGGA Annual Conference Summit Awards ® Gala book
The Council may confer Honorary Life Membership in APEGGA upon any Professional Member who has rendered eminent service to the Association.
Dr. Gordon Williams, P.Geol., has been a leader in the geoscience community and a key player in APEGGA’s regulatory functions. He was born and raised in a farming community in southwestern Manitoba, obtaining his B.Sc. from Brandon College (University of Manitoba) in 1955 and his Ph.D. in geology in 1960 from the University of Alberta.
Over the course of his career, Dr. Williams has been active in the advancement of the profession and its future professionals. He taught geology and served as chair of the Geology Department at the University of Alberta. Dr. Williams also taught at the University of Queensland in Australia, served as dean of science and technology at Mount Royal College, and now operates his own consulting company.
Dr. Williams has been employed by oil companies in western Canada and has worked on oil and gas, oil sands, oil shale, and
coal projects in Alberta, British Columbia, Manitoba, the Northwest Territories, and Saskatchewan. Dr. Williams is currently a sessional instructor in petroleum land management in the Haskayne School of Business at the University of Calgary.
Dr. Williams has been an active APEGGA volunteer for more than 30 years. He played a pivotal role in establishing the Canadian Council of Professional Geoscientists (CCPG), is an honorary member and past-president of the Canadian Society of Petroleum Geologists (CSPG), and a distinguished fellow of the Geological Association of Canada (GAC). Dr. Williams has been recognized by receiving APEGGA’s L.C. Charlesworth Professional Service Award, CCPG’s first-ever Canadian Professional Geoscientist Award, GAC’s J. Willis Ambrose Medal, and CSPG’s President’s Award.
APEGGA’S L.C. CHARLESWORTH PROFESSIONAL SERVICE AWARD
| This is a reprint from the APEGGA Annual Conference Summit Awards ® Gala book
Dr. Ian A. McIlreath, P.Geol., has devoted more than 30 years of his career to active participation in Canada’s leading earth science organizations. He has made, and continues to make, truly outstanding contributions to the field of geology on both a national and international level. He has served on many
executive committees and boards, he has chaired and led numerous major committees and has been an active member on many more, including international organizations. Dr. McIlreath’s work with the Canadian Society of Petroleum Geologists (CSPG) and the Canadian geoscience community, particularly the Geological Association of Canada (GAC), has made a significant and positive impact. He received his Ph.D. from the University of Calgary in 1977, following an M.Sc. and a B.Sc. in Engineering Geological Sciences from Queen’s University.
After completing his Ph.D., Dr. McIlreath joined Shell Canada as an exploration geologist for three years. Subsequently, he has held various technical and discipline lead, as well as management, positions at Petro-Canada, Agat, PanCanadian, and EnCana. In January, 2009 he joined Talisman Energy as manager geoscience discipline in the Exploration and Technology and Geoscience department.
His commitment to his profession is evidenced by his many impressive
accomplishments. Dr. McIlreath had the honour of being the youngest CSPG president when he held that office in 1983. He is the only person to have served as the president of both the CSPG and the Geological Association of Canada, and he also served as president of the Canadian Geological Foundation. Dr. McIlreath was the General Chairman of GeoCanada 2000, Canada’s first national earth science meeting. He is currently the General Chairman of GeoCanada 2010, the second summit. For his contributions to the profession, Dr. McIlreath has received numerous honours and awards.
A mentor, teacher, researcher, editor, author, and critical reviewer, Dr. McIlreath has also served the broader community having sat as a board member on the Alberta Science and Technology Leadership Awards Foundation, the Burgess Shale Foundation, and the University of Calgary Senate. He currently sits on the Board of Trustees of the Canadian Science and Technology Museum Corporation in Ottawa.
Dr. Gordon Williams on the right, receiving his award from John McLeod, past president of APEGGA.
Dr. Ian McIIreath (right) receiving his award from former APEGGA President Dr. Gordon Williams at the 2009 APEGGA Summit Awards.
THANK YOU to Our Volunteers
Thank you to all the volunteers on the Organizing Committee who made the 2009 CSPG CSEG CWLS Convention a success!
General Co-Chairs
Mike Cecile CSPG
Mike Jones CSEG
Dave Greenwood CWLS
Organizing Committee
Kevin Root Technical Program
Rob Vestrum Technical Program
Satyaki Ray Technical Program
Darren Aldridge Finance Chair
Flo Reynolds Exhibits Chair
Victor Irwin Exhibits Committee
Craig van Dongen Exhibits Committee
Wade Whitlow Exhibits Committee
Randy Smith Exhibits Committee
Chris McGregor Exhibits Committee
Terry McCoy Sponsorship Chair
Organizing Committee (...continued)
Fiona MacDonald Publications Chair
Laura Brick Special Events Chair
Lyndsey Nicholas Volunteer Coordinator
Travis Hobbs Short Courses & Field Trips
Debbie Legaspi Short Courses & Field Trips
Alexi Belonogov Short Courses & Field Trips
Julia Baumeister Short Courses & Field Trips
Nicole Lehocky Short Courses & Field Trips
Andy Anderson Short Courses & Field Trips
Blair Neil Short Courses & Field Trips
Jennifer Leslie-Panek Short Courses & Field Trips
Petra Buziak Short Courses & Field Trips
Dara Welch Posters
Dave Clyde Logistics
Gary Taylor Judging & Awards
Sarah Cutten Judging & Awards
Darren Singleton Core Conference
Norm Cooper Core Conference
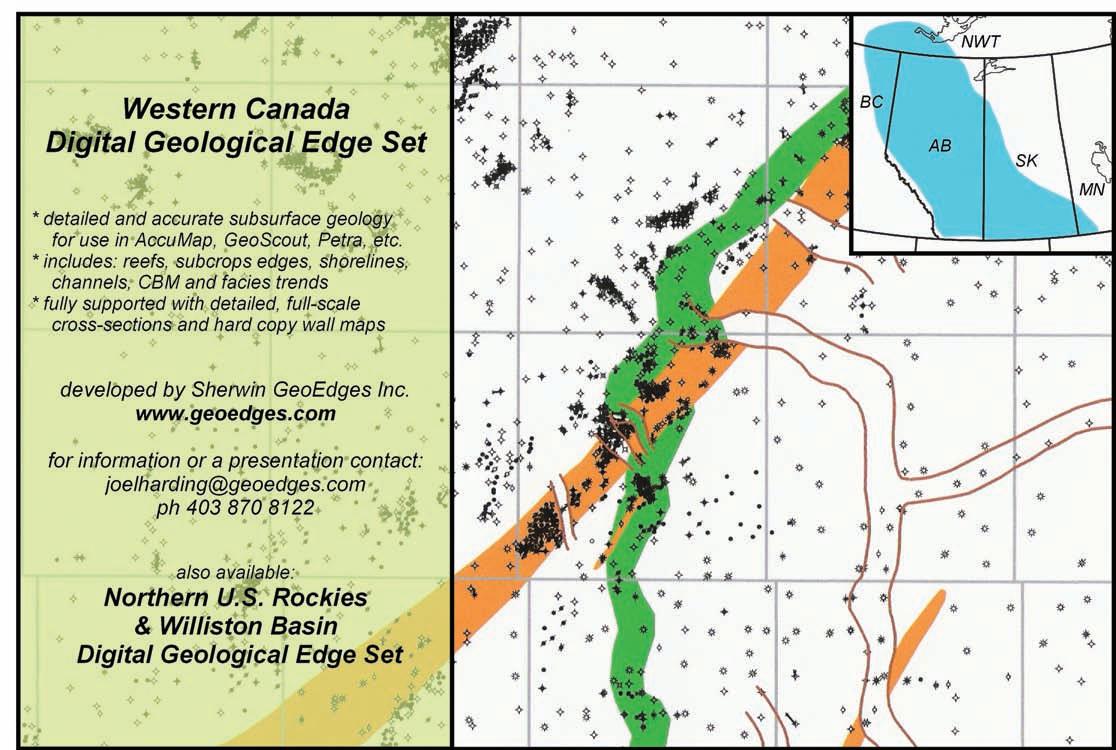
CONNECTING I NDUSTRY PROFESSIONALS with University Students across Canada
| by Chad Glemser
Lecture tours organized by CSPG’s University Outreach Committee attempt to bring oil and gas industry professionals together with university students to talk about careers in the petroleum industry and the many technical challenges that face us everyday. This year CSPG’s University Outreach Committee was proud to send out six lecturers to visit various universities across Canada to present their work to students and faculty. The University Outreach Committee expresses their sincere appreciation and thanks to all universities involved with hosting the lecturers on tour this year.
In the fall of 2008 two lecturers, Marianne Molgat, a geologist with Talisman Energy in Calgary, and Bill Martindale, a geologist with Petro-Canada, traveled east to talk to students in Ontario and Quebec. Molgat’s talk, entitled “The Petroleum Industry in Ontario: History, Reservoir Geology and Geologists” provided an excellent overview of the petroleum industry in Ontario, its reservoir geology, and recent technological advances that allow geoscientists to more accurately and correctly identify hydrocarbons. Molgat’s lecture tour was appropriately focused towards Ontario universities, where she visited the University of Toronto, Lakehead University, and Laurentian University. Molgat also provided a first-hand account of the daily activities of a geologist in the petroleum industry, the diversity of their work, as well as training and cross-training opportunities. Bill Martindale traveled to Waterloo, Queen’s University, Carlton University, University of Ottawa, McGill, and western universities.
The winter lecture tours featured Dr. Michael Rygel, Assistant Professor at the State University of New York, College at Potsdam; Scott Rayner, a senior consultant at Matrix Solutions Inc.; Terrence Lukie, a senior sedimentologist with Talisman Energy; and Alex J. MacNeil, a geologist with Imperial Oil Ltd. in Calgary. Dr. Rygel’s lecture, entitled “The Magnitude of Late Paleozoic Glacioeustatic Fluctuations: A Synthesis” provided a comprehensive literature review of over 100 published papers showing that the magnitude of eustatic fluctuations varied throughout the Carboniferous and Permian and that at least eight distinct phases can be recognized. The University Outreach Committee was pleased to have Dr. Rygel, the 2006 CSPG Ph.D. Thesis Award winner,
present to students and faculty at the universities of Windsor, Western Ontario, Waterloo, Laurentian, Ottawa, and Carleton.
Scott Rayner’s lecture about “Quaternary and Tertiary Period Buried Bedrock Channels in Alberta’s Athabasca Oil Sands Region; Implications to the regional hydrogeology and in-situ oil sands project’s groundwater supply” provided an excellent example of a hydrogeological case study, incorporating Quaternary, Tertiary, and Cretaceous geological, hydraulic head, and groundwater chemistry mapping that displayed the implications of source well deliverability and source water chemistry to an in-situ oil sands project’s water supply. Students and faculty at Dalhousie, St. Francis Xavier, and Acadia universities were treated to an informative talk displaying these practical implications.
In March 2009, Terrence Lukie toured five western Canadian universities (University of Manitoba, University of Regina, University of Saskatchewan, University of Victoria, and Simon Fraser University) while Alex J. MacNeil headed east to Ontario and Quebec to lecture at McMaster, Queen’s, and McGill. Lukie’s talk, entitled “The Ups and Downs of Horizontal Drilling in the Alberta Foothills” provided an excellent introduction to students and faculty about the many technical, environmental, and regulatory challenges of drilling gas wells in the Alberta foothills. Lukie’s lecture “was the single most effective and best talk I have ever seen on introducing geoscience students to the petroleum industry” stated William Last, Professor of the University of Manitoba.
While Lukie was lecturing in the west, MacNeil talked with students about his Ph.D. work on “New Insight to Controls on the Nature of Devonian Reefs – Contributions from the Upper Devonian Alexandra Reef System” for which he was the 2007 recipient of the CSPG Ph.D. Graduate Thesis Award. MacNeil’s lecture was very well received by both students and faculty, attracting upwards of 80 students and faculty at all three universities and inspired many students to become CSPG student members.
The CSPG Lecture Tours provide an excellent way for students and faculty to learn about CSPG and its many benefits for both undergraduate and graduate
students, exciting careers in the petroleum industry and, most importantly, a great way for students to network with industry professionals. In addition to the Lecture Tours, the University Outreach program offers many other benefits to university students through Student Chapters, student memberships, field trips, and student awards. The Lecture Tours provide a great way to promote these benefits.
With the many impressive lectures given this year and in the past, the University Outreach Committee is always looking for enthusiastic individuals with new and creative lecture ideas to bring to aspiring undergraduate and graduate students across Canada. If you, or someone you know, have an idea for a talk you would like to give on any aspect of petroleum geology, please feel free to contact either Chad Glemser (C.Glemser@ shell.com) or Tracy Allen (Tracy_Allen@ nexeninc.com).
CSPG Hot tiP
Did you know that CSPG Members have access to the online CSPG Member Directory? You can search for a fellow member’s contact information either by their name, company or CSPG member ID. To use this resource, visit the Members Only section of the website by selecting “Member Login” in the top right corner at www.cspg.org.
www.cspg.org
Canadian Society of Petroleum Geologists
20th ANNUAL MIXED GOLF TOURNAMENT
FRIDAY, AUGUST 28, 2009 - LYNX RIDGE GOLF CLUB
Format: Modied Texas Scramble, shotgun start at 8:00 am. Teams will be assigned according to handicap or average score. This is a fun tournament open to both men and women. Registration includes a Continental Breakfast, Dinner, Green Fees and Power Carts.
Registration Deadline August 7, 2009 (Priority will be given to CSPG Members). CSPG Members: Register online at http://www.cspg.org/events/events-social-golf.cfm. Non-Members and Guests: Mail or fax your form to CSPG’s ofce (contact information below).
� CSPG - Member #
Name:
Company:
Address:
Phone (daytime):
Email:
� Male � Female
Guest Name:
� Male � Female
� Non Member
Phone / Cell (evening):
Club Handicap or average 18 hole score:
(One guest allowed per CSPG Member)
Club Handicap or average 18 hole score:
Please note: A Waiver must be signed by EACH participant 5 business days prior to the Mixed Golf Tournament. A waiver form will be distributed to you once your registration form has been processed. If a waiver is not signed prior to the tournament, your registration will be removed from the tournament. All registrations must be accompanied by full payment. All Cancellations or Amendments to registrations must be received in writing via email to Dick Willott at dickw@boypetro.com. Phone requests will not be accepted. The Cancellation or Amendment must be received by 4:00 pm on August 14, 2009. A 15% Cancellation and Administration fee will apply.
For more information, contact Dick Willott at 403-543-5387, Brenda Pearson at 403-206-3339, or David Caldwell at 403-852-5571.
$ 85.00 Member
$ 125.00 Non-Member / Guest
$ 25.00 Extra Meal Ticket (Non-playing guests. Maximum 10 spots; rst-come, rst served.)
$ TOTAL (GST Included. GST # 118836295)
� VISA � MC � Cheque/Money Order (Payable to CSPG)
Card Number:
Name of Cardholder:
Expiry:
Signature:
Registrations to be sent to: Canadian Society of Petroleum Geologists Attn: Mixed Golf Tournament 600, 640 – 8 Avenue SW Calgary, Alberta T2P 1G7
Phone: 403.264.5610 Fax: 403.264.5898
Welcome to the ANNUA l Mixed Golf Tournament
This year’s tournament will be held on Friday, August 28th, at Lynx Ridge Golf Course in northwest Calgary. We are back to the Friday morning and back at Lynx Ridge. Once again, our committee: Darin Brazel, David Caldwell, Penny Christensen, Carter Clarkson, Norm Hopkins, Alyssa Middleton, Kevin Muir, Brenda Pearson, Dick Willott, and Hugh Wishart will bring together a first class tournament for all participants.
The CSPG Mixed is a four-person best-ball tournament with an 8:00 am shotgun start. Golfers’ average scores / handicaps are used to create balanced teams so everyone has a chance to contribute. The CSPG Mixed is a social tournament, intended for fun, and an opportunity to network and socialize with your colleagues and peers from industry, and provides mix and meet opportunities for geoscientists, industry, and consultants. We
look forward to the return of our sponsors for this fun event, and will continue our support for the CSPG Trust “Geoscientist for the Future” fundraising.
Entry deadline for the tournament will be Friday August 7th, with non-members accepted in date priority until the tournament is filled. Priority is always given to CSPG members first. Questions concerning registration can be directed to Dick Willott from Boyd Petrosearch at his office 403543-5387 or by email to dickw@BoydPetro. com. You can also contact Brenda Pearson at 206-3339 or bpearson@birchcliffenergy. com or David Caldwell at 403-852-5571 or david@commandequipment.com.
This year we are using the on-line registration services of Events Online to collect the registration information and charge members and guests the registration fees.
As tournament chairs, we are completely satisfied that Events Online will provide a safe and secure area for registration and event payment. Your information will not be sold or distributed to anyone by using the registration site.
If you have any questions, please phone or email either of the CSPG Mixed Golf cochairs Brenda Pearson or David Caldwell.
c SPG m ixed Golf committee:
Dick Willott – Boyd Petrosearch
Penny Christensen – Schlumberger
Carter Clarkson – Hycal
Kevin Muir – Recon Petrotechnologies
Hugh Wishart – Oilexco
Brenda Pearson – Birchcliff Energy
Darin Brazel – LogTech Canada
Norm Hopkins – Fairmount Energy
David Caldwell – Command Equipment
CSPG Calendar
2010 Call for Photos
$200 Prize for Best Photo
$200 Prize for Best Canadian Photo
Deadline: June 30, 2009
• Any Landscape Oriented Photo of Geological Interest – Canadian or International
• Digital Photos Only. Files must be tiff or quality jpeg with a minimum resolution of 3 megapixels.
To submit your photo, use our online submission form at www.cspg.org via the Publications tab. If you have any questions, please contact Dave Hills at david.hills@dvn.com.
Photo by Glen Stockmal
approximately 50 times the amount of CO2 contained in the atmosphere, not including the immense contribution of the living biological communities, it is apparent that the oceans by controlling the amount of atmospheric CO2 play a vital part in maintaining stable conditions suitable for organic life on earth. It is well known that atmospheric CO 2 has been at much higher levels in the past. During the Palaeogene, values up to five times current atmospheric levels have been reported (1,885 parts per million –Pagani, 2005) without injury to ocean life. According to the ocean acidification theory, life could never have evolved on earth! That this is nonsense is obvious, but the constant unqualified repetition in the media of unsubstantiated claims of disaster raises unwarranted concern among the general public. This is particularly so when it occurs in respected mainstream media outlets.
REFERENCES:
Appenzeller, Tim. 2007. The Big Thaw, Ice on the Run, Seas on the Rise. National Geographic, June 2007.
Doran, P. T., et al. 2002. Antarctic climate cooling and terrestrial ecosystem response. Nature, advance online publication.
Gore, Al. 2006. An Inconvenient Truth. Movie.
Holland, Jennifer S. 2007. The Acid Threat. National Geographic Magazine, November, 2007, Photography by David Liitschwager.
Holloway, G. and Sou, T. 2002. Has Arctic sea ice rapidly thinned? Journal of Climate, v. 15, p. 1691-1701.
Intergovernmental Panel on Climate Change. 1990. Climate Change 1990: The IPCC Scientific Assessment. Cambridge University Press, Cambridge.
Intergovernmental Panel on Climate Change. 2001. Climate Change 2001: The Physical Science Basis. Cambridge University Press, Cambridge.
Intergovernmental Panel on Climate Change. 2007. Climate Change: The Physical Science Basis. Summary for Policymakers, Fourth Assessment Report. Geneva, Switzerland.
Jones, P. D. 1995. Recent variations in mean temperature and the diurnal temperature range in the Antarctic. Geophysical Research Letters, v. 20 p. 1345-48.
Krabill, W., et al. 1994. Greenland Ice Sheet Thickness Changes Measured by Laser Altimetry. Geophysical Research Letters, v. 22, p. 2341-2344.
Krabill, W., et al. 2000. Greenland Ice Sheet: High elevation balance and peripheral thinning. Science v. 289, p. 428-430.
The Errors in Al Gore’s Movie. Science and Public Policy Institute. www.scienceandpublicpolicy.org.
Morner, Nils Axel. 2004. Estimating Future Sea Level Changes from Past Records. Global and Planetary Change, v. 40, issues 1-2, January, p. 49-54 New York Times, December 8, 2002
Polykov, I. V., et al. 2003. Trends and variations in Arctic climate systems. EOS. Transactions of American Geophysical Union, v. 83 p. 547-48.
Polykov, I. V. and Johnson, M. A. 2000. Arctic decadal and interdecadal variability. Geophysical Research Letters, v. 27, p. 4097-4100.
Rothrock, D. A., Yu, Y., and Maykut, G. A. 1999. Thinning of the Arctic sea ice cover. Geophysical Research Letters, v. 26, p. 3469-72.
Segalstad, Tom. 2009. Carbon Isotope Mass Balance vs. Oceanic CO 2 . International Conference on Climate Change, New York. www.heartland.org/events/NewYork09/ proceedings.html.
Sansom, J. 1989. Antarctic surface temperature time series. Journal of Climate, v. 2, p. 116472.
Thompson, L. G. 2002. Kilimanjaro ice core records: evidence of Holocene climate change in tropical Africa. Science 298, p. 589-93.
Tkachuk, R. D. 1983. The Little Ice Age. Geoscience Research Institute, v. 10, issue 2, p. 56-65 or www.grisda.org/origins/10051.html. (...Continued from
Hanna, E. and Cappelin, J. 2003. Recent cooling in coastal Southern Greenland and relation with the North Atlantic oscillation. Geophysical Research Letters, v. 30, 32-1 to 32-3.
(...Continued from page 12)
Morocco on an AAPG field trip since the pre-rift conjugate margin basin equivalent to the East Georges Bank Basin is exposed in the High Atlas Mountains of Central Morocco. Indeed, spectacular outcrops in the High Atlas provide support for the geological analysis of some two decades ago, as will be shown in this presentation
BIOGRAPHY
Tako Koning is Holland-born but Albertaraised and graduated in 1971 with a B.Sc. in Geology from the University of Alberta. He also earned a B.A. in Economics from the University of Calgary in 1981. He was employed by Texaco for 29 years as a geologist and manager in Canada, Indonesia, Nigeria, and Angola. He retired in 2002 when Texaco merged with Chevron and continued to live and work in Angola where he is a consultant for
Moncton, C. W. 2007. 35 Inconvenient Truths,
Tullow Oil. He is also involved with aid work in northern Angola drilling water wells with Yme Foundation, a Norwegian humanitarian
organization (www.yme.no). Over the years, he has given many presentations to the CSPG International Division on a variety of subjects related to exploration and production projects in the countries where he has lived and worked. His first presentation to the International Division was in 1987 and this will be his 15th presentation in the past 22 years.
INFORMATION
There is no charge. Please bring your lunch. The facilities for the talk are provided complimentary of EnCana and refreshments by Geochemtech Inc. For further information or if you would like to give a talk, please contact Bob Potter at (403) 863-9738 or ropotter@telusplanet.net or Trent Rehill at (403) 606-6717 or trehill@kulczykoil.ca.
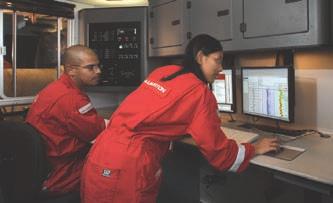
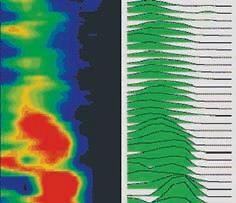
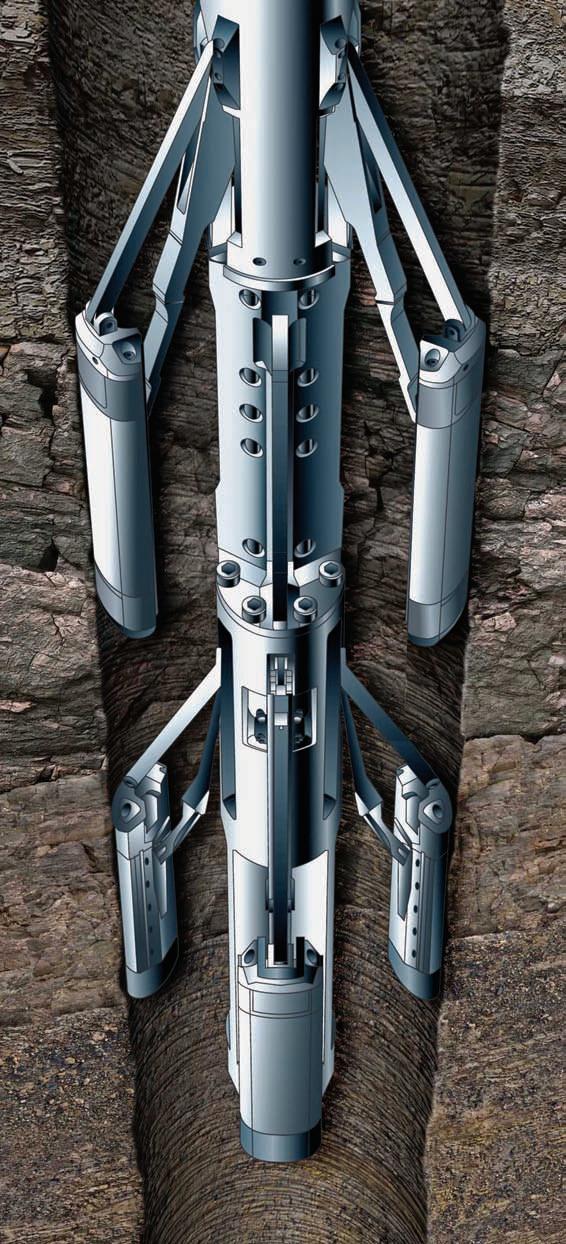
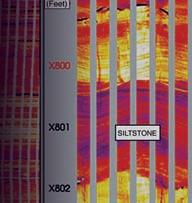
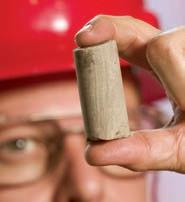
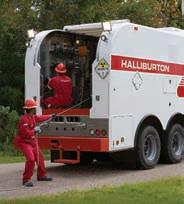
For rock-solid reliability— miles underground—look into our precise imaging solutions.
Halliburton Wireline and Perforating Services has the most reliableimaging solutions in the world—including the new Oil Mud ReservoirImager (OMRI™) tool and its X-tended Range Micro Imager (XRMI™) tool version—both of which generate crisp, digitalwellboreimages across the full range of formation resistivitiesand with excellent vertical resolution.
Before you get in too deep, look into Halliburton Wireline and Perforating Services— the leader in reliability and service excellence. For more information, please visit us at www.halliburton.com/wireline.
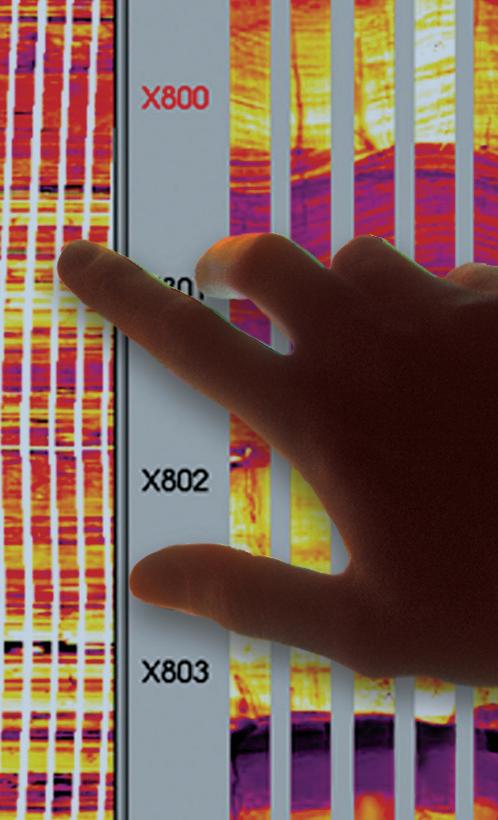

–
Thousands of landmen, engineers & geologists use geoSCOUT oil and gas mapping and analysis software every day, to make more efficient, informed decisions. Give us an hour for a demo – we know you’ll see the value. Call 403.262.1992 Email info@geoscout.com | Online www.geoscout.com/demo If you want easy-to-use
industry-leading customer service easy & efficient migration of existing data helping clients increase productivity
geoSCOUT™ uses a Windows-based platform that makes it easy for you to get the oil and gas data you need to make smarter decisions faster and to maximize the return on your oilfield investments. And, our solution provides you with a complete package that all your departments can use.
Another powerful suite of tools from