


“As a geologist and PETRA product manager, it’s my job to understand your challenges and make sure PETRA helps you meet them. Connecting directly to IHS data is one of those ways. It’s fast and simple, so you spend more time analyzing data, not loading it.”
Dana Codding Subsurface Product Manager
PETRA provides multi-discipline reservoir management teams with the analysis tools needed for today’s exploration, exploitation and acquisition challenges.


#600, 640 - 8th Avenue SW Calgary, Alberta, Canada T2P 1G7
Tel: 403-264-5610 Fax: 403-264-5898
Web: www.cspg.org
Office hours: Monday to Friday, 8:30am to 4:00pm
Business Manager: Tim Howard
Email: tim.howard@cspg.org
Communications & Public Affairs: Heather Tyminski
Email: heather.tyminski@cspg.org
Corporate Relations Manager: Alyssa Middleton
Email: alyssa.middleton@cspg.org
Membership Services: Dayna Rhoads
Email: dayna.rhoads@cspg.org
Programs & Services Manager: Lori Humphrey Clements
Email: lori.humphreyclements@cspg.org
Reception: Kasandra Klein
Email: reception@cspg.org
Joint Annual Convention Committee
Convention Manager: Shauna Carson
Email: shauna.carson@cspg.org
Convention Assistant: Tanya Santry
Email: tanya.santry@cspg.org
EDITORS/AUTHORS
Please submit RESERVOIR articles to the CSPG office. Submission deadline is the 23rd day of the month, two months prior to issue date. (e.g., January 23 for the March issue).
To publish an article, the CSPG requires digital copies of the document. Text should be in Microsoft Word format and illustrations should be in TIFF format at 300 dpi., at final size. For additional information on manuscript preparation, refer to the Guidelines for Authors published in the CSPG Bulletin or contact the editor.
Technical Editors
Ben McKenzie Colin Yeo (Assistant Tech. Editor) Tarheel Exploration Encana Corporation Tel: 403-277-4496 Tel: 403-645-7724
Email: bjmck@telusplanet.net Email: colin.yeo@encana.com
Coordinating Editor
Heather Tyminski
Comunications and Public Affairs, CSPG
Tel: 403-513-1227, Email: heather.tyminski@cspg.org
ADVERTISING
Advertising inquiries should be directed to Alyssa Middleton, Tel: 264-5610, Email: alyssa.middleton@cspg.org. The deadline to reserve advertising space is the 23rd day of the month, two months prior to issue date.
The RESERVOIR is published 11 times per year by the Canadian Society of Petroleum Geologists. This includes a combined issue for the months of July/August.
Advertisements, as well as inserts, mailed with the publication are paid advertisements. No endorsement or sponsorship by the Canadian Society of Petroleum Geologists is implied.
The contents of this publication may not be reproduced either in part or in full without the consent of the publisher.

KINGDOM’s Grid Editor allows you to locate every feature flawlessly.
Your next work of art could be worth a fortune. Until now, perfecting contour maps was time consuming and the process was nothing to smile about.
Now Grid Editor from SMT changes the picture forever. It lets you turn the statistical maps of a computer into the geological maps of a geologist. With Grid Editor, every adjustment to a contour line is reflected in the underlying grid. Instantly And your changes happen just by dragging contours, so there’s no need to manually reset them point by point.
Faster. More accurate. Incredibly easy to use and to install. And when you put your masterpiece in front of your decision makers, you’ll be smiling from ear to ear.
Grid Editor helps you find the time you need to interpret the data, not manage the tools.
Grid Editor can help you improve your picture. Visit our Web site at www.seismicmicro.com/monalisa3 and learn why KINGDOM 8.2 is the market leader for PC-based interpretation with over 2,500 companies in 85 countries.

Intuitive. Integrated. Interpretation. America +1 (713) 464-6188 Asia +65 6220 1089 Europe +44 (0) 20 8240 6524

CSPG EXECUTIVE
PRESIDENT
Lisa Griffith • Griffith Geoconsulting Inc. lgriffith@griffithgeoconsulting.com Tel: (403) 669-7494
VICE PRESIDENT
Graeme Bloy • West Energy Ltd. gbloy@westenergy.ca Tel: (403) 716-3468
PAST PRESIDENT
Colin Yeo • EnCana Corporation colin.yeo@encana.com Tel: (403) 645-7724
FINANCE DIRECTOR
James Donnelly • ConocoPhillips Canada james.donnelly@conocophillips.com Tel: (403) 260-8000
ASSISTANT FINANCE DIRECTOR
David Garner • Chevron Canada Resources davidgarner@chevron.com Tel: (403) 234-5875
PROGRAM DIRECTOR
Randy Rice • Suncor Energy Inc. rjrice@suncor.com Tel: (403) 205-6723
SERVICE DIRECTOR
Jen Vèzina • Devon Canada Corporation jen.vezina@devoncanada.com Tel: (403) 232-5079
ASSISTANT SERVICE DIRECTOR
Ayaz Gulamhussein • NuVista Energy Ltd. Ayaz.gulamhussein@nuvistaenergy.com Tel: (403) 538-8510
OUTREACH DIRECTOR
Greg Lynch • Shell Canada Limited greg.lynch@shell.com Tel: (403) 691-2052
ASSISTANT OUTREACH DIRECTOR
Mike DesRoches • DesRoches Consulting Inc. mdesroch@shaw.ca Tel: (403) 828-0210
COMMUNICATIONS DIRECTOR
Peggy Hodgkins • CGGVeritas peggy.hodgkins@cggveritas.com Tel: (403) 266-3225
CORPORATE RELATIONS DIRECTOR
Monty Ravlich • Sanjel Corporation mravlich@sanjel.com
A message from the Outreach Director, Greg Lynch
I sometimes hear fellow geologists from other parts of the country refer to the CSPG as the “Calgary Society of Petroleum Geologists,” usurping a local small-C Calgary for the real thing, big-C Canadian. Admittedly, there may be a certain grain of truth in this misperception, simply because of the sheer number of CSPG members living and working in Calgary. Certainly, with one of the highest concentrations of geologists in the world assembled here in one place, CSPG activities can seem at times Calgary-centric.
However, the mandate and intent of the Society is to assist petroleum geologists working and living in all corners of the country. And the reality is that hydrocarbon resources are distributed across the whole of Canada; for instance here’s a quiz for you: see if you can name a province or territory that doesn’t have proven reserves (of course that depends on how you define “reserves”!). Emerging regions are taking much of the focus off of Alberta, and some of the headliners are as interesting as they are surprising. In step with this, through the leadership of President Lisa Griffith, the CSPG is taking measures to realign with the rest of the country as a whole and become more national and inclusive.
To date, existing CSPG-Outreach programs comprise a mixed bag covering both local and national interests. In particular, CSPG University Outreach is spread across the full extent of the University network with over twenty chapters housed in various schools across the country. The chapters create a sense of community and give students access to resources and information from the CSPG. Nonetheless, University Outreach continues to evolve and steps are now being taken to merge the various different geology clubs which may exist in individual schools. This will help strengthen the clubs, avoid duplication or unwanted competition, as well as further expose students to the
full extent of what geoscience has to offer. Soft rock, hard rock, they’re all rocks. To this effect discussions have begun with GAC (Geological Association of Canada) and PDAC (Prospectors and Developers Association of Canada) to unify clubs and broaden our collective base.
Student geology clubs in some cases already have longstanding names, typically honoring prominent faculty of the past, or maybe linking them to a certain geological feature. For GAC it’s the “Logan Club,” with Sir William Edmond Logan, the iconoclastic founder of the Geological Survey of Canada, acting as figurehead. Within our joint clubs I could certainly see the CSPG adopting Logan as our zemi as well; his initial mandate was after all, among other things, to identify and characterize coal resources in the New World – Canada’s first hydrocarbon geologist!
Icons are in fact very important to promoting science and outreach to the public, as they put a face, name, and character to the discipline, even if somewhat dated. Although Logan does embody the image of geologists of yore, his likeness still haunts the halls of many a geoscience department today. Doing a little bit of digging on the GSC website, I was surprised to find that in a MacLean’s survey Logan was voted by an expert panel the #1 Canadian Scientist of all time (for all disciplines), and #6 greatest Canadian. Accordingly, Canada’s highest peak, Mount Logan, is named in his honor, which is not too bad considering he was a geologist.
Interestingly, former Prime Minister Jean Chretien attempted to have this most prominent of landmarks renamed Mount Pierre Elliot Trudeau. The CSPG responded to this by wielding some of its influence, in unison with the outcry coming from across the rest of the country, to have this initiative stopped in its tracks. This was no small feat (Continued on page 46...)


CORPORATE MEMBERS
ABU DHABI OIL CO., LTD. (JAPAN)
APACHE CANADA LTD.
BAKER ATLAS
BG CANADA EXPLORATION & PRODUCTION, INC.
BP CANADA ENERGY COMPANY
CANADIAN FOREST OIL LTD.
CANETIC RESOURCES TRUST
CONOCOPHILLIPS CANADA
CORE LABORATORIES CANADA LTD.
DEVON CANADA CORPORATION
DOMINION EXPLORATION CANADA LTD.
DUVERNAY OIL CORP.
ENERPLUS RESOURCES FUND
FUGRO AIRBORNE SURVEYS
geoLOGIC systems ltd.
GRIZZLY RESOURCES LTD.
HUNT OIL COMPANY OF CANADA, INC.
HUSKY ENERGY INC.
IHS
IMPERIAL OIL RESOURCES LIMITED
LARIO OIL & GAS COMPANY
MJ SYSTEMS
MURPHY OIL COMPANY LTD.
NEXEN INC.
PENN WEST PETROLEUM LTD.
PETRO-CANADA OIL AND GAS
PETROCRAFT PRODUCTS LTD.
PROVIDENT ENERGY LTD.
RPS ENERGY CANADA LTD.
SHELL CANADA LIMITED
SPROULE
SUNCOR ENERGY INC.
TALISMAN ENERGY INC.
TAQA NORTH LTD.
TOTAL E&P CANADA LIMITED
WEATHERFORD CANADA PARTNERSHIP
AS OF APRIL 29, 2008
By Tim Howard
The past year and a half has been a period of change and transition around the office. In August of 2006, we moved from our old haunts on 5th Avenue to the new one at the corner of 8th Avenue and 6th Street S.W. Along with the CSEG, we now share the 6th floor of the Western Union Building in what has become a far better service to our members and our committees, and a healthier work environment for our staff.
A month later, in September of 2006, Deanna Watkins, our longest-serving staff member, retired to continue building her own business. The Society retained her services to manage our bookkeeping, something she had been doing an excellent job of for many years while on staff.
In December of 2006, Lori HumphreyClements, our Convention Manager, departed on maternity leave to look after her second child. As Lori’s replacement, we hired Shauna Carson, who has been the Convention Manager since then.
Leaving her role as Convention Assistant and stepping into one of the roles Deanna vacated, Sarah Barton took over as Membership Services Coordinator. Tanya Santry, who had started out with us in our new office as our Administrative Assistant and Receptionist, took over Sarah’s role as Convention Assistant, and has continued there ever since. Following Tanya into the front-desk job in December of 2006 was Dayna Rhoads, who came to us from the Calgary Herald.
Jaime Croft-Larsen, our Communications Coordinator, retired from CSPG last summer to assume the role of Communications Manager with the Petroleum Human Resources Council of Canada and Heather Tyminski, who had been working with Kim MacLean, as our Corporate Relations Assistant, stepped into Jaime’s position to better put her Master’s in English to work on our behalf.
Some of you will recall Kristina Keith filling Sarah’s position when Sarah was on maternity leave. Kristina worked very hard for us last fall and we were happy that she was able to find employment with her former employer, the Canadian Cancer Society, in Vancouver in an enhanced role. Sarah subsequently moved back into Membership Services at the beginning of March and has since taken employment elsewhere, this time with the Human Resource Institute of Alberta, as their conference and development manager.
Sarah had actually returned to work two months earlier than planned to help fill the Corporate Relations position, in Kim MacLean’s absence. Kim is currently out of the office and we expect her to return in the fall of this year. With Sarah’s departure from Corporate Relations, we subsequently brought Alyssa Middleton in to fill Kim’s role until she returns and Dayna has moved from the front desk to Membership Services and her former role has been filled by Kasandra Klein.
Lori also returned in January to bring some much needed stability and assistance to many functions that have been receiving short shrift in recent years. In her capacity as Programs and Services Manager, Lori has taken over the roles of junior staff supervisor, daily financial management, committee staff liaison, awards coordination, and special projects.
Shauna Carson has stayed on as Convention Manager and she and Tanya have become the front-line staff of the new Joint Annual Convention Committee, or JACC, chaired by Ian McIlreath, serving both the CSPG and the CSEG convention and conference needs.
Tim Howard, the Business Manager, is about the only person left in the office who remains largely in his old role.
So, for those of you without a program, this is how the CSPG 2008 Office team stacks up:
Business Manager
Tim Howard
Programs & Service Manager
Lori Humphrey-Clements
Corporate Relations Manager
Kim MacLean (pinch-hitting, Alyssa Middleton) Communications & Public Affairs Coordinator
Heather Tyminski
Membership Services
Dayna Rhoads
Admin Assistant & Reception
Kasandra Klein
Bookkeeping
Deanna Watkins
JACC Convention Manager
Shauna Carson
JACC Convention Assistant
Tanya Santry
As the dust settles and we look forward to a year of staff stability, we encourage you to either call or drop into the office and introduce yourself to the ‘new kids on the block’ or reacquaint yourselves with the veterans.
SPEAKER
Stephen
L.
Bend Department of Geology, The University of Regina
11:30 am, Wednesday, June 4th, 2008 Telus Convention Centre, Calgary, Alberta
Please note: The cut-off date for ticket sales is 1:00 pm, Friday, May 30th, 2008. Ticket Price: $34.00 + GST.
Due to the recent popularity of talks, we strongly suggest purchasing tickets early, as we cannot guarantee seats will be available on the cut-off date.
During this talk I will present and demonstrate my eTextbook in Petroleum Geology, recently
published by the American Association of Petroleum Geology (AAPG) in December 2007.
Widely acknowledged as the first peerreviewed electronic textbook in geoscience, this CD-based publication is a significant departure from the traditional textbook and previous web-based eText experiments because of the depth, breadth, and scope of material that is contained within this CDbased publication.
For the first time, an introductory textbook in geology is able to combine the traditional look of a textbook with a very large number of colour images, animations, video clips, and immersive images (e.g., virtual microscope); but also include an interlinked ‘library’ of classic, peer-reviewed, journal articles, book chapters, and contributions by professionals within the industry. This eTextbook also contains many of the petrophysical logging charts that are so frequently used by the professional petroleum geologist, and demonstrates the utility of such charts and diagrams by including several worked examples.
From a teaching and pedagogical perspective, this publication platform enables the
Expertise in heavy oil & deep basin reservoirs
• Time Lapse (4D) Processing
• 4D Cross Equalization
• Multicomponent (3C, 4C) Processing
• 3D Merging
• PSTM with Common Offset Vector Binning
Hart Janssen
B.Sc., Manager, Seismic Processing
Direct: 403-260-3372 Main: 403-237-7711
www.sensorgeo.com
sponsored by
presentation of concepts and instructional material in a variety of possible ways that I believe presents concepts in a much more accessible way. This, of course, readily suits the teaching of geology, which is a highly visual discipline. The ability to include limitless full-colour graphics, or use various forms of multimedia that facilitate the learning process, without the limitation of cost, is especially appealing where traditional texts have either suffered from high cost or the exclusion of colour.
Is this publication platform a mere publication oddity? It would appear not, since the AAPG already has two other similar electronic publication projects in various states of preparation and others in the planning stage. The relatively low cost of publication, a high degree of portability, the freedom from bandwidth restrictions, and an independence from the internet and browser quirkiness are giving other publishers reasons to take this publication platform seriously.
Stephen Bend has a Bachelor’s Degree from the University of Keele, England, a Master’s Degree in Organic Petrology and Organic Geochemistry from the Organic Geochemistry Unit (now NRG), the University of Newcastle upon Tyne, and a Ph.D. from the Northern Carbon Research Labs., School of Chemistry, also at the University of Newcastle upon Tyne. He was employed by Exlog as a petroleum geologist for over five and a half years, during that time he was contracted to the following oil/gas fields or locations: Beryl Oil Field, Statfjord Field, North Sea; Gulf of Suez, Egypt; Gaijuira Peninsular, Columbia; B.C./ Alberta Foothills, Hibernia Field, and Scotia Shelf, Canada; Dutch North Sea; N.W Dome, Qatar, and the Troms-1 Field, Norwegian Arctic. In 1984 he operated and managed a commercial Geochemistry Laboratory in Halifax, Nova Scotia for Exlog Canada, which prompted a return to graduate school in 1985. In 1990 he joined the Department of Geology at the University of Regina where he has served as both a faculty member and is a former Head of Department.
Ongoing research interests include the petrographic and geochemical study of crustal organic matter, specifically related to the correlation and modeling of crude oils and source rocks within the Williston Basin and the characterisation of coal, coal bed methane, CO2 sequestration, coal oxidation, the fluorescence characteristics of coal macerals, and the origin and correlative relationship of lower Palaeozoic oils. Bend was instrumental in creating a new Modeling/GIS laboratory within the Department of Geology at the University of Regina.
SPEAKER
Mark S. Caldwell Klabzuba Oil & Gas Inc., Denver, CO
11:30 am, Thursday, June 19, 2008 Telus Convention Centre Calgary, Alberta
Please note: The cut-off date for ticket sales is 1:00 pm, Monday, June 16, 2008. Ticket Price: $34.00 + GST.
Due to the recent popularity of talks, we strongly suggest purchasing tickets early, as we cannot guarantee seats will be available on the cut-off date.
The Bearpaw Uplift of north-central Montana hosts a world-class example of gravity-induced faulting within Upper Cretaceous marine sedimentary rocks and their overlying Tertiary volcanic and sedimentary cover. Seismic exploration, mostly for shallow (less than 640 metres, 2,100 foot depth) Upper Cretaceous biogenic gas reservoirs, has yielded high-quality 2D and 3D datasets. Mapping this seismic data reveals a complex pattern of faulting hidden beneath a glacial veneer north of the Bearpaw Mountains and into Canada. This fault pattern is very similar in geometry and origin to that mapped at the surface south of the Bearpaw Mountains.
Laramide basement-involved uplift of the Bearpaw Arch was accompanied by extensive outpouring of surface lava flows and volcaniclastics and the emplacement of a wide variety of intrusive bodies in the middle Eocene (53-42 mya). Thrust sheets loaded with thick volcanic and sedimentary cover moved off the flanks of the Bearpaw Arch along overpressured organic-rich shale decollements. Rocks beneath the decollements are mostly undeformed with dips of 1 to 3 degrees away from the arch. The headward or updip portion of the thrust sheets is dominated by extensional structures in a chaotic fault array of normal faults and grabens, while the basinward downdip portion is characterized by compressional thrust-faulted structures.
The detailed study area, located in northern
Hill and Blaine Counties, is dominated by north-directed compressional structures that trap biogenic gas in a variety of structural traps well imaged with 2D and 3D seismic. Two principal decollements have been identified and mapped in the study area. The older, upper 1WS decollement is rooted in an organicrich shale within the uppermost Colorado Shale (First White Specks). Regional gentle NE structural dip on this thrust sheet is punctuated by regularly spaced fault-bounded horsts or “pop-up” structures that are up to 8 km (5 miles) long. These structures were then faulted and folded by deformation associated with the lower, younger 2WS decollement, located in organic-rich shale just above the Greenhorn (Second White Specks). Several long (up to 64 km, 40 mi.) strike-slip faults offset earlier formed pop-ups with roughly 1,500 m (5,000 feet) right-lateral displacement as measured by piercing points at mapped fault intersections.
Historically, the primary exploration objective around the Bearpaw Uplift has been the Upper Cretaceous (Campanian) Eagle Sandstone. Much of the Eagle gas in the study area is found in structures associated with the (older) 1WS decollement. Structural traps include northvergent fault-bend fold traps, backthrusts (south-vergent thrusts), pop-up blocks, blind


thrusts, and footwall cutoffs. Several one-well Eagle fields have produced between 1 and 2 Bcf from very high-quality marine shoreface reservoirs (30% porosity, 200-1,000 mD perm). The largest Eagle gas accumulation in the study area has produced over 6 Bcf from a dome formed above a blind thrust.
Recent exploration has led to the discovery of shallow gas reserves in the underlying Niobrara (Santonian Medicine Hat) Sandstones. Klabzuba’s St. Joe Road field, discovered in 2001, covers 40 sq. mi. and has produced over 11 Bcf from 74 wells in the Niobrara Sandstone. Current daily production for the field is over 10 mmcf/d. Niobrara gas is trapped downdip of a major right-lateral strike slip fault that formed above the 2WS decollement.
BIOGRAPHY
Mark Caldwell received his B.Sc. degree in Geology from the University of Michigan and a M.Sc. degree in Geology from Western Michigan University. Mark began his career with Northern Michigan Oil & Gas in Traverse City, Michigan exploring the Michigan Basin. Mark has been employed as a geologist for Klabzuba Oil & Gas, Inc. since 1988 and has been actively working both the subsurface geology and geophysics of the Bearpaw Uplift since 1994.


Rely on CGGVeritas to maximize your exploration success.
Using the most advanced land acquisition technology, we have acquired more data in the Canadian Foothills and Heavy Oil region of N.E. Alberta than any other company, and have achieved an industry-leading QHSES record in the process. When quality and safety are top priorities, choose CGGVeritas.
Focus on Performance. Passion for Innovation. Powered by People. Delivered with Integrity.


Oct.20 – 23,2008 • The Banff Centre

SPONSORS:
Canadian Society of Petroleum Geologists, Geological Association of Canada, Canadian Federation of Earth Scientists, Royal Society of Canada.
GENERAL CHAIR AND TECHNICAL PROGRAM COORDINATOR
Andrew D. Miall
ORGANIZING COMMITTEE
Shauna Carson, Steve Grasby, Elisabeth Kosters, Jeff Packard, and Ian Young.
TECHNICAL ADVISORS
Bill Ruddiman, Dick Peltier.
Registration for the Conference opens June 15. Registration is $800 for CSPG Members and $900 for non-CSPG Members. Also, you can save $100 if you register before August 15.
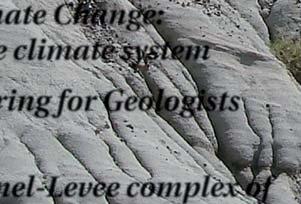
The modern world is faced with two significant and interrelated problems: a climate system that appears to be undergoing rapid change, and a growing economy that will soon have to deal with the rapid depletion of its most important energy source: readily available and inexpensive oil and gas. A survey was initiated in 2005 to explore the knowledge and opinions about these issues amongst Canadian earth scientists, focusing on the members of the Geological Association of Canada and the Canadian Society of Petroleum Geologists. Some of the major results of this survey will be reported at forthcoming annual meetings of these societies (Miall and Miall, 2008).
The history of the earth’s climate is one of continual change. Many natural processes contribute to this change, including longterm forcing related to the movement and elevation of the earth’s continental plates, changes in the amount and distribution of solar radiation received by the earth driven by regular changes in the earth’s orbit and by changes in the sun’s activity, and climatic modulations driven by periodic and episodic oscillations in the pattern of oceanic and atmospheric currents (Ruddiman, 2008).
There has been a sense amongst many earth scientists that the geological history of climate change has not been a major influence on the work of the Intergovernmental Panel on Climate Change (IPCC). Comments such as “The climate has always been changing; what’s so special about the last few years?” are commonly heard at the water cooler. The first three assessments did not specifically address the issue of paleoclimates, but a chapter dealing with this issue is now included in the Fourth Assessment, published in April 2007. However, earth-science data have, from the beginning of the work of the panel, been a major factor in the developing understanding of the climate system. For example:
• The overriding importance of orbital forcing (the Milankovitch mechanism) in governing glacial to interglacial changes on a 105-year time scale. (Ruddiman, 2008).
• The Heinrich ice-rafting events in the North Atlantic Ocean, and the insights they
have provided into thermohaline circulation during ice-house conditions (e.g., Alley, 2007).
• Raised beaches and coral terraces and the information they have provided about continental ice cover, ocean water temperatures, and sea-level change (e.g., Peltier and Fairbanks, 2006).
• The discovery and documentation of millennial-scale oscillations of climate change in ice cores (Dansgaard-Oeschger cycles) and deep sea sedimentary records (the so-called Bond “cycles”) have raised important questions about climatic forcing and solar influences on climate at the millennial scale (Alley, 2007).
The IPCC has focused on Holocene climates for the very good reason that it is the particular climatic sensitivities of an ice-house world that are being affected by anthropogenic (Continued on page 16...)
(...Continued from page 15)
forcing. Earlier climatic conditions, such as the sudden temperature spike of the Paleocene-Eocene Thermal Maximum, can also provide important information about the response of the climate system to sudden forcing.
There is now a global consensus amongst most scientists that the climate is currently being modified rapidly by the anthropogenic addition of greenhouse gases to the atmosphere, a consensus largely shared by Canadian earth scientists (Miall and Miall, 2008). The level of carbon dioxide in our atmosphere is now greater than at any time in the past 800,000 years. But it remains unclear whether any significant component of current changes in climate can be attributed to natural causes.
One of the most important ways to evaluate current models of climate change is to thoroughly explore the record of change through the last few millennia (see Mann, 2007). This is an exercise for the geosciences, and it is the first of two major objectives of this conference to examine this record and work towards a better understanding of what it tells us about the dynamics of the climate system at all physical scales and time scales. There is a rich record of paleoclimatic variability and an array of techniques for evaluating climate history, based on the study of landscapes, preserved sediments, soils, cave deposits, marine and other drill cores, ice, tree rings, and other records. Only by working from such an understanding can we reliably evaluate the contribution being made to climate change by anthropogenic processes.
The major cause of greenhouse gas increases is the combustion of fossil fuels, and there is an increasing realization that means must be found to increase the efficiencies in our use of fossil fuels and bring about
substantial net reductions in their use in the coming decades. This presents a two-part problem: worldwide economic growth is increasing rather than reducing the use of fossil fuels, and such growth is leading to an accelerating depletion of these resources, with many experts predicting a decline in the availability of inexpensive oil and natural gas within the foreseeable future. Similar problems are emerging with the other crucial natural resource: water. Impending shortages therefore comprise a second equally important reason for reducing the use of fossil fuels, and it is the second major objective of this conference to review the state of the supply, and to discuss energy sustainability, and some of the major environmental issues associated with the exploitation of coal and oil sands.
The Gussow-Nuna Conference will consist of two and one-half days of invited oral presentations. Additional presentations by poster-display are to be solicited from the geosciences community. The conference will conclude with a one-day field trip to examine the record of Late Quaternary climate change in the Banff-Calgary area (see Figure 1).
All those interested in the science behind evolving social and economic policy may wish to consider attending this event. Registration will be limited.
For further information, go to http:// www.cspg.org/conventions-gussow.cfm. To propose a poster presentation, please contact miall@geology.utoronto.ca.
Ruddiman, W. F. 2008. Earth’s Climate: Past and Future, Second edition. W. H. Freeman and Company, New York, 465 p.
Alley, R. B. 2007. Wally Was Right: Predictive Ability of the North Atlantic “Conveyor Belt” Hypothesis for Abrupt Climate Change. Annual Review Earth Planetary Sciences, v. 35, p. 241272.
Eyles, N. and Miall, A. D. 2007. Canada Rocks: The Geologic Journey. Fitzhenry and Whiteside, Toronto, 512 p.
Mann, M. E. 2007. Climate over the past two millennia. Annual Review of Earth and Planetary Sciences, v. 35, p. 111-136.
Miall, C. E. and Miall, A. D. 2008. Report on the results of a survey of Canadian Earth Scientists. GAC and CSPG Annual Meetings, May, 2008.
Peltier, W. R. and Fairbanks, R. G. 2006. Global glacial ice volume and last glacial maximum
duration from an extended Barbados sea level record. Quaternary Science Reviews, v. 25, p. 3322-3337.
Rutter, N., Coppold, M., and Rokosh, D. 2006. Climate change and landscape in the Canadian Rocky Mountains. The Burgess Shale Geoscience Foundation, Field, British Columbia, 137 p.
BIOGRAPHY
At the annual meeting of the Royal Society of Canada, held at the University of Alberta, 17th November 2007, Andrew Miall took up a two-year term as President of the Academy of Science, one of the three constituent academies of the Royal Society of Canada. The society is described as “Canada’s national academies of the Arts, Humanities and Sciences, dedicated to the promotion of exceptional learning, research and accomplishments.” Fellows are nominated by their peers and admitted by annual election. The Academy of Science, at 900 Fellows, represents about one half of the RSC membership.
Andrew Miall holds the Gordon Stollery Chair in Basin Analysis and Petroleum Geology at the University of Toronto. He received a Higher Doctorate from the University of London in 1992, and is a Distinguished Fellow of the Geological Association of Canada. He is the author of five books including Principles of Sedimentary Basin Analysis and the recently published Canada Rocks: The Geologic Journey, co-authored by Nick Eyles. He was Editor of Geoscience Canada from 1982 to 1990. He has been a member of CSPG since 1972, and was the Chair of the First International Symposium on Fluvial Sedimentology, held in Calgary in 1977, and Editor of CSPG Memoir 5, the proceedings volume, published the following year.
Miall’s previous service to the Royal Society of Canada includes a four-year term as National Representative for Canada to NATO’s “Committee on the Challenges of Modern Society” (20002004) and Chair of the Program Committee for the society’s annual symposia in 2003 and 2006. The 2003 symposia was on the topic “Energy, Environment and Society: Making Choices” and that in 2006 was “Water in Canada and the World: Rising tensions in the 21st century: issues and solutions.”
During his tenure as President of the Academy of Science, Miall is committed to raising the profile of the Earth Sciences in Canada. To this end he accepted to take on the role of General Chair and Technical Program Coordinator for the forthcoming Gussow-Nuna conference “The Geoscience of Climate Change: Understanding the Climate System, and the Consequences of Climate Change for the Exploitation and Management of Natural Resources,” which is to be held at the Banff Centre, 20-23rd October, 2008.
This article was originally published in the May 2007 Reservoir.
The world’s geoscientists, including petroleum geologists, offer a valuable perspective on the historical patterns of global climate change, as deduced from our intensive study of rock, fossil, and ice records. Based on this evidence, we have concluded that:
• Global climates have changed naturally and frequently throughout geologic time;
• The rate of climate change has been variable;
• The pattern and severity of climate change has varied by region; and
• Climate change continues today.
Temperature and geographic data indicate t hat the earth is currently experiencing an overall warming phase – a trend that is both expected and consistent with our emergence from the most recent glacial period beginning approximately ten thousand years ago. However, there is a strong opinion among some of the scientific and political community that the present-day warming has been accelerated as a direct consequence of anthropogenic activity, specifically rising concentrations of atmospheric CO2 , due to man’s widespread extraction and combustion of hydrocarbon fuels. Although a correlation has been drawn between the recent rise in atmospheric CO2 levels and average global temperatures, certain scientists continue to question this correlation and its cause-effect relationship.
A second and equally important element of the climate change discussion concerns the potential geographic and biologic consequences of a warming earth. While many observers are predicting catastrophic impacts, it is important to note that the fossil record provides many examples of ancient species that either suffered or benefited due to previous climate change.
The mechanisms contributing to climate change are numerous, involving cyclical inputs of both long and short duration. Climate behavior models are exceedingly complex, possess significant error uncertainty, and remain highly imprecise. As a learned technical society, the CSPG encourages continued scientific inquiry into all aspects of climate change, including possible anthropogenic effects. We
are committed to supporting such research and its publication and dissemination.
Hydrocarbon fuels will likely serve as one of man’s primary energy sources for the foreseeable future. As petroleum geologists, we are keenly aware of the earth’s finite endowment of these resources and the
need to use them wisely. CSPG members continuously strive to reduce our collective carbon footprint, by improving the efficiency of finding, extracting and processing these fuels. Our geoscientists are also expected to be leading edge contributors towards the development of greenhouse gas sequestration technologies.

| by Ed Mathison
The following was received as a “Letter to the Editor” in response to “A Call for Member Input to Update the CSPG Commentary on Climate Change,” originally published in the May 2007 Reservoir.
The stated intent of the CSPG’s proposed position on climate change is to take a neutral stance. The stated reason for taking a public position is that we have “a valuable perspective on the global history of climate change, and we have an obligation to Society to communicate this knowledge.” I will argue that our society’s position is anything but neutral and that our “valuable perspective” as outlined in the position paper is highly selective regarding Earth’s climatic history.
The following is a critique of various statements within the draft.
“Global climates have changed naturally and frequently throughout geologic time.”
Although this statement is undoubtedly true it does not follow that the current warming is due to natural causes, although this is implied. To ascertain the cause of current warming, the role of various climate drivers needs to be evaluated which is precisely what the IPCC reports address. Paleoclimate records can contribute to this analysis by providing an understanding of past climate variability and, through inference, the role of various drivers in this variability. We also need to know to what extent human activities have affected the Earth Climate system.
A critical question that can be answered from the Earth’s climate archive is: “What is the response of the Earth Climate system to massive injections of greenhouse gasses and what were the consequences for existent biota.”
Warming events associated with enhanced greenhouse effect are not uncommon in the geological record. The closest approximation of current greenhouse gas concentrations for a sustained period of time occurred during the Mid-Pliocene (3.3 to 3.5 Ma) (IPPC, 2007). Atmospheric carbon dioxide concentrations are estimated to have been from 360 to 400 ppm. Sea levels based on geologic and isotopic data were 15 to 25 m above modern levels with correspondingly reduced ice sheets (ibid). High latitude warming was substantial (10ºC to 20ºC) while low latitude warming was slight to nonexistent (ibid).
The most definitive example of a rapid warming due to substantial increase in greenhouse gases (2,000 ppm CO 2 concentrations) is the PalaeoceneEocene Thermal Maximum, when High Arctic sea surface temperatures exceeded 20ºC, redwood forests flourished on adjacent lands, and globally atmospheric temperatures rose 5-9ºC (Bowen et al., 2006). Alternative explanations for the source of greenhouse gasses include methane-calthrates, thermogenic methane (from igneous intrusions in the North Atlantic), and widespread burning of coal and peat. The massive release of carbon into the ocean-atmosphere system and the concomitant rise in surface temperatures resulted in widespread biotic migration and mass extinction.
In addition, both the carbon cycle and hydrological cycle were fundamentally altered. To quote Bowen et al. (2006), “The Earth System response to initial PETM (Paleocene-Eocene Thermal Maximum) forcing was not simply a shift away from, and recovery to, equilibrium, but a shift to a fundamentally different, semi-stable state.” This semi-stable state lasted for approximately 60,000 years prior to a gradual return (over 70,000 years) to conditions similar to the late Paleocene, albeit with a markedly different benthic foraminiferal and terrestrial mammalian faunas. The PETM illustrates that the Earth’s climate can respond in a non-linear fashion to constant forcing once critical thresholds have been crossed.
The most probable interpretation for the end of Permian mass extinction event is a cascade of environmental responses due to the voluminous outgassing accompanying emplacement of Siberian flood basalts (Wignall, 2007). Global warming, due to release of greenhouse gases (principally CO2 and methane), is merely one of the many consequences of this outgassing and shares in part responsibility for the mass extinction event.
In addition to the PETM and end of Permian, both the end of the Triassic and Cretaceous are characterized by greenhouse-gas-induced temperature spikes that contributed to mass extinctions. In addition to these temperature spikes, it is very likely that greenhouse gasses provided a positive feedback for Milankovichcycle-driven interglacial warmings (Houghton, 2004, IPPC 2007).
In evaluating the impact of human activities on the Earth’s climate system we need to understand the uniqueness of modern times. Never before have over six billion humans inhabited the Earth nor have there been powerful technologies that vastly magnify our abilities to bring about change and impact Earth systems. Human activities now equal in scale Earth processes, making us a profound planetary force (Rees, 1997, Vitousek et al., 2002 in Grimm, 2006). We are, for example, the Earth’s number one geomorphic agent. In the last 300 years we have released 600 billion tonnes of CO2 into the atmosphere raising concentration of this gas from 280 to 380 ppm, well outside the range of natural variability over the past 650,000 years (IPPC, 2007). The Earth’s climate is the outcome of the interrelationship of geologic, oceanic, ecological (including humans), and atmospheric processes. We have become a significant factor in this interplay.
“The rate of climate change has been variable.”
This, although true, masks the anomalousness of the current warming rate (i.e., over the last 50 years). Post Pleistocene warming occurred at an average rate of one degree Celsius per thousand years (0.01ºC per decade) (Pittock, 2005). Since the Younger Dryas 10,000 years ago, rates of warming have never exceeded 0.05ºC per decade for more than a few decades (ibid). The current warming, over the last century, has averaged 0.074ºC per decade (IPPC, 2007). This includes a mid-century cooling from 1945 to 1976 that has been compensated for by more rapid warming of 0.13ºC per decade since then (ibid).
“…the Earth is currently experiencing an overall warming phase – a trend that is expected and consistent with our emergence from the most recent glacial period…”
Immediately following the last glaciation, the Earth’s Climate system was characterized by gradual warming interrupted by a number of reversals, most notably the Younger Dryas, from 12,000 to 10,700 years ago; a return to conditions similar to the end of glaciation. An abrupt warming of approximately 7ºC in about 50 years marked the end of this event. Following a brief cooling at 8.2 ka the current climate regime was established. The climate of the last 8,000 years has
been remarkably stable (i.e., not gradually warming) relative to the last 420,000 years (IPCC, 2007). Although the Earth’s climate has been stable there have been significant regional variations (i.e., changes in weather patterns). The long-term changes in the Holocene are consistent with changes in orbital variation (i.e., Milankovich cycles) (Houghton, 2004). The current warming (over the last 50 years) is far too rapid to be attributable to orbital changes. Changes in the Earth’s orbit take place gradually over thousands of years (Dressler and Parson, 2006).
“However, there is strong opinion among the scientific and political community that the present warming has been accelerated.”
“Warming of the climate system is unequivocal, as is now evident from observation of increases in global average air and ocean temperatures, widespread melting of snow and ice, and rising global mean sea level” (IPCC, 2007). This is certainly more than opinion. There is overwhelming scientific consensus, based upon well researched and rigorously tested data, that the Earth’s climate has warmed over the last 100 years and that the
warming has accelerated over the last 50 years. The second half of the 20th century is likely the warmest 50 years for the Northern Hemisphere over the last 1,300 years (data is insufficient for the southern hemisphere) (ibid).
The inclusion of politicians in the above statement has no relevance and serves only to minimize the scientific consensus.
“Although a correlation has been drawn between the recent rise in atmospheric CO2 levels and the average global temperature, certain scientists continue to question this correlation.”
It is much more than a correlation. There is a very high probability that there is a causal relationship between the current warming and the recent rise in CO2 levels from anthropogenic sources. Global temperature, since the mid-20th century, is very likely (90% certainty) to be due to increases in greenhouse gas concentrations (IPCC, 2007). “(I)t is extremely unlikely that global climate change of the past fifty years can be explained without external forcing and very likely that it is not due to known natural causes alone” (ibid). In addition, a discernable human influence has
been detected on other aspects of climate including ocean warming, wind patterns, temperature extremes, and precipitation patterns (ibid).
Few scientists publishing in refereed atmospheric science journals question the validity of a causal relationship between elevated greenhouse gas levels from anthropogenic sources and the current rise in global average temperature. To quote Britain’s Royal Society, “At present there is a small minority which is seeking to deliberately confuse the public on the cause of climate change. They are often misrepresenting the science, when the reality is that the evidence is getting stronger every day” (DOB, July 11, 2007). Funding for this well orchestrated campaign to discredit the science of climate change flows, in part, from the fossil fuel industry (Union of Concerned Scientists, Daily Oil Bulletin, January 4, 2007; see also University of Calgary Gauntlet, November 2007). The tactics used by these detractors are similar to those used by the tobacco industry to deny links between smoking and cancer (CBC, The Fifth Estate, Denial Machine, November 2006). The “findings” of detractors are generally posted on (Continued on page 20...)
In accordance with Article VI,subparagraph (a) of the By-Laws,the Nominating Committee hereby calls for Nominations to Stand for Election to the 2009 Executive Committee of the Canadian Society of Petroleum Geologists.
Nominations can be made in two ways:
1) Formal Nominations are to be made in writing,signed by at least twenty-five members in good standing and endorsed by the nominee who is consenting to stand for office.Candidates nominated in this fashion will automatically be added to the Nomination Slate.Nominations should be forwarded to the CSPG office by September 15,2008.The slate of candidates will be published in the November Reservoir and the election will take place on December 4,2008.
2) Informal Nominations can be made via email or letter;please confirm that the nominee is willing to stand for the office of choice and send to CSPG Office to the attention of the Past President.Candidates nominated in this fashion will be considered for addition to the Nomination Slate by the Nominations Committee.
The following vacancies exist for 2009:
• Vice President• Assistant Program Director• Assistant Outreach Director
• Assistant Finance Director• Assistant Services Director• Assistant Communications Director
Successful candidates for the Directorships will serve two-year terms and the elected Vice President,a third one-year term as Past President.Interested parties should contact the office for details and general requirements of service on the Executive.
Internet sites, not in refereed journals and should not influence the society’s stand on these issues.
These articles are not meant to influence the scientific debate on climate change, rather they are meant to influence the general public and thereby influence policy makers. To quote Dressler and Parson (2006): “Well established claims backed by near-universal scientific consensus cannot be readily distinguished from the views of tiny partisan minorities.” The statements of these detractors are not scientific claims,
rather they are political statements (i.e., propaganda) masquerading as science.
“...the fossil record provides many examples of ancient species that either suffered or benefited due to previous climate change.”
This statement is of little comfort to those who care about the welfare of all humans and the Earth’s ecological communities. We are currently in a mass extinction event that may rival the rate of extinction at the end of the Cretaceous. Rapid climate change is an additional stress upon already stressed
ecosystems. A recent report by 1,300 scientists from 95 countries, compiled by the United Nations, estimates that two thirds (15 of 24) of global ecosystems are in decline and may significantly deteriorate over the next 50 years (CBC News, March 30, 2005). Higher ocean temperatures coupled with more acidic seas (due to dissolved CO2 ) results in bleaching of corals and, if temperatures are elevated enough, ultimately death of the organisms. The Great Barrier Reef is at risk of becoming “functionally extinct” within decades (United Nations Report, CBC News, January 20, 2007). Loss of sea ice in the Arctic will result in the collapse of the Arctic marine ecosystem threatening the viability of species dependent upon sea ice for food or habitat (i.e., bowhead whales, walruses, seals, and polar bears). Sea bird colonies including glaucous gulls, and thick-billed murres have declined dramatically in the last few decades. With the loss of summer sea ice the hunting tradition of the Inuit will be in jeopardy.


There is no wrong answer.
At Divestco, we understand what it
to
to
on a
to be a
provider to act in your
You
interests, give you exactly what you need, and only what you want. Divestco’s integrated offering for geological professionals gives you the ability to choose from a wide range of geological products and services to suit your unique needs. Pick anything you want, choose a bundled offer or let our experts create a custom solution for you.
Call Jennifer Davies at 403.537.9904 or email jennifer.davies@divestco.com for more information. Take your pick


To stay within their optimum climatic range, forests migrated at rates of tens of meters per century following the last glaciation. Given current rates of warming, shifts of hundreds of kilometres per century will be required (Pittock, 2005). Forests not in their optimum climatic zone are likely to succumb to heat stress, drought, forest fires, and disease (ibid). The current spread of pine beetles, which is devastating the forests of British Columbia and Alberta, is directly related to climate warming (Allan Carrol, Canadian Forestry Service). It is estimated that within seven years 80% of pines in central British Columbia will be dead (B.C. Forest Service, quoted in The Washington Post, February 28, 2006). In the southwest United States the intensity and number of forest fires has increased dramatically in the last few decades. It is estimated that the American southwest will loose approximately 50 percent of its forest in the next several decades to 100 years. Sky islands, high altitude forests with endemic faunas that have existed since the last glaciation, are succumbing to fire and insect infestation under the current climate regime (New York Times, May 27, 2007). With the loss of not only individual species as well as whole ecosystems, extinction rates will accelerate leading to a loss of potentially useful species but also to impoverishment of our biological community.
Our complex civilizations require constant input of materials and energy. If these interconnected systems break down then our civilization may become vulnerable to partial or total collapse (witness the breakdown of law and order in New Orleans following Hurricane Katrina). A report prepared for (Continued on page 22...)


The CSA certified, intrinsically safe LoadTrak™ Panic Alert device is ideal for oil and gas workers who travel alone or who work in remote or hazardous areas.
Let Panic Alert help your company address potential liability concerns and help you comply with provincial Lone Worker legislation and guidelines.
Panic Alert device will not ignite emissions or fumes and has a 300-metre signal radius from an outfitted vehicle.
Lone workers have access to a 24/7 monitoring centre at the push of a button or, if the worker is immobile, an automatic alert is sent using the sensor/man-down mode.
For more information about Panic Alert, or to locate an authorized LoadTrak dealer near you, visit www.loadtrak.com/workalone or call 1-866-LoadTrk (1-866-562-3875)


variation of less than one degree Celsius per century. The catastrophic warming predicted by the IPCC 20 years ago has given no indication of materializing. Since 1998 global temperatures have not increased at all and a slight cooling trend has set in, already more pronounced in the Southern Hemisphere. All this while CO 2 levels continue to increase.
8. The IPCC is a political organization, not a scientific one. Its mandate was to investigate Anthropogenic Global Warming, not to investigate all and any causes of Climate Change. As a consequence, the Panel has never seriously investigated other causes of climate changes on the planet. There are a number of candidates, mostly of a solar, galactic, and cosmic nature, which affect this planet and others. Theories abound, but the Panel ignores all of them, by saying that the sun’s irradiance variations are insufficient to cause any climate changes. Their computer models do not even include Milankovitch. However, over the last few hundreds of years the correlations with solar activity have been obvious (FriisChristensen, E. and K. Lassen, 1991. Length of the solar cycle: An indicator solar activity closely associated with climate. Science v. 254, p. 698-700.), waiting to be explained by more than radiation. Why does the sun behave as it does? Do the Svensmark Cosmic Ray experiments (which have not been debunked as the IPCC maintains) give a clue to the unpredictable cloud cover? Do heavy planets like Jupiter pull the sun out of the barycentre? Is there a link between that and the cyclic solar interior upheavals, as evident by sunspots and flares?
The science is far from settled, but the political IPCC has caused us to embark on a worldwide scheme to control a rather harmless non-polluting, fertilising gas. Many of the points mentioned above are not geological ones, though some are, as we are discussing climate connections of events such as the Deccan Traps and biological extinctions. But foremost in our current debate about the position of the CSPG must be the consideration that a scientific society will encourage scientific debate, and be faithful to the scientific method and principle of ethics.
The CSPG should never allow itself to be aligned with a politically correct program which rests on unproven hypotheses.
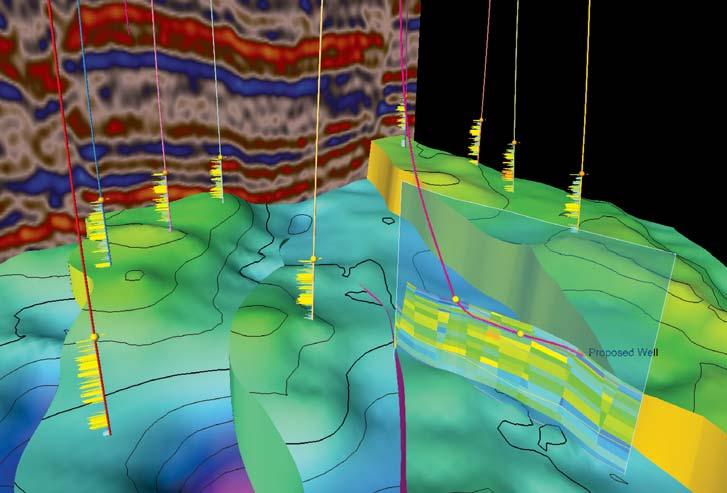

SEISMIC-TO-SIMULATION SOFTWARE AMPLIFIESTHE IMPACT OF E&PTEAMS. One solution uniting the subsurface domains of geophysics, geology, and reservoir engineering—new modeling capabilities better predict fracture geometries and facies distributions, analyze structural uncertainties, and define your well placement strategy.
“It’s like having an extra geologist sitting there. It’s telling you things that you didn’t know, it’s testing your theories like you never saw before and helping you come up with new ideas.” —David Hamilton, CEO, Subsurface Computer Modeling
Schlumberger Information Solutions—step-changing productivity for geoscientists and engineers.
| by: Ray Mireault P. Eng. and Lisa Dean P. Geol., Fekete Associates Inc.
Geologist A is presenting a development prospect. Geologist B is presenting an exploration play. Which should you invest in?
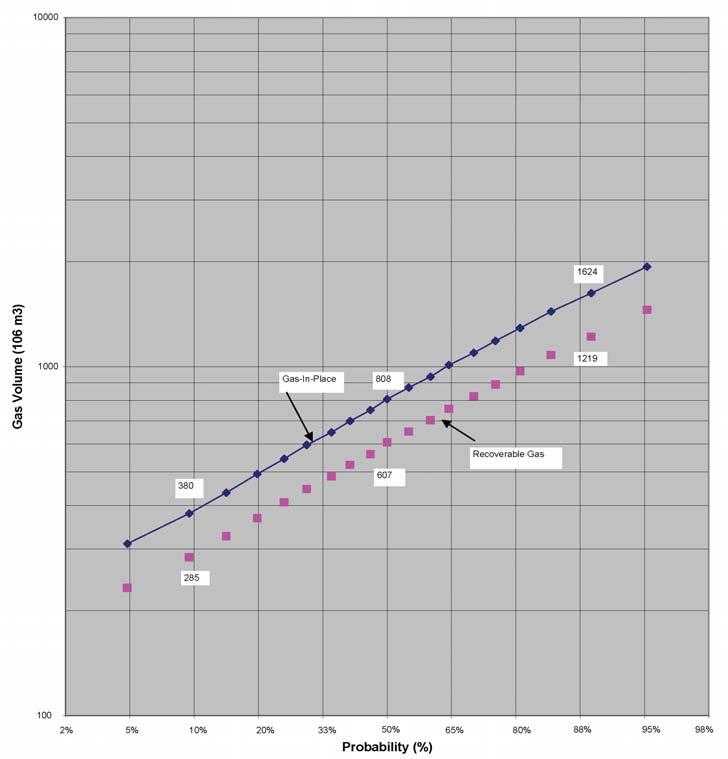
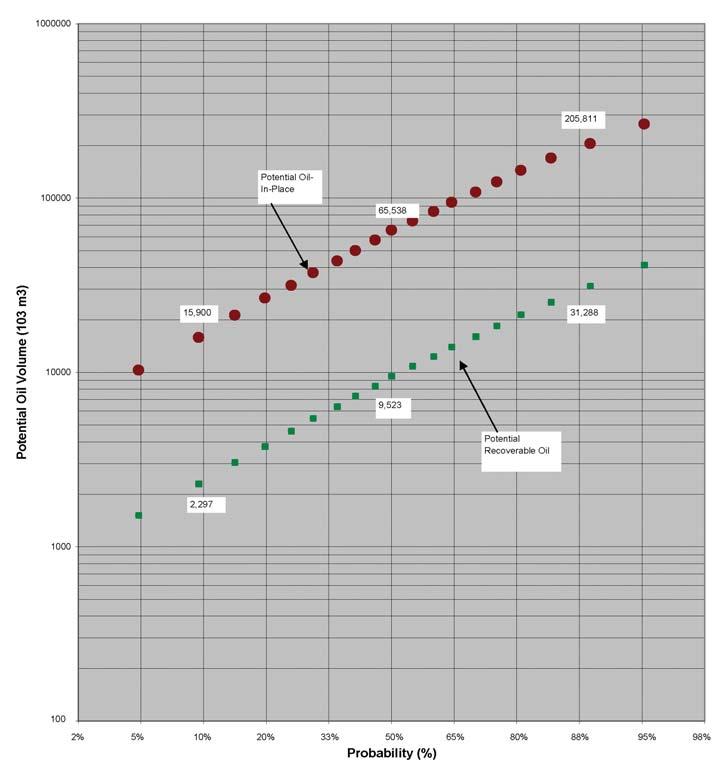
This is a daily question in oil companies. A development prospect is generally considered a “safer” investment but the volume of hydrocarbons and its economic value is limited (Figure 1). The exploration prospect may carry more “dry hole” risk but a company has to make some exploration discoveries or it eventually runs out of development opportunities (Figure 2).
However, simply estimating the size of the deposit is not sufficient. Although Geologist A’s development prospect has a P10 to P90 recoverable gas range of between 258 and 1,219 106 m3 (10 to 43 BCF), it may or may not be a good investment. For example:
• Low permeability reservoir rock may restrict production rates so that each well recovers very little gas over time. The low rate/long life profile may actually have very little economic value.
• The combination of royalty rates, operating costs, processing fees, and transportation tariffs may mean that very little of the sales revenue is retained by the company, despite an apparently attractive commodity sale price outlook.
• Capital costs may simply be too great. If the prospect is located offshore (or at a remote onshore) location, the prospect may contain insufficient gas to offset the required investment capital.
Management needs to know the following about any exploration or development opportunity:
• What are the chances that at least the value of the capital investment will be recovered if we proceed?
• How much capital could be lost if events do not turn out as expected?
• What is the potential gain in economic value if events do unfold as expected?
• What is the total capital commitment required to realize production?
Answering the financial questions would be (relatively) easy if we knew exactly how much oil/gas is in place, the fraction that will be recovered, its sale price when produced, and the associated capital and operating costs. But prior to producing a deposit, we don’t
know any of the foregoing with any degree of precision. We need to assess and balance the uncertainty in our technical knowledge against the impact that the uncertainty has on the expected financial performance (and capital exposure) of the investment.
When consistently applied, Monte Carlo simulation provides a tool to systematically assess the impact of technical uncertainty on financial performance. A consistent approach also enables comparison and ranking of development and exploration opportunities, so a company can identify and pursue its better prospects.
In Fekete’s experience, the following assessment procedure provides a consistent approach to prospect evaluation:
1. Estimate the probable range in OOIP/ OGIP from 3-point estimates for the input parameters in the volumetric equation.
2. Estimate the probable range in recovery
factor from reservoir engineering principles, analogue performance, and/or reservoir simulation.
3. Estimate the total field/pool daily production rate range from the recoverable hydrocarbon range based on a seven year rate-of-take (deplete the field in about 15 years).
4. Estimate the number of wells required to achieve the projected daily production rate from reservoir rock characteristics and test well performance.
5. Estimate the type and size of pipelines, wellsite, and plant facilities required to produce at the forecasted production rates.
6. Estimate operating costs and assess the present day value of production from economic runs. This is the discounted present day value of the sales price less royalties, operating costs, processing fees, and transportation tariffs.
7. Estimate well and facility capital costs.
8. Compare the probable range in economic value to the required capital investment range. Quantify the chances of recovering the capital investment, the expected return on investment, the capital exposure, and the total capital commitment.
The job of the earth sciences (geology, geophysics, reservoir engineering) in a Monte Carlo evaluation is to develop input parameter ranges that reflect the current state of knowledge for the prospect. The recommended approach is an integrated approach that first develops minimum and maximum values that are consistent with the known facts. The end point values must encompass the true value with a high (90 to 95%) degree of certainty. The most likely value is estimated only after establishing the possible range in the parameter values.
Geologist A’s development prospect is a structural trap with 4-way closure that contains a series of stacked fluvial sands at a depth of about 400 m. The sands were initially deposited in a broad valley and are capped with a thick shale sequence. Subsequent basement uplift created the present drape structure. Drilling results
to date set the minimum area of the deposit at 600 ha. Based on the seismic interpretation, the areal extent is most likely about 1000 ha but it could be as large as 1,600 ha (the maximum closure area with the existing data).
The structure is estimated to contain about 46 m of gross sand thickness within a 60 m gross interval. Due to fluvial deposition, the areal extent of an individual sand body is expected to be limited and so not all sands are expected to be gas charged. Accordingly, the average net pay is estimated to be between 12 and 46 m but will most likely be about 21 m.
The geological model and limited cuttings analysis suggest that sand porosity also varies. If the deposit is dominated by argillaceous, highly cemented sands, then average porosity could be as low as 8%. However, porosity will be either better developed or better preserved when fluvial rock is saturated with hydrocarbons, so a large percentage of ultra-clean sands could push the average porosity value to as much as 18%. Assuming average quality sands, porosity will most likely be about 12%.
Currently, there is no good basis from which to estimate the residual water saturation in the gas-bearing sands. The best value for good-quality sands would be 15% Sw. An average water saturation value for the “dirty” fine-grained sands might be about 40% but could be as high as 60% (the maximum value for fine-grained sand).
Well test data indicates that the deposit contains a sweet, 0.7 gravity gas. Two pressure buildup tests indicate a reservoir pressure of 3,448 and 4,138 kPa(abs) for an arithmetic average of 3,793 kPa(abs). Reservoir temperature is estimated at 38°C. The gas deviation factor (Z) at initial reservoir conditions is estimated to be about 0.9.
Sand permeability is expected to vary considerably between individual sands with a range of 3 to 30 mD. Based on experience and reservoir engineering principles, gas recovery from volumetric expansion of a reservoir at shallow depth is generally in the order of 70 to 85%. Due to the limited areal extent of the sands, the most likely value is estimated at 75%
The following table summarizes the input parameters that were used to develop the volumetric estimates of gas-in-place and recoverable gas for the development prospect:
OGIP=A*h* * (1-S W ) * (Ts* Pi ) (Ps* Tf * Z)
Once 3-point estimates have been developed, Monte Carlo simulation can be used to calculate the gas-in-place and recoverable gas volumes. Monte Carlo simulation consists of randomly selecting values for each input parameter and calculating a gas-in-place and recoverable gas volume. Many iterations (in this case 10,000) creates gas-in-place and recoverable gas distributions.
From the simulation, Geologist A’s gas development prospect has an 80% probability of containing between 380 and 1,624 106m3 of gas-in-place. Based on the technical input,
there is an 80% chance that the recoverable gas volume is between 285 and 1,219 106m3 of gas. The mathematical significance of the P50 value is that it is the number that splits the distribution into 2 equal halves.
An obvious question is why can’t we simply multiply all the minimum input parameter values to determine the minimum gas volume and all the maximum values for the maximum volume? Doing so yields the following values:
inspection of the probability graph (Figure 1) the chances of recovering more than 120 106m3 of gas are greater than 98% (100-2%). At the other end of the scale, there is less than a 2% chance of producing 3,880 106m3 from the prospect (the probability value corresponding to 3,880 106m3 is well off the scale).
The reason for the large discrepancies is because the error in the product of multiplication successively increases with each multiplication, unlike addition. To illustrate, if the estimated value for each input parameter is out by 17%, the sum of addition will also be out by 17%. Not so with multiplication:
Even alternating from a conservative to an optimistic estimate doesn’t completely cancel out the errors when multiplying.
In this article we have outlined the rationale for Monte Carlo Simulation. Geologist A’s development prospect was used as an example. In next month’s article, we will present Geologist B’s exploration prospect and then compare the two Monte Carlo Simulation outcomes, clearly showing how Monte Carlo can be used to determine economic viability and therefore aid in business decisions!
This article was contributed by Fekete Associates, Inc. For more information, contact Lisa Dean at Fekete Associates, Inc.
As can be seen, the minimum values are much less than the P90 values calculated previously and the maximum values are much greater. Even a calculation using the most likely values doesn’t match the P50 values very well. From
(...Continued from page 22)
Temperature increase, due to changes in various climate drivers, is one of the easiest variables to model. Large-scale climate trends can be modelled with a fair degree of certainty although regional trends are not as readily simulated due, in large part, to computational limitations. A very good fit with historical data has been achieved from models incorporating both man made and natural climate drivers (see Weaver in Coward and Weaver, 2004). The current warming over the last 50 years, based on these models, is attributed predominantly to the enhanced greenhouse effect from anthropogenic sources, while changes in solar radiation accounts for a portion of the warming. Warming in the first half of the 20th century is attributed largely to increased solar output while the midcentury cooling is attributed to sulphur emissions due to burning of coal (Dessler and Parson, 2006).
I maintain that our duty to society is to provide unbiased information that accurately reflects the state of scientific knowledge at this time. The position paper fails to achieve this by presenting a highly selective reading of the current state of knowledge both of current climate change and of paleo-climates. In addition,
the findings of the atmospheric science community are discredited or presented as being highly uncertain. This judgement is not backed up by refereed articles nor is it a judgement by people engaged in the research. If we as a scientific organization wish to challenge the research of thousands of scientists then we must be able to present independent research to back our statements and be willing to have them critically scrutinized by the entire scientific community. Although we may not like the findings of the atmospheric science community, casting aspersion upon their conclusions reduces us to the status of an advocacy group for our industry as opposed to a scientific organization.
Bowen, G. J., Bralower, T. J., Delaney, M. L., Dickens, G. R., Kelly, D.C., Koch, P.L., Kump, L.R., Meng, J., Sloan, L.C., Thomas, E., Wing, S.L., and Zachos, J.C. 2006. The PaleoceneEocene thermal maximum gives insights into greenhouse gas induced environmental and biotic change. www.geosc.psu.edu/people/ faculty/personalpage/tbralower/Bowen.
Chesworth, W. 2006. Review of books: A Poverty of Reason: Sustainable Development and Economic Growth, Beckerman, W. 2003 and Re-thinking Green: Alternatives to
Environmental Bureaucracy Close, C.P. and Higgs, R. 2005. Geoscience Canada Vol. 33, No. 5, p. 143-144.
Coward, H. and Weaver, A.J. (eds.). 2004. Hard Choices, climate change in Canada. Wilfrid Laurier University Press, Waterloo, 255p.
Dressler, A.E. and Parson, E.A. 2006. The Science and Politics of Global Climate Change, a Guide to the Debate. Cambridge University Press, New York, 179p.
Grimm, K. 2006. Katrina, Wilma and Me: Learning to Live with Climate Surprises? Geoscience Canada,Vol. 33, No. 2, p. 76-80.
Houghton, J. 2004. Global Warming, the Complete Briefing, Third Edition. Cambridge University Press, New York, 332p.
International Panel on Climate Change. 2007. Climate Change 2007: The Physical Sciences Basis.
Pittock, A. B. 2005, Climate Change, Turning up the heat, CSIRO Publications, Collingwood, Australia, 295p.
Wingall, P.G. 2007. The End-Permian mass extinction – how bad did it get? Geobiology Vol. 5, p. 303-309.


adjacent levee/overbank deposits in space and time is presented, in addition to a brief discussion of reservoir implications.
Based on a detailed study of facies and stratigraphic architecture, IC3 comprises four vertically stacked, nested, erosivelybased channel units (C1 to C4). Basal scours are traceable across the study area (i.e., >1.6 km long) and correspond to major incision events that eroded part of the underlying channel unit.
The base of the entire channel complex forms a smooth, shallow-dipping surface (<1°) that becomes more irregular along the channel margin. Part of this surface coincides with the base of channel unit C1, which incises the top of a regionally extensive carbonate-clast-rich debrite. Laterally, the basal surface becomes steeper and terraced along the northwest margin where it partially truncates adjacent sandstone-rich levee deposits, including a quartz-clast debrite (Figure 2a). On the opposite side (southeast margin), the basal surface is mostly marked by interfingering of sandstone-rich channel fills and mudstonerich levee units (Figure 2b). These observed differences are interpreted, respectively, to be the result of differences in the nature of sediment transport and deposition along the outer-bend (cut-bank) margin and innerbend (point bar) margin of the channel. The base of IC3, therefore, is an asymmetrical, composite feature related to multiple episodes of channel system development (Navarro et al., 2007a, b).
Channel units exhibit a lateral offset stacking pattern toward the northwest, which is interpreted to be associated with a long-term unidirectional migration of the entire channel-levee complex (Figure 1). The lateral migration of IC3 was punctuated by repeated re-incision events marked by the major scour at the base of each channel unit.
Channel units comprise a number of genetically related channel fills. Channel fills in the lower part of IC3 are broad (estimated 1.6 km), but become narrower upward ( 600 m). This suggests that the width of the channel belt decreased upward (Figure 1), and reflects temporal changes in flow or slope conditions of the channel system. For example, sediment supply and caliber likely diminished with time, and as a consequence the volume, density, thickness, and sand-to-mud ratio of channel-filling flows progressively decreased. Coincident with these changes
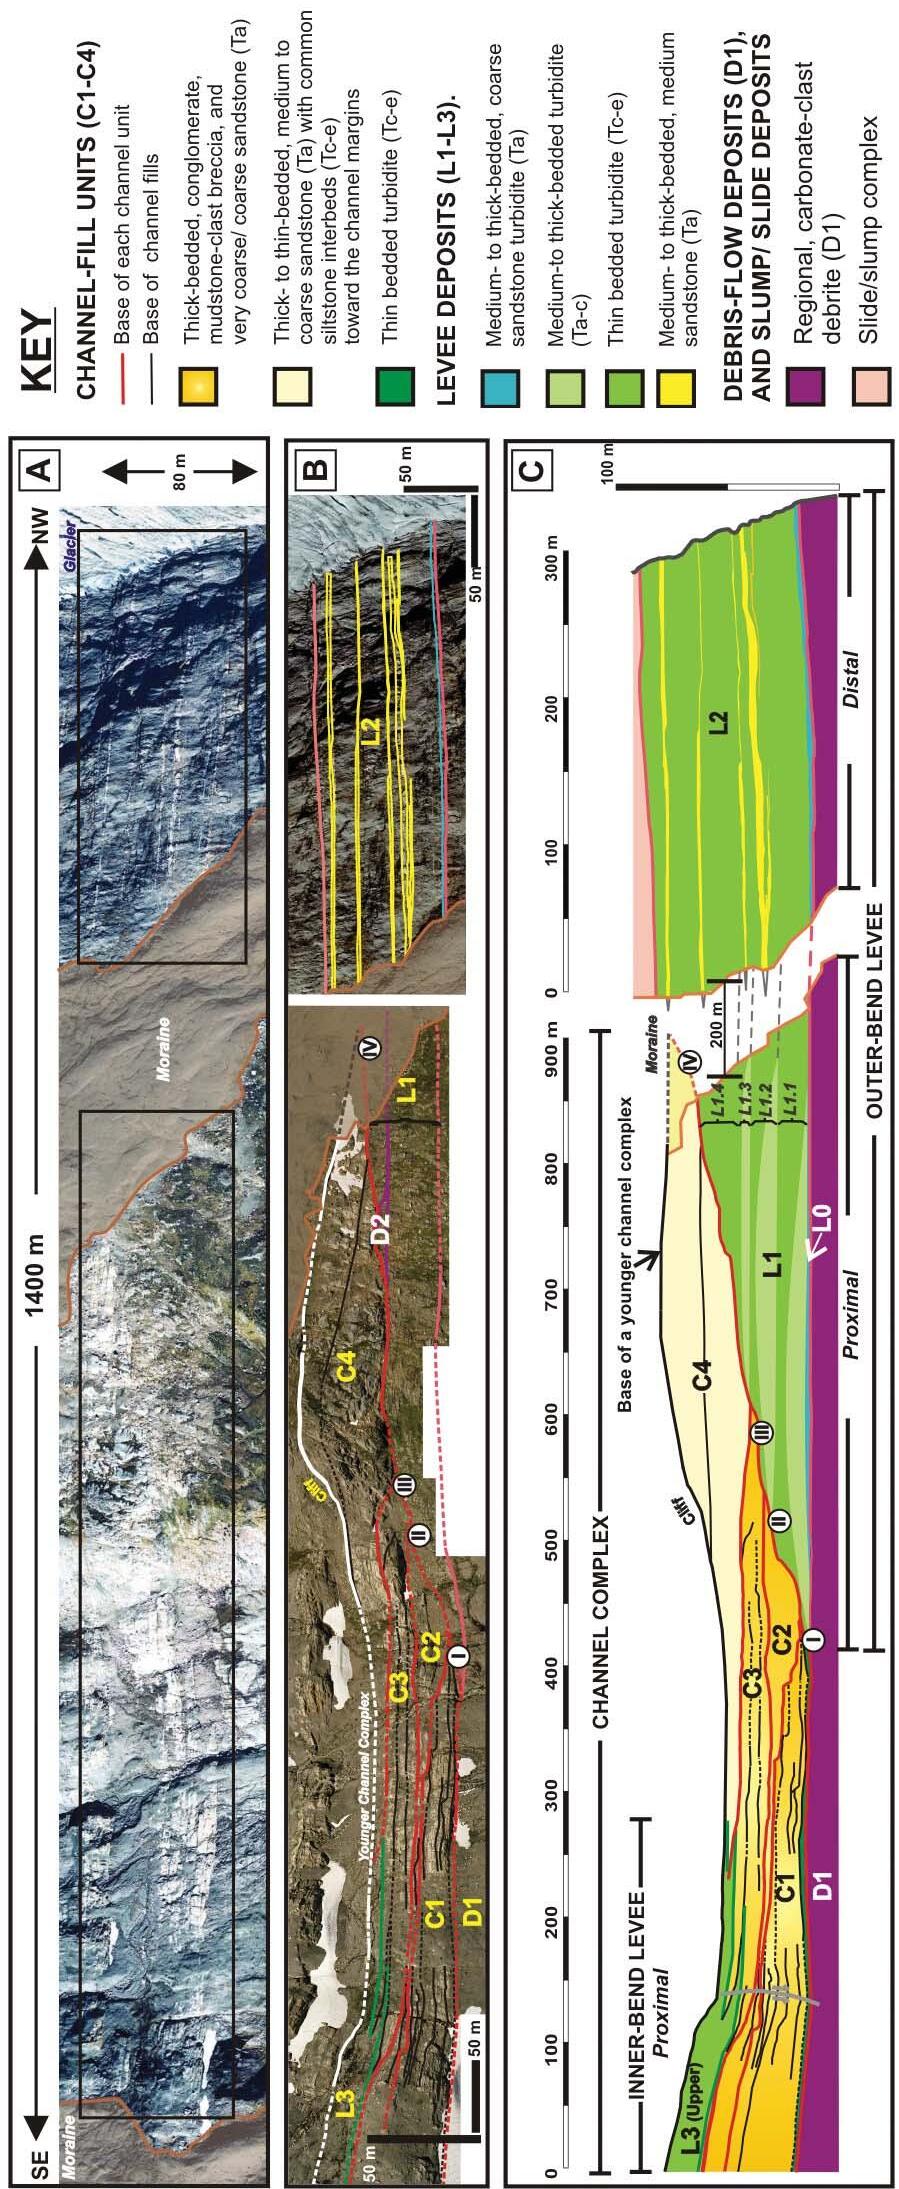
Figure 1. Internal architecture of Isaac Channel 3 (From Navarro et al., 2007a, b). (A) Aerial photo of 1.4 kmoutcrop belt. ( B) Photomosaic of IC3, showing major channel units (C1-C4), proximal levee deposits (L1 and L3), distal levee deposits (L2), and debris-flow deposits (D1). L1 overlies an overbank lobe (L0) and includes four levee packages (L1.1-L1 .4). L2 includes overbank-splay deposits (bright yellow). (C) Schematic architectural panel illustrating the channel network and coeval levee deposits.
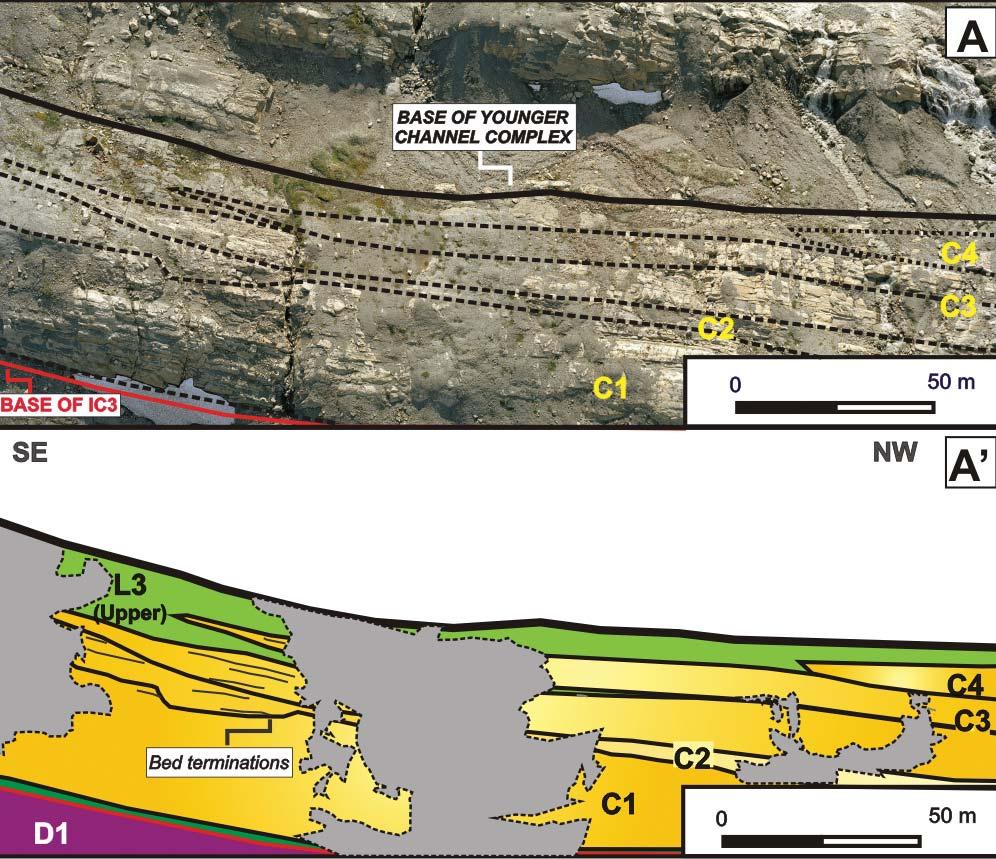
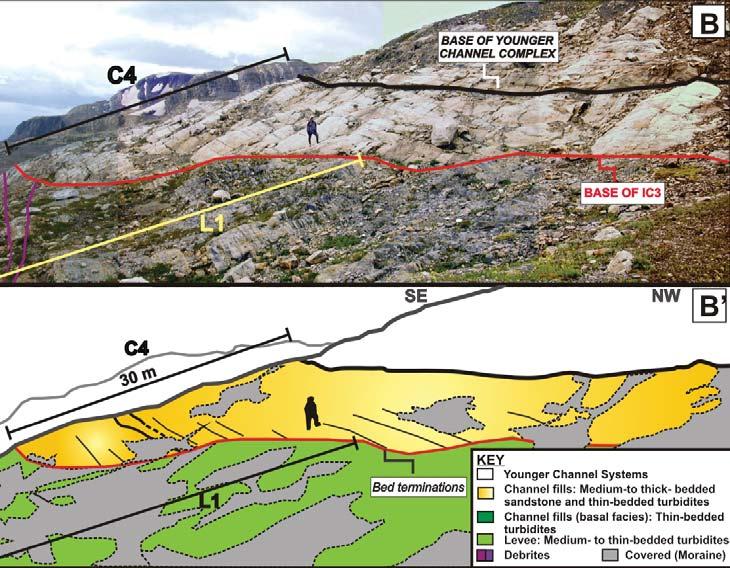
Figure 2. (A,B = uninterpreted; A’,B’ = interpreted) Channel and levee units along the SE and NW margins (A, A’ and B, B’, respectively) of upper channel fills of IC3 (From Navarro et al., 2007b). (A, A’) Inner channel bend: channel fills of channel units C3 (uppermost) and C4 interfingering with thin-bedded levee strata (L3) deposited by lower energy overbanking flows on the inner channel-bend. (B, B’) Outer channel bend levee: channel fills of channel unit C4 onlap quartz-clast debrite (D2) and fine-grained outer-bend levee strata (L1) deposited by more energetic overbanking flows on the outer channel bend, or cutbank side, of the channel.
was an increase in the confinement and probably in sinuosity of the channel system. These observed and interpreted changes of the stratigraphic evolution of IC3 are similar to those identified and interpreted from high-resolution seismic images of modern channel systems (e.g., Indus Fan, offshore Gulf of Mexico, Nile Delta).
Channel units are laterally and vertically amalgamated, and each shows variations in lithofacies, geometry, and internal bed amalgamation according to position (axis versus margin) within the channel units.
A diversity of facies associations are recognized at the base of channel units (i.e., basal facies associations): (a) <2 m thick succession of thinly-bedded sandstone interbedded with mudstone (Tb-e Bouma turbidites) at the base of C1, which were deposited from the low-concentration tail region of energetic turbidity currents; (b) up to 8 m thick, mudstone-clast breccia layers with variable lateral continuity. These strata overlie the base of C2 and locally C3 and are composed of abundant, generally angular mudstone clasts eroded from fine-grained strata associated with older channel fills or laterally adjacent levee deposits, and/or upstream erosion and downslope transport by sandy and gravelly, high-concentration turbidity currents; and (c) gently inclined succession (<3 m thick) observed at the base of C4, consisting of massive sandstone interstratified with mudstone-clast breccia lenses. All three basal facies associations, which are then overlain by channel-fill strata, represent bypass deposits wherein the vast majority of the flow moved through the channel and deposited in areas further downdip. Basal facies, especially finegrained strata and breccia would most likely represent important permeability barriers and baffles within IC3.
The main part of each channel fill is 7-30 m thick and commonly shows a fining- and thinning-upward trend, as does IC3 as a whole. Lower channel fills (C1 and C2) are composed mostly of pebble to granule conglomerate (Figure 3a), whereas upper channel fills (C3 and C4) consist of sandstone (Figure 3c) and granule conglomerate. Channel-axis deposits are thick-bedded (up to 2.5 m thick), normal graded or massive conglomerate and sandstone, with net-togross ratios above 80%. Beds are typically amalgamated and their lateral continuity is highly variable, ranging from tens to hundreds of meters. Mudstone-clast breccia are also common (Figure 3b). Coarsegrained deposits correspond to the Ta
(Continued on page
(...Continued from page 31) turbidite Bouma division, or R3 and S3 Lowe divisions, and were deposited by gravel- and sand-rich, high-concentration turbulent flows. Normal coarse-tail graded beds suggest differential grain settling during transport and deposition from these concentrated flows, or a decrease in coarse sediment supply associated with a rapidly waning flow. Massive deposits, on the other hand, suggest higher instantaneous rates of sediment deposition beneath a rapidly collapsing turbulent suspension.
In contrast, channel-margin deposits, especially those in the upper channel units (C3 and C4), are more heterolithic (Figures 2b, 3d). Away from the channel axis, coarsegrained strata grade from amalgamated sandstone to less amalgamated, more interbedded thin- to thick-bedded, coarsegrained sandstone and thin- to mediumbedded, upper-division turbidites, exhibiting a dramatic decrease in net-to-gross ratios (in the order of 60-70%). Coarse-grained strata tend to thin rapidly over a few hundreds of meters. Sandstone beds consist of Ta (Bouma) or S3 (Lowe) strata, and Tb turbidites, and, respectively, represent suspension deposition from concentrated flows and traction transport/deposition under upper-stage plane bed. These strata are intercalated with thinly bedded Tcd and Tcde Bouma turbidites related to deposition from lower-energy, low-concentration turbidity currents. The onlap and persistent thinning of beds near the margins of the uppermost channel fills is interpreted to indicate lower energy conditions along the periphery of larger flows that preferentially exploited the axes of the channels.
Finally, the vertical and lateral changes observed in channel strata of IC3, as well as its distinctive margin architecture, are interpreted to reflect temporal and spatial changes in depositional style and pattern caused by changes in sediment supply and slope conditions.
AS RESERVOIR ANALOGUE
IC3 is a superb outcrop example of an ancient submarine channel-levee system, and has many sedimentological and stratigraphic attributes in common with previously described ancient channel-levee systems (e.g., Cerro Toro Formation in Chile, Pab Formation in Pakistan, and Kirkgeçit Formation in Turkey). However, IC3 strata are so well exposed and preserved, in addition to the fact that they were deposited on a passive margin, potentially makes this
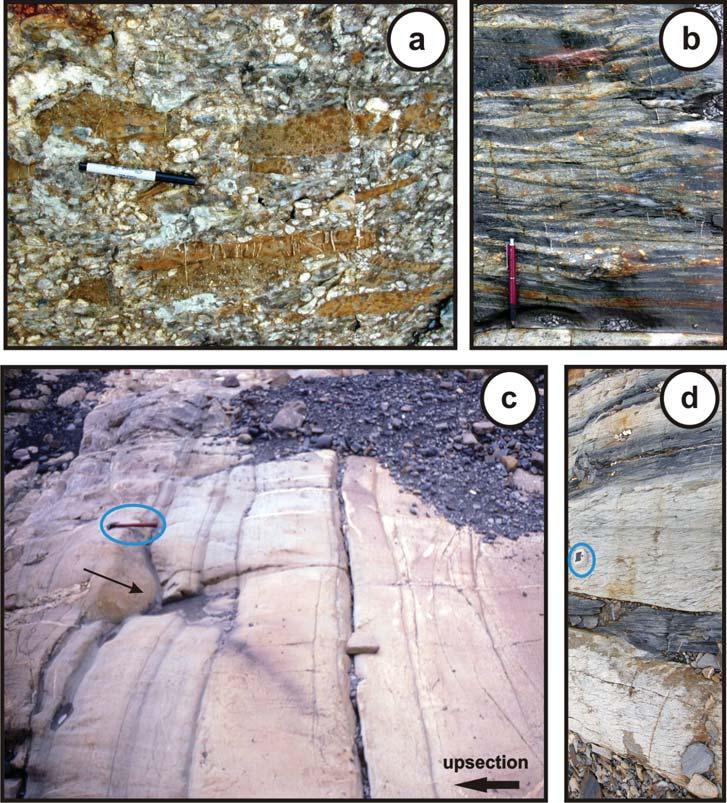
Figure 3. Photos of channel-fill lithofacies. A) Poorly sorted, clast-supported pebble conglomerate with dispersed large carbonate clasts (brownish-orange weathered) embedded in a quartz-rich matrix of grains from fine-sand to pebble size. These deposits occur in channel unit C1; (B) Detail of mudstone-clast breccia, in which grey, elongated clasts distributed randomly or sub-parallel to bedding are embedded in a poorly sorted, coarse-grained matrix. Some breccias are formed from upslope erosion (rip-up clasts), but others, like the one shown here, were derived most likely from post-depositional processes (i.e., in-situ fluidization and injection); C) common massive and normally-graded sandstone beds observed in the channel axis with local U-shaped scours (arrow); D) typical normally graded sandstone interbedded with siltstone/fi ne sandstone beds along the (northwest) channel margin of channel unit C4. Compass as scale.
channel-levee complex a unique ancient analogue for predicting and estimating stratal architecture and continuity in the many passive-margin, deep-water channel-levee hydrocarbon reservoirs being currently explored and developed around the world.
Arnott, R.W.C. and Ross, G.M. 2008. Overview of the (Neoproterozoic) Windermere Supergroup of the southern Canadian Cordillera. Canadian Society of Petroleum Geologists Reservoir, Vol. 35, Issue 2, p. 35-38.
Navarro, L., Khan, Z. A., and Arnott, R.W.C. 2007a. Architecture of a Deep-water Channellevee Complex: Channel 3, Castle Creek South, Isaac Formation, Windermere Supergroup, British Columbia, Canada. In T. Nilsen and G.
Steffens, editors, Atlas of Deep-Water Outcrops, AAPG, Special Publication 56.
Navarro, L., Khan Z. A., and Arnott, R.W.C. 2007b. Depositional architecture and evolution of a deep-marine channel-levee Complex: Isaac Formation, Windermere Supergroup, British Columbia, Canada. In T. Nilsen and G. Steffens, editors, Atlas of Deep-Water Outcrops, AAPG, Special Publication 56 (CD-ROM paper).
Our ongoing research of the WSG is funded by the industry members of the Windermere Consortium (Anadarko Petroleum, Canadian Natural Resources Ltd., Devon Petroleum Ltd., Husky Energy, Encana Corp., Nexen Inc., and Shell) and an NSERC Collaborative Research and Development Grant.
Thank you to all the volunteers on the Organizing Committee who made the 2008 CSPG CSEG CWLS Convention a success!
General Co-Chair (CSPG)
Bruce Shultz
Huron Energy
General Co-Chair (CSEG)
Tooney Fink ConocoPhillips Canada
General Co-Chair (CWLS)
Brian Glover Petro-Canada Oil & Gas
Finance Chair
Darren Aldridge Baker Atlas
Sponsorship Chair
Terry McCoy Calvalley Petroleum Inc
Exhibits Chair
Florence Reynolds Nexen Inc.
Exhibits Committee
Victor Irwin Divestco
Publications Chair
Fiona MacDonald Schlumberger - DCS
Special Events Chair
Laura Brick geoLOGIC systems ltd.
Volunteer Coordinator
Lyndsey Nicholas Absolute Imaging
Technical Prog. Co-Chair (CSPG)
Scott Leroux EnCana
Technical Prog. Co-Chair (CSEG)
Ken Hedlin Husky Energy
Technical Prog. Co-Chair (CWLS)
Brian Glover Petro-Canada Oil & Gas
Field Trips (CSPG)
Krista Jewett BG Canada
Lori Meyer Imperial Oil
Short Courses (CSPG)
Travis Hobbs EnCana
Julia Feltham Compton Petroleum
Short Courses (CSEG)
Bill Nickerson Global Geosolutions Inc.
Short Courses (CWLS)
Nicole Lehocky Weatherford Canada Partnership
Andy Anderson Weatherford Canada Partnership
Posters
Darren Singleton IHS
Greg Cave Consultant
Core Conference
Richard Harris EnCana
Brian Zaitlin Suncor Energy
Carly Frank EnCana
Chris Podetz EnCana
Jonah Resnick EnCana
Lana Sharp EnCana
Judging & Awards
Gary Taylor Imperial Oil
Sarah Cutten ARC Resources
Angie Webster GR Petrology Consultants Inc.
Logistics
Adam MacDonald EnCana
For more on field seminars and short courses, call 918-560-2650 or visit www.aapg.org/education.
Lewis & Clark Geotour: Marias River To Gates
Of The Mountains, Montana
September 9-14, 2008 / Begins and ends in Great Falls, MT
William B. Hansen, Jireh Consulting Services, Great Falls, MT http://www.aapg.org/education/fieldseminars/details.cfm?ID=19
Modern Terrigenous Clastic Depositional Environments
September 25-October 2, 2008 / Begins in Columbia and ends in Charleston, SC
Walter J. Sexton, Athena Technologies, Inc., Columbia, SC
http://www.aapg.org/education/fieldseminars/details.cfm?ID=60
Fall Education Conference On Structural Geology
September 15-19, 2008 / Houston, TX
Eight top-notch courses around the theme of Structural Geology, with 10 renowned instructors: John Lorenz, Ronald Nelson, Martin Traugott, Mark Zoback, Russell Davies, Ken McClay, Vivek Chitale, Paul Elliott, Fred Hilterman, and Mark Rowan. http://www.aapg.org/education/fec.cfm
Interpretation Of Old DST’s For Bypassed Pay Potential
September 25-27, 2008 / Denver, CO, following the SPE Annual Meeting
Hugh W. Reid, Hugh W. Reid & Associates, Calgary, AB, Canada
http://www.aapg.org/education/shortcourse/details.cfm?ID=111


Computer Mapping For Petroleum Exploration
July 9-10, 2008 / Dallas, TX
Hannes Leetaru, Illinois State Geological Survey, Champaign, IL
http://www.aapg.org/education/shortcourse/details.cfm?ID=48
Seismic Interpretation Of Compressive Structures
July 19-25, 2008 / Begins and ends in Calgary, AB, Canada
John Shaw, Harvard University, Cambridge, MA; Dr. Frank Bilotti, Chevron, Houston, TX
http://www.aapg.org/education/fieldseminars/details.cfm?ID=112
Basic Well Log Analysis
July 22-25, 2008 / Denver, CO
George Asquith, Texas Tech University, Lubbock, TX; Daniel Krygowski, The Discovery Group, Denver, CO
http://www.aapg.org/education/shortcourse/details.cfm?ID=45


| by Ashton Embry
In my initial article in this series, I emphasized that sequence stratigraphy is one of a number of stratigraphic disciplines with each discipline characterized by a specific type of stratigraphic surface used for correlation and unit definition. I defined sequence stratigraphy as 1) the recognition and correlation of stratigraphic surfaces which represent changes in depositional trends in the rock record and 2) the description and interpretation of resulting, genetic stratigraphic units bound by those surfaces. Sequence stratigraphic thought has traveled a long and bumpy road to arrive at our current understanding of the discipline and that succinct definition.
In this article and the following one, I will describe the history of sequence stratigraphic analysis from its first vestiges, which were part of the birth of modern geology, to its current state, which is vibrant but burdened by invisible surfaces, an overblown jargon, and questionable methodologies.
Sequence stratigraphy has been slowly evolving ever since the late 1700s when James Hutton, the father of modern geology, first recognized an unconformity as a specific type of stratigraphic surface and realized that it represented a substantial time gap. From that time onward, unconformities were seen as very useful stratigraphic surfaces for correlation and bounding stratigraphic units and for unraveling geological history. Because an unconformity represents a change in depositional trend, it is one of the main surfaces employed in sequence stratigraphy. Thus, it can be said that sequence stratigraphy began at the moment Hutton conceptualized an unconformity.
During the 1800s, debate began on whether unconformities were generated by a rise of the land surface (tectonics) or by a fall in sea level (eustasy). By the end of the century the tectonics interpretation was favoured
and unconformities, and the episodes of diastrophism they represented, were seen as the key to global correlations. In the first two decades of the 20th century, key relationships associated with unconformities were recognized. Grabau (1906) described stratigraphic truncation below the unconformity and stratigraphic onlap above it. Barrell (1917) provided the first deductive model for sequence stratigraphy when he introduced the concept of base level, an abstract surface which acts as the ceiling for sedimentation, and proposed that cycles of base level rise and fall produced repeated unconformities in the stratigraphic record. Notably, he also defined a diastem which, in contrast to an unconformity, is a stratigraphic surface which represents an insignificant gap in the stratigraphic record. Unfortunately Barrell was struck down by the Spanish Flu soon after his paper on base level and unconformities was published, and his “ahead (Continued on page 36...)
of their time” concepts lay in limbo for a long time.
In the 1930s small-scale, unconformitybounded units were recognized in the Carboniferous strata of the mid-continent and were called cyclothems (Weller, 1930; Wanless and Shepard, 1936). We now know that these cyclothems were generated by numerous eustatic rises and fall in sea level related to the waxing and waning of the Gondwana glaciers. However, at the time of their recognition, there was fierce debate as to whether cyclothems were the product of tectonics or eustasy.
Sequence stratigraphy began as a specific stratigraphic discipline almost 60 years ago when Sloss et al. (1949) coined the term sequence for a stratigraphic unit bounded by large-magnitude, regional unconformities which spanned most of North America. Krumbein and Sloss (1951, p. 380-381) elaborated on the concept of a sequence which they characterized as a “major tectonic cycle.” It was not until the early 1960s that Sloss (1963) fully developed the concept and named six sequences which occurred throughout North America. Sloss (1963) interpreted that the unconformities which bound his sequences were generated by repeated episodes of continent-wide, tectonic uplift.
After Sloss et al. (1949) gave us the concept of a sequence, Harry Wheeler published a series of papers (Wheeler and Murray, 1957; Wheeler 1958, 1959, 1964a, 1964b) which used theoretical deduction to provide a foundation for the development of unconformities and consequent sequences. The main parameters in Wheeler’s model, like that of Barrell (1917), were sediment supply and rising and falling base level (base level transit cycles). Wheeler (1958, 1959) provided real-world examples of unconformity-bounded sequences to support his model. In most cases, the recognized unconformities were of smaller magnitude than the continent-wide unconformities of Sloss (1963) and many of the unconformities of Wheeler (1958, 1959) disappeared in a basinward direction. As illustrated by Wheeler (1958, Fig. 3), where one of the bounding unconformities disappeared, that specific sequence was no longer recognizable. Thus to Wheeler (1958), a sequence was a unit bounded by unconformities over its entire extent.
The result of defining a sequence as a unit bounded entirely by unconformities was that most sequences occurred only on the
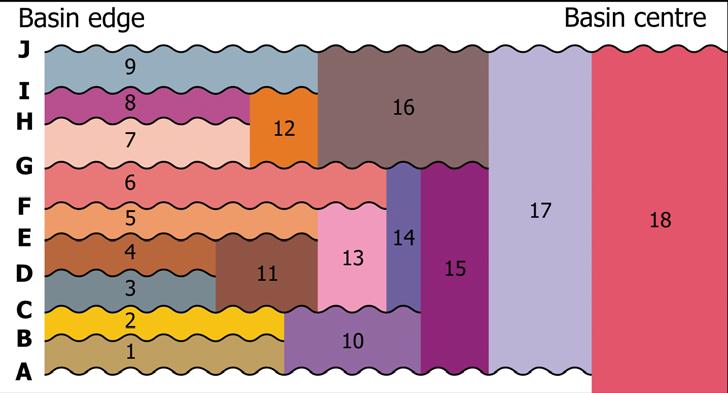
Figure 1. The occurrence of 10 unconformities on the basin margin allows 9 “unconformity-only” sequences to be defined. Because each unconformity extends a different distance into the basin, a new series of “unconformityonly” sequences has to be defined each time an unconformity disappears. Such a chaotic nomenclatural system and the lack of subdivision over much of the basin ensured that the “unconformity-only” sequences of Wheeler (1958) were not widely adopted.
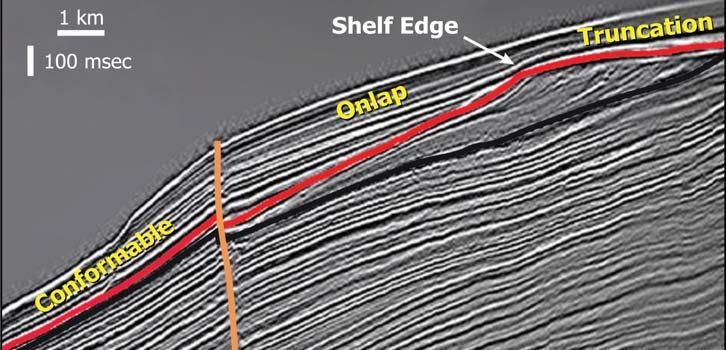
Figure 2. A seismically delineated sequence boundary (red line) exhibits of a variety of specific stratigraphic relationships along its length indicating that different types of surfaces comprise the boundary. On the basin flank the boundary is characterized by truncation whereas further basinward it exhibits marine onlap. Toward the basin centre the boundary is a correlative conformity. Seismic line from Quaternary succession of the Gulf of Mexico, Desoto Canyon area. (modified from Posamentier, 2003).
flanks of a basin where major breaks in the stratigraphic record were common and readily recognized. Nomenclatural problems occurred as unconformities appeared and disappeared along depositional strike and basinward and new sequences had to be recognized at every place this happened (Figure 1). Furthermore, unconformitybounded sequences had very limited value for subdividing the more central successions of a basin where breaks in the record were absent or very subtle.
In summary, by the mid 1960s, sequence stratigraphy was characterized by two separate approaches, one of data-driven empiricism as exemplified by the work of Sloss (1963) and the other of theoretical deduction as used by Wheeler (1958). Notably, both approaches came to a similar place, that of a sequence being a unit bounded by subaerial unconformities generated by base level fall (tectonic uplift or eustatic fall).
The pre-modern era in sequence history came to a close in the mid 1960s with the publication of Kansas Geological Survey Bulletin 169 (Merriam, 1964) which summarized the concepts on cyclic sedimentation and unconformity development up to that date. After this, interest in sequence stratigraphy waned as the focus of sedimentary geology switched to process sedimentology and facies models. In the mid 1970s a few new terms were introduced. Frazier (1974) named unitbounded marine starvation surfaces (today’s maximum flooding surfaces) a depositional complex and Chang (1976) renamed a sequence as defined by Sloss et al. (1949) as a synthem. Neither of these suggestions was embraced by the stratigraphic community and sequence stratigraphy remained in the closet until Exxon researchers published their revolutionary concepts and methods.
PETER VAIL AND SEISMIC DATA
Interest in sequence stratigraphy was revived
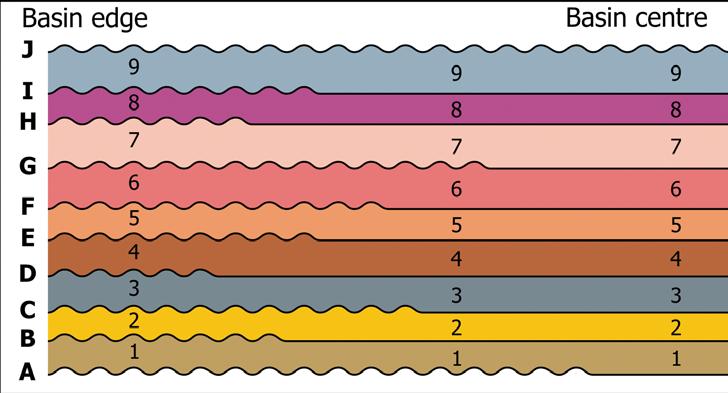
Figure 3. The same 10 unconformities as shown on Figure 1 are present on the basin flank and the same 9 depositional sequences are delineated. With Mitchum et al.’s (1977) addition of the “correlative conformity” to the definition of a sequence boundary, the same 9 sequences can be extended over the entire basin. This resolved the nomenclatural nightmare of “unconformity-only” sequences and the lack of subdivision in the central portions of a basin.
in 1977 with the publication of AAPG Memoir 26 on Seismic Stratigraphy (Payton, 1977). In this watershed publication, Peter Vail and his colleagues from Exxon used regional seismic lines as their primary data base and demonstrated that the sedimentary record consists of a series of units that are bound mainly by unconformities (Vail et al., 1977). This was accomplished on the reasonable assumptions that many seismic reflectors parallel stratal surfaces and that unconformities coincided with seismic reflectors at which other reflectors terminated due to truncation, toplap, onlap, or downlap. In essence, Vail et al. (1977) used seismic data to delineate unconformities by way of the seismically imaged, geometric relationships of the strata.
A number of the Exxon researchers, including Peter Vail, had been graduate students under Larry Sloss and it is not surprising that the seismically determined, unconformityrelated units were termed “depositional sequences” by the Exxon scientists. On the basin flanks, a sequence-bounding reflector was characterized by truncation below and onlap above and appeared to be similar to the unconformity used by Sloss et al. (1949) and Wheeler (1958) to bound a sequence (i.e., an unconformity formed mainly by subaerial erosion). Of critical importance was the observation that the reflector that encompassed this truncation unconformity on the basin flanks could be traced into the more central areas of the basin where it had different character. In some areas the reflector exhibited no evidence of missing section and these portions were termed the correlative conformity part of the sequence boundary. More commonly, the reflector exhibited unconformable relationships characterized by either marine onlap or by marine downlap. Thus a sequence boundary,
as delineated with seismic data, seemed to be a composite boundary characterized by a truncation unconformity on the basin flanks and by marine unconformities and stretches of correlative conformities in the more central portions of the basin (Figure 2). On the basis of these observations, Mitchum et al. (1977) proposed a new definition of a sequence – “a stratigraphic unit composed of a relatively conformable succession of strata bounded at its top and bottom by unconformities or correlative conformities.”
The new definition essentially revolutionized sequence stratigraphy. With it, the stratigraphic succession of a given basin could be subdivided into a series of sequences which could be recognized over most or all of a basin (Figure 3). The problems that had prevented the acceptance of the unconformity-only bounded sequences of Sloss (1963) and Wheeler (1958) were thus resolved and new life was breathed into sequence stratigraphy. Overall, the Exxon seismic data clearly demonstrated that sequence boundaries are key, regional correlation horizons and that sequences are the most practical units to use for stratigraphic subdivision if one wants to describe and interpret the depositional history of a stratigraphic succession.
One of the most innovative aspects of the Vail et al. (1977) sequence boundary is that it is a composite of different types of stratigraphic surfaces rather than one specific type of surface. It is this composite nature of a sequence boundary which allows sequences to the correlated over large areas of a basin and is the key to the great utility of such a boundary. One problem associated with the seismically delineated, composite sequence boundary was the uncertainty of the specific nature of the surface types which comprised a sequence boundary. Such
uncertainty stems mainly from the poor vertical resolution of the seismic data which was available at the time Vail et al. (1977) were doing their studies. In most instances, individual reflectors comprised 20-30 metres of strata and thus the seismic data were not adequate to resolve the necessary details to confidently identify all the specific types of stratigraphic surfaces which were generating the reflectors that were designated as sequence boundaries on seismic sections. On the basis of truncation/onlap relationships, a reasonable interpretation was that subaerial unconformities formed the sequence boundaries on the basin flanks. However, it was very uncertain what specific types of stratigraphic surfaces formed the seismically determined, marine unconformities and the correlative conformities of the sequence boundaries farther basinward. Furthermore, in some cases, such as for the “downlap surface” or a toplap unconformity, it was uncertain whether or not the seismically imaged unconformity (apparent truncation of reflectors) was a real unconformity or was an artifact of the low seismic resolution (merging rather than terminating strata). This uncertainty regarding the specific types of stratigraphic surfaces which comprise a sequence boundary is still causing significant problems today.
In addition to providing a new methodology and definition for sequence delineation, Vail et al. (1977) interpreted that the multitude of sequence boundaries they recognized on seismic data from many parts of the world were generated primarily by eustatic sea level changes. This interpretation stood in contrast to that of Sloss (1963), who had always emphasized tectonics as the prime driver of sequence boundary generation. As noted earlier, the debate of tectonics versus eustasy for unconformity generation began in the 19th century and it continues today. Importantly, the interpretation that eustasy was the driving force behind sequence generation led to the development of a deductive model for sequence generation which combined sinusoidal eustatic sea level change with a constant sediment supply and a basinward increasing subsidence rate. This model reproduced a number of the stratigraphic relationships seen on the seismic sections such as basin flank unconformities associated with truncation and basin centre, condensed horizons associated with downlap. Because of this, the model was embraced by the Exxon scientists and became the centre piece of their next watershed publications on sequence stratigraphy (Wilgus et al., 1988). These papers, and the models and interpretations they advocated, formed the

Alberta’s Professional Geoscientists and Engineers provide Albertans with many of the essentials of daily living. The work that they do allows all of us to enjoy warmth, light, power, water and the ability to travel and communicate over distance.
Since 1920, Members of APEGGA, The Association of Professional Engineers, Geologists and Geophysicists of Alberta, have made a difference in the daily lives of millions of Albertans by bringing science and innovation to life.
The P.Geol., P.Geoph., P.Eng., and R.P.T. professional designations represent the highest standards of quality, professionalism and ethics in geoscience and engineering. APEGGA Members can take pride in the role they play and the contribution they make to Alberta. APEGGA and its over 47,000 Members are committed to public safety and wellbeing through the self-regulation of the geoscience and engineering professions in Alberta.
Visit www.apegga.org for more information.
Geologists Geophysicists Engineers
The CSPG Graduate Thesis Awards are presented annually for the best Ph.D. and M.Sc. theses either originating from a Canadian university, regardless of project location, or dealing with a Canadian sedimentary/petroleum geology topic, regardless of university location.
The CSPG gratefully acknowledges and appreciates the continued support from Arc Financial Corporation in their sponsorship of the Graduate Thesis and Undergraduate Awards program. On hand for this year’s presentation were Andy Evans (Senior Vice President), Paul Beitel (Senior Vice President), and Laughlan Currie (President and Director).
The awards were presented at the Technical Luncheon held on March 25, 2008 at the Telus Convention Centre.
AWARD – Best Ph.D.
The 2007 Graduate Thesis Award – Best Ph.D has been awarded to Dr. Alex J. MacNeil for his thesis, “Sedimentology of the Late Devonian (Frasnian) Alexandra Reef System, Northwest Territories, Canada: New Insight to the Nature of Devonian Reef Systems.” Alex’s project advisor at the University of Alberta was Dr. Brian Jones.
MacNeil graduated from the University of Saskatchewan in 1998 with a B.Sc. (Honours) degree in Paleobiology/Geology and began graduate studies at the University of Alberta that autumn. After completing his Masters’ on the Cenozoic carbonates of Grand Cayman, MacNeil opted to forgo the tropical sun in exchange for Ph.D. research on the Paleozoic carbonates of the Late Devonian Alexandra Reef System in the Northwest Territories.
The Alexandra Reef System (lowermid-Grosmont equivalent) consists of exceptionally well-preserved limestone deposits. These are exposed near Hay River, NWT, for ~ 46 km with negligible structural deformation; the entire transect of peritidal to fore-reef deposits can be walked on foot.
Since the mid-1960s, the stratigraphic model for the Alexandra was that of a single barrier reef complex, and this model underpinned several industry-led field trips over the decades as well as MacNeil’s initial work in the region. Upon analysis of his field data, including new cores and exposures at recent road cuts through previously inaccessible parts of the formation, MacNeil identified an increasing number of problems with interpreting the Alexandra as a single barrier reef complex. Discovery of an intra-formational sequence boundary confirmed that the reef system had a much more complex stratigraphic architecture than previously realized. A detailed description and discussion of this data was published in Sedimentology, 53, 321-359.
An important contribution from MacNeil’s Ph.D. thesis is the demonstration that highresolution sequence stratigraphy, when integrated with detailed facies analysis, can be used to elucidate various depositional controls on the development of ancient reef systems, and how those controls may have varied through time. With information derived from the sequence stratigraphic framework of the Alexandra, MacNeil developed a model that relates the biotic composition of Devonian reef facies to nutrient availability in the depositional realm. This has implications for our understanding of Devonian reef systems in western Canada and at the global scale.
AWARD – Best M.Sc.
The 2007 Graduate Thesis Award – Best M.Sc. has been awarded to Jessica Krawetz (née Rylaarsdam) for her thesis “The Stratigraphy and Sedimentology of the Upper Albian Paddy Member of the Peace River Formation, and the Walton Creek Member of the Boulder Creek Formation: Northwest Alberta and Northeast British Columbia” (supervised by Dr. Guy Plint at the University of Western Ontario, London). Financial support was provided by an NSERC Industrial Scholarship and Anadarko Canada Corporation. After completing her M.Sc. thesis, Krawetz worked for Anadarko Canada Corporation, and is now employed as a project geologist at Canadian Natural Resources.
Krawetz’s thesis integrated outcrop data from the B.C./Alberta Foothills between Tumbler Ridge and Grande Cache with drill core and well log data from the B.C. and Alberta plains. The purpose of the project was to determine how the marginalmarine and estuarine deposits of the Paddy member correlate to the coeval coastal plain and marine deposits of the Walton Creek member; and ultimately to determine how these relate to the other units across the Western Canada Foreland Basin.
GRADUATE STUDENT THESIS
AWARDS – M.Sc. Honourable Mention
The 2007 recipient of an Honourable Mention in the M.Sc. category is Patrick
Johnstone. Patrick’s thesis, “Geology of the Upper Cretaceous Nanaimo Group, Southernmost Gulf Islands and Adjacent Saanich Peninsula, Southwestern British Columbia,” was supervised by Dr. Peter S. Mustard and Dr. James A. MacEachern of the Department of Earth Sciences at Simon Fraser University. The work was supported by NSERC and an SFU Graduate Fellowship.
Johnstone completed his B.Sc. at Simon Fraser University in 1996, and prior to completing his Masters, he worked in a teaching-support role at SFU, as a fieldwork assistant for the B.C. Geological Survey Branch, and as a supportive geologist in the Geospatial Analysis and Modeling Section of the Illinois State Geological Survey. Currently, he is a Project Scientist for SNC Lavalin Environment Inc. in Burnaby, B.C. Johnstone’s thesis examines a package of Cretaceous sedimentary rocks exposed on the northern tip of the Saanich Peninsula and several small adjacent islands within the Strait of Georgia.
(...Continued from page 37)
foundation for new sequence stratigraphic terminology and methods which could be applied to the rock record of well logs and outcrops as well as to seismic. In the next article in this series, I will discuss this revolutionary model which took sequence stratigraphy from correlating low-resolution seismic to interpreting high-resolution well log and outcrop stratigraphic sections. I will also put into context all the terminology and disagreements the Exxon sequence model has spawned over the past 20 years and I’ll describe the alternative models and methods which have arisen during this time.
Barrell, J. 1917. Rhythms and the measurements of geologic time. GSA Bulletin, v. 28, p. 745-904.
Chang, K. 1975. Unconformity-bounded stratigraphic units. GSA Bulletin, v. 86, p. 15441552.
Frazier, D. 1974. Depositional episodes: their relationship to the Quaternary stratigraphic framework in the northwestern portion of the Gulf Basin. Bureau of Economic Geology, University of Texas, Geological Circular 74-1, 26 p.
Grabau, A. 1906. Types of sedimentary overlap. GSA Bulletin, v. 17, p. 567-636.
Krumbein, W. and Sloss, L. 1951. Stratigraphy and sedimentation. W. M. Freeman and Co. San Francisco, 495 p.
Merriam, D. (ed.) 1964. Symposium on cyclic sedimentation. Kansas Geological Survey, Bulletin 169 (2 volumes), 636 p.
Mitchum, R, Vail, P., and Thompson, S. 1977. Seismic stratigraphy and global changes in sea level, part 2: the depositional sequence as the basic unit for stratigraphic analysis. in: Payton, C. (ed.) Seismic stratigraphy: application to hydrocarbon exploration. AAPG Memoir 26, p. 53-62.
Payton, C. (ed.) 1977. Seismic stratigraphy: applications to hydrocarbon exploration. AAPG Memoir 26, 516 p.
Posamentier, H. 2003. A linked shelf-edge delta and slope-channel turbidite system: 3d seismic case study from the eastern Gulf of Mexico. in: Roberts, H., Rosen, N, Fillon, R., and Anderson, J. (eds.), Shelf margin deltas and linked down slope petroleum systems, Proceedings of the 23rd GCSSEM conference, p. 115-134.
Sloss, L. 1963. Sequences in the cratonic interior of North America. GSA Bulletin, v. 74, p. 93-113.
Sloss, L., Krumbein, W., and Dapples, E. 1949. Integrated facies analysis. in: Longwell, C. (ed.). Sedimentary facies in geologic history. Geological Society America, Memoir 39, p. 91-124.
Vail, P. et al. 1977. Seismic stratigraphy and global changes in sea level. in: Payton, C. (ed.). Seismic stratigraphy: applications to hydrocarbon exploration, AAPG Memoir 26, p. 49-212.
Weller, J.M. 1930. Cyclic sedimentation of the Pennsylvanian period and its significance. Journal of Geology, v. 38, p. 97-135.
Wheeler, H.E. 1958. Time stratigraphy. AAPG Bulletin, v. 42, p.1208-1218.
Wheeler, H.E. 1959. Stratigraphic units in time and space.American Journal Science, v. 257, p. 692-706.
Wheeler, H.E. 1964a. Base level, lithosphere surface and time stratigraphy. GSA Bulletin. v. 75, p. 599-610.
Wheeler, H.E. 1964b. Base level transit cycle. in: Merriam, D.F. (ed.) Symposium on cyclic sedimentation: Kansas Geological Survey, Bulletin 169, p. 623-629.
Wheeler, H.E. and Murray, H. 1957. Base level control patterns in cyclothemic sedimentation. AAPG Bulletin, v. 41, p. 1985-2011.
Wanless, H. and Shepard, F. 1936. Sea level and climatic changes related to late Paleozoic cycles. GSA Bulletin, v. 47, p. 1177-1206.
Wilgus, C., Hastings, B.S., Kendall, C.G., Posamentier, H.W., Ross, C.A., and Van Wagoner, J.C. 1988. Sea level changes: an integrated approach. SEPM Spec. Pub. 42, 407 p.


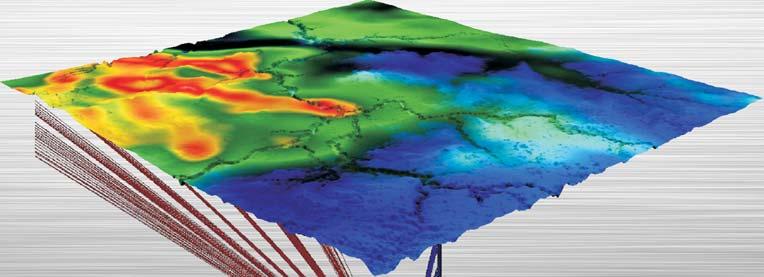
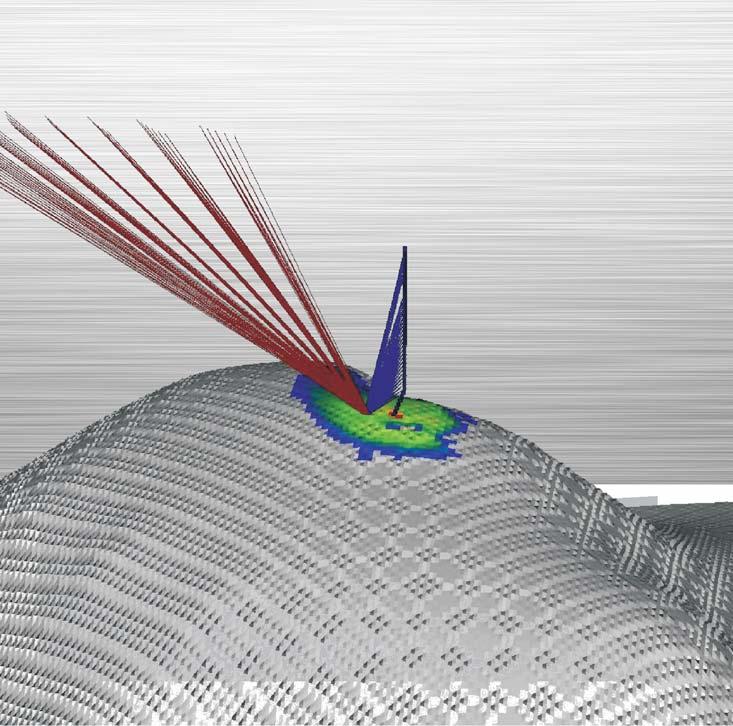
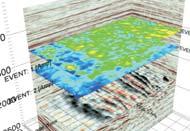


| by Philip Benham
Paleo2008 was the annual paleontological symposium held on March 15 and 16th at Mount Royal College. It was jointly hosted by the CSPG Paleontological Division, Alberta Palaeontological Society and Mount Royal College Earth Science Department. The event was free and open to the general public. The intent of the symposium was to provide a venue where researchers, students, society members, and the general public could make contact, interact, and exchange ideas.
The Saturday program consisted of a lecture series, poster presentations, fossil displays, and a fossil identification booth. The morning and afternoon lecture series sandwiched a two-hour poster session and featured topics as diverse as palynology (Alwynne Beaudoin, Royal Alberta Museum) and erosion rates in Dinosaur Provincial Park and the associated
fossil loss due to it (Darren Tanke and Donald Henderson, Royal Tyrrell Museum).
The keynote speaker was Karen Chin of the University of Colorado. Her talk on dinosaur coprolites was a fine way to end the day. Poster topics were even more diverse and the presenters ranged from seasoned researchers to budding young palaeontologists presenting school science projects. Despite the range in age and educational backgrounds a common love of science brought people together to converse as equals. The audience reached up to a hundred people at points during the day.
Sunday was limited to a pair of workshops which due to limited space and some materials costs required registration and a nominal fee. The workshops this year focussed on ichnological matters. The morning workshop
was run by Dr Karen Chin who took us through various aspects of dinosaur biology that can be inferred from coprolites. Her workshop included a hands-on identification exercise using microscopes provided by Mount Royal College. The afternoon workshop was led by Richard McCrea and Lisa Buckley of the Peace River Palaeontology Research Centre in Tumbler Ridge. The workshop on vertebrate trackways included lectures and an opportunity to cast theropod dinosaur footprints.
We would especially like to thank IHS who provides funds to the CSPG divisional talks to offset the costs of putting on events like these. Mount Royal College provides free access to the lecture theatre and display area. Without this support and the efforts of volunteers, Paleo2008 would not have occurred.
considering the well-known stubbornness of former Prime Minister Jean Chretien.
An interest in outreach is clearly growing across the country. In a recent Geoscience Canada article, Godfrey Nowlan and Donna Schreiner reported that the largest technical session at last year’s GAC/MAC Annual Meeting in Yellowknife was dedicated to earth science outreach. An accompanying workshop focused on issues related to better integration of geoscience outreach in Canada.
Besides the merging of student geology clubs, as mentioned above, CSPG Outreach is striving to enhance national integration through participation in or collaboration with existing bodies which already promote geoscience education and awareness across the country, namely the Canadian Geoscience Education Network (CGEN) and the Canadian Federation of Earth Sciences (CAFES).
CGEN is a nation-wide network of people from various backgrounds interested in promoting the geosciences to the public
and within schools. The network of volunteers supports five core programs and has an annual meeting linked to the GAC conference, as well as regional meetings which may be more accessible to some.
Of the five CGEN programs, the CSPG directly supports EdGEO, which comprises workshops for school teachers enabling them to teach geology in the classroom and outdoors. The format is tremendously efficient as it has a veritable ripple effect. Each year on the order of a few hundred teachers from all regions are exposed to the program. They in turn take it to the classroom, exposing thousands of young students to earth sciences – often for the first time.
If, for instance, the more than 450 teachers who participated in 2006-07 each lecture to 30 students, then over 13,500 would have benefited – now that’s impact! In my experience, the kids then educate their parents.
Also, the program has turned up in the most amazing of places, with the list of stops rolling out like a Johnny Cash talking blues
highway tune, CGEN’s “been everywhere.” EdGEO has been to Calgary, Cambridge Bay, Resolute, Iqaluit, Vancouver, Drumheller, Yellowknife, Ottawa, Victoria, Kelowna, Regina, Montreal, Whiteshell, Whitehorse, Inuvik, Prince George, Toronto, Parrsboro, Dartmouth, Edmonton, Fort Vermillion, Port Coquitlam, St. Catherines, and Field.
CGEN always welcomes new members; just send an email to cgen@sympatico.ca with “join CGEN” in the subject line. Or, for more information, visit their website at http://cgen.bio.ns.ca/.
As you can imagine, our financial support to such programs is only part of the equation; we do need volunteers to step forward. For instance, the joint CSPGCSEG-APEGGA Kids in Science Program (KISP) is another great way to share your experience and passion for Geosciences with school-aged kids, while at the same time maybe rediscovering your own inner KISP. For more on KISP contact the CSPG office directly at reception@cspg.org, or call (403) 264-5610.

(Oral & Poster Presentations)
Margin Evolution & Development Basin Petroleum Systems | Productive Fields & Analogues IN ADDITION TO THE CONFERENCE SESSIONS,ALSO FEATURED WILL BE:
FIELD TRIPS
Nova Scotia (Pre-Meeting)
• Permian to Jurassic Rift Successions
• Classic Carboniferous Sections
• Onshore Cretaceous Reservoir Equivalents
Morocco (Post-Meeting)
• Triassic Synrift Reservoir Facies & Architecture
Portugal (Post-Meeting)
• Jurassic Carbonates & Fluvio-deltaic Successions
PROGRAM INFORMATION
David E.Brown dbrown@cnsopb.ns.ca
Grant D.Wach grant.wach@dal.ca
SPONSORS / ENDORSEMENTS
COURSES
Practical Salt Tectonics Petroleum Systems Modelling
CORE WORKSHOP
Offshore Nova Scotia Reservoirs, Facies & Sequences
SEISMIC DATA ROOM Latest Central Atlantic Programs & Profiles
LOGISTICAL INFORMATION Trudy D.Lewis trudy.lewis@ns.sympatico.ca
WEBSITE & ON-LINE REGISTRATION www.conjugatemargins.com