

20 Well-to-Well Automated Correlation: Western Canadian Sedimentary Basin, Alberta 30 Go Take a Hike 34 GeoConvention 2014: Focus 35 Geology of the Mount Stephen Trilobite Beds and Adjacent Strata near Field B.C., Yoho National Park New Perspectives on a 127 Year Old Discovery, Part 3 $10.00 FEBRUARY 2014 VOLUME 41, ISSUE 02 Canadian Publication Mail Contract – 40070050


CAN YOUR SOFTWARE WITHSTAND A FLOOD OF INFORMATION?


As the most dynamic data aggregator in the industry, Petrosys keeps your workflow moving.
Only Petrosys’ powerful suite of software effortlessly navigates the overflow of data from multiple sources and disciplines. Our industry-leading dynamic data aggregation, integration and surface modeling capabilities enable you to identify, refi ne and resolve issues more quickly. Dedicated technical support and service offer expert solutions when needed. And with our clear, logical interface, even getting started is smooth sailing. Start achieving exploration and production targets at a lower cost and in a shorter time frame with Petrosys. To learn more go to www.petrosys.com.au/transcend


MORE THAN MAPPING SOFTWARE SERVICES CONNECTIVITY DATA MANAGEMENT
CSPG OFFICE
#110, 333 – 5th Avenue SW Calgary, Alberta, Canada T2P 3B6
Tel: 403-264-5610
Web: www.cspg.org
Office hours: Monday to Friday, 8:30am to 4:00pm
Executive Director: Lis Bjeld
Tel: 403-513-1235, Email: lis.bjeld@cspg.org
Event Coordinator: Kristy Casebeer
Tel: 403-513-1226, Email: kristy.casebeer@cspg.org
Geoscience Coordinator: Kelsey Green
Tel: 403-513-1225, Email: kelsey.green@cspg.org
Member Services:
Tel: 403-264-5610, Email: membership@cspg.org
Publications and Website: Emma MacPherson
Email: emma.macpherson@cspg.org, Tel: 403-513-1230
Co-Manager, GeoConvention 2014: Aileen Lozie
Tel: 403-513-1227, Email: aileen.lozie@cspg.org
Database Administrator and Accounting: Kasandra Amaro
Maternity leave until January 2014
Corporate Sponsorship: Lis Bjeld
Tel: 403-513-1235, Email: lis.bjeld@cspg.org
Controller: Eric Tang
Tel: 403-513-1232, Email: eric.tang@cspg.org
EDITORS/AUTHORS
Please submit RESERVOIR articles to the CSPG office. Submission deadline is the 23rd day of the month, two months prior to issue date. (e.g., January 23 for the March issue).
To publish an article, the CSPG requires digital copies of the document. Text should be in Microsoft Word format and illustrations should be in TIFF format at 300 dpi., at final size. For additional information on manuscript preparation, refer to the Guidelines for Authors published in the CSPG Bulletin or contact the editor.
Technical Editors
Hugh S. Mosher Colin Yeo (Assistant Tech. Editor) Nunaga Resources Ltd. Encana Corporation M.: 403-809-9997 Tel: 403-645-7724
Email: hsmosher@telus.net Email: colin.yeo@encana.com
Coordinating Editor
Emma MacPherson, Publications Coordinator, CSPG Tel: 403-513-1230, emma.macpherson@cspg.org, ADVERTISING
Advertising inquiries should be directed to Emma MacPherson, Tel: 403-513-1230 email: emma.macpherson@cspg.org. The deadline to reserve advertising space is the 23rd day of the month, two months prior to issue date.
The RESERVOIR is published 11 times per year by the Canadian Society of Petroleum Geologists. This includes a combined issue for the months of July and August. The purpose of the RESERVOIR is to publicize the Society’s many activities and to promote the geosciences. We look for both technical and non-technical material to publish. Additional information on the RESERVOIR’s submission guidelines can be found at http://www.cspg. org/publications/pubs-reservoir-submissions.cfm.
RESERVOIR ISSUE 02 • FEBRUARY 2014 3 FEBRUARY 2014 – VOLUME 41, ISSUE 02 ARTICLES Well-to-Well Automated Correlation: Western Canadian Sedimentary Basin, Alberta ............................................................... 20 Journey to the Bottom of the World: Susan R. Eaton’s Account of her Scientific Adventures in the Antarctic to Grade 3 to 8 students ................................................ 29 Go Take A Hike 30 Photo of the Month 33 GeoConvention 2014: Focus ..................................................................................................... 34 Geology of the Mount Stephen Trilobite Beds and Adjacent Strata near Field B.C., Yoho National Park, New Perspectives on a 127 Year Old Discovery, Part 3 ........... 35 DEPARTMENTS Executive Comment 5 Technical Luncheons 8 Division Talks ........................................................................................................................... 16 Rock Shop .................................................................................................................... 4, 12, 24
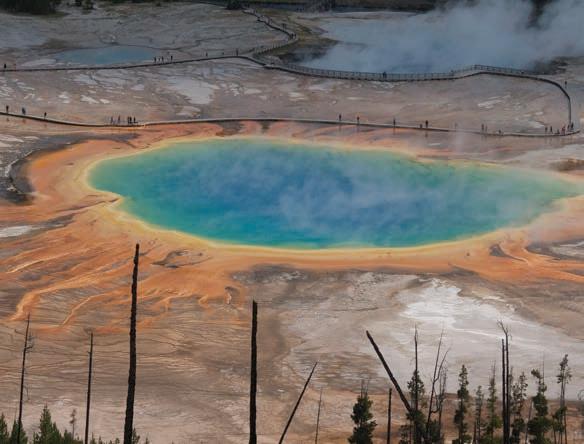
FRONT COVER
Prismatic Hot Spring in Yellowstone National Park, Wyoming owes its wonderful colour to algae that breed in the hot warm waters on the edge of the spring.
Photo by Dave Robinson.
The contents of this publication may not be reproduced either in part or in full without the consent of the publisher. Additional copies of the RESERVOIR are available at the CSPG office. No official endorsement or sponsorship by the CSPG is implied
any advertisement, insert,
article
Reservoir
otherwise noted.
submitted materials
reviewed by the editor.
right
edit
submissions, including letters to the Editor. Submissions must include your name,
membership number
applicable). The material contained in this publication is intended for
use only. While reasonable care has been taken, authors
the CSPG make no guarantees that any of the equations, schematics,
devices discussed will perform as expected or that they will give the desired results. Some information contained herein may be inaccurate or may vary from standard measurements. The CSPG expressly disclaims any and all liability for the acts, omissions, or conduct of any third-party user of information contained in this publication. Under no circumstances shall the CSPG and its officers, directors, employees, and agents be liable for any injury, loss, damage, or expense arising in any manner whatsoever from the acts, omissions, or conduct of any third-party user. Designed and Printed by The Data Group of Companies, Calgary, Alberta.
for
or
that appears in the
unless
All
are
We reserve the
to
all
address, and
(if
informational
and
or
ROCK SHOP
PRACTICAL LOG ANALYSIS COURSES


For Engineers, Geologists, Geophysicists, and Technicians Practical Quantitative Log Analysis: 15 – 17 Oct 2013 Analysis of Unconventional Reservoirs: 18 Oct 2013 Details and Registration at: www.spec2000.net/00-coursedates.htm In-House and Multi-Media Narrated Self-Study Courses Also Available === Instructor: E. R. (Ross) Crain. P.Eng. 1-403-845-2527 ross@spec2000.net === – 50 Years Worldwide Experience – Analysis, Training, Mentoring, Forensic Reviews –Strip Log Strip Log Horizontal Log Horizontal Log Mud Log Mud Log Log Viewer Log Viewer Log Manager Log Manager Log Analysis Log Analysis Suite 102, 7370 Sierra Morena Blvd SW, Calgary, AB T3H 4H9 info@WellSight.com 1-800-447-1534 (403) 237-9189 *Domestic & International Supervision 906, 505 6 St. SW Calgary, AB T2P-1X5 Jocelyn Lampron, P. Geol. President & CEO Wellsite Geological Supervision *Conventional Wells-Heavy Oil/SAGD *Coal Bed Methane Wells www.hopewellpetroleum.com info@hopewellpetroleum.com ph: 403.266.3132 cell: 403.818.8549 *On & Offshore Geological Supervision 742 Memorial Drive NW Calgary, Alberta T2N 3C7 P: 403 242 1522 F: 403 242 8223 E: office@chinookconsulting.ca www.chinookconsulting.ca SERVICES • Wellsite geological supervision • Core and cuttings petrographic studies • Operations geology • Remote geo-steering and remote geological supervision • Project management Reinson Consultants Ltd. GERRY REINSON, Ph.D., P.Geol. Regional and Reservoir Mapping, Core Studies, Field and Lab Courses greinson@telus.net www.reinsonconsultants.com TEL: (403) 861-8346 (The name that says it all!!!) Bus 403.234.7625 800, 555 - 4 th Avenue SW, Calgary, AB, T2P 3E7 info@WellsiteGeologists.com www.WellsiteGeologists.com


CSPG EXECUTIVE
PAST PRESIDENT
Paul MacKay • Shale Petroleum Ltd. paul.mackay@shalepetroleum.com Tel: 403.457.3930
PRESIDENT
Dale Leckie • Nexen Energy ULC daleleckie@nexencnoocltd.com Tel: 403.613.0458
PRESIDENT ELECT
Tony Cadrin • Journey Energy Inc. tony.cadrin@journeyenergy.ca Tel: 403.303.3493
FINANCE DIRECTOR
Gord Stabb • Durando Resources Corp. gstabb@durando.ca Tel: 403.819.8778
FINANCE DIRECTOR ELECT
Astrid Arts • Cenovus Energy aarts@barrick-energy.com Tel: 403.766.5862
DIRECTOR
Alexis Anastas • Nexen Energy ULC alexis_anastas@nexencnoocltd.com Tel: 403.699.4965
DIRECTOR
Andrew Fox • MEG Energy Corp. andrew.fox@megenergy.com Tel: 403.770.5345
DIRECTOR
Milovan Fustic • Statoil Canada Ltd. MFUS@statoil.com Tel: 403.724.3307
DIRECTOR
Michael Laberge • Channel Energy Inc. mlaberge@surgeenergy.ca Tel: 403.301.3739
DIRECTOR
Robert Mummery • Almandine Resources Inc. mummery1@telus.net Tel: 403.651.4917
DIRECTOR
Weishan Ren • Statoil Canada Ltd. wren@statoil.com Tel: 403.724.0325
DIRECTOR
Darren Roblin • Endurance Energy snowice@telus.net Tel: 587.233.0784
EXECUTIVE DIRECTOR
Lis Bjeld • CSPG lis.bjeld@cspg.org Tel: 403.513.1235
EXECUTIVE COMMENT
A message from 2014 President, Dale Leckie
What’s in Store for 2014
One of the last year’s important highlights for the CSPG was its registration as a nonprofit society registered federally under the NFP Act in March 2013. Under the NFP act, the stated Mission of the CSPG is to “To advance the professions of the energy geosciences – as it applies to geology; foster the scientific, technical learning and professional development of its members; and promote the awareness of the profession to industry and the public.” Restated, the mission of the CSPG is to promote technical learning events and to be a focal point for networking and social activities for our members. The mission of the CSPG is not to be a profit maker but to be economically viable. This mission statement should guide all CSPG initiatives and the portfolios of its Board.
2013, under the Presidency of Paul MacKay, was an action-filled year. The Geoconvention Partnership Agreement was signed; the Educational Trust Fund was reorganized; CSPG complied with the NFP Act and the Ambassador Program was initiated.
Now, 2014 is upon us. It is time to stabilize and continue the initiatives set by previous presidents. My first initiative will be increased collaboration with other Societies to benefit the professional development of members and hopefully increase our membership numbers and to continue to build strong ties with our provincial professional regulatory body – APEGA and fellow society to the south – AAPG.
CSPG will continue the ongoing co-operation on other fronts:
• GeoConvention 2014, and the planning for future years.
• CSPG is partnering with AAPG to organize a Playmakers Forum on May 27, 2014.
• CSPG is co-sponsoring a conference on the oil sands on Oct 14-16, 2014 entitled “Oil Sands and Heavy-Oil Symposium: A Local to Global Multidisciplinary Collaboration.”
• In 2015, CSPG will partner with SEPM in 2015 to host a Carbonate Research Conference in Banff; both CSPG and SEPM were benefactors of the late Dr. Eric Mountjoy who bequeathed part of his estate for the betterment of our science and education of students.
• AAPG (ACE) is coming to Calgary in 2016.
Other initiatives for 2014 will include:
• Membership drive will happen this year.
• Focus on the Bulletin of Canadian Petroleum Geology and peer reviewed Publications.
(Continued on page 7...)
RESERVOIR ISSUE 02 • FEBRUARY 2014 5

CORPORATE SPONSORS
SAMARIUM
geoLOGIC systems ltd.
TITANIUM
APEGA
Shell Canada Limited
PLATINUM
Cenovus Energy Inc.
IHS
Imperial Oil Resources
Nexen Energy ULC .
GOLD
AGAT Laboratories
ConocoPhillips
Enerplus Corporation
Tourmaline
Schlumberger Canada Limited
Statoil Canada
SILVER
Athabasca Oil Corporation
Baker Hughes Inteq
Canadian Natural Resources Ltd
CGG Services (Canada) Inc.
Devon
Encana Corporation
Husky Energy Inc.
ION Geophysical
MEG
MJ Systems
Petrosys
Suncor Energy
BRONZE
ARC Financial Corporation
Arcis Seismic Solutions
Belloy Petroleum Consulting
Casey & Associates
Cougar Consultants, Inc.
Earth Signal Processing Ltd
Explor
GLJ Petroleum Consultants Ltd.
Hunt Oil
Loring Tarcore
Olympic Seismic Ltd.
Paradigm Geophysical (Canada) Corp.
PGS
PLS Inc
Pro Geo Consultants
Saudi Aramco
Seisware
Sensor Geophysical Ltd.
Talisman Energy
Tesla
TGS
Tucker Energy Services Canada Inc
As of January 2014
A Special Thanks to Geologic Systems Ltd.,
CSPG ’s Top Sponsor of the Month.
(...Continued from page 7)
• Reinforcing CSPG branding as started by Robin Mann – part of this branding is recognition as “Canada’s Energy Geoscientists.”
• Growth of the Ambassador Program that Paul MacKay started.
This CSPG Board encourages you, as CSPG members, to support and promote CSPG activities where ever possible – encourage
new and renewed membership; encourage volunteering; encourage participation at CSPG events, and to promote the mission of the CSPG.
Use the CSPG to your full advantage and ‘Welcome Home.’

When time is money, Wellsite Geoscience is money well spent.
Whether you’re exploring a basin, producing a well or completing a shale play, time is money. That’s why Weatherford Laboratories brings a suite of formation evaluation technologies right to the wellsite. Utilizing mud gas and cuttings, these technologies provide detailed data on gas composition, organic richness, mineralogy and chemostratigraphy in near real time. As a result, operators now have an invaluable tool to assist with sweet spot identification, wellbore positioning, completion design and hydraulic fracturing. We call it Science At the Wellsite. You’ll call it money well spent.
SCIENCE AT THE WELLSITE ™
RESERVOIR ISSUE 02 • FEBRUARY 2014 7
www.weatherfordlabs.com ©2013 Weatherford. All rights reserved Formation Evaluation ┃Well Construction ┃Completion ┃Production
WELLSITE GEOSCIENCE SERVICES
TECHNICAL LUNCHEONS FEBRUARY LUNCHEON
Systematic Assessment of Water Resources to Support Unconventional Play Development, West-Central Alberta
SPEAKER
Brad J.R. Hayes
Petrel Robertson Consulting Ltd.
11:30 am Wednesday, February 5th, 2014 Calgary, TELUS Convention Centre Macleod Hall C/D Calgary, Alberta
Please note: The cut-off date for ticket sales is 1:00 pm, three business days before event. (Friday, January 31st, 2014.) CSPG Member Ticket Price: $45.00 + GST. NonMember Ticket Price: $47.50 + GST.
Each CSPG Technical Luncheon is 1 APEGA PDH credit. Tickets may be purchased online at https://www.cspg.org/eSeries/source/Events/ index.cfm.
ABSTRACT
Shale and tight sandstone and carbonate reservoirs are now being developed in the heart of the Western Canada Sedimentary Basin using horizontal wells and multizone frac completions. Devonian Swan Hills carbonates and Duvernay shales, Triassic Montney siltstones, and Cretaceous Wilrich and Cardium sandstones are the bestknown and most widespread plays. While drilling and completions methodologies vary by play and are still being optimized in many cases, there is a clear need for large source water volumes and secure water

disposal zones to support field operations, particularly where high-volume slickwater fracs are part of the story.
A revised regulatory framework being put into place by the Alberta Energy Regulator demands that operators plan their unconventional development operations, including water sourcing and disposal on a project scale and play wide basis, and in collaboration with other operators where possible. It is important, therefore, that
operators have regional knowledge of water resources, and the ability to interact readily with nearby competitors.
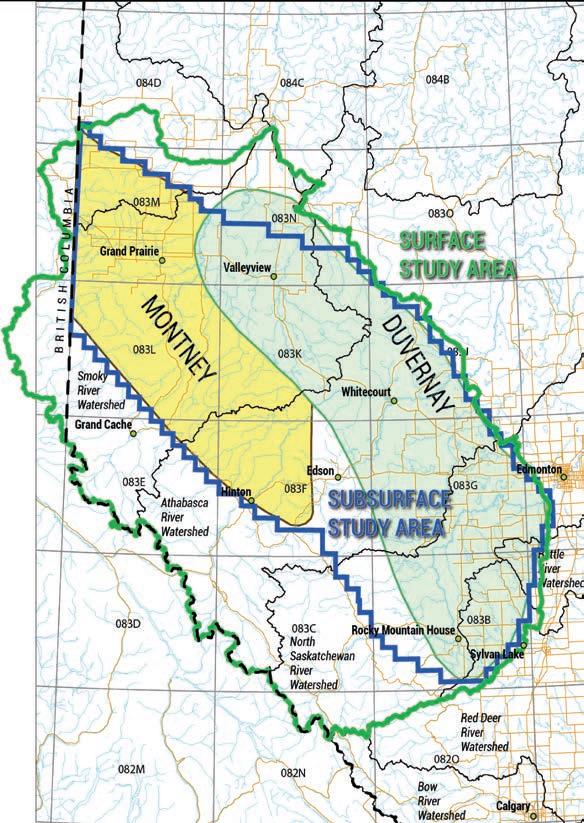
The West-Central Alberta Basin (WCAB) Water Project is designed to characterize surface and subsurface water resources across broad unconventional oil and gas play fairways in west-central Alberta. It provides the foundation to support more detailed characterization projects addressing specific unconventional developments. Technical
8 RESERVOIR ISSUE 02 • FEBRUARY 2014
Webcasts
sponsored by
work is being performed by independent consulting groups, while project governance and financial support is provided by a consortium of oil and gas producers under the umbrellas of PTAC (Petroleum Technology Alliance of Canada) and CAPP (Canadian Association of Petroleum Producers).
In order to address water issues as broadly as possible, the WCAB Project has been designed to assess water resources at surface, in surficial sediments and shallow non-saline aquifers, and in deep saline aquifers. Initial work in 2012/2013 focused on data collection and cataloguing, but by summer of 2014, more detailed modeling and analytical / predictive work will be completed. Collaboration with the Regulator ensures that Project work will be of direct value in regulatory applications. Ultimately, Project results will be made public so that all concerned stakeholders can gain a common understanding of the best technical solutions for use of both non-saline and saline water resources. At the present time, project data are being displayed in an integrated GISdriven website for client companies; more sophisticated display, query, and decisionsupport tools will be developed beginning later in 2014.
The WCAB Project is an excellent example of the collaborative work that industry needs to undertake in order to demonstrate environmental sensitivity in developing unconventional resources. Sharing this information with regulators and public stakeholders is an important step in gaining societal acceptance for the development work that needs to be done.
BIOGRAPHY
Brad Hayes is President of Petrel Robertson Consulting Ltd., a consulting firm engaged by clients including industry, government agencies, and legal and financial organizations, to address conventional and unconventional hydrocarbon exploration and development.
Much of Brad’s work on unconventionals during the past few years has focused on characterization of subsurface aquifers as potential water source and disposal zones. He
has led PRCL in regional subsurface aquifer projects in Horn River Basin, the BC Montney fairway, Central Mackenzie Valley and Deh Cho areas of NWT, and now in west-central Alberta. Ben Kerr of Foundry Spatial and Derek Brown of Strategic West are other key members of the team examining surface, shallow and deep water sources in the WCAW Project.
Brad received a PhD from the University of Alberta, and a B.Sc. from the University of Toronto, and has been with PRCL since 1996.
Brad is an active member of the CSPG, and served as its President in 2001. He is also a member of AAPG, GAC, and APEGBC, and currently sits on APEGA Council.
RESERVOIR ISSUE 02 • FEBRUARY 2014 9
TECHNICAL LUNCHEONS FEBRUARY LUNCHEON
A Brief Tectonic and Depostional History of the Northern Gulf of Mexico
SPEAKER
Joseph Carl Fiduk AAPG Distinguished Lecturer
11:30 am Thursday, February 27th, 2014 Calgary, TELUS Convention Centre Macleod Hall C/D, Calgary, Alberta
Please note: The cut-off date for ticket sales is 1:00 pm, three business days before event. (Monday, February 24th, 2014.) CSPG Member Ticket Price: $45.00 + GST. Non-Member Ticket Price: $47.50 + GST.
Each CSPG Technical Luncheon is 1 APEGA PDH credit. Tickets may be purchased online at https://www.cspg.org/eSeries/source/Events/ index.cfm.
ABSTRACT
The Gulf of Mexico (GOM) is the 9th largest body of water on earth, covering an area of approximately 1.6 million km2 with water depths reaching 4,400 m (14,300’). The basin formed as a result of crustal extension during the early Mesozoic breakup of Pangaea. Rifting occurred from the Late Triassic to early Middle Jurassic. Continued extension through the Middle Jurassic combined with counter-clockwise rotation of crustal blocks away from North America produced highly extended continental crust in the subsiding basin center. Subsidence eventually allowed oceanic water to enter from the west leading to thick, widespread, evaporite deposition. Seafloor spreading initiated in the Late Jurassic eventually splitting the evaporite deposits into northern (USA) and southern (Mexican) basins. Recent work suggests that this may have been accomplished by asymmetric extension, crustal delamination, and exposure of the lower crust or upper mantle rather than true sea floor spreading (or it could be some combination of the two). By 135 Ma almost all extension had ceased and the basic configuration of the GOM basin seen today was established. The Laramide Orogeny was the last major tectonic event impacting the GOM. It caused uplift and
GEOEDGES INC.
Detailed and accurate geology at your fingertips in Petra, GeoGraphix, ArcGIS, AccuMap, GeoScout and other applications
US Rockies & Williston Basin Geological Edge Set
Webcasts sponsored by
erosion for the NW margin from the Late Cretaceous to early Eocene.
Sedimentation in the GOM can be divided into five megasequences: Rifting to Upper Jurassic, Lower Cretaceous, Upper Cretaceous, Paleogen, and Neogene. The oldest sediments are clastics in the Upper Triassic known only from peripheral rift basins onshore. In the basin center evaporites of the Middle Jurassic Louann Formation are the oldest deposits encountered. Deformation and movement of the Louann salt affects almost all the overlying strata and plays a very important role in all aspects of the basin’s petroleum systems. Above the salt, Upper Jurassic marine shales of Oxfordian and Tithonian age comprise two of the most important petroleum source beds. In the Lower Cretaceous megasequence the Aptian age Sligo and Albian age Stuart City carbonates established basin rimming reef margins that divided shelf from deep water. These reefs sit above the structural hinge between thick and thin continental crust. In the Upper Cretaceous megasequence the Cenemanian age Woodbine-Tuscaloosa system represent the first coarse clastics to advance beyond the Lower Cretaceous shelf margin. The megasequence is capped with
for information contact: Joel Harding at 403 870 8122 email joelharding@geoedges.com www.geoedges.com
Western Canada: Slave Point, Swan Hills, Leduc, Grosmont, Jean Marie, Horn River Shales, Elkton, Shunda, Pekisko, Banff, Mississippian subcrops and anhydrite barriers in SE Sask., Bakken, Three Forks, Montney, Halfway, Charlie Lake, Rock Creek, Shaunavon, BQ/Gething, Bluesky, Glauconitic, Lloyd, Sparky, Colony, Viking, Cardium, Horseshoe Canyon and Mannville CBM, Oilsands Areas, Outcrops
US Rockies & Williston: Red River, Mississippian subcrops & anhydrite barriers (Bluell, Sherwood, Rival, etc), Bakken, Three Forks, Cutbank, Sunburst, Tyler, Heath, Muddy, Dakota, Sussex, Shannon, Parkman, Almond, Lewis, Frontier, Niobrara, Mesaverde shorelines, Minnelusa, Gothic, Hovenweep, Ismay, Desert Creek, Field Outlines, Outcrops
Eastern US / Appalachian Basin Geological Edge Set
North American Shales Geological Edge Set
Texas & Midcontinent US Geological Edge Set
Texas & Midcontinent: Permian Basin paleogeography (Wolfcampian, Leonardian, Guadalupian), Granite Wash, Mississippian Horizontal Play, Chat, Red Fork, Morrow, Sligo/Edwards Reefs, Salt Basins, Frio, Yegua, Wilcox, Eagleford, Tuscaloosa, Haynesville, Fayeteville-Caney, Woodford, Field Outlines, Outcrops, Structures
North American Shales: Shale plays characterized by O&G fields, formation limit, outcrop, subcrop, structure, isopach, maturity, stratigraphic cross-sections. Includes: Marcellus, Rhinestreet, Huron, New Albany, Antrim, Utica-Collingwood, Barnett, Eagleford, Niobrara, Gothic, Hovenweep, Mowry, Bakken, Three Forks, Monterey, Montney, Horn River, Colorado
Eastern US / Appalachia: PreCambrian, Trenton, Utica-Collingwood, Medina-Clinton, Tuscarora, Marcellus, Onondaga Structure, Geneseo, Huron, Antrim, New Albny, Rhinestreet, Sonyea, Cleveland, Venango, Bradford, Elk, Berea, Weir, Big Injun, Formation limits, Outcrops, Allegheny Thrust, Cincinatti Arch, Field outlines
Deliverables include:
-Shapefiles and AccuMap map features
-hard copy maps, manual, pdf cross-sections
-Petra Thematic Map projects, GeoGraphix projects, ArcView map and layers files
-bi-annual updates and additions to mapping
-technical support
10 RESERVOIR ISSUE 02 • FEBRUARY 2014
Western Canada Geological Edge Set Northern
tsunami deposits from the Chicxulub impact on the Yucatan peninsula. The Paleogene1 and Neogene 2 megasequences are dominated by major clastic inputs of the lower Wilcox1, upper Wilcox1, Vicksburg1, and Frio1, lower Miocene2, middle Miocene2, upper Miocene2, Pliocene2, and Pleistocene2. These progradational episodes not only advanced the shorelines and shelf margins significantly but also deposited thick sands (major reservoirs) in the deep GOM. The Neogene progradational episodes are strongly influenced by glacioeustatic cycles of increasing frequency and amplitude
BIOGRAPHY
Joseph has a B.S. and M.S. degree in Geology from the University of Florida, an M.B.A degree from the University of Texas of the Permian Basin and a Ph.D. in Geology and Geophysics from the University of Texas at Austin. He has worked for the USGS, Gulf Oil, Discovery Logging, the Texas Bureau of Economic Geology, British Petroleum, Texas A&M University, the University of Texas, the University of Colorado, as a private consultant, and Chief Geologist for CGG and CGGVeritas. Joseph is currently Chief Geologist for WesternGeco in Houston, TX.
Joseph’s research interests cover coastal and shelfal clastic deposition, salt structural deformation and evolution, basin analysis, shelf margin to
deep marine depositional processes, marine sedimentology, petroleum systems analysis, and the use of three-dimensional seismic data in petroleum exploration. He is currently involved in salt-sediment interaction research in the Flinders Ranges, South Australia, fluvial deltaic deposition in the Cretaceous Seaway of NW Colorado, and deep marine stratigraphic analysis in the Gulf of Mexico. Joseph teaches internal training classes on seismic interpretation and salt tectonics for WesternGeco and external industry courses for Nautilus U.S.A. and local geologic societies.
He is a member of the American Association of Petroleum Geologists (AAPG) #352532 and a Certified Petroleum Geologist #5367. Joseph has served as a session chair at the 2001, 2004, 2008, 2010, and 2011 National Conventions. He was an invited speaker at the 1991, 1993, 2004, 2005, and 2010 conventions and at the 1999 and 2008 International conferences. Joesph has also been invited to speak to the Moroccan Association of Petroleum Geologists (2007) and the Mexican Association of Petroleum Geologists (2008).
Joseph is a member of the Houston Geological Society (HGS) #10461 and has been an alternate delegate for the HGS since 2004 and has sat as a voting representative four times. In addition, Joseph has served as a session chairman at the 2006 and 2012 GCAGS meetings. He co-instructed a short course in Deepwater Depositional Processes at the
2007 GCAGS meeting in Corpus Christi. Joseph has been an invited speaker to the HGS dinner meetings in 1996 and in 2005 as well as an invited speaker to the New Orleans Geological Society (1999), the Southwest Research Institute (2001), the Costal Bend Geophysical Society & Corpus Christi Geological Society (2004), the HGS-PESGB 4th International Conference on African E & P (2005), the Lafayette Geological Society (2005), the New Orleans Geological Society (2006), the Dallas Geological Society (2007), and the Offshore Technology Conference (2010).
Joseph is a member of the Society of Exploration Geophysicists (SEG) #148620 and a member of the Geophysical Society of Houston #10461 and has served as a session chair at the 2009 National Convention.
Joseph is a member of the Society for Sedimentary Geology (SEPM) #43576 and a member of the Gulf Coast Section SEPM where he is currently president-elect. He has served on the Conference program advisory committee in 2005, served as a session chair in 2005, and was an invited speaker at the 10th Annual Research Conference (1989), 24th Annual Research Conference (2004), and the 25th Annual Research Conference (2005).
In his 30+ years as a working geologist Joseph has published 70+ peer-reviewed abstracts and papers.

RESERVOIR ISSUE 02 • FEBRUARY 2014 11


12 RESERVOIR ISSUE 02 • FEBRUARY 2014
Opus Training Group 403 720-9810 www.opustraininggroup.com Geology Training for the Petroleum Industry Wellsite 101 • Domestic and International wellsite supervision • Conventional and Unconventional wells • Extensive Hz experience • Customized corporate solutions available (403) 250-3982 sales@clconsultants.ca www.clconsultants.ca 1602 – 5th St N.E. Calgary, AB T2E 7W3 Phone: 403-233-7729 www.tihconsulting.com e-mail: tih@shaw.ca T.I.H. Consulting Ltd. Geologic Well-Site Supervision www.rpsgroup.com/energy (403)263-0449 17084 Global Leaders in Wellsite Geology Serving the petroleum industry for over 25 years ■■ Conventional Vertical / Horizontal Wells ■■ Unconventional Heavy Oil / CBM Wells ■■ International WSG / Operations Geology CanRock Geo Inc. Log Analyst & Wellsite Geologist www.CanRockGeo.com info@CanRockGeo.com 1.403.813.0947 Onsite & Remote Geo-Steering Conventional Vertical & Horizontal Oil Sands & Heavy Oil Core & Cuttings Analysis Project Supervision SAGD / Horizontal Specialty in HZ Wells-Viking, Cardium, Mannville, Bluesky & McMurray CHAD Data Magnetic & Gravity data for the Western Canadian Basin John W. Peirce, P. Geo. Chief Geophysicist www.chad-data.com 250.616.6914
ROCK SHOP
TECHNICAL LUNCHEONS MARCH LUNCHEON
Geological and Technological Components of Bakken and Three Forks Reservoirs, Williston Basin
SPEAKER
Dr. Stephen A. Sonnenberg Colorado School of Mines
11:30 am Tuesday, March 11, 2014 Calgary, TELUS Convention Centre Macleod Hall C/D Calgary, Alberta
Please note: The cut-off date for ticket sales is 1:00 pm, three business days before event. [Thursday, March 6, 2014]. CSPG Member Ticket Price: $45.00 + GST. Non-Member Ticket Price: $47.50 + GST.
Each CSPG Technical Luncheon is 1 APEGA PDH credit. Tickets may be purchased online at https://www.cspg.org/eSeries/source/Events/ index.cfm.
ABSTRACT
The Bakken and Three Forks formations are productive across much of the Williston Basin. The first production dates back to 1953 with discoveries at the Antelope Field of North Dakota. The Bakken became an important horizontal target commencing in 2000 with the development of Elm Coulee Field in Montana. The Three Forks became a target from 2007 to the present. The USGS technically recoverable number for the Bakken and Three Forks is 7.5 billion barrels oil and 6,700 billion cubic feet of gas (USGS, 2013).
Six distinct facies are present in the Bakken of the Williston Basin. Overall the succession appears to represent shelf deposits ranging from subtidal to lower intertidal back to subtidal. The amount of limestone, dolomite and sandstone present varies across the area. In general, more dolomite and limestone is present in the southern part of the basin and the siliciclastic content increases towards the north.
The Three Forks consists largely of silty dolostone, clay-rich dolostones, red beds and anhydrites. These units were deposited in subtidal to supratidal environments in a restricted epeiric sea. Four regional units of the Three Forks have been identified and regional thicknesses and correlations established. The upper three cycles of the Three Forks are the current target of exploration. Recent cores of these intervals show significant residual oil saturation. Thus, petroleum potential in these units is high.
The Bakken and Three Forks are regarded as technology reservoirs because they require horizontal drilling and multistage fracture stimulation. Some critical geologic components for the reservoirs include sedimentary facies, mineralogy, mechanical stratigraphy, diagenetic history, overpressure, source rock maturity, natural fractures and traps. Critical technology components include lateral length, number of hydraulic fracture stages, proppant volume and type,
Webcasts sponsored by
proppant loading, fluid volume and type, fluid to proppant ratio, injection rate, treatment pressure, choke size, plug and perf versus sliding sleeve completions, and well spacing.
BIOGRAPHY
Dr. Stephen A. Sonnenberg is a Professor and holds the Charles Boettcher Distinguished Chair in Petroleum Geology at the Colorado School of Mines. He specializes in unconventional reservoirs, sequence stratigraphy, tectonic influence on sedimentation, and petroleum geology. A native of Billings, Montana, Sonnenberg received BS and MS degrees in geology from Texas A&M University and a Ph.D. degree in geology from the Colorado School of Mines. He has over twenty-five years experience in the industry.
Steve has served as President of several organizations including the American Association of Petroleum Geologists, Rocky Mountain Association of Geologists, and Colorado Scientific Society. He also served on the Colorado Oil and Gas Conservation Commission from 1997-2003 and was the Chair of the Commission from 19992003.
He is the recipient of the Young Alumnus Award, Outstanding Alumnus Award, and Mines Medal from the Colorado School of Mines, Distinguished Achievement Medal from Texas A&M University, distinguished service awards from AAPG and RMAG, and honorary membership awards from AAPG, RMAG and the Colorado Scientific Society. In 2013, he was awarded the Halbouty Medal from AAPG.
RESERVOIR ISSUE 02 • FEBRUARY 2014 13
TECHNICAL LUNCHEONS MARCH LUNCHEON
Natural Fractures in Shale Hydrocarbon Reservoirs
SPEAKER
Julia Gale AAPG Distinguished Lecturer
11:30 am
Tuesday, March 25, 2014 Calgary, TELUS Convention Centre Macleod Hall C/D, Calgary, Alberta
Please note: The cut-off date for ticket sales is 1:00 pm, three business days before event. [Thursday, March 20, 2014]. CSPG Member Ticket Price: $45.00 + GST. Non-Member Ticket Price: $47.50 + GST.
Each CSPG Technical Luncheon is 1 APEGA PDH credit. Tickets may be purchased online at https:// www.cspg.org/eSeries/source/Events/index.cfm.
By using examples from shale reservoirs
worldwide, the diversity of shale-hosted fracture systems and the how and why various fractures systems form are presented. Core and outcrop observations, strength tests on shale and on fractures in core, and geomechanical models allow prediction of fracture patterns and attributes that can be taken into account for well placement and hydraulic fracture treatment design. Both open and sealed fractures can interact with, and modify, hydraulic fracture size and shape. Open fractures can enhance reservoir permeability but may conduct treatment fluids great distances, possibly aseismically in some instances.
The challenge of incomplete sampling of subsurface fractures has been addressed through comprehensive fracture data collection in cores and image logs and careful selection of outcrops, coupled with an understanding of how fractures and their attributes scale. Well tested mechanistic models of how fractures grow in tight sandstones and carbonates were also used to interpret fractures in shale. In order to predict fracture patterns and their attributes, it is helpful to understand the mechanism of their formation and timing in the context of the burial and tectonic histories of the basin in which they are forming. A key variable is the depth of burial, and thereby the temperature, pore-fluid pressure,
expertise in Integrated Subsurface Solutions


and effective stress at the time of fracture development. For the most part, the origin of fractures cannot be determined from their orientation or commonly-measured attributes such as width, height, and length. The mineral fill in sealed fractures does provide an opportunity however, and fluid-inclusion studies of fracture cements tied to burial history have been used to unravel their origin.
Interaction with hydraulic fracture treatments may serve to increase the effectiveness of the hydraulic fracture network, or could work against it. Factors governing the interaction include natural fracture intensity, orientation with respect to reservoir stress directions, and the strength of the fracture plane relative to intact host rock. The effect of calcite-sealed fractures on the tensile strength of the Barnett Shale was tested using a bending test. Samples containing natural fractures have half the tensile strength of those without and always break along the natural fracture plane. Yet in other examples, the weakness is in the cement itself, partly because of retained fracture porosity.
Natural fractures in shales likely grow by slow, chemically assisted (subcritical) propagation and a subcritical propagation criterion was used to model the growing fractures. The subcritical crack index is a mechanical rock property that controls fracture spacing and an input parameter for the models. The subcritical crack index for several shales was measured. The index is generally high for Barnett Shale - in excess of 100 - although it does show variability with facies. By contrast, subcritical indices in the New Albany Shale are much lower, and also show considerable variability. Barnett Shale subcritical indices suggest high clustering whereas New Albany Shale subcritical indices suggest fractures are likely to be more evenly spaced, with spacing related to mechanical layer thickness. The investigation of the variability in subcritical index in shale and how it might tie to other rock properties is underway.
BIOGRAPHY
Julia Gale started her career in geology with undergraduate studies at Imperial College, London. She obtained a Ph.D. in Structural Geology from Exeter University, UK in 1987, working on the Archean of southern West Greenland. She taught structural geology and tectonics for 12 years at the University of Derby, UK, having research interests in the Dalradian of NE Scotland and the Mona Complex of Anglesey, NW Wales. Julia moved to the University of Texas at Austin in 1998, where she is a Research Scientist at the Bureau of Economic Geology in the Jackson School of Geosciences. Her research focus is on natural fracture characterization and prediction in shale and carbonate hydrocarbon reservoirs.
14 RESERVOIR ISSUE 02 • FEBRUARY 2014
Webcasts sponsored by geo-reservoirsolutions.com A division of Geo-Reservoir Solutions Ltd. Your data will be carefully managed on secure workstation and made available to reviewers in one of our spacious, private and comfortably appointed data rooms. If you desire to establish a data room on your own site, we can supply a dedicated workstation with working software license to you on a rental basis, which we will manage and maintain. Contact us for further information and pricing. DAtA room services We offer seismic project preparation, data presentation on Seisware, Kingdom or WinPics seismic workstation. storage support convenience comfort
403.777.0008 info@geo-reservoirsolutions.com Featuring one of our many technical services offering world class geophysical data support ... RESERVOIR_GEORes_third_Dataroom_08_2013.indd 1 2013-08-22 1:25 PM

Start your year off right with the 2014 CSPG Geological Calendar
Available NOW for 10 dollars!
Office: 110-333, 5th Ave SW
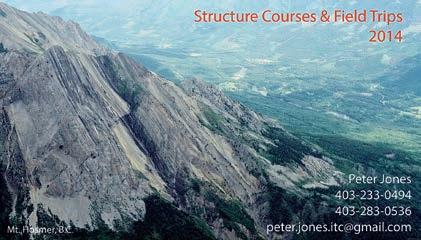
DIVISION TALKS STRUCTURAL DIVISION
Virtual Airborne Field Trip of Southern Alberta
and British Columbia
SPEAKER
Peter Jones International Tectonic Consultants Ltd.
12 noon, Thursday, February 6, 2014 Conference Centre Room A, +30 level, Western Canadian Place (Husky Energy), 707-8th Avenue S.W. Calgary, Alberta
ABSTRACT
This talk will present a summary of 26 years of aerial photography of southern Alberta and southeastern British Columbia, conducted from a single-engine Beechcraft.
From Calgary to the Rocky Mountain Trench via the Triangle Zone, Kananaskis country,
DIVISION TALKS BASS DIVISION
Alberta HydrocarbonBearing Shales and Siltstones
SPEAKER
Dean Rokosh and Steve Lyster
12:00 Noon
Tuesday, February 11th, 2014 ConocoPhillips Auditorium, Gulf Canada Square, 401 - 9th Ave. S.W. Calgary, Alberta
Recent advances in hydraulic fracturing and horizontal drilling technology have made unconventional petroleum resources increasingly important to the oil and gas industry in Alberta. The Alberta Energy Regulator (formerly Energy Resources Conservation Board) is performing ongoing work to quantify the in-place hydrocarbon resources in self-sourced (shale) and tight (siltstone) reservoirs.
The term ‘shale gas’ has largely become a catchall phrase to describe any unconventional plays that require hydraulic fracturing, including shale gas, shale oil, tight gas, tight oil, and hybrid laminated reservoirs. The analysis of each shale or siltstone unit requires its own unique spin, with different considerations of organic content, grain density, water saturation, hydrocarbon fluid makeup, reservoir conditions, and other parameters. Data requirements include geological picks,
unconventional log analyses, adsorption isotherms, XRD mineralogy, RockEval tests, organic petrography, Dean Stark analysis, and analogue pressure and temperature information and gas analyses. The nature of shale analysis means that many conventional laboratory tests may have a high associated uncertainty that must be quantified in resource estimates.
We evaluated the geology, distribution, characteristics, and hydrocarbon potential of key shale and / or siltstone units in Alberta. Five units show immediate potential: the Duvernay Formation, the Muskwa Formation, the Montney Formation, the Nordegg Member, and the basal Banff and Exshaw formations (sometimes referred to as the Alberta Bakken by industry). The released study also includes a preliminary assessment of the Colorado, Wilrich, Rierdon, and Bantry Shale units. These units were systematically mapped, sampled, and evaluated for their hydrocarbon potential.
BIOGRAPHIES
Dean Rokosh graduated from S.A.I.T. in 1977 and worked as a geological technologist (8 years), landman (2 years) and oil scout (2 years) for Hudson’s Bay Oil & Gas, Dome Petroleum and Amoco Petroleum. In 1990, Dean enrolled at the University of Alberta and graduated with a B.Sc. in Geology in 1994 and a Ph.D. in Geology in 2000. He did a one year postdoc in Quaternary Geology and helped write a book on climate change in the Rocky Mountains. Dean then worked as a research assistant with Prof. Doug Schmitt in geophysics at the University of Alberta for 3.5 years. One of the projects he worked on was
Sponsored by
Crowsnest Pass and the Fernie Basin west to Elko, this talk will covers viewing folds, faults, landslides, culture, industry gas fields, coal mines, lakes, dams and history.
DIVISION INFORMATION
Structural Division talks are monthly-ish and cover a diversity of structural themes. Our Structural Division sponsors are HEF Petrophysical and Husky Energy. All are welcome and no registration is required. For additional information, to be placed on the Division e-mail list or to present a talk, please contact Darcie Greggs, Darcie.Greggs@huskyenergy.com.
Sponsored by
‘shale anisotropy’ which brought him to work at the AER in 2005, specializing in resource appraisal of unconventional deposits.
Steve Lyster has a B.Sc. and Ph.D. in Mining Engineering from the University of Alberta, specializing in geostatistics. He has been a geostatistician with the Alberta Energy Regulator since 2009, and has worked on modelling groundwater aquifers, mapping bedrock topography, and other projects. His main focus for the last three years has been quantification of shale hydrocarbon resources and incorporating the concept of uncertainty into resource estimates.
INFORMATION
BASS Division talks are free. Please bring your lunch. For further information about the division, joining our mailing list, a list of upcoming talks, or if you wish to present a talk or lead a field trip, please contact either Steve Donaldson at 403-766-5534, email: Steve. Donaldson@cenovus.com or Mark Caplan at 403-817-2603, email: mark.caplan@ brionenergy.com or visit our web page on the CSPG website at http://www.cspg.org.
16 RESERVOIR ISSUE 02 • FEBRUARY 2014
DIVISION TALKS INTERNATIONAL DIVISION
Petroleum Exploration in the Paleogene Lacustrine Basins of Central Sumatra
SPEAKER
T. D. J. England
Bukit Energy Inc
12:00 Noon
Wednesday, February 12th, 2014
Nexen Plus 15 Conference Centre Nexen Annex Building 7th Ave. & 7th Street SW Calgary, Alberta
ABSTRACT
Primary controls on sedimentation in lacustrine basins are tectonics and climate which together govern water and sediment inputs. High sediment and water supply result in over-filled basins with prograding sedimentary sequences and stable lake levels; low sediment and water supply result in under-filled basins with predominantly aggradational sedimentary sequences and unstable lake levels. Depositional environments are diverse and complex, given the many influencing factors, and sediments deposited in these basins may be siliciclastic, volcaniclastic, carbonate, evaporitic and organic. Rapid lateral changes in sedimentary facies and depositional systems are typical.
The Paleogene lacustrine basins of central Sumatra are generally overfilled; however, distinct episodes occurred where more balanced fill conditions prevailed, allowing tropical meromictic lake conditions to develop and profundal organic-rich source beds to be laid down. Assuming consistent humid climate conditions, this deposition occurred during a period of relatively stable tectonics, which greatly reduced detrital sediment input to some basins. The organicrich mudstones are up to 150 m thick in marginal sequences and up to 1500 m thick in profundal sequences. Primary reservoir targets are alluvial, fluvial, deltaic and sublacustrine sandstones interbedded with or juxtaposed to the source rocks. Basin dynamics in response to episodic Paleogene
Sponsored by
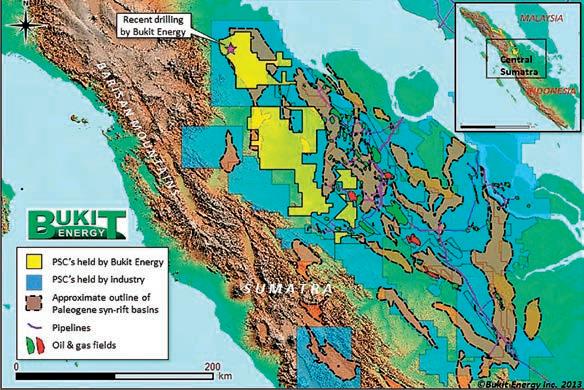
through Neogene tectonics have created numerous structural and stratigraphic traps. These include intrabasinal and marginal fault block highs and extensional collapse complexes on overbuilt margins formed during the syn-rift episode (49-25.5 Ma), and various contractional and wrench fault-related folds and inversion structures formed during the post-rift episode (post 25.5 Ma).
From a regional perspective the Paleogene succession is underexplored, as historical drilling was focused on Neogene strata overlying the rift shoulders, with few wells having been drilled down the flanks into the deeper parts of the basins. Over 13 BBOE has been discovered to date, mostly within Neogene reservoirs, although it is likely that all of this petroleum was sourced from the Paleogene lacustrine deposits. Given the tighter reservoir quality of the Paleogene carrier beds, effective regional paleo-sol top seals, occurrence of overpressure, and intersections of oil and gas bearing layers within the source rock sequences, significant prospective resource potential is indicated for the deeper parts of the basins. These tight resources are being targeted on existing PSC’s held by production as well as through new conventional and unconventional PSC’s which have much improved contract terms.
BIOGRAPHY
Tim England entered the Canadian oil patch in 1980 after graduating with a B.Sc. in Geology from UBC in 1980. Early career positions at
Union Oil and Esso Resources exposed him to the basics of exploration for oil and gas in Alberta and British Columbia. In 1985 he joined BP Canada to explore in the Canadian high Arctic, drilling wells in the Beaufort Sea and Queen Elizabeth Islands during the final Panarctic Oils Ltd. consortium years. Following the arctic adventure, Tim returned to school to specialize in basin analysis. He graduated with a doctorate in geological sciences from Memorial University of Newfoundland in 1990.
After graduate school, Tim rejoined BP in Houston to explore in the Gulf of Mexico deepwater province, eventually returning to Calgary in 1993 to join Talisman’s new international exploration team. Over the next 16 years, he participated in the ten-fold growth of the company, developing and supporting projects in the Americas, Europe, Africa, the Middle East and Southeast Asia. Exploration-led country entries were accomplished in Trinidad & Tobago, Colombia, Peru, and Alaska. Tim guided Talisman’s high Arctic exploration drilling program on the North Slope of Alaska and subsequently lead the exploration effort in Norway.
Since leaving Talisman in 2009, Tim has primarily focused on E&P projects in Indonesia, China and Mongolia. In 2011 Tim co-founded Bukit Energy Inc. to explore for tight oil and gas resources in Indonesia.
Timothy D. J. England, EVP Exploration, Bukit Energy Inc., Suite 2310, 700-2nd Street S.W. Calgary, Alberta, Canada T2P 2W2 tengland@bukitenergy.com
RESERVOIR ISSUE 02 • FEBRUARY 2014 17
DIVISION TALKS PALEONTOLOGY DIVISION
Paleo 2014 Alberta Palaeontological Society 18th Annual Symposiums
Presented in conjunction with the C.S.P.G. Palaeontological Division, Alberta Palaeontological Society and Mount Royal University Earth Sciences Department
LECTURES AND POSTER DISPLAYS
Saturday, March 22, 2014 9:00 am to 5:00 pm
WORKSHOPS
Sunday March 23, 2014 9:00 am to 4:00 pm
CALL FOR POSTERS AND ABSTRACTS
The Alberta Palaeontological Society (APS) would like to invite you to provide a poster at our fifteenth annual palaeontological symposium. This symposium will showcase presentations from a mix of avocational and professional palaeontologists from all over Western Canada. We are interested in posters on topics associated with palaeontology. Specific invitations have been given to staff and students of western universities, natural history clubs, the Geological Survey of Canada, museums and members of the petroleum industry and the artists’ community. The aim is to showcase palaeontology to the general public and foster closer relations between the APS and the above groups. The event is free to all participants. There is no fee to submit a poster and abstract.
We plan to encourage families to bring fossils to our identification booth. Advertising for the event will go out to news media, Canadian Society of Petroleum Geologists Reservoir, the internet, and various government facilities, museums, schools, etc.
THE INSTRUCTIONS FOR POSTERS /DISPLAYS
A table and stand with a 4x8-foot poster board will be supplied to each presenter. Each presenter should bring stick pins or tape for attaching posters although we will try to have some on hand for those who forget. Those who have special requirements such as electricity to operate a display or a larger display area should identify these requirements upon submission of a request for space. Presenters are requested to provide an abstract as per instructions below. We request that poster presenters be set up by 8:30 AM the day of the event. During the day a poster session period will be specified, please be available at least during this time for discussion about your exhibit. The deadline for submission of request for poster space is February 15, 2014.
THE SYMPOSIUM
The symposium is a two day event with lectures, poster and showcase displays on Saturday, March 22, 2014, and workshops on Sunday March 23, 2014. Saturday programs are free and open to the general public. No registration is required to attend the Saturday activities. Due to limited space, Sunday workshop participants will be required to register and pay a moderate fee for workshop manuals. The main events will be centred in the lower level hall at Mount Royal University.
SYMPOSIUM ABSTRACT VOLUME
As in past years an attractive symposium abstract volume will be published. It will be sold at a price to cover publication costs. We request that speakers and poster presenters submit abstracts for the publication to the editor (see below). Abstracts can be 1-4 pages (with 1 being standard) in length although exceptions will be made for specific requests. Abstract contributors are encouraged to include photos and/or diagrams although it should be noted that the abstract volume will be printed in black and white. Documents will not be edited for content but may be reformatted to fit into the volume. Snail
Sponsored by
mail address (and email address if you wish) of the author should be included for insertion in the volume. Deadline for submission of abstracts for publication is February 15, 2014. Specific instructions and examples can be downloaded from our website www.albertapaleo.org.
FURTHER INFORMATION
Lecture Program and Workshops: Harold Whittaker, (403) 286-0349, programs1@albertapaleo.org
Posters and Displays: Doug Shaw (403) 556-2438, posters@albertapaleo.org
Advertising:
Reg Spratley (403) 263-0556, library@albertapaleo.org
Abstract Submissions: Howard Allen (403) 862-3330, editor2@albertapaleo.org
ABOUT THE ALBERTA PALAEONTOLOGICAL SOCIETY
The Alberta Palaeontological Society is a nonprofit society whose purpose is to promote the science of palaeontology through study and education and make contributions to the science through discovery, collection, description, public education and preservation of material for study and posterity. The APS works with professionals at museums and universities to add to Alberta’s palaeontological collections and preserve its heritage. Alberta Palaeontological Society meetings are generally held on the third Friday of the month in Room B108 of Mount Royal University, in Calgary.
18 RESERVOIR ISSUE 02 • FEBRUARY 2014
PALEO 2014
Presented in conjunction with the CSPG Palaeontological Division and Mount Royal University Earth Sciences Department
Mount Royal University, 4825 Mount Royal Gate SW, Calgary, Alberta
Lectures and Poster Displays – Saturday, March 22, 2014, 9:00 AM to 4:30 PM
Workshops – Sunday, March 23, 2014, 9:00 AM to 4:00 PM
Saturday lecture events and poster viewings are free and require no registration. There will be fossil displays and activities of interest to a wide audience, including families, on the Saturday. Sunday workshops do require registration and a minor fee.
SPEAKER SCHEDULE
Saturday, March 22th
All talks to be held in Jenkins Theatre, lower level of Mount Royal University
9:00 AM Opening statement by Cory Gross, APS President, and Symposium instructions by Harold Whittaker.
9:15 AM The perils of Protichnites: The checkered history of an iconic ichnotaxon . Robert MacNaughton, Ph.D. Research Scientist, Geological Survey of Canada
10:15 AM Coffee break
10:30 AM Cretaceous methane seepage fueling life oasis in the Arctic. Dr. Benoit Beauchamp, University of Calgary
11:00 AM Lungfishes: Origin and evolution of an iconic ‘living fossil.’ Jason Pardo, M. Sc. Student, University of Calgary
11:30 PM Life before impact: Paleodiversity dynamics immediately prior to the end-Cretaceous extinction in southern Saskatchewan. Emily L. Bamforth, Assistant Curator of Palaeontology, Royal Saskatchewan Museum
12:00 PM Noon Hour Break
1:00 PM Cretaceous/Paleocene terrestrial palynology. Kimberley Bell, Ph. D. student, University of Calgary
1:30 PM How complete is our knowledge of prehistoric biodiversity? Sarda Sahney, Visiting Fellow, University of Bristol
2:00 PM Poster session. Poster presenters are requested to be with their posters
2:45 PM Coffee break
3:00 PM Heavy industry activities in Alberta and it’s positive effect on vertebrate paleontology at The Royal Tyrrell Museum of Paleontology. Darren Tanke, Royal Tyrrell Museum of Paleontology
3:30 PM Growth and histology of the armoured dinosaurs. Michael Burns, University of Alberta
4:00 PM High Arctic camel on Ellesmere Island. Dr. Natalia Rybczynski, Canadian Museum of Nature
5:00 PM Finish
WORKSHOP
Sunday March 23th (limited pre-registration) Mount Royal University,
Illustrating Prehistoric Animals
Two Identical Sessions: 9:00 - 12:00 and 1:00 - 3:00 (select one session).
Presenter: Sydney Mohr Palaeontology Artist
Art is the perfect medium by which to educate and promote interest in prehistoric life. In order to bring a drawing to life while maintaining accuracy and realism, a number of topics will be covered, including light and shading, proportion, and movement. Application of these techniques will be demonstrated using graphite pencils, with a particular focus on depicting non-avian theropod dinosaurs and primitive birds. In addition to learning how to search for accurate visual resources, aspects of basic anatomy including feathers and skeletal structure will also be touched on. Participants are encouraged to bring a notebook, as well as any art pencils if they have them, although these will also be supplied for the session.
Cost: $15 per person
To register for workshops contact Harold Whittaker (403) 286-0349 or programs1@albertapaleo.org
Make the cheque payable to the Alberta Palaeontological Society, P.O. Box 35111, Sarcee Postal Outlet, Calgary Alberta, Canada T3E 7C7.
Deadline for workshop registration is March 10, 2014. Registration is limited to 25 participants, so register early.
RESERVOIR ISSUE 02 • FEBRUARY 2014 19
AUTOMATED CORRELATION: Western Canadian Sedimentary Basin, Alberta
| By Omar Deder, NeoSeis Technology Group Ltd., Calgary, Alberta, omarderder@neoseis.com
A BSTRACT
The identi fication of lithofacies relies on core data analysis w hich can be expensive and time consuming as compared to the electrofacies which are straight forward and inexpensive. To date, challenges of interpret ing as well as correlating well log data have be en on the increase especially when it involves numerous boreholes making manual analysis almost impossible.
NeoStrat ® i s a PC application, which supports well to well correlation. This is done through classification of the well log responses into relatively similar groups based on eletrofacies and lithofacies. The objective of this paper is to evaluate the merits of the algorithm utilized to achieve well log analysis versus expert analysis.
The algorithm which was developed processes the data in three stages: first by zoning the log into sub-intervals, se condly by characterizing the interval with various shape parameters whil e imposing user defined boundary conditions, and finally by perform ing a statistical (weig hted correlation) method to classify the interval.
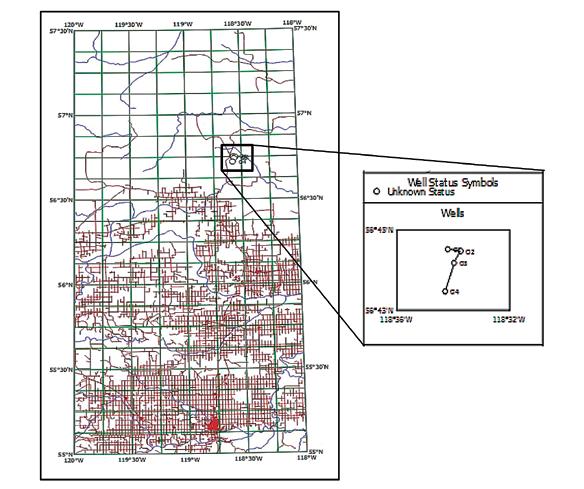
A representative project to illustrate this difficulty is focused on wells drilled in the Pouce Coupe South, west-central Alberta area. The four wells used in this study were O1, O2, O3 and O4. The results of qualitative and quantitative analysis from the reference well O1 are taken to arrive at different well log pick s and petrofacies in the adjacent wells O2, O3 and O4.
The algorithm was implemented in each of the wellbores and similar log responses and classifies the wells in classes that represent the lithologic information. The automated well log correlation software was used to correlate and to improve electrofacies evaluation and lithofacies identification on the basis of correlations to generate a subsurface model for non-cored intervals at other adjacent matching wells O2, O3 and O4.
The software has relieved the tedium of correlating logs, and has shown to consistently outp erform human log interpreters in determining rock types and lithofacies relationships. Tests on multiple datasets from studied wells separated by thousands of meters demonstrate high-
2. Mid-Jurassic to Paleocene succession, dominated by clastic rocks (deposited during evolution of the Canadian Cordillera). WELL-TO-WELL
fidelity well-to-well correlations, indicating the NeoStrat® software is a very promising geological characterization tool.
INTRODUCTION
Well-to-well correlations typically use total gamma ray and resistivity logs. The shapes of the log curves are used for matching, but the absolute values are generally not considered. The focus of this study aims at recognizing the patterns of the available log dataset (Gamma Ray and Resistivity data) to describe the stratigraphy for automating the possible correlation process
Numerous methods for correlation by computer have been tested and reported in the literature. The literature demonstrates that three techniques have been employed for the most reliable resu lts, which are Pearsonia n Correlation, Dynamic Programming and Expert Systems (Olea & Sampson , 2003). Cross-association analysis (Sackin et al., 1965; Merriam & Sneath, 1967), and Pearsonian cross-correlation coefficient by using dips from microresistivity (Kemp, 1982) have also been examined. Other methods include Matrix Algebra log interpretation techniques (Doveton, 1986),
Dynamic programming (Fang et al., 1992; Le Nir et al., 1998), Log data zonation (Lanning & Johnston, 1983; Gill et al., 1993), Pattern Recognition (Duda & Hart, 1973; Cheng & Lu, 1985), Expert Systems (Davis et al., 1981; Bonnet & Dahan, 1983; Lineman et al., 1987), Artificial neural networks (Luthi & Bryant, 1997; Luthi, 2001).
A representative project is focused on wells drilled in the west-central Alberta, Pouce Coupe South area. Four wells were used in this study O1, O2, O3 and O4 (Figure 1). The complex of the geological process in the Western Canadian Sedimentary Basin (WCSB) region produced a wide variation in lithological and physical properties. In general, two distinct parts governed the sedimentation in two different tectonic setting within this area (Mossop & Shetsen, 1994), which is:
1. Paleozoic to Jurassic succession, dominated by carbonate rocks (deposited on the stable craton),
20 RESERVOIR ISSUE 02 • FEBRUARY 2014
Figure 1. Location Map of the investigated area.
Four boreholes were selected to evaluate the automated classification algorithms. These wells were selected owing to the consistency of tool testing and calibration. For the purposes of this study, a series of formation and units were defined based on the geophysical results and previous studies in the region (Edwards et al., 1994; Moslow, 2000; Dixon, 2000; ERCB, 2009; Clack, personal communication, 2013).
Three geologic informal units were also included to verify our work, which are the Montney D, Montney C and Montney B. The units were a prominent turbidite deposit, which is the distal portion of the turbidities fan. Based on the geological and petrophysical analysis made on the core drilled within well O1, the core is comprised of very fine grained sandstone, siltstone and shale (Derder O., 2012; Derder O., 2012; Derder O., 2013).
METHODS
! Reading in clean zone of interest for match well,
! Reading in clean zone of interest for match well,
Pearsonian Correlation Coefficient
Pearsonian Correlation Coefficient
Pearsonian Correlation Coefficient
If ���� is the offset between intervals and ����! ���� is the reading for log ����! at depth ����! at the same interval, then the standardized shale similarity between the intervals of length 2���� + 1 centered at depth and interval of the same length centered at ����!!! in log ����! is equal to:
product of Standardized shale similarity and Pearsonian Correlation Coefficient to automate the process of correlation between the wells (Olea & Sampson, 2003). The method is applicable to use even in the presence of gaps in the stratigraphic record and changes in thickness of equivalent intervals.
Calculation of the coefficient requires computation of the covariance between the
Calculation of the coefficient requires computation of the covariance between the
standard deviations. If
is the offset between intervals and
standard deviations. If ���� is the offset between intervals and ����!
is the reading for
is the reading for
Calculation of the coefficient requires computation of the covariance between the intervals and standard deviations. If ���� is the offset between intervals and ����! ���� is the reading for log
regular interval, then the covariance between the intervals of length
regular interval, then the covariance between the intervals of length
interval of the same length centered
interval of the same length centered at
centered at depth z in log λ2 and interval of the same length centered at zi+k in log λ4 is equal to:
at depth
at the regular interval, then the covariance between the intervals of length
centered at depth
in log
in
is equal to:
interval of the same length centered at ����!!! in log ����! is equal to:
���� Reading in zone of interest for reference well,
���� + ���� Reading in zone of interest for match well,
! Reading of pure shale in zone of interest for reference well,
While the standard deviations are:
While the standard deviations are:
While the standard deviations are:
! Reading of pure shale in zone of interest for match well,
While the standard deviations are:
! Reading in clean zone of interest for reference well,
! Reading in clean zone of interest for match well,
Pearsonian Correlation Coefficient
STANDARDIZ ED SHALE SIMILARITY
Calculation of the coefficient requires computation of the covariance between the intervals standard deviations. If ���� is the offset between intervals and ����! ���� is the reading for log
Standardized Shale Similarity
If k is the offset between intervals and λ1 (i) is the reading for log λ1 at depth z at the same regular interval, then the standardized shale similarity between the intervals of length 2n + 1 centered at depth zi in log λ1 and interval of the same length centered at zi+k in log λ3 is equal to:
regular interval, then the covariance between the intervals of length 2���� + 1 centered at depth
interval of the same length centered at ����!!! in log ����! is equal to:
The Pearsonian correlation coefficient for these two intervals is:
The Pearsonian correlation coefficient for these two intervals is:
The Pe arsonian correlation coefficient for these two intervals is:
If ���� is the offset between intervals and ����! ���� is the reading for log ����! at depth ����! at the same regular interval, then the standardized shale similarity between the intervals of length 2���� + 1 centered at depth ����! in log ����! and interval of the same length centered at ����!!! in log ����! is equal to:
While the standard deviations are:
!(����,
+
����! ���� Reading in zone of interest for reference well,
����! ���� + ���� Reading in zone of interest for match well,
����!"# ! Reading of pure shale in zone of interest for reference well,
����!"# ! Reading of pure shale in zone of interest for match well,
in zone of interest of standard matching similarity for match well,
Covariance between the intervals for standard matching similarity,
Weighted Correlation Coefficient
Standard deviation of the intervals for standard matching similarity,
Weighted Correlation Coefficient
Reading in zone of interest of standard matching similarity for reference well,
Reading in zone of interest of standard matching similarity for match well,
• λ1 (j ) Reading in zone of interest for reference well,
����!!!"# ! Reading in clean zone of interest for reference well,
����!!!"# ! Reading in clean zone of interest for match well,
As previously noted the algorithm which was developed processes the data in the following stages:
Pearsonian Correlation Coefficient
1. Zoning of the log;
Weighted Correlation Coefficient
• λ3 (j + k) Reading in zone of interest for match well,
• λmax 1 Reading of pure shale in zone of interest for reference well,
• cov2,4 (i, k; n) Covariance between the intervals for standard matching similarity, • s2 (i, n)s4 (i, k; n) Standard deviation of the intervals for standard matching similarit y,
The Pearsonian correlation coefficient for these two intervals is:
• λ2 (j) Reading in zone of interest of standard matching similarity for reference well,
Calculation of the coefficient requires computation of the covariance between the intervals and their standard deviations. If ���� is the offset between intervals and ����! ���� is the reading for log ����! at depth ����! at the same regular interval, then the covariance between the intervals of length 2���� + 1 centered at depth
• λmax 3 Reading of pure shale in zone of interest for match well,
in log
and interval of the same length centered at ����!!! in log ����! is equal to:
2. Characterizing of the curve shape;
3. Employing statistical correlation and defining boundary condition to classify the interval;
4. Interacting with the automated classification algorithm (accepting or rejecting results) to ensure the user always remains in control at all times to oversee the automated correlation process.
• λshale 1 Reading in clean zone of interest for reference well,
the standard deviations
• λshale 3 Reading in clean zone of interest for match well,
PEARSONIAN CORR ELATION
COEFFICIENT
The Pearsonian correlation coefficient for
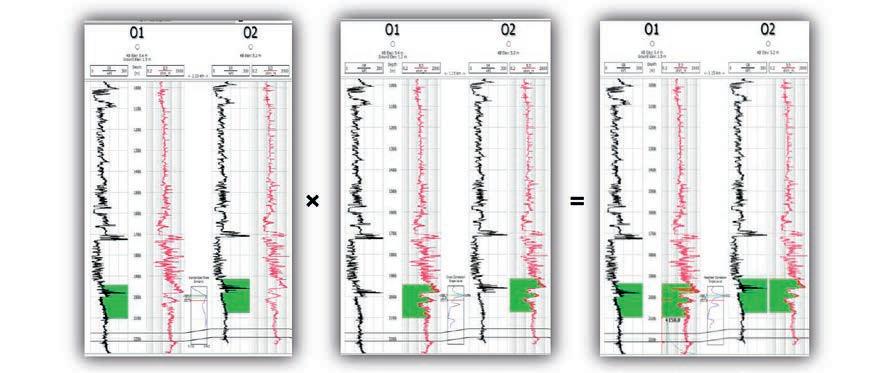
We applied the technique of Weighted Correlation Coefficient (Figure 2). The weighted Correlation Coefficient is a
Covariance between the intervals for standard matching similarity,
• λ4 (j + k) Reading in zone of interest of standard matching similarity for match well,
Standard deviation of the intervals for standard matching similarity
Reading in zone of interest of standard matching similarity for reference well,
Reading in zone of interest of standard matching similarity for match well,
Weighted Correlation Coefficient
WEIGHTED CORRELATION COEFFICIENT
4
Calculation of the coefficien t requires computation of the covariance between the intervals and their standard deviations. If k is the offset between intervals and λ1 (i) is the reading for log λ1 at depth z at the same regular interval, then the covariance between the intervals of length 2n + 1
The correlation method requires the user to select the correlation length for populating an anchor table (a guide function of depth different ial versus depth). Correlation coefficients can vary erratically and in order to help preclude this, the range of a semivariogram, which is the minimum distance at which the semivariogram equals
(Continued on page 22...)
RESERVOIR ISSUE 02 • FEBRUARY 2014 21
����! ! ����, ����; ���� = 1 1 2���� + 1 ����! ���� ����!!!"# ! ����!"# ! ����!!!"# ! ����!(���� + ����) ����!!!"# ! ����!"# ! ����!!!"# ! !!! ! ! !
����!
������������! ���� ����; ���� 1 2���� + 1 ����! ���� ����! ���� + ���� 1 2���� + 1 ����!(����) ����!(���� + ����) !!! ! ! ! !!! ! ! ! !!! ! ! ! While
are: ����! ���� ���� 1 2���� + 1 ����! ! ���� 1 2���� + 1 ����!(����) !!! ! ! ! ! !!! ! ! ! ����! ���� ����; ���� = 1 2���� + 1 ����! ! ���� 1 2���� + 1 ����!(����) !!!!! ! !!! ! ! !!!!! ! !!! !
these two intervals is: ����! ! ���� ����; ���� = ������������! !(���� ����; ����) ����! ���� ���� ����!(���� ����; ����) ������������! !(����, ����; ����) Covariance between the intervals for standard matching similarity ����! ���� ���� ����!(���� ����; ����) Standard deviation of the intervals for standard matching similarity ����! ���� Reading in zone of interest of standard matching similarity for reference well, ����! ���� + ���� Reading in zone of interest of standard matching similarity for match well, Weighted Correlation Coefficient ����! ! ! ! ����, ����; ���� = ����! ! ����, ����; ���� ����! ! ����, ����; ����
����!
4 at the same regular centered at depth ����! in log ���� ����!!!"#
intervals and their
log ����! at depth ����! at the same
2���� + 1 centered at depth ����! in log ����! and
at ����!!!
log ����!
������������! ���� ����; ���� = 1 2���� + 1 ����! ���� ����! ���� + ���� 1 2���� + 1 ����!(����) ����!(���� + ����) !!! ! ! ! !!! ! ! ! !!! ! ! !
����
is equal to:
����! ����, ���� = 1 2���� + 1 ����! ! ���� 1 2���� + 1 ����!(����) !!! ! ! ! ! !!! ! ! ! ����! ����, ����; ���� = 1 2���� + 1 ����! ! ���� 1 2���� + 1 ����!(����) !!!!! !!!!! ! ! !!!!! !!!!! !
two
is: ����! ! ���� ����; ���� = ������������! !(���� ����; ����) ����! ����, ���� ����!(����, ����; ����) ������������! !(����, ����; ����)
similarity ����! ����, ���� ����!(����, ����; ����)
����! ���� Reading
reference well, ����! ���� + ����
standard matching similarity
well,
The Pearsonian correlation coefficient for these
intervals
Covariance between the intervals for standard matching
Standard deviation of the intervals for standard matching similarity,
in zone of interest of standard matching similarity for
Reading in zone of interest of
for match
����! ! ! ! ���� ����; ���� = ����! ! ���� ����; ���� ����! ! ����, ����; ����
4 at the same regular centered at depth ����! in log
intervals and their
����
����! ����
log ����! at depth ����! at the same
2����
1
depth ����! in log ����!
����!!!
����!
������������! ���� ����; ���� = 1 2���� + 1 ����! ���� ����! ���� + ���� 1 2���� + 1 ����!(����) ����!(���� + ����) !!! !!! ! !!! !!! ! !!! !!! !
+
centered at
����! ���� ���� = 1 2���� + 1 ����! ! ���� 1 2���� + 1 ����!(����) !!! ! ! ! ! !!! ! ! ! ����! ����, ����; ���� = 1 2���� + 1 ����! ! ���� 1 2���� + 1 ����!(����) !!!!! !!!!! ! ! !!!!! !!!!! !
����! ! ����, ����; ���� = ������������! !(����, ����; ����) ����! ���� ���� ����!(���� ����; ����) ������������! !(���� ����; ����)
����! ����, ���� ����!(���� ����; ����) Standard
intervals
standard
����! ����
����! ����
���� Reading
Covariance between the intervals for standard matching similarity
deviation of the
for
matching similarity,
Reading in zone of interest of standard matching similarity for reference well,
+
����! ! ! ! ����, ����; ���� = ����! ! ����, ����; ���� ����! ! ����, ����; ����
4
same regular
depth ����! in ����!!!"#
at the
centered at
����!
����!
1
����!
log ����
������������!, ����, ����; ���� = 1 2���� + 1 ����! ���� ����! ���� + ���� 1 2���� + 1 ����!(����) ����!(���� + ����) !!! ! ! ! !!! ! ! ! !!! ! ! !
2���� +
in
����! ����, ���� = 1 2���� + 1 ����! ! ���� 1 2���� + 1 ����!(����) !!! ! ! ! ! !!! ! ! ! ����! ����, ����; ���� = 1 2���� + 1 ����! ! ���� 1 2���� + 1 ����!(����) !!!!! !!!!! ! ! !!!!! !!!!! !
����! ! ����, ����; ���� = ������������! !(����, ����; ����) ����! ���� ���� ����!(���� ����; ����) ������������!
����; ����)
����! ����, ���� ����!(���� ����; ����)
����! ����
����! ����
����
����! ! ! ! ����, ����; ���� = ����! ! ����, ����; ���� ����! ! ����, ����; ����
����! ! ����, ����; ���� = 1 1 2���� + 1 ����! ���� ����!!!"# ! ����!"# ! ����!!!"# ! ����!(���� + ����) ����!!!"# ! ����!"# ! ����!!!"# ! !!! ! ! ! ����!
����!!!"#
����!
����!"#
����!"#
����!!!"#
����! at depth ����! at
����! in
������������!, ����, ����; ���� = 1 2���� + 1 ����! ���� ����! ���� + ���� 1 2���� + 1 ����!(����) ����!(���� + ����) !!! !!! ! !!! !!! ! !!! !!! !
����! ����, ���� = 1 2���� + 1 ����! ! ���� 1 2���� + 1 ����!(����) !!! !!! ! ! !!! !!! ! ����! ����, ����; ���� = 1 2���� + 1 ����! ! ���� 1 2���� + 1 ����!(����) !!!!! !!!!! ! ! !!!!! !!!!! !
����! ! ����, ����; ���� = ������������! !(����, ����; ����) ����! ����, ���� ����!(����, ����; ����) ������������!
����; ����)
����! ����, ���� ����!(����, ����; ����)
����! ����
����! ����
����
!(����,
+
����! ! ! ! ����, ����; ���� = ����! ! ����, ����; ���� ����! ! ����, ����; ����
Figure 2. Illustration of the concept of weighted correlation coefficient for the same wells. The best match is between the intervals centered at 2017 m, which is the correct correlation.
(...Continued from page 21)
the variance, provides a statistical measure of the distance within which measurements are statistically correlated.
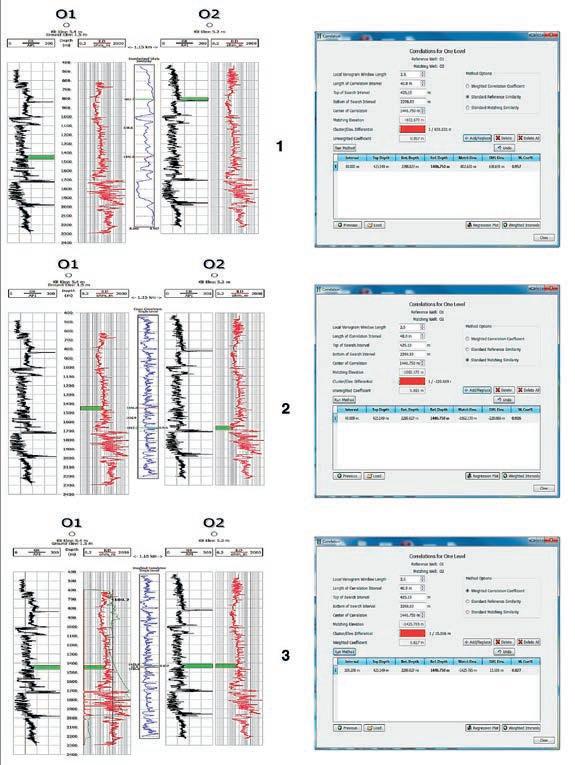
The selection of the re ference elevations was based on a graph of the slope of the local semivariogram. The regression graph of the anchor locations with depth differential versus depth in correlated wells for each pair of wells (Reference an d Matching wells) was c alculated. The chosen p arameters of the regression level and minimum correlation coefficient cut -off were used for the weighted correlation.
SOFTWARE IMPLEMENTED
The program focuses on innovation and user-friendliness for manipulation of the
well and spatial data. We developed the program using the cross-platform Qt toolkit capable of running on Windows, Unix/Linux and Macintosh platforms. The program allows importation of well log data, well to well correlation interval specification, a filtering capability, resampling, anchor table population, regression analysis , well picks importation and extension, datum flat tening, log shading with lithological definition, well to well correlation visualization, gridding and contour mapping capabilities and sending the output results to many file formats.
The algorithms were tested on well logs from a series of borehole drilled in the studied area. Previous work in this area included log and core interpretation for the purpose of determining the reservoir characterization
for the Montney Formation (Derder, 2102; Derder, 2013). The work of Derder provides a complete discussion of the geological and petrophysical interpretation of Montney Formation (Units C & D) in the same area.
The work of Clack (Pers. Comm., 2013) in the region has employed analysis on the log data based to the curve shape analysis. Our goal here is to test and validate how the algorithm identifies the contacts; is the algorithm demonstrating the same trends as the expert ’s picks; and what is the comparative accuracy of the algorithm? It took little time (seconds) to compute wellto-well correlations in a dataset of 2300m of multi-channel logs sampled at multiwindowed of intervals.
Wells O1 and O2 have been selected to explain the concept of usi ng single-log correlation versus multi- log (weighted) correlation. The parameters for correlation were set to be similar for all correlation methods on the same window, where leng th of correlation interval, top of search interval, bottom of search interval, and center of correlation were 40m, 425m, 2299m and 1446m respectively (Figure 3).
We first correlate the wells by using only standard reference similarity log (gamma ray). We then correlate the wells by using only standard matching similarity log (Conductivity log). Finally, we have correlated the selected well by using the weighted log (gamma ray and conductivity). The same method was applied to correlate other adjacent wells of O2 with O3, and to correlate wells of O3 and O4.
In addition to the conductivity log, an attempt is made to investigate the ability of the program by using rock sensitive logs for correlation, such as density and sonic logs. Firstly, the core was selected to assess the lateral and vertical electrofacies variability in the studied area . Then, the geology from drilled core and petrophysical data within Units D, C and B were integrated for the reference well O1 to recognize the different electrof acies in the adjacent wells.
RESULTS
Poor correlations results were obtained between two wells O1 and O2 by using only one single log (GR) (Figure 3.1). Equally poor results were obtained with resistivity logs only (Figure 3.2). Unlike the single log correlation, the weighted correlation results between wells O1 and O2 reveals a very similar sequence in both wells and can provide better results than their separate consideration (Figure 3.3).
22 RESERVOIR ISSUE 02 • FEBRUARY 2014
Figure 3. Poor correlation derived from one single log was used at a time (1 & 2). Satisfactory correlation results obtained from weighted method between wells O1 & O2 correlation (3).
T he weighted correlation method is utilized for populating an anchor table. The regression graph and correlation coefficient of the anchor locations with depth differential versus depth in correlated wells for each pair of wells are shown in (Figure 4). For the weighted correlation, the chosen parameters of the regression level and minimum correlation coefficient cut-off were used.
Although there being 1150m between Wells O1 and O2 from a dataset in WCSB, a very good correlation was obtained. The sample rates were changed to 0.1m before well-to -well correlation in order to provide us with better matching and continuity of log curves. There are ver y good similarity correlations between wells O2 and O3, and between wells O3 and O4. The distance between wells O2 and O3 and between wells O3 and O4 are 1140m and 2450 m, respectively (Figure 5).
The electrofacies is o ften used to distinguish and describe geologic u nits from logs. However, the success of the classification depends on understanding and integrating the facies from the geological study and electrofacies from logs in the study area. An attempt has been made t o
validate how the facies classification system corresponds to the log elec trofacies while not overlooking missing sequences. Therefore, we investigate the degree to which the facies from the core differ from the electrofacies in the log.
The NeoStrat ® software accomplishes the interpretation of log data with computeraided correla tions. It calculates the difference between the logs in elevation within the selected window. We recognize and delineate zones from the logs based on the log curve shape, log magnitude and geological description from the core (corelog correlation).
The reference pick interpretation was that of the author, and may not represent that of other experts interpreting the same data. The picks in the region were based on correlating the wells to the nearest wells the author could find in the Western Canada Geologic Atlas and contributed work of Clack (pers. Comm., 2013). The correlations were based mainly on the gamma ray logs, which were most commonly used in the Atlas. Thus, most of the picks are probably acceptable.
The gamma and resistivity logs were used
for zonation based on pattern recognition and log threshold parameters (Figure 6). The algorithm was tested to identify certain types of contacts. Table 1 refers to software picks which have a comparable human contac t pick. In general, the algorithm produces very sat isfactory results. The computer picked contacts indicate that the algorithm consistently places contacts which were within 2m of a pick selected by log analyst.
A satisfactory result in general was obtained. Fifty-one percent (47 out of 93) of the contact are very close to the human contact picks and are within a 2m dif ferential. Twenty-nine percent (27 out of 93) are within 5m differential and t wenty percent (19 out of 93) are inconsistent with analyst picks (more than 5 meters) either due to the failure of the algorithm or failure of the log analyst.
For correlations within unit of Montney Formation (D, C and B) in particular, a better result was obtained. About 60% (7 out of 12) of the contacts are very close to the human contact picks. Very good computed contacts also notice within 5m of a log analyst making a 26% (3 out of 12).
(Continued on page 24...)

RESERVOIR ISSUE 02 • FEBRUARY 2014 23
COMING SOON! The CSPG Continuing Education committee will be releasing the 2014 course offering soon! Please check the CSPG website and your email inbox for more information—www.cspg.org/education If you have any questions please contact the CSPG office 403-264-5610
Around 14% (2 out of 12) of the computer picks are likely to be inconsistent with analyst picks (around 6 meters).
For validation of the work, we have tried to define tops of the Montney Units using GR with sonic, and GR with density logs. Table 2 summarizes the different in picks of the selected units using GR with induction logs to the GR with sonic, and GR with density logs. Form the tables we notice that the sonic and density logs enhanced the results obtained from using GR with conductivity logs as the follows:
• Firstly, About 70% of the picks (8 out of 12) were within 2m or less. The other four contacts were within 3m or less, which indicates the favor of using rock sensitive logs.
• Secondly, the difference of Montney D unit in the well O4 is reduced by using sonic and density logs due their ability of measuring the rock properties. It decreased from 6.98m to 3.9m and 4.7m using sonic and density logs, respectively. In addition, the difference of Montney C unit in the well O2 is decreased from 6.98m to 2.03m and 3.5m using sonic
ROCK SHOP
and density logs, respectively.
• Thirdly, although the contact of Montney B in well O2 is higher than the same pick in the reference well, the same pick in the other wells were deeper but within a very narrow range of only 1m. The picks of the Montney units using GR with sonic logs and GR with density logs were shown in the (Figure 7).
CONCLUSION AND RECOMMENDATION
NeoStrat® is a com puter program developed to correlate the stratigraphy of well logs using weighted correlations of different logs such as gamma ray, resistivity, sonic and density. The main purpose of this evaluation was to determine if the correlations were useful and if the author would consider using it in geological and petrophysical studies. The main focus was on the effects of using different parameter values and how they affected the accur acy of the resulting correlations.
The correlation program is worthwhile and useful. The main use will probably be for detailed correlation of reservoir units or over limited sequences. The results can also
210, 237 – 8th Ave. S.E. Calgary, AB T2G 5C3
Phone: 403.263.5440
Fax: 403.263.2331
m.sahota1@shaw.ca

aid in the refinement of manual correl ations. Anomalies in the correlations highlight the presence of special circumstances. Although the automatic weighted correl ations are not always exactly correct every where, they often show something that a geologist doing manual correlation s may have probably missed. Results are summarized below:
• The software, in general using multilogs is a very promising geological characterization, correlation and interpretation tool.
• The log picks algorithm performed well in the case study and provide consistent well-to-well correlations on wells separated by thousand meters with little dependence on the type or combination of logs.
• Interactive processing is recommended for locating sharp contacts , especially for gradational contacts.
• The system is controlled by the reference well interpretation and pattern recognition to build the statistical knowledge base.
• Using more logs and curve shape parameters could enhance classification by providing enough discrimination between tops and unit s.
FARHAT HYDERI,P.Geol.
President / CEO
3300, 205 - 5th Ave SW Calgary, AB T2P 2V7
Tel403 726 0666
Fax403 264 1262
Cell403 819 2516
farhat@sableconsultants.com
SABLECONSULTANTS.COM
Conventional Wells Coring Pr ograms Heavy Oil/Oil Sands Coal Bed Methane SAGD Horizontal Project Supervision

24 RESERVOIR ISSUE 02 • FEBRUARY 2014
(...Continued from page 23 )
petrographical & sedimentological descriptions for samples (thin section - fluid inclusion studies) conventional vertical/horizontal wells operations geology SPECIALIZED IN GEOLOGICAL WELLSITE SUPERVISION AND CORE ANALYSIS RockWell
our best friend and most valuable partner is our client Stephan C. Dragomir president www .g e ok2. c om - phon e : 403.831.9941 - s dr a gomir @ g e ok2. c o m SABLEPETROLEUM CONSULTANTSINC. WELLSITE GEOLOGICAL SUPERVISION
Consulting
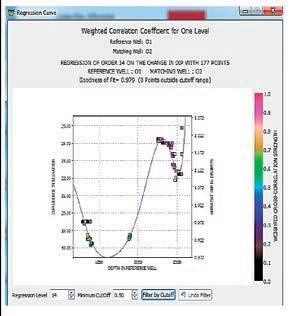
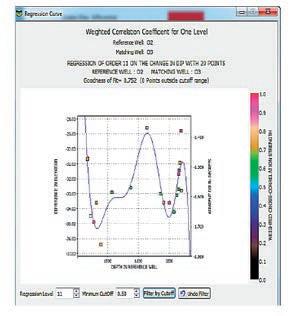
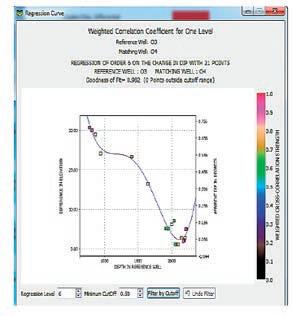
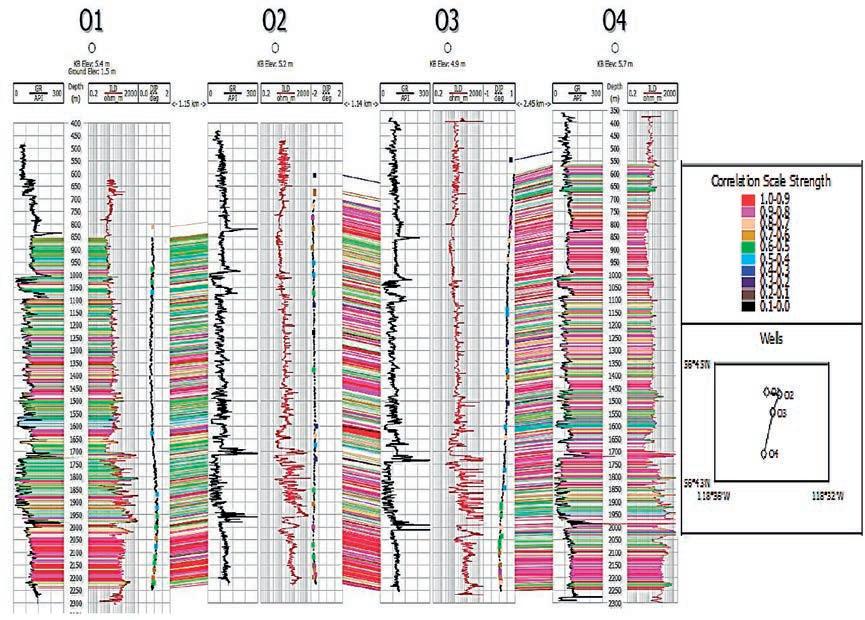
5. Illustrate the perfect correlation between wells O1, O2, O3 and O4. Black log (GR), red log (ILD). The strength of correlation coefficient cut-off is 0.5.
REFERENCES
1. Bonnet, A. and Dahn, C., 1983, Oil-well data interpretation using expert system and patter recognition techniques: Proceedings of the Eighth International Joint Conference on Artificial Intelligence, W.Kaufmann, Inc., Los Altos, California, p. 185-189.
2. Cheng, Y. C. and Lu, S.Y., 1985, Waveform correlation by tree matching: IEEE
Transactions on Pattern Analysis and Machine Intelligence, v. PAMI-7, no.3, p. 299-305.
3. Davis, R., Austin, H., Carlbom, I., Frawley, B., Pruchnik, P., Sneiderman, R., Gilreath, J A. The Dipmeter Advisor: Interpretation of Geologic Signals” Proceedings of the 7th International Conference on Artificial Intelligence. August 1981
4. Derder, O. 2012. Characterizing Reservoir Properties for the Lower Triassic Montney Formation (Units C and D) Based on Petrophysical Methods. MS thesis, University of Calgary, Calgary, Alberta, Canada.
5. Derder, O. 2012. Rock typing and definition of flow units, Montney Formation (Unit C), (Continued on page 29...)
RESERVOIR ISSUE 02 • FEBRUARY 2014 25
Figure 4. Regression curves (difference in elevation) for the correlations of each wells pair.
Figure
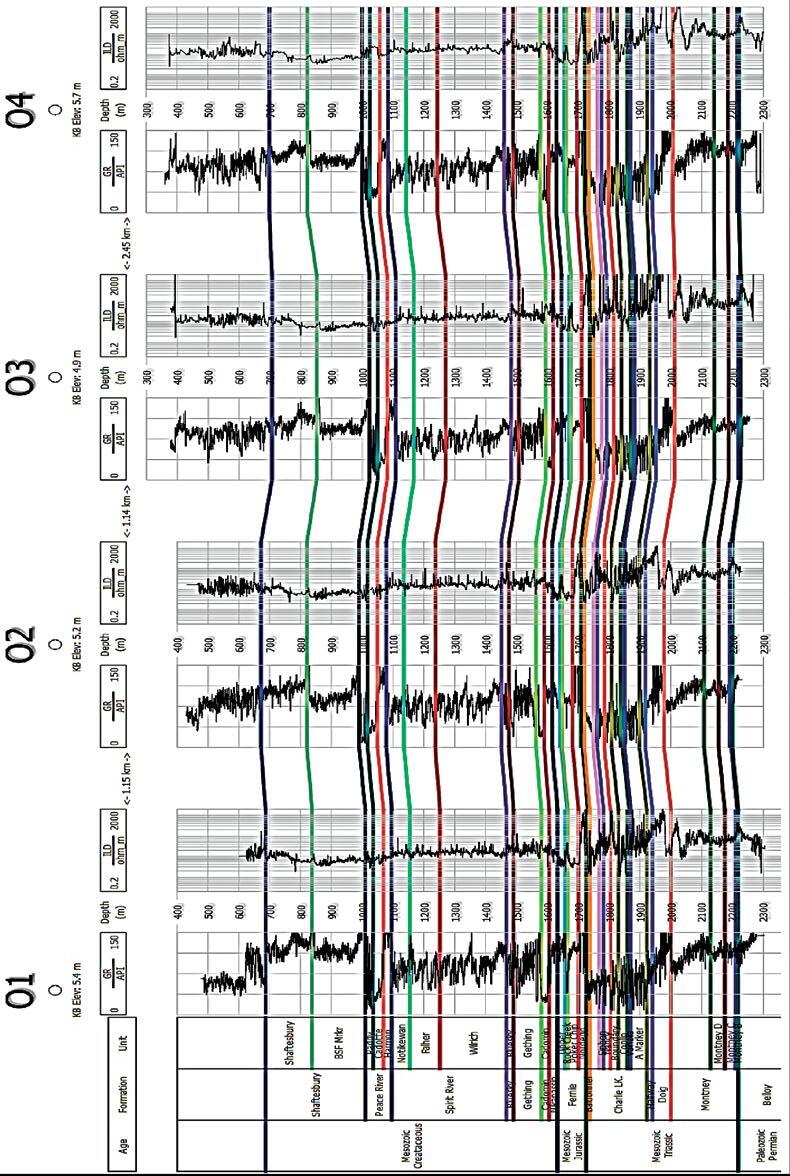
6. Log picks for the studied wells. The algorithm presented here applied for the well-to-well correlation of gamma ray and induction log deep logs.
26 RESERVOIR ISSUE 02 • FEBRUARY 2014
Figure
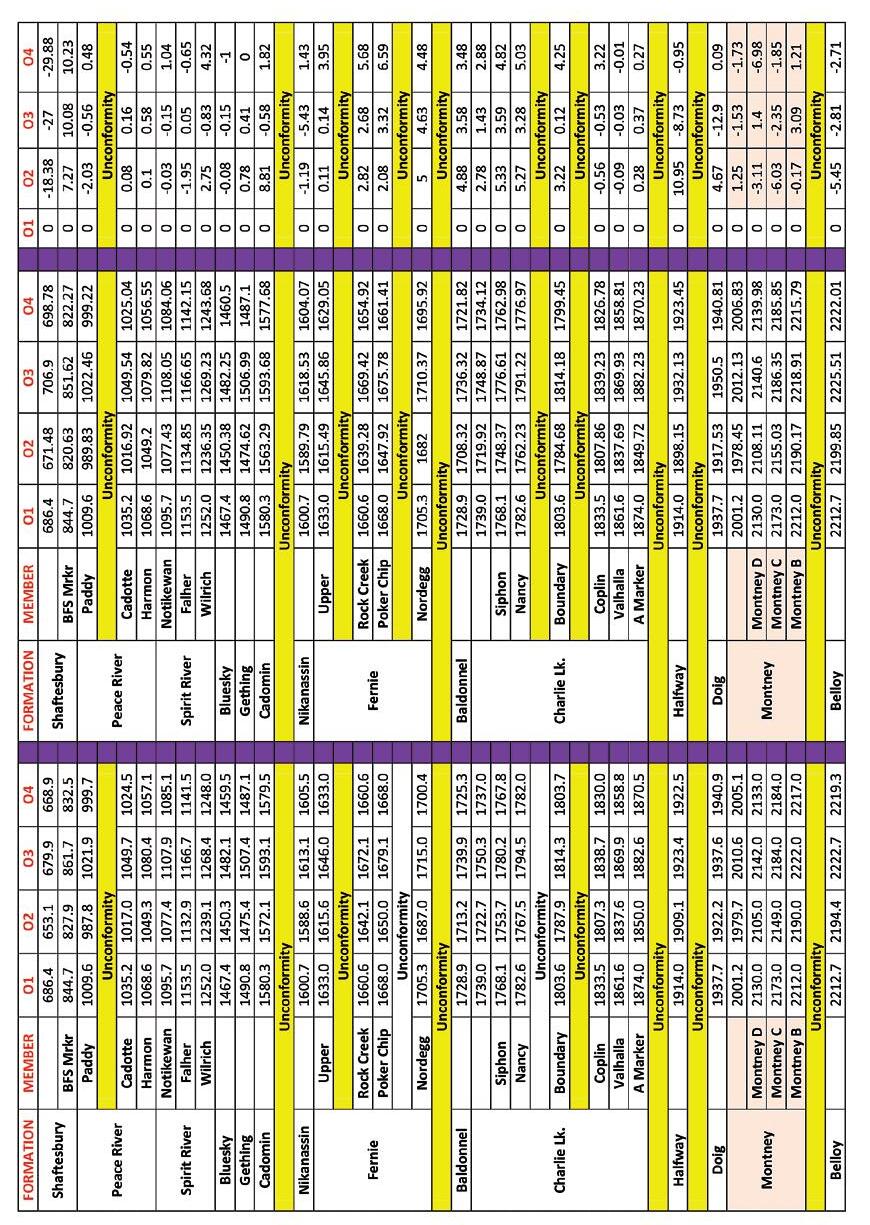
analyst picks. Mi ddle, software picks. Right, t he difference in elevation be tween the human picks and our algorithm picks. Units ar e in meter.
Table 1. The Corre lation for wells indicates, in general, a high degree of corr elation between the log measuremen ts.
RESERVOIR ISSUE 02 • FEBRUARY 2014 27
Left,
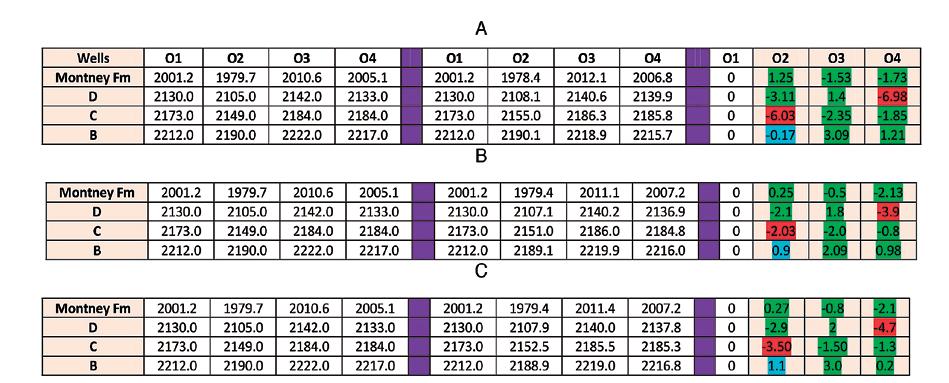
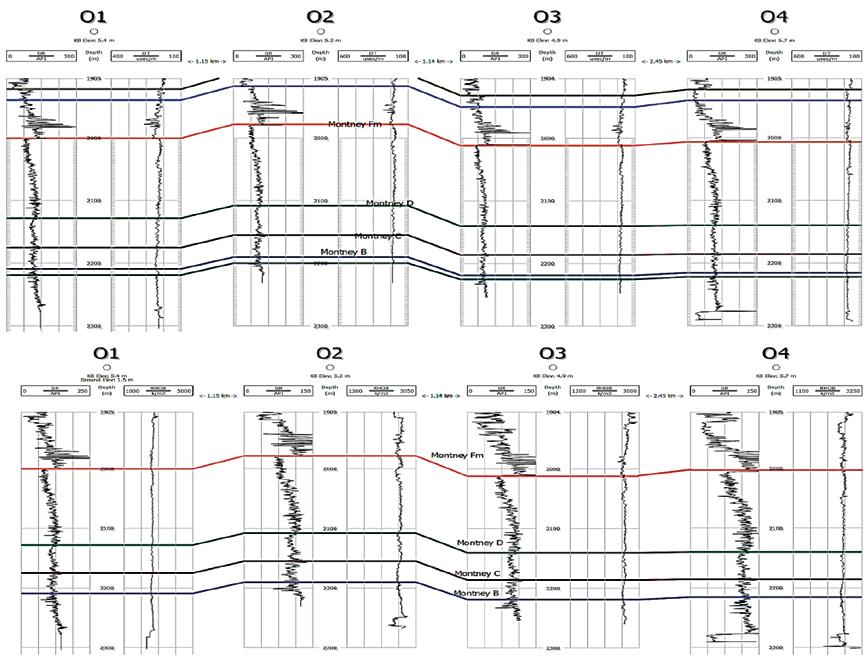
28 RESERVOIR ISSUE 02 • FEBRUARY 2014
Table 2. Summarizes the selected picks of Montney Units (D, C and B) using different logs. A (GR & ILD log), B (GR & Sonic ∆t log) , C (GR & Density log)
Figure 7. Tops Montney Formation Units. GR with Sonic logs (top) . GR with Density logs (bottom).
West Central Alberta. InSite: 31(1): 16-21.
6. Derder, O. 2013. Characteristics of the Triassic Upper Montney Formation (Unit C), West Central Area, Alberta. CSPG CSEG CWLS geoConvention.
7. Dixon, J. (2000). Regional lithostratigraphic units in the Triassic Montney Formation of western Canada. Bulletin of Canadian Petroleum Geology, v.48, No.1, p.80-83.
8. Doveton, J. H., 1986, Log Analysis of Subsurface Geology: John Wiley & Sons, New York, 273 p.
9. Duda R. O. and Hart P. E., 1973, Pattern Classification and Scene Analysis, New York: Wiley- Interscience, 211-236pp.
10. Edwards, D. B., Barclay J. E., Gibson, D. W., Kvill, G.E., Halton, E. (1994). Triassic Strata of the Western Canada Sedimentary Basin. Geological Atlas of the Western Canada Sedimentary Basin (Chapter 16).
11. Energy Resources Conservation Board (ERCB), Table of Formations, Alberta, 2009.
12. Fang, J. H., Chen, H. C., Shultz, A. W., and Mahmoud, W., 1992, Computeraided well log correlation: American Association of Petroleum Geologists Bulletin, v. 76, no. 3, p. 307-317.
13. Gill, D., Shomrony, A., and Fligelman, H., 1993, Numerical zonation of log suites
by adjacency- constrained multivariate cluster: American Associ ation of Petroleum Geologists Bulletin, v. 77, no. 10, p. 1781-1791.
14. Kemp, F., 1982, an algorithm for the stratigraphic correlation of well logs: Mathematical Geology, v. 14, no. 3, p. 271-285.
15. Lanning, E. N. and Johnson, D. M., 1983, Automated identif ication of rock boundaries —an application of the Walsh transform to geophysical well log analysis: Geophysics, v. 48, no. 2, p. 197-205.
16. Le Nir, I., Van Gysel, N., and Rossi, D. 1998, Cross-section construction from automated well log correlation: a dynamic programming approach using multiple logs: Transaction of the SPWLA 39th Annual Log ging Symposium, Society of Professional Log Analysts, Houston, paper DDD, 13 p.
17. Lineman, D. J., Mendelson, J. D., and Toksöz, M. N., 1987, well to well determination using knowledge- based systems and dynamic depth warping: SPWLA Transactions, 28th Annual Symposium, paper UU, 25 p.
18. Luthi, S.M. and Bryant, I.D., 1997, Welllog correlations using a back-propagation neural network: Mathematical Geology, vol. 29, no. 3, p. 413-425.
19. Luthi, S.M., 2001, Geologic al Well
Logs, Their Use in Reservoir Modelling: Springer-Verlag, Berlin, 373 p.
20. Merriam, D. F. and Sneath, P. H. A ., 1967, Comparison of cyclic rock sequences using cross-association: in Ess ays in Paleontology and Stratigraphy, C.Teichert and E. L. Yochelson, eds.: University of Kansas, Department of Geology, Special Publication 2, Lawrence, Kansas, p. 523538.
21. Moslow, T. (20 00). Reservoir Architecture of a Fine-Grained Turbidite System: Lower Triassic Montney Formation. WC SB. 20th Annual Research Conference DeepWater Reservoirs of the World (pp. 686713). GCSSEPM Foundation.
22. Mossop, G. D., Shet sen, I (1994). Introduction to the Geological Atlas of the Western Canada Sedimentary Basin (Chapter 1).
23. Olea, R. A. and Sampson, R. J., 2003, User’s manual for Correlator, version 5.2: Kansas Geological Survey, Lawrence, Kansas.
24. Sackin, M. J ., Sneath, P. H. A., and Merriam, D. F., 1965, ALGOL program for cross-association of numeric sequences using a medium size computer: Kansas Geological Survey, Special Distribution Publication 23, 37 p.
JOURNEY TO THE BOTTOM OF THE WORLD: Susan R. Eaton’s account of her scientific adventures in the Antarctic to Grade 3 to 8 students
On December 17, 2013, Susan Eaton (P.Geol., P.Geoph., M.Sc., B.Sc. Hon., B.J. (Journalism) Hon.) came as a guest speaker to Notre Dame des Vallées, a French elementary – junior high school in Cochrane, Alberta. She gave two presentations; one in the morning to 23 Grade Three and Four students; and another in the afternoon for a group of about 45 Grades 5 to 8 students. Many topics were covered;
1) recounting Shackleton’s epic survival story after his ship, the Endurance, was crushed by ice and sank;
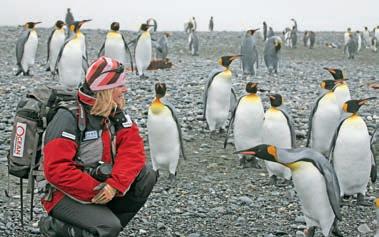
2) how a team of scientists from various disciplines (including geology and geophysics) retraced Shackleton’s steps in 2013, under the auspices of the Geological Society of America;
3) the importance of understanding oceanic changes that have triggered a cascading series of geological and
biological changes in this fragile ecosystem and also have global implications;
4) the survival skills required to explore the Antarctic;
5) the high-tech gear needed for diving and snorkeling in extremely cold water; and
6) the fauna encountered, from the highly
opportunistic and predatorily leopard seals to the curious and sometime mischievous penguins, a big highlight with the younger children.
Susan showed her outstanding photographs and videos, as well as those taken by National Geographic photographers. Susan was very successful in capturing the students’ interest. She was extremely generous in sharing her knowledge, while adjusting the content of her presentation to reach the appropriate grade level. Pertinent questions were asked, and, for many, the exciting world of science came alive, engaging the next generation of budding scientists. Thank you, Susan, for a very enriching and inspiring presentation!
Eva Drivet (P.Geol.) Drivet Geological Consulting Ltd
RESERVOIR ISSUE 02 • FEBRUARY 2014 29
(...Continued from page 25)
GO TAKE A HIKE
Ram Falls Provincial Park, Alberta
| By Philip Benham, W.R. Jamison and Yingchun Guan
Trailhead: The roads to reach this site are mostly unpaved and there are few facilities. Ensure you start with a full tank of gas and bring a vehicle appropriate for the gravel roads. Spring thaw and heavy rains can make roads slick or impassable. Drive 8 km west from Caroline on Hwy 22 to intersection with Hwy 591 then continue WSW on it for 31 km. At junction with Hwy 40 / 734 continue SW on Hwy 40. It swings to NW and, almost 58 km from the junction, you will cross the bridge over Ram River. The park entrance is on your right, 300m beyond the bridge. Proceed about 500m east from the entrance to the day use area and Ram Falls Viewpoint parking area (P on map). To access the “Wad” viewpoint, drive 2.7 km west from the PP entrance along Forestry Road 40 (passing the airstrip- “A” on map), then turn left (west) on a well maintained gravel road and continue for another 2.0 km. Walk south through the forest (no trail) for ~100 to 200 m to the bank of the river. The “Wad” should be in sight on the opposite bank.
Distance: The trail to the Ram Falls viewpoint is short (about 400m return) but you can extend it by walking almost 1 km along the valley rim for varying views of the waterfall and contorted strata. The view point is stepped boardwalk that drops perhaps 30m. Handrails provide safety at the viewpoint and signs advise you not to clamber on the steep slopes of loose shale..
The Reservoir Committee welcomes contributions from our readership to this series. If you wish to offer a submission to Go Take a Hike on your favourite hike of geological interest, email the Reservoir at Emma.MacPherson@cspg.org for more information.
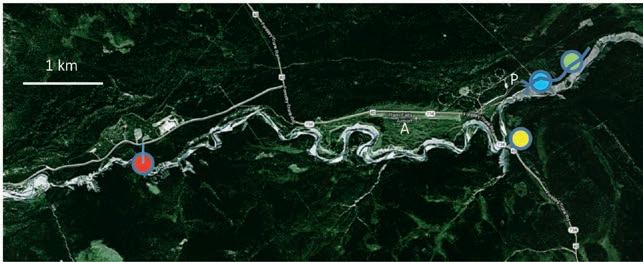
The Turonian aged Cardium Formation is a sandstone prone package of strata sandwiched between the black marine shales of the underlying Blackstone and overlying Wapiabi formations. All three formations are extensively and spectacularly exposed at Ram Falls Provincial Park. The Cardium is approximately 100m thick and is subdivided into members on the basis of least five coarsening (and shallowing upwards) cycles. The most obvious to spot is the approximately 15m thick Kakwa member which contains the thick sandstone that forms the resistant lip of the waterfall (Plint et al, 1988).
Numerous thrust faults are exposed along the length of Ram River. Strata adjacent to these faults display widely varying deformation styles based on an interplay of lithology, bedding thickness, geomechanical properties and characteristics of the fault. We will discuss these from west to east. The sites discussed on cross-section are colour coded to circles on map, or stars if off the map. About 5 km directly west of the park entrance (and visible from the waterfall viewpoint) are the Ram Mountains. They are composed of Paleozoic carbonates carried to the surface by the McConnell Thrust (the same fault observed at Mount Yamnuska flanking the

Bow Valley). The eastern limit of the erosion resistant Paleozoic strata (purple star on cross–section) marks the boundary between the Rockies Front Ranges and the Foothills. East of the McConnell Thrust but, upstream of the viewpoint, is a disharmonically deformed “wad” of late Jurassic Nikanassin Group sandstones, siltstones and shales. It sits in the hangingwall of an unnamed thrust fault (red circle). The strata are so convoluted that they resemble swirled ice-cream. At the waterfall viewpoint (blue circle) the Cardium rises and then arcs gracefully over itself in the hanging wall of a relatively small thrust fault that, for the most part, places Wapiabi over Wapiabi. The forelimb of the folded Cardium exhibits significant extensional deformation, but much less than in the “Wad.” Further downstream, the exposed footwall Cardium dips steeply at about 45° SW (green dot). Beyond this, the river swings southeast and steeply dipping Blackstone shales are exposed as far as the eye can see. The Cardium, had it been preserved (see cross section) would be up to one kilometre above us at this point. A good three kilometres of overlying strata has been removed by erosion during the growth of the Rockies and since cessation of fault activity in the Eocene (approximately 45 Ma).
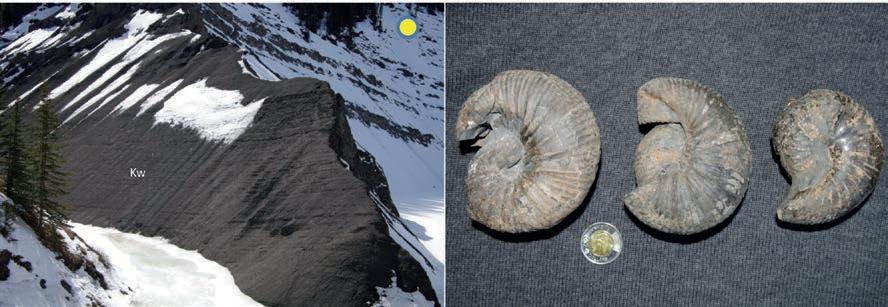
30 RESERVOIR ISSUE 02 • FEBRUARY 2014
Above Left: View of Wapiabi black shales with minor siltstone and siderite nodules, along Hwy 40 at the bridge over Ram River. Above Right: Close-up of Scaphites depressus. These specimens are macroconch (probably female); the male of the species is much smaller (microconch). Scaphites is a heteromorph ammonite (complete specimens are shaped vaguely like the number “9”). It is common in the Western Interior Seaway and its rapid evolution makes it a useful biostratigraphic marker. These specimens come from the Wapiabi Fm, upstream of the waterfall and park. Photo courtesy of Keith Mychaluk.
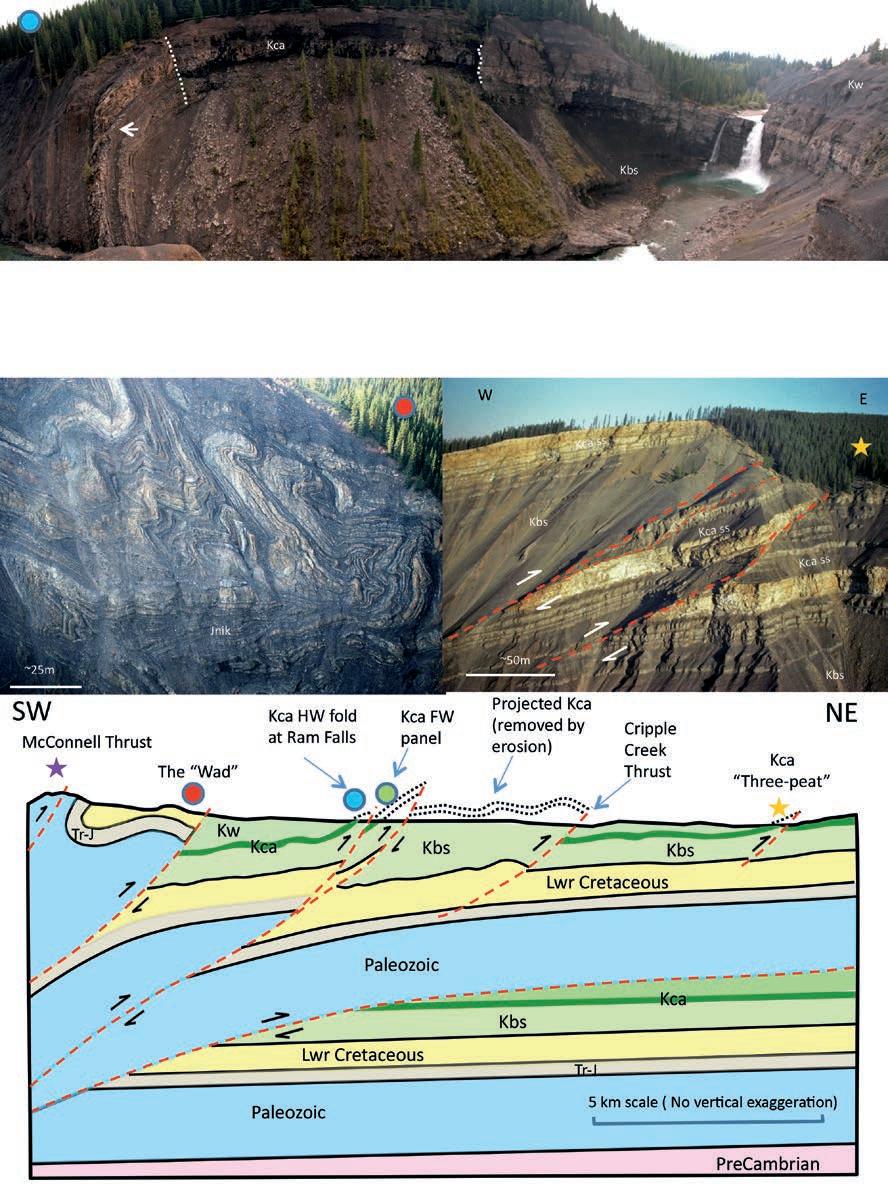
Top. Panoramic view from the Ram Falls platform. On a clear day the Ram Mountains (lifted by the McConnell Thrust) will be visible about 5 km west beyond the falls. The west dipping backlimb of the Cardium hanging-wall fold rises and then overturns steeply. The white arrow points to the start of strong extension of the Cardium sand in the forelimb. Dashed lines mark minor fault offsets. Photo courtesy of Tannis McCartney Centre Left: The “Nik Wad” displaying disharmonically folded Nikanassin strata. Centre Right: Cardium “three-peat” about 8 km downstream of waterfall on South Ram River, view from helicopter (not accessible as part of this hike). White arrows identify fault movement direction. Bottom: Cross section adapted from Currie and Reik (1977) after Erdman (1946). In general deformation decreases eastwards. Photo locations on section are identified with coloured dots and stars. The cross-section is a simplification as numerous folds and small faults dramatically thicken the Blackstone (Kbs) downstream of Ram Falls.
RESERVOIR ISSUE 02 • FEBRUARY 2014 31
Top Left: Brown sideritic concretion within the Wapiabi (near viewing platform). These concretions can occur around the shells of ammonites as the decaying organism alters the pH, triggering carbonate cementation.
Top Right: Distal expressions of storm event beds (often expressed as hummocky cross stratification) can be seen here in occasional silty to fine grained, rippled sandstone beds.
Centre Left: View from platform downstream to footwall Cardium (erosion resistant fin) on north side of valley. An extensive slope of loose Wapiabi shale (and some outcrop) is in the foreground. If you walk to the point opposite the fin you will see Cardium at your feet on the south side of the valley.
Inset shows several metres of sideritic nodular bedding on the top of one of the Cardium shallowing cycles which are easily visible from the trail along the valley edge.
Centre Right: View of Cardium sands in the footwall, downstream of the waterfall.
About 8 km downstream of the last Cardium is yet another fault repeat. It is not accessible by foot but a view by helicopter is provided (orange star). Note that here the Cardium exhibits more brittle deformation, the fault branches and splits the Cardium into three beams. This may be due to much smaller displacement along the fault plane.
If you look closely at the various outcrops you will see that fracture (or joint) density varies between the sandstones and the surrounding shales as well as along individual beds depending on their position on a structure (fold flexure or fault proximity tend to result in increased fracture density). Regional joint sets occur parallel and perpendicular to the direction of compression (which is approximately 40 degrees East of North). This regional compressional orientation is related to the growth of the Rocky Mountains (mostly between the Mid Cretaceous to Eocene) when approximately 170 km of shortening due to fault and folding is known to have occurred (Price and Fermor, 1984). These regional joint sets are then “supplemented” by additional fracture sets during fold and fault growth. You may notice that many of the fractures in the sandstone terminate at bed boundaries. This is due to the differing geomechanical properties (the stiffer, more brittle sandstone versus the softer, ductile shales). A combination of these properties is taken into account when petroleum companies consider the creation of manmade fractures (“fracs”) during the stimulation of a well. Generated “frac’s” tend to propagate to the NNE (the direction of maximum compressive stress), and are then held open with injected sands or ceramic particles. The natural fractures within the reservoir provide additional key high permeability pathways for oil and gas within the tight reservoir. Without the combination of completion technology, horizontally oriented wells and natural fracture systems many unconventional plays (such as the Cardium Light Tight Oil play) would be uneconomic.
References:
Currie, J.B., and Reik G.A.,1977. A method of distinguishing regional directions of jointing and of identifying joint sets associated with individual geologic structures. Can. J. Earth Sci., 14, 1211-1228 (1977).
Erdman, O A, 1946., Cripple Creek Map Area, GSC Paper 46-22, 1946.
Plint, A.G., Walker, R.G., and Duke, W.L. (1988). From: James, D.P., & Leckie, D.A. (Eds.) 1988, Sequences, Stratigraphy, Sedimentology,: Surface and Subsurface. CSPG, Memoir 15, p. 167-184. Price, R.A. and Fermor, P.R. 1984. Structure section of the Cordilleran Foreland Thrust and Fold Belt west of Calgary. Geological Survey of Canada Map 1501A.
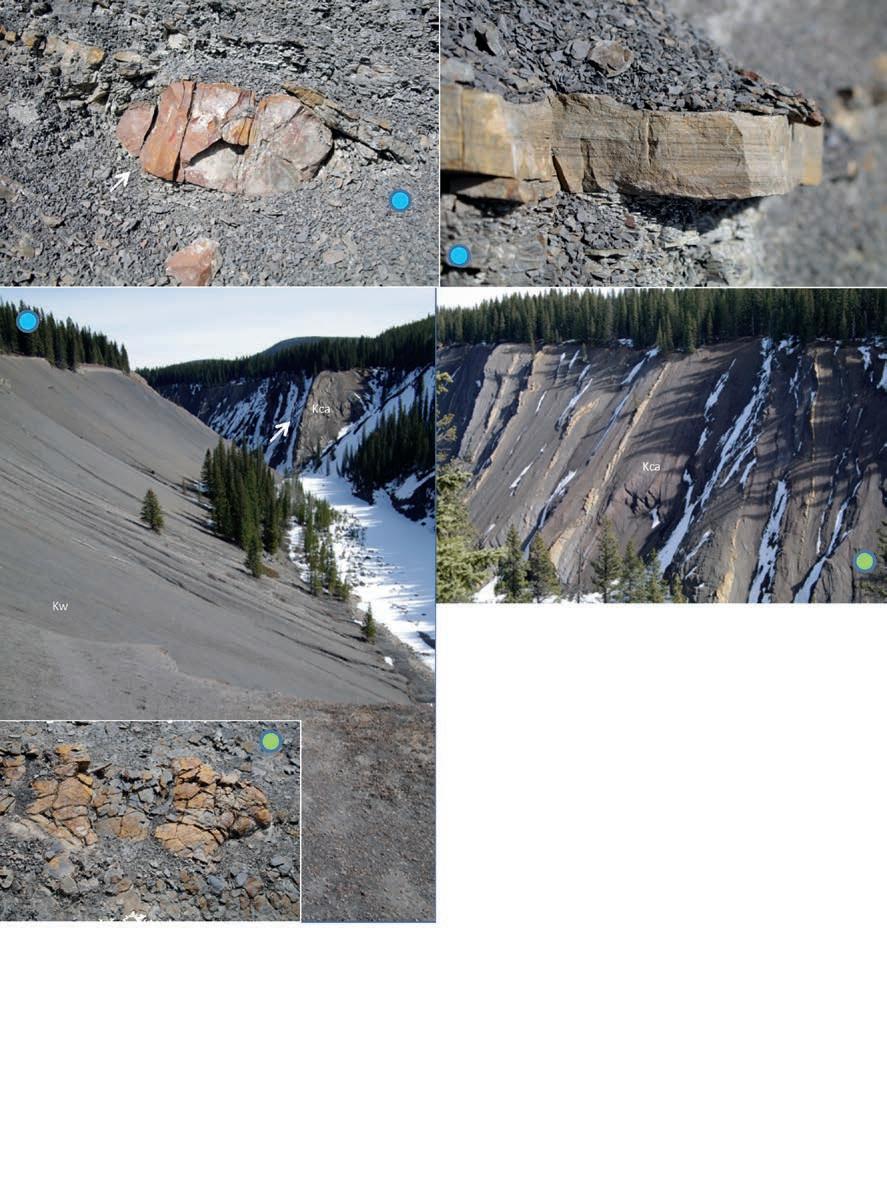
Reik G.A. and Currie, J.B., ,1974. A Study of Relations between Rock Fabric and Joints in Sandstone. Can. J. Earth Sci., 11,1253-1268 (1974).
32 RESERVOIR ISSUE 02 • FEBRUARY 2014
PHOTO OF THE MONTH
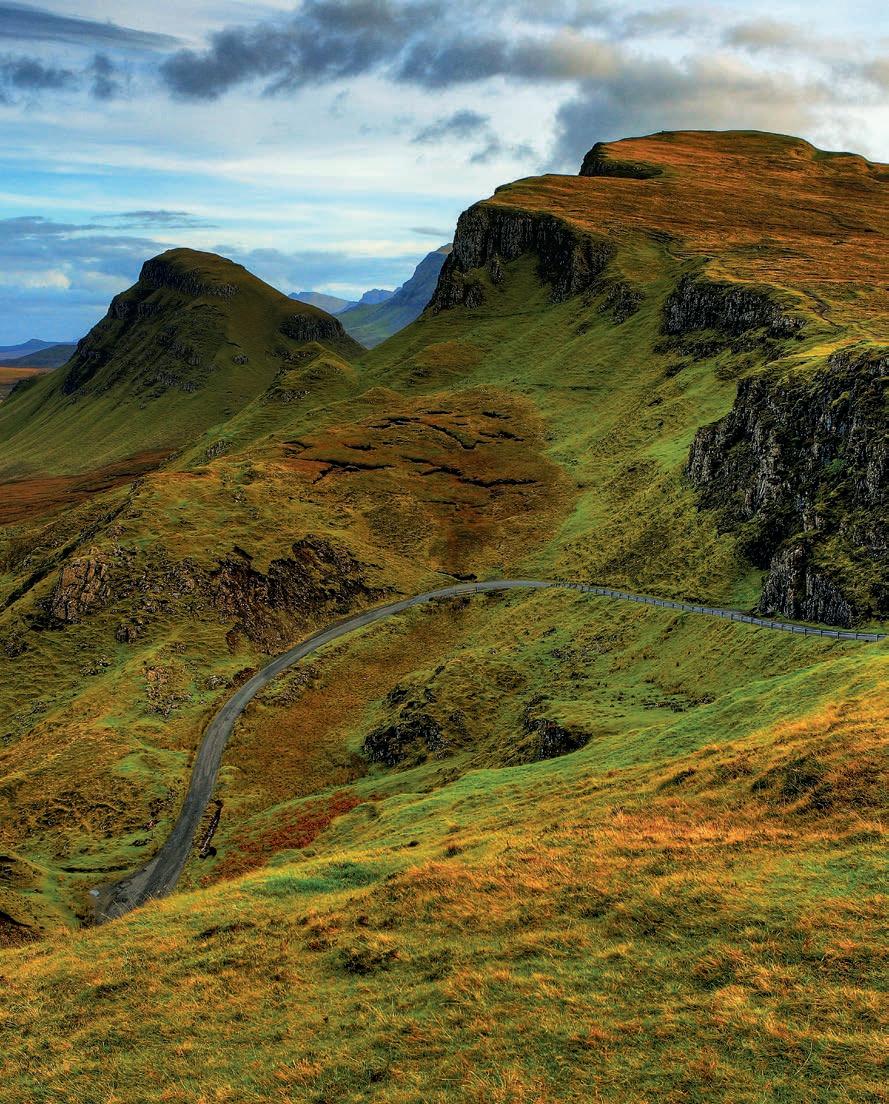
RESERVOIR ISSUE 02 • FEBRUARY 2014 33
The Quirang, Isle of Skye, Scotland. This fascinating landform is a result of a series of landslides. This feature is comprised of Jurassic sediments, clays, shales and sandstones overlain by thick lava flows.
GEOCONVENTION 2014: FOCUS
GeoConvention is not just about the education; your GeoConvention experience wouldn’t be complete without the opportunity for networking. Macmillan’s definition of networking is “the activity of meeting and talking to people to exchange information and advice about work or interests.” There are several events taking place during the week, designed to facilitate this. And provide a little fun, too!
FOCUS ON BREAKFAST
Some say breakfast is the most important meal of the day. That may be especially true for GeoConvention as the Power Up Breakfasts take place on the exhibit floor, providing an opportunity to visit with suppliers while you enjoy
Luncheons, to share stories, talk about key issues and inspire you to change and action. Monday’s lunch will feature Ivo Vegter, an independent South African journalist and author of Extreme Environment: How Environmental Exaggeration Harms Emerging Economies, published by Random House Struik, and nominated for the 2013 Alan Paton Non-Fiction Award. Check out Ivo’s TEDxCapeTown talk on YouTube, follow him on twitter @IvoVegter, and don’t miss his lunch presentation on May 12. Amanda Lang, co-host of CBC TV’s Lang and O’Leary Exchange and senior business correspondent for CBC’s The National, will be the speaker at Tuesday’s lunch. Her book, The Power of Why: Simple Questions That Lead to Success, shows readers how to reignite curiosity at any age to become more innovative and productive and this will be the topic of her address on May 13.
Wednesday will again feature an Industry-
will focus on networking and building the future of the industry.
FOCUS ON SOCIAL EVENTS
Wind down at the end of each day with fun social activities. The Monday Night Social Event and Tuesday Night Networking Event both take place on the exhibit floor. They provide an opportunity for exhibitors and delegates to visit and get to know colleagues in a casual environment with entertainment, food and beverages. Wednesday evening will be focused on education with a new Alumni Reception – where you can catch up with professors, school reps and fellow alumni to celebrate everyone’s successes and show support for your alma mater – and the Challenge Bowl – where student teams will compete in an action-packed geoscience quiz game. And the week will wrap up again with the annual AGAT Core Meltdown at the

MONDAY LUNCH: IVO VEGTER
South African journalist, author TUESDAY LUNCH: AMANDA LANG Lang & O'Leary Exchange and CBC Sr. business correspondent


34 RESERVOIR ISSUE 02 • FEBRUARY 2014
www.geoconvention.com Registration opens March 3
program:
sessions
poster presentations
the AER Core Research Centre
May 12-16, 2014, www.geoconvention.com
3-day technical
oral
and
2-day Core Conference at
3-day exhibit floor with over 100 exhibitors Networking and Social Programs
GEOLOGY OF THE MOUNT STEPHEN TRILOBITE BEDS AND ADJACENT STRATA NEAR FIELD B.C., YOHO NATIONAL PARK
New Perspectives on a 127 Year Old Discovery: Part 3
| By V. Allen Kimmel P. Eng., P. Geol.
This article is a summary of one technical letter and three technical papers related to ongoing research by the author in an area that includes the Mount Stephen Trilobite Beds and Burgess Shale located near Field, BC. The present research began with the recognition of, and investigation into, the Field Slide by the author, the findings of which are summarized immediately below. Analysis of the slide mass and slide failure surfaces led to other relevant findings that are contained within the pages that follow.
The article is divided into three segments for publication in the Reservoir. The first segment deals with the existing surface geomorphology and Cambrian depositional environments. The second segment deals with the Mount Stephen Trilobite Beds, adjacent strata and local structural features. The final segment concludes discussing the local structural features and highlights the major conclusions of the research to date.
PART 3 - FINAL SEGMENT
THE FOSSIL GULLY FAULT ZONE
The Fossil Gully Fault Zone (FGFZ) is a remnant of the final of three major mountain building events visible in the study area. The Fossil Gully Fault (FGF) received its name from Rasetti (1951. p.39 & 40, Fig. 3) while working in Fossil Gully on the north slope of Mount Stephen. That same year Ney (1954), called the fault the Field Stephen Fault and viewed it as being part of a fault zone rather than a single fault, though he did not pursue resolving the structure of the zone (p.120 Fig 1). Both Ney and Rasetti traced the fault/fault zone from the west side of Mount Stephen across the Kicking Horse Valley and onto Fossil Ridge on the southwest side of Mount Field.
As is evident in Figure 18, the FGFZ comprises three fault blocks visible on the south side of Mount Field - the relatively in place west block, the partially down thrown and rotated central wedge and the fully down thrown and rotated east block. The blocks are separated by the Western Fossil Gully Fault (WFGF) and the Eastern Fossil Gully Fault (EFGF). The total vertical displacement across the FGFZ in this location is estimated
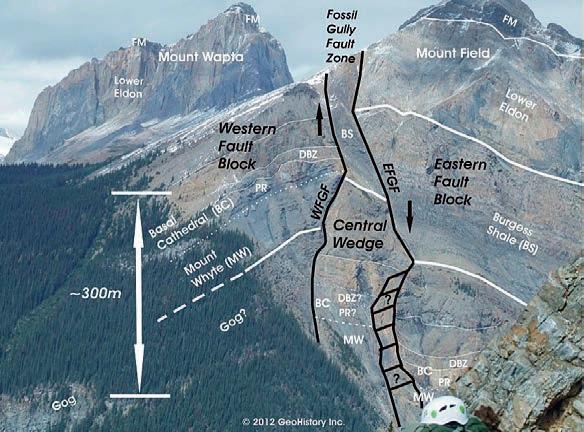
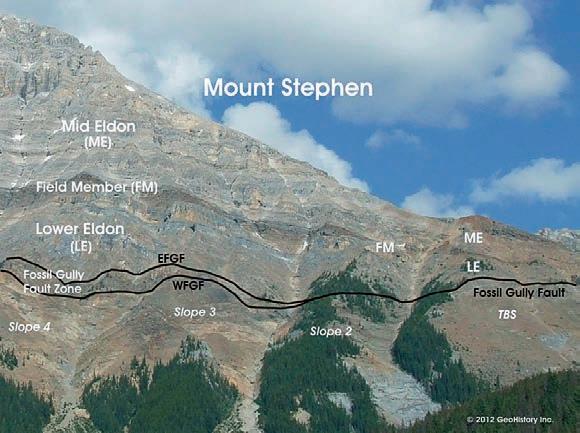
RESERVOIR ISSUE 02 • FEBRUARY 2014 35
Figure 18. The FGFZ on Mount Field. The Basal Cathedral (on the eastern fault block visible above the climbing helmet at the base of the photo) is approximately 300 metres lower than the correlative Basal Cathedral Zone on the Western Fault Block. Note the patch reefs (PR) visible within the Basal Cathedral as well as the overlying draping carbonate beds zone (DBZ) in the Western Block.
2003,
Figure 19. Original Fossil Gully Fault interpretation on the west side of Mount Stephen which shows the Fossil Gully Fault Zone merging into one fault across Slope 2 and the TBS. Note also the apparent pinching out Field Member (FM) from left to right in the photo. Modified from Fletcher and Collins
Fig.3
36 ...)
(Continued on page
at approximately 300 metres. Findings from this year’s field work indicate that the Fossil Ridge strata, containing the famous Walcott and Raymond Quarries, is located within the central wedge of the FGFZ.
The FGFZ interpretation was refined and enhanced along the western flank of Mount Stephen by Fletcher and Collins in 2003. Though Fletcher and Collins (2003. p.1824, Fig.1) appear to have originally hypothesized that the full FGFZ crossed the entirety of Mount Stephen, their final interpretation shows the Fossil Gully Fault Zone tracking south from Fossil Gully, across Slope 4 and Slope 3 and then merging into a single Fossil Creek Fault that continues south across Slope 2 and finally crosses the TBS immediately upslope of the patch reef shown in Figure 2 of the initial article segment (p. 1828 Fig. 3 and 2009, figure 8, p.40). They interpret the upper one third of the TBS as Mid and Lower Eldon separated by a pinching out Field Member, as illustrated in Figure 19. There is no Cathedral Escarpment in their interpretation.
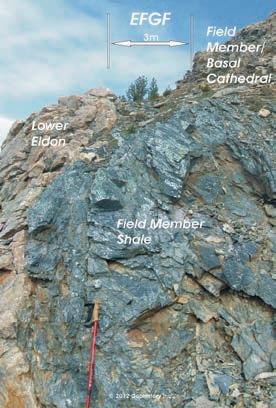
Figure 20. The Eastern Fossil Gully Fault (EFGF) on the southern edge of the TBS. Note the deformed Field Member shale that makes up the mass of the strata in the 3 metre wide fault. The fault separates the Lower Eldon of the central wedge (block) from the Field Member Upper Eldon and Basal Cathedral/Burgess exposed on the surface of the eastern fault block. (...Continued
Investigation of the upper TBS slope reveals that the entire Fossil Gully Fault Zone is present on the TBS, not just one merged Fossil Gully Fault. The defining western fault of the Fossil Gully Fault Zone (WFGF) crosses the TBS above the patch reefs as previously documented by Fletcher and Collins (2003 and 2009) and shown in Figure 19. But the Eastern Fossil Gully Fault (EFGF) is also present crossing the top third of the TBS, approximately 100 metres upslope of the WFGF on the northern edge of the TBS and approximately 50 metres upslope of the WFGF on the southern edge of the TBS (Figure 22). Hence the FGFZ is continuous from at least Mount Field to the southern edge of the TBS on Mount Stephen.
Like in other places along the FGFZ, strata adjacent to the bounding faults has been dragged into both faults (Collins and Fletcher, 2003, p. 1830). On the TBS, some of this strata is Ogygopsis shale (in the WFGF), and some Field Member shale (in the EFGF) which comprises the oddly orientated, steeper dipping black strata evident in Figure 20.
The shales found within the faults were slightly deformed (stretched) during the faulting process and, if fossiliferous Ogygopsis shale, contain elongated trilobite fossils. Densified post deformation by groundwater movement through the fractured fault strata over time, this strata is the source of the dense black shale fragments found throughout the UTBs
(Figure 21). The densification is caused by an increase of magnesium oxide within the rock. Typical Ogygopsis shales have an MgO content of 1.5 to 2%. The densified shales have an MgO content ranging from 25 to 31% (Powell et al 2006, p. 438, Table 2).
Aside from the obvious E-W vertical displacement and rotation visible on Mount Field in Figure 18, the fault blocks of the FGFZ also exhibit a N-S axial rotational component. The throw across the FGFZ, estimated at approximately 300 meters on the south face of Mount Field, is estimated to only be in the tens of metres on the TBS. Here, the zone acts more as a hinge line than an offsetting normal fault zone. The strata on the west, downdip side of the FGFZ (the west block) - Basal Cathedral Limestones and Ogygopsis Shale - is essentially the same as the strata on the east, upslope side of the FGFZ (the east block). The central wedge between the two defining faults has rotated into the highest position of the three blocks. The Basal Cathedral and Ogygopsis thrust strata that is exposed on the top of the east and west blocks has been completely eroded off of the central wedge, exposing younger lower Eldon at the surface as Deiss had interpreted in 1940 (Deiss, 1940 p. 779l). Viewed another way, the eastern and western blocks have been down thrown relative to the central block (Figure 22). Ogygopsis shales and Field Member shales/ carbonates were, in places, dragged into the bounding faults in the process.
Given that the erosional unconformity moves upsection to the east, the Ogygpsis/ Burgess Shale beds exposed at the top of the TBS are potentially tens of metres stratigraphically higher, and hence younger, than the fossiliferous Ogygopsis beds found within the UTBs and LTBs. These upper TBS beds comprise green/yellow bedded slatey shales void of fossils.
The visually thinning Field Member (from north to south) across the TBS in Figure 19 is a combination of the interbedded Field Member shale/carbonate sequence found below the thrust in the lower portion of Figure 16 (previous article segment) and the EFGF. The bulk of the Field Member still exists below the thrusted Basal Cathedral remnants on the eastern fault block, but has been completely eroded off of the central faut block (wedge). As previously stated, there is no Cathedral Escarpment or proximal Escarpment carbonate evident anywhere on the surface of the TBS - within the thrust strata or within the underlying Eldon. If present within the unthrusted strata on the TBS, the Cathedral Escarpment would be positioned hundreds of metres below the exposed Eldon on the central fault block (assuming significantly less than a hundred metres of vertical offset within the central fault block).
CONCLUSIONS
Analysis of the Field Slide mass and failure surfaces has provided new insight into the depositional, structural and geomorphological history of the Mount Stephen area.
Foremost, numerous investigators have commented on the sparsity of the Ogygopsis fauna/ fossils in the LTBs vs the abundance of the same in the UTBs. Recognizing that the LTBs are the same rock as the UTBs, and that the LTBs were deposited 450metres basinward of the original depositional position of the UTB’s (which is 150 metres basinward of any Basal Cathedral patch reefs or bioherms evident on the TBS), allows the development of a plausible explanation for the discrepancy in fossil abundance in the LTBs relative to the UTBs. The mass of the Ogygopsis fauna lived on and amongst the dead Basal Cathedral patch reefs - the location of the UTB deposition. The LTB strata was deposited significantly basinward of this setting, hence the relative sparsity of fauna in the LTBs.
Second, the initial deposition of the Ogygopsis Shale beds took place after a basin flooding event(s) that covered the Basal Cathedral unconformity/exposure surface(s) in moderately deep water, as no
36 RESERVOIR ISSUE 02 • FEBRUARY 2014
from page 35)
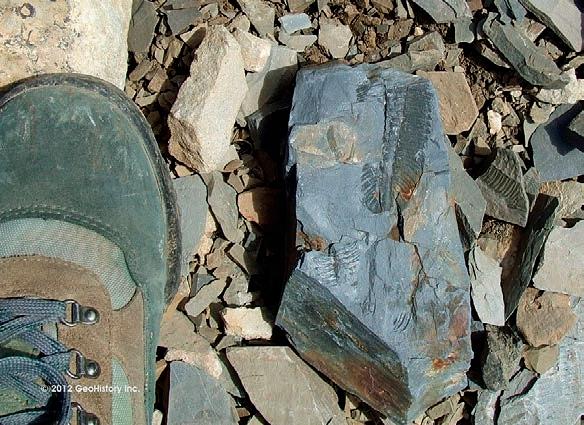
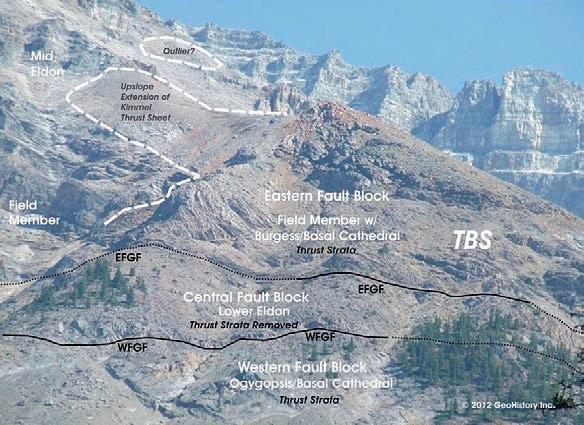
reef regeneration occurred on the exposed TBS patch reefs during Ogygopsis time. The Ogygopsis muds initially infilled the lows between the topographic highs created by the exposed, dead Basal Cathedral patch reefs. The water depth was likely close to storm wave base as the existing (dead patch reef) highs are not draped in Ogygopsis Shale. Rather, the muds infilled the existing lows - possibly just below the reach of turbulent water. The highs (absent of draping muds) would have been subject to
turbulent water. Regardless, the waters in which the fauna lived, near or at storm wave base should have been well oxygenated.
Third, initial analysis indicates that the Ogygopsis/Basal Cathedral erosional unconformity moves upsection to the east, preserving more Basal Cathedral strata in this direction. Given this hypothesis, the Ogygopsis/Burgess Shale beds exposed at the top of the TBS, comprised of green/ yellow bedded slatey shales void of fossils,
would be younger strata, occurring tens of metres stratigraphically higher than the top of the Ogygopsis beds found within the UTBs and LTBs.
Fourth, the absence of gygopsisor equivalent shale within the Yoho Valley Burgess exposures and on Fossil Ridge (the Walcott Quarry) has perplexed researchers for over a century.
Fifth, no Cathedral Escarpment or related strata exist anywhere on the TBS or adjacent slopes.
Sixth, the patch reefs located on the TBS are part of the initial, lowermost Cathedral/ Stephen Formation(s) carbonate/shale depositional package. Initial observations indicate the exposed Cathedral Escarpment within the Kicking Horse Valley comprises the reefal stages of several depositional packages. Seventh, the exposure surface between the underlying Basal Cathedral Formation and the overlying Ogygopsis Shale Formation is a major unconformity that represents the stratigraphic break separating the two formations, as well as the break separating the Basal Cathedral from younger Cathedral strata. Mapping of this and other unconformities is essential to understanding the Mid Cambrian geology of the study area.
Eighth, the existence and nature of the Fossil Gully Fault Zone/Fossil Gully faulting indicates extensional tectonism post thrusting.
Ninth, previous investigators did not account for the existence of any laterally displaced (thrusted) strata or any duplication of strata (repeated thrust sections) on the TBS or adjacent slopes. Discovery/recognition of the Kimmel Thrust Complex, Fossil Gully Fault Zone, patch reefs and exposure surfaces necessitates upgrading the existing published Mid Cambrian depositional models, stratigraphic relationships and overall structural history of the study area.
Finally, the findings of this article provide a solid basis for the creation of a cohesive geological history – from the deposition of the mid Cambrian formations, through the deformation caused by the mountain and post mountain building events to the signature of the most recent glacial and post glacial geomorphological events. The successful integration of multiple geological and geotechnical disciplines was key to solving the complex, 127 year old Mount Stephen Trilobite Beds puzzle – a puzzle that took over half a billion years to create.
(Continued
RESERVOIR ISSUE 02 • FEBRUARY 2014 37
Figure 21. An elongated trilobite fossil found within an altered piece of MgO rich, dense black Ogygopsis Shale on the southern edge of the UTBs. Sourced from the Western Fossil Gully Fault upslope, these fragments (frequently fossiliferous) are found throughout the mid TBS. Pieces of more typical undeformed fossiliferous Ogygopsis from the UTBs are visible at the right centre and at the lower right corner of the photo.
Figure 22. The Fossil Gully Fault Zone (FGFZ) on the TBS showing the central fault block with Ogygopsis/Burgess/ Basal Cathedral thrust strata removed, revealing the underlying Lower Eldon.
38 ...)
on page
CORPORATE SUPPORTERS
Apache Canada Ltd.
Apoterra Seismic Processing Ltd.
BDO Canada LLP
Birchcliff Energy Ltd.
BJV Exploration Partnership
Cabra Consulting Ltd.
Cabra Enterprises Ltd.
Casey & Associates
Canada Brokerlink Inc.
CL Consultants
Compass Directional Services
Continental Laboratories (1985) Ltd.
Core Laboratories
Core Laboratories Canada
Cougar Consultants, Inc.
Datalog Technology Inc.
EDGE Technologies
Energy Navigator
EV Cam Canada Inc.
Explor
Fekete
Geotir
GLJ Petroleum Consultants Ltd.
GranTierra Energy Inc.
Little Rock Document Services
Matrix Geoservices Ltd.
Matrix Solutions Inc.
McDaniel & Associates Consultants Ltd.
Mcleay Geological Consultants Ltd.
National Oilwell Varco
Nickpoint Environmental Services
Paradigm Geophysical (Canada) Corp.
Pason Systems Corp.
Pulse Seismic Inc.
Regent Resources
RIGSAT Communications
RPS Energy Canada Ltd.
SAExploration
Shea Nerland Calnan LLP
Sigma Explorations
Statcom Ltd.
Sproule Associates Limited
Sourcex
Total Gas Detection Ltd.
Tucker Energy Services Canada
Tucker Wireline Services Canada Inc.
AS OF JANUARY 10, 2014
CSPG welcomes our 2013 Corporate Supporters!
The benefits of being a corporate member include:
• Recognition in the monthly Reservoir and quarterly Bulletin
• One associate membership
• Reserved tables at the technical luncheons with your company logo
• One free pass to the CSPG Core Conference
…and more! Contact Kasandra Klein at kasandra.klein@cspg.org to be a corporate member today!
(...Continued from page 37)
ACKNOWLEDGEMENTS
Foremost, I would like to thank Parks Canada for granting the author, a private individual, a research permit during the summer of 2012. The permit made the Field Slide Study a reality. Funding for this project was provided by GeoHistory Inc. (www.geohistory.ca)
A special thank you goes to several Parks Canada staff, who made time for this research project, making it possible for us to carry out our field work in the closed and restricted areas. Thanks especially to Todd Keith, who was instrumental in helping me through the permit (and other) processes and who spent some critical days on the mountain with me. Thanks to Dan Teleki who helped with more research days on the mountain and with other logistical considerations. And finally, thanks to Adele Laramee who stayed with us for an “extended” day. With their help we were able to spend approximately 20 hours of research time within the restricted and closed areas - time that allowed the formulation of the findings within this paper, findings that go far beyond the original scope of the Field Slide Study.
THANKS ALSO TO:
Rajeev Nair and the University of Calgary for the use of their field instrumentation.
My volunteers - Min Seo and Katie Liebault for helping with the initial field work and Maurice Quinn for his ongoing field work assistance.
Haley Kimmel for her initial compilation of published literature, help with the initial field work and for her constructive editing suggestions.
Landon Kimmel for his ongoing help with the field work (especially his unparalleled packhorse and blister first aid skills) and for his help researching the published literature.
REFERENCES
Aitken, J.D. and McIllreath, I.A. 1984. The Cathedral Reef Escarpment, A Cambrian great wall with humble origins. GEOS 13-1: 17 -19.
Collom, C. 2000. On the outcrop. Marrella - newsletter of the Yoho Burgess Shale Foundation, 13: 12-15.
Deiss, C. 1940. Lower and middle Cambrian stratigraphy of southwestrn Alberta and southeastern British Columbia. Bulletin of the Geological Society of America. 51: 731- 794.
Fletcher, T.P. and Collins, D.H. 1998. The MidCambrian Burgess Shale and its relationship to the Stephen Formation in the southern Canadian Rocky Mountains. Canadian Journal of Earth Sciences 35 (4), 413-437.
Fletcher, T.P. and Collins, D.H. 2003. The Burgess
shale and associated Cambrian formations west of the Fossil Gully Fault Zone on Mount Stephen, British Columbia. Canadian Journal of Earth Sciences 40, 1823 - 1838.
Fletcher, T.P. and Collins, D.H. 2009. Geology and Stratigraphy of the Burgess Shale Formation on Mount Stephen and Fossil Ridge. A Burgess Shale Primer –International Conference on the Cambrian Explosion Banff August 2009 Field Trip Companion Volume. 32 - 53.
Fritz, W.H. 1971. Geological setting of the Burgess Shale. In Proceedings of the North American Paleontological Convention, Chicago, Ill., September 1969. 1155 - 1170.
Hunter, IG, Bloy, GR and Leggett, SR, 1988. The Lower Fairholm Reef Complex (Cairn Formation), White Man Gap area, Canmore, Alberta: CSPG Memoir 13 399-403.
Kimmel, V. A. 2011. The Mount Stephen Landslide. Technical letter to the BSGF and Parks Canada.
Kimmel, V. A. 2012a The Field Landslide, Yoho National Park, British Columbia - unpublished.
Kimmel, V. A. 2012b Stratigraphy and Depositional Setting of the Middle Cambrian Strata in Yoho National Park near Field, British Columbia. - unpublished.
Kimmel, V. A. 2012c Structural History of the Middle Cambrian Strata in Yoho National Park near Field, British Columbia. - unpublished.
McIlreath, I.A. 1977. Accumulation of a Middle Cambrian, deep-water limestone debris apron adjacent to a vertical, submarine carbonate escarpment, southern Rocky Mountains, Canada. Society of Economic Paleontologist and Mineralogists Special Publication No. 25 November, 1977. 113-124.
Ney, C. S. 1954. Monarch and Kicking Horse Mines, Field, British Columbia. Alberta Society of Petroleum Geologists 4th Annual Field Conference Guidebook, 119 - 136.
North, F.K. and Henderson, G.G.L. 1954. Summary of the geology of the southern Rocky Mountains of Canada. Alberta Society of Petroleum Geologists 4th Annual Field Conference Guidebook, 15 - 81.
Powell, W.G., Johnston, P.A., Collom, C.J. and Johnston, K.J., 2006. Middle Cambrian Brine Seeps on the Kicking Horse Rim and their Relationship to Talc and Magnesite Mineralization, and Associated Dolomitization, British Columbia, Canada. Economic Geology, 101, 431-435.
Rasetti, F. 1951. Middle Cambrian stratigraphy and faunas of the Canadian Rocky Mountains. Smithsonian Miscellaneous Collections. 116 (5)
38 RESERVOIR ISSUE 02 • FEBRUARY 2014
Scope of Practice
Every member of APEGA has a self-defined Scope of Practice, as specified by Part 1, Section 5(1) of the Engineering and Geoscience Professions Act. Every member is obliged to understand and internalize those parts of the legislation, given that it defines them professionally.
The Practice of Geoscience is defined in Section 1 of the Act. A Professional Geoscientist is expected to choose an area of specialty within the broad group of tasks contained in Section 5(1) that fits that person’s academic training and professional experience. If a practitioner strays outside that competence envelope, the outcome may be dire for public health and safety.
Competence is not a static entity. As a professional grows in knowledge and experience, one’s scope of practice envelope grows with it. Professional Development (PD) is an integral part of growth in competence and re-definition of an individual’s personal scope of practice.
APEGA’s Continuing PD program underscores the essential nature of knowing how the boundaries of competence change over time. Progressive geoscientists continuously learn and adopt new ways of doing things and their confidence and competence grow.
What are the boundaries of your scope of practice, now and five years from now? Are you ready to grow?
For more information: Tom Sneddon, P.Geol., FGC Director Geoscience and Outreach
P: 403-262-7714 or 888-262-3688
E: tsneddon@apega.ca

Professionals in Geoscience www.apega.ca
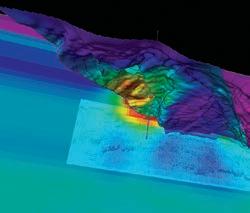
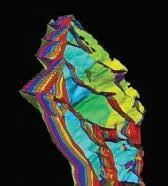
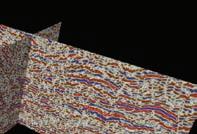
Blueback Reservoir the preferred and chosen GeoScience Solutions Partner Try something new. Find something better. Blueback Rock Physics plug-in for Petrel* Bridging the gap between geology and geophysics The complete suite of rock physics tools for quantitative interpretation across multiple domains within Petrel. Blueback Reservoir blueback-reservoir.com E sales@blueback-reservoir.com | T +1 403 538 4821 blueback-reservoir.com/rockphysics *Mark of Schlumberger 4000 5000 6000 8000 9000 10000 11000 12000 7000 13000 14000 15000 16000 Acoustic impedance (kP a.s/m) 17000 1.4 1.5 1.7 1.6 P/S velocity ratio 1.8 1.9 2.0 2.1 2.2 2.3 2.4 2.5 2.6 2.7 2.8 Por=0.4 Por=0.35 Por=0.3 Por=0.25 Por=0.2 Por=0.15 Por=0.1 Vol shl=0.6 Vol shl=0.4 Vol shl=0.2 Reservoir Properties
Petrel
Wells
