


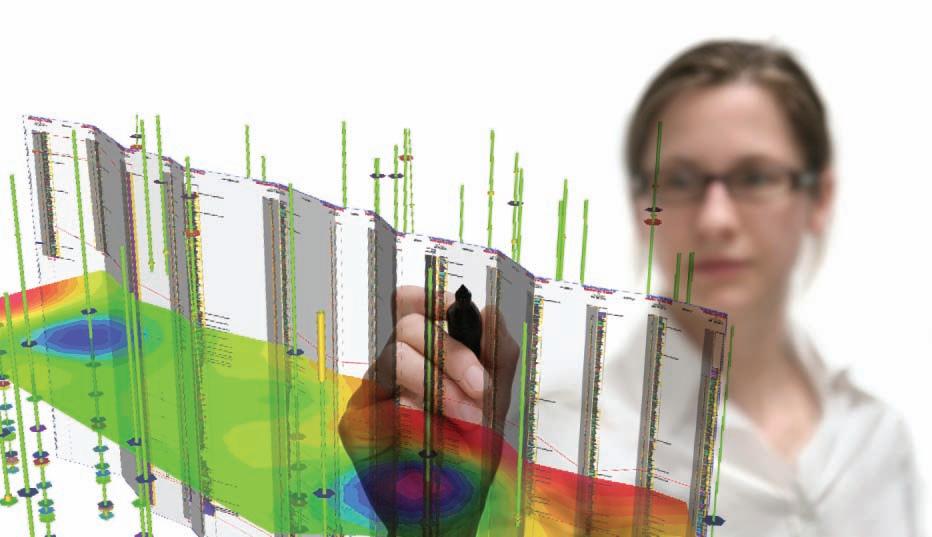
Looking to maximize opportunities in today’s volatile market?
Combine the power of PETRA® and IHS Critical Information including well and log data to define reservoir parameters and determine new opportunities faster and more cost effectively.
Let IHS information solutions improve your decision-making and reduce your risk.
For more information on PETRA visit us at www.ihs.com/reservoirsolutions


CSPG OFFICE
#600, 640 - 8th Avenue SW
Calgary, Alberta, Canada T2P 1G7
Tel: 403-264-5610 Fax: 403-264-5898
Web: www.cspg.org
Office hours: Monday to Friday, 8:30am to 4:00pm
Executive Director: Lis Bjeld
Email: lis.bjeld@cspg.org
Advertising & Sponsorship Coordinator: Alyssa Middleton
Email: alyssa.middleton@cspg.org
Communications Coordinator: Heather Tyminski
Email: heather.tyminski@cspg.org
Member Services Coordinator: Kasandra Klein
Email: kasandra.klein@cspg.org
Registration Coordinator: Dayna Rhoads
Email: dayna.rhoads@cspg.org
Convention Contacts
Convention Manager: Shauna Carson
Email: scarson@geoconvention.org
Convention Coordinator: Tanya Santry
Email: tsantry@geoconvention.org
EDITORS/AUTHORS
Please submit RESERVOIR articles to the CSPG office. Submission deadline is the 23rd day of the month, two months prior to issue date. (e.g., January 23 for the March issue).
To publish an article, the CSPG requires digital copies of the document. Text should be in Microsoft Word format and illustrations should be in TIFF format at 300 dpi., at final size. For additional information on manuscript preparation, refer to the Guidelines for Authors published in the CSPG Bulletin or contact the editor.
Technical Editors
Ben McKenzie Colin Yeo (Assistant Tech. Editor) Tarheel Exploration EnCana Corporation
Tel: 403-277-4496 Tel: 403-645-7724
Email: bjmck@telusplanet.net Email: colin.yeo@encana.com
Coordinating Editor
Heather Tyminski, Comunications Coordinator, CSPG Tel: 403-513-1227, Email: heather.tyminski@cspg.org
ADVERTISING
Advertising inquiries should be directed to Alyssa Middleton, Tel: 403-513-1233, email: alyssa.middleton@cspg.org. The deadline to reserve advertising space is the 23rd day of the month, two months prior to issue date.

A FEW THINGS A GEOSCIENCE PROFESSIONAL SHOULD KNOW WHEN EXPLORING A CAREER WITH SAUDI


1. The Red Sea and Rub’ al Khali have huge potential for new discoveries.
2. We embrace bold new concepts to tackle tough technical challenges.
3. Energy is our #1 export ... Adventure stories a close second.
In other words, a career with Saudi Aramco is more than just a job. It’s exploring vast new frontiers for oil and gas resources, working with ground-breaking technologies, and teaming with top-notch professionals dedicated to a secure energy future. It’s also the opportunity for you and your family to experience international travel adventures, develop friendships that last a lifetime, and enjoy a highly competitive compensation and benefits program.
Enrich your life. Visit www.Aramco.Jobs/CSPG. Visit us at GeoCanada 2010, Booth #807


President John Varsek • Cenovus Energy john.varsek@cenovus.com Tel: (403) 645-5417
Vice President
Kirk Osadetz • Geological Survey of Canada, Calgary kosadetz@nrcan.gc.ca Tel: (403) 292-7022
Past President
Graeme Bloy • Canada Capital Energy Corporation gbloy@capitalenergy.ca Tel: (403) 975-5784
Finance director
Greg Lynch • Shell Canada Ltd. greg.lynch@shell.com Tel: (403) 691-3111
assistant Finance director
Darren Aldridge • Baker Hughes darren.aldridge@bakerhughes.com Tel: (403) 537-3505
Program director
Scott Leroux • EnCana Corporation scott.leroux@encana.com Tel: (403) 645-2000
assistant Program director
Brett Norris • TransGlobe Energy Corp. brettn@trans-globe.com Tel: (403) 264-9896
serVice director
Ayaz Gulamhussein • NuVista Energy Ltd. ayaz.gulamhussein@nuvistaenergy.com Tel: (403) 538-8510
assistant serVice director
Richard Thom • Core Laboratories Canada Ltd. richard.thom@corelab.com Tel: (403) 250-4052
outreach director
Mike DesRoches • Talisman Energy Inc. mdesroches@talisman-energy.com Tel: (403) 513-6843
assistant outreach director
Steve Dryer • Consultant whiskeyjackresources@telus.net Tel: (403) 969-2292
communications director
Stephen Hubbard • University of Calgary steve.hubbard@ucalgary.ca Tel: (403) 220-6236
assistant communications director
Jim Barclay • ConocoPhillips
Jim.E.Barclay@conocophillips.com Tel: (403) 532-3889
executiVe director
Lis Bjeld • CSPG lis.bjeld@cspg.org Tel: (403) 513-1228
A message from the CSPG Service Director, Ayaz Gulamhussein
Ko taku rourou Ko tau rou Ka or ate tangata With my resources, And your resources, Everyone will benefit.
-Traditional Maori Proverb
In the petroleum industry, the term “resource” is often used. It is used to quantify the amount of hydrocarbon we believe is in place for a given play, accredit research information showcased in journals and magazines, and to refer to individuals who posses creative ideas and a strong work ethic.
In the workplace, human resources are absolutely crucial to the success of a company. A competent and dedicated group of individuals can help an organization realize the goals and objectives that it sets for itself. In a strong organization, an individual’s personal growth tends to occur concurrently with the company’s. The development of technical, interpersonal, and leadership skills, engages employees and extracts their maximum potential.
A not-for-profit technical organization like the Canadian Society of Petroleum Geologists is no different; human resources are central to the success of the Society. Engagement of volunteers and the extraction of their t alents are two of the most important premises on which our Society is built upon. Without committed volunteers, the Society would not be able to offer the numerous programs and activities that are now seen as commonplace.
T he CSPG offers an expansive and diverse set of programs. The skill sets required from the volunteers that run these activities are equally multifarious. Having such an incredible array of programs has been crucial to the Society providing its members with opportunities that interest them, and contribute to their per sonal development. No matter where a volunteer’s interests lie, a CSPG member can find a cluster of his or her kinship somewhere within the organization.
Interested in sedimentology or structural geology? Technical Divisions is the place for you. Like being a social butterfly? Organizing the Mixed Golf tournament, the 10K Road Race, or the Squash Tournament is right up your alley. Want to provide inspiration to future geoscientists? University Outreach and K-12 Education needs you! Enjoy writing and editing? The Communications group has an opportunity with your name on it.
C reative people tend to cluster together. This makes life more fun. It also fosters technological progress. When clever people cluster, they can bounce ideas off one another. The sharing of ideas often leads to innovation, which in turn leads to efficiency. These efficiencies often act as catalysts for further innovation. As a technical society, technological advancement, innovation, and efficiency are central to our mandate.
The CSPG continues to attract top volunteer talent, whether it is for technical luncheons, technical divisions, or other committees. The clustering of highly energetic and intelligent individuals is critical to the continued evolution of the science of petroleum geology. Technology and innovation are changing the way we look at mature, under-explored, and unexplored basins. Creative and inquisitive minds will be the prerequisite to the CSPG staying at the leading edge of hydrocarbon exploration.
Currently, the CSPG has approximately 300 volunteers that serve on 60 committees. These volunteers drive all the technical aspects of the Society, while the office staff provides strong administrative and structural support.
(Continued
on page

At APEGGA we know and understand that we live and practice in a complex world. The heavy lifting in the resource extraction industries, and in the environmental industry, is done by teams, often led by Professional Geoscientists. These teams include professionals, technologists and support staff both at headquarters in the city and at camp in the field.
There’s no question in our minds that geoscience projects require teams to manage questions surrounding the many varied issues including governance, tax impact, reporting and environmental concerns including land-use and ground disturbance. Through consultation and communication, all these issues, and a multitude of others, are resolved to ensure the projects we work on benefit society. The Geoscience Professionals’ code of ethics and paramount responsibility to protect public safety and well-being must be recognized and acted upon.
P.Geol.s, P.Geoph.s and Professional Licensees (Geological and Geophysical) are team players. No doubt. Our work helps keep Alberta safe and strong and the only way we can achieve that goal is through teamwork amongst professionals.
Teamwork Pays. Visit www.apegga.org for more information or call Tom Sneddon, P.Geol., Geoscience Affairs Manager at 403-262-7714 or 1-800-661-7020.
This ad is the sixth in a series
ApAche cAnAdA Ltd.
BAker AtLAs
cAnAdiAn nAturAL resources Limited
cAsey & AssociAtes
cenoVus enerGy inc.
conocophiLLips cAnAdA Limited
deVon cAnAdA corporAtion
FuGro AirBorne surVeys corp.
geoLoGic systems ltd.
husky enerGy inc.
ihs
imperiAL oiL resources
LArio oiL & GAs compAny
mJ systems
murphy oiL compAny
nexen inc.
petrocrAFt products Ltd
puLspetroL
proVident enerGy Ltd.
sheLL cAnAdA Limited
sprouLe AssociAtes Limited
suncor enerGy inc.
totAL e&p cAnAdA Limited
tourmALine oiL corp.
(...Continued from page 5)
the c sp G executive realizes that our so ciety needs to take a proactive role in recognizing voluntary contributions. Volunteers must also be appreciated and sincerely thanked on an ongoing basis. A concerted effort to incorporate the feedback and opinions of our volunteers is also underway.
Last year, the c sp G conducted a comprehensive survey, which solicited feedback from the membership. the information collected in regards to volunteerism within the so ciety, has been exceptionally helpful to the executive, who are building a go-forward plan for the organization.
Feedback from the c sp G s urve y conducted in 2009 indicated that over 47% of c sp G members have volunteered in the past. 48% of members indicated that they wanted clear and accurate time commitments provided to them regarding volunteer positions, while 36% wanted clear and definitive role descriptions. As to their reasons for volunteering, 43% of members wanted to improve their technical or leadership development, 36% of members wanted to expand their technical network, and 30% of volunteers wanted to expand their social network. 50% of members felt that the c sp G did a good job of informing the members of volunteer opportunities. th is last statistic is something that obviously needs to be improved upon.
In T ROduC TIO n TO ThE nE w VOl un T EER MAnAgE ME nT Sy STEM
B ecause volunteers are the so ciety, and are essential to its success, the 2010 se rvice co mmittee is designing and implementing a Volunteer ma nagement sy stem (V ms) t hat will replenish the volunteer base. the Volunteer ma nagement sy stem will be rewarding socially, technically, and professionally for all of our volunteers.
c sp G ’s V ms will act as a placement tool for individuals that want to participate within the so ciety. th is system will ensure that all members that are interested in volunteering, no matter where they may reside, will get an opportunity to participate in the growth of the c sp G. the V ms will also arrange for ap propriate volunteering training where it is deemed necessary.
cu rrently, the executive is building and populating a standardized organizational chart, assessing committee vacancies, implementing a database for tracking, and creating a process for succession planning.
While new ways of broadcasting volunteer opportunities are being evaluated, c sp G m embers can still check out the c sp G website for openings. new positions are posted regularly, along with detailed descriptions of what the roles entail. if you don’t find anything on the website that interests you, general submissions are also accepted. the c sp G office will contact you, as soon as a position that fits your fancy becomes available! if you are interested in volunteering, email c sp G at volunteer@cspg.org.
With so many options to choose from, and so many great people to meet, don’t you want to volunteer?
AS OF APRIL 12, 2010
Caitlin Roher
The highest reward for a person’s work is not what they get for it, but what they become because of it. –
Consulting & Exploration Management Over 20 years of expertise
Meaningful geophysical maps
Geology-driven seismic models
Client-tailored & confidential
For more information: Karen Brawley Rogers, P. Geoph. (403) 969-7793
karen@amuletexploration.com
www.amuletexploration.com
SPEA kER
Toni Simo
ExxonMobil, Upstream Research Company Houston, Texas, AAPG Distinguished Lecturer
11:30 am, thursday, may 27, 2010 teLus convention centre, calgary, alberta
Please note: the cut-off date for ticket sales is 1:00 pm, Friday, may 21, 2010. csPg member ticket Price: $38.00 + gst. non-member ticket Price: $45.00 + gst.
Each CSPG Technical Luncheon is 1 APEGGA PDH credit.
Did you know that you can book a table for the Technical Luncheon? To book your company’s table or to buy tickets, visit http://www.cspg.org/ events/events-luncheons.cfm.
Isolated carbonate platforms and mounds (ICPM) originate on topographic highs in shallow marine waters and are surrounded on all sides by deeper-water environments. Comparative studies of modern and ancient isolated platforms allow insights into mechanisms that control the platforms. Modern examples provide information especially relevant to Tertiary platforms because the carbonate-secreting organisms that built the platforms are very similar and occupied similar ecologic zones.
In the modern detailed information on the organisms and environments of deposition can provide insights into the dominant controls on facies type and dimensions today. However, there is a challenging lack of information regarding how the facies and size change through time. This challenge can be addressed through high-resolution seismic images, which provide sequential and spatial information and allow for comprehensive analysis on ICPM initiation, amalgamation, and demise. A unique combination of insights gathered from modern and ancient datasets on isolated carbonate platforms and mounds can be used to make predictions, create conceptual models, and guide geologic model inputs.
Webcasts sponsored by
Two- and three-dimensional seismic surveys from Southeast Asia show internal seismic geometries and positions of margins, providing clues on the evolution of the ICPM. Mounds initiate as small positive features that amalgamate to form platforms of different sizes and geometries prior to drowning. The distance between the mounds appears to be the first-order control on amalgamation and ultimate platform size. However, amalgamation may be inhibited if strong currents redistribute sediment transported off-bank and away from the mounds, leaving unfilled accommodation space.
Understanding the feedbacks between mound amalgamation and carbonate production will have implications for predicting control mechanisms and building conceptual models. High amalgamation rates imply large areas of shallow-water carbonate deposition and high carbonate production resulting in the formation of mega-platforms. Smaller areas of shallow-water deposition tend to drown faster when environmental conditions deteriorate and platforms cannot keep up with increased accommodation.


Satellite images over several modern platforms in Southeast Asia provide an opportunity to investigate the importance of oceanographic processes such as tides and currents as well as tectonic subsidence and chemistry on carbonate deposition and the impact on ICPM evolution. In the Tertiary, however, special consideration is needed for seasurface temperature and salinity residence times. These parameters are thought to be the major difference in biologic controls on the types of organisms building shallow-water platforms in the Tertiary versus today.
Modern and ancient datasets are used in parallel to evaluate what and how certain processes control initiation, growth, and demise of isolated carbonate platforms and mounds. This allows us to predict the controls for ancient ICPM, thus establishing a framework of rules for predictive conceptual models.
bIOGRAPH y
Toni Simo completed his B.Sc., M.Sc., and Ph.D. in Geology at the University of Barcelona. He is currently Research Associate for Upstream Research Company, ExxonMobil. Before that, he was a professor at University Polytechnic Barcelona and before that, a professor at the University of Wisconsin. Some of his previous publications include Controls on Carbonate Platform and Reef Development, Advances in Carbonate Sequence Stratigraphy, and Cretaceous Carbonate Platforms.

SPEAKER
Lynn N. Hughes
United State District Judge AAPG Distinguished Lecturer
11:30 am Tuesday, June 8, 2010
Calgary TELUS Convention Centre Calgary, Alberta
Please note:
The cut-off date for ticket sales is 1:00 pm, Thursday, June 3, 2010.
CSPG Member Ticket Price: $38.00 + GST.
Non-Member Ticket Price: $45.00 + GST.
Each CSPG Technical Luncheon is 1 APEGGA PDH credit. Tickets may be purchased online at https://www.cspg.org/eSeries/ source/Events/index.cfm.
Mixing principles and examples with economics and anthropology, a thoughtful and practical perspective on integrity is developed. Often in ethics – as in science – identifying the problem is harder than knowing the solution, making recognition the critical first step in ethical analysis.
Good things, like cooperation, can become negative when they are not
tethered to an external reality and the larger society. Also, because our ideology and psychology can blind us to the nature of our choices, we need balance, feed-back, and thought to resolve the ethical aspects of the ordinary and unfamiliar.
Since 1985, Lynn N. Hughes has been a judge with the United States District Court, Houston. Before that (19791985), he was a judge with the Texas C ivil District Court. Hughes was Adjunct Professor at South Texas College of Law (1973-2003) and at the University of Texas (1991, 2000). He is a member of the Judicial Advisory Board, Law and Economics Centre, George Mason University School of Law; Advisory Board, Houston Journal of International Law since 1980 (Chair, 1989-1999); American Anthropological Association; and Council on Foreign Relations. He received his B.A. from the University of Alabama, his J.D. from the University of Texas Law School, and his LL.M. from the University of Virginia School of Law.

Webcasts
Volunteers are needed in the following areas:
• Information Booth
• Registration Package Pick-Up
• Technical Sessions
• Core Conference
Students who volunteer for a minimum of 8 hours will have the registration fee refunded. If you are interested in any of these opportunities, please contact volunteers@geocanada2010.ca.

Creative Petroleum Exploration
Location: Calgary, AB, Canada, with the AAPG International Conference & Exhibition
Instructors: Edward Beaumont and Doug Strickland
Image Log Interpretation
Location: Calgary, AB, Canada, with the AAPG International Conference & Exhibition
Instructor: Laird Thompson
Writing for the Bulletin – A Primer in Scientific Writing for Refereed Geoscience Journals
Location: Calgary, AB, Canada, with the AAPG International Conference & Exhibition
Instructor: Gretchen Gillis
Field Seminars:
Choose from over 50 exciting field seminars, short courses and online programs all designed with the goal of helping you explore and better understand the science of this industry. Please see the AAPG website for complete descriptions and registration information. Below are the highlights of courses coming up very soon. Make your plans now before seats get filled! JUNE 21-25 SEPT 23-30
LAUNCH DATE JUN 1
MAY 11-13 MAY 16-21
MAY 17-18 MAY 19-21
Fractures and Tectonics of the Northern Appalachian Basin
Location: New York
Leader: Robert Jacobi
Sedimentology and Sequence Stratigraphic Response of Paralic Deposits to Changes in Accommodation: Predicting Reservoir Architecture, Book Cliffs, Utah
Location: Colorado/Utah
Leaders: Keith Shanley, Michael Boyles
Renewable & Non-Renewable Resources
- Overview & Integration: A Renewable Energy Certificate Course
Instructor: Theresa Coffman
Essentials of Subsurface Mappping – Short Course
Location: Houston, TX
Instructor: Richard Banks
Play Concepts and Controls on Porosity in Carbonate Reservoir Analogs – Field Seminar
Location: Almeria, Spain
Leaders: Evan K. Franseen, Robert H. Goldstein, Mateu Esteban
Reservoir Engineering for Petroleum Geologists – Short Course
Location: Houston, TX
Instructor: Richard Green
Fundamentals of Petroleum Geology – Short Course
Location: Houston, TX
Instructor: Stephen Bend
Folds, Faults and Hydrocarbons in the Southern Canadian Cordillera – Principles and Practices Combination Short Course/Field Trip
Instructors: Chuck Kluth and Wayne Narr SEPT 16-19 NOV 8-12 OCT 4-8
Location: Calgary, AB, Canada, with the AAPG International Conference & Exhibition
Instructor: Peter Jones
FALL EDUCATION CONFERENCE 2010 – Theme: Unconventional Resources
Location: Houston, Texas
Instructor: Multiple experts!
Application of Structural Geology in Prospecting in Thrusted and Extensional Terrain
Location: Las Vegas, NV
Modern Terrigenous Clastic Depositional Systems
Leader: John Warme OCT 2-9 OCT 10-13
Location: South Carolina
Leader: Walter Sexton
Applied Stratigraphy of Paleozoic Carbonate Platforms; Facies, Cycles, Sequences, Reefs, Reservoirs
Location: Nevada
Introduction to Geological Reservoir Characterization
Instructor: Roger Slatt SEPT 13DEC 17
MAY 30JUNE 5 JUNE 7-9 JUNE 7-11 JUNE 9-10
Complex Carbonates Reservoirs: The Role of Fracturing, Facies and Tectonics – Field Seminar
Location: Naples – Rome, Italy
Leaders: Raffaele Di Cuia, Davide Casabianca, Claudio Turrini
Exploring for Bypassed Pay in Old Wells – Short Course
Location: Wichita, KS
Leader: Hugh Reid
Folding, Thrusting and Syntectonic Sedimentation: Perspectives from Classic Localities of the Central Pyrenees – Field Seminar
Location: Barcelona, Spain
Leaders: Antonio Teixell, Antonio Barnolas
The Petroleum Industry: Upstream & Downstream – Short Course
Location: Dallas, TX
Instructor: Stephen Bend
For more information on any AAPG Education programs, call 918-560-2650 or toll-free 1-888-338-3387, or visit www.aapg.org/education.
SPEAKER
Philip S. Simony
Department of Geology and Geophysics, University of Calgary
SPEAKER
Sharon D. Carr
Department of Earth Sciences, Carleton University
12:00 noon, Thursday, May 6, 2010 Room LPW-910, Livingston Place West (250 2nd St SW), Calgary, Alberta
The approximately 400 km-wide thrust belt of the southeastern Canadian Cordillera largely comprises four major composite thrust sheets that evolved and were emplaced “in sequence” in the Cretaceous to Eocene during the westward underthrusting of the North Amercian craton. In the Rocky Mountain external zone, each sheet is thin skinned and was carried by a thrust system that has a common basal thrust. In the internal zone, there is a westward increase, toward the core, in thickness and importance of ductile shear within each sheet. In the core, each
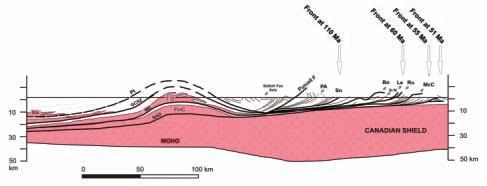
Figure 1. Flow zones – thrust system linkages: Schematic southwest – northeast cross-section showing linkages between the internal and external zones of the southeastern Canadian Cordillera, and the location of successive Cretaceous to Eocene orogenic fronts. Four composite Early Cretaceous to Eocene “in-sequence” thrust sheets comprise mid-crustal flow zones in the core linked to thrust fault systems in the foreland. (FmC = Frenchman Cap dome; PA = Porcupine Creek Anticlinorium; Ru = Rundle thrust; St M. = Saint Mary fault; TO = Thor-Odin dome; Malton (Ma) – Ptarmingan (Pt) – Snaring (Sn), Gwillim Creek Shear Zone (GCSZ) – Bourgeau-Lewis (Bo-Le), Monashee décollement (MOD) – McConnell (McC), Basal décollement (BAD) – Foothills thrusts).
sheet has an infrastructure of metamorphic and migmatitic rocks that includes interfolded cover and basement under a suprastructure of rocks that had been previously deformed and thrust into place. “Transport” (Couette) flow and ductile shear were important in the infrastructure of each sheet. That infrastructure had an eastern margin or “tip line” where the flow and shear, within each sheet, were transferred eastward into an external thrust system via transport on the basal thrust. This geometric – kinematic framework of great thrust sheets is based on the facts of stratigraphy, mapped geometry and geochronology, and can form the basis for dynamic modeling. Channel flow (Poiseuille) models, with or without extrusion, can be evaluated within this framework.
BiogR APhy
Philip Simony obtained his Ph.D. at the Imperial
College London in 1963. His career as a professor at the University of Calgary, spanning forty years, was dedicated to teaching geology and mapping in the southeast Canadian Cordillera.
Research themes include thrust tectonics; structure of metamorphic complexes; and geometry, emplacement, and deformation of plutons. Although retired since 2002, Philip continues to be active, and is presently working on the kinematic linkages between the internal core zone and external thrust belt of the Cordillera.
Sharon Carr obtained her Ph.D. at Carleton University in Ottawa in 1990. Since then she has worked as a professor at Carleton teaching and carrying out research in the southern Canadian Cordillera, Yukon, and Grenville Province. Research themes include tectonic evolution of core zones of orogenic belts, and applications of detailed U-Pb studies to tectonic problems.

ichnology: an example of Psilonichnus
Myo Myint
exposed at
SPEA kER
Myo Myint
Geological Consultant
7:30 Pm, Friday, may 14, 2010 mount royal university, room B108 calgary, alberta
The paleoichnological research for a doctoral thesis on the Paleogene Shiramizu Group, Joban Coal Field, Japan, reveals that an ichnospecies: Psilonichnus quietis is newly proposed and is characterized by an unlined vertical-to-inclined burrow ranging in diameter from 0.4 to 2.8 cm and ranging in depth from 10 cm to 2.5 m, with four different shapes of swelling (abrupt enlargement with different
forms at varying intervals and/or at a terminus from an unbranched master shaft). It exhibits three intergradational architectural patterns, herein termed Type I, Type II, and Type III. Type I burrows have forms of straight and curve patterns of vertical and inclined shaft. Type II have vertical inclined-to-oblique shafts with four different shapes of swelling at varying intervals and at the terminus. These swellings are located at obtuse angles from a master shaft and swelling series are aligned to the same direction. Type III have vertical, inclined oblique to sinuous shafts and ranges in diameter from 0.4 to 1 cm with uniform average in diameter of 0.6 cm approximately.


The Psilonichnus quietis burrows are comparable to the burrows of modern Ocypode or constructed by adult Ocypodid crabs, but Type III by juveniles. to ephemeral Type II burrows indicate semi-permanent dwelling structures. terminus of Type II to reflect 1) pauses 2) shelter for extended period of time, 3) space utilization, 4) the position of greatest stability against gravitationally induced collapse. This structure does not demonstrate forked points for any types of branching burrow or turnarounds. Therefore, Type II burrows indicate not only semi-permanent dwelling but additional behaviors as well. The breeding burrow, expressed as expanded and distinct chambers at the terminus, and non-breeding burrows characterized by the lack of such chambers, can be found at the same side. This is consistent with present-day structures, where both breeding and
Ocypodid
SPEAKER
Dr. Quentin Goodbody
Exploration VP of Papua New Guinea/ Australia Talisman Energy
12:00 Noon
Thursday, May 20, 2010
Encana Amphitheatre, 2nd Floor East end of the Calgary Tower Complex 1st Street and 9th Avenue S.E. Calgary, Alberta
In the search for material resource in a tightening market, Talisman reassessed Papua New Guinea (PNG) potential in late 2008 with an eye to monetizing our offshore Pandora gas field. Both the offshore and onshore basins were assessed for remaining exploration potential. Although the offshore exploration
potential was s een as limited, recent discoveries in the foreland at Douglas and Puk-Puk onshore suggested an effective gas kitchen in the Cecilia Trough, capable of generating volumes significant enough to charge the entire foreland. Exploration drilling density also suggested that the potential of the foreland had barely been tested. With industry focusing on the established, producing, and expanding oil and gas resource in the PNG fold/ thrust belt, the interior foreland had been, relatively speaking, overlooked and certainly underexplored.
The petroleum system in the P NG foreland is a typical Australian Mesozoic passive margin assemblage with Early Jurassic coals sourcing Late Jurassic and Early Cretaceous paralic and shallow marine quartzitic sandstone reservoirs sealed by a thick regional transgressive shale. Effective delineation of viable structures is the primary exploration risk with remoteness, sparse 2D seismic grids, and tropical wetland conditions and climate contributing to the operational and technical challenges of finding and developing this impressive resource.
Dr. Quentin Goodbody received his Bachelor of Ge ology from Trinity College in Dublin. He then, at the University of Alberta, completed a Masters in Micropalaeontology (Silurian Radiolaria), which was followed by a Ph.D. in Stratigraphy/Sedimentology/Palaeontology
from the University of Alberta investigating the Middle Devonian of the Canadian Arctic Islands. After a three-year post-doctorate position at the ISPG, Dr. Goodbody joined Shell Canada from 1987-1998, where he worked on the Mackenzie Delta, Canadian Rockies, and the east coast of Canada. Subsequent shorter stints with Rigel, Pacalta/ City and AEC/Encana working numerous South America assets led Dr. Goodbody to his current employment with Talisman Energy. At Talisman, Dr. Goodbody has worked throughout the international organization and has recently been assigned to the Exploration Vice President Papua New Guinea and Australia. The adventure continues.
T here is no charge. Please bring your lunch. The facilities for the talk are provided complimentary of EnCana and refreshments by Geochemtech Inc. For further information or if you would like to give a talk, please contact Bob Potter at (403) 863-9738 or ropotter@telusplanet.net or Trent Rehill at (403) 606-6717 or trehill@kulczykoil.ca. Or visit our new Face Book page (“CSPG International Division”).


| by Colin Yeo, P.Geol. and Lionel Derochie, P.Eng.
In this, our final installment of the series, we discuss how the economic attributes that have been generated for plays and prospects can be used to analyze and determine the appropriate mix of investment opportunities that will meet financial and strategic corporate goals. As previously mentioned, all companies expect to be profitable, to grow the NPV of their assets, and to provide stable financial performance over the longterm. In the past, there have been some companies that did not use a disciplined approach to portfolio management, which lead to investment decisions that were not aligned with corporate strategies and hence poorer results were achieved. A rigorous, standardized, disciplined, and open process in selecting plays and prospects for exploration and development has proven to be a better approach in achieving strategic goals. Because capital discipline is important in larger companies, many of them have adopted the portfolio management process.
The PRINCIPles Beh IND PROjeCT PORT fOl IO Ma N age M e NT (PPM)
Project portfolio management is concerned with the allocation of capital and manpower resources to a large range of investment opportunities. The economic indicators that have been addressed in previous articles are used to characterize these plays and project portfolio management is the process that aligns these opportunities to corporate strategies and objectives. This ensures that a project or group of projects will help the organization meet its goals such as increasing shareholder value by profitably increasing production rates and reserves.
To be effective, opportunities must be evaluated consistently across a company. Price files, production forecasts, royalties, capital costs, operating costs, and income tax rates must be reasonable and match historical trends. In this way, each project can be properly assessed as to its contribution towards achieving corporate objectives. The decision to invest in a project can be made on its relative costs and risks and its relative benefits to the organization. PPM enables continuous monitoring of those projects that are selected for execution and, as such, some projects may be discontinued if they are under-performing or no longer aligned with corporate objectives. On the other
hand, if some projects are performing above expectations, even more capital can be allocated to them.
Risk assessment is crucial to the concept of PPM. The chance of project failure needs to be accurately determined and, if the project is successful, the variability of cash flow needs to be understood. This expected cash flow is used in PPM decisions. It is this cash flow that funds corporate financial obligations including the capital required for future exploration and development. Risk assessment must go beyond the usual exploration risk components of source, migration, reservoir, trap, and seal to include drilling and completion risk as well as production rate and reserve risk. In addition, commercial risk such as price variations, royalty changes, capital and operating cost creep, marketing, and stakeholder relations must also be considered. Organizational capability, technical skill sets and ability to execute programs is an important consideration in the PPM assessment. All of these risk factors must be calibrated with historical trends to ensure appropriate risk assessments are made. These are important issues to consider when making investment decisions.
a l IgNINg T he OPPOR TUNIT y I N ve NTORy w IT h CORPOR aT e OBjeCTI ves
All companies have cash flow requirements needed to meet debt interest payments, G&A costs, and dividend payments to shareholders even before investments are made in capital projects. Corporate objectives are often varied: small start-ups focus on adding reserves and production at low cost, income trusts seek large cash-flow streams to distribute to unit-holders, and senior producers focus on achieving high rates of return on capital employed. The risk make-up of the project portfolios for these different types of companies will certainly vary depending on the strategy they elect to adopt. Usually, senior executives strive to achieve a balance between all financial and operational measures over the long term.
In order to ensure long term, reliable and steady cash flow, companies strive to diversify their production base to avoid concentration risk and also vary their product (gas, gas liquids, oil, heavy oil) mix to stabilize their revenue streams. These concerns around diversification will sometimes override economic ranking in
the selection of projects for the portfolio because some particular projects may be better aligned with corporate and business strategies despite having poorer economic indicators.
Hard choices always have to be made. Assuming that a company does not want to take on any additional debt and does not want to issue new shares, it probably will have a fixed capital budget tied to its internal cash flow. Quite often, companies will have more investment opportunities than capital resources and are faced with difficult capital allocation decisions. This is where PPM provides useful tools and processes for making these investment decisions.
A Simple exAm ple USi ng ppm
ConCe pt S to BUi ld C ApitAl
BUdget S
There are a number of factors that influence the various economic indicators used in portfolio management and it is important to understand how the indicators are affected by these factors. Figure 1 illustrates three simple cases whereby the assumptions for initial rate (Qi), ultimate reserves (EUR), and capital invested (Capex) are identical for each case. The only variation between the cases involves a changing decline exponent (n value). Case 1 is an exponential decline that has an n value of 0 whereas Case 2 is a hyperbolic decline with an n value of 0.5 and Case 3 is a super harmonic decline that has an n value of 1.25. The associated production profiles for each of these cases are shown in Figure 1.
As seen in the table within Figure 1, although the F&D costs are the same at $4.25/BOE, the NPV10% ranges from a high of 6.6 $MM
Figure 2. Three cases showing the effects of risk on economic indicators. Risk is any event, condition, or issue that could adversely affect cash flow. This figure is a summary of economic indices and, for this discussion, we only consider rate of return, net present value, profit to investment ratio – both undiscounted and at a 10% discount rate – pay out, F&D cost, and production efficiency. There are many other, more appropriate, ratios that can be used to identify those projects that are key contributors to a corporation’s goals and strategies.
for the exponential decline case to a low of 3.6 $MM for the super harmonic decline case. Similarly, there is quite a range in values for IRR (Internal Rate of Return), PIR (Profit to Investment Ratio), PE (Production Efficiency), and PO (Payout) depending on the production prof ile assumed. Production profiles significantly affect the economic indicators of a project and it is for this reason that some higher rate/reserve
opportunities are not necessarily the best economic prospects in a given portfolio.
Risk is another very important factor that has to be accounted for in portfolio management. Consider the three cases presented in Figure 2. For the purpose of this analysis, Case 4 is considered to be a low-risk, lowreward opportunity, Case 5 is a medium-risk,
(Continued on page 16...)
medium-reward opportunity, and Case 6 is a high-risk, high-reopportunity. The economic indicators presented in the top part of the table in Figure 2 assume 100% success. All three cases generate similar IRRs (~75%) and payouts (~18 months). Although the IRRs are the same, F&D as well as PIR10% are considerably different from one case to the other. The high case has an F&D of $5.00/ BOE and generates a PIR10% of 2.14 whereas the low case has an F&D of $9.00/BOE and generates a PIR10% of 1.27. On the face of it, without taking risk into account, most
companies would prefer to have a portfolio of projects made up of high-case opportunities.
The bottom portion of the table in Figure 2 provides the economic indicators after risk is applied. It was assumed that the low-risk case has a chance of success (COS) of 90%, the medium-risk case, 60% and the high-risk case, 40%. As can be seen, the IRR for the high-risk, high-reward case is considerably reduced after risk is accounted for and this would cause the portfolio manager to rethink which projects should be pursued and which ones should be delayed.

Improve your exploration odds with Divestco. At Divestco we want the odds to be in your favor so we have given you a whole deck of geological products and services to choose from. Divestco’s integrated offering for geological professionals gives you the ability to choose from a wide range of geological products and services to suit your unique needs. Pick as many individual cards as you want or let our experts deal you a winning hand. Call us at 403.237.9170 or email sales@divestco.com for more information.


There are many considerations a manager must give in building a portfolio. Let’s assume a company has 50 $MM to invest in drilling. If the company was to invest its entire budget on low-risk opportunities, it would drill 69 low-risk, low-reward wells (Case 4) and, with a risked NPV10 of 812 $M per well, the program would be expected to generate 56 $MM of NPV. If the same 50 $MM was invested in medium-risk, medium-reward opportunities (Case 5), 25 wells would be drilled with an expected NPV of 43 $MM. Similarly, if the entire budget was dedicated to high-risk, high-reward opportunities (Case 6), 14 wells would be drilled and, on a risk-adjusted basis, would be expected to generate 40 $MM of NPV. Therefore, if the company is focused on maximizing NPV and is risk averse, the portfolio manager would be inclined to invest the entire budget in lowrisk, low-reward wells.
Now let’s consider a hypothetical situation where the company’s investment criteria require it to generate a minimum PIR10% of 1 from its drilling program. This represents an NPV of 50 $MM for a 50 $MM capital budget. The manager could generate the required 50 $MM of NPV by spending 45 $MM to drill 62 low risk wells (Case 4). Now the manager has 5 $MM to spend on a higher-risk, higher-reward opportunity. Let’s suppose the manager elects to invest the 5 $MM to drill a high-risk, high-reward well (Case 6). If the high-risk well comes in as forecasted, an additional 10.7 $MM of NPV10 will be generated bringing the total return to 60.7 $MM, which is 4.7 $MM more than the 56 $MM that would have been generated had the entire budget been invested in low-risk, low-reward wells.
In this instance, the portfolio manager is not simply gambling on the higher-risk well, the manager is trying to diversify the company while still achieving the original PIR target. By drilling the higher-risk well, the manager is potentially opening up a new exploration area and providing new opportunities for growth. Follow-up wells to any discovery will generally have improved COSs, making subsequent outpost and development wells even more economic on a risk adjusted basis.
Aligning the Portfolio to the needs of the Cor PorAt ion

As we have shown, there is no one “right” portfolio for a company; it is a combination of projects that will achieve the financial, strategic, and operational goals of a company. Consideration must be given to the number of opportunities available within a certain play-type, their comprehensive risk attributes (not just technical risk), the capability of staff to execute the program on time and within
budget while getting the desired results and the ability of the company to provide the ongoing capital resources to get the job done. Small companies with limited budgets may not want to bet the farm on a one-off, deep, high-risk, technically complex prospect but rather may want to focus on building a low-risk, low-reward, diversified production base to generate stable cash flow upon which to grow, further diversify and increase corporate NPV in a slow and steady manner.
Project Portfolio Management is both the art and science of understanding what the corporation needs to be successful, however it chooses to define success. The Portfolio Manager must insist on standardization where appropriate and encourage thoroughness and thoughtfulness when dealing with unique features of an individual project. Risk is front and centre in all of these deliberations. Then, by assembling a portfolio of these projects, the Manager improves the company’s chances of meeting its goals and objectives. It should be remembered that there is a “lost opportunity cost” in not pursuing some projects. Hopefully, this is a deferral and not a complete loss. For those opportunities not pursued, the Portfolio Manager may elect to farmout or divest to monetize those plays and prospects that always rank low in the inventory.
In this series, we have attempted to present a simple but accurate explanation of petroleum economics for geoscientists. We hope we have shown that something that appears to be complicated at first glance is not really difficult to understand when it is broken down into its constituent parts.
We hope we have provided the concepts and jargon that will allow geoscientists to actively engage in discussions with reservoir engineers, reserve evaluators, financial analysts, portfolio managers, and management. A basic understanding of petroleum economics is a prerequisite for success in the oil industry. And remember, it’s all about cash flow!
Support for this series is provided by Energy Navigator who have reviewed articles, supplied technical consultation, and critiqued manuscripts. We thank them for their help.

You’ve got the power of Petrel.

A unified seismic-tosimulation solution for geothermal operations.


Geophysics. Geology. Reservoir Engineering.
Petrel* gives you an advantage no other application can offer—a powerful integrated workflow from seismic to simulation. This enables you to model complex geologic structures with pinchouts and truncated faults—and easily incorporate new data to update the model and rerun ECLIPSE* simulations at any time. That really makes the difference in understanding complex geothermal resources.
“With Petrel and its integrated workflow, we can exploit the complete reservoir potential and minimize the exploration risk in geothermal operations.”
Dr. Zoltan Timar-Geng, Geologist GEOenergie Bayern GmbH www.slb.com/petrel2009


WWW.CSPG.ORG
www.cspg.org/education/education-trips.cfm

CSPG Continuing Education Committee is proud to offer the Summer/Fall Field Trip Seminar Series. Offering local one- to three-day field trips running in and around Calgary.
Stratigraphy and Hydrocarbon Potential of the Bakken Formation in Western Montana
Instructor: Ted Doughty
Contrasting the Reservoirs of Braided vs. Meandering Depositional Systems
Instructor: Jon Noad
Upper Cretaceous Meander River Deposits Exposed in the Dinosaur Park Badlands
Instructor: Derald Smith and Peter Putnam
Structure and Hydrocarbon Occurrence, Rocky Mountain Foothills and Front Ranges
Instructor: Kirk Osadetz, Glen Stockmal, and David Kisilevsky
For additional information please see the website at: or contact: www.cspg.org/education/education-trips.cfm
Amanda Mitander at amitander@tridentexploration.ca
Tyrus Bender at tyrus.bender@EnCana.com
| by R. E. (Gene) Ballay, Ph.D.
The only certainty in most of our formation evaluations is the presence of uncertainty and how that issue is (or is not) addressed. At the simplest level one may estimate the Best and Worst Case, for each input attribute, and then bound the evaluation with the resulting extreme values, even as we recognize that the simultaneous occurrence of multiple “best” or “worst” values is an unlikely event.
It is in fact relatively simple to address the uncertainty question in a comprehensive, realistic and quantitative fashion, and to further identify where to focus time, and money, in search of an improved evaluation.
At the simplest level our S w estimates are compromised by uncertainty in the various Archie equation attributes.
S w n = a Rw / ( m Rt )
In another article (Risky Business) we took the derivative of Archie’s equation (the same approach will suffice for a shaly sand equation), and calculated the individual impact of each term’s uncertainty upon S w to identify where the biggest bang for the buck, in terms of a core analyses program or suite of potential logs, was to be found. At that time we noted the “link between parameters, in that the relative importance of a single attribute, can be dependent upon the magnitude of another attribute, so that the characterization must be done for locally specific conditions.”
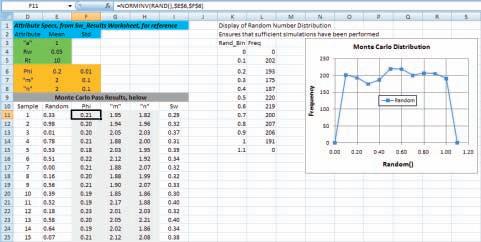
An alternative approach is Monte Carlo simulation, which can be implemented with routine Excel spreadsheet functions. The Monte Carlo method randomly assigns values, according to user specified probability distributions, to each of the input parameters and then calculates the result. When the simulation is repeated a statistically significant number of times (results herein are based upon 2,000 passes, which Excel handles without a problem), one is able to determine the likely outcome within any specific probability band, and to further identify which parameter is dominating the uncertainty (and hence where time and money is most efficiently directed for an improved result).
As an example, with the specifications tabulated in Figure 1, there is a 95%
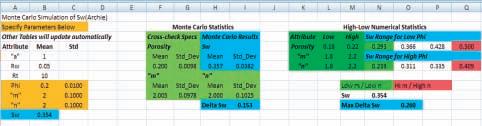
•Monte Carlo simulation of Sw (Archie) for above user-specified distributions
• w and Rt are assumed to be ‘well known’, but may be varied by a straightforward extension of the technique ‘a’, R
•With these specifications, there is a 95% probability that Sw is bounded by 0.357 +/–2(0.0382) 0.28 < Sw < 0.43
•The Best / Worst case would have 0.24 < Sw < 0.50, the difference being the unlikely chance of all Best (or Worst) events occurring simultaneously
probability (+/- two standard deviations) that 0.28 < S w < 0.43, whereas the Best / Worst approach would bound the results with 0.24 < S w < 0.50; the difference being the unlikely event of multiple, simultaneous Best or Worst events. Not only does Monte Carlo give us a more realistic summary, but by varying the input standard deviations (uncertainties), one is able to identify where to most efficiently concentrate time / money in an effort to improve results.
The Monte Carlo method relies on repeated random sampling of user specified input probability distributions to model expected results. This approach is attractive when it is infeasible or impossible to compute an exact
2
Simulations
result with a deterministic algorithm.
An advantage of Monte Carlo is that any type of distribution can be used to characterize the uncertainty specification of input parameters, for example normal, log normal, etc; an issue since the phenomena governing frequency distributions in nature often favor log-normal (Limpert et al., 2001).
As illustrated in Figure 1, Monte Carlo also allows one to quantify the upside and down side better than a Best / Worst approach, and to recognize which distribution (parameter) is dominating the result uncertainty.
•Petroleum applications typically use log normal , and triangular statistical distributions.
•Probably the best known statistical distribution is the bell shaped normal distribution, whose probability density function is described by:
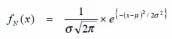
•Two parameters characterize the distribution
•the mean value µ,
•the variance represented by σ2
•The square root of the variance is the standard deviation
A limitation of Monte Carlo is that special software is typically utilized (commercial add-ons to Excel, etc.), and is often not even an option in commercially available petrophysics software packages. Common oilfield distributions, however, such as Normal, Log Normal, and Triangle are available in Excel and it is straightforward to implement Monte Carlo within the Excel framework. In this approach, one remains in the familiar Excel environment, and actually leverages their Excel skill set via the additional hands-on experience within the platform.
(Continued on page
A discussion of the Monte Carlo method can be found in Decision Analysis for Petroleum Exploration by Paul Newendorp and John Schuyler, and a collection of articles addressing exploration risk can be found in The Business of Petroleum Exploration published by the AAPG, Tulsa, Oklahoma. Additional information may be found in the References, with useful on-line reference material to be found at the following links:
• http://www.enrg.lsu.edu/pttc/
• http://www.mrexcel.com/
• http://people.stfx.ca/bliengme/exceltips. htm
• http://office.microsoft.com/en-us/excel/ HA011118931033.aspx
• http://www.statsoft.com/textbook/ stathome.html
• http://en.wikipedia.org/wiki/Monte_ carlo_simulation
• http://www.ipp.mpg.de/de/for/bereiche/ stellarator/Comp_sci/CompScience/ csep/csep1.phy.ornl.gov/mc/mc.html
• http://www.sitmo.com/eqcat/15
• http://www.riskglossary.com/link/monte_ carlo_method.htm
• http://www.chem.unl.edu/zeng/joy/mclab/ mcintro.html
THE G AUSSIAN OR NORMAL DISTRI bU TION
For illustration purposes, we focus here on the bell-shaped Gaussian distribution. Log Normal or Triangular distributions are easily handled with a simple change of Excel functions.
Gauss was a child prodigy and perhaps the greatest mathematician since antiquity (http://en.wikipedia.org/wiki/Carl_ Friedrich_Gauss). When the dwarf planet Ceres was discovered, and observed for only a few days before vanishing, Gauss was able to mathematically predict where it would be found a year later, and missed the mark by only half a degree.
The bell-shaped, or normal, probability distribution, is the most widely used family of statistical distributions and came to be referred to as Gaussian because he analyzed astronomical data within that context.
Two parameters characterize the Gaussian distribution: the ‘mean’ and ‘variance’ (Figure 2, page 19).
Excel’s NormDist function [NORMDIST(x, mean, standard_dev, cumulative)] calculates both the probability density, and cumulative probability, for a specified ‘x’ value with given mean and standard deviation (standard deviation being the square root of the variance) (Figure 3).
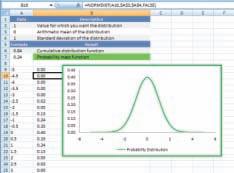
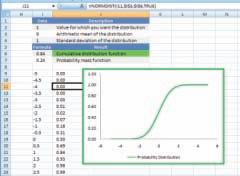
•Syntax: NORMDIST(x, mean, standard_dev, cumulative)
•There are two variations of NORMDIST, according to the value assigned cumulative
•Cumulativeis a logical parameter that determines the form of the function
•If True, it returns the cumulative distribution function.
•If FALSE, it returns the probability mass function.
Figure 4
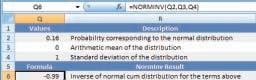
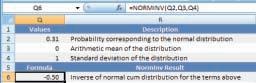
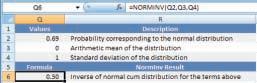
Figure 5
•The NORMINV [NORMINV(Probability, Mean, Standard_Dev)] performs the inverse operation by returning the ‘x’ value for a given cumulative probability of normal distribution with specified mean and standard deviation
•As a quality control device, we determine and display the distribution of random numbers, between zero and one, for the number of Monte Carlo passes being used in a specific simulation (2000, in this example). In a perfect world there would then be 200 observations in each of the ten bins displayed
•Each of the uncertain attributes are modeled as a random number input to NormInv, whose mean value and standard deviation are locally appropriate For example, the first pass random estimate of porosity, with a distribution centered on 20 pu and having a standard deviation of 1 pu, results in an estimate of 21 pu.
Setting the logical variable ‘cumulative’ to ‘false’ in the preceding expression will yield the ‘probability mass function,’ while setting ‘cumulative’ to ‘true’ returns the ‘cumulative’ distribution.
Be aware that Excel 2007 is used for these illustrations and while there is a Compatibility Mode for earlier Excel versions, it is conceivable that screens could differ. For greater clarity, the graphics / text in Figure 3 are color-coded, and in each case (true and false) the Excel cursor has been placed in a calculation cell, so that the functional form of NormDist is displayed at the top of the respective screen capture.
As an illustrative interpretation of the cumulative distribution, we recognize (Figure 3, right side) that the Cumulative Probability (vertical axis) has reached 0.50 (50%) when the Probability Distribution (horizontal axis) is 0. As expected, when the mean value is specified to be 0, there is equal probability of any single value being higher or lower.
Departing from the mean, Figure 3 (graphical display and Excel cell values) reveal that a cumulative probability of
• 16% has been reached @ x= -1.0,
• 31% @ x=-0.5,
• 69% @ x=+0.5,
• 84% @ x=1.0, etc.
There is then a 31% chance that ‘x’ is at least -0.5 in magnitude, a 69% chance that ‘x’ is at least 0.5 in magnitude, etc.
•Relation between NormInv Magnitude and the distribution of NormInv values
•90 samples
•The distribution of NormInv Magnitude is ‘normal’ per specified ‘mean’ and ‘std’, and will approach the expected ‘bellshape’ as yet more simulations are performed -
•It is the distribution of NormInv values that is driving the Sw(Archie) simulation
The NORMIN v [NORMIN v (Probability, Mean, Standard_Dev)] performs the inverse operation by returning the ‘x’ value for a given cumulative probability of normal distribution with specified mean and standard deviation (Figure 4).
This calculation indicates the Cumulative probability is
• 16% when ‘x’ attains the value -0.99,
• 31% when ‘x’ attains the value -0.50,
• 69% when ‘x’ reaches 0.50.
With a basic understanding of what the Excel Gaussian Distributions options are, one is able to model the Archie equation within that framework. For illustration purposes, we regard ‘a,’ Rw and Rt to be well known, and , ‘m’ and ‘n’ subject to uncertainty as specified in Figure 5. Allowance for uncertainty in ‘a,’ Rw and Rt may be addressed by a straight-forward extension of the techniques presented here.
Also, while the focus here is on the simple S w (Archie), any other model (shaly sand, for example) may be evaluated in a similar manner. Once the concepts are understood, locally specific models are readily developed.
Each of the uncertain attributes is modeled as a random number input to NormInv, whose mean value and standard deviation are locally appropriate. For example (Figure 5), the first pass random estimate of porosity, with a distribution centered on 20 pu and having a standard deviation of 1 pu, results in an estimate of 21 pu. The random values of ‘m’ and ‘n,’ appropriate to the specified distributions, are independently and randomly determined, and S w calculated per the Archie relation.
Because Excel recalculates equations each time the spreadsheet is opened, or specifications are changed, the various results will change (your line item spreadsheet values will change, each time you make a modification).
As a quality control device, we determine and display the distribution of random numbers, between zero and one, for the number of Monte Carlo passes being used in a specific simulation (2,000, in this example). In a perfect world there would be 200 observations in each of the ten blue bins displayed in Figure 5.
Figure 6 illustrates the relation between the magnitude of NormInv, and the distribution of NormInv values, for different standard (Continued on page 22...)

•Porosity is specified as a Gaussian distribution, centered on 20 pu with a standard deviation of 1 pu
•2,000 calculations are done, and the result
histograming the resulting porosity distribution and calculating the resulting statistics ‘checked’ by means of
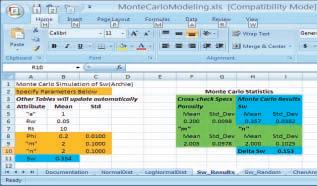
•The MC simulation is observed to reproduce the specified inputs
•Random number mean Std converge to input values ‘’‘’and
•One issue of interest is the dependence of Sw upon individual attribute values / uncertainties
•With the specifications at right
• Sw (mean) = 0.357
• σ ) = 0.038 (S
•There is a 95% likelihood that S is contained within + / -2 σ
•(0.357 –0.076) < Sw < (0.357 + 0.076)
•0.28 < Sw < 0.433
•Be aware of how Excel ‘bins’ data
(...Continued from page 21)
deviations, at 90 simulations. Both distributions take on an approximate Gaussian appearance, with the larger standard deviation result displaying more scatter. It is the distribution of NormInv values that is driving the S w (Archie) simulation. It is important to realize that each occurrence of NormInv involves an independent Rand() input.
The approach taken here is intended to parallel that of the LSU results (Must Read supplemental material – www.enrg. lsu.edu/pttc/), which also includes Log Normal and Triangle distributions, and so can be directly referenced if either of those distributions are required.
As an additional QC device, the statistical attributes of the simulated quantities ( , ‘m’ and ‘n’ in this example) are tabulated directly from the simulation population, and displayed graphically (Figure 7).
With 2,000 simulations, the model population nicely replicates the input numerical specifications, and the porosity distribution takes on the expected appearance (Figure 7).
Simulation results are reported both numerically and graphically (Figure 8). In this particular case, there is a 95% likelihood that S w is contained within + / - 2 , (0.357 – 0.076) < S w < (0.357 + 0.076) ➔ 0.28 < S w < 0.433.
In utilizing Excel frequency distribution graphics, one should take note of how the ‘bins’ are populated, as they are not ‘centered’. This can cause the graphic to take on a shifted appearance, with respect to the numerical report (consult Excel Help on the Frequency function for details).
The S w (Archie) result population is further affected by the nonlinear relation between the various attributes, as discussed by Bryant et al. in Understanding Uncertainty (Oilfield Review. Autumn 2002), who illustrates that a normal uncertainty distribution about a given porosity yields a log-normal distribution for the resulting S w distribution. Bryant’s article is another Must Read.
IN SE ARCH OF T HE bIGGEST b ANG FOR T HE bUCk
We are typically confronted with two issues, first to characterize the uncertainty in the S w estimate itself, and next to identify where time and money would be best spent to reduce that uncertainty. There are two ways to proceed: 1) take the derivative of Archie’s equation with respect to each term, and compare the magnitude of each term against one another, for specific attribute values or 2) Monte Carlo simulation, with the input attribute distributions specified per locally representative requirements.
The differential approach was illustrated in an earlier article, Risky Business, and those results have been included in the following so as to both ‘make the connection’ and to also serve as a cross-check. The illustrative attribute values / uncertainties are those in the Chen and Fang (1986) paper, so as to allow reference to that material as well.
In the case of Figure 9 attributes, the differential approach would indicate that time / money would be best spent on ‘m,’ as the relative uncertainty of the cementation exponent is far greater than any of the other attributes.
The connection between derivatives and Monte Carlo is made by recognizing that two standard deviations encompasses 95% of the statistical scatter, and then setting, attribute by attribute, 2 equal to the Chen and Fang illustrative uncertainties, thereby forming the Base Case for Monte Carlo (Figure 9).
Monte Carlo simulations are then performed, incrementally, with each attribute better defined by 10% and the improvement (reduced scatter) in the resulting S w noted (Figure 10).
Monte Carlo simulation reveals that a 10%
• + / -1 σ will encompass ~ 68% of the distribution
• +/-2 σ 95 % of the distribution,
•Approximate the ‘Phi’ relative uncertainty of 15% @ 10 pu (1.5 pu) as 2 σ 1.5 pu => σ 0.75 pu for Monte Carlo Simulation purposes
•That is, 2 σ encompasses 95 % of the spread in the distribution, and it is set equal to the 15 % uncertainty of the Chen & Fang analyses
•Approximate the ‘m’ relative uncertainty of 10% @ 2.00 (0.2) as 2 σ 0.2 => σ ~ 0.1 for Monte Carlo Simulation purposes
•Approximate the n relative uncertainty of 5% @ 2.00 (0.1) as 2 σ 0.1 => σ ~ 0.05 for Monte Carlo Simulation purposes ‘’
•The Biggest Bang For The Buck is to be found in ‘m’ as it has the greatest uncertainty relative to the other attributes
The Biggest Bang for the Buck Derivatives vs. Monte Carlo
After C. Chen & J. H. Fang. Sensitivity Analysis of the Parameters in Archie‘s Water Saturation Equation. The Log Analyst. Sept –Oct 1986
Figure 11
•One also observes that the Best / Worst numerical evaluation of S is considerably more pessimistic than is the +/-2 σ Monte Carlo simulation (Archie)
•The Best and Worst of all parameters are unlikely to occur simultaneously
improvement in definition of the cementation exponent will yield the greatest reduction in S w uncertainty, relative to the other attributes, and consistent (as expected) with Chen and Fang (Figure 9).
We also note that the Best / Worst case scenario would significantly overstate the 95% Monte Carlo uncertainty, because it’s unlikely (though not impossible) that the Best or Worst, of all attributes, would occur simultaneously (Figure 11).
Were porosity to be 25 pu, rather than the 10 pu of the above example, the focus changes. Now attention is best devoted to the ‘n’ exponent (Figure 12).
The uncertainty in an S w estimate is a dynamic issue, dependent upon the relative magnitudes of the input attributes which are themselves linked, and thus may change through the reservoir.
(to be continued...)
•Chen and Fang identify the attribute resulting in the greatest Sw uncertainty
•In the case at right, ‘m’ is the dominant issue
•This same issue can be addressed with Monte Carlo simulation (below)
•The Base Case is at lower left, with each simulation towards the right
improvement in Phi , m and n individual precision by 10
•If porosity were to be 25 pu, rather than 10, the focus changes
•‘m’ and ‘n’ uncertainties have been set equal in this simulation
•The Base Case is at lower left, with each simulation towards the right reflecting an improvement in Phi m n precision by 10 %. ‘ ’, ‘ ’ and ‘’
•With the improved porosity, focus shifts to ‘n’, the tortuosity of the conductive (brine) phase in the presence of a non-conductive (hydrocarbon) phase, as offering the Biggest Bang For The Buck.
•Improved n definition yields the greatest reduction in the standard deviation of Sw ‘’
We appreciate the unidentified LSU faculty who posted their material (located via Google) to http://www.enrg.lsu.edu/pttc/.
George Eden (BP Canada) and Larry Maple (ConocoPhillips) generously shared their thoughts, and suggested relevant reference material, as ideas and material on this question were gathered over the past few years.
Stefan Calvert (BG India, E&P) has kindly shared his thoughts and spreadsheet examples, as this overview was put together.
Omissions, typos, etc. remain, of course, my (the author’s) responsibility.
Copyright 2009 Robert E Ballay, LLC.
The second part of “Rolling the Dice,” including the references, will be printed in the June issue of the Reservoir.
Headquartered in Munich, Germany, GeoNeurale is a center for excellence in earth science research and training, as applied to both hydrocarbon and geothermal reservoir characterization and evaluation.
GeoNeurale’s Malm 2010 Research Project involves an international team of scientists, each with at least 20 years of experience, integrating geology, geophysics, petrophysics, geostatistics, neural networks, and artificial intelligence for static and dynamic simulation of the Bavarian Malm.
GeoNeural is also engaged in the development and delivery of specialized training courses. In the last two years, scientists from 17 countries and 31 companies or universities have attended their presentations.
Combine the power of AccuMap® & PETRA® for your complete E&P solution
You rely on the power of your applications to make your plays count. We’ve got the solution. To find out more information visit us at GeoCanada 2010, booth 427.
www.ihs.com/power


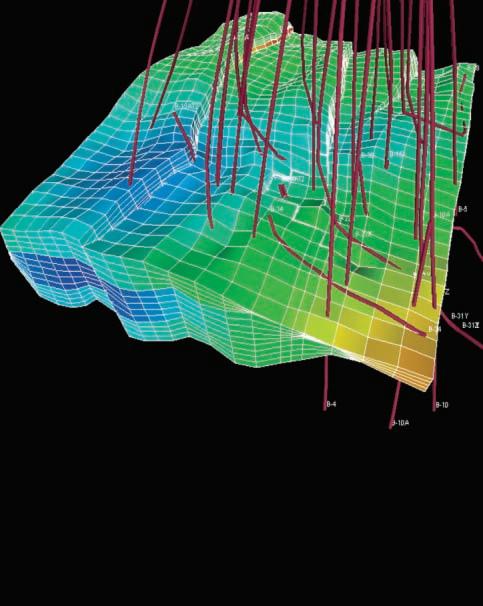
| by Zeev Berger*, Michelle Boast, and Martin Mushayandebvu (Image Interpretation Technologies Inc.) *corresponding author: zeev@iitech.ca, michelle@iitech.ca, martin@iitech.ca
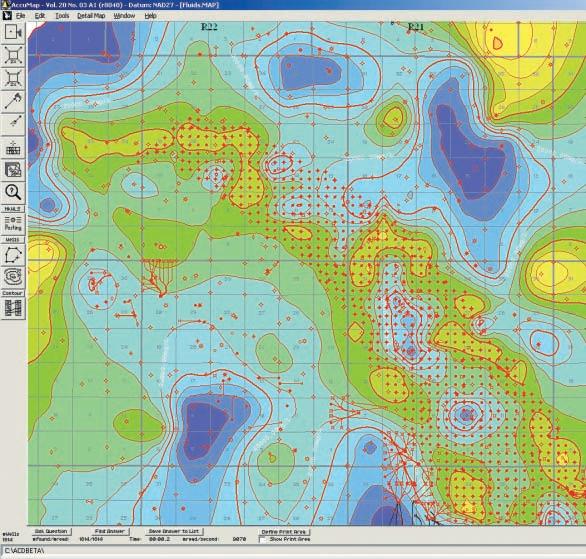
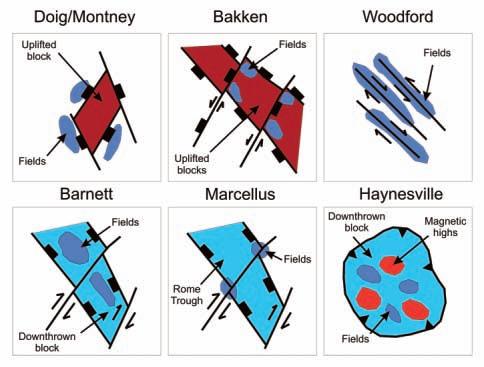
The emergence of unconventional plays in North America provided us with the opportunity to critically review the use of integrated regional studies of high resolution aeromagnetic (HRAM) data, in several mature basins in the USA and Canada. The results of these studies have been compiled onto a series of structural/ tectonic maps that are designed to illustrate the relationships between basement and sedimentary structures and the presence of ‘sweet spots’ and ‘preferred trends’ within these unconventional plays (Figure 1). Our regional studies have been used by our clients to evaluated and rank new opportunities within the different resource play areas and to assist existing operators in making some crucial drilling decisions. For example, the ‘sweet-spots’ in the Woodford shale gas plays of the Anadarko and Delaware basins are clearly localized along major reactivated wrench-fault systems and related fracture systems (Figure 1). This information can be used to evaluate acquisition opportunities as well as to position horizontal wells that are designed to intersect areas of maximum fracture densities. In contrast, in the Barnett shale play of the Dallas Forth Worth basin, the presence of wrench-fault systems has a negative impact on the play because this area is known to have problems with deep formation water (Figure 1).
Previously, we provided an in-depth look at the structural setting of the Peace River Arch area and illustrated the control of basement and sedimentary structures on the development of the emerging Montney/ Doig resource play (Berger et al., 2008; Berger et al., 2009). The development of several new exploration opportunities have lead us to revisit our tectonic work and expand the interpretation further north and south along the foreland area of the Western Canada Sedimentary Basin. To the north, the Montney/Doig play has been successfully extended into the moderately deformed region of the fore-foothills of northeast British Columbia. To the south, in the Ferrier/Pembina area, a new and exciting unconventional resource play of Cardium
light oil is emerging. This new play is located in the vicinity of an existing tight gas plays of the Rock Creek and Ellerslie formations, which are also beginning to show some new signs of life due to improved economic outlook for gas exploration in Alberta. The objective of this article is to illustrate the tectonic framework and uniqueness of all these new active resource plays, and to demonstrate the contribution of our regional approach to the exploration and exploitation of these plays.
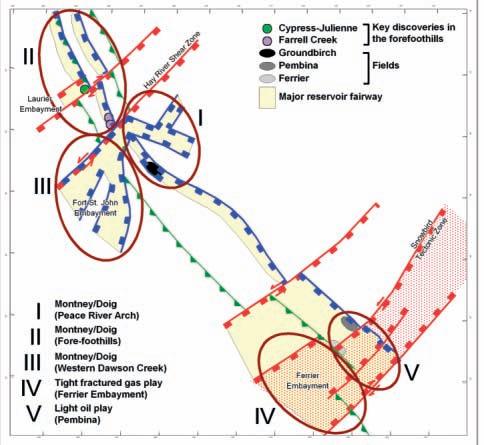
A summary tectonic map of the WCSB foreland basin covering the location of the new resource plays is presented in Figure 2. This map is based on integrated analysis of seismic data, well data, gravity and magnetic data, as well as remote sensing images. Geological structures in this area can be divided into three major categories. The first structural type is regional in scale and
includes the northeast-trending Hay River Shear Zone and Snowbird Suture Zone. These major Precambrian basement terrain structures have been active throughout the geological history of the basin. The second structural type comprises a number of linear to curvilinear normal faults systems that trend more or less parallel to the fold belt. These ‘down to the basin’ normal faults developed during the formation of the foreland basin. The third type of structure consists of exposed and buried thrust faults of the fold belt region, as well as several different types of reactivated and inverted structures that have developed in response to the evolution of the thrust belt to the west.
Unique plays that demonstrate the relationship between these three distinct structural types, and related Mesozoic sedimentation, are: 1) the mature play of the Montney/Doig of the Peace River Arch 2) the emerging Montney/Doig play of the fore-foothills 3)
the relatively unexplored Montney/Doig play of the Western Dawson Creek Complex 4) the fractured reservoir play of the Rock Creek and Ellerslie formations in Ferrier embayment area and 5) the Cardium light oil play of the Pembina field (Figure 2).
The structural and sedimentary evolution of the foreland basin comprises the foreland basin phase and the Laramide reactivation and inversion phase (Figure 3). The foreland basin phase is characterized by the presence of normal faults that trend parallel to the mountain front. These faults are cut and offset by northeast-trending reactivated basement structures which represent elements of the major shear zones (Figure 3A). The effect of the two different set of structures on Mesozoic sedimentation is illustrated in Figures 3B and 3C. Faults that trend parallel to the mountain front locally enhance the development of the typical sedimentary prism to the west (Figure 3B). Whereas, the northeast-trending faults create well defined grabens and/or structural embayments which are locally filled with foreland basin sediments (Figure 3C). In northeast British Columbia, the extensional faults that trend parallel to the mountain front are known to control the development of reservoir fairways of the Baldonnel, Doig, and Montney formations. In contrast, the structural embayment of the Dawson Creek Complex is primarily responsible for controlling the development of the reservoir fairway of the Halfway Formation. In the Ferrier/Pembina area, extensional faults trending parallel to the mountain front control the development of reservoir fairways of the Cardium Formation, while the structural embayment of the Snowbird Suture zone clearly controls the development of a reservoir fairway of the Rock Creek and Ellerslie formations.
The Laramide reactivation and inversion phase of foreland basin development is characterized by the emergence of new detached thrust faults, as well as the reactivation and inversion of the existing normal faults (Figure 3D). Normal faults that parallel the mountain front may either act as a ‘ramp’ to the thrust faults (Figure 3E), or, they may be completely or partially inverted (Figure 3F). Northeast-trending faults of the structural embayment may become reactivated as strike-slip faults, leading to a northeasterly directed penetration of the thrust belt into the structural embayment. In the case of the Dawson Creek Complex, the strike-slip reactivation of graben-related
(Continued on page 28...)
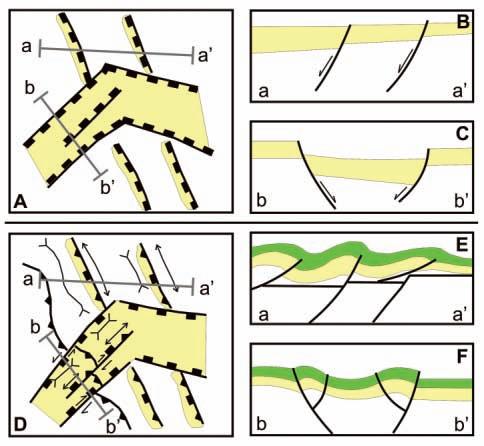
illustrations of the relationships between structures and sedimentation in the foreland basin of WCSB. Figures 3A, 3B, and 3C illustrate, in map and cross-section views, the effect of structures of Mesozoic sedimentation during the formation of the foreland. Figures 3D, 3E, and 3F, illustrate the impact of Laramide thrusting, reactivation, and inversion.
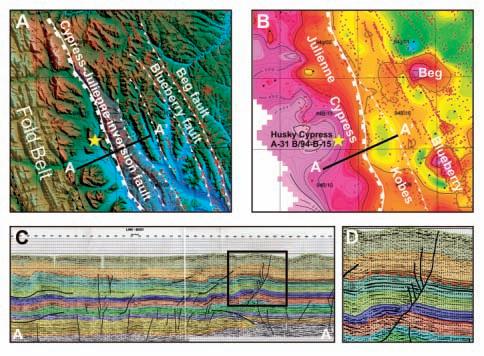
Figure 4. Structural and stratigraphic play elements of the Cypress Creek play area. The structural setting of the play is illustrated in Figure 4A with digital topographic data. The presence of thick Montney/doig play is illustrated with Doig isopach map in Figure 4B. The process of inversion is demonstrated with the seismic line in Figure 4C. Whereas, the abrupt increase in thickness of the Montney/Doig sediments across the fault is shown in Figure 4D.
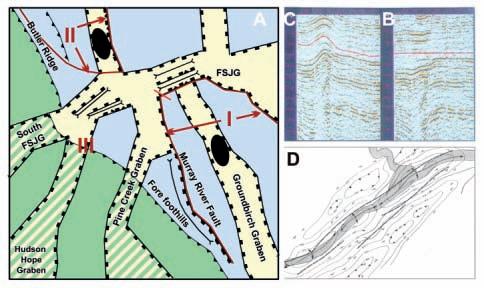
Figure 5. Structural and statigraphic play elements of the Western Dawson Creek Complex (Figure 5A). Numeral I: the location of the Peace River Arch Play, Numeral II: the fore-foothills play. The location of the seismic line shown in figures 5B and 5C is shown in red. Structural inversion of the Monias field is illustrated in Figures 5B and 5C. The presence of northeast-trending anticlines and synclines is demonstrated with surface structures maps in Figure 5D. (Berger, 2010)
(...Continued from page 27)
faults led to partial inversion of the graben’s margins, as can be seen in the Monias fields.
T HE MONTNE y/DOIG PLAy OF THE FORE-FOOTHILLS REGION
The past two years have been marked by an unprecedented expansion of the Montney/ Doig play into the fore-foothill region of northeast BC. This was mostly driven by the exploration successes of Talisman in the Farrell Creek area and Husky in the Cypress Creek
area. Although both companies remain tightlipped about their exploration strategies, it is possible to deduce, from available regional data sets, the key elements of this new and emerging resource play. Figure 4 focuses on the key Husky well and the area to the north that was recently sold for an exceptionally high price. The Husky discovery is located in a large and structurally undisturbed synclinal valley that has developed between the exposed thrust front to the west and a major thrust fault to the east which we have
named the “Cypress-Julienne Fault Zone” or “CJFZ.” These structural features have clear topographic expressions that can be recognized with digital topographic data and other remote-sensing tools.
The synclinal valley, is also characterized by the presence of thick Montney/Doig reservoir which occurs immediately west of the CJFZ (Figure 4B). The Montney/ Doig reservoir shows an abrupt change in thickness across the normal fault suggesting that it acted as a major growth fault during the development of the foreland basin. A regional seismic line across the fault zone also shows that this fault was later reactivated and inverted during the development of the fold belt to the west (Figures 4C and 4D). These observations suggest that the Montney/Doig play is likely to be developed along the north-northwest trending axis of the undisturbed syncline, which can be regarded as an isolated structural basin of the Montney/Doig reservoir.
T HE MONTNE y/DOIG PLAy OF THE wESTERN DAwSON CREEk COMPLEX
Exploration activities in the Western Dawson Creek Complex have been hampered by a lack of geological and geophysical controls as well as by limited access to exploration licenses. However, this vast area should be regarded as the last remaining frontier for new large opportunities in the Montney/ Doig resource play. A regional tectonic map of the Western Dawson Creek Complex is presented in Figure 5A. This map is based on the integration of several datasets including new high-resolution magnetic and gravity surveys, and detailed surface structure maps that were prepared for this study using highresolution stereo photographs. The tectonic map was also constrained using available well information and a grid of 2D seismic lines that were made available by Lynx Information Technologies (e.g., Figures 5B and 5C).
The Western Dawson Creek Complex is located between the well developed Peace River Arch play and the newly developed fore-foothills play. The structural setting of this area is quite unique because it contains a mixture of both the plays. Key features include deep-seated graben structures that display the same characteristics as the Groundbirch field; inverted fault structures similar to the CJFZ; and northeast-trending synclinal valleys that developed inside the Fort Saint John Graben (FSJG) along several reactivated and inverted fault systems.
Seismic lines across the Monias field can be used to demonstrate the process of inversion of structures in this area (Figure
5B and C). The flattened seismic line in Figure 5B shows the development of a thick Triassic section along the faulted edge of the FSJG. The original seismic line in Figure 5C, shows the present-day configuration of the inverted structure. Note that the inversion process lead to the development of a broad and relatively unstructured synclinal valley to the north of the Monias field. This feature is reminiscent of the synclinal valley that is being explored in the Cypress Creek area. The presence of northeast-trending synclinal valleys in the graben area can be further demonstrated with surface structure maps that were used in this study (Figure 5D).
R ESERVOIR G AS PLAyS w ITHIN THE SNOw bIRD T ECTONIC ZONE AND THE FERRIER EMbAy MENT
The Snowbird Tectonic Zone (SBTZ) is a large, northeast-trending, wedge-shaped, basement feature that is interpreted to be a series of highly deformed Lower Proterozoic rock units. The tectonic zone is dominated by the presence of northeast trending basement features that appear to have acted as major zones of weaknesses throughout the geological history of the Western Canada Sedimentary Basin. The repeated reactivation of basement structures within the Snowbird Tectonic Zone has lead to the development of several fracture-related gas plays in the Mississippian Banff Formation, the Jurassic Rock Creek and Nordegg formations, and the Cretaceous Ellerslie and Cardium formations. The reactivated basement structures also controlled the depositional environment, and the migration and accumulation of oil in the Cardium Formation of the giant Pembina field.
Control of the Snowbird Tectonic Zone on the development of the Rock Creek Formation is shown in Figures 6A and 6B. The preserved wedge of the Rock Creek sediments is clearly confined to the aerial extent of the SBSZ. Furthermore, variation in the thickness of the Rock Creek Formation is largely controlled by the presence of northeast-trending basement structures that can be seen on the magnetic data (Figure 6B). The effect of basement structures on the Rock Creek Formation and other tight reservoir rocks is most noticeable in the southern half of the tectonic zone. This area has been named here as the Ferrier Embayment.
The control of basement structures on the location of major gas fields in the Ferrier Embayment area is illustrated in Figure 6C. The dominant structural features in this area are northeast-trending basement involved
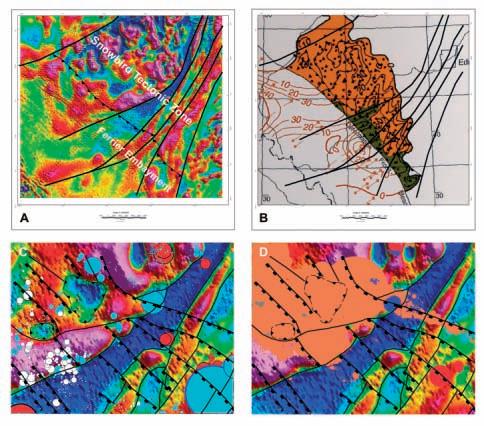
Figure 6. Structural and stratigraphic play elements of the Ferrier/Pembina field. The close spatial relationship between basement structures and the distribution of Rock-Creek reservoir is shown in Figures 6A and 6B. The control of basement and sedimentary structures on the development of “sweet spots” of different gas field is illustrated in Figure 6C. These formations include: Banff (in red), Ellerslie (in blue) and Rock Creek (in grey). Figure 6D illustrates the control of basement and sedimentary structures on distribution of Cardium oil in the Pembina area.
structures that follow the major lithological units of the basement; northwest-trending structures in the sedimentary section that cut and offset basement structures; and major circular features that reflect the presence of structural/topographic depressions in the basement floor. The bubbles on Figure 6C show cumulative production from several gas fields that produce from the Rock Creek, Banff, and Ellerslie formations. There is strong control of both basement and sedimentary structures on the development of ‘sweetspot’ in these gas plays.
Also within the Ferrier Embayment, structural control of basement on the Pembina oil field is evident (Figure 6D). Basement structures within the Pembina field include: 1) a major structural and topographic depression of the basement that controls the location of the main field; 2) a major northeast-trending lithological boundary within the basement that forms the southern margin of the field; and, 3) a major northwest-trending fault that controls the location of the southern linear arm of the field. These relationships between basement structures, which can be detected with HRAM data, and accumulation of oil in and around the Pembina field area could have a profound impact on the development of
‘sweet spots’ and ‘preferred trends’ within the new light oil play that is being developed in this area.
Exploration and exploitation of resource plays present new challenges to the geosciences community. Geologists and geophysicists, who have been trained to search for well defined structural and stratigraphic traps, are now being asked to identify ‘sweet spots’ and ‘preferred trends’ that are controlled by extremely subtle geological features. The identification of such trends can clearly make or break the economic success of most resource plays. This article demonstrates that the emerging unconventional plays in the foreland basin of the Western Canada Sedimentary Basin follow the same pattern. That is, the location of most of the known ‘sweet spots’ can be clearly linked to basement and sedimentary structures. However, this basin exhibits a wide variety of different structural controls that must be recognized and carefully assessed in the context of the complex tectonic evolution of the basin. Such analysis may require the use of tools and techniques that are not routinely used for conventional exploration.
(Continued on page 30...)
REFERENCES AND SELECTED bILIOGRAPH y
Barclay, J. E., Krause, F. F., Campbell, R. I., Utting, J. 1990. Dynamic casting and growth faulting: Dawson Creek Graben Complex, Carboniferous-Permian Peace River Embayment, Western Canada. In: Geology of the Peace River Arch. S. C. O’Connell and J. S. Bell (eds.). Bulletin of Canadian Petroleum Geology, v. 38a, p. 115-145.
Berger, Z., Boast, M., and Mushayandebvu, M. 2008. The contribution of Integreated HRAM Studies to Exploration and Exploitation of Unconventional Plays in North America. Part 1: The Peace River Arch. Reservoir, v. 35, Issue 10, p. 42-47.
Berger, Z., Boast, M., and Mushayandebvu, M. 2009. The contribution of Integreated HRAM Studies to Exploration and Exploitation of Unconventional Plays in North America. Part 2: Basement structure control on the development of the Peace River Arch’s Montney/Doig resource plays. Reservoir, v. 36, Issue 2, p. 40-45.
Berger, Z. 2010. Western Dawson Creek tectonic study by IITECH. Unpublished.
Canadian Discovery Ltd. 2008. The Doig
Formation in Peace River Country. Canadian Society of Petroleum Geologists. The Reservoir v. 35, issue 7, p. 32-35.
Canadian Discovery Ltd. 2007. Puskwaskau –Beaverhill Lake Sand Oil, Alberta T71, R26W5. Canadian Society of Petroleum Geologists. The Reservoir v. 34, issue 2, p. 33-36.
Cant, D. J. 1988. Regional structure and development of the Peace River Arch, Alberta: A Paleozoic failed-rift system? Bulletin of Canadian Petroleum Geology, v. 36, p. 284-295.
Davies, G. R. 1997. The Triassic of the Western Canada Sedimentary Basin; tectonic and stratigraphic framework, paleogeography, paleoclimate, and Biota. In: An issue focused on the study of Triassic of the Western Canada sedimentary basin. Bulletin of Canadian Petroleum Geology, v. 45, no. 4, p. 434-460.
Davis, G. R. and Smith, L. B. 2006. Structurally controlled hydrothermal dolomite reservoir facies; an overview. In: Structurally controlled hydrothermal alteration of carbonate reservoirs. Bulletin of the American Association of Petroleum Geologists, v. 90, no. 11, p. 1641-1690.
Harding, T. P., Verbuchen, R. C., and ChristieBlick, N. 1985. Structural styles, plate tectonic
settings and hydrocarbon traps of divergent (transtensional) wrench faults. In: Strike-slip deformation, basin formation and sedimentation. K. T. Biddle and N. H. Christie-Blick (eds.). Society of Economic Paleontologists and Mineralogists Special Publication 37, p. 51-77.
Krause, F. F., Deutsch, K. B., Joiner, S. D., Barclay, J. E., Hall, R. L., and Hills, L. V. 1994. Cretaceous Cardium Formation in the Western Canada Sedimentary Basin. In: Geological Atlas of the Western Canada Sedimentary Basin. G. D. Mossop and I. Shetsen (eds). Alberta Reserach Council and Canadian Society of Petroleum Geologists, p. 375-385.
Norgard, G. 1997. Structural inversion of the middle Triassic Halfway Formation, Monias field, northern British Columbia. In: An issue focused on the study of Triassic of the Western Canada Sedimentary Basin. T. F. Maslow and J. Wittenburg (eds.). Bulletin of Canadian Petroleum Geology, v. 45, no. 4, p. 614-623.
O’Connell, S. C., Dix, G. R., and Barclay, J. E. 1990. The origin, history, and regional structural development of the Peace River Arch western Canada. In: Geology of the Peace River Arch. S. C. O’Connell and J. S. Bell (eds.). Bulletin of Canadian Petroleum Geology, v.38a, p.4-24.


FARHATHYDERI,P.Geol President
226CopperfieldBlvd.S.E. Calgary,ABT2Z4R6
Tel 4037260666
Fax4034515380
Cell4038192516
farhat@sableconsultants.com SABLECONSULTANTS.COM
ConventionalWellsHeavyOil/OilSands SAGD Horizontal CoringProgramsCoalBedMethaneProjectSupervision


WORKING WITH THE EARTH Calgary, Alberta – May 10-14, 2010 info@geocanada2010.ca

Convention is a once-in-a-decade event. The Technical Sessions span the breadth of the Earth Sciences, and this Convention is a must-attend event for anyone looking to increase their skill-set or
full program of oral sessions features ten concurrent rooms running a total of 77 sessions over the course of four days (Monday, May 10 – Thursday, May 13) – over 500 oral presentations to choose from!
Monday May 10 AM
Hydrothermal Processes in Ore Genesis and Mineral Deposit Discovery
Monday May 10 PM Hydrothermal Systems and Ore Deposits
Signal Processing and Algorithms
Signal Processing and Algorithms
Tuesday May 11 AM
Rise of Oxygen and Early Life on Earth
Tuesday May 11 PM GeoScience Education
Wednesday May 12 AM Future of Geosciences in Canada
Wednesday May 12 PM Great Canadian Lagerstatten
Thursday May 13 AM
Ichnology / Cratons, Kimberlites, and Diamonds
Advances in Seismic Acquisition
International Exploration and Development of Mineral and Energy Resources / Offshore Canada Challenge Solution and Discovery
Energy Practice - Resources Data Management, Estimation, and Reporting
Subsurface Imaging and Structure
Imaging the Earth: New Techniques and Advances
Northern Development: Resources, Sediments, and People
Northern Development: Resources, Sediments, and People
Stress, Strain, Anisotropy, and Induced Fractures
Paleoproterozoic Tectonic Assembly of the W. Canadian Shield: New Findings and Implications for Paleocontinental Reconstruction
Paleoproterozoic Tectonic Assembly of the W. Canadian Shield: New Findings and Implications for Paleocontinental Reconstruction
Organic Geochemistry and Petrology: Applications in Exploration Geology and Environmental Issues
Stress, Strain, Anisotropy, and Natural Fractures
Communicating Earth Sciences to the Public
Communicating Earth Sciences to the Public Workshop
Northern Development: Tectonics, CircumArctic Geology, and Paleogeography
Seismic Interpretation and Case Studies
Groundwater Exploration and Management 1: Basin-scale Models
Groundwater Exploration and Management 2: Aquifer-scale Methods
Advances in Stable Isotope Geochemistry in Energy and Environmental Research
Thursday May 13 PM Cratons, Kimberlites, and Diamonds
Potential Field and Electrical Methods in Exploration
Northern Development: Tectonics, CircumArctic Geology, and Paleogeography
Long-term Nuclear Waste Management in Canada
WORKING WITH THE EARTH
Calgary, Alberta – May 10-14, 2010 info@geocanada2010.ca
From Monday to Thursday, each day of presentations begins with a special plenary speaker. In addition, general poster talks will be taking place on the Exhibit Floor Monday to Wednesday, with over 300 authors presenting their work; and specialized poster sessions are scheduled for Tuesday afternoon in Hall D.
Groundwater
Contamination and Remediation 1: Innovations in Bioremediation
General Hydrogeology
Contributions
Groundwater
Contamination and Remediation 2: New Methods in Soil and Groundwater Remediation
Geological Processes over Time in Central Canada
Geological Environments Hosting Uranium Deposits
Geological Environments Hosting Uranium Deposits
Geological Environments Hosting Uranium Deposits
Ancient Life on Many Scales: Papers on Palynology, Paleontology, and Paleoecology in Honor of Prof. Leonard v. Hills
Interplay between Thermodynamics, Kinetics, and Deformation in Metamorphism
Interplay between Thermodynamics, Kinetics, and Deformation in Metamorphism
Interplay between Thermodynamics, Kinetics, and Deformation in Metamorphism
Interplay between Thermodynamics, Kinetics, and Deformation in Metamorphism
Sequence Stratigraphy/ Seismic Stratigraphy
General Session on Mineralogy, Petrology, Geochemistry
Cordilleran Magmatism, Tectonics, and Resources
Cordilleran Fold and Thrust Belt
Structural Geology and Geophysics
Clastic Sedimentology 1: Fluvial/Alluvial Systems
Displayed here is an outline of the Technical Program. visit www. GeoCanada2010.ca to see the list of speakers and talks. Please note that all information is subject to change. visit www.GeoCanada2010. ca for the most up-to-date information.
Carbonates / Oil and Gas Pools
Practical Applications of New Petrophysical Technologies
Advances in Core Analysis Techniques
Comparative Studies of a Spectrum of Shale Plays
Characterization, Operations and Production of Shale Gas
General Structure and Tectonics
Modern Analogs for the McMurray Fm
Frontier PracticeProfessionalism at the forefront
Climate Change Through Time
Tectonostratigraphy and Interplay of Natural Fractures with Sedimentary Facies
Clastic Sedimentology 2: Shore to Shelf
Geoscience Information Management in a Spatially enabled Online World Advances in Geomodelling
Geohazards - Risks
Identification, Mitigation, and Management
Comparative Planetary Geology: Meteorites, Impacts, and More
Comparative Planetary Geology: Meteorites, Impacts, and More
Clastic Sedimentology 3: Deep Water
General Poster Sessions Basin-Centered Tight Gas
Geoengineering Carbon Mineralization
Oil Sands Mining: Water and Landscape Design
Carbon StorageFrom Concept to Implementation Heavy OilSubsurface
Geothermal Energy
Mineral Exploration and Mining practice: The Role of Professional Geoscientists
Recent Advances in Structural Mineralogy
Practical Applications in Geomodelling
Communicating Earth Sciences to the Public
The GeoCanada 2010 Core Conference Committee is pleased to announce the following list of core displays that capture the many facets of “Working with the Earth,” the theme of GeoCanada 2010. On display will be examples of new methodologies and technical applications in evaluation of the subsurface, examples of carbonate and clastic depositional systems and the new paradigm of subsurface exploitation encompassed by unconventional heavy oil, shallow gas, tight gas, and shale gas opportunities.
This year the Core Conference will be presented on
Thursday, May 13 9 :00am – 4:00pm Friday, May 14 8 :30am – 2:00pm
Remember, your delegate badge allows you free access to public transit for the week of the Convention – public parking at the ERCB is extremely limited and pay-only.
Need directions? Walking from Brentwood C-Train Station (approx 8 mins)
1. Head northwest towards 33 St NW
2. Slight left at Research Rd NW
3. Turn left at 33 St NW
4. Turn right at Research Way NW (ERCB will be on the left)
The Tentative program will include presentations on:
Pedogenic and Groundwater Silcretes in Paleovalley Filling J3 and J2 Sandstones, Medicine River Area, West Central Alberta, Canada
Federico Krause and Andrea F. P. Mellor
Sedimentological and Ichnological Assessment of a Regional Sequence Boundary / Transgressive Ravinement Surface, Bluesky-Gething Interval, Northern Alberta
Cassandra Frosini, Stephen M. Hubbard, and Kaylee D. Anderson
Facies Architecture of the Upper Mannville Group (Sparky, Waseca, and McLaren Formations), West-Central Saskatchewan
Alireza Morshedian, James A. MacEachern, and Shahin E. Dashtgard
Reservoir Characterization by Means of Drill Cuttings: An Example of Hydrothermal Dolomite in Cuttings from the Monkman Area of British Columbia
Tim Hartel
Chemostratigraphic Characterization of Incised Valley Fill Sequences from the Lower Cretaceous Mannville Group and the Basal Colorado Sandstone
Milly Wright, Kenneth Ratcliffe, and Brian Zaitlin
Subaerial Unconformities in the Upper Devonian Snipe Lake Reef Complex, WestCentral Alberta
Beverly Mack and Nancy Chow
Reservoir Characteristics of the Birdbear Formation in West-Central Saskatchewan
Chao Yang
Geology of the Jurassic Shaunavon Formation, Southwestern Saskatchewan Arden Marsh and Gavin Jensen
New Production and Facies Model for the Devonian Three Forks / Torquay Package in Southern Saskatchewan
Erik Nickel
DE POSITIONAL Sy STEMS: SA NDSTONE
Sedimentology of the Lower Vivian Formation: An Extensive Lowstand Fluvial System, Marañon Basin, Peru
Mark Radomski and Mark Hearn
How to Log Core (With Examples from the Williston Basin of Southeast Saskatchewan)
Don Kent and John Lake
Pressure Decay Profile Permeametry Lou Monahan
Using Paralic Coal as an Indicator of Accommodation Space and Correlation Tool in Terrestrial Sediments: Examples from the Falher and Mannville
J. A. Wadsworth
Lithofacies Identification and the Implications for SAGD Well planning in the McMurray Formation, Christina Lake Area, Alberta
Travis Shackleton, Robert Gardner, Sung Youn, Grace Eng, and Lori Barth
Regional Stratigraphy and Reservoir Units of the Grosmont Formation: Laricina’s
Saleski and Burnt Lakes Leases
J. Hopkins, K. Wilde, S. Christiensen, and K. Barrett
The Wabiskaw D Member, Clearwater Formation: A World Class Oil Sands Reservoir Hosted in an Incised Valley Complex
Daren J. Shields and Rudy Strobl
Paleogeographic Distribution of the Lower Cretaceous McMurray (Dina) Formation in Northeastern Alberta and Northwestern Saskatchewan
Dan Kohlruss, Jenna Phillips, Mike Ranger, Murray Gingras, and Per Pedersen
Stratigraphy and Sedimentology of the Tukweye Member of the Martin House Formation, Mackenzie Corridor, Northwest Territories
Julia E. A. Davison, Stephen M. Hubbard, Thomas Hadlari, and Dennis Meloche
Unconventional, Low-Permeability
Offshore Marine Reservoir Facies, with Hiatal Conglomerates Developed at Internal Stratigraphic Unconformity Surfaces - the Alderson Member of the Milk River Formation, Upper Cretaceous, Southern Alberta and Saskatchewan Shaun O’Connell
Horn River Shales…Boring and Black? Or Beautifully Complex?
Shelley Leggitt, Shona Ness, and Roy Benteau
Integrated Sedimentology, Ichnology, and Petrography of Unconventional Gas Reservoirs of the Montney Formation; Dawson Creek Region, Northeastern B.C. Peter Proverbs, Kerrie L. Bann, and Chris Fratton
Correlating the Subsurface Nikanassin Group to an Outcrop near Grande Cache, Alberta
Rachael M. Rose, Ross B. Kukulski, Brett D. Miles, M. Keegan Raines, Andrew Leier, Holly Rose, Tanya Dixon, and Cassandra Frosini
Potential Unconventional Gas Reservoirs of Alberta - What Do They Have in Common? What are the Main Differences?
Doug Cant
We would like to thank all the exhibitors for participating in the 2010 Convention.

The 2010 Convention Committee thanks the following exhibitors for participating in GeoCanada this May:
Company Name........... Booth Number
Aarhus Geophysics 1022
acQuire ............................................................ 334
Actlabs 414
Aeroquest Surveys 623
AGAT Laboratories Ltd. 323
Alberta Geological Survey.......................... 929
Alberta Research Council 813
ALT - Advanced Logic Technology...........612
American Association of Petroleum Geologists .................................................1026
APEGBC 935
APEGGA 937
Baker Hughes 418
Blue Marble
Boyd PetroSearch
Calgary Rock
Cdn. Clean
Canadian Discovery Ltd. 313
Cdn. Natl. Stock Exchange ......................... 915
Cdn. Federation of Earth Sciences.........1038
CGGVeritas 109
Continental Imaging Products 1014
Continental Laboratories / CL Consultants.......................................... 314
Core Laboratories Canada Ltd. 1009
CREWES, University of Calgary 332
Canadian Society of Exploration
Geophysyicists ......................................... 1037
Canadian Society of Petroleum Geologists 1033
Canadian Well Logging Society 1032
Datalog Technology...................................... 720
dGB Earth Sciences USA LLC 540 Digital Formation 539
Inc. ............................................... 123
systems ltd. ............................... 101
Association of Canada 1041
Rentals & Services Inc. 730
Rock & Lapidary Ltd. 636
Inc. 912
Divestco Inc. 433 Geogiga Technology Corp. 1025
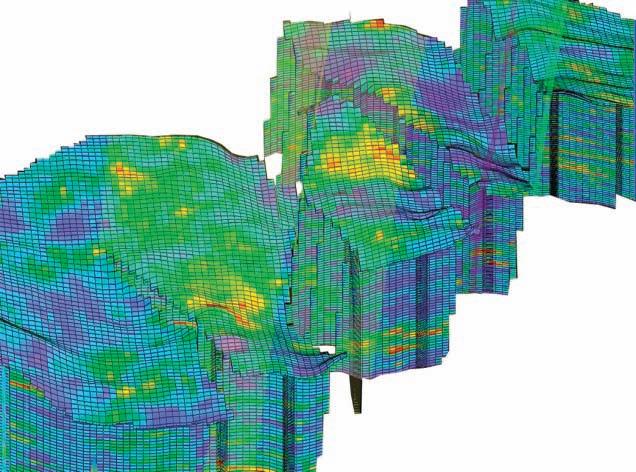


ION ...................................................................513
Isobrine Solutions .........................................633
Isomass Scientific Inc. ..................................819
iSys - The Imaging Systems Group Inc. ...537
Kinetex Multi-Component Services ........542
Komarevich Originals Ltd ...........................222
Light Up the World ....................................1100
Little Rock Document Services Ltd.........325
Manitoba Innovation, Energy and Mines.936
Matrix Solutions Inc. ...................................927
MicroSeismic, Inc. .........................................609
Mineralogical Association of Canada .......941
MJ Systems ......................................................900
National Oilwell Varco ................................415
Natural Resources Canada/GEM .............928
Neuralog ..........................................................413
Newfoundland and Labrador (Natural Rescources)...............................724
Northwest Territories Geoscience Office............................................................933
NRC Research Press ....................................939
Nuclear Waste Management Organization ...............................................229
Oce-Canada Inc. ..........................................920
Ontario Geological Survey .........................930
OYO Geo Space Canada, Inc. ...................714
Packers Plus Energy Services .....................829
Paradigm .........................................................507
Pason Systems Corp. ...................................631
Petrocraft Products/ Datacon Core Image................................909
Petrosys Canada Inc. ..................................914
Picarro Inc. ....................................................918
Pro-Geo Consultants...................................514
Quest Coring Services ................................324
Rocking Horse Energy Services Inc. ....1108
Roxar Canada Ltd. .......................................801
RPS Energy ......................................................501
Sample Pro Ltd. .............................................627
Saskatchewan Ministry of Energy and Resources ............................................934
Saudi Aramco .................................................807
Schlumberger .................................................301
SDI (System Development Inc.)................923
SeisWare International Inc. .......................531
Seismic Micro Technology (SMT) .............335
SGS Canada Inc. ............................................722
Sigma Explorations Inc. ...............................615
Society Of Exploration Geophysicists .............................................315
Southern Alberta Institute of Technology..................................................330
Straterra Inc. ..................................................322
Telus - Spot Imagery ..................................1122
Terraplus Inc. .................................................614
Tetrale Inc. ....................................................1110
TGS ...................................................................625
Thermo Scientific Niton Analyzers .........817
TOTAL Gas Detection Ltd. .......................815
Transform Software and Services Inc. .....911
Trivision Geosystems Ltd. ..........................635
United Oil & Gas Consulting Ltd. ............639
University of Alberta ...................................224
University of Calgary –Dept. of Geoscience ................................228
University of Toronto ..................................230
University of Waterloo,
Dept. of Earth Sciences...............................232
University of Western Ontario ................234
University Outreach .................................1029
Uretek Canada Inc. .....................................321
Valtus Imagery Services ...............................621
VSG - Visualization Sciences Group ........738
Weatherford Canada ...................................601
WellSight Systems Inc. .................................837
Yukon Government, Oil & Gas Resources ....................................................932
Current as of March 22, 2010
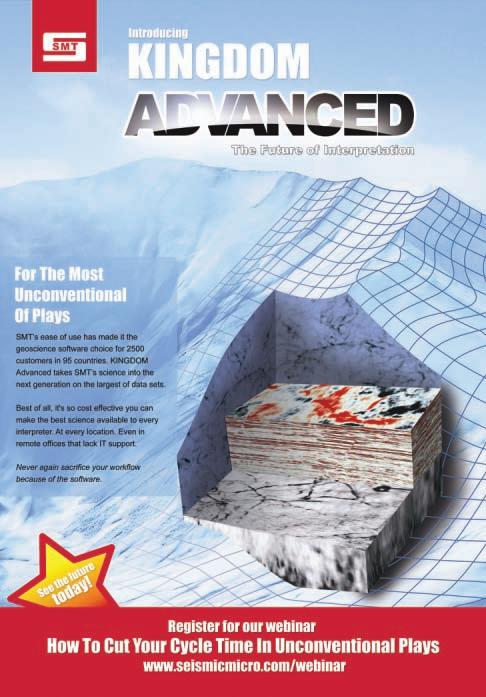
| By Cory MacNeill
The Annual CSPG/CSEG University Outreach Booth will be the place to be for students at GeoCanada 2010. The University Outreach committees have been working hard to ensure that there are numerous opportunities for students to network and learn at GeoCanada 2010. Students who
register online before April 29, 2010 get a special rate of just $75.00 for the entire convention.
Any students interested in getting their registration fee refunded and capitalizing on even more networking opportunities can


volunteer at the convention. A minimum of eight hours of service is required to receive the refund and volunteer positions are available in the following areas: Technical Sessions, Information Booth, Registration Package Pick-Up, and the Core Conference. Contact volunteers@geocanada2010.ca for more information or to sign up.


Students attending the convention will want to find the University Outreach Booth in the exhibit hall. This is where they can enter draws for some great prizes, meet up with fellow students, and have a place to call their own. There is even a foosball table to be won for the club room of their home university!


The University Outreach Booth is also the place where students can find out and register for the Challenge Bowl, get information about some of the scholarships and awards available and sign up for student membership in the CSPG or CSEG.


Registration for the annual student-only field trips will begin at the convention. This year’s CSPG student field trip will be taking place on June 23, 2010 and is titled ‘Aspects of Marginal Marine Sedimentology and Stratigraphy of the Bearpaw-Horseshoe Canyon Formation Transition near Drumheller, Alberta.’ The annual CSEG student field trip will be occurring a few days later on June 27, 2010 and includes learning about all aspects of the seismic industry.


In addition, there will be two activities for students taking place away from the convention location. There will be a downtown field trip, which will include visits to Talisman Energy, Trident Exploration, and Key Seismic Solutions. The second off-site activity is the Student Pub and Disco Night. This event will be on Wednesday, May 12 at Local 522 Pub in downtown Calgary, and promises to be a fun night.


For more information about GeoCanada 2010, and to register, visit www. geocanada2010.ca. For questions about the events and opportunities for students, please contact Cory MacNeill: cmacneill@ tridentexploration.ca.
crabs (e.g., Uca) occur. Conclusively, Psilonichnus quietis is interpreted to represent ephemeral to semi-permanent dwelling behaviors (primary level) and breeding behavior (secondary level), probably produced by Ocypodid crabs similar to Ocypode and/ or Uca, employing deposit-feeding and/or scavenging modes of trophic style.
Myo Myint is a consulting geologist (self-employed) specializing in wellsite and petroleum exploration and development operations in the Western Canada Sedimentary Basin and International areas. He received a Ph.D. from the University of
Tsukuba, Japan in 1997. After graduation in Japan, he moved to Singapore to work with a Japanese geological consulting firm and immigrated to Canada in 2003. He is a member of APEGGA and CSPG.
This event is jointly presented by the Alberta Palaeontological Society, Mount Royal University and the CSPG Palaeontology Division. For details or to present a talk in the future please contact CSPG Paleo Division Chair Philip Benham at 403-6913343 or programs@albertapaleo.org. Visit the APS website for confirmation of event times and upcoming speakers: http://www.albertapaleo.org/.
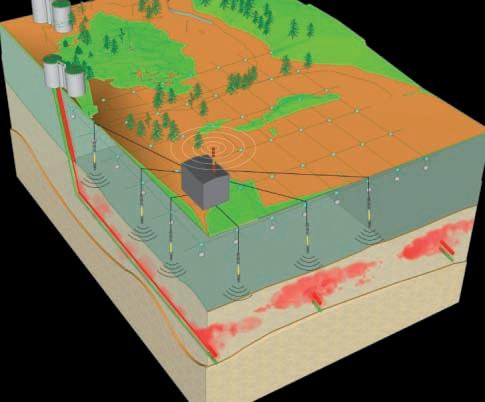
CGGVeritas delivers unrivalled processing and imaging technology, expertise and service to optimize your heavy oil production results:
haV e you B een a mem B er of C spg for 30+ year s (sin C e at leas t 1980)?
If so, you should have already received your invitation to the 10th Annual LongTime Members Reception. This popular event is a complimentary cocktail party organized exclusively for our more senior members in appreciation of their long commitment to CSPG. Attendance is by invitation only.
This year the reception will take place Tuesday, May 11, 2010 from 4:00 to 6:00 p.m., and will be held once again at the Rotary House on the Stampede Grounds. It will be held in conjunction with the GeoCanada 2010 Convention, but you need n ot be registered for the Convention in order to attend the event.
As is tradition we will be presenting the Honourary Membership Awards at the Long-Time Members Reception. This year’s recipients are Ashton Embry, John Maher, and Rick Young.
If you are a long-time member (30+ years) in good-standing, and have not received an invitation yet, please call Dayna Rhoads, CSPG Registration Coordinator at 403513-1229. She will verify your start-date and ensure you are on the invitation list.
• 5D interpolation to increase geometry density and resolution
REVIVE
Unmatched 4D processing experience
• Multicomponent processing provides valuable insights for
• reservoirs where conventional seismic fails to deliver
• the high-amplitude, aliased groundroll noise, revealing the P-wave image.
Adaptive polarization filter to effectively isolate, characterize and attenuate
Please join us for coffee at the 2010 GeoCanada Convention booth #109.
Contact:
(403) 205-6000
SAFER, CLEARER, BETTER
Processing & Imaging
cggveritas.com
Please contact volunteers@ geocanada2010.ca.
| By D. T. Sneddon, P.Geol.
Every working (and semi-working) geoscientist is a business. Every good and successful business needs a business plan to ensure continuing success. Every good business plan includes a number of key elements:
• Corporate Strategy/Strategic Plan
• A vision statement
• A mission statement
• A list of achievable goals
• R&D Progress and Plan
• Marketing and Sales
• Human Resources
• Financial Operations and Plans
• Threats and Opportunities
• Income/Expense Statement for last year
• I ncome/Expense pro forma for next year
• Capital Expenses and Investments
• Balance Sheet at fiscal year end
To build a full 30-page business plan is a rewarding but time-consuming task and isn’t for everyone. Most people can do what amounts to an Executive Summary business plan in an evening, or a weekend, which will keep them on track for the planning year.
Thanks to the Canada Revenue Agency, those of us of the consulting persuasion need to prepare the old year income/expense statement anyway and most of us keep a number of them in our shoebox from past years, which can be a very useful planning tool. Similarly, APEGGA insists on tracking your Continuing Professional Development (CPD) score. This data can be turned to your advantage if you use it as background to your personal growth strategy.
A good time for doing the vision, Mission, and Goals statements is always right now. Our society places the highest of all values on human life, but for some reason most of the people I know seem to place a low value on their own time. This continues to perplex me, because our lives are the only thing we truly own. The reality is that the only time we have to work with is a succession of “now” states and we literally use them or lose them and being scarce, those hours and days have real economic value.
We all have a vision of life and it is a valuable thing to actually write it down somewhere. Plato quotes Socrates in the Dialogues, specifically the Apology, as saying “The unexamined life is not worth living.” A brief vision statement is a good way to begin that examination, usually with the help of one’s significant other who is generally at the core of our personal business plan and a joint vision is always critical to personal success.
Corporate vision statements tend to be boring: “Success Corporation will provide shareholder value by wise investment of retained earnings” doesn’t exactly catch a romantic’s view of life, but it is certainly clear and concise. It also provides a point of departure for the rest of the corporation’s business plan. A personal vision statement that is equally pragmatic might go something like this:
“Joe Doaks, P.Geol. will provide a growth environment for Jane Doaks and his dependants and will provide excellent professional services to his community and clients.”
Equally pragmatic and slightly more poetic would be:
“Jane Doaks, P.Geo. will serve her fellow citizens through volunteering as a role model for young people and through providing professional services to the community in strict conformity with the APAEGGA Code of Ethics.”
Having established a vision of who you want to be, the next big question involves where you want to go and how you plan to get there. A mission can be really simple (“I will find oil”) or somewhat more complicated (“My mission is to become an expert Holocene stratigrapher and to bring fresh water to third world countries”). Once your vision is clear and your mission is well defined, goals are a snap since you will focus only on those options that contribute to your vision and mission in life. All you have to do is list all the currently available opportunities, scratch out those that do not contribute to getting you to where you want to be over your planning horizon and then listing them in priority from highest return on investment through to lowest.
Next, you must plan the investment required to achieve your highest priorities.
This is where the Continuing Professional Development Program (CPD) comes in, particularly if you need to expand your scope of practice or simply maintain your position in the pack. It will guide your thinking and goad you to action. you, as a professional member of APEGGA, are obliged to earn 240 Professional Development Hours (PDH) over each three-year period anyway, and a time investment plan will optimize the value received for that commitment. CSPG, CSEG, and CWLS membership gives you access to a wealth of CPD opportunities. The technical societies and APEGGA cooperate fully to ensure you get a good return on your investment and the public benefits from what you learn. Courses and conferences with technical, business, and soft skills are all eligible for CPD credits.
The categories of CPD are in Professional Practice Guide 8 (details downloadable at http://www.apegga.org/Regulatory/CPD/toc. html):
• Professional Practice
• Formal Activity
• Informal Activity
• Participation
• Presentations
• Contributions to Knowledge you can value/cost the time investment in category using the following methods:
Professional Practice is straight forward: APEGGA spots you 50 PDH, with 15 hours of work equivalent for 1 PDH for normal practice. That is equivalent to three full months on the job. If you are not working, or working part time, you can apply for a reduction to 30 PDH when carrying out your annual CPD reporting. If you are a full-time graduate student, your PDH load can be reduced to 30, with 30 PDH (Continued on page 43...) The 7th Annual Friends of Science Luncheon

Registration at 11:30 am, Metropolitan Conference Centre 333 – 4th Avenue SW, Calgary, Alberta
TICKETS: $75 or $675/table of nine. RSVP by May 13, 2010 For more information: E-mail: contact@friendsofscience.org or Call: (403) 830-1735

NeuraDB is the solution to find, load, manage, QC, store and deliver the wide variety of critical E&P data that your organization uses. It is a vendor-neutral, well-based data management system to compliment your existing infrastructure. NeuraDB allows your staff to gather and load all relevant data from a single trusted source.
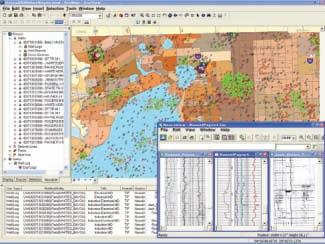
• Well data master
• Raster and digital log repository
• Physical data inventory
• Well File System for reports, maps, etc.
• Select data from ArcGIS interface
• View data immediately or deliver to your application


granted for a successful thesis defense.
Formal Activity represents a significant investment in new knowledge. The formal activity is a course of study at a university or college; a professional development seminar or course like those offered by APEGGA at the Annual Conference and other times during the year; attendance in a course or field trip associated with a convention or technical conference like the annual Geoscience Convention sponsored by the Canadian Society of Petroleum Geologists, the Canadian Society of Exploration Geophysicists, and the Canadian Well Logging Society. These activities are worth 1 PDH per hour of attendance and if the sponsor of the course has qualified to grant Continuing Education Units (CEU), each CEU equals 10 PDH. you can use up to 30 PDH in any given year and carry over any surplus to the next reporting year. Formal activities will include an evaluation process or, if they do not, the activity must be greater than one half day in duration.
Informal Activity – I get many queries regarding informal activities and there seems to be some confusion in the community over how much things like lunch-hour brown-bag presentations, technical luncheons, vendor seminars, technical society, professional
associations or managerial associations, selfdirected study, and meetings where technical and/or professional issues are discussed in an organized forum are worth in PDH. The general rule for these gatherings that normally are less than a half-day in duration is that one activity hour equals 1 PDH. Thus a monthly/ bimonthly CSPG or CSEG technical luncheon or CSPG Division noon presentation will be worth 1 PDH. As per Formal Activities, a total of 30 PDH can be used in any reporting year, with any surplus carried over to the next. Since these activities are the lifeblood of the technical societies, participation is important both for our own professional development and for the continuing health of the sponsoring society.
Participation means participation as a volunteer on civic, APEGGA, technical society, safety or other organization committees, or assistance at events sponsored by one of those bodies. This category includes community service like working at food banks, being a Scout or Guide leader, coaching amateur sports teams, delivering meals to seniors, collecting toys for less privileged children, community league, or home and school association committees and so on. The selection of the activity is at the discretion of the Member. Participation activity hours each count for

1 PDH, to a maximum of 20 in any given reporting year.
Presentations and gaining experience to refine presentation skills that are outside normal work are also PDH earners. Examples would be doing a PowerPoint presentation on a geoscience topic for a community library or museum, presenting a technical paper at a conference or seminar outside work hours, or leading a discussion at a public meeting. One hour of preparation or delivery is worth 1 PDH. Please note that if your topic is really popular and you are able to present the same talk more than once, you can only claim the first presentation for PDH. Once again, the annual maximum number of PDH is 20.
Contributions to Knowledge is the toughest category, but undoubtedly the most rewarding. An example of the type of activity that wins these points is participation on boards or committees that develop standards, codes, and practices. Course development committees for Enform fall into this category, as do CSA and ad hoc APEGGA committees for such activities as development of practice guides and professional practice or industry standards. One hour of committee work yields 1 PDH. Patents are worth 15 PDH upon registration; as are publications in refereed

1961 – 2010
CSPG CLASSIC GOLF TOURNAMENT GOLDEN ANNIVERSARY
Congratulations and thank you to the loyal sponsors and participants for 50 years of dedication, fun and service to the CSPG and the oil and gas industry in Canada.
Congratulations and thank you to the loyal sponsors and participants for 50 years of dedication, fun and service to the CSPG and the oil and gas industry in Canada.
In 1961, Canada was 94 years old, the Canadian Red Ensign was the nation’s flag and the Honorable John Diefenbaker was Prime Minister of Canada. The Transatlantic telephone system was officially launched and Wayne Gretzky was born. The 1961 Chevrolet Impala SS 409 was the first muscle car. The nominal crude oil price remained at $3.00US per barrel through 1961 after OPEC formation in 1960.
1961 also experienced the origin of a very special event – the first CSPG Golf Tournament in Calgary with Bruce Bailey as acting tournament chairman. Since that inaugural event the CSPG golf tournament grew into the annual 3-day golf-networking social for geologists, geophysicists and industry service providers. It became the coveted industry golf tournament to be a participant and not uncommon to be placed on a two-year waiting list!
current business and play trends of the day.


and register early at http://www.cspg.org/ events/events-social-classicgolf.cfm
In a time-warp summary, participants have experienced the discoveries of Mitsue, Pembina Nisku, Elmworth Deep Basin, Sable Island on the East Coast, Drake Point in the Arctic, oil sands development, the recent unconventional resource plays, and the list goes on. The oil and gas industry has seen boom and bust times, survived price fluctuations and challenges as well as shifts in the geo-political markets. Mind you, not all of us have seen them all, but the connection of past participants and newcomers in this setting makes the double bogey seem less stressful. The CSPG Classic extends our sincere appreciation to all the participants and sponsors that have made this tournament the quality tradition it has evolved into over the past 50 years.


Within the past 50 years, geologists and service partners have met annually at the CSPG golf tournament and shared the

On June 16, 17 & 18, 2010, at the Elbow Springs Golf Club in Calgary, the CSPG proudly celebrates the 50th Annual CSPG Classic Golf Tournament.
Be part of this milestone industry tradition

The 50th anniversary tournament includes three rounds of golf with power carts, oncourse sponsor tents with refreshments and food, three evening dinners, Friday breakfast with the awards banquet and dance on Friday evening. Participants will also receive a commemorative 50th anniversary wind jacket.
The tournament features $10,000 in prizes and draws including two vacation trips, BBQ, daily hole and skill prizes. Visit the photo gallery from last year’s event at http://picasaweb.google.ca/foonder/ CSPG_Classic_2009_Candid#
The CSPG Classic welcomes charity partner “Agapé Hospice” who will benefit from special events held during the tournament.
Mike LaBerge Chairman CSPG Classic Golf Committee


The Canadian Society of Petroleum Geologists annually presents a variety of awards to recognize technical achievements and excellence in volunteerism. The 2009 CSPG awards will be presented at the 2010 Awards Ceremony on Monday, May 10th, 2010 from 6:00pm to 7:30pm, and will be held at the Boyce Theatre on the Calgary Stampede Grounds. The event takes place in conjunction with the GeoCanada 2010 Convention and is open to the public, whether one is registered for the convention or not. Please join us to honour the volunteer contributions and technical excellence of your fellow CSPG members.
Presentations of the following awards will be made:
President’s Special Recognition Award
Gordon Williams
Stanley Slipper Gold Medal
Michael L. Rose
R.J.W. Douglas Medal
Dr. James Dixon
President’s Award
Tony Cadrin
Link Award
Jon Noad
Honourary Membership
*To be awarded at the 2010 Long-Time Members Reception*
Ashton Embry
John Maher
Rick young
Medal of Merit
Daniel J.K. Ross
R. Marc Bustin
H.M. Hunter Award
Peter Harrington
Peter Hay
Tracks Award
Norbert Alwast
Astrid Arts
Michael Cecile
Travis Hobbs
Ben McKenzie
Chris Seibel
Service and Volunteer Awards
For a listing of recipients please see the following webpage: http://www.cspg.org/ about/awards.cfm
We will also recognize our Technical Luncheon and Technical Division speakers, Short Course Instructors, Field Seminar Leaders and Honourary Address Speaker at this event.
(...Strategic
scientific or technical journals. Theses earn 30 PDH, if you wish to enter them in this category rather than as Professional Practice. Books are worth 60 PDH upon publication. All other publications (like this one) are worth 10 PDH as are external reviews of other people’s manuscripts. Editing papers for publication are valued at 1 PDH per hour of editing.
Like tax returns, CPD returns document the hours committed to becoming a better informed geoscientist. It is important that you review the CPD Program manual occasionally to ensure you fully understand what is required, as it is updated from time to time like all manuals and guides.
Upon completion of the first three elements of a business plan, you really have a strategy to follow. you are thinking in strategic terms that will allow a focussed approach to building a viable action plan that takes you out of the realm of merely listing a set of New year’s resolutions to be forgotten by March and into the universe of possibilities for personal growth.
In another article, I will examine how to develop a professional marketing plan for your services, whether you are a lone wolf consultant or a staff geologist for a large corporation.
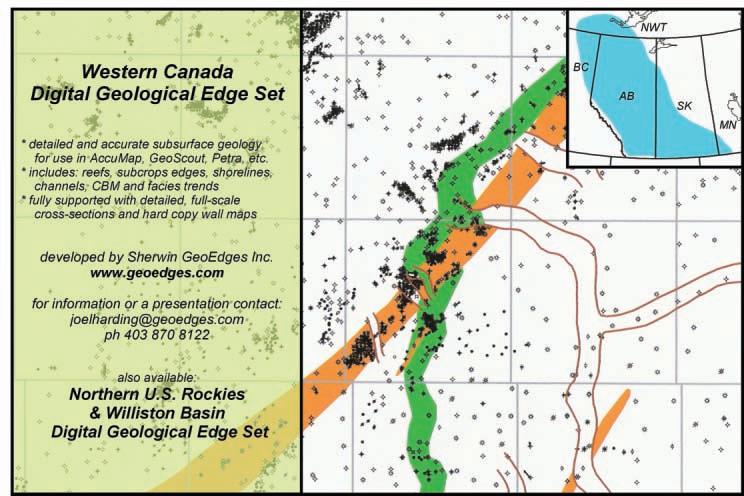
Need a solution that will take you to oil faster?

Introducing the DecisionSpace® Desktop unified workspace
Now your entire asset team can collaborate in real time using one unified workspace.
Accelerate analysis and interpretation by sharing a common subsurface framework. Reduce cycle time and improve accuracy by examining more scenarios faster.
Improve your returns in the field and in the office with industry-leading science and unmatched usability. Learn more at Halliburton.com/decisionspacedesktop.
High Science Simplifiedsm

THANK YOU. Without your input and support, we wouldn’t be