Define Reservoir Parameters with Confidence
Looking to maximize opportunities in today’s volatile market?
Combine the power of PETRA® and IHS Critical Information including well and log data to define reservoir parameters and determine new opportunities faster and more cost effectively.
Let IHS information solutions improve your decision-making and reduce your risk.
For more information on PETRA visit us at www.ihs.com/reservoirsolutions


CSPG OFFICE
#600, 640 - 8th Avenue SW Calgary, Alberta, Canada T2P 1G7
Tel: 403-264-5610 Fax: 403-264-5898
Web: www.cspg.org
Office hours: Monday to Friday, 8:30am to 4:00pm
Executive Director: Lis Bjeld
Email: lis.bjeld@cspg.org
Communications & Public Affairs: Heather Tyminski
Email: heather.tyminski@cspg.org
Corporate Relations Coordinator: Alyssa Middleton
Email: alyssa.middleton@cspg.org
Membership Services: Dayna Rhoads
Email: dayna.rhoads@cspg.org
Reception: Kasandra Klein
Email: reception@cspg.org
Joint Annual Convention Committee
Convention Manager: Shauna Carson
Email: scarson@geoconvention.org
Convention Coordinator: Tanya Santry
Email: tsantry@geoconvention.org
EDITORS/AUTHORS
Please submit RESERVOIR articles to the CSPG office. Submission deadline is the 23rd day of the month, two months prior to issue date. (e.g., January 23 for the March issue).
To publish an article, the CSPG requires digital copies of the document. Text should be in Microsoft Word format and illustrations should be in TIFF format at 300 dpi., at final size. For additional information on manuscript preparation, refer to the Guidelines for Authors published in the CSPG Bulletin or contact the editor.
Technical Editors
Ben McKenzie Colin Yeo (Assistant Tech. Editor) Tarheel Exploration EnCana Corporation Tel: 403-277-4496 Tel: 403-645-7724 Email: bjmck@telusplanet.net Email: colin.yeo@encana.com
Coordinating Editor
Heather Tyminski
Comunications and Public Affairs, CSPG Tel: 403-513-1227, Email: heather.tyminski@cspg.org
ADVERTISING
Advertising inquiries should be directed to Alyssa Middleton, Tel: 403-513-1233, email: alyssa.middleton@cspg.org. The deadline to reserve advertising space is the 23rd day of the month, two months prior to issue date.
The RESERVOIR is published 11 times per year by the Canadian Society of Petroleum Geologists. This includes a combined issue for the months of July and August. The purpose of the RESERVOIR is to publicize the Society’s many activities and to promote the geosciences. We look for both technical and non-technical material to publish. The RESERVOIR is not intended to be a formal, peer-reviewed publication. Additional information on the RESERVOIR’s guidelines can be found in the May 2008 issue (p.46-48; available at http://www.cspg.org/publications/reservoir/reservoir-archive-2008.cfm).
No official endorsement or sponsorship by the CSPG is implied for any advertisement, insert, or article that appears in the Reservoir unless otherwise noted. The contents of this publication may not be reproduced either in part or in full without the consent of the publisher.
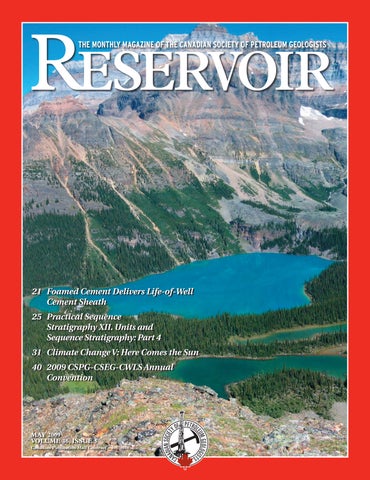
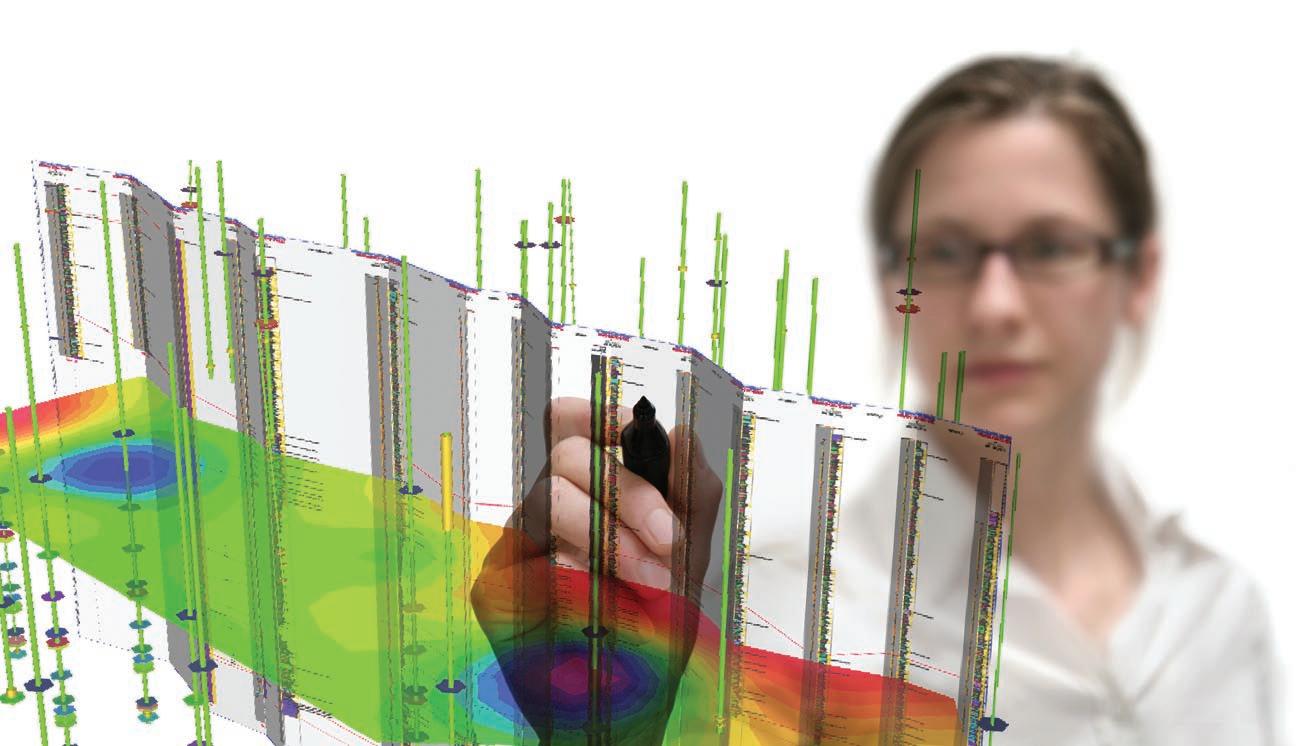
FRONT COVER
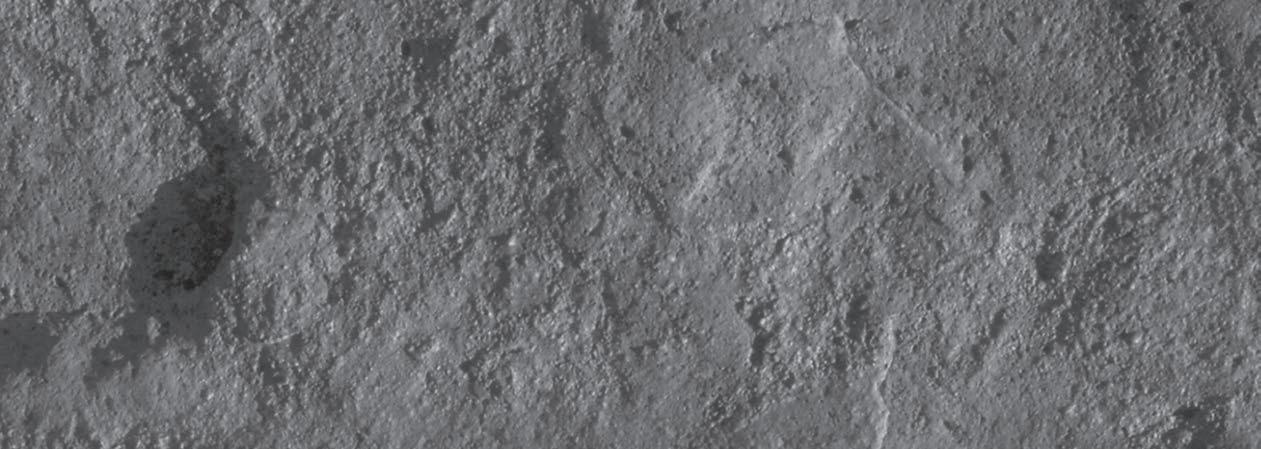
Best Canadian Photo. Lake O’Hara, British Columbia. Resistant dark gray
Lower Cambrian Gog Formation quartzite is overlain by Middle Cambrian platformal carbonates and shales along the continental divide. Photo by Glen Stockmal.

Proudly brought to you by Professionals in Geoscience and Engineering
Alberta’s Professional Geoscientists and Engineers provide Albertans with many of the essentials of daily living. The work that they do allows all of us to enjoy warmth, light, power, water and the ability to travel and communicate over distance.
Since 1920, Members of APEGGA, The Association of Professional Engineers, Geologists and Geophysicists of Alberta, have made a difference in the daily lives of millions of Albertans by bringing science and innovation to life.
The P.Geol., P.Geoph., P.Eng., and R.P.T. professional designations represent the highest standards of quality, professionalism and ethics in geoscience and engineering. APEGGA Members can take pride in the role they play and the contribution they make to Alberta.
APEGGA and its 54,000 Members are committed to public safety and well-being through the self-regulation of the geoscience and engineering professions in Alberta.
Visit www.apegga.org for more information.
Geologists Geophysicists Engineers

CSPG EXECUTIVE
President
Graeme Bloy • Canada Capital Energy Corporation gbloy@capitalenergy.ca Tel: (403) 975-5784
Vice President
John Varsek • EnCana Corporation john.varsek@encana.com Tel: (403) 645-2000
Past President
Lisa Griffith • Griffith Geoconsulting lgriffith@griffithgeoconsulting.com Tel: (403) 669-7494
Finance director
David Garner • Chevron Canada Resources davidgarner@chevron.com Tel: (403) 234-5875
assistant Finance director
Greg Lynch • Shell Canada Ltd. greg.lynch@shell.com Tel: (403) 691-3111
Program director
Randy Rice • Suncor Energy Inc. rjrice@suncor.com Tel: (403) 205-6723
assistant Program director
Scott Leroux • EnCana Corporation scott.leroux@EnCana.com Tel: (403) 645-2000
serVices director
Ayaz Gulamhussein • NuVista Energy Ltd. ayaz.gulamhussein@nuvistaenergy.com Tel: (403) 538-8510
assistant serVice director
Penny Colton • Geophysical Service Inc. pcolton@geophysicalservice.com Tel: (403) 514-6267
outreach director
Mike DesRoches • Talisman Energy Inc. mdesroches@talisman-energy.com Tel: (403) 513-6843
communications director
Peggy Hodgkins • CGGVeritas peggy.hodgkins@cggveritas.com Tel: (403) 266-3225
EXECUTIVE COMMENT
A message from the Services Director, Ayaz Gulamhussein
What do you want?
In mid-2008, the world’s economy entered into a state of flux. A global economy that was roaring along only six months prior, began to crumble as leading indicators pointed towards a looming financial crisis. On a macro-economic scale, governments began acting rapidly in an effort to reverse contracting growth. On a micro-economic scale, individuals began to reevaluate their priorities and resource allocations.
As an individual’s priorities and needs change, the institutions that support them must change as well.
Professional associations have the responsibility to adjust their focus, based on the dynamic attitudes, concerns, needs, and priorities of the groups which they serve. The Canadian Society of Petroleum Geologists is no exception.
In 2004, CSPG ran a seventy-question survey, which collected information about the membership. The survey gathered demographic data, in addition to specific information regarding the members’ overall satisfaction with the services provided by the Society. Members were also asked to consider the direction that they wanted to see the Society take. The data collected in 2004, was used by the Executive at the time, to build a comprehensive go-forward plan for the Society.
Over the past four years, CSPG primarily focused on improving the Reservoir, the Bulletin of Canadian Petroleum Geology, Technical Luncheons, Conventions, the Core Conference, and Continuing Education. The focus on these services was in direct response to what the membership said they valued most.
As our profession and professional activities rapidly evolve, CSPG’s Executive understands that the needs of its members are also changing at a similar pace. For this reason, we have unveiled a new membership survey for 2009.
The overarching objective for this exercise is
to align the direction of the Society with the needs of the membership. The new survey will allow us to gauge the membership’s overall satisfaction with the Society, in addition to helping us identify general expectations and key shortcomings.
We attempted to make the new survey both clear and comprehensive. As we value your time, the survey has been designed to take no more than 15 minutes. The survey comprises of both demographic questions and core questions. This will allow us to use the data for analytic segmentation. Individual responses will be confidential.
The CSPG membership survey opens on May 1st, 2009, and will remain open until May 31st, 2009. Shortly after the survey closes, the collective responses will be analyzed. Once the analysis has been conducted, the Executive will report the findings back to the membership through the Reservoir and CSPG website.
For the CSPG Executive to have a high level of confidence in the survey results, we require a strong participation rate from the membership. Statistically speaking, a confidence level can be estimated from the survey. This will also be communicated back to the membership.
We are at a very pivotal time in the history of the CSPG. as our industry restructures. We must decide on what the future image of our Society will be. We need to decide what advocacy roles, if any, the CSPG could play. We need to determine whether the membership places greater value on tangible services, or intangible ones. The types of courses the Society should offer, and content expected, must also be discovered. The 2009 survey findings will support factbased organizational decisions, and assist the Society towards the goal of achieving its organizational mission. Engaging our membership in a regular and consistent dialogue to gather real information, can only dramatically and positively affect our future success.


CORPORATE MEMBERS
APACHE CANADA LTD.
BAKER ATLAS
CONOCOPHILLIPS CANADA LIMITED
DEVON CANADA CORPORATION
ENERPLUS RESOURCES TRUST
geoLOGIC systems ltd.
GEOMODELING TECHNOLOGY CORP.
HUNT OIL COMPANY OF CANADA,
HUSKY ENERGY INC.
IHS
IMPERIAL OIL RESOURCES
LARIO OIL & GAS COMPANY
LITTLE ROCK DOCUMENT SERVICES
MJ SYSTEMS
MURPHY OIL COMPANY
NEXEN INC
PENN WEST PETROLEUM LTD.
PETRO-CANADA OIL AND GAS
PETROCRAFT PRODUCTS LTD.
PROVIDENT ENERGY LTD
RPS ENERGY CANADA LTD.
SHELL CANADA LIMITED
SPROULE ASSOCIATES LIMITED
SUNCOR ENERGY INC
TALISMAN ENERGY INC
TECK COMINCO LIMITED
TOTAL E&P CANADA LIMITED
TOURMALINE OIL CORP
AS OF MARCH 29, 2009
CSPG ON-L INE I NDEX TO PUBLICATIONS
| by Peter Hay, Publication Index Chair
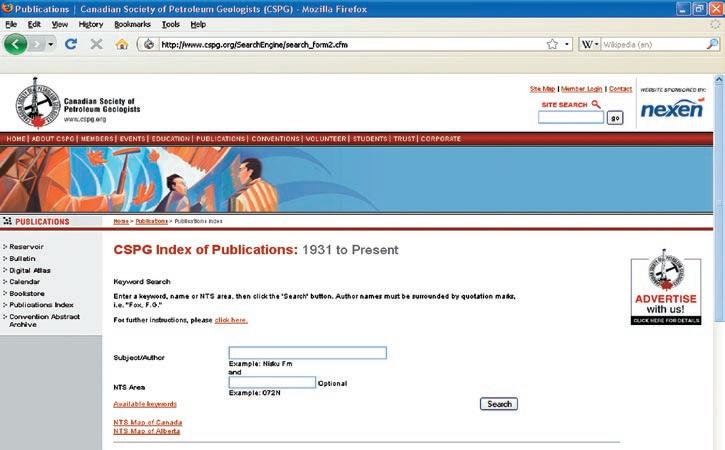
The CSPG Publications Index contains references to all CSPG publications, as well as those of the predecessor Alberta Society of Petroleum Geologists, and the Saskatchewan Geologic Society and the
Edmonton Geologic Society. Approximately 5,000 papers are included, including all Bulletin of Petroleum Geology and Journal papers, Memoirs, Guidebooks, Devonian (Continued on page 44...)
Reservoir Characterization
Expertise in heavy oil & deep basin reservoirs
• AVO / LMR Analysis
• Neural Network Analysis
• PP & PS Registration
• Joint PP & PS Inversion
• Fracture Detection Analysis using Azimuthal AVO
• Spectral Decomposition
Time Lapse Analysis
Carmen Dumitrescu P.Geoph., M.Sc., Manager, Reservoir Geophysics
Direct: 403-260-6588 Main: 403-237-7711 www.sensorgeo.com
technicaL Luncheons MAY LuNCHEON
Earth’s greatest extinction and how to survive it
SPEAKER
Charles Henderson University of Calgary
CO -AUTHOR
Tyler Beatty University of Calgary
11:30 am
thursday, m ay 14, 2009 telus convention centre calgary, a lberta
Please note: the cut-off date for ticket sales is 1:00 pm, monday, may 11, 2009. csPg member ticket Price: $38.00 + gst. non- member ticket Price: $45.00 + gst
Due to the recent popularity of talks, we strongly suggest purchasing tickets early, as we cannot guarantee seats will be available on the cut-off date.
Did you know that you can book a table for the Technical Luncheon? To book your table, or to buy individual tickets, visit www.cspg.org or call CSPG’s office at (403) 264-5610.
Earth’s greatest mass extinction 252.2 million years ago was expressed in subtle
KEEPING TRACK
Claus Sitzler from Duvernay Oil. Corp, Manager North East BC to Consulting Geologist
$ 65 per ticket, $585 per table www.friendsofscience.org
ways and the events and aftermath are both paleogeographically and paleoenvironmentally variable. Owing to this variability, a biostratigraphic framework is necessary to ensure proper global calibration of the extinction pattern. The base and top of the last stage of the Permian (Changhsingian) are defined at Meishan, South China and the intervening Changxing Limestone contains a diverse record of tropical biota until within centimetres of the top, when 90% of biodiversity is lost.
On the other side of the Panthalassic Ocean, at Opal Creek in Kananaskis Country, Late Permian biodiversity was reduced over an extended period, but a sudden extinction is still recorded. These very different sites can be correlated by carbon isotopic excursions and conodonts.
Finding a discrete extinction mechanism in these very different rocks is difficult and an understanding of ancient oceanographic conditions drawn from geochemical and paleontological evidence is critical. However, the primary agent may have started on the land’s surface in Siberia with the outpouring and CO2 degassing of massive amounts of lava that also ignited older coal beds. This provided more CO2 increase, leading to a runaway greenhouse, rapid global warming, and a cascade of ecologic crises. Warmer oceans dissolve less oxygen and show reduced circulation leading to dysoxic conditions and eventually euxinic conditions that upwelled and spread across shallow shelves as indicated by biomarker evidence of green-sulfur bacteria in shallowwater deposits.
But where on this hot, suffocating, and smelly Earth did life survive this calamity? It turns out that ancient shores around Western and Arctic Canada provided one such refuge that Beatty et al. (Oct. 2008; Geology) named “the habitable zone.” In contrast to the Tethys and southwestern Panthalassic oceans, the Early Triassic trace fossil record from the northwest margin of Pangea provides numerous examples of rapid recovery, but only within a narrow set of paleoenvironmental conditions.
(lower shoreface to offshore transition, and isolated event beds in offshore settings). Within environments distal of the offshore transition, ichnofossil diversity is greatly diminished. The habitable zone hypothesis provides a model for the distribution of these refuges, in which wave aeration, enhanced by frequent storms, gave rise to an optimal zone for benthic colonization.
Subsequent biodiversity increase in the Triassic provided the shells that would be concentrated into bioclastic hydrocarbon reservoirs in the mid-Montney and Halfway formations. Comparisons to biodiversity loss and greenhouse warming in today’s world cannot be ignored.
BIOGRAPH y
Charles Henderson, P.Geol. is a Professor at the University of Calgary where he has been teaching stratigraphy and paleobiology for 20 years following his Ph.D. at the University of Calgary in December 1988. He worked with Esso Resources in the early 1980s after his B.Sc. and M.Sc. at University of British Columbia. His research focuses on conodont paleobiology and biostratigraphy and integrating conodonts with other stratigraphic datasets. The research of many of his former and current students has been focused on stratigraphic studies in Western and Arctic Canada that are applicable to the oil industry, whose support is gratefully acknowledged.
Henderson is the Chairman of the Subcommission on Permian Stratigraphy of the International Commission on Stratigraphy and his research is focused on events recorded in Permian rocks around the world.
Tyler Beatty is a geoscientist with Imperial Oil. He graduated from the University of Western Ontario in 1997 with a B.Sc. in Geology and Environmental Science and from Simon Fraser University in 2003 with a M.Sc. in Geology. He is a Ph.D. candidate in the Department of Geoscience, University of Calgary. His research interests are centred on Late Paleozoic and Triassic conodonts and trace fossils.
Race Resource Consulting Inc. Calgary (403)720-3799 or csitzler@telus.net
Ticket can be obtained by email (Visa/MC accepted): contact@friendsofscience.org
Payment can also be made by cheque to: Friends of Science
PO Box 23167 Connaught P.O., Calgary, AB T2S 3B1
In these locations anomalously diverse ichnofossil assemblages from shoreface environments provide evidence of oxygenated refuges for benthic marine organisms. Within these refuges, peak ichnofossil diversity and bioturbation intensity are associated with a narrow range of sedimentary environments,
technicaL Luncheons MAY LuNCHEON
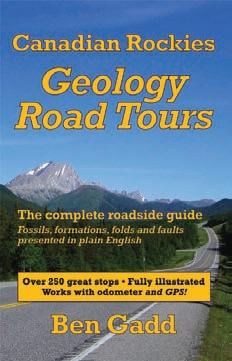
Geology rocks! The making of Canadian Rockies Geology Road Tours
SPEAKER
Ben Gadd
11:30 am thursday, m ay 21, 2009 telus convention centre calgary, a lberta
Please note:
the cut-off date for ticket sales is 1:00 pm, Friday, may 15, 2009.
csPg member ticket Price: $38.00 + gst. non- member ticket Price: $45.00 + gst.
Due to the recent popularity of talks, we strongly suggest purchasing tickets early, as we cannot guarantee seats will be available on the cut-off date.
Did you know that you can book a table for the Technical Luncheons? To book your company’s table, or to buy individual tickets, visit www.cspg.org or call CSPG’s office at (403) 264-5610.
Having written the very popular Handbook of the Canadian Rockie s, Ben Gadd wanted to follow up with a short, easy-to-read geological guide to what one sees along the TransCanada Highway between Calgary and Golden, plus a few other major routes across the Canadian Rockies. The book was planned to total about 200 pages, including a number of annotated photos.
Five hundred and seventy-six pages later, Gadd was finished, and the result has been described as “monumental.” The book includes over 500 illustrations. It details the geology of every all-weather road across the Rockies from Crowsnest Pass to the Alaska Highway. The Icefields Parkway is also covered, as is the Kananaskis Trail and its continuation through the southern foothills, plus the route southward to Waterton.
Geology Rocks is a half-hour slide talk Gadd has prepared about the origins of this book. It is also about his long, awardwinning career as a geologist, naturalist, writer, and educator. Gadd’s earth-science
education was unique. In the talk we find out why University of Calgary professor Ed Klovan has jokingly referred to Gadd as “our most successful failure.”
Canadian Rockies Geology Road Tours was launched to great praise at the Geological Survey of Canada in Calgary on November 4, 2008. Before and after the upcoming talk, copies will be available for purchase, and Gadd will be happy to inscribe.
BIOGRAPH y
Ben Gadd, 62, has lived in Jasper, Alberta since 1980. The author of Handbook of the Canadian Rockies, which has sold over 50,000 copies, Gadd has written or co-authored eight other books and contributed to several more. His first novel, Raven’s End, has become an awardwinning Canadian best-seller. It has also has been translated into German, Italian, Dutch, and Danish for sale in Europe, and also into Japanese.
Gadd has received three Banff Mountain Book Festival awards.
Gadd is a recognized authority on the Rocky Mountains. Educated as a geologist, he has pursued a career in natural history, working in the summer as a freelance interpretive guide in Jasper National Park – a job he describes as “rent-a-naturalist” – and in the winter as a writer and lecturer on Rockies topics. He also teaches writing courses for Grant MacEwan College.
A member of several conservation groups, Gadd advocates for the mountain national parks, attending hearings, making representations on park-protection issues, and speaking up publicly as required. Gadd is the founder of the nonprofit Jasper Institute, which offers naturalhistory courses to park visitors. He designs nature trails, produces interpretive signage, and consults with protected-area managers. Heard frequently on CBC radio, he has also appeared in many television programs and several documentaries on the Rockies.
When not otherwise occupied, Gadd hikes, bikes, climbs, and cross-country skis in the mountains he loves best. Married over forty years, he and Cia have two adult sons.
Canadian Rockies Geology Road Tours
Ben Gadd
technicaL Luncheons JuNE LuNCHEON
Synchrotron light in the Earth Sciences: applications to the petroleum geosciences
SPEAKER
Jeff Cutler
Canadian Light Source Inc.
University of Saskatchewan, Saskatoon, SK
11:30 am thursday, June 11, 2009 telus convention centre calgary, a lberta
Please note: the cut-off date for ticket sales is 1:00 pm, monday, June 8, 2009. csPg member ticket Price: $38.00 + gst. non- member ticket Price: $45.00 + gst
Due to the recent popularity of talks, we strongly suggest purchasing tickets early, as we cannot guarantee seats will be available on the cut-off date.
Did you know that you can book a table for the Technical Luncheon? To book your table, or to buy individual tickets, visit www.cspg.org or call CSPG’s office at (403) 264-5610.
As applied research moves into the 21st century, scientists are discovering that traditional analytical techniques are not answering all of their questions. For example, new materials are being developed daily that may have significantly different properties but are chemical indistinguishable using current analysis techniques. It is important for researchers to understand

these differences and be able to go back to the laboratory and impart those unique properties to new products or processes. Therefore, today, scientists are turning to new tools to shed light on old and new questions. One such tool is synchrotron light-based analysis, which is now being seen as the enabling technology that will help answer many of these difficult questions.
In particular, application of synchrotron light in the earth sciences has proved to be extremely beneficial for physical, mineralogical, and chemical characterization of complex geologic systems such as:
• micron-scale, crystalline intergrowths;
• elements (S, N) and phases (CH 4 , CO2 ) in geomacromolecules (kerogen, asphaltenes) and fluid inclusions; and
• neoformed low-temperature, semiamorphous minerals.
Primarily, these involve application of
synchrotron light in the areas of X-Ray Diffraction (S-XRD), X-Ray Absorption Spectroscopy (XANES/XAFS), X-Ray Fluorescence (S-XRF), and Computed Micro-Tomography (S-CMT).
The Canadian Light Source (CLS), a 2.9 GeV synchrotron facility located at the University of Saskatchewan, is a multifaceted research tool where intense beams of light are generated to help probe the nature and structure of matter. Opened in October 2004, this centre is in routine operation (24 hours a day / 5 days a week) with users, both academic and industrial, coming to Saskatoon from around the world. Twenty-two beamlines (with very heavy involvement from the Canadian scientific communities) are now in various stages of operation, commissioning, construction, and planning. These beamlines and associated endstations will be extremely useful for research in the petroleum geosciences – using infrared spectroscopy and spectromicroscopy, soft and hard x-ray imaging, μ-XAFS, single crystal diffraction, and small and wide angle scattering. This presentation will report on the current status of the Canadian Light Source and some insight into the future of the facility.
BIOGRAPH y
Jeffrey Cutler is the Director of Industrial Science at Canadian Light Source Inc. and an adjunct professor in the Department of Chemistry at the University of Saskatchewan. Through his various roles at the CLS, Dr. Cutler is building the overall scientific program at the synchrotron by introducing industry to the power of synchrotron light as an R&D tool.
Dr. Cutler received his Ph.D. from the University of Western Ontario, Canada in physical inorganic chemistry and prior to coming to the Canadian Light Source, spent several years working for the United States Air Force as a research scientist.
In 1981, Dr. Cutler was presented the Gold award of the Duke of Edinburgh’s award by His Royal Highness Prince Phillip.
Canadian Light Source Inc. (CLSI) operates the Canadian Light Source, Canada’s national synchrotron research facility. Located at the University of Saskatchewan in Saskatoon, the CLS is a world-class, state-of-the-art facility that is advancing Canadian science, enhancing the competitiveness of Canadian industry, and contributing to the quality of life of people around the world.
technicaL Luncheons JuNE LuNCHEON
The sedimentology of ancient mangroves: swamped with hydrocarbon potential
SPEAKER
Jon Noad Shell Canada
11:30 am thursday, June 18, 2009 telus convention centre calgary, a lberta
Please note:
the cut-off date for ticket sales is 1:00 pm, monday, June 15, 2009. csPg member ticket Price: $38.00 + gst non- member ticket Price: $45.00 + gst
Due to the recent popularity of talks, we strongly suggest purchasing tickets early, as we cannot guarantee seats will be available on the cut-off date.
Did you know that you can book a table for the Technical Luncheons? To book your company’s table, or to buy individual tickets, visit www.cspg.org or call CSPG’s office at (403) 264-5610.
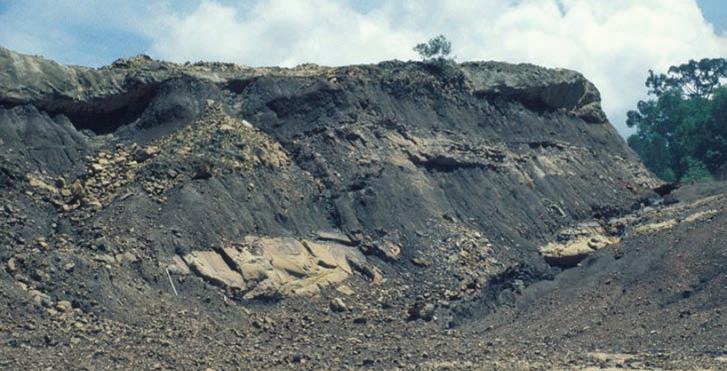
Fossil mangrove deposits have received relatively little attention in the published literature, despite their significant potential as hydrocarbon-prone source rocks. Recent fieldwork examining both ancient and modern deposits suggests that mangroves may also host significant oil deposits. Fossil mangroves can be classified as either humid or arid mangroves. The former are clastic in character, comprising shales encasing both channelised and sheet-like sandstones. Detailed sedimentological analysis of Miocene coastal clastic deposits in the Sandakan region of eastern Borneo has identified several well preserved mangrove systems, and enabled the development of new criteria enabling the recognition of these facies in other locations. Ancient arid, or carbonate mangroves, were studied in Mallorca.
Unpublished data from Brunei suggests that mangrove mudstones may provide a significant
source of oil, sourced mainly from the waxy cuticles of mangal species. Using analogue data to give an indication of the lateral extent of the fossil mangrove sandbodies, plays can be developed invoking stratigraphic traps sourced from the associated organic-rich mudstone deposits. Both arid (carbonate) and humid (clastic) fossil mangroves show great potential as self-sourcing hydrocarbon reservoirs, and may indeed already be producing oil from misidentified or unrecognised ancient mangroves.
Several morphologically distinct sandbody classes within the successions from Borneo have been assigned to channel and intermangrove broads, based on analogues from both the Everglades of Florida and modern Bornean mangroves. The channelised sandstones have extremely steep banks and appear to accrete vertically, thought to be due to the constraining mangrove
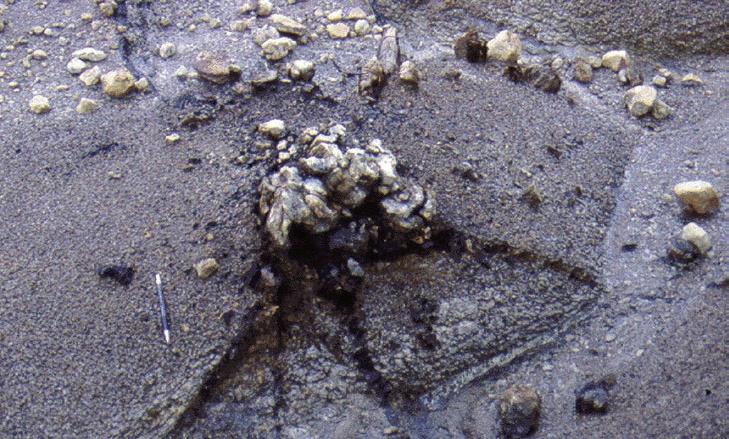
root systems. The sheet-like sandstones are massive with rare rooted intervals, and are interpreted as shallow extensive broads, open areas within the mangrove system. All of these sandbodies are potential reservoirs. A variety of beautifully preserved plant and animal fossils support these interpretations.
Arid mangrove systems share some of the features of clastic mangrove systems, but are dominantly carbonate in character. Interpreted mangrove deposits from the Miocene of eastern Mallorca, Spain were studied by Coppes (unpublished M.Sc. thesis, Delft University, 2005), who recorded a variety of limestone beds encased in carbonate muds. These are typically heavily rooted, with fenestra and an absence of large channels. Well developed soil horizons form key marker beds within the stratigraphy. They are commonly associated with reefal and (Continued on page 12...)
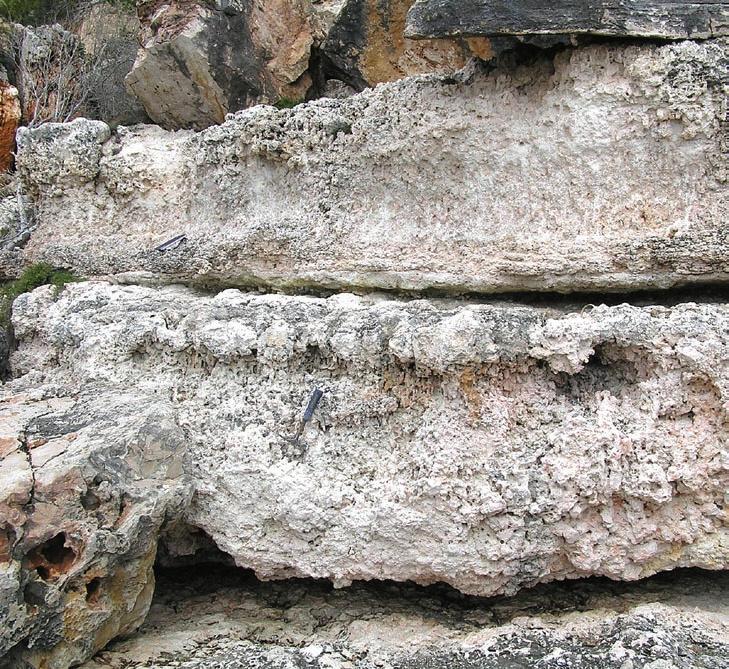
Series of steep-sided mangrove channels, incised into mudstones bearing rooted trees, from eastern Borneo.
Rooted mangrove tree, from eastern Borneo.
tidally influenced, stromatolitic carbonates. Coppes created a three-dimensional reservoir model of these high vertical permeability deposits in Petrel and simulated production from fossil mangroves at a scale previously unrecorded, with impressive results which will be presented here.
BIOGRAPH y
Jon Noad works for Shell Canada as an exploration geologist in basin-centred gas. He began his career in gold and platinum mining in South Africa after graduating in 1985 from Imperial College, London. Returning to the UK he joined British Telecom as their first marine geologist, responsible for routing and burial of international subsea telecommunications cables. He also completed a Masters in Sedimentology at evening classes, with a thesis project based in Dinosaur Provincial Park here in Alberta, leading on to a full time Ph.D. at University College London. There he worked on the sedimentary evolution of eastern Borneo, kindling a lifetime interest in fossil mangroves. He joined Shell in 1998, based in Holland, and worked mainly on Middle Eastern exploration before moving to Canada in 2006. He also taught at Delft University for two years half time. Jon is currently President of the British Sedimentological Research Group.
Our client Penn West Energy, one of Canada’s largest conventional oil and gas income trusts with a diverse mix of hydrocarbon assets throughout the WCB, requires the expertise and guidance of an energetic prospect generator for its new role of
CHIEF GEOLOGIST
Working closely with the exploration and development management team, the sought after Geologist’s primary goal will be to assist in the development of an inventory of new opportunities throughout the Company’s extensive land base, as well as supporting existing exploitation and drilling operations. Technically proficient and familiar with basin assessment, risk management and play and prospect development techniques, the selected Geologist’s background will ideally include a broad range of geoscience expertise including hydrocarbon systems analysis, sequence stratigraphy, carbonate sedimentology, seismic interpretation, reservoir characterization, workstations and an expertise with a host of exploration and economic analysis software packages (PETRA, PETRAL, GEOSCOUT and MOSAIC).
A professional Geologist with 15 or more years of suc cessful exploration and exploitation experience, the preferred candidate will possess the interpersonal, communication and leadership qualities that will permit him/her to guide and influence the technical evaluation and assessment of new project initiatives. Ultimately, the Chief Geologist will play an active role in ensuring that all of the Company’s geotechnical professionals are working to their full potential by scheduling their access to the most relevant training, succession planning and ca re er dev el op me nt p rog ra ms an d i nitiatives available. Pos s es s ing a plea s ant, enthusiastic and mature personality, the ideal candidate will be recognized as being the ultimate “mentor” through their ability to provide ongoing technical leadership within land strategy and technical evaluation meetings, all with the goal of assisting the geological population to maximize corporate performance and returns.
Candidates interested in pursuing this pivotal, technical leadership position are encouraged to respond in complete confidence to Rob Derkitt at 403-266-8800 or by email to rob@rjderkittassociates.com.
Heavily rooted limestone beds, separated by thin, laterally persistent palaeosol horizons, from Mallorca.

Do more exploring collaborating project leading technology leading industry leading subsurface subsea subanywhere smiling geosteering globe-trekking horizontal drilling ecothinking biking team building carbon capturing pushing the envelope groundbreaking digital mapping remote sensing playing creative thinking stress reducing parenting mud logging well logging caring for our environment life balancing family bonding skiing hockey playing initiative grabbing challenging yourself

Fracture anisotropy modeling using borehole images and dipole sonic data: examples from tight gas sandstone reservoirs in the Canadian Foothills
SPEAKER
Patrick Fothergill Schlumberger, Calgary, Canada
CO-AUTHOR
Romain Prioul
Schlumberger-Doll Research, Cambridge, USA
12:00 noon thursday, m ay 7, 2009 room LPW-910, Livingston Place West 250 2 street sW, calgary, a lberta
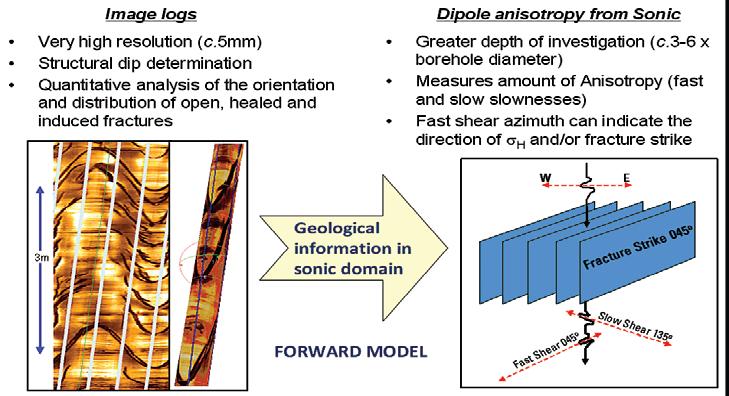
Sandstone reservoirs in the Canadian Foothills often have very low permeabilities (micro-darcy), with gas production rates controlled almost entirely by the presence of open natural fractures. For this reason, it is extremely important to be able to identify, characterize, and quantify fractures in the wellbore, and to understand how they relate to the local structure and the present-day stress field. This work is usually carried out using electrical and/or acoustic borehole images, which provide a high-resolution, oriented picture of the formation near the wellbore (Figure 1). Borehole images can be used to analyze the orientation and density of open and healed fractures, quantify structural and stratigraphic dip, and determine downhole variations in lithofacies. This information can be extremely important for planning completion programs and for developing accurate reservoir models.
However, borehole images have a very shallow depth of investigation. Resistivity images typically read several centimeters into the formation, depending on the resistivity of the rock, and ultrasonic data only provide an image of the borehole wall. This makes it extremely difficult to assess if an open fracture
extends into the formation. Furthermore, using image logs alone to identify natural versus drilling-induced fractures can often be problematic. In western Alberta and northeast British Columbia, the present day maximum horizontal stress direction (NE/ SW) is closely aligned with the strike of one set of natural fractures (often referred to as ‘Type I’ fractures). This means drillinginduced and natural fractures can often have a very similar appearance on the borehole images. These limitations can be overcome by integrating the results of the borehole image interpretation with dipole anisotropy data, measured by modern borehole sonic tools.
Wireline sonic tools measure the dynamic, elastic properties of the formation around the borehole using compressional and shear wave velocities. They have a much greater depth of investigation than the borehole images: typically 3-6 times the diameter of the borehole. In anisotropic formations, crossdipole measurements can be used to record fast- and slow-shear slowness values and azimuths (Figure 1). The amount of slowness anisotropy measured can give an indication of the extent of natural fracturing and / or the difference between maximum and minimum horizontal stress. However, in order to better understand the cause of anisotropy at depth away from the well, it is necessary to integrate the fracture data obtained from the borehole images with the sonic results, using recently developed forward-modeling techniques.
This methodology uses an excess-compliance fracture model that relies on the orientation of the individual fractures and the elastic properties of the host rock. It is a powerful way to transform fracture data from the geological domain into the sonic domain. It enables a
more confident analysis of which fractures are likely to penetrate the formation, and hence give maximum contribution to gas production. In this presentation, examples will be used to show how the technique can be applied to tight-gas reservoirs in western Canada.
BIOGRAPH y
Patrick Fothergill is a Senior Geologist with Schlumberger’s Data and Consulting Services (DCS), here in Calgary. He holds a Ph.D. from the University of London and a B.Sc. from Kingston University, in the UK. He has been with Schlumberger for more than eight years. For the past three years he has worked on borehole image interpretations from structural, unconventional gas, CBM, and heavy oil wells in western Canada. Before coming to Canada, he worked for Schlumberger in Aberdeen, mainly on the geological interpretation of wireline and LWD images, as well as providing well placement support. Prior to joining Schlumberger he worked for three years as a Research Associate with the Ocean Drilling Program (ODP).
Romain Prioul is a Senior Research Scientist and Program Manager with Schlumberger Doll Research (SDR) in Cambridge, Massachusetts. He received a Ph.D. (2000) in Geophysics from the Institut de Physique du Globe de Paris, France. From 1999 to 2000, he also worked as a research and teaching assistant of rock mechanics at the same institute. From 2000 to 2003, he was a Research Scientist at the Schlumberger Cambridge Research, UK, and a Senior Research Scientist at Schlumberger-Doll Research from 2003 to 2005 in Ridgefield, CT, USA and since 2005 in Cambridge, MA, USA. His research interests include fracture and stress characterization from seismic and sonic anisotropy, geomechanics and rock physics, and surface and downhole seismic reservoir monitoring. He is member of SEG and AEGE.
Figure 1. Integration of borehole images and sonic logs for advanced fracture analysis.

Do more
exploring collaborating
project leading technology leading industry leading subsurface subsea subanywhere smiling geosteering globe-trekking horizontal drilling ecothinking playing team building biking creative thinking stress reducing carbon capturing pushing the envelope parenting groundbreaking digital mapping remote sensing rock sampling rock climbing relaxing on the weekends mud logging well logging caring for our environment life balancing family bonding skiing hockey playing initiative grabbing challenging yourself
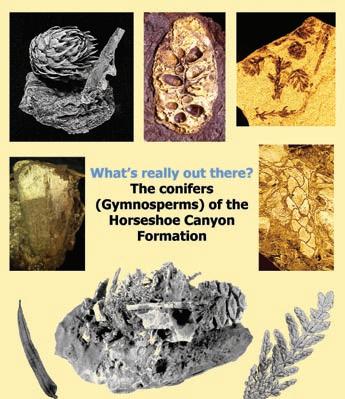
What’s really out there?
The conifers (gymnosperms) of the Horseshoe Canyon Formation
SPEAKER
Kevin Aulenback Drumheller
7:30-9:00 pm Friday, may 8, 2009 mount royal college, room B108 calgary, a lberta
While known for many years, the conifers (gymnosperms) of the Horseshoe Canyon Formation have unfortunately been little studied. The most complete work on the conifers of the formation is incorporated in a broader study of the flora by Bell in “Uppermost Cretaceous and Paleocene floras of western Alberta” (GSC Bulletin 13 published in 1949). Since then only a handful of individual scientific papers have been published (Ramanujam and Stewart, 1969; Muhammad, 1986; Serbet and Stockey, 1991; McIver and Aulenback, 1994; Aulenback and LePage, 1998).
Although not presently being investigated scientifically, many taxa can be identified readily by the interested researcher, student, or collector, or can they? Are there any true Cycads in the formation? What pines can one find? Does Sequoia exist in the Cretaceous? What is Parataxodium and does it have any
ROCK SHOP
evolutionary links to present taxa? Does Taiwania exist in the flora?
Many of the fossil conifers in the Horseshoe Canyon Formation can be found in coeval formations around the world as well as many older formations. Some of the conifers in the formation can even be placed in extant genera. For these reasons, the conifers can be used to identify and offer insights into global environments of the time.
The Horseshoe Canyon Formation conifers are shown and discussed, based on reproductive and vegetative morphology, and compared to both extant and extinct taxa. Many conifers, which have not been previously recorded from the formation, are introduced. New insights and interpretations are given which are startling and will change preconceived notions of morphology and relationships of fossil forms in other formations as well as extant taxa. In the Cretaceous, conifers are not always what they seem.
BIOGRAPH y
Kevin Aulenbach worked as a technician at the provincial museum in 1980 and transferred to Drumheller in 1981 to work as a full-time technician for the Tyrrell museum. His training over the years eventually focused on fine and chemical preparation. He has many accomplishments both in and out of the field in paleovertebrates and paleobotany such as: discovery of the first mammal in the lower Horseshoe Canyon Formation (1984), dinosaur embryos in Devils Coulee (1987), dinosaur nesting sites in the Gobi Desert (1988), monocotyledonous rhizome sites in the Horseshoe Canyon Formation (2000) and Oldman Formation (2002); redesigned and redeveloped the Conservatory in the Tyrrell Museum to represent the fossil record of the Horseshoe Canyon Formation (1996-2001); prepared the bird / dinosaurs Caudipteryx and Protoarchaeopteryx in China (1996, 1997) and Archaeoraptor in Utah with result of identifying composite nature (1999). He also received two recognition awards for service with the department of Alberta Culture (2001, 2003). Kevin quit his employment with the Tyrrell Museum in 2004 and is presently a stay-at-home father of three.
His Interests are in Paleobotany and Photography; he has recently written a book on the fossil flora of the Horseshoe Canyon, which is being published by the University of Calgary.
INFORMATION
This event is jointly presented by the Alberta Palaeontological Society, Mount Royal College, and the CSPG Paleontology Division. For details or to present a talk in the future please contact CSPG Paleo Division Chair Philip Benham at 403-691-3343 or programs@albertapaleo. org. Visit the APS website for confirmation of event times and upcoming speakers: http://www. albertapaleo.org/
diVision taLKs INTERNATIONAL DIVISION
Exploration and development of oil in the fold and thrust belt of northern Cuba
SPEAKER
Gordon Hurlburt, Senior Geologist Sherritt International
12:00 noon
tuesday, m ay 12, 2009 encana a mphitheatre, 2nd Floor e ast end of the calgary tower complex 1st street and 9th avenue s.e . calgary, a lberta
The first oil wells in Cuba were drilled in 1881 in the Motembo Field where production of 56° API oil was obtained from serpentinized ophiolites. A number of oil fields were discovered after Motembo in both igneous and sedimentary rocks as well as additional fields in the serpentinized ophiolites. In 1971, Cubapetroleo (Cupet), the national oil company of Cuba, discovered the Varadero oil field which is the largest field to be found on the island to date.
The majority of oil and gas production in Cuba currently comes from a series of fields in the fold and thrust belt in northern Cuba. Almost all of these fields are found between the capital city of Havana and the tourist centre of Varadero. Most of the reservoirs in the fields are located slightly offshore and are reached by drilling horizontal or directional wells from drilling pads located along the coastline.
Oil production is mainly from fractured deep water Jurassic – Cretaceous Veloz Group carbonates that are trapped structurally due to a Tertiary compressional event that created the fold and thrust belt along the northern coast of Cuba.
The produced oil is typically quite heavy and viscous with oil gravities in the range of 911° API and viscosities in the order of 150 - 200 mPa.s at reservoir conditions. Even with this heavy oil, however, flow rates from many of the directional or horizontal wells are in the order of 300 - 400 m³ oil per day with low water cuts.
In 1992, Sherritt International began exploring and developing oil reserves in the fold and thrust belt of northern Cuba with a re-completion program of oil wells drilled by CUPET in the Varadero, Boca de Jaruco, Perifericos, and Pina fields.
In 1994, Sherritt drilled their first well in Cuba and in 1998 commissioned two custom-designed rigs to be built in Canada specifically for drilling wells in Cuba.
The information from the new wells combined with the existing data helped in the development of an improved geological model of the fold and thrust belt of northern Cuba.
In addition, the geological model was further modified by the re-processing of existing seismic and acquisition of new 2D and 3D seismic surveys. Pre-stack depth migration (PSDM) was later performed on the seismic which greatly improved the geological interpretation and became an essential tool for exploration and development in Cuba.
Since the initial re-completions in 1992, Sherritt International has drilled more than 160 wells in Cuba and has produced more than 160 million barrels of oil.
BIOGRAPH y
Gordon Hurlburt is currently a Senior Geologist with Sherritt International in Calgary. He began working for Sherritt International in 1987 and started becoming involved in Cuba in 1992. Hurlburt received a B.Sc. in Geology from the University of Alberta in 1977 and is a member of the CSPG, AAPG, and APEGGA.
INFORMATION
There is no charge. Please bring your lunch. The facilities for the talk are provided complimentary of EnCana and refreshments by Geochemtech Inc. For further information or if you would like to give a talk, please contact Bob Potter at (403) 863-9738 or ropotter@telusplanet.net or Trent Rehill at (403) 606-6717 or trehill@ kulczykoil.ca.

Have you shot seismic in recent years? If so, have you performed the mandatory regulatory follow up?
Boyd PetroSearch is here to help. We know the rules and have the expertise to clean up any seismic site. Our comprehensive services include: field inspections, documentation and submission.
• Surface Crown Land • Surface Freehold Land • Surveyed Road Allowance
Please call:
Kathy Sloan 403.543.5375
Dani MacLeod 403.543.5384 or visit www.boydpetro.com
New near-surface geophysical applications to the exploration and development of oil sands in
Canada
and the United States
SPEAKER
Paul Bauman, WorleyParsons Komex
12:00 noon, tuesday, m ay 26, 2009 encana a mphitheatre, 2nd Floor e ast end of the calgary tower complex 1st street and 9th avenue se calgary, a lberta

Until recently, near-surface geophysical applications in oil sands development were largely confined to delineating the top of the Devonian carbonates and, in certain cases, directly delineating mineable ore (bitumen) in the McMurray Formation. The types and geographic areas of geophysical utility have expanded widely in recent years. This talk will discuss a wide range of techniques and, more importantly, a wide range of uses. Applications will include routine ore delineation in both mineable and in situ deposits; paleochannel mapping; Clearwater delineation; muskeg thickness mapping; downhole measurements of P-wave and S-wave velocities for the calculation of engineering modulii; steam chamber monitoring; steam breakout monitoring at surface; karst feature delineation; sub-river and sub-lake exploration; and basal aquifer delineation. Examples will largely be taken from the Athabasca Oil Sands, but will also be drawn from other deposits in Canada and the United States.
BIOGRAPH y
Paul Bauman is a Professional Geophysicist and Engineer with over 25 years of engineering geophysics experience in the environmental, water resource, mining, oil and gas, civil engineering, and archaeology sectors. Bauman has a B.Sc. in Geological Engineering from Princeton University, a minor in Near Eastern Studies also from Princeton, and an M.Sc. from the University of Waterloo in hydrogeology. He worked for Schlumberger International from 1981 to 1986 in remote locations in Borneo and Papua New Guinea. In 1990, Bauman created and has since managed the near-surface geophysics group at WorleyParsons. This group numbers about 20 geophysicists, including four permanently stationed in Fort McMurray, and has worked on every continent in the world.
Bauman has lectured at various universities, museums, and research institutions in North and South America, Europe, and the Middle East, on geophysical adventures ranging from water exploration in tsunami-affected areas of Indonesia to searching for Dead Sea Scrolls. Aspects of his archaeo-geophysical work have been the subject of a NOVA documentary (Ancient Refuge in the Holy Land), CBC interviews, and numerous newspaper and magazine articles including in Time and National Geographic.
INFORMATION
BASS Division talks are free. Please bring your lunch. For further information about the division, joining our mailing list, a list of upcoming talks, or if you wish to present a talk or lead a field trip, please contact either Steve Donaldson at 403-645-5534, email: Steve.Donaldson@encana.com or Mark Caplan at 403-532-7701, email: mcaplan@aosc. com or visit our web page at www.cspg.org/events/ divisions/basin-analysis-sequence-strat.cfm.
diVision taLKs ENVIRONMENT DIVISION
The global warming debate from a disinterested viewpoint
SPEAKER
Jerry Osborn Department of Geoscience University of Calgary
12:00 noon Friday, may 29, 2009 aquitaine Building
2nd Floor conference room (+15 Level) 540 – 5th ave sW calgary, a lberta
The global warming debate is polarized to the extent that there is little or no dialogue between pro-AGW and anti-AGW factions, outside of references in journal papers and insults on websites. To some extent each faction mounts its own conferences and publishes peer-reviewed research in its own friendly journals. The debate is complicated by fusion of several questions which are not always separated by debaters (Is it warming? Is warming anthropogenic? If so what should the social response be? If climate is always changing naturally anyway should we attempt to mitigate anthropogenic climate change? Should we worry about potentially calamitous “tipping points” for which there is some, but not robust, evidence?). Scientific and social issues are mixed together to the degree that social / political philosophy influences interpretations of science.
The result is wildly varying views on scientific issues, defensiveness of scientists, cherrypicking of evidence to support points of view, diversions over hockey sticks and oil-company funding, occasional shouting matches at CSPG talks, and immense public confusion.
This talk will offer a brief overview of the state of debate over CO2 -generated warming, from a point of view that is disinterested politically and without vested interests scientifically. A brief look at the excesses of the debate will be followed by a summary of current arguments for and against anthropogenic global warming.
BIOGRAPH y
Gerald (Jerry) Osborn is a Professor of Geology in the Geoscience Department at the University of Calgary. His interests are surficial and Quaternary geology with occasional forays into geomorphology and engineering geology. His main line of research is Holocene climate change using glacial-history and lake-sediment proxies. Consulting activities have included aggregate searches, mass-movements hazards analysis, flood hazard analysis, and river migration as applied to boundary law. Included in the
thousands of students that have passed through his introductory geology classes at University of Calgary are many petroleum geologists working in Calgary.
INFORMATION
All lunch talks are free and open to the public. Please bring your lunch. For information or to present a talk for the Environment Division please contact Andrew Fox at andrewfox@ megenergy.com.
American Association of PETROLEUM GEOLOGISTS Annual Convention & Exhibition


Register today for the 2009 AAPG Annual Convention & Exhibition.


The ACE Technical Program is unmatched with more than 1,000 technical presentations, 22 field trips and 18 short courses.
Head to Denver where you’ll find a wide range of presentations providing valuable information for your job, including:
• tight-gas sandstones
• sedimentology of shale and reservoir development
• 3-D interaction of tectonics and sedimentation
• external controls on the shaping of deepwater margins and systems: influences on reservoir development
• emerging global deepwater plays
• petroleum systems analysis basins around the world
• gas shale reservoirs

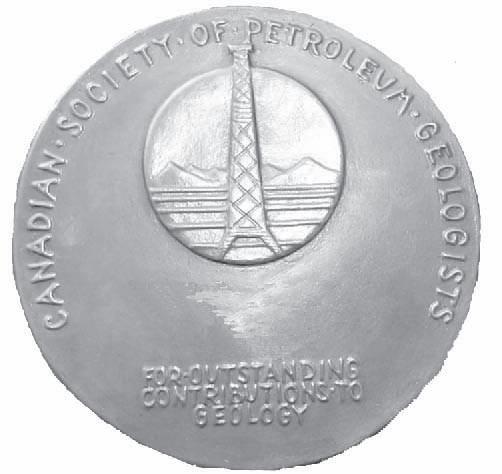
RJW DOUGLAS MEDAL CALL FOR NOMINATIONS
The RJW Douglas Medal is awarded annually by the Canadian Society of Petroleum Geologists for outstanding scientific contributions to the understanding of sedimentary geology in Canada, commending major contributions to regional tectonics, petroleum, and structural geology.
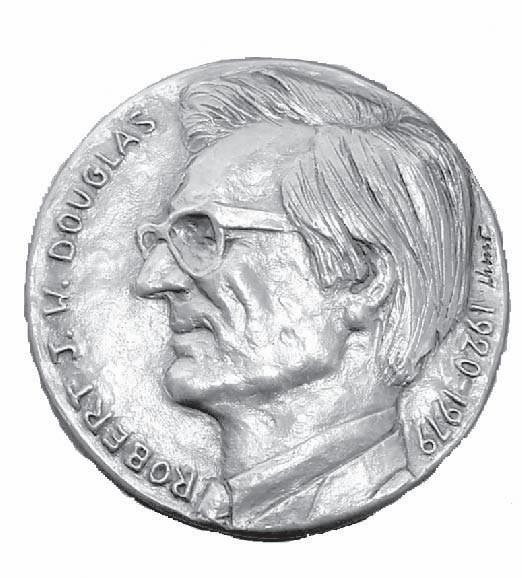


The award is open to all geologists who follow the example of Bob Douglas in contributing to the development of Canadian sedimentary, petroleum, and structural geology.
Nominations for the award of the medal must be endorsed by at least three members of the CSPG. Nominations may be proposed at any time, but to be considered for a particular year, they must be received by the Society before September 1
The sponsors of a nominee for the award should supply:
A curriculum vitae (outling the nominee’s career and previous honours or distinctions).
A list of publications by the nominee.
A summary of the nominee’s achievements in a form suitable for use as a citation for the award.
An analysis of the nominee’s achievements, highlighting the contributions for which he or she is being recognized, and relating these to the appropriate publications in the bibliography.
The last item of information is a key part of the nomination and should convey the magnitude and scope of the nominee’s scientific contributions, with comments on the influence that these contributions have had on others. An example of a submission may be provided on request.
Completed nominations should be sent to:
Margot McMechan
CSPG Douglas Medal Committee Chairman, c/o Margot McMechan
GSC – Calgary
3303, 33rd Street NW, Calgary, Alberta T2L 2A7
Telephone (403) 292-7154
Email: mmcmecha@nrcan.gc.ca
FOAMED CEMENT DELIVERS Life-of-Well Cement Sheath
| by Dion Billard, P.Eng.
Unconventional gas field development has become the focal point of this decade. With some of the world’s largest oil and gas fields rapidly depleting, the industry has turned to unconventional gas resource plays to fill the void.
In North America, operators are paying particular attention to shale gas. Large fields currently under development include the Montney in Western Canada, the Bakken in west-central Canada and the northern United States, and the Woodford Shales in Oklahoma.
All of these shale basins require new technologies to enable development for long-life wells. Many shale plays are using long horizontal sections through the reservoir. This technique allows operators to perform multiple fracture stimulations over several intervals on each well to maximize production.
An effective stimulation program is essential, and this in turn depends on a cementing strategy that will help ensure zonal isolation throughout the horizontal wellbore. The presence of under-balanced zones, nearby water and lack of natural barriers are some of the challenges to hydraulic stimulation that can be addressed with advanced cementing technology.
F OAM CEMENT
Foam cement can offer unique benefits when completing wells. The ZoneSeal ® isolation process is the industry’s leading
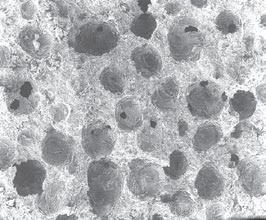
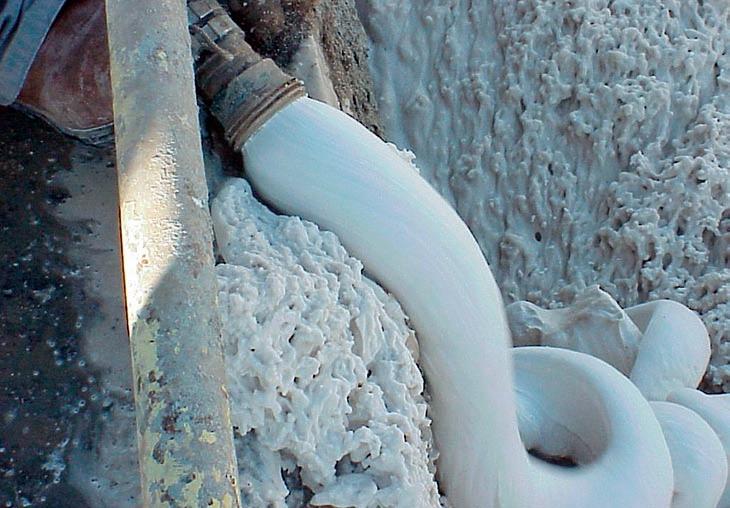
method of delivering foam cement. To make a foamed cementing system, nitrogen gas is combined with conventional cement at an engineered gas-to-slurry ratio Figure 1). It can help operators achieve zonal isolation by providing slurry properties with several advantages, including improved mud displacement, better gas / influx control, increased elasticity, higher tensile strength, lost circulation capabilities, and improved economics. When compared to conventional, non-nitrified cement, foam cement can improve the net present value (NPV) of the well.
I MPROVED MUD DISPLACEMENT AND GAS / INFLUX CONTROL
During pumping operations, foam cements can exhibit higher dynamic-flow shear stress than conventional cements since nitrified slurry has two phases – gas and liquid. Higher shear stress creates increased mud displacement and provides a better capacity than conventional cements for carrying away any remaining formation cuttings.
The two-phase structure of foam cement also reduces overall slurry fluid loss, which is important for controlling gas migration and fluid influx into the un-set cement. More importantly, foam cement enables the hydrostatic pressure in the cement column to remain almost constant during the cement transition period from a liquid to a solid state. Consequently, foam cement can be superior for controlling gas migration and shallow water flows.
Another benefit of foam cement is that it provides an elastic cement sheath all the way around the casing string. This maximizes zonal isolation for the fracture initiation points of the multistage stimulation process. Traditional cements can leave an un-cemented region along the high side in a deviated or horizontal wellbore (Figure 3). Without complete zonal isolation, multipleinterval hydraulic fracturing programs (Continued on page 22...)
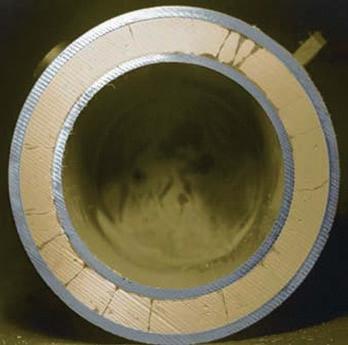
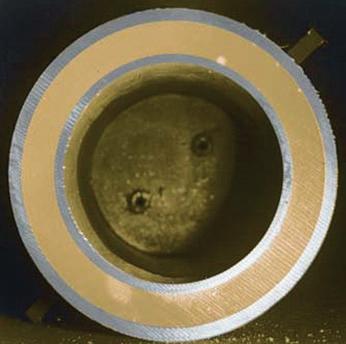
Figure 2. These illustrations show sectioned samples from cyclic stress tests. In each test, the cement was allowed to cure, after which the internal casing was pressurized simulating actual well conditions. The conventional high compressive strength neat cement (left) failed when inner pipe pressure reached 4,500 psi. When foam cement (right) was tested in the same manner, integrity was maintained when cycled to more than 9,000 psi.
Figure 1. Foam Cement on surface. Insert – Foam Cement micro-structure

(...Continued from page 21)
may require higher treating pressure and / or result in premature screenouts. The effective annular seal delivered by the foam cement also allows fractures to be directed into the targeted zones.
I NCREASED ELASTICIT y
Due to the honeycomb structure of the foam cement, there is a greater elasticity than in conventional cement, allowing an increased resistance to stresses induced by downhole temperature and pressure cycling. This feature enables the cement sheath to yield while the well casing expands, and rebound when the casing returns to its original conditions. As a result, the cement sheath is less likely to crack over a long period of time.
Mixing in specific cement additives can also drastically improve the resilience and ductility of the base cement slurry. Combining such specialized cement blends with nitrogen to produce foam cement can further enhance these benefits.
Such combinations can even produce elastic, resilient, react-and-respond cement sheaths. As conditions change over the life of the well, these cement blends can adjust without intervention to changes due to stresses on the wellbore
and retain or regain cement integrity. With these specialized cements, the flow of hydrocarbons through any small cracks or micro-annuli that may form in the cement initiates the react-and-respond, automaticsealing feature, restoring zonal isolation in the well. This interventionless reaction can occur in the presence of hydrocarbons with up to a 99 percent water cut.
H IGHER TENSILE STRENGTH
The tensile strength and mechanical properties of foam cement can make it ideal for zonal isolation in a wide variety of hydraulic fracturing operations.
The cement sheath is subject to hoop stresses during casing pressure tests or fracture stimulation treatments, which can lead to tensile cracking, one of the most common modes of cement sheath failure. Studies have shown that conventional cement sheaths can fail when the internal casing pressure increases by as little as 3,000 pounds per-square-inch (psi), whereas foam cement will remain intact under the same conditions (Figure 3). Therefore, since cement is more likely to suffer tensile failure, the higher tensile strength of foam cement can prevent tensile cracking of the cement sheath. The sheath’s capability to withstand these stresses is predominantly determined by the cement’s mechanical
properties (Young’s modulus and Poisson’s ratio) and tensile strength.
Typically, the cement’s compressive strength is of minimal importance, depending on future wellbore events and the overall goals for completing and producing the well. Compressive strength of 500 psi to 1000 psi normally provides more strength than is required of the cement sheath for complete zonal isolation. Because cement typically does not fail under compressive events, the lower compressive strength of foam cement will not increase the risk of failure during hydraulic fracturing treatments.
L OST CIRCULATION CAPABILITIES
Lost circulation during the drilling operation can be problematic. Such occurrences can result in non-productive time (NPT) for the drilling operation. Lost circulation zones can be the result of fractures (induced or natural), direct communication with lowpressure intervals, depleted zones and/or variations in rock stresses.
The expanding capabilities of foam cement make it ideal in lost circulation environments. It can drastically reduce the rig time by sealing the thief zone in one treatment. This will result in less NPT and earlier completion of the well.
Figure 3. WellLife ® III Service.
I MPROVED ECONOMICS
Foam cement is a life-of-well cementing solution that will reduce future remedial work, providing a stable, elastic, and resilient cement sheath. This reduction in remedial work can save a producer hundreds of thousands of dollars in NPT. Although foamed cement can increase the initial costs of primary cement jobs, the fact that a foam cement sheath can provide zonal isolation for hundreds of stress-relaxation cycles makes it a more economical choice over conventional cement sheaths that will generally crack in 2 to 10 cycles. In a marginal or mature field, the increased economic life of a well can justify the use of foam cement for providing long-term zonal isolation when the installation of exotic flexible or rubber cement sheaths could not be justified.
DELIVERy IS KE y!
Following best practices is essential to the success of the ZoneSeal isolation process when conducting a foam cement job. By executing flawlessly, the cement can be properly placed to help deliver life-of-well cement. These best practices include:
• Conditioning of the drilling fluids (gel strength),
• Adequate annular clearance or cement sheath thickness,
ROCK SHOP
• Casing standoff or centralization,
• Optimum flow rates,
• Pipe movement during placement and displacement of the slurry (rotation and / or reciprocation),
• Spacer design and contact time,
• Adequate casing wiping during displacement,
• Foam recompression (if circulating foam back to surface).
FOAM CEMENT IN ACTION
In 2008, Halliburton Canada successfully placed 73 foam cement treatments for the Canadian oil and gas industry. These projects consisted of 19 vertical wells, 33 directional wells and 21 horizontal wells.
The benefits of foam cement for the life of a well are increasingly being recognized by Canadian operators. The potential for increased production and reduced remedial costs are making foamed technology the choice for long-term zonal isolation.
Currently, Halliburton Canada is applying the most recent foam cement technology, ElastiSeal™ cement, in the Montney Shale with one of Canada’s largest shale-play operators. Such a versatile cement sheath will provide the best chance to successfully implement the required large scale, multiple
stimulation program. To date, Halliburton has successfully placealbores. These wells will be hydraulically stimulated multiple times along the horizontal to maximize production over the life of the well. At the time of writing, stimulation of the first of these wells is under way.
T HE BENEFITS ARE CLEAR
Foam cement can be the optimal means to complete a well and should be considered whenever a long, productive life in a highstress environment is required.
For an in-depth analysis on a particular well and/or field, please refer to Halliburton’s WellLife® III cementing service. The WellLife III cementing service can deliver a life-ofwell cement sheath by starting with tools to analyze the life cycle of the well. Whether a cyclic steam application or deep Geothermal application, WellLife service enables the analysis of the pressure and temperature cycles to recommend a cementing solution to last the life of the well.
This article was contributed by Halliburton. CSPG thanks Halliburton for the contribution


• Print any length raster or LAS log
•
•
PRACTICAL SE qUENCE STRATIGRAPH
The Units of Sequence Stratigraphy: Part 4 Parasequences
| by Ashton Embry
I NTRODUCTION
There are three basic types of stratigraphic units in use in sequence stratigraphy –sequence, systems tract, and parasequence. Various proposals for defining and delineating specific types of sequences and systems tracts were reviewed and discussed in the last three articles in this series (Embry, 2009a, b, c). In this article I will discuss the last unit type – the parasequence.
ORIGINAL DEFINITION
The term parasequence was originally defined by Van Wagoner et al. (1988, p. 39). In keeping with sequence stratigraphic practice, they defined a parasequence by means of its bounding surfaces: “a relatively conformable succession of beds or bedsets bound by marine-flooding surfaces.” To understand the definition of a parasequence, one needs a definition of its defining bounding surface – a marineflooding surface.
A marine-flooding surface, which is much more commonly called a flooding surface (FS), was defined by Van Wagoner et al. (1988, p. 39) as “a surface separating younger from older strata across which there is an abrupt increase in water depth.” This definition does not provide much insight into what a flooding surface actually is and how one would recognize one. All stratigraphic surfaces separate younger from older strata (Law of Superposition) leaving “an abrupt increase in water depth” as the only criteria for recognition. Given this is a very interpretive criteria, rather than an observable one, it is not a suitable characteristic for defining a material-based surface. Because adequate definitions were not provided, one is left wondering what a flooding surface actually is and, consequently, what a parasequence is.
Van Wagoner et al. (1990) provided much more information and insight into what they actually meant by the terms flooding surface and parasequence, although the actual definitions remained the same as those originally offered. They provided a model for the development of a parasequence (Van Wagoner et al., 1990, Figure 4) (Figure 1 herein) and portrayed parasequences as
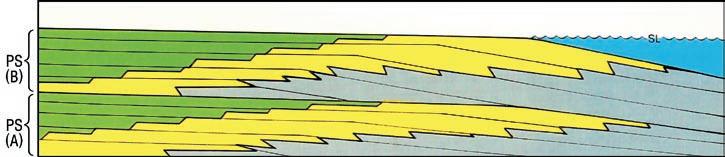
Figure 1. The Van Wagoner et al. (1990) model for parasequences. Each parasequence consists of a succession of coarsening-upward, regressive strata. The lack of any transgressive strata is a problematic flaw in this model. Modified after a portion of Van Wagoner et al. (1990), Figure 4.
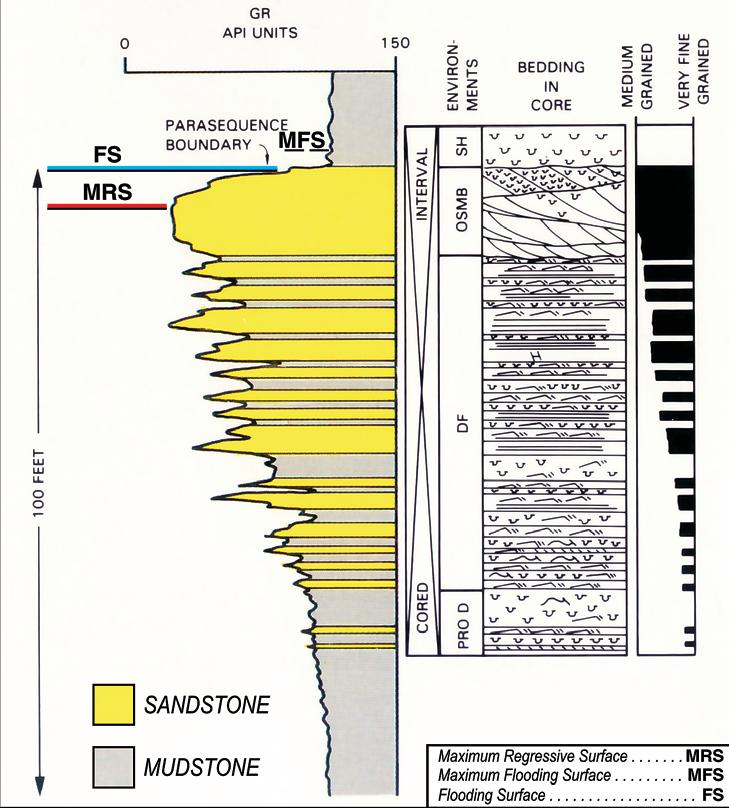
Figure 2. Parasequence boundary as defined and illustrated by Van Wagoner et al. (1988, 1990). These authors placed the boundary at the change from sandstone below to shale / siltstone above and called such a surface a flooding surface (FS). As shown, a flooding surface (FS) lies between a maximum regressive surface (MRS) below and a maximum flooding surface (MFS) above. As defined, a flooding surface is a lithostratigraphic surface rather than a sequence stratigraphic one. Modified after a portion of Van Wagoner et al. Figure 3B.
units of shallowing-upward strata separated by surfaces which marked a transgression. As shown on Figure 1, Van Wagoner et al.
(1990) did not include the formation of any transgressive strata in their parasequence
(Continued on page 26...)
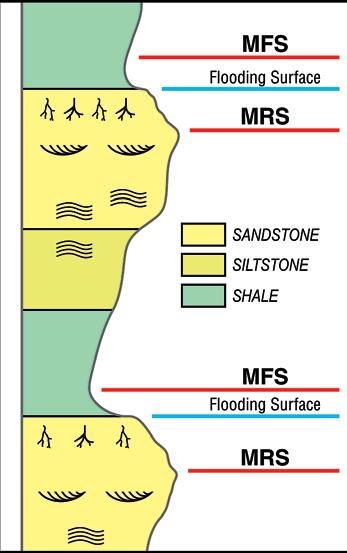
Figure 3. A schematic section of a transgressiveregressive succession that is not interrupted by any unconformities. Two sequence stratigraphic surfaces, maximum regressive surface (MRS) and maximum flooding surface (MFS) as well as a lithostratigraphic surface, flooding surface (FS), can be delineated in such a succession.
Although Van Wagoner et al. (1988, 1990) put the parasequence boundary at the flooding surface, others have used the MRS or the MFS. Such variance in boundary delineation has resulted in considerable confusion regarding the placement of a parasequence boundary.
(...Continued from page 25)
model. Given the Law of the Conservation of Matter, this lack of any transgressive strata is nonactualistic as discussed by Arnott (1995). Consideration of this aspect of the model helps to put in context problems associated with the Van Wagoner et al. (1988, 1990) concept of a flooding surface and a parasequence. These are discussed below.
PARASE qUENCE AS A L ITHOSTRATIGRAPHIC U NIT
An inspection of various diagrams in Van Wagoner et al. (1990) (e.g., Figures 3b and 7 in Van Wagoner et al., 1990) reveals that what Van Wagoner et al. (1988, 1990) meant by a flooding surface is a contact between a marine sandstone below and a deeper-water, marine shale / siltstone above (Figure 2). Going by the illustrations in Van Wagoner et al. (1990), such a contact can be gradational (conformable) or scoured (diastem). As shown on Figures 2 and 3, a flooding surface, as conceived and applied by Van Wagoner et al. (1988, 1990), is best categorized as a within-trend
facies contact that is developed within a transgressive succession. A flooding surface (FS) lies between two surfaces of sequence stratigraphy – a maximum regressive surface (MRS) below and a maximum flooding surface (MFS) above (Figures 2 and 3). Notably, a flooding surface does not represent a change in depositional trend. Rather, it represents a change in lithology (sandstone / limestone to shale / marl) within a depositional trend (e.g., within a fining-upward succession) and consequently is best considered to be a lithostratigraphic surface rather than a sequence stratigraphic one.
With the understanding of what a flooding surface really is, it follows that a parasequence is a unit bound by lithostratigraphic surfaces. Furthermore, this means that a parasequence as defined and used by Van Wagoner et al. (1988, 1990) is really a lithostratigraphic unit and not a sequence stratigraphic one. Another complication is that the term flooding surface has also been sometimes inappropriately applied to well defined and characterized, material-based surfaces of sequence stratigraphy including a maximum regressive surface, a maximum flooding
(Continued on page 28...)
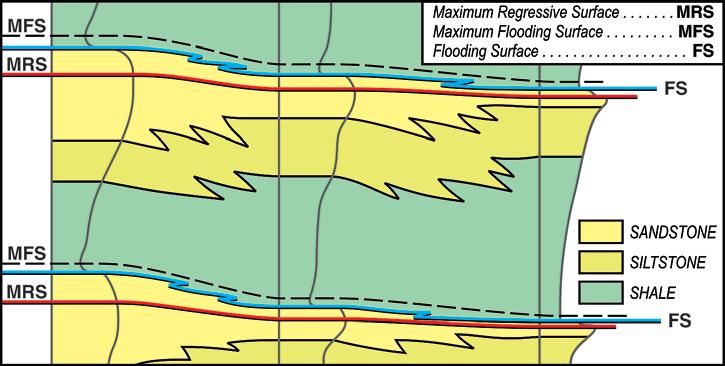
Figure 4. A schematic cross-section showing the correlation of three transgressive-regressive successions. Van Wagoner et al. (1988, 1990) recommend the use of the diachronous, flooding surface (FS), a lithostratigraphic surface, as the boundary for a parasequence. Herein, the maximum regressive surface (MRS) which has very low diachroneity and is a sequence stratigraphic surface, is recommended as the defining bounding surface for a parasequence. A unit bound by maximum flooding surfaces (MFS) has already been defined and named a genetic stratigraphic sequence.
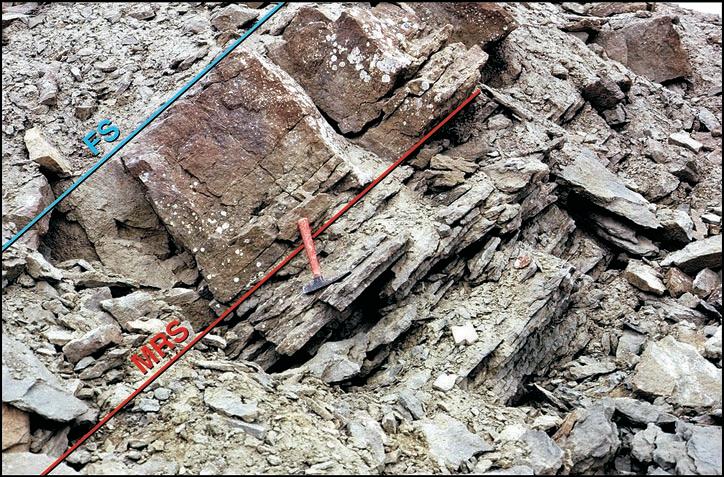
Figure 5. The upper portion of a small scale, regressive-transgressive succession is shown. A maximum regressive surface (MRS) is delineated at the base of the red weathering, massive, highly burrowed, calcareous sandstone unit and coincides with the change from a coarsening- and shallowing-upward succession (regressive) to a fining- and deepening-upward succession (transgressive). A flooding surface (FS) occurs within the transgressive strata at the boundary between the burrowed sandstone and the overlying unit of shale and siltstone. Middle Devonian Bird Fiord Formation, Bathurst Island.
Superior Quality
CGGVeritas is committed to acquiring and processing superior quality data in the locations where you operate. With the highest quality data library in Canada, you’ll have access to multi-client data in the most desirable regions of Alberta and North-East British Columbia.
Count on CGGVeritas to help you explore, develop and produce with confidence.
surface, and a shoreline ravinement (Embry, 2005; Catuneanu, 2006). This practice has created additional uncertainty and confusion as to what a flooding surface and a parasequence really are and how they can be objectively delineated. Additional confusion has resulted from cases where an MFS coincides with the lithological change from sandstone to shale.
R EDEFINING A PARASE qUENCE AS A SE qUENCE S TRATIGRAPHIC U NIT
The parasequence is a widely used unit in sequence stratigraphic analysis despite uncertainties concerning boundary placement and consequent variations in use. To rectify this confusing situation, it is necessary to define a parasequence using bona fide sequence stratigraphic surfaces for its defining boundaries. The schematic cross section of Figure 4 illustrates two different placements for a parasequence boundary. Van Wagoner et al. (1988, 1990) put the boundary at the diachronous, facies change from sandstone to shale (flooding surface) whereas, I would contend a better placement is at the maximum regressive surface (MRS), which is a sequence stratigraphic surface with very low diachroneity. As shown in Figures 5 and 6, the MRS occurs below an FS. Figure 7 illustrates an outcropping parasequence which has MRSs for boundaries. The highly burrowed, massive sandstone that was deposited during transgression and deepening is placed at the base of the parasequence rather than at the top as proposed by Van Wagoner et al. (1988,
1990). Arnott (1995) also reached the same conclusion that a parasequence boundary is best placed at the base of such transgressive strata.
I suggest a parasequence be defined as “a small-scale, sequence stratigraphic unit
bound by maximum regressive surfaces (MRS) and their correlative surfaces”. Because an MRS is an accepted, materialbased surface of sequence stratigraphy (Embry, 2002, 2008), this change ensures that a parasequence is a bona fide sequence stratigraphic unit. Furthermore, such a definition does not alter the basic meaning or utility of a parasequence and matches how numerous practitioners have already applied the term (e.g., Arnott, 1995).
PARASE qUENCE V ERSUS SE qUENCE
As shown on Figure 8, a parasequence is delineated and extended by recognizing MRSs and correlating them. Sometimes a maximum flooding surface (MFS) can replace an MRS and in this situation the MFS would act as the parasequence boundary because it would be a correlative surface of the MRS. If both bounding MRSs were everywhere replaced by MFSs, the resultant unit would be a genetic stratigraphic sequence (Embry, 2009a) rather than a parasequence.
An MRS often correlates with an unconformable shoreline ravinement (SRU) on the basin flanks and thus an SR-U can act as one of the bounding surfaces of a parasequence. However, when both bounding MRSs of a previously delineated
Figure 6. A portion of Figure 7 of Van Wagoner et al. (1990) showing the Van Wagoner et al. (1990) parasequence boundaries (FSs in blue) versus the recommended MRSs in red. Modified after a portion of Van Wagoner et al. (1990) Figure 7.
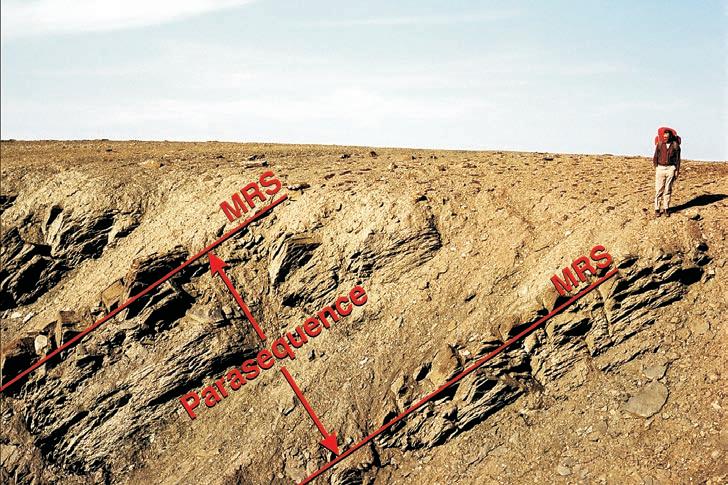
Figure 7. A parasequence is delineated in outcropping Bird Fiord Formation (Middle Devonian) strata on Bathurst Island, Canadian Arctic Archipelago. The boundaries are placed at readily recognizable maximum regressive surfaces (MRS). Tom Oliver for scale.
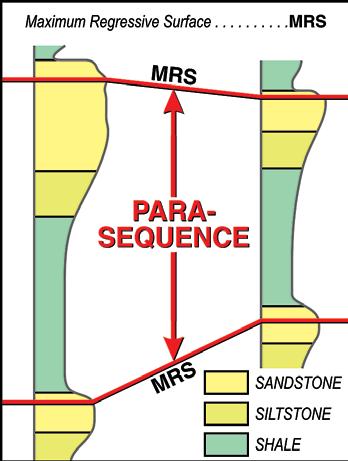
Figure 8. As shown on this schematic cross-section, parasequences are delineated and correlated on the basis of maximum regressive surfaces (MRS). Correlative surfaces of an MRS often include a maximum flooding surface and a shoreline ravinement and these sequence stratigraphic surfaces can also be used as a parasequence boundary.
parasequence can be shown to be correlative with SR-Us (Figure 9), then the unit must be designated as a depositional sequence rather than a parasequence. Thus a parasequence can be seen as a “depositional sequence in waiting” and any parasequence which has been recognized is potentially a depositional sequence upon subsequent work and extended correlation.
Given the above, a case can be made for dropping the term parasequence all together and including a unit bounded by MRSs within the definition of a depositional sequence. Hopefully, this question will be decided over the next few years.
PARASE qUENCE AND S CALE
Part of the proposed definition of a parasequence limits the term parasequence to small-scale units (< a few tens-ofmetres thick) and this is dictated by current practice. Large-scale (hundreds-of-metres thick) sequence stratigraphic units bound by MRSs are best designated as depositional sequences. The reason for this is almost all larger magnitude MRSs correlate back to unconformities (SR-Us, SUs) on the basin margin.
F INAL REMARKS
The term parasequence is best applied exclusively to small-scale, transgressiveregressive units bound by MRSs and their correlative surfaces. Parasequences are formed either during a small-scale, base
level fall-rise cycle (correlative SR-U not yet recognized) or during a reduction in sediment supply during base level rise (no SR-U generated). Finally, I recommend that that a flooding surface (a lithostratigraphic surface between a marine sandstone / limestone below and a shaly lithology above) be allowed as a proxy for a parasequence boundary when available data do not allow the MRS to be reliably or easily delineated. However, I would emphasize that it is desirable to use MRSs whenever possible.
R EFERENCES
Arnott, R. W. 1995. The parasequence definition – are transgressive deposits inadequately addressed? Journal of Sedimentary Research, v. 65, p. 1-6.
Catuneanu, O. 2006. Principles of Sequence Stratigraphy. Elsevier, New York, 375 p.
Embry, A. F. 2002. Transgressive-Regressive (T-R) Sequence Stratigraphy, In: Sequence stratigraphic models for exploration and production. J. Armentrout and N. Rosen (eds.). Gulf Coast Society of Economic Paleontologists and Mineralogists Conference Proceedings, Houston, p. 151-172.
Embry, A. F. 2005. Parasequences in Third Generation (3G) Sequence Stratigraphy. Search and Discovery Article #110022. http://www. searchanddiscovery.net/documents/2005/av/ embry/softvnetplayer.htm.
Embry, A. F. 2008. Practical Sequence Stratigraphy VI: The Material-based Surfaces of Sequence Stratigraphy, Part 2: Shoreline
ravinement and Maximum Regressive Surface. Canadian Society of Petroleum Geologists. The Reservoir, v. 35, issue 9, p. 32-39.
Embry, A. F. 2009a. Practical Sequence Stratigraphy IX: The Units of Sequence Stratigraphy, Part 1, Material-based Sequences. Canadian Society of Petroleum Geologists. The Reservoir, v. 36, issue 2, p. 23-29.
Embry, A. F. 2009b. Practical Sequence Stratigraphy X: The Units of Sequence Stratigraphy, Part 2, Time-based Sequences. Canadian Society of Petroleum Geologists. The Reservoir, v. 36, issue 3, p. 21-24.
Embry, A. F. 2009c. Practical Sequence Stratigraphy XI: The Units of Sequence Stratigraphy, Part 3: Systems Tracts. Canadian Society of Petroleum Geologists. The Reservoir, v. 36, issue 4, p. 24-29.
Van Wagoner, J. C., Posamentier, H. W., Mitchum, R. M., Vail, P. R., Sarg, J. F., Loutit, T. S., and Hardenbol, J. 1988. An overview of the fundamentals of sequence stratigraphy and key definitions. In: Sea level changes: an integrated approach. C. Wilgus, B. S. Hastings, C. G. Kendall, H. W. Posamentier, C. A. Ross, and J. C. Van Wagoner (eds.). Society of Economic Paleontologists and Mineralogists, Special Publication 42, p. 39-46.
Van Wagoner, J. C., Mitchum, R. M., Campion, K. M., and Rahmanian, V. D. 1990. Siliciclastic sequence stratigraphy in well logs, cores and outcrops. American Association of Petroleum Geologists. Methods in Exploration, no. 7, 55 p.
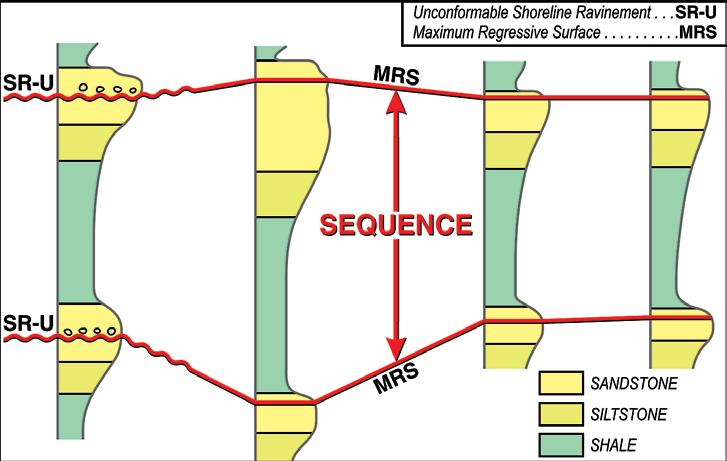
Figure 9. When both maximum regressive surface (MRS) boundaries of a previous delineated parasequence (e.g., see Figure 8) are found to correlate with unconformable shoreline ravinements (SR-U), as illustrated on this schematic cross-section, the unit becomes a depositional sequence. Thus a parasequence can be regarded as a “depositional sequence in waiting.”
PETROLEUM INDUSTRY COURSES
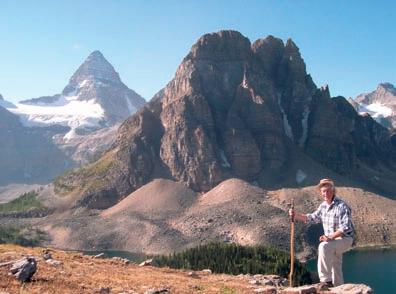
OVERVIEW OF THE OIL & GAS INDUSTRY IN WESTERN CANADA
Date: June 2 & 3, 2009
Cost: $945 (includes GST)
Instructor: Bill Ayrton
Effective for personnel just joining the oil patch, or for financial, accounting, and information systems personnel.
• Learn about the many facets of the industry.
• Oil finding, land acquisition, drilling, seismic, well completion, jargon and terminology
GEOLOGY FOR NON-GEOLOGISTS
Date: May 26 & 27, 2009
Cost: $945 (includes GST)
Instructor: Bill Ayrton
WHO SHOULD ATTEND
New geologists, engineers, geophysicists and landmen, as well as summer students entering the industr y for the first time will find the courses a very beneficial introduction to the petroleu m industry These courses will be extremely useful to nonprofessional and support staff in the oi l and gas industry, as w ell as accountants, lawyers, brokerage and financial personnel working primarily alongside the oil and gas industry.
TO REGISTER
To register or to obtain additional information regarding in-house and upcoming courses, please contact:
Ayrton Exploration Consulting Ltd.
Tel: (403) 262-5440
Email: ayrtonex@telusplanet.net
Or visit our website: www.ayrtonexploration.com
Effective for geological technicians or administrative staff, or for those who just want a better understanding of geology to appreciate the world around us.
• Learn about earth structure, geologic time-scale and processes, Western Canada geology, and interesting nearby locations.
• Participate in a r ock identification exercise , cross-section project and a mini-field trip in downtown Calgary.
GEOLOGY OF THE WESTERN CANADIAN SEDIMENTARY BASIN
Date: June 9, 10 & 11, 2009
Cost: $1365 (includes GST)
Instructor: Bill Ayrton
Ideal for those who wish to improve their geological understanding of where and how we look for oil and gas fields in Western Canada.
• To visualize what Western Canad a looked like throughout the stages of history, for example, the position of the sea versus land, what sediments were deposited, and what type of life that existed and evolved.
• To review the importance of each major stratigraphic unit, i.e. Devonian, Mississippian, Cretaceous, etc.
• Discuss the geological and seismic expression of typical oil and gas fields in each unit.
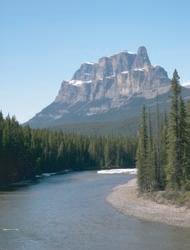

Mount Assiniboine Hiking season is coming up!
Photo by: Bill Ayrton
CLIMATE CHANGE V Here Comes the Sun
| by Dr. A. Neil Hutton
The sun has provided the energy for almost everything on earth since life began, including its climate. Although not obvious in our daily lives on Earth, the sun’s energy fluctuates in cycles with about an eleven-year periodicity. The evidence of solar activity is provided by sunspots which appear as dark blemishes on the sun’s surface. They are caused by concentrated magnetic fields and massive flares of plasma. Sometimes individual spots can be several times the diameter of the earth. They are huge (Figure 1). The sun’s activity has been gauged by counting the number of sunspots on a daily basis – the greater the number of spots, the greater the activity. The calculation of the sunspot number is complex, but now has a standardized approach, although there are two different systems currently being used. What is particularly useful about the sunspot numbers is that they have been observed for about 400 years and there is an excellent record of the cycles. On the other hand, the measure of the sun’s energy, the Total Solar Irradiance (TSI) has only been recorded for the last 30 years. A record of the solar cycles for the last 400 years is shown in Figure 2. The most striking feature is almost total lack of activity in the sun for seven decades during the Maunder Minimum coincident with the depths of the Little Ice Age from 1645-1715. A second minimum (the Dalton Minimum) occurred from 1800-1830, and was also associated with a period of very cold climate. The warming of the last half of the 20 th Century is marked by much higher
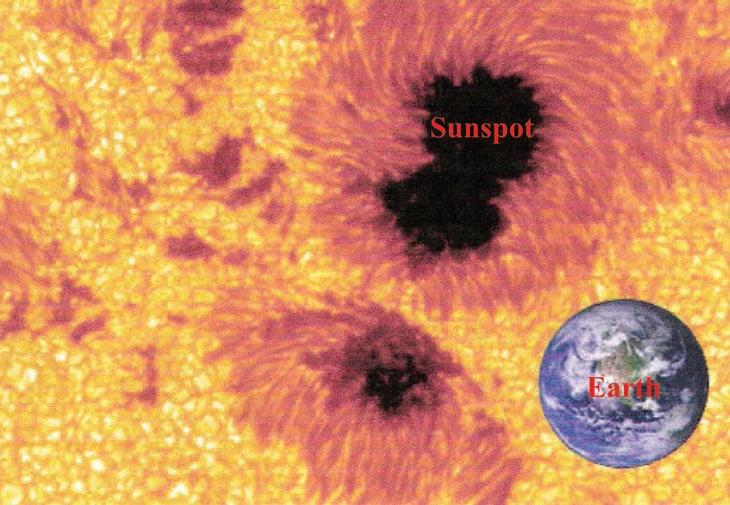
1. The Earth in scale relative to a typical large sunspot. Sunspots are believed to result from the fact that the sun is a viscous material in which the poles rotate at a different rate than the equator. This causes disruptions of the magnetic field, which erupt at the surface as sunspots. The intense magnetic activity inhibits normal convection, thus the dark spots are up to 1000 degrees C cooler than the background. (Source: www. norcalblogs.com/watts/climate_change).
sunspot activity than has been observed in the previous 200 years.
The Total Solar Irradiance will increase during the solar maxima (when the sun displays the maximum number of sunspots) and decrease during the solar minima (when the sun has fewest sunspots). Currently, it is argued that these changes are so
small that they can not significantly affect the climate. Measurements over the last 30 years suggest that during the minima, the sun produces 1,361 watts per square metre at the top of the atmosphere and this increases by only 1.3 watts per square metre (0.1%) during periods of maximum activity, apparently too small to cause
(Continued on page 32...)
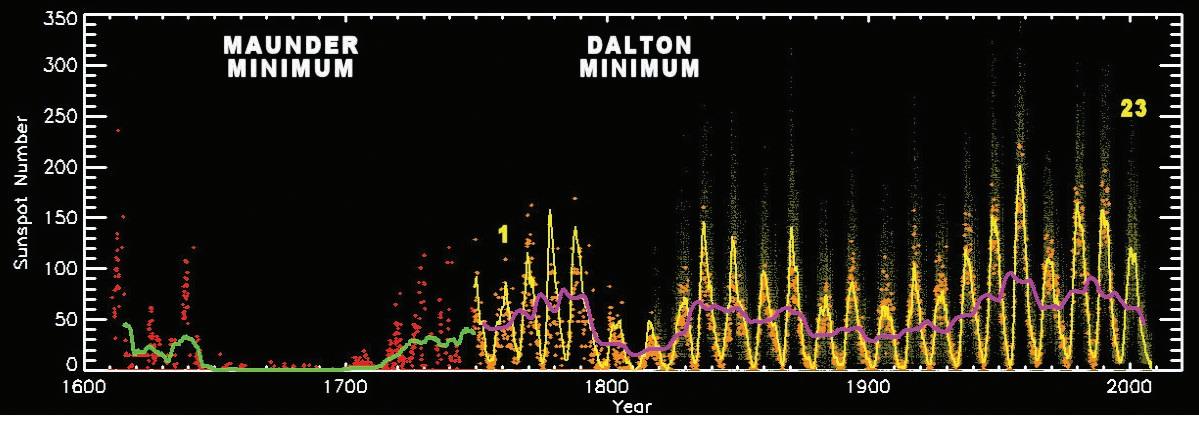
Figure 2. The record of sunspot numbers from 1610 to 2008. The yellow line is the averaged Wolf number in use after 1749. The red diamonds represent group numbers in use before 1749. The heavy green and magenta lines are the eleven-year mean of the monthly average of the group (pre-1749) and Wolf numbers (post-1749). Solar cycles 1 and 23 are shown in bright yellow. The magenta eleven-year mean shows very clearly that the warmth of the last part of the 20th Century is marked by significantly greater activity than at any time in the previous 400 years (Source: graphic from Stellar Spectrograph at Lowell Observatory data NASA and Royal observatory of Belgium).
Figure
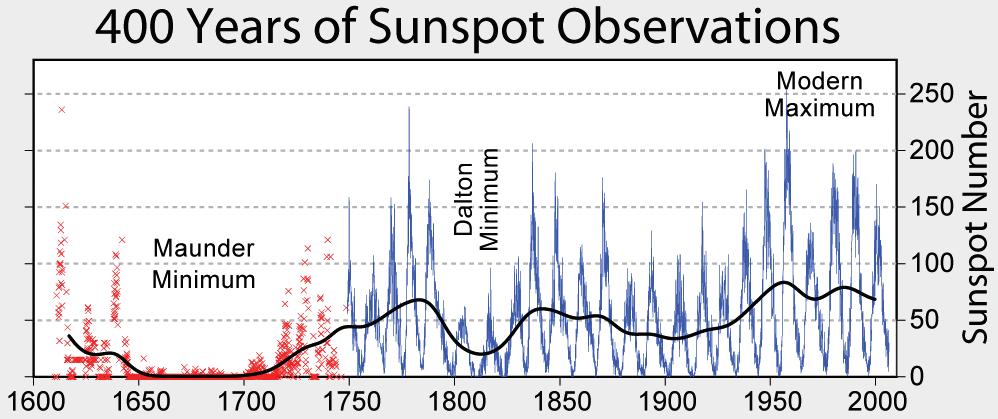
(...Continued from page 31)
significant warming. The IPCC (Historical Overview of Climate Change Science, p. 108, 2007) categorically state that, “… changes in solar irradiance are not the major cause of the temperature changes in the second half of the 20th century, unless those changes can induce large feedbacks in the climate system.” This totally begs the question of why climate was significantly colder during the Maunder and Dalton Minimums, and fails to acknowledge that the sun, during the last four hundred years, had its most active period in the last half of the 20th Century (Figure 3).
Moreover, in order to justify the warming effect of traces of CO 2 in the atmosphere
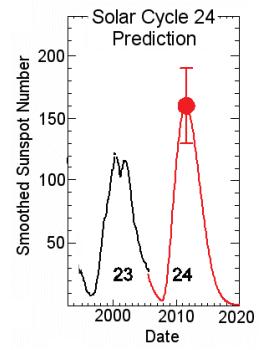
Figure 4a. The projection for Solar Cycle 24, as of December 2006, forecast that the cycle would peak about 2010 with a sunspot number of 160, plus or minus 25, making it the strongest solar cycle on record. In fact as of January 2009, the cycle had still not commenced after a cumulative total of 535 spotless days. (compare to Figure 4b for the current forecast; Source: NASA Science Headlines 21 December 2006).
IPCC (ibid.) have appealed to the unproven assumption of positive cloud feedback to cause warming. Otherwise the traces of atmospheric CO 2 are incapable of having a significant effect. The cloud feedback assumptions have recently been shown to be incorrect, essentially invalidating all previous results from computer-generated climate models, all of which assume positive feedbacks. Spencer et al. (2007) and Spencer (2009) documented from satellite data analysis that cloud feedbacks are negative – basically invalidating the CO 2 warming hypothesis.
On December 21st, 2006, Dr. David Hathaway of the Marshall Space Flight
Center announced that Solar Cycle 24 would be one of the most intense cycles since recordkeeping began 400 years ago. The prediction was for a maximum sunspot number (SSN) peaking about the year 2010, at an SSN of 160, plus or minus 25. (Figure 4a) By April 2007 it appeared that Solar Cycle 24 was running late. It was then predicted to peak in mid-2011 or 2012 with an SSN of 90-125. Finally, in January, 2008 the arrival of Solar Cycle 24 was announced based on the appearance of a small sunspot of reverse polarity to that seen in previous Solar Cycle 23. Nevertheless, one year later, the sun remained quiescent with the fewest sunspot days recorded in the last century. (Figure 4b) There was a total of 266 sunspot-free days for the year, resulting in 2008 being the least active solar year since 1900 (Figure 5).
New data from the Solar Data and Climate Experiment (SORCE) shows that Total Solar Irradiance is now at its dimmest since records of TSI were established in 1978. The implications of these observations are that the climate should be cooling and, indeed, this has been observed. An abrupt cooling took place between January 2007 and January 2008, recorded by all of the world’s global climate stations. Furthermore, the Globally Averaged Temperature recorded by Hadley Climate Centre (Figure 6) has declined significantly concurrently with the
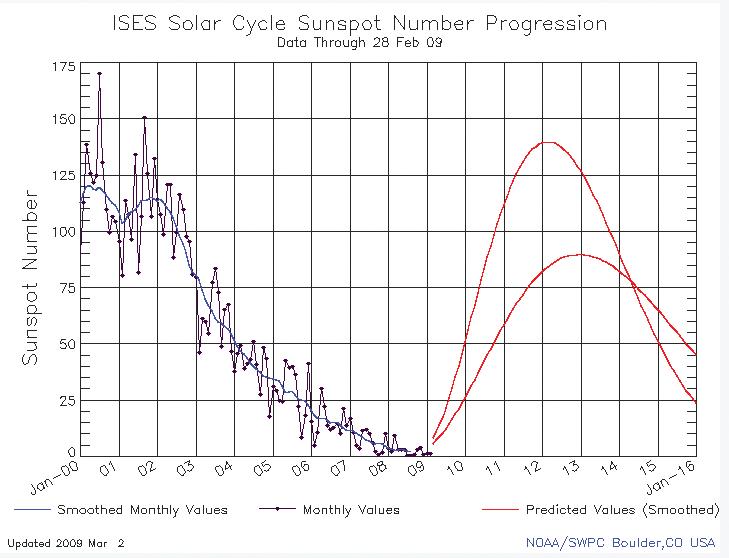
Figure 4b. The revised forecast for Solar Cycle 24 as of January 2009. The predicted high values are peaking in 2011, with a sunspot number of 140. The predicted low peaks in 2012 with a sunspot number of 90. Given the continued quiescence of the sun both predictions seem optimistic. The continuing drop of the AP Index (Figure 10) suggests that the sunspot number could very well be less than 50 (Source: NOAA/SWPC. Boulder, Colorado).
Figure 3. 400 Years of Sunspot Numbers with the eleven-year mean of the monthly averages (heavy black line) that shows the Modern Maximum Activity is higher than at any time in the past 400 years shown on the chart (Source, NOAA and Royal Observatory of Belgium, compiled by Hoyt and Schatten, 1998a, 1998b).
Figure 5. Chart showing the cumulative number of sunspot-free days in 2007 and 2008. The number of sunspot free days in 2008 is the highest since 1913. For most of the last century, cycles 16-23 have shown fewer spotless days as they reached their minima.
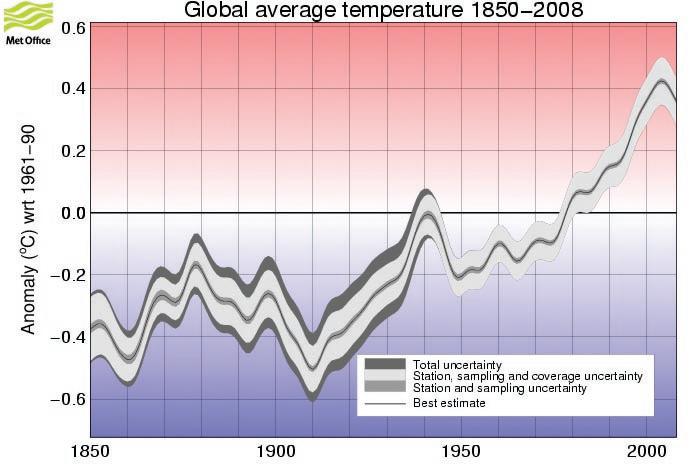
Figure 6. The Global Average Temperature 1850-2008. This data set shows that there has been no warming since 2000 and that there has been a significant temperature drop since 2007. The temperature decline is occurring in concert with the changes observed in the sun’s energy output, both in sunspot number and in the AP energy index. The latter index shows a marked decrease as of October 2006 (Figure 10; source: Met Office Hadley Centre for Climate Change).
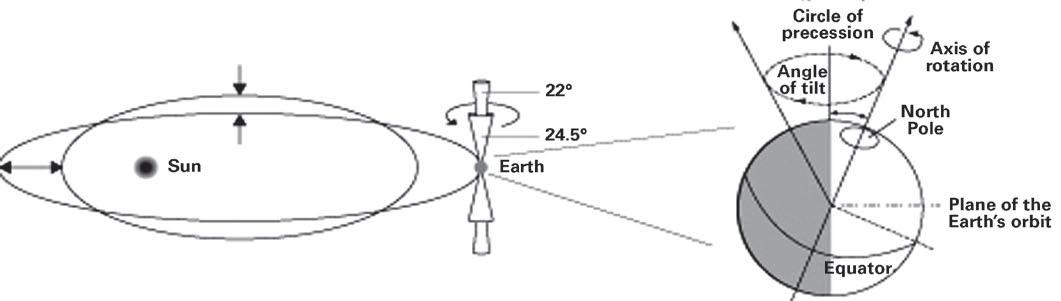
Figure 7. Diagrammatic representation of the orbital parameters of the Earth. The eccentricity of the orbit, the tilt of the axis of rotation, and the circle of precession as described in points 1, 2, and 3 in the text. (Source: http://www.open.ou.nl//dja/klimaat/System/solar_radiation_and_milank.htm).
failure of Solar Cycle 24 to appear. If the sun remains in this dormant state, the world could be heading into a period of significant cooling analogous to the Dalton Minimum in the early 1800s.
There has been extreme reluctance on the part of IPCC to acknowledge a sun / climate connection, notwithstanding the documentation of many significant correlations, such as the correspondence of sunspot cycle length with global average land temperature. The IPCC principle dogma is that the variations in TSI are too small to have any influence on climate, although the TSI measurements have only existed for 30 years. This dogma is maintained despite the fact that the Maunder Minimum and Dalton Minimum are associated with periods of substantial and well documented cooling of the world’s climate. The fact that the precise mechanism is not understood does not negate the influence of the sun. When Friis-Christensen, a leading solar researcher, attended the initial IPCC meetings he was surprised to find that the committees
refused to consider the sun’s influence on climate as a topic worthy of investigation! The justification was that the IPCC mandate was to investigate man-made causes of climate change. In other words, they wanted to confirm that human-released CO 2 was the cause of warming.
So far we have discussed the decadal and centennial effects of the sun’s variability on climate as a result of the sunspot cycle and associated changes in TSI. What we will try to demonstrate next is that the sun’s influence is complex and multifaceted, and that there are a variety of complex mechanisms altering the impact of the sun’s energy on Earth. In the search for a mechanism that could explain the profound changes in climate resulting in the Earth’s extensively documented glacial cycles, a Serbian astrophysicist, Milutin Milankovitch, developed a hypothesis that states that, as the Earth travels through space around the sun, cyclical variations in the axial attitude and orbit combine to produce variations in the amount of solar energy reaching
the Earth. Milankovitch recognized three specific aspects of the Earth’s attitude to the sun (Figure 7):
1). The shape of the Earth’s orbit changes from elliptical (high eccentricity) to almost circular (low eccentricity) in a cycle that takes between 90,000-100,000 years. When the orbit is highly elliptical the amount of insolation (the total energy of the sun reaching the Earth) at the closest approach (perihelion) would be in the order of 20-30% greater than at the most distant point (aphelion), resulting in a much different climate than we experience today since the orbit is now almost circular.
2). The axis of the Earth’s rotation is tilted and this tilt causes the changes in seasons from summer to winter. The tilt, however, changes over a period of about 40,000 years from approximately 22.1 to 24.5 degrees. Increased tilt means more severe seasons wth warmer summers (Continued on page 34...)
and colder winters while less tilt means colder summers and milder winters. The colder summers are believed to allow snow and ice to accumulate in high latitudes building into massive ice sheets. The albedo (reflectivity) of the snow and ice causes more of the sun’s energy to be directed back to space accelerating the cooling.
3). In addition to the tilt of the Earth’s axis, it also has a wobble or eccentricity, not unlike the wobble of a spinning top as the spin decreases. This is known as precession and it changes the attitude of the Earth in its orbit. If a hemisphere is pointed toward the sun at perihelion, that hemisphere will be pointed away at aphelion, resulting in a more extreme difference in seasons. This seasonal effect is reversed for the opposite hemisphere. Presently our northern summer occurs near aphelion.
From these relationships Milankovitch calculated a link between global ice volume and insolation resulting from variations in the Earth’s orbit. He focused his analysis on summer insolation at 65 degrees north, reasoning that cooler summers might reduce summer snow melt, which would result in a positive accumulation of snow and ice and the development of ice sheets. Milankovitch’s work was ignored for about 50 years and his theory was strongly criticized in the 1950s and 1960s by meteorologists, who argued that variations in insolation were insufficient to cause the changes he predicted. In 1976 his work was vindicated by the discovery that deep sea sediment cores did in fact correspond to periods of climate change as Milankovitch had theorized (Figure 8). In 1982 the US National Academy of Sciences commended the Milankovitch Cycle model as follows:
“…orbital variations remain the most thoroughly examined mechanism of climatic change on time scales of tens of thousands of years and are by far the clearest case of a direct effect of changing insolation on the lower atmosphere of the earth.” (National Research Council, 1982).
Nevertheless, Milankovitch’s work has fallen out of favour once more, since climatologists are reluctant to concede a role for the sun and prefer to discount variations in insolation as having a material effect on climate. Most of the current criticisms are based on lack of an ideal perfect fit to the predicted cycles. This assumes, of course, that there are no other factors influencing the climate
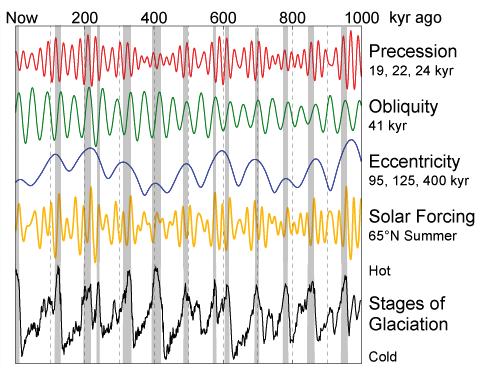
Figure 8. A diagram summarizing the effect of the Milankovitch Cycles in the last million years. The bottom curve plots the stages of glaciation which have a rather regular 100-year periodicity, corresponding, in turn, to the peak eccentricity of the Earth’s orbit. Just as striking, however, are the regular 15-20,000-year warm periods. Most observers looking at this periodic cycle would conclude that we may very well be reaching the end of the current warm cycle although presently the Earth’s orbit has low eccentricity (nearly circular) (Source: Orbital data - Quinn et al. 1991; glacial cycles - Lisiecki and Raymo, 2005).

Figure 9. Solar activity from 1700 with Abdussamatov’s projections beyond the year 2000. According to the author, the sun is at the end of a 200-year solar cycle. The continuation of warming is attributed to the thermal inertia of the oceans as a result of warming during the 20th Century. Beyond 2000, the author forecasts a sharp decline in solar activity. The peak at the year 2000 is Sunspot Cycle 23 and that Abdussamatov’s forecast for Cycle 24(made in 2006) is lower than the most recent projection from NOAA in January 2009. On this basis, the analysis of the solar radius has greater predictive ability for the variability of the solar cycle (Source: Solomon, 2008).

Figure 10. This graph shows the progression of the Average Planetary Magnetic Index which is a measure of the solar particle radiation by its magnetic effects. The Index shows a significant decline with a distinct step in October 06 to values ranging from 7-8. Since then, there has been a further sharp decline to values of 3 or 4, the lowest ever recorded. All of this suggests that the sun has made a transition from a very active cycle to an inactive period. This may have the characteristics of a Dalton Minimum of the 1800s (Source: NOAA/ SWPC. Boulder, Colorado).
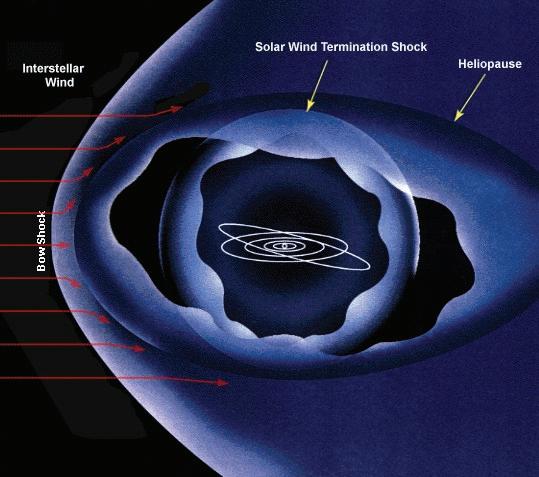
during the periodicity of the Milankovitch Cycles which, as we will discuss, is not the case. The sunspot cycle undoubtedly has an influence but this occurs over a shorter time frame than the major glacial cycles.
A number of researchers have studied longterm patterns of sunspot cycles in order to detect longer-term trends. Commonly the approach is to run an autocorrelation analysis to detect statistically significant cycles. (e.g., Cole, 1973; Neftel, Oeschger, and Suess, 1981). Typically such studies identify a 200-year cyclicity in minima to maxima of the sun’s 11-year sunspot cycle.
Khabibullo Abdussamatov (2007), a Russian space researcher, also determined that sun spots occur in 200-year cycles. For example, he regards the period of the Medieval Warm Period to the conclusion of the Little Ice Age (LIA) as the first 200year cycle. The second cycle is from the end of the LIA until the present. (Figure 9). Abdussamatov attributes the lag in cooling to the thermal inertia of the oceans, which have an immense heat capacity, and have been warmed significantly during the 20th Century. As Figure 9 suggests, Abdussamatov’s projections may prove to be accurate since he records a sharp dropoff in the year 2000, with a minima at or before the year 2040. The current behaviour of the sun is actually lower than the Abdussamatov forecast and indicates that we may be entering a period of global cooling. The projections are not based on analysis of individual sunspot cycles, but on observations of the solar radius, which is directly related to solar activity. It was noticed during the Maunder minimum of the LIA, that the quiescent sun’s radius decreased significantly, thus the measure of solar radius and its behaviour provides a guide to broader cycles of the solar activity. Recently released data indicates that the Total Solar Irradiance and the Average Planetary Magnetic Index (AP) are declining, and are now at the lowest levels since the 1930s when recording started (Figure 10).
The AP index is designed to measure solar particle radiation by its magnetic effects and provides a measure of the sun’s magnetic field, the heliosphere. The heliosphere is the result of a constant stream of charged particles, the solar wind, emanating from the sun, which extends the sun’s magnetic field far into space. The solar wind was discovered in 1958, and space probes now show that it extends far beyond the sun and the solar system into interplanetary space. To provide some measure of the scale of the heliosphere,
(Continued on page 36...)
Figure 11. An illustration of the Heliosphere in relation to the solar planetary system and interstellar space. Variations in the sun’s activity will result in expansion or contraction of the Heliosphere which is also modulated by the strength of the cosmic flux of the interstellar wind (Source: NASA Basics).
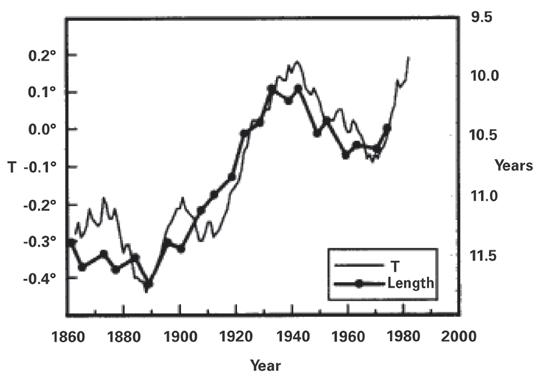
Figure 12. A plot of the sunspot cycle length versus the Northern Hemisphere land temperature that shows a remarkably good correlation over the last 130 years. On average, cycles are eleven years but it is known that the cycles are shorter when activity is strong and are longer when activity is weak. Although this correlation is convincing that there is a sun-Climate link it has been systematically ignored by IPCC (Source: Friis-Christensen and Lassen, 1991).
(...Continued from page 35)
light or any unimpeded cosmic particle will take some 20 hours to travel from the outer limit of the heliosphere into the centre of the solar system, compared to eight minutes for light from the sun to reach the earth. So, not only does the sun provide us with its energy, but the heliosphere is like a giant umbrella protecting us from a potentially devastating
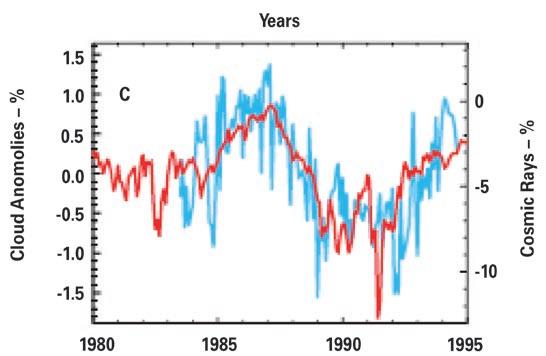
Figure 13. This diagram was developed by observing the changes in cloudiness as observed by geostationary satellites and comparing this with the variations in cosmic radiation. The coincidence of the changes in the cloud cover with the changes in cosmic radiation intensity is remarkable and provides compelling evidence of the sun’s role in the cosmic ray cloud feedback system (Source: Marsh and Svensmark, 2000).
rain of cosmic energy (Figure 11, page 35). The boundary of the heliosphere fluctuates according to surges of cosmic energy and the competing energy of the solar wind.
Approximately 50-70% of incoming cosmic radiation is deflected by the heliosphere, with the remaining cosmic energy reaching the Earth, where it is, in part, deflected

CSPG Calendar
2010 Call for Photos
$200 Prize for Best Photo
$200 Prize for Best Canadian Photo
Deadline: June 30, 2009
• Any Landscape Oriented Photo of Geological Interest – Canadian or International
• Digital Photos Only. Files must be tiff or quality jpeg with a minimum resolution of 3 megapizels.
To submit your photo, use our online submission form at www.cspg.org via the Publications tab. If you have any questions, please contact Dave Hills at david.hills@dvn.com.
by the magnetic field. In the atmosphere, primary particles are to a large extent brought to halt in collisions. The release of energy yields millions to billions of secondary particles that dissipate steadily towards sea level. Measurements indicate that cosmic rays show a 25-30% decrease following periods of high sun-spot counts when the solar wind is strong. Therefore, there is a link between the sun’s TSI and its deflection of cosmic energy, which has significant effects on Earth’s climate.
This new scientific field of cosmo-climatology was started by a pioneering paper in 1991 by Friis-Christensen and Lassen in which they documented a close relationship between solar activity and the surface temperature of the earth (Figure 12). Subsequently, in 1997, Svensmark and Friis-Christensen, in a landmark paper, documented a relationship between global cloud coverage and cosmic ray flux. These findings were expanded by Marsh and Svensmark in 2000, describing the manner in which low cloud properties, in particular, are influenced by cosmic rays. Figure 13 shows a quite remarkable correlation between the changes in the cloud cover in the troposphere and the associated variation in cosmic radiation intensity in the period from 1984-1994. One can readily see that the more cosmic rays enter the troposphere, the more cloud develops. Cosmic rays ionize the molecules of the atmosphere transforming them into condensation nuclei for water vapour.
I think we can say that these findings were greeted by hostility from the promoters of Anthropogenic (man-made) Global Warming theory. It would be fair to say that there was
Photo by Glen Stockmal.
a deliberate attempt to discredit Svensmark’s research and to forestall approval of funds to determine experimentally the nucleation of clouds by cosmic rays. It was, therefore, not until 2006 that Svensmark and his team was able to embark on an experiment in which a reaction chamber the size of a small room was constructed in the basement of the Danish National Space Center. The gases in the chamber mimicked the chemistry of the lower atmosphere. Naturally occurring cosmic rays entered through the ceiling. The result demonstrated quite conclusively that cosmic rays induced and catalyzed cloud condensation nuclei. The intensity of the reaction surprised the investigators who had expected only a moderate response. This confirmed Svensmark and his collaborators’ interpretation that quite small changes in cosmic radiation could have a significant effect on climate through the promotion of cloud cover (see Svensmark and Calder 2007, “The Chilling Stars” for an excellent review on cosmoclimatology).
So now it is apparent that there is a feedback mechanism associated with the sun’s drop in energy output and the production of aerosols, the precursors for the formation of cloud droplets, by interaction of cosmic rays in the troposphere. Although the
decline in observed TSI may be small, it signals a drop in the energy of the solar wind and a greater influx of cosmic rays. This in turn produces more cloud and lowered temperatures. Climate models only include the effects of the small variations in the direct solar radiation without the feedback effects of cosmic rays on clouds. Also, as already discussed in an earlier article, the work of Spencer (2009) demonstrates that the model feedback assumptions are wrong in the first place,
The other element in this great clash of cosmic energy is the variability and intensity of cosmic rays. The greatest generation of cosmic rays comes from stellar explosions called supernovae which occur about once every 50 years in a galaxy such as the Milky Way. They cause a brilliant luminous burst of radiation which briefly may outshine an entire galaxy before fading in a few weeks or months. During this brief interval, a supernova can radiate as much energy as the sun in its entire life span (Giaccobe, 2005). The explosion expels most of the stellar material at a velocity at up to one-tenth of the speed of light, driving a shock wave through the interstellar medium.
Nir Shaviv, an Israeli physicist, working on
iron meteorites noticed that some samples displayed extensive cosmic ray damage while others were little affected. What he determined was that meteorites sustained 2-5 times the damage, while traveling through the spiral arms of the Milky Way Galaxy, as they did in the relatively empty space between the spiral arms (Shaviv, 2002).
This seemed logical since the supernovae, the source of cosmic rays, are most likely to be located in the spiral arms. Our Milky Way Galaxy is a disc-like body with curved arms radiating from its centre and, through time, the solar system travels through the galaxy. The solar system revolves around the galaxy’s centre so that every 135 million years (plus or minus 25 million years) we should expect a colder climate as the solar system passes through a spiral arm. Within the spiral arm, the cosmic ray density would be sufficient to change Earth’s cloud cover by 15% – more than enough to change the state of the Earth from a hothouse with temperate climates extending to the polar regions, to an ice house with extensive polar ice caps. Shaviv argues that cosmic ray fluctuations explain more than two-thirds of Earth’s temperature variations, and on geological time scales, are the most dominant climate drivers. This conclusion is (Continued on page 38...)
based on the comparison of cosmic ray flux variations compared to a reconstruction of temperature derived from studying oxygen isotope in the shells of fossils from tropical oceans (Veizer, 2000; Shaviv and Veizer, 2003). The results of this comparison are presented in Figure 14 where the match of cosmic ray flux with reconstructed temperature is close to a 100% correlation, leaving little room for other potential climate drivers such as CO2 . Furthermore, when comparison of reconstructed CO2 values (GeocarbIII; Berner and Kothvala, 2001; Berner and Streif, 2001; Rothman, 2002) is made with Phanerozoic climate trends, the correlation is poor (Figure 15). Possibly CO2 reconstructions can be improved, but the high correlation with celestial drivers indicates that CO2 can not have a significant role in climate variability over geological time scales. The fundamental problem is that there is no natural system that can act over geological time scales to add or remove CO2 from the atmosphere. The oceans are the main reservoir of CO2 so that in cold cycles atmospheric CO2 should be reduced, and increased as the ocean warms. Therefore changes in atmospheric CO2 follow climate change.
What emerges from this review is that climate is subject to a series of cycles operating on different time scales but modulated by the activity of the sun and its interplay with the Cosmic Ray Flux. On short time scales of decades and centuries, the sun spot activity, together with negative feedback from cosmic ray flux, are the principal climate drivers inducing the modulation of our current warm period, and the historic variation indicated by the Little Ice Age, Medieval Warm Period, Dark Ages Cooling, Roman Warm Period, etc.. On the scale of millennia are the Milankovitch Cycles where changes in insolation related to the attitude and proximity to the sun cause glaciation with a distinct 100,000 year or 40,000 year periodicity. Finally there is the millionary celestial cycle with a period of 143 (plus or minus 10 million years) as the sun travels through the Milky Way Galaxy, changing the Earth’s climate from icehouse to greenhouse with the modulation of the Cosmic Ray Flux. If CO2 has any role in this cosmic journey it is very minor and probably co-incidental.
REFERENCES
Abdumassatov, K. I. 2007. Optimal Prediction of the Peak of the Next 11-year Cycle and of the Peaks of Several Succeeding Cycles on the Basis of Long-Term Variations in the Solar Radius or Solar Constant. Kinematika i Fisika Nebesnykh, Tel 23, no. 3.
Berner, R. A. and Kothvala, Z. 2001. GEOCARB (...Continued
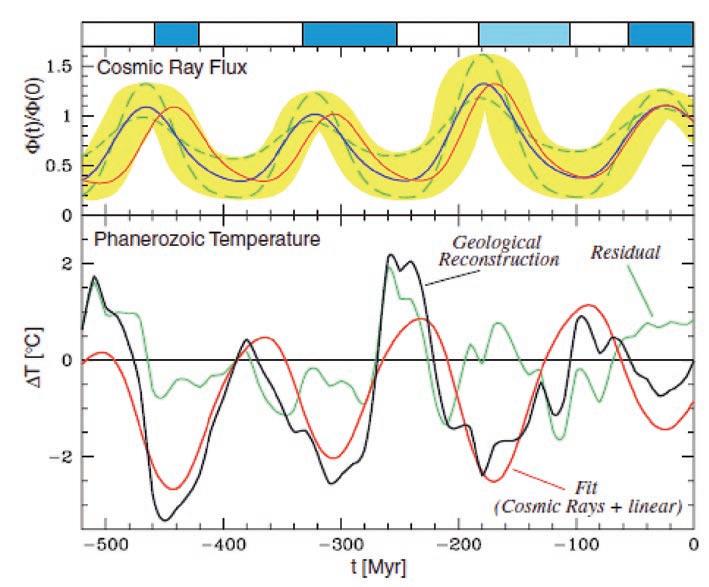
Figure 14. A comparison of the Cosmic Ray Flux (CRF) constructed from iron meteorite exposure data (Shaviv, 2002b). The blue line depicts the nominal CRF, while the yellow shading delineates the error range. The other curves denote other CRF reconstructions leading to the final fine-tuned blue reconstruction. The bottom black curve depicts a statistically smoothed curve of temperature spanning 500m.y. (Veizer et al., 2000). The red line is the model reconstruction for temperature based on the CRF flux (red line upper). The blue bars at the top represent cool climate modes with established polar ice caps (icehouses) while the white bars represent times of warmth (greenhouses) as developed from sedimentological criteria (Frakes and Francis, 1998; Frakes et al., 1992). The figure demonstrates that the ‘icehouses’ and oxygen isotope cold intervals coincide with times of high CRF production, while the greenhouse intervals are characterized by low CRF episodes (Source: Shaviv and Veizer, 2003).
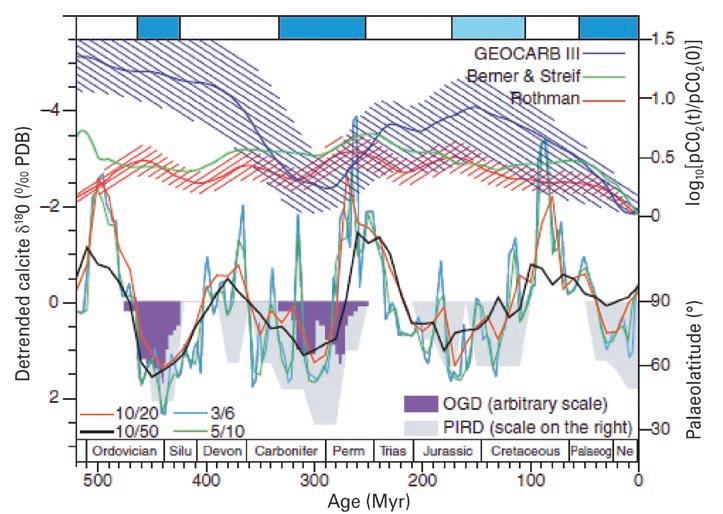
Figure 15. Climate indicators for Phanerozoic geological epochs derived from oxygen isotope ratios plotted with the reconstructed partial pressure of CO2. (pCO2) levels. The bottom set of curves are the running means for various filters as indicated bottom left and yield a proxy for temperature. The shading on the bottom curves reflects the distribution of glacial deposits (OGD) and the paleolatitudinal deposits of ice-rafted debris (PIRD). The blue and white bars are as described in Figure 14 reflecting cold or warm climates. The upper set of curves outlines the reconstructed histories of past pCO2 variations (data from Geocarb III by Berner and Kothvala, 2001; Berner and Streif, 2001; and Rothman, 2002). Cross-hatching reflects error range in the reconstructions. It is clear on the basis of this data set that CO2 has no significant correlation with Phanerozoic climate (Source: Shaviv and Veizer, 2003).
III: A revised model of atmospheric CO2 over Phanerozoic time. American Journal of Science, v. 301 p. 182-204.
Berner, U. and Streif, H. 2001. Klimafakten Der Ruckblick Ein Schlussel fur die Zukunft. Stuttgart, Science Publishers, 238 p.
Cole, T. W. 1973. Periodicities in Solar Activity. Solar Physics v 30.
Frakes, L. A. and Francis, J. E. 1988. A guide to Phanerozoic cold polar climates from high latitude ice rafting in the Cretaceous. Nature, v. 33, p. 547-549.
Frakes, L. A., Francis, J. E., and Syktus, J. I. 1992. Climate modes of the Phanerozoic; The history of the Earth’s climate over the past 600 million years. Cambridge, Cambridge University Press, 286 p.
Friis-Christensen, E. and Lassen, K. 1991. Length of Solar Cycle: An Indication of Solar Activity Closely Associated with Climate. Science, v. 254, no. 5032, p. 698-700.
Giaccobe, F. W. 2005. How a Type II Supernova Explodes. Electronic Journal of Theoretical Physics v. 2, no. 6, p. 30-38.
Intergovernmental Panel on Climate Change.
ROCK SHOP
2007. Climate Change: Historical Overview of Climate Change Science. Fourth Assessment Report. Geneva, Switzerland.
Lisiecki, L. E. and Raymo, M. E. 2005. A PliocenePleistocene stack of 57 globally distributed benthic Oxygen 18 records. Paleoceanography, v. 20, PA1003.
Marsh, N. D. and Svensmark, H. 2000. Low Cloud Properties Influenced by Cosmic Rays. Physical Review Letters, v. 85, p. 5004-5007.
Milankovitch, M. (see: www.earthobservatory. nasa.gov/Features/Milankovitch).
Neftel, A. Oeschger, H. and Suess, H. E. 1981. Secular Non-random Variations of Cosmogenic Carbon 14. Earth and Planetary Science Letters v. 56, no. 12, p. 127-137, 141-147.
Quinn, T. R., et al. 1991. A Three Million Year Integration of the Earth’s Orbit. The Astronomical Journal, v. 101, p. 2287-2305.
Rothman, D. H. 2002. Atmospheric carbon dioxide levels for the past 500 million years. Proceedings of the National Academy of Sciences, v. 99, p. 4167-4171.
Shaviv, N. J. 2002a. Cosmic ray diffusion from the galactic spiral arms, iron meteorites and a
possible climate connection? Physical Review Letters, v. 89, 051102.
Shaviv, N. J. 2002b. The spiral structure of the Milky Way, cosmic rays, and ice age epochs on Earth. New Astronomy, v. 8, p. 39-37.
Shaviv, N. J. and Veizer J. 2003. Celestial Driver of Phanerozoic Climate. GSA Today, v. 13 no. 7, p. 4-10.
Spencer, R. W. 2009. Satellite and Climate Model Evidence against Substantial Man Made Climate Change. In Press. Journal of Climate, also at www.drroyspencer.co.
Svensmark, H. 1998. Influence of cosmic rays on Earth’s climate. Physical Review Letters, v. 81, p. 5027-5030.
Svensmark, H. and Calder, N. 2007. The Chilling Stars: A Cosmic View of Climate Change, Icon Books Ltd. U.K.
Svensmark, H. and Friis-Christensen, E. 1997. Variations in Cosmic Ray Flux and Global Cloud Coverage – a Missing Link in Solar Climate Relationships. Journal of Atmospheric and SolarTerrestrial Physics, v. 59 p. 1225-1232.
Veizer, Jan. 2003. Celestial climate driver: a perspective from four billion years of the Carbon cycle. Geoscience Canada, v. 32, p. 32-3


2009 CSPG CSEG CWLS CONVENTION
2009 Core Conference
The 2009 Core Conference Committee is pleased to welcome the following list of core displays that will capture the spirit of this year’s Frontiers + Innovation theme. The core displays represent many of the current frontier regions that will require innovations and technologies geared to solving our many challenges going forward. From describing the depositional setting of the Bakken Formation in southeast Saskatchewan to the complexities of the Grosmont Formation in northern Alberta, this year’s Core Conference will create an opportunity for you to explore the many frontiers of the geoscience community.
New this year, the Core Conference will begin Thursday, May 7 and run from 10:00am to 4:00pm, then continue Friday May 8 from 8:30am – 12:00pm, followed by an afternoon Core Meltdown. As always, the Conference will be held at the worldclass facilities of the ERCB Core Research Centre.
A Late Tertiary Shift in the Stress Regime in the Williston Basin of southeast Saskatchewan
John Lake* and Donald Kent
Depositional Setting of the Upper Devonian – Lower Mississippian Bakken Formation of Subsurface Saskatchewan: Integrating Sedimentologic and Ichnologic Data
Solange Angulo* and Luis Bautois
Stratiform Carbonate Breccias of the Grosmont Formation, Alberta Part B: Petrography and Origin
John Hopkins* and Kent Barrett
Update on the Bakken in Southeast Saskatchewan: Stratigraphic Relationships, Sedimentology, and Diagenesis Explored
Erik Nickel* and Dan Kohlruss
The Control of Dolomitization on Porosity in the Upper Devonian Jean
Marie Carbonate of Northeastern British Columbia
Jack Wendte*, Alan Byrnes, and David Sargent
A Stratigraphic Framework for the Jurassic-Cretaceous Nikanassin Group, Northwestern Alberta, Canada Brett Miles*, Stephen Hubbard, Keegan Raines, Ross Kukulski, Robert Fisher, and John-Paul Zonneveld
The Grosmont C at Saleski, Northern Alberta: A Solution-Enhanced, Highly Fractured Dolomite Reservoir Jen Russel-Houston*, Cornelius Rott, Peter Putnam, and Robert McGrory
Reservoir Characteristics and Architecture of the Cypress / Merryflat Pool, Southwestern Saskatchewan and Southeastern Alberta
Della Loggie*, Gord Howell, Janice Choi, Julianne Fic, Joe Sitch, Melissa Siueira, Paolo Grossi, Sabina Zaidi, and Per Kent Pedersen
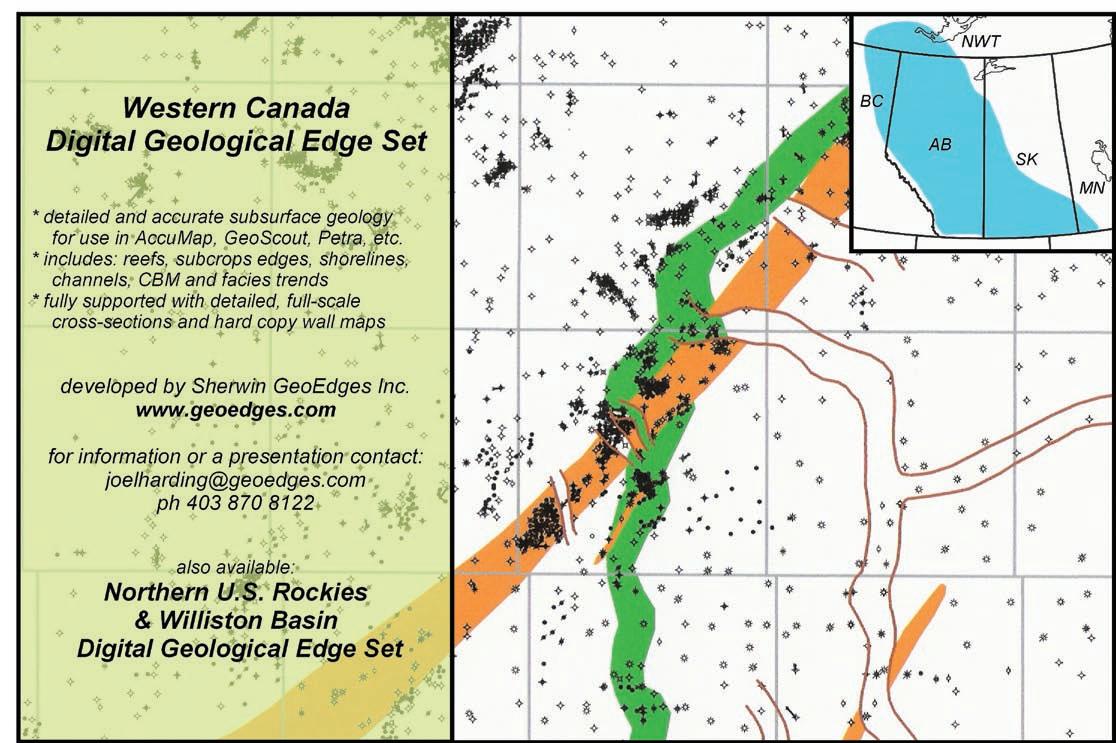

10 GREAT COURSES ON THE BUSINESS OF PETROLEUM EXPLORATION.
• Risk Analysis & Decision Making in E&P
• Petroleum Resources & Reserves: An Overview of Recommended Geological Practices
• Decision Methods and LNG Value Chain
• Creativity in Exploration
• Keys to Complex Well Economic Success
• Think on Your Feet—The Importance of Clarity, Brevity and Impact™
• The Energy Industry from the Investor’s Perspective: How will the new policies affect investment strategies?
• Exploration Success and Failures from Pore Pressure Assumptions
• Farm-ins and Farm-outs for Explorationists The 4th Annual AAPG Fall Education Conference September 21-25, 2009 / Norris Conference Center / Houston, Texas
• Knowledge Transfer in the Multi-Generational Workplace
49th ANNUAL CSPG CLASSIC
Elbow Springs Golf Club • June 17-19, 2009
The Golf Committee would like to thank the following sponsors:
2008 Diamond Sponsors
geoLOGIC systems ltd.
2008 Emerald Sponsors
AGAT Laboratories Ltd.
GeoStrata Resources Inc.
IHS
ProGeo Consultants
Schlumberger of Canada
RECON Petrotechnologies Ltd.
Tristone Capital Inc.
Weatherford Canada Patnership
Wildcat Scouting Services (1991) Ltd.
2008 Platinum Sponsors
Arcis
Baker Atlas
Belloy Petroleum Consulting
CSPG
Devon Canada Corporation
Divestco
Fugro Data Solutions Canada Inc.
GLJ Petroleum Consultants
LogTech Canada Ltd.
2008 Gold Sponsors
ATB Financial
Athabasca Oil Sands Cor[p.
Beaver Drilling Ltd.
Boland Exploration Consulting
Canadian Discovery Ltd.
Continental Laboratories Ltd.
Fekete Associates Inc.
Genesis Executive Corporation
Greystone Resources Ltd.
Hotwell Canada Ltd.
Jimel Oilfield Scouting Services Ltd.
Pajak Engineering Ltd.
2008 Silver Sponsors
AON Reed Stenhouse
Martin Quinn Esq.
Core Laboratories Canada Ltd.
Gabel Energy Inc.
Hycal Energ y Research Labs
Hydro-Fax Resources Ltd.
2008
Bronze
MD Totco Nov. Wellsite Gas Watch
M J Systems
Pason Systems Corp.
Rundle Energy Partners
Ryan Energy Technologies
Tucker Wireline Services
West Canadian Vega Estate Planning Corp.
Paradigm
Paramount Resources Ltd.
Petrocraft Products Ltd.
Polaris Resources Ltd.
Regent Resources Ltd.
RGS Consultants Ltd.
Scotia Waterous
Sproule Associates Limited
Tectonic Energy Consulting Inc.
Halliburton Group of Canada
ConocoPhillips Canada
Painted Pony Petroleum Ltd.
Montane Resources Ltd.
Quality Trophies and Engraving Ltd.
Sample Pro Ltd.
Seismic Brokerage Services Ltd.
Trivision Geosystems
Wild Rose Geological Services Ltd Ltd.
Sponsors
Aguila Exploration Consultants Ltd.
Candian Stratigraphic Services
Crow River Resources
Dack Resources Ltd.
IEXCO Canada Inc.
Petro Tech Printing
San Dago Resources Ltd.
Registration Form
NAME:
SPOUSE’S NAME:
COMPANY:
ADDRESS (Bus.):
POSTAL CODE:
TELEPHONE: CELL PHONE:
E-Mail:
SHIRT SIZE: q S q M q L q XL q XXL
All contestants are required to have a photo (any will do) in the Golfer’s Photo Roster. New applicants or former contestants who do not meet this request are considered to have submitted an incomplete entry. Former contestants who have submitted a photo in the past need not do so again.
Handicap / Golf Index __________________ or
Average of best three 18-hole scores in past 2 years:______________
Entry Fee: Includes three rounds of golf with power cart; Paid driving range; Door prize draws; Skill prizes; BBQ (at Elbow Springs) and Awards Banquet (Calgary Petroleum Club) both for you and your guest.
Cost: $395.00 Tournament Fee
To assist the Entertainment Committee with budgeting, please indicate if you plan to attend the two major social events of the tournament: Wednesday Barbecue: Self: Yes q No q Guest: Yes q No q Friday Awards Banquet: Self: Yes q No q Guest: Yes q No q
Social Events Cancellation: Contact Craig Boland with 48 hours notice.
Make Cheques Payable To: CSPG (Classic Golf)
Send Entries To: CSPG Classic Golf Tournament 600, 640-8th Avenue S.W. Calgary, AB, T2P 1G7
Attention: Craig Boland
For more information call Craig Boland: (403) 861-8686 E-mail: craig.boland@shaw.ca
Early Bird Deadline May 6, 2009. Qualify for Early Bird Draw Prize.
Entries received after May 27, 2009 will be accommodated based on availability.
* Please photocopy your entry form and cheque before mailing. No receipts issued. ** All cancellations received after May 20th subject to a administrative fee ($60) and must be submitted to Craig Boland via email craig.boland@shaw.ca or fax (403) 264-5898. No refunds after June 3, 2009.
On-Line Registration Information:
Use CSPG Membership Log-In, Go to Event Registration-Social Events, CSPG Classic
Mail/Courier Registration: Print this registration Form (http://www.cspg.org/events/events-social-classicgolf.cfm) send to CSPG Office with cheque.
Get your registration in early to confirm your spot in this year’s tournament and preference in the 50th Annual Tournament. This event has eighteen flights catering to all levels of player from Beginner to the Scratch player. New Golfers are welcome, with all new entries ranked chronologically.
49 TH ANNUAL CSPG CLASSIC GOLF TOURNAMENT
Networking with a Nine Iron
| by Mike Laberger, CSPG Classic Golf Chair

The 49th Annual CSPG Classic Golf tournament will be held this year from June 17 to 19, 2009 at the Elbow Springs Golf Club located just west of Calgary on Highway No.8. This tournament is a traditional networking event where geoscientists and oil and gas industry service representatives mix in a fun social atmosphere and maintain connections in these dynamic times.
The tournament will accommodate 144 to 176 golfers catering to all levels of player from beginner to the scratch golfer. It is open to ladies and men who will golf alongside each other in a match-play format. Your registration includes three rounds of golf with power cart, door prizes, skill prizes, and BBQ at Elbow Springs on Wednesday and Thursday. The Friday evening Awards Banquet will be held at the Calgary Petroleum Club complete with dinner and dancing. Visit the photo galleries from last year’s event at http://picasaweb.google.ca/foonder/2008_ CSPG_Classic_Candid_Daily# and http:// picasaweb.google.ca/foonder/CSPG_Classic) Golf_2008_Flight_Groups.
The 49th Annual CSPG Classic Golf Tournament welcomes charity partner, “WELLSPRING,” a volunteer organization that provides cancer support and education. WELLSPRING will benefit from special events held during the tournament through silent auction draws that culminate at the Friday evening banquet.
This year, we are using online registration services at the CSPG website www.cspg. org/events/events-social-classicgolf.cmf to collect the registration information and fees. We have an Early Bird deadline May 6, 2009 which qualifies registrants for an Early Bird Draw Prize. New golfers are welcome with all new entries ranked chronologically. Questions regarding registration can be directed to Craig Boland at (403) 861-8686 or craig.boland @shaw.ca.
One more year to the milestone 50th Annual Golf Classic in 2010. Get your registration in early to confirm your spot in this year’s tournament and preference to participate in the grand celebration of the 50th.
2009 COMMITTEE
name company
Mike LaBerge Channel Energy Inc
Andreas Georgousis Divestco.com
Bob Earle PROGEO Consultants
Brenda Pearson Birchcliff Energy
Craig Boland Boland Exploration Consultants
David Grinde GMP
Foon Der Typhoon Energy
Frank Pogubila Ryan Energy
Fred Pember Dejour Energy
George Ardies Consultant
George Bowley Colonia Energy Corp
Gerald Wendland Rustler Petroleum
James Ablett RECON Petrotechnologies
Matt Earle Paradigm Geophysical
Mike Swain MD Totco
Richard Chisholm Oxford Petroleum Corp
Scott Thain PROGEO Consultants
Lisa Abbott, Thera Bignall, Murray Larson, Lois Zver
On Course – Recent Sand Deposits: “Stay out of the lows!”
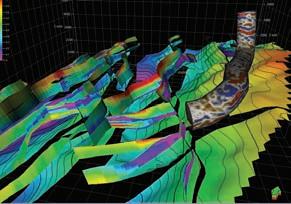

Petrel* 2009 gives me an advantage no other application can offer— the ability to work with huge seismic volumes and giant high-resolution models leveraging all the latest compute technology: 64-bit processing, memory addressing, parallel processing, and advanced graphics— that really makes the difference in my productivity.
(...Continued from page 7)
Symposia and Williston Basin guidebooks, etc. – all going back to 1931. In addition, CSPG Luncheon talks since 2003, as shown in the monthly CSPG Reservoir, have just been added.
Geologists wishing to research specific formations, areas, or subjects, can easily do so by accessing the CSPG website at www. cspg.org. The Publications Index is found under the Publications area on the website.
References to individual CSPG papers can be retrieved by selecting Keywords – defined as subjects discussed at considerable length – and which include geologic ages (e.g., Cretaceous, Lower), geologic formations (e.g., Cardium or Slave Point Fm), or areas (e.g., Calgary area, Grand Banks) or subjects, (e.g., hydrodynamics, source rocks, climate change). To select keywords to be retrieved, simply type the keyword in the space following “Subject/Author” and then hit the “Search” button.
References to papers can be retrieved geographically by NTS (National Topographic System) area, as well as by province or country. To determine the appropriate NTS area, refer to the pages listing the Alberta or Canada NTS areas.
One of the major advantages of this on-line Index is the ability to retrieve lists of all available keywords which can be searched and the number of times each keyword appears in the Index. To access this keyword listing, hit the “Available keywords” button and then select the first alphabetic letter of the keywords desired.
Retrievals can be combined – e.g., all CSPG papers referring to the Viking Fm in NTS area 083H (Edmonton area). Or papers referring to the presence of two keywords are retrieved by separating the keywords with a comma.
Finally, new volunteers are urgently needed for the CSPG Index Committee. Meetings to select appropriate keywords from recent CSPG Bulletins and Reservoir papers are held at the CSPG Office over the noon hour every 3-4 weeks, and provide increased familiarity with CSPG publications.
CSPG Publications Index Committee
• Peter Hay, Retired
• Michele Innes, Sword Energy Inc
• Barrie Dargie, Micat Resources Ltd.
May 4-8, 2009 CSPG CSEG CWLS CONVENTION
Roundup Centre & ERCB Core Research Centr e, Calgary , Albert a
Students: The New Frontier
Places to go & Things to do during the 2009 CSPG CSEG CWLS Joint Annual Convention
• Visit the Student Lounge Area located on the Exhibit Floor
– Where you can get information, network, play games and enter draws!
• Network with industry professionals at the Geoconvention Gala (Monday May 4th, 4 – 6 PM)
• CSEG Challenge Bowl (Tuesday May 5th, 4 – 6 PM)
– Enter to win a trip to the 2009 SEG Convention in Houston!
• Participate in Field Trips
Refer to the Student Insert in the Registration Package for more Information Volunteer for FREE Admission to the 2009 Annual Convention!! Visit www.geoconvention.org for more information


Student Travel Bursaries are available for the 2009 Convention! Please visit www.cseg.com/students for more information
*Due to the limited amount of available bursaries, students presenting will be given first priority.


GET THE BEST RESULTS for your CSPG calendar submissions
| by Dave Hills, Geological Calendar Chair
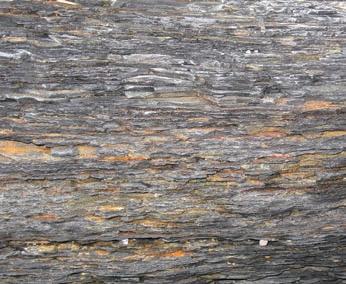
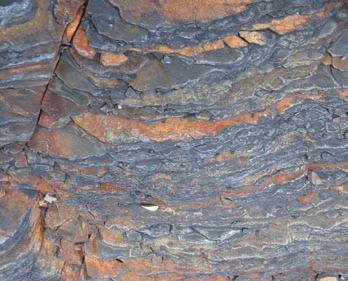
It’s that time of year again when the Geological Calendar Committee pokes its head out of its winter den, sniffs the air, and starts getting the house ready for another Geological Calendar. This is also field trip season for many of our members, which offers golden opportunities to take the perfect photograph for next year’s CSPG Geological Calendar. With that in mind, I thought I would take the opportunity to show what I think makes the perfect calendar photograph.
To start, let’s assume two things: that the photograph in question is technically adequate (i.e., the resolution, exposure, focus, etc., are fine) and that the object of geological interest is good, but not great (artistic merit can sometimes take a back seat when the geology is just awesome). What we are left with then is your approach to taking the shot and how to balance information with aesthetics in its composition.
To illustrate this point of composition, let’s take a look at three shots taken of the Exshaw outcrop at Jura Creek near Canmore, Alberta. At top, this photo (Figure 1) is a typical rock shot. With the exception of not having a scale, this is the type of shot one would expect from a thesis, conveying maximum geological information regarding the laminae thickness, continuity, and so on. It is, however, pretty dull unless you’re ‘into’ shales (you know who you are). A second image taken from a higher vantage point (Figure 2) and from a short distance pulls out
the upper, oxidized surfaced of the shale laminea, but again fails to impress. Both photographs are able to project a lot of geological information, but this is at the detriment of artistic flare.
In the third image (Figure 3), the photographer has taken a completely different approach to the problem. Here, he has opted for a side-on angle of view and the results are quite stunning. Primarily, the image captures the third dimension
fantastically, with good use of the camera’s depth of field, and an angle that shows the rounded nature of the rock face. Also, the choice of focussing the camera on a relatively close piece of the rock face pulls the viewer to look at a section in greater detail. So, despite the majority of this image being out-of-focus, I would suggest that it conveys more information than either of the other two shots by giving the viewer a better understanding of the form of the rock face. If you are thinking that this is purely down to some fancy camera work with expensive equipment, bear in mind that all three images have been taken with a simple point-and-shoot digital camera.
This is only one example of how a different viewpoint has transformed an average photograph into something more interesting. Other ways of spicing up a rock-shot is to compose your image with something in the foreground and / or background that enhances the subject matter. Something else to consider is the time of day when the shot is taken. Midday images are typically lacking many shadows, which would enhance an image by giving it more form. However, images taken when the sun is low will pull out forms far better. Furthermore, the deeper colours of forms taken when lit by a setting sun give a vibrancy not found at any other time of day.
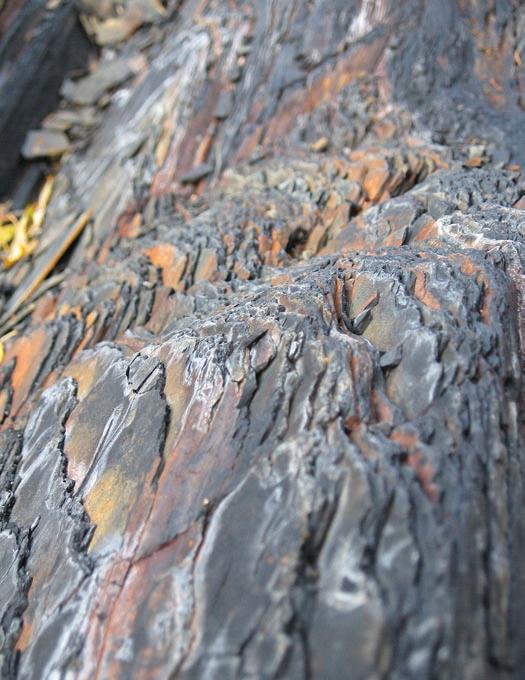
One of the best pieces of advice that I have heard, is to take a slightly different point of view when approaching a shot like this. Whether that means a different angle, lighting, or settings is up to you, but it won’t hurt to experiment. So, go forth with cameras poised, as the CSPG Calendar submissions will begin as of April, 2009 until the deadline of Tuesday, June 30. I very much look forward to seeing the results, and remember, we will again be awarding two prizes of $200 for the best Canadian photo and the best overall shot. Good luck and happy snapping to you all.
Many thanks to Hamid Farid for donating all three photographs for this article.
Figure 1. Ho Hum.
Figure 2. Better.
Figure 3. Oooh, feel the artistic merit!

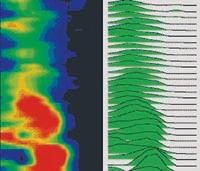
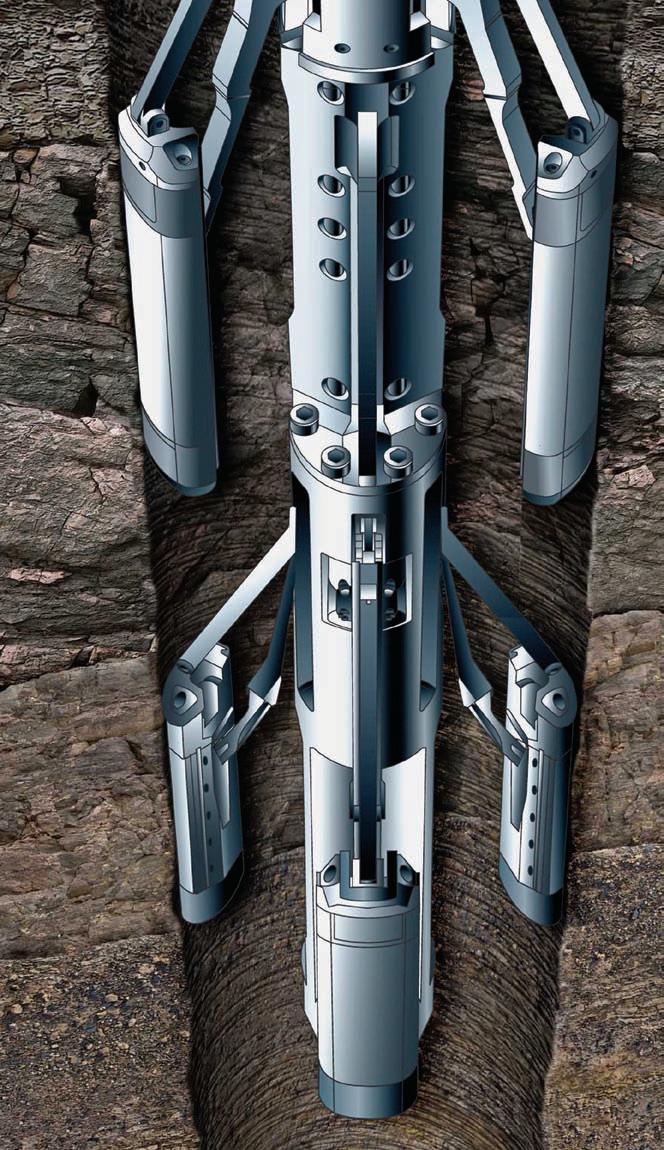


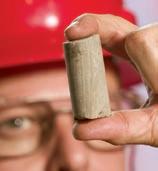

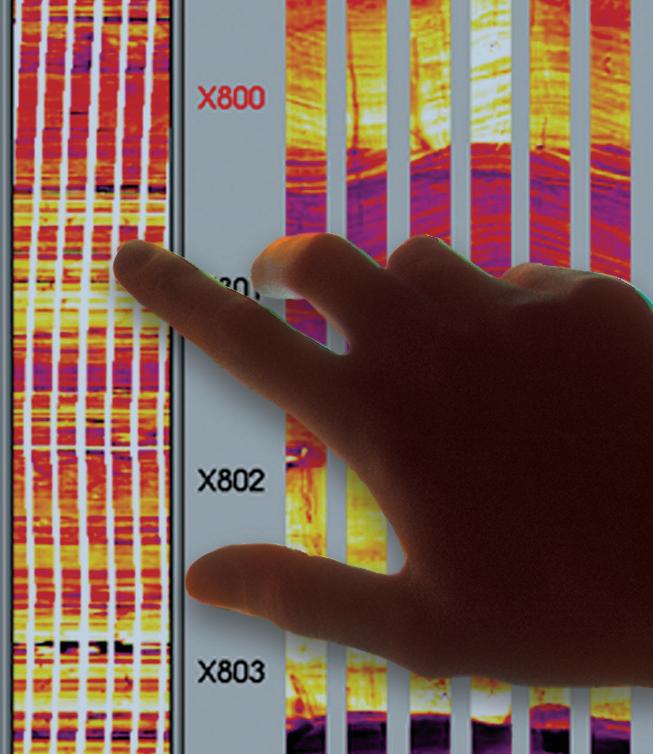
www.halliburton.com/wireline.
industry-leading customer service easy & efficient migration of existing data helping clients increase productivity

We know that almost everyone who tries geoSCOUT™ wants to use geoSCOUT. So, why hasn’t everyone already switched to geoSCOUT? Probably because, in general, people don’t like change. But, in this case, change is good – very, very good.
Just ask the thousands of landmen, engineers & geologists currently using geoSCOUT oil and gas mapping and analysis software to make solid decisions every day. Give us an hour for a demo – we know you’ll see the value. Call 403.262.1992 | Email info@geoscout.com | Online www.geoscout.com/demo Another powerful suite of tools from geoLOGIC