


IHS PETRA ® provides a unique solution to integration, analysis and manipulation of geological, geophysical, petrophysical and engineering information. With easy data loading and a powerful and flexible database, you can both effectively manage projects and quickly visualize results using interactive mapping, cross sections, log plots, cross plots and more—all within a single system. Superior technical support and proven integration of customer enhancements make PETRA the highest-ranked 1 geological interpretation tool in the E&P industry for both reliability and accuracy and ease of use. Energy information, refined.
1 Welling & Company Geological & Geophysical Software Study, 2009


#600, 640 - 8th Avenue SW Calgary, Alberta, Canada T2P 1G7
Tel: 403-264-5610 Fax: 403-264-5898
Web: www.cspg.org
Office hours: Monday to Friday, 8:30am to 4:00pm
Executive Director: Lis Bjeld
Email: lis.bjeld@cspg.org
Technical Programs and Social Events Coordinator: Dayna Rhoads
Email: dayna.rhoads@cspg.org
Publications Coordinator: Caitlin Young
Email: caitlin.young@cspg.org
Member Services Coordinator: Kasandra Klein
Email: kasandra.klein@cspg.org
Outreach Coordinator: Alyssa Middleton
Email: alyssa.middleton@cspg.org
Corporate Sponsorship: Lis Bjeld
Email: lis.bjeld@cspg.org
Convention Contacts:
Convention Manager: Aileen Lozie
Email: aileen.lozie@cspg.org
Sponsorship and Exhibits Coordinator: Alyssa Middleton
Email: alyssa.middleton@cspg.org
Please submit RESERVOIR articles to the CSPG office. Submission deadline is the 23rd day of the month, two months prior to issue date. (e.g., January 23 for the March issue).
To publish an article, the CSPG requires digital copies of the document. Text should be in Microsoft Word format and illustrations should be in TIFF format at 300 dpi., at final size. For additional information on manuscript preparation, refer to the Guidelines for Authors published in the CSPG Bulletin or contact the editor.
Technical Editors
Ben McKenzie Colin Yeo (Assistant Tech. Editor) Tarheel Exploration EnCana Corporation Tel: 403-277-4496 Tel: 403-645-7724 Email: bjmck28@shaw.ca Email: colin.yeo@encana.com
Coordinating Editor
Caitlin Young, Publications Coordinator, CSPG Tel: 403-513-1227, Email: caitlin.young@cspg.org
ADVERTISING
Advertising inquiries should be directed to Caitlin Young, Tel: 403-513-1227, email: caitlin.young@cspg.org. The deadline to reserve advertising space is the 23rd day of the month, two months prior to issue date.
The RESERVOIR is published 11 times per year by the Canadian Society of Petroleum Geologists. This includes a combined issue for the months of July and August. The purpose of the RESERVOIR is to publicize the Society’s many activities and to promote the geosciences. We look for both technical and non-technical material to publish. Additional information on the RESERVOIR’s submission guidelines can be found at http://www.cspg. org/publications/pubs-reservoir-submissions.cfm.
The contents of this publication may not be reproduced either in part or in full without the consent of the publisher. Additional copies of the RESERVOIR are available at the CSPG office for $6.50 each. No official endorsement or sponsorship by the CSPG is implied for any advertisement, insert, or article that appears in the Reservoir unless otherwise noted. All submitted materials are reviewed by the editor. We reserve the right to edit all submissions, including letters to the Editor. Submissions must include your name, address, and membership number (if applicable). The material contained in this publication is intended for informational use only. While reasonable care has been taken, authors and the CSPG make no guarantees that any of the equations, schematics, or devices discussed will perform as expected or that they will give the desired results. Some information contained herein may be inaccurate or may vary from standard measurements. The CSPG expressly disclaims any and all liability for the acts, omissions, or conduct of any third-party user of information contained in this publication. Under no


CSPG EXECUTIVE
PRESIDENT
Kirk Osadetz • Geological Survey of Canada, Calgary kosadetz@nrcan.gc.ca Tel: (403) 289-9022
VICE PRESIDENT
Robin Mann • AJM Petroleum Consultants rcmann@ajmpc.com Tel: (403) 648-3210
PAST PRESIDENT
John Varsek • Cenovus Energy john.varsek@cenovus.com Tel: (403) 645-5417
FINANCE DIRECTOR
Darren Aldridge • Baker Hughes Incorporated darren.aldridge@bakerhughes.com Tel: (403) 537-3400
ASSISTANT FINANCE DIRECTOR
Andrea Hood • geoLOGIC Systems Ltd.. ahood@geologic.com Tel: (403) 262-1992
PROGRAM DIRECTOR
Brett Norris • TransGlobe Energy Corp. brettn@trans-globe.com Tel: (403) 264-9896
ASSISTANT PROGRAM DIRECTOR
Jon Noad • Murphy Oil Corporation jon_noad@murphyoilcorp.com Tel: (403) 294-8829
SERVICES DIRECTOR
Chris Seibel • Nexen Inc. chris_seibel@nexeninc.com Tel: (403) 699-4558
ASSISTANT SERVICES DIRECTOR
Michelle Hawke • Apache Canada Ltd. Michelle.Hawke@apachecorp.com Tel: (403) 261-1200
COMMUNICATIONS DIRECTOR
Jim Barclay • ConocoPhillips Canada Jim.E.Barclay@conocophillips.com Tel: (403) 532-3889
ASSISTANT COMMUNICATIONS DIRECTOR
Stephen Hubbard • University of Calgary steve.hubbard@ucalgary.ca Tel: (403) 220-6236
OUTREACH DIRECTOR
Steve Dryer • Whiskey Jack Resources Inc. whiskeyjackresources@telus.net Tel: (403) 969-2292
ASSISTANT OUTREACH DIRECTOR
Simon Haynes • Statoil Canada Ltd. sihay@statoil.com Tel: (403) 724-0364
EXECUTIVE DIRECTOR
Lis Bjeld • CSPG lis.bjeld@cspg.org Tel: (403) 513-1228
A message from Programs Director, Brett Norris

As the baton of the conductor swept up and down in fluent but increasingly energetic movements, the orchestra responded within a fraction of a second as one, building to a crescendo, strong and loud, followed by a beautiful slow decrescendo that seemed to cause a collective exhale from the audience. Schubert Symphony No. 9 in C Major. While the music was fine, my mind was occupied wondering what management training the conductor had received that allowed him to wave his baton around and have 50-plus musicians do exactly as he wanted, and on time. Maybe it wasn’t the training so much as the baton itself? Like in Harry Potter. Maybe, I wondered, these batons might be available online for managers in industry? And if so, would it work at home? Now that could make things easier...
Music from Schubert, Bach, and other great composers of the past has been played again and again for hundreds of years. How dull is that? Of course, it is the interpretation of exactly how those great pieces get played that requires the imagination and vision, and enormous hard work behind the scenes that results in the flawless performance of that vision. This is what keeps the music fresh and the audience returning time after time. It is not simply repetition of the same old music.
So it is with an organization like the CSPG. As leadership changes, so too does the interpretation of what the organization needs to achieve and how it shall do so, all within the broader context of a great CSPG foundation, history, and volunteer and member base. The enormous work by the volunteer base behind the scenes is what makes it happen. The CSPG historically has delivered superb and often cutting-edge technical publications, conferences, training, and talks that attract a global audience. Continuing this legacy remains a strong focus of the current executive.
The variety in Programs in 2010 was excellent (GeoCanada, ICE, Luncheon Talks, Technical Division talks, Continuing Education Field Seminars, and Short Course) and the line-up for 2011 is equally strong, supported by returning veteran volunteers and new volunteers. Before introducing the key people within Programs that are making it happen in 2011, I would first like to thank Scott Leroux, last year’s Program
Director, for his help, energy, enthusiasm, patience, and pointed insights, all of which were spot on (except perhaps his prediction as to the hours required for volunteering). Taking on the role in 2011 of Assistant Program Director is Jon Noad, whom I am really looking forward to working with to continue improving the portfolio. Jon is highly motivated to do an outstanding job for the CSPG, not only because of the type of person he is, but as importantly, he understands that whatever mess we create this year he will inherit and have to clean up next year as Program Director.
Continuing Education: Carrie Jeans and David Kisilevsky are co-chairs (Short Courses and Field Seminars respectively), both returning chairs for 2011. Carrie and David are responsible for tens of CSPG field seminars and short courses organized throughout the year, including those for the annual convention and Education Week. Supporting David and Carrie is a large group of committed volunteers and CSPG office staff that provide the bulk of formalized training opportunities for the members each year. Contacts and upcoming courses and field seminars can be found on the CSPG website. Check out the new month by month view of offerings in the website “Development Calendar”.
Technical Luncheons: The 2011 chairs are Tim Bergen, Ryan Mohr, and Riona Freeman, all returning to the role, bringing valuable experience and insight. The technical luncheon committee organizes up to two full-scale talks each month, ranging in scale and scope from the microscopic to the planetary. These talks are the biggest single CSPG gatherings outside of the convention and provide a good opportunity to reconnect with friends and colleagues over lunch, and be educated and entertained. Schedules of upcoming talks can be viewed on the website Development Calendar and contact information can be found on the web.
Technical Divisions: There are currently nine active technical divisions that provide lunchtime and evening talks on a wide variety of topics. Each division represents an area of specialization, and therefore these talks are a great opportunity to build your specialized knowledge and network in a more relaxed informal atmosphere. The division chairs are: (Continued on page 7...)

AAPG
AGAT LAborATories
APAche cAnAdA LTd.
APeGGA Arc FinAnciAL corPorATion
AryTon consuLTinG exPLorATion LTd.
bAker ATLAs
bLuebAck reservoir
boyd PeTroseArch
cAnAdA brokerLink
cAnAdiAn nATurAL resources LTd.
cAsey & AssociATes
cenovus enerGy inc.
cGG veriTAs
coLorAdo schooL oF mines
conocoPhiLLiPs cAnAdA LimiTed devon cAnAdA corPorATion
divesTco inc.
encAnA
enerPLus resources Fund
FuGro Airborne surveys corP.
FuGro – JAson
GeoedGes inc.
geoLoGic systems ltd.
GeomodeLinG TechnoLoGy corP.
GeosTrATA resources inc.
hALLiburTon enerGy services
hunT oiL comPAny oF cAnAdA husky enerGy inc.
ihs
imPeriAL oiL resources
LArio oiL & GAs comPAny
LiTTLe rock documenT services
LorinG TArcore LAbs LTd.
mJ sysTems
murPhy oiL comPAny
neurALoG
nexen inc.
Penn WesT enerGy TrusT
PeTrocrAFT ProducTs LTd.
PLusPeTroL
ProvidenT enerGy LTd.
rPs enerGy
schLumberGer cAnAdA LTd.
sensor GeoPhysicAL LTd.
sheLL cAnAdA LimiTed
sProuLe AssociATes LimiTed
suncor enerGy inc.
TALismAn enerGy
ToTAL e&P cAnAdA LimiTed
TourmALine oiL corP.
Tucker WireLine LTd.
WeATherFord LAborATories
(...Continued from page 5)
• Environment: Andrew Fox
• International: Bob Potter and Trent Rehill
• Core and Sample: Doug Hayden
• Sedimentology: Eric Street
• Structure: Darcie Greggs
• Basin Analysis and Sequence Stratigraphy: Mark Caplan and Steve Donaldson
• Heavy Oil Sands: Nicole Keilly and Randy Smith
• Paleontology: Philip Benham
• Geomodeling: Weishan Ren
• Emerging Petroleum Resources: currently seeking a chairperson
Contact information can be found on the CSPG website and the schedule of talks can be found on the website “Development Calendar” showing a month-by-month view.
Conventions and conferences require armies of volunteers and multi-year advance planning by long-term committees and chairs. To suggest that there are one or two key people would be very misleading. The Joint Annual Convention this year, held in early May, is entitled “recovery 2011,” and promises to be as big a success as previous conventions, drawing a large, multi-disciplinary crowd. More information is available on the website.
The 2011 Gussow Conference is being held in Banff in October, and is entitled “Advances in Applied Geomodeling for Hydrocarbon Reservoirs – Closing the Gap”. The Gussow

conference is a meeting focused on new and emerging issues related to the industry, bringing together recognized experts related to the conference theme. These are very successful conferences that attract participants from around the world, providing a forum for networking and exploring diverse topics related to a focused theme.
Non-CSPG offerings: The CSPG is continuing to build collaborative and mutually beneficial alliances with other organizations and individuals. The intent is to continue to offer high-quality, home-grown CSPG educational opportunities in addition to these new third party opportunities. As these opportunities come in, they will be posted on the website under the Education tab, or in the Reservoir, or both, so please continue to check these periodically.
Finally, I would like to thank all those people who are involved with the Programs portfolio for their dedicated effort, from the previous and current CSPG executive, the CSPG office staff, the Chairs, and the multitude of people that help those chairs. 2011 will be another great (and busy) year at the CSPG, and I invite members to take full advantage of what their society has to offer, both in regards to taking part in events and programs being offered, as well as taking advantage by volunteering and helping out. But for now, I have to check out ebay for those batons…
» Play-by-play comparative review
» Two feature play micro-studies
» Hard copy report and wall posters
» Company-wide online access
» Well completion/frac/interval details
» Online, searchable
» Reliable data (QA/QC/engineer audits)
» 30 resource plays and growing


SPEAKER
Stephen P. Cumella Bill Barrett Corporation
Funded by the AAPG Foundation 11:30 am Wednesday, March 2, 2011 Calgary, TELUS Convention Centre Calgary, Alberta
Please note: The cut-off date for ticket sales is 1:00 pm, Friday, February 25, 2011. CSPG Member Ticket Price: $42.00 + GST. Non-Member Ticket Price: $45.00 + GST.
Each CSPG Technical Luncheon is 1 APEGGA PDH credit.
Did you know that you can book a table for the Technical Luncheon? To book your company’s table or to buy tickets, visit http://www.cspg. org/events/events-luncheons.cfm.
Sandstones in tight gas accumulations in the Rocky Mountains commonly have permeabilities in the single-digit microdarcy range and water saturations below 50%. If these sandstones had similar permeabilities at the time they were gas charged, capillary pressures required to reach these water saturations would have been hundreds to thousands of psi. Buoyancy can create these high capillary pressures, but gas columns must be hundreds to thousands of feet to reach these pressures. Many Rocky Mountain tight gas accumulations occur in discontinuous fluvial sandstone intervals where fluid columns of this magnitude aren’t possible. An alternative explanation for this problem is that the gas charge occurred before the sandstones reached
very low permeability when the capillary forces required to reach low water saturations were much lower (Shanley et al., 2004). This explanation proposes that gas charge occurs at shallower burial depths and compaction and cementation degrade permeability to the microdarcy range with continued burial.
Recent studies of the diagenesis of Mesaverde sandstones in the Piceance Basin indicate that permeabilities were reduced to near their current microdarcy levels prior to or during gas charge. Two mechanisms to provide the high capillary pressures required to charge the tight sandstones other than buoyancy are gas generation from in situ coals or other organic-rich intervals and gas migration up major fault and fracture zones from highly pressured organic-rich underlying units. These deeper units are probably also overpressured as a result of hydrocarbon generation. Significant in situ organic content is required to saturate the pore space of the sandstones in a tight gas accumulation. Some tight gas systems such as the southern Piceance may have sufficient in situ TOC to charge the sandstones within the system. Such systems have commercial production at high well density over large areas of the basin. Basins like the Piceance or the San Juan either have (San Juan) or will have (Piceance) continuous producing areas in most of the deeper parts of the basins.
Tight gas systems with low in situ TOC have a much more limited distribution of commercial gas production. Some tight gas accumulations may be conventional traps with gas/water contacts that are obscured by the very low relative permeability to gas or water (Shanley et al., 2004) Other tight gas accumulations may be controlled not by trap but by proximity to a major fault system that provides a conduit for highly pressured gas from deeper formations.
High heat flow may also be critical to creation of pervasive highly gas-charged accumulations. The importance of high heat flow is indicated by significant differences between the Williams Fork gas accumulation in the north and south parts the Piceance Basin. In the southern Piceance, the gas accumulation has uniformly low water saturations, low water production, and a gas-saturated interval that gradually thickens into the deeper part of the basin, but the top of the gas interval shows little variation locally. In the northern part of
Webcasts sponsored by
the basin, the gas accumulation has variable water saturation, higher water production, and the top of the gas-saturated interval can vary significantly over relatively short distances. The higher heat flow in the southern Piceance may have created a pervasive fracture system that allowed all sandstones within the gas-saturated interval to be charged to high gas saturations. In the northern Piceance, gas migration may have occurred primarily along major fracture and fault zones; areas near the fault zones have better gas saturations and thicker gas-saturated intervals. Prolific tight gas accumulations in the San Juan Basin and in Wattenberg field in the DJ Basin are other examples in which high heat flow may have played a significant role in the creation of the accumulation.

Stephen P. Cumella is a geologist with Bill Barrett Corporation in Denver, Colorado. He received his bachelor’s and master’s degrees in geology at University of Texas at Austin. Steve started his career with Chevron in 1981 and worked in exploration and development assignments in the Rockies, mid-continent, Michigan Basin, and West Africa. Since leaving Chevron in 1990 he has worked on various projects in the U.S. and South America. Steve has worked the Piceance Basin and other Rocky Mountain basins at Barrett Resources, Williams, and Bill Barrett Corporation for the last ten years and has authored several publications, given numerous presentations, and led several fieldtrips. He is past president of the Grand Junction Geological Society and was presented the Rocky Mountain Association of Geologists’ Outstanding Scientist award in 2005. The publication entitled Understanding, Exploring, and Developing Tight-Gas Sands that he co-edited was awarded the Robert H. Dott Memorial Award for best AAPG special publication in 2008. Cumella is associate editor of the AAPG Bulletin and the Mountain Geologist.
SPEAKER
Matthew D. Jackson Imperial College
Funded by the AAPG Foundation
11:30 am Tuesday March 15, 2011 Calgary TELUS Convention Centre Calgary, Alberta
Please note: The cut-off date for ticket sales is 1:00 pm, Thursday, March 10, 2011. CSPG Member Ticket Price: $42.00 + GST. Non-Member Ticket Price: $45.00 + GST.
Each CSPG Technical Luncheon is 1 APEGGA PDH credit.
Did you know that you can book a table for the Technical Luncheon? To book your company’s table or to buy tickets, visit http://www.cspg. org/events/events-luncheons.cfm.
Hydrocarbon reservoirs are geologically heterogeneous over a wide range of scale. This heterogeneity is a key control on fluid flow during hydrocarbon production, because geological (sedimentary, structural, and diagenetic) processes dictate the spatial distribution of petrophysical properties such as porosity, permeability, relative permeability, and capillary pressure. These properties control the flow of oil, water, and gas. Consequently, to understand, model, and predict fluid flow, it is essential to understand and model geological heterogeneity. This
is challenging for two reasons. The first is that geological heterogeneity is complex, ranging from the scale of individual pores to the scale of the entire reservoir (i.e., microns to kilometres). The second is that subsurface data is limited. Well data has high spatial resolution but is sparsely distributed; seismic data is extensive but has low spatial resolution. Poor understanding of geological heterogeneity leads to increased uncertainty in predictions of hydrocarbon recovery, and increases the risk associated with hydrocarbon extraction.
Recognizing that a reservoir model cannot represent explicitly every type and scale of heterogeneity raises a number of persistent questions. What are the key types and scales of heterogeneity that models should capture? Are these key heterogeneities the same for all reservoir and hydrocarbon types, and all recovery processes? What is the minimum level of model resolution / complexity required to make recovery predictions that are ‘good enough’? How should models best capture these key heterogeneities? To answer these questions requires the development of models based on rich datasets that capture heterogeneity at a high level of detail. Such models can be constructed using analogue outcrops. This presentation describes ongoing research to develop and apply outcrop analogue models, emphasizing the use of novel surfacebased modelling techniques in conjunction with adaptive gridding / meshing for flow simulation, and the insight gained into the impact of geologic heterogeneity on flow.
The approach is illustrated using examples of shallow-marine sandstone reservoir analogues from three contrasting depositional environments across a hierarchy of scales. The environments represented by the analogues comprise (1) a single, wavedominated shoreface-shelf parasequence; (2) two stacked, fluvial-dominated deltaic parasequence sets; and (3) multiple stacked, tide-dominated channel belts and tidal heteroliths. The datasets were obtained from well-exposed outcrops in Utah, USA; the Western Desert, Egypt; and the Isle of Wight, UK. They describe reservoir architecture in generic analogues for many shallow-marine reservoirs. The model results demonstrate that subtle aspects of reservoir architecture, which are typically neglected in subsurface models, can have a significant impact on flow and hydrocarbon recovery. Conversely, features which are routinely included because they are easy to model may be unimportant to flow. New
Webcasts sponsored by
reservoir modelling methods are required to capture subtle, yet important, geological heterogeneities. The methods developed here to handle outcrop datasets are equally applicable to subsurface reservoirs. They rely less on grid- or pixel-based methods, and integrate better with a new generation of reservoir simulators.

Matthew D. Jackson received his Bachelor’s degree in Physics from Imperial College London and his Ph.D. degree in Geological Fluid Mechanics from the University of Liverpool. He then rejoined Imperial College as a Research Associate in the Department of Earth Resource Engineering (now the Department of Earth Science and Engineering) working on a multidisciplinary project to characterize the impact of geologic heterogeneity on production from complex tidal reservoirs. He is currently Senior Lecturer in Geological Fluid Mechanics and Reservoir Engineering. He established (with Dr. Gary Hampson) the Outcrop Modelling Group at Imperial College, which he still co-leads. He also established and leads the Smart Wells Group. Jackson has received the Brian Mercer Award for Innovation from the Royal Society, the ‘Outstanding Associate Editor’ award of the Society of Petroleum Engineers Journal, and (as co-author) the SEPM ‘Excellence of Poster Presentation Award’ at the 2010 AAPG/SEPM Annual Meeting. He has served on the board of the Petroleum Group of the Geological Society of London, and currently serves on the board of the London Section of the SPE. He is a member of the AAPG, SPE, and AGU. He lives in London with his wife Liz and their son Nathaniel.
Jackson’s principal research interests are geologic reservoir modelling, numerical modelling of multiphase flow through porous media, understanding the interaction of geologic heterogeneity and flow, and downhole monitoring and control in instrumented and advanced wells. His research emphasizes an integrated approach to problem solving. He also has active and ongoing research into magma formation and transport in the continental crust. He leads the Smart Wells Group and coleads the Outcrop Modelling Group at Imperial College London.
integrated
SPEAKER
Christopher D. Laughrey Weatherford Laboratories
CO-AUTHORS
Laughrey, Christopher D. 1 , Lemmens, Herman 2 , Ruble, Tim E. 3 , Butcher, Alan R. 4 , Walker, Greg 3 , Kostelnik, Jaime 5 , Barnes, John 5 , Knowles, Wayne 3 .
1 Weatherford Laboratories, 16161 Table Mountain Parkway, Golden, CO 80403.
2 FEI Company, Eindhoven, Netherlands.
3 Weatherford International Ltd., 5200 North Sam Houston Parkway West, Houston, TX 77086.
4 FEI Company, Brisbane, Queensland, Australia.
5 Pennsylvania Geological Survey, Pittsburgh, PA.
11:30 am
Tuesday April 5, 2011 Calgary, TELUS Convention Centre Calgary, Alberta
Please note: The cut-off date for ticket sales is 1:00 pm, Thursday, March 31, 2011. CSPG Member Ticket Price: $42.00 + GST. NonMember Ticket Price: $45.00 + GST.
Each CSPG Technical Luncheon is 1 APEGGA PDH credit. Did you know that you can book a table for the Technical Luncheon? To book your company’s table or to buy tickets, visit http:// www.cspg.org/events/events-luncheons.cfm.
Thermogenic shale gas produced from the Marcellus Formation in the northeastern region of the play in Pennsylvania is postmature. Petrologic and geochemical parameters suggest that Marcellus shale gas reservoirs reached maximum burial depths and temperatures characteristic of zeolite and prehnite facies low-grade metamorphism. Although methane can continue to be
generated and remain stable under these conditions in organic-rich sediments, this degree of burial diagenesis raises several critical questions regarding metagenetic gas generation and the reservoir quality of the rocks. Deep burial diagenesis implicates compaction, cementation, redox reactions involving hydrocarbons, transition metals, and water, water loss, and dissolution/ re-precipitation processes. All of these processes may enhance or diminish reservoir potential by retaining or releasing gas from the system at high thermal maturities and by diagenetically altering shale rock properties.
To help understand such post-mature thermogenic shale gas reservoirs, we studied selected core samples of Marcellus Formation organic-rich mudstones from the Bennett #1 well in Sullivan County, Pennsylvania. We employed an integrated suite of highresolution analytical techniques to determine quantitative mineralogy; measure quantity, quality, and thermal maturity of organic matter; describe and classify porosity, and develop a diagenetic history of the Marcellus Formation in the region.
The organic-rich intervals of the Marcellus Formation in this core consist of laminated to thinly bedded or bioturbated, fossiliferous,
Webcasts sponsored by
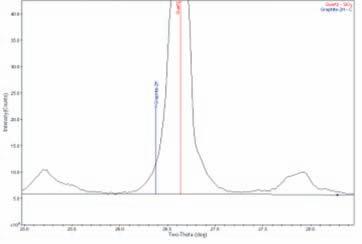
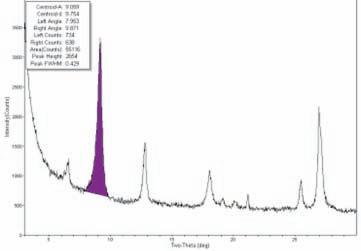
calcareous, quartzose mudstone and mudshale. The rocks are dominated by quartz, illite, and calcite. Quartz occurs as detrital silt and associated authigenic silica overgrowths, as a cryptocrystalline replacement of fossil materials, as pore-filling microquartz and megaquartz cements, and as patchy sheets of quartz-cement platelets. Illite occurs as crenulated, flake-like detrital platelets and as thin flakes and filaments of pore-filling authigenic clay. The mean illite crystallite thickness is 211Å and the average Kübler index is 0.428 (º2 ); these parameters indicate that the shales reached the top of the low anchizone prehnitepumpellyte metamorphic facies at maximum burial (Figure 1A). Calcite occurs as finely crystalline equant spar replacing allochems and filling fossil molds, as micron- and decimicron-sized crystals dispersed in clay and organic matrix, and as discontinuous parallel laminations of microspar and pseudospar. Minor amounts of anhydrite present in the rocks occur within these latter discontinuous laminations, often along with calcite. Additional minerals include feldspar, mixed-layer illite-smectite, chlorite, kaolinite, dolomite, apatite, pyrite, and graphite (Figure 1B). Whole-pattern fitting and the Reitveldrefinement method of a sample from 2,550 m in the core quantify the abundance of
graphite at 3 wt. percent, a value consistent with the measured total organic carbon (TOC) at that depth. The graphite was derived from carbonaceous organic matter during early metamorphism.
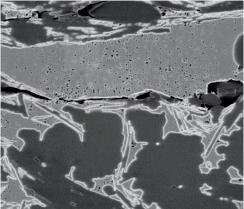
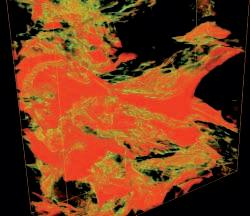
All of the organic-rich intervals meet the requirements for commercial thermogenic shale-gas reservoirs. Total organic carbon ranges from 0.58 to 11 wt. percent, with most of the cored interval having TOC between 2 and 4 wt. percent. The original kerogen was dominated by Type II organic matter. All thermal maturation parameters indicate the rocks reached the metagenetic zone of thermal maturity. Pyrobitumen appears to be abundant within the Marcellus rocks in the Bennett core. Microscopic and SEM examination along with 3D models derived from FIB-SEM analysis shows that pyrobitumen comprises a significant volume of the rocks (Figure 2). High-temperature pyrolysis of whole-rock samples, however, showed no response in the 600˚ to 800˚C region of the pyrogram where pyrobitumen is typically detected. Based on this lack of response, we suspected that the pyrobitumen was undetectable by the flame-ionization detector (FID) due to its highly aromatized
graphitic nature. Most of the porosity in the Marcellus is associated with this graphitic pyrobitumen.
Early diagenesis of the Marcellus sediments mostly involved mechanical compaction and dewatering of the muds during burial to approximately 500 meters. Chemical compaction at greater burial depths was dominated by quartz cementation and clay mineral transformations, which effectively destroyed most original porosity in the rocks. Organic porosity developed during late catagenesis and continued on into metagenesis at depths greater than 8 km where storage capacity continued to evolve within a graphitic pyrobitumen matrix. These observations, in conjunction with recent work on deep natural gas stable isotopes in the Appalachian basin, extend the potential for thermogenic shale-gas production into the early metamorphic realm.
Christopher D. Laughrey is a Senior Geosciences Advisor with Weatherford Laboratories at their Unconventional Reservoir Services facility in Golden, Colorado. He specializes in reservoir petrology, basin analysis, and both isotope
SPEAKER
Murray K. Gingras University of Alberta
This talk was collaborated with James A. MacEachern, and Shahin E. Dashtgard of Simon Fraser University.
11:30 am
Tuesday, April 26, 2010
Calgary TELUS Convention Centre Calgary, Alberta
Please note: The cut-off date for ticket sales is 1:00 pm, Wednesday April 20, 2011. CSPG
Member Ticket Price: $38.00 + GST. NonMember Ticket Price: $45.00 + GST.
Each CSPG Technical Luncheon is 1 APEGGA PDH credit. Tickets may be purchased online at https:// www.cspg.org/eSeries/source/Events/index.cfm.
This talk sets out a philosophical approach
to ichnological (trace fossil) analysis, which focuses on the interpretation of trace fossils as sedimentary structures rather than as paleontological entities per se. Using wideranging datasets and a large number of observations and interpretations, a “Process Ichnology” framework is proposed. This interpretive framework provides an improved means of estimating the presence and magnitude of various physical and chemical (i.e., physico-chemical) depositional stresses (e.g., water turbidity, sedimentation rates, substrate consistency, salinity, and oxygenation) in ancient sedimentary environments. Ichnological datasets that are considered include: 1) trace-fossil distributions; 2) ethological diversity and the range of diversity; 3) the significance of burrow linings; 4) trace-fossil size; and, 5) post-depositional compaction of trace fossils. From these data, higher-resolution estimates can be made for the determination of sedimentation rates, temporal variation in sedimentation rate, sediment consistency, and aspects of the bottom- and interstitialwater chemistries. Additionally, the character of depositional bypassing of sediment grains can be determined.
The methodologies and interpretations herein are intended for use by non-ichnologists
and petroleum geochemistry, particularly with regard to unconventional natural gas reservoirs. Christopher is especially involved in consulting, teaching in-depth workshops on both unconventional and conventional reservoir geology and geochemistry, and collaborating with other Weatherford scientists on research and business development efforts within the company. Prior to joining the Weatherford team in late 2009, Christopher worked as a Senior Geological Scientist for the Pennsylvania Geological Survey where he conducted applied research in tight-gas sands, fractured carbonate reservoirs, applied sequence stratigraphy, shale petrology, source rock geochemistry of the Marcellus and Utica shales, and natural gas isotope geochemistry throughout the Appalachian basin. He has conducted professional workshops in applied shale petrology / petroleum geochemistry, sequence stratigraphy, and carbonate petroleum reservoirs for the Petroleum Technology Transfer Council, SPE, and PetroChina. Christopher also taught graduate courses in sandstone and carbonate petrology at his alma mater, The University of Pittsburgh. He began his career in 1977 as a geologist and geophysical analyst for the Marine Seismic Exploration department at the Western Geophysical Company (now WesternGeco) in Houston, Texas.
Webcasts sponsored by
in a manner akin to the interpretation of physical sedimentary structures. However, the outlined framework is complementary to other methods of ichnological analysis, such as ichnofacies- or ichnofabric-analysis, and can be applied as such. Indeed, this method is a derivative of these and other earlier techniques, and should be employed where a systematic approach to obtaining highresolution sedimentological interpretations are a required aspect of the study.
Murray Gingras received his diploma in mechanical engineering technology from the Northern Alberta Institute of Technology in 1987, his B.Sc. degree from the University of Alberta in 1995, and his Ph.D. from the University of Alberta in 1999. Gingras has worked professionally in the hydrocarbon industry at the Northern Alberta Institute of Technology and as an assistant professor at the University of New Brunswick. He is presently Professor at the University of Alberta. Murray has over 80 peer-reviewed journal publications. His research focuses on applying sedimentology and ichnology to sedimentary rock successions, as a paleoecological tool, a reservoir development tool, and in process sedimentology.
SPEAKER
Christopher J. Collom Koch Exploration Canada
12 noon to 1pm Thursday, March 3, 2011
Location: Please note new venue Room B, +30 level, Husky Energy 707-8th Avenue SW
ABSTRACT
Insofar as the tectonic characterization of paleocontinental margins is concerned, Laurentia certainly has a complex Precambrian history. Born from the Proterozoic rifting that resulted in the breakup of the ancient supercontinent of Rodinia, the western Laurentian margin bears overall resemblance to much younger analogs – such as the Brazilian and Nigerian offshore profiles on either side of the Recent Atlantic Ocean. En echelon or nested normal faults bordering asymmetric half-grabens were apparently active, or became reactivated, during the Late Neoproterozoic (Ediacaran) to at least Middle Cambrian interval along much of what is now the Front Ranges of British Columbia. Thick Gog Group clastics (Early Cambrian) were deposited over just such a differentially subsiding margin, and are thinnest above a prominent feature known widely as the Kicking Horse Rim. It is in the vicinity of this structural feature that the drama of the Burgess Shale and its myriads of unusual and often
Sponsored by
soft-bodied organisms unfolds. This talk will examine the geological setting of this world-renowned fossil lagerstätten, and integrate new paleontological and lithostratigraphic data. Together they offer a much different picture of ancient Canada half a billion years ago than has been oft-repeated since the discovery of the Kicking Horse Rim in the early 1940s.
For additional information on CSPG Structural Division talks, please contact Darcie Greggs, Darcie.Greggs@huskyenergy.com.


And join thousands of industry professionals at this year’s recovery 2011 convention in Calgary May 9 - 13, 2011 at the Calgary TELUS Convention Centre.
• Purchase tickets to see Michael Economides, author and professor and John Furlong, CEO of the Vancouver 2010 Olympic Games speak on Monday May 9th and Wednesday May 11th respectively at the Hyatt Regency Hotel.
• Ensure you also purchase tickets to attend the Monday night after-party and annual Core Meltdown. Purchase your tickets early to avoid disappointment – these events will sell out!

• Early bird deadline is March 31, 2011
• Registration includes: admission to the exhibition hall and Earth Science for Society exhibition, access to the technical program, poster sessions, Core Conference, Monday night mixer and Tuesday night reception at the Hyatt Regency Hotel
• Register online at www.geoconvention.com
Produced
Paleontological Symposium presented jointly by the C.S.P.G. Palaeontological Division, Alberta Palaeontological Society, and Mount Royal University Earth Sciences Department
9:00 AM to 5:00 PM (Lectures and Poster displays) Saturday, March 19, 2011
9:00 AM to 4:00 PM (Workshops) Sunday March 20, 2011
Mount Royal University, 4825 Mount Royal Gate SW, Calgary, Alberta
THE SYMPOSIUM
The symposium is a two-day event with lectures, posters, book signings, a fossil identification booth, and showcase displays on only Saturday, March 19, 2011, and workshops on Sunday, March 20, 2011. Saturday programs are free and open to the general public. No registration is required to attend the Saturday activities. Due to limited space, Sunday workshop participants will be required to register and pay a moderate fee for workshop materials. The main events will be centred in the lower-level hall at Mount Royal University, adjacent to Jenkins Theatre.
Saturday, March 19th Speaker Schedule
All talks to be held in Jenkins Theatre, lower-level of Mount Royal University
9:00 – 9:15 AM Introduction and Symposium Instructions.
9:15 – 9:45 AM
Hope Johnson, LL.D. (1916-2010):
An extraordinary Albertan amateur paleontologist
Darren Tanke, Royal Tyrrell Museum.
9:45 – 10:15 AM
The history of Peace Country palaeontology.
Bert Hunt and Katalin Ormay, Paleontological Society of the Peace.
10:15 – 10:45 AM
How to find fossils: blending sedimentology, palaeoecology, pattern recognition, and common sense.
Jon Noad, Murphy Oil.
10:45 – 10:55 AM : Coffee Break
10:55 – 11:25 AM
Ecosystems in stone: determining paleobiodiversity drivers in the latest Maastrichtian of central Canada.
Emily Bamforth, McGill University.
11:25 – 11:55 PM
How Tyrannosaurs got Tyrannosaurus rex.
Tetsuto Miyashita, Department of Biological Sciences, University of Alberta.
(Continued on page 14...)


11:55 – 1:15 PM
Lunch break and Poster Session
1:15 – 1:30 PM
APS 25th anniversary presentation. Wayne Braunberger, APS President.
1:30 – 2:00 PM
In search of the beautiful and brainy: a summer studying ankylosaurs in Korea, China, and Mongolia. Victoria Arbour, University of Alberta.
2:00 – 3:00 PM
Icefield bunnies, gullible bees and why the tallest mountain is not the highest. Ben Gadd, Author and Guide.
3:00 – 3:05 PM : Coffee Break
3:05 – 4:05 PM
A revised chronostratigraphy for the Oldman, Dinosaur Park, and Bearpaw formations at Dinosaur Provincial Park, Alberta, Canada.
Dave Eberth, Royal Tyrrell Museum.
4:05 – 5:05 PM
Silk and venom: the geological history of spiders. Paul Selden, Paleontological Institute, University of Kansas.
5:05 PM : Finish
WORKSHOPS
Two workshops are offered on March 20th, 2011. Both will be held at Mount Royal University, Room B213.
WORKSHOP 1
9 – 12 AM: Fossil Arthropods
Presenter: Dr. Paul Selden, University of Kansas Cost: $15 per person.
This workshop will provide an introduction to the arthropods, including the variety of groups that are found as fossils: trilobites, chelicerates, insects, myriapods, and crustaceans. There will be representative samples to look at, and you will learn how to identify them and where they might most commonly be found as fossils.
Dr. Paul Selden is the Gulf-Hedberg Distinguished Professor of Invertebrate Paleontology and Director of The Paleontological Institute, University of Kansas. His research interests lie in the field of fossil arthropods. He has worked on fossil horseshoe crabs, the extinct giant eurypterids (‘sea-scorpions’), myriapods, fossil spiders and other arachnids, and the discovery of the oldest animals on land and the oldest known spiders.
WORKSHOP 2:
1 – 4 PM
Ankylosaur Fan Club
Presenter: Victoria Arbour, University of Alberta Cost: $15 per person.

Get to know the ugliest of the dinosaurs, the armoured ankylosaurs! We will learn how to recognize ankylosaur fossils from Alberta, and how to tell different species of ankylosaurs apart. This will be a hands-on workshop with specimens and models to study, and will be appropriate for both children and adults.
Victoria Arbour is a Ph.D. student at the University of Alberta. She studies the diversity and biogeography of ankylosaurs, and has previously studied the biomechanics of tail clubbing in these amazing dinosaurs.
To register for workshops contact Mona Marsovsky at (403) 547-0182 or giftshop@ albertapaleo.org. Make the cheque payable to the Alberta Palaeontological Society, P.O. Box 35111, Sarcee Postal Outlet, Calgary Alberta, Canada T3E 7C7. Deadline for workshop registration is March 7, 2011. Registration is limited to 20 participants per workshop, so register early.
FURTHER INFORMATION:
General inquiries: Vaclav Marsovsky (403) 547-0182 membership@albertapaleo.org
Lecture program: Philip Benham (403) 691-3343 programs@albertapaleo.org

T2P 3T7 Tel: 403.237.7711 Fax: 403.237.7881
IFP/Beicip’s Reservoir Simulation Technology
—For Shale Reservoirs
Innovative Software that is Comprehensive, Easy-to-use, Fully-Integrated, Flexible & Fast.
• Reduce costs of field development planning
• Optimize well spacing & hydraulic fracturing
• Identify sweet spots/SRV
• Find new ways to maximize EUR
• Greatly reduce history matching time
• Manage the uncertainty in your forecasts
• Utilize your time to analyze the reservoir/ wells instead of model building
| By E. R. (Ross) Crain, P.Eng.

Unicorns are beautiful, mythical beasts, much sought after by us mere mortals. The same is true for petrophysical models for unconventional reservoirs. This is the fifth in a series of review articles outlining the simple beauty of some practical methods for log analysis of the unusual.
Oil shales, as in the case of gas shales, are seldom pure shale. A pure shale consists of clay minerals and clay-bound water. Most real shales have a variety of other minerals and organic matter – and possibly some minor amounts of porosity.
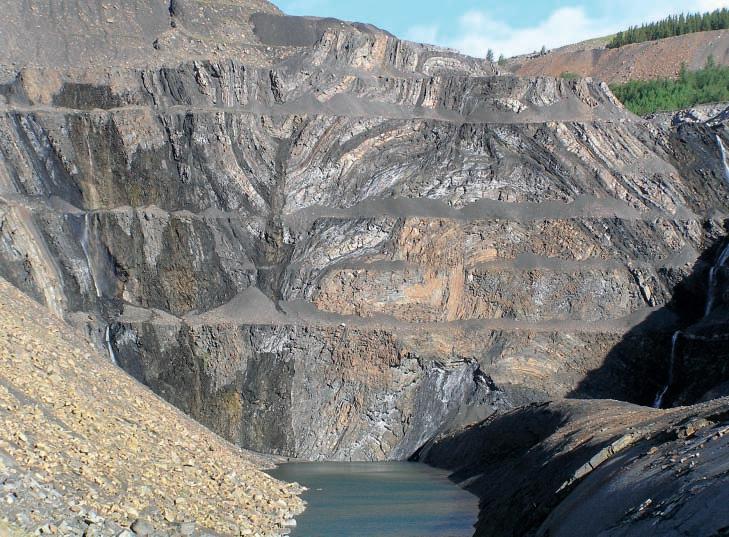
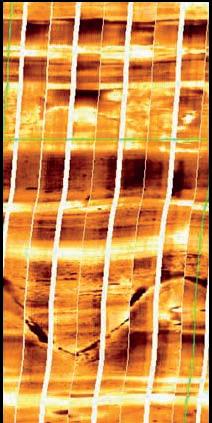
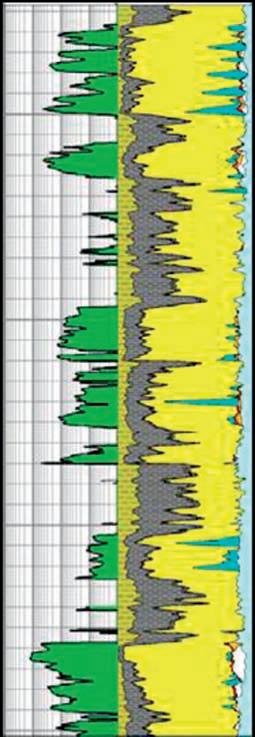
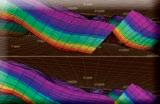
Many so-called shales are really silts, shaly
silts, or laminated shaly sands or silts, such as the Green River Shale of Western USA (Figure 1).
Some oil shales contain significant amounts of calcite, dolomite, and siderite, making log analysis difficult due to the varying matrix density of the rock. Many are laminated, adding to the log analysis problem.
Some clean silts and sands are called oil “shales” because they are radioactive and look like shale on logs, such as the Bakken “shale” in Saskatchewan and North Dakota. The Upper and Lower Bakken are real organic shales, but the oil-producing Middle
Bakken is a dolomitic quartz sand with little clay. These are analyzed with a standard shale-corrected, complex-lithology porosity model coupled with a shale-corrected Archie-type water-saturation model.
The distinguishing characteristic of an oil shale is that it contains significant organic carbon, which has not yet transformed into oil. As such, the oil shale is usually termed a source rock. Some adsorbed and some free gas may also exist. Oil shales require a specialized log analysis model because the Archie saturation model is often inappropriate.
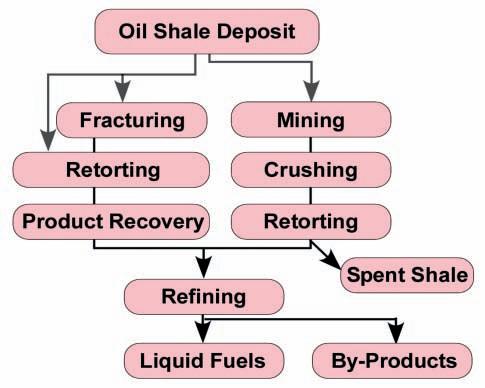
Oil shale can be mined on the surface or at depth, and the rock heated in a retort to convert the organic content to oil. Some valuable by-products such as vanadium may also be extracted, but dry clay, ash, and other minerals are a serious waste disposal issue. In-situ extraction using super-heated steam, air, carbon dioxide, or some other heat transfer system is used to convert the organic carbon to oil. Collector wells then extract the oil.
Oil shales contain predominantly Type I kerogen, as opposed to coal and coal bed methane reservoirs, which contain mostly Type III. Gas shales contain mainly Type II kerogen.
Oil shale has received many different names over the years, such as cannel coal, boghead coal, alum shale, stellarite, albertite, kerosene shale, bituminite, gas coal, algal
coal, wollongite, schistes bitumineux, torbanite, and kukersite. Some of these names are still used for certain types of oil shale. Recently, however, attempts have been made to systematically classify the many different types of oil shale on the basis of the depositional environment of the deposit, the petrographic character of the organic matter, and the precursor organisms from which the organic matter was derived.
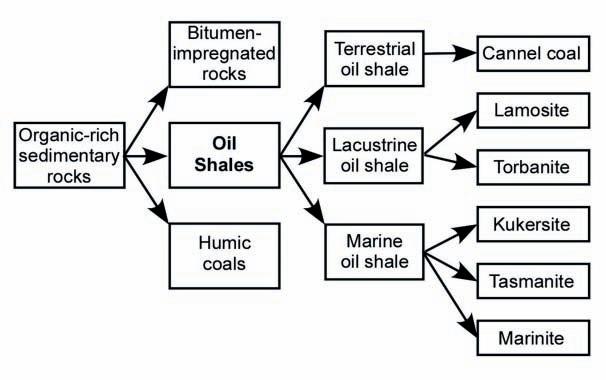
A useful classification of oil shales was developed by A.C. Hutton. He divided oil shale into three groups based on their deposition environment: terrestrial, lacustrine, and marine, and further by the origin of their organic matter.
Terrestrial oil shales include those composed of lipid-rich organic matter such as resin, spores, waxy cuticles, and corky tissue of roots and stems of vascular terrestrial plants commonly found in coal-forming swamps and bogs. Lacustrine oil shales include organic matter derived from algae that lived in fresh, brackish, or saline lakes. Marine oil shales are composed of organic matter derived from marine algae unicellular organisms, and marine dinoflagellates.
Within these three groups, Hutton recognized six specific oil-shale types, as shown in Figure 3:
1. Cannel coal is brown to black oil shale composed of resins, spores, waxes, and cutinaceous and corky materials derived from terrestrial vascular plants together with varied amounts of vitrinite and inertinite. Cannel coals originate in oxygendeficient ponds or shallow lakes in peatforming swamps and bogs.
2. Lamosite is pale, grayish-brown and dark gray to black oil shale in which the chief organic constituent is lamalginite derived from lacustrine planktonic algae. Other minor components include vitrinite, inertinite, telalginite, and bitumen. The Green River oil-shale deposits in western United States and a number of the Tertiary lacustrine deposits in eastern Queensland, Australia, are lamosites.
3. Marinite is a gray to dark gray to black oil
shale of marine origin in which the chief organic components are lamalginite and bituminite derived chiefly from marine phytoplankton. Marinite may also contain small amounts of bitumen, telalginite, and vitrinite. Marinites are deposited typically in epeiric seas such as on broad, shallow marine shelves or inland seas where wave action is restricted and currents are minimal. The Devonian–Mississippian oil shales of eastern United States are typical marinites. Such deposits are generally widespread, covering hundreds to thousands of square kilometers, but they are relatively thin, often less than 100 m.
Torbanite, tasmanite, and kukersite are related to specific kinds of algae from which the organic matter was derived; the names are based on local geographic features.
4. Torbanite, named after Torbane Hill in Scotland, is a black oil shale whose organic matter is composed mainly of telalginite found in fresh- to brackish-water lakes. The deposits are commonly small, but can be extremely high-grade.
5. Tasmanite, named from oil-shale deposits in Tasmania, is a brown to black oil shale. The organic matter consists of telalginite derived chiefly from unicellular algae of marine origin and lesser amounts of vitrinite, lamalginite, and inertinite.
(Continued on page 18...)

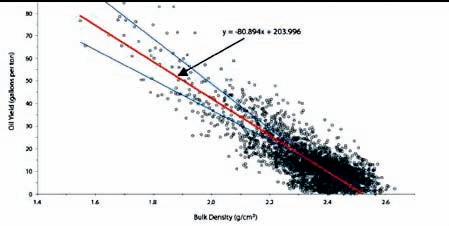
8. Density versus oil yield for same data set. Density is in grams/cc. Data is from “Basin-Wide Evaluation of Uppermost Green River Oil Shale Resources, Uinta Basin, Utah and Colorado” by M. D. Vanden Berg, Utah Geol Survey, 2008.
(...Continued from page 17)
6. Kukersite, which takes its name from Kukruse Manor near the town of KohtlaJärve, Estonia, is a light-brown, marine oil shale. Its principal organic component is telalginite derived from green algae. Kukersdite is the main type of oil shale in Estonia and western Russia, and is burned instead of coal to generate electricity in power plants.
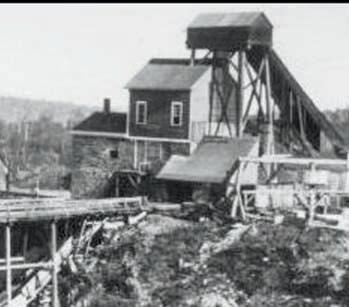
Canada produced some shale oil from deposits in New Brunswick in the mid-1800s. The mineral was called Albertite and was originally believed to be a form of coal.
Later, the nature of the mineral and its relation to the surrounding oil shale was described correctly. Abraham Gesner used Albertite in his early experiments to distill liquid fuel from coal and solid bitumen. He is credited with the invention of kerosene in 1846, and built a significant commercial distillery to provide lighting oil to replace
whale oil in eastern Canada and USA. In the 1880s, shale oil was abandoned as a source of kerosene in favour of distillation from liquid petroleum.
Canada’s oil-shale deposits range from Ordovician to Cretaceous age and include deposits of lacustrine and marine origin in at least 20 locations across the country. During the 1980s, a number of the deposits were explored by core drilling. The oil shales of the New Brunswick Albert Formation, lamosites of Mississippian age, have the greatest potential for development. The Albert oil shale averages 100 l/t of shale oil and has potential for recovery of oil and may also be used for co-combustion with coal for electric power generation.
Marinites, including the Devonian Kettle Point Formation and the Ordovician Collingwood Shale of southern Ontario, yield relatively small amounts of shale oil (about 40 l/t), but the yield can be doubled
by hydroretorting. The Cretaceous Boyne and Favel marinites form large resources of low-grade oil shale in the Prairie Provinces of Manitoba, Saskatchewan, and Alberta. Upper Cretaceous oil shales on the Anderson Plain and the Mackenzie Delta in the Northwest Territories have been little explored, but may be of future interest.
The grade of oil shale has been determined by many different methods with the results expressed in a variety of units. The heating value of the oil shale may be determined using a calorimeter. Values obtained by this method are reported in English or metric units, such as British thermal units (Btu) per pound of oil shale, calories per gram (cal/ gm) of rock, kilocalories per kilogram (kcal/ kg) of rock, megajoules per kilogram (MJ/kg) of rock, and other units.
The heating value is useful for determining the quality of an oil shale that is burned directly in a power plant to produce electricity. Although the heating value of a given oil shale is a useful and fundamental property of the rock, it does not provide information on the amounts of shale oil or combustible gas that would be yielded by retorting (destructive distillation).
The grade of oil shale can be determined by measuring the yield of oil of a shale sample in a laboratory retort. The method commonly used in Canada and United States is called the modified Fischer assay, first developed in Germany, then adapted by the U.S. Bureau of Mines. The technique was subsequently standardized as the ASTM Method D-3904-80. Some laboratories have further modified the Fischer assay method to better evaluate different types of oil shale and different methods of oil-shale processing.
The standardized Fischer assay consists of heating a 100-gram sample crushed to –8 mesh (2.38-mm mesh) screen in a small aluminum retort to 500ºC at a rate of 12ºC per minute and held at that temperature for 40 minutes. The distilled vapors of oil, gas, and water are passed through a condenser cooled with ice water into a graduated centrifuge tube. The oil and water are then separated by centrifuging. The quantities reported are the weight percent of shale oil, water, shale residue, and “gas plus loss” by difference. Some organic matter is turned to char and reported as part of the shale residue. As a result, this assay may understate the amount of oil that might be recovered in a commercial-scale retort that continuously mixes the feedstock. Oil yield is usually converted from mass fraction
into US or Imperial gallons per ton (gpt or gal/t) of rock. So much for going metric! In Canada, oil yields are quoted in liters per metric ton of rock (l/t).
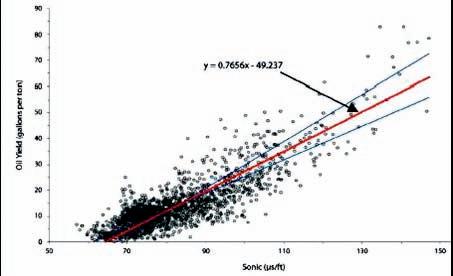
Traditional methods for log analysis of oil shales, dating back to the early 1960s, are somewhat over-simplified regression methods using sonic or density data. See for example “Evaluating Oil Shales by Well Logs” by S. R. Bardsley and S. T. Aigermissen, AIME, 1962.
By crossplotting Fischer assay oil yields with corresponding log data, regression lines are generated that provide a decent average oil yield from logs. Problems related to matrix density or matrix travel time variations due to mineral variations with depth are masked by this method. Separate transforms are usually taken when mineralogy is known to change. Logs average about 3 feet (1 meter) of rock compared to much finer detail available from the core assay, so crossplots tend to show considerable scatter in laminated intervals, as shown in the examples below.
Equation of the line (Figure 7) is:
1: Y = 0.766 * DTC - 49.4
Equation of the line (Figure 8) is:
2: Y = - 80.3 * DENS - 204
Equations for each individual well were also presented, showing considerable variation from well to well and zone to zone.
A literature search quoted by R. M. Habiger and R. H. Robinson in 1985 gives the following equations for estimating oil yield:
Smith (1956) Garfield County, Colorado:
3: Y = 31.6 * DENS^2 - 206 * DENS + 327
4: Y = 22.9 * DENS^2 - 167 * DENS + 280
Bardsley and Algermissen (1963) Unita Basin, Utah:
5: Y = - 66.4 * DENS + 171
6: Y = 41.01 * 10^-4 * DTC^2 - 16.7
Tixier and Alger (1967) Piceance Basin, Colorado:
7: Y = - 59.4 * DENS + 155
Cleveland-Cliffs (1975) Unita Basin, Utah
8: Y = 496 * DENS^-0.6 - 285
9: Y = 157 * 10^-4 * DTC^1.8 - 29.2
I have reduced all equations to three significant digits, which is all that log analysis can support. The reader should refer to the appropriate technical papers to see the
(Continued on page 20...)
(...Continued from page 19)
data spread and regional environment before using any of the above equations.
NUMERICAL EXAMPLE
DENS 2 .2 1.8 g/cc
DTC 100 130 sec/ft
Smith
3: 26.7 58.6 US gal/ton
4: 23.4 53.6
Bardsley and Algermissen
5: 24.9 51.5
6: 24.3 52.6
Tixier and Alger
7: 24.3 48.1
Cleveland-Cliffs
8: 24.0 63.6
9: 23.3 61.0
MULTIPLE REGRESSION (PHILLIPS) METHOD
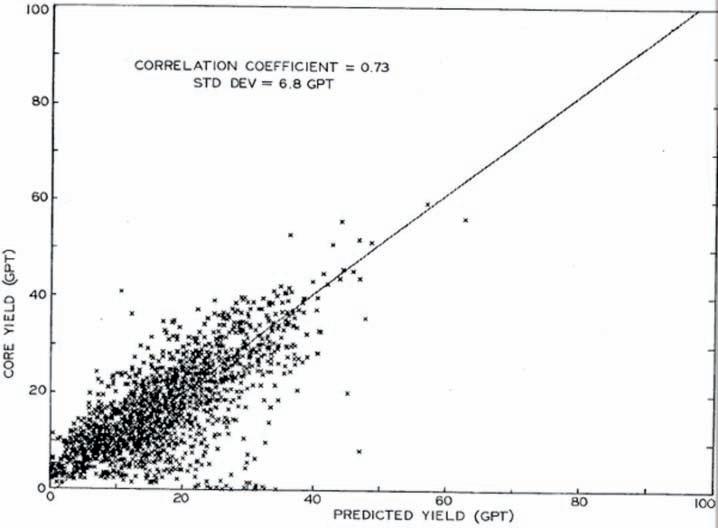
A more sophisticated method was proposed by R. M. Habiger and R. H. Robinson in 1985, using multiple linear regression of sonic, density, and resistivity versus oil yield. The method was patented by the authors on behalf of Phillips Petroleum (US Patent
#4548071), even though the method is strictly mathematical and no “invention” was involved. The patent actually claims to protect every individual step of the math, including taking the logarithm of resistivity. Since mathematical solutions and computer code cannot be patented, infringement is moot. Both sonic and density crossplots of the type shown above are included in the patent and in their 1985 SPWLA paper.
They were also faced with very poor quality density log data from poorly calibrated slim hole, non-contact tools. As a result, they had to normalize the density logs using histograms and correlated density “variation” (DV) to oil yield instead of raw density. DV was calculated from: 10: DV = DENSlog - DENSmean
This also had the effect of handling some of the matrix density variations between wells, but not from layer to layer within each interval in a single well.
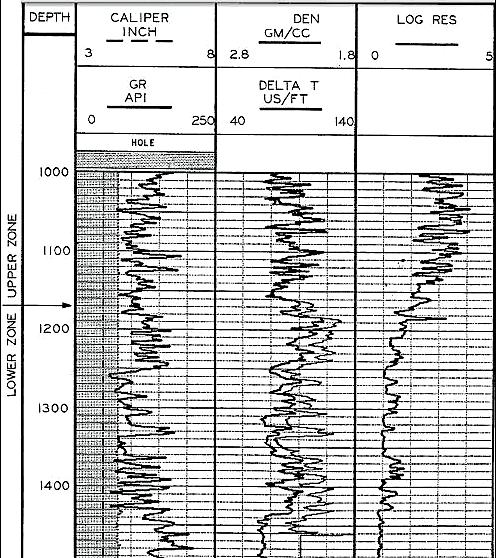
A clay index was generated by regression: 11: CI = DTC + 127.31 * DV - 84.84 Their regression line is quoted as: Upper zone:
12: Y = - 74.37 * DV + 7.86 * (log RESD) + 0.5 * CI - 9.65
Lower Zone
13: Y = - 81.58 * DV + 4.70 * (log RESD) + 9.36
Where:
DENSlog = actual log reading (gm/cc)
DENSmean = average density log readings over the analyzed interval (gm/cc)
DV = density variation (gm/cc)
DTC = compressional sonic travel time ( sec/ft)
CI = clay index (percent)
RESD = deep resistivity reading (ohm-m)
Y = oil yield (gallons per ton of rock).
EVALUATION
There are no good reasons to avoid standard multi-mineral methods such as simultaneous equations, principal components, or other statistical methods for oil shales. Simultaneous equation solutions are widely used in mineral evaluation from logs. A typical equation set for an oil shale would be:
14: DENS = 2.35 * Vshl + 2.65 * Vqtz + 2.74 * Vlim + 2.87 * Vdol + 0.95 * Vker
15: DTC = 120 * Vshl + 55 * Vqtz + 47 * Vlim + 44 * Vdol + 200 * Vker
16: PHIN = 0.30 * Vshl - 0.05 * Vqtz + 0.00 * Vlim + 0.04 * Vdol + 0.95 * Vker
17: PE = 3.45 * Vshl + 1.85 * Vqtz + 5.10 * Vlim + 3.10 * Vdol + 0.95 * Vker
18: 1.00 = Vsh + Vqz + Vls + Vds + Vker
Where: Vxxx = Volume of shale, quartz, limestone, dolostone, and kerogen respectively.
This equation set is inverted by Cramer’s Rule or with spreadsheet functions to obtain the unknown volumes. Parameters must be adjusted to suit local conditions. Minerals chosen must be guided by local knowledge, based on petrography or XRD results. If a log curve is unavailable or faulty due to bad hole conditions, the data can be synthesized or the equation set reduced to eliminate that curve, with the loss of one of the minerals in the answer set.
The volumetric results must then be converted to mass fraction, as is done for tar sands, potash, and coal analysis:
19: WTshl = Vshl * 2.35
20: WTqtz = Vqtz * 2.65
21: WTlim = Vlim * 2.71
22: WTdol = Vdol * 2.87
23: WTker = Vker * 0.95
24: W Trock = = WTshl + WTqtz + WTlms + WTdol + WTker
Mass fraction
25: Wker = WTker / WTrock
26: WT%ker = 100 * Wker
Where:
Vxxx = volume fraction of components
WTxxx = weight of components
Wxxx = mass fraction of components
WT%xxx = weight percent of components
Kerogen mass fraction should be close to Oil Yield mass fraction from Fischer analysis, or a simple linear conversion to account for “gas plus loss”. If Fischer analysis is given in US gal / ton or liters / ton, suitable conversion factors must be used to obtain mass fraction (ton / ton) for comparison to the log analysis results.
Calibration to Fischer assay data would permit adjustment of parameters to produce a better match to core than is usual from single or multiple regression. The core data should be averaged over a threefoot running average so that comparison to logs can be more meaningful.
I have had no chance to test simultaneous or PCA approaches on oil shale, but have used it successfully in potash and conventional multi-mineral oil reservoirs.

E. R. (Ross) Crain, P.Eng. is a Consulting Petrophysicist and a Professional Engineer with over 45 years of experience in reservoir description, petrophysical analysis, and management. He has been a specialist in the integration of well log analysis and petrophysics with geophysical, geological, engineering, and simulation phases of oil and gas exploration and exploitation, with widespread Canadian and Overseas experience.
His textbook, “Crain’s Petrophysical Handbook on CD-ROM” is widely used as a reference to practical log analysis. Mr. Crain is an Honourary Member and Past President of the Canadian Well Logging Society (CWLS), a Member of Society of Petrophysicists and Well Log Analysts (SPWLA), and a Registered Professional Engineer with Alberta Professional Engineers, Geologists and Geophysicists (APEGGA).


Innovate. Without boundaries.


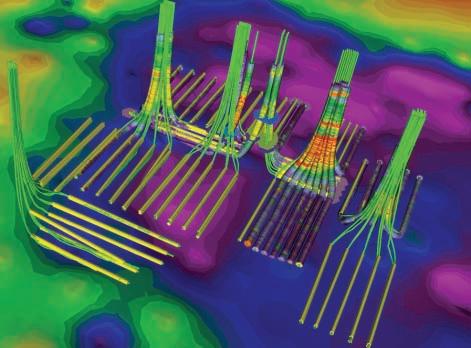
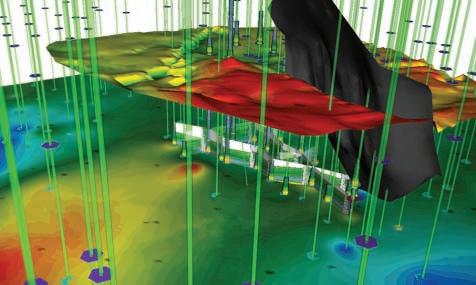
One major oil company has written over 60 Ocean* plug-ins extending Petrel* workflows—to meet specific reservoir challenges and distribute proprietary intellectual property globally across their organization.
With the Ocean framework, software developers can focus on the domain logic of their applications, without worrying about infrastructure code. Apps have been created in as little as one hour. The freedom to innovate is here now.

industry-leading customer service
other planes of weakness), and the stimulation treatment itself.
| By C. R. Clarkson1, R. Aguilera2, P. K. Pedersen1, R. J. Spencer1,3
1Department
of
Geoscience, University of Calgary, 2Schulich School of Engineering, University of Calgary, 3Alberta Innovates Technology Futures
North American onshore shale gas plays have been aggressively pursued in the past decade, yet there is much to learn about key reservoir properties controlling gas storage and flow in these reservoir types; this translates into uncertainty in estimation of reservoir properties from production analysis, as well as production forecasting. Production analysis and forecasting is further challenged by the complex wellbore architectures and completion styles used to develop shale plays – the well / completion style of choice today are long horizontal wells, stimulated with multiple hydraulic fracturing stages (often > 10 stages) along the length of the lateral. As discussed in Part 6 of this Shale Gas Series, multi-stage fracturing combined with long lateral lengths are required to contact as much reservoir surface area as possible to maximize inflow from shale reservoirs, which often have matrix permeabilities on the order of 100 nanodarcies.
In this article, we first review shale reservoir properties and shale well completion strategies that must be considered when performing quantitative production analysis and forecasting. We then discuss the possible flow geometries that can be expected for multi-fractured horizontal wells, followed by current techniques for analysis. This article builds on the reservoir engineering concepts provided by Fekete in their excellent series on “Reservoir Engineering Fundamentals for Geologists” presented in 2008 issues of CSPG Reservoir, but applied to the more complex problem of shale gas well analysis. Specifically, application of various methods of production analysis to shale gas wells, including empirical (traditional decline-curve analysis) and analytical methods (modern rate-transient analysis), are discussed.
There are a wide range of reservoir types that are currently being referred to as “shale gas” reservoirs. The focus of the current article is on deep, thermogenic shale gas plays exemplified by the Barnett Shale play of the Fort Worth Basin. Even among this subclass of shale gas reservoirs, a wide range of reservoir properties may be exhibited.
Due to the wide range in possibilities for reservoir behavior and induced hydraulic-fracture geometry, variety of well-performance behaviors may be exhibited. We have illustrated some possibilities using following conceptual models for well / reservoir / hydraulic fracture combinations:

Single Porosity Reservoir
Scenario 1

Horizontal Well

Dual Porosity Reservoir
Stimulated Reservoir Volume
Scenario 2

Scenario 3
Scenario 4
Discrete Hydraulic Fractures Volume
Scenario 5

Scenario 7
Scenario 6

Scenario 8
For thermogenic shale gas reservoirs, the organic matter contained in the shale is of sufficiently high maturity that dry gas of thermogenic origin is the primary fluid retained in the reservoir by a combination of free- (compressed-) gas storage in the inorganic and organic matter pore space (matrix and fractures) and sorbed gas storage in the organic matter. The organic matter content, which impacts the amount of sorbed gas, may be variable, but is less than 50% by weight, and often less than 10%. These reservoirs are characterized by very low matrix permeability (often on the order of 100 nanodarcies), may be naturally fractured (where the natural fractures are open or filled with mineral matter), and
Clarkson and Pedersen (2010).
may be highly brittle, owing to high silica or carbonate content.
When performing quantitative production analysis of shale gas reservoirs, the analyst can encounter a wide range of reservoir characteristics that may need to be accounted for (or at least acknowledged) in the analysis, including:
• Low matrix permeability, which causes transient flow periods to be extensive.
• Dual porosity or dual permeability behavior, due to existence of natural fractures or induced hydraulic fractures (or both).
(Continued on page 24...)
gas reservoirs as conceptualized by Bello (2009). The figure below assumes a slab matrix geometry, but a cube matrix geometry was also discussed by Al-Ahmadi et al. (2010).
(...Continued from
• Other reservoir heterogeneities, such as multi-layers (interbedded sand / silt / shale) and lateral heterogeneity.
• Stress-dependent permeability, due to a highly compressible fracture pore volume.
• Desorption of gas from the organic matrix.
• Multi-mechanistic (non-Darcy) flow – in shale matrix, caused by gas-slippage along pore wall boundaries and diffusion (see Javadpour, 2009), or in the hydraulic fractures due to inertial flow.
Further considerations when analyzing production data from shale gas wells include the wellbore architecture used (vertical, deviated, horizontal, multi-lateral), and stimulation treatment chosen. By far, the most popular choice for wellbore / stimulation treatment in most shale gas plays today is horizontal wells (cased or openhole) completed in multiple stages. Often the strategy is to pump high-rate, high-volume stimulation treatments for each fracturing stage, using a low-viscosity fluid (e.g., “slickwater”) with the intent of creating a complex fracture network (or “stimulated reservoir volume”) that maximizes contact
Figure 2. Sequence of transient flow geometries expected for a multi-fractured horizontal well drilled in a shale gas reservoir with ultra-low matrix permeability. Coloured arrows are flow lines – red arrows are fracture flow and green arrows are matrix flow. Plan view. Note that flow geometry 2 (bilinear) is a combination of 1 and 3. Modified from Al-Ahmadi et al. (2010).
Figure 2. Sequence of transient flow geometries expected for a multi-fractured horizontal well drilled in a shale gas reservoir with ultra-low matrix permeability. Coloured arrows are flow lines red arrows are fracture flow and green arrows are matrix flow. Plan view. Note that flow geometry 2 (bilinear) is a combination of 1 and 3. Modified from Al-Ahmadi et al. (2010).
with the low-permeability shale matrix (Mayerhofer et al., 2008). Whether or not a complex fracture network is created depends on a variety of factors, including in-situ stress orientation and magnitude, mechanical properties of the shale, shale fabric, existence of heterogeneities within the shale (healed natural fractures, or other planes of weakness), and the stimulation treatment itself.
Due to the wide range in possibilities for
reservoir behavior and induced hydraulicfracture geometry, a wide variety of wellperformance behaviors may be exhibited. We have illustrated some possibilities using the following conceptual models for well / reservoir / hydraulic fracture combinations:
According to Bello (2009), five flow regions could be encountered: early transient linear flow along fractures (flow geometry 1 above, Region 1 of Bello); bilinear flow, caused by simultaneous linear flow in the fractures and linear flow from matrix to fractures (Region 2 of Bello); and linear flow of gas from the matrix to the fractures after pressure gradients have dissipated in the fractures (flow geometry 3 above, Region 4 of Bello). Region 3 of Bello (2009) is the infinite-acting transient linear flow response in homogenous reservoirs and Region 5 is boundary-dominated flow in matrix blocks (once pressure transient has reached the inner no-flow boundary in the matrix blocks). We note that some depletion of fractures may occur before significant contribution from the matrix, causing an early apparent boundary-dominated flow. According to Bello and Wattenbarger (2010), Region 4 (matrix linear flow) is the dominant transient flow regime found
Ozkan et al. (2009) recently developed an analytical method for analyzing pressure-transient behavior of Horizontal Well
CSPG is collecting photos of geological interest from across Canada and around the world to include on a promotional DVD, the end goal of which is to promote general society awareness on an international level and Corporate Membership/Sponsorship of the CSPG. The rst edition of the DVD is entitled Rocks! Across Canada and features the vast breadth of the Canadian geological landscape. This is just the rst edition in a series of DVD's that the CSPG plans to produce, with later editions featuring geological landscapes from around the world.
Scenario 1 represents a horizontal well naturally completed (openhole) in a single porosity reservoir, which is likely ineffective in ultra-low permeability shale gas reservoirs because of the lack of contacted surface area.
Scenario 2 may be applicable to cases where either a horizontal well is naturally completed (openhole) in a dual porosity (naturally fractured) reservoir or a multifractured horizontal well where a complex hydraulic fracture network has been created. In the latter scenario, the induced hydraulicfracture / stimulated natural-fractures network (“Stimulated Reservoir Volume” or “SRV”) may behave like a dual porosity reservoir. Some authors (e.g., Bello and Wattenbarger, 2008; Bello, 2009) suggest that multi-fractured horizontal wells may be modeled using a dual porosity representation of the stimulated reservoir volume, where the induced hydraulic fracture network represents the fracture pore volume and the matrix blocks between the induced fractures represent the matrix.
In Scenario 3, the SRV is limited to a region immediately around the horizontal well, and the background reservoir is single porosity.
So, if you have photographs of geological interest from either Canadian or International locations and would like to submit them for use in the DVD series, or if you are unsure if your photo may not be what we are looking for or if you have any questions regarding this new project, please email Publications Coordinator Caitlin Young at caitlin.young@cspg.org or call 403-513-1227
Scenario 4 is similar to Scenario 3 except the background reservoir is naturally fractured (dual porosity) – the SRV and background reservoir would have different fracture spacing, permeability, and porosity.
Scenarios 5-8 have the same reservoir characteristics as 1-4, but with discrete
hydraulic fractures. These have a different conductivity than the background naturally fractured reservoir.
The understanding of flow geometries caused by hydraulic fracture geometry and reservoir properties is critically important when interpreting rate-transient / decline characteristics of shale gas wells. We now briefly review possible flow geometries encountered for multi-fractured horizontal wells in shale gas reservoirs.
When a well is placed on production, a pressure transient is initiated and propagates outward from the well over time. Fluid flow, which is normal to pressure gradients induced in the reservoir (or hydraulic fracture), follows certain patterns. The sequence of flow geometries encountered during shale gas well production can be quite complex; flow geometries for Scenario 5, representative of a relatively high matrix permeability (single porosity) tight gas reservoir, was discussed in Chen and Raghavan (1997) and Clarkson and Beierle (2010).
Figure 2 illustrates a possible set of flow geometries for multi-fractured horizontal wells completed in shale gas reservoirs as
conceptualized by Bello (2009). The figure assumes a slab matrix geometry, but a cube matrix geometry was also discussed by AlAhmadi et al. (2010).
According to Bello (2009), five flow regions could be encountered: early transient linear flow along fractures (flow geometry 1 above, Region 1 of Bello); bilinear flow, caused by simultaneous linear flow in the fractures and linear flow from matrix to fractures (Region 2 of Bello); and linear flow of gas from the matrix to the fractures after pressure gradients have dissipated in the fractures (flow geometry 3 above, Region 4 of Bello). Region 3 of Bello (2009) is the infinite-acting transient linear flow response in homogenous reservoirs and Region 5 is boundary-dominated flow in matrix blocks (once pressure transient has reached the inner no-flow boundary in the matrix blocks). We note that some depletion of fractures may occur before significant contribution from the matrix, causing an early apparent boundary-dominated flow. According to Bello and Wattenbarger (2010), Region 4 (matrix linear flow) is the dominant transient flow regime found for most shale gas reservoirs.
Ozkan et al. (2009) recently developed an analytical method for analyzing pressuretransient behavior of shale gas wells, referred
to as the “Trilinear-Flow” model that is conceptually similar to Figure 2, but with a few important differences. The reservoir between the hydraulic fractures was assumed to be naturally fractured (see Scenario 7 in Figure 1). Further, an additional latelinear flow period was assumed to occur (perpendicular to the well) to the inner hydraulically-fractured region. They noted, however, that drainage beyond the hydraulic fracture tips does not occur for “practical matrix permeabilities”, i.e., for nanodarcy matrix permeabilities associated with many shale plays.
With an understanding of possible flow geometries in shale gas reservoirs, we can now discuss how these flow geometries affect rate-transient behavior, and how we can use this information to quantitatively analyze shale gas wells.
METHODS FOR ANALYZING SHALE GAS WELL PRODUCTION DATA
Production data, or rate-transient, analysis can be used to derive the following information about the reservoir and the wellbore or fracture geometry:
1. Ultimate recovery (EUR) and Original Gas-In-Place (OGIP).
(Continued on page 26...)
(...Continued from page 25)
2. Fracture or matrix permeability, hydraulic fracture half-length and fracture conductivity (e.g., Scenario 5) or contacted matrix surface area (e.g., Scenario 2), effective wellbore length.
Modern production analysis methods (see Fekete series “Reservoir Engineering for Geologists”, Part 7) use both production rates and flowing pressures in the analysis to account for variable operating conditions of the wells. For the purposes of this review, we divide production analysis methods into several categories:
1. Straight-line methods (pressure-transient analysis analog): This type of analysis is similar to diagnostic analysis for welltesting described by Mattar and Dean (2008). Derivative plots are used to identify the flow geometries to the well and data corresponding to each flow geometry is analyzed on specialty (usually Cartesian) plots designed to linearize the
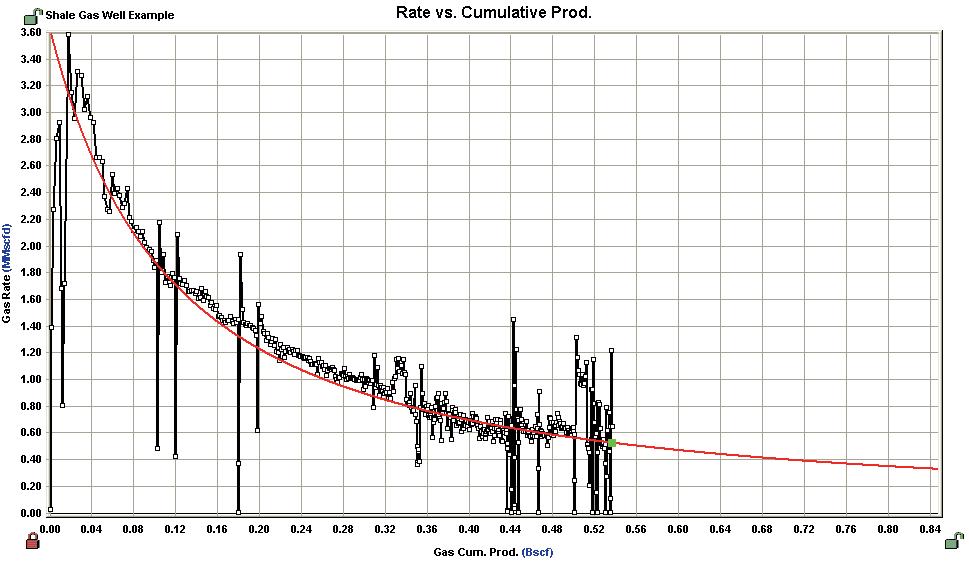
dataset for that flow geometry. The Horner plot for pressure-buildup analysis is an example of a straight-line method used to analysis radial (transient) flow to obtain permeability*thickness and skin. For production data, which can be analyzed like an extended drawdown test, the transient flow periods (linear, bilinear, radial, etc.) may also be analyzed this way, provided the correct superposition time function is used, and the flow geometry is properly identified using derivative or other diagnostic plots. The flowing material balance plot (see Mattar et al., 2008) is a straight-line method that can be used to analyze boundary-dominated flow to obtain OGIP.
2. Type-curve methods (pressure-transient analysis analog): This technique involves matching production data (usually adjusted to account for flowing pressure variations) to theoretical / empirical solutions to flow equations that are cast in dimensionless variable format.
From the match of the data to the dimensionless type-curves, reservoir, well-length, or stimulation information may be extracted through the definition of the dimensionless variables. Mattar et al. (2008) show an example using the Blasingame type-curves to analyze vertical well production.
3. Analytical and numerical simulation: Various commercial and analytical simulation tools are available that can be used to analyze single- or multi-well production data by fitting the model to historical production or pressure (flowing or shut-in) data through adjustment of model inputs. Once an adequate model calibration has been performed, the model may be used to forecast single or multi-well production under a variety of operational and development scenarios.
4. Empirical methods : These methods include the classic decline-curve approach of Arps (exponential, hyperbolic, harmonic;
see Dean and Mireault, 2008), which are largely used to forecast production and obtain estimated ultimate recovery (EUR). They also include modern approaches such as the Power-Law Exponential decline approach (Ilk et al., 2008). These techniques are referred to as “empirical” because, except under certain conditions, a theoretical derivation does not exist. For shale gas, the application of Arps’ curves, for example, must be considered empirical because, strictly speaking, the curves were not developed to analyze transient flow (which most shale wells exhibit for long periods of time).
We now discuss application of each of these techniques using an actual multi-fractured horizontal well (MFHW) completed in a shale gas reservoir as an example.
by the boundary-dominated flow period. Because our well exhibits only linear flow, preceded by a short “cleanup” period, and followed perhaps by liquid-loading behavior (after 400 days), we have matched the well on Wattenbarger’s type-curves (Figure 5, page 25). Our well appears to match the linear flow type-curve quite well, except for the early cleanup period. The estimated x f from the match is reasonably close to that obtained from straight-line analysis (using permeability as an input). We note that if a more complex sequence of flow regimes is exhibited (ex. Figure 2), then type curves specifically designed for multi-fractured horizontal wells will be required (e.g., see Bello and Wattenbarger, 2010).
regime is linear flow, which will possibly be followed by boundary-dominated flow, or perhaps another transient flow period. A conservative approach would be to assume that boundary-dominated flow immediately follows the transient linear flow period, and that the drainage area of the well (this is a required input for forecasting boundary-dominated flow) is equal to that corresponding to the stimulated reservoir volume, as inferred from microseismic data (see Part 6). We therefore used Nobakht et al.’s (2010) method for forecasting our shale gas example (Figure 6), except instead of using Arps’ decline curve to forecast boundary-dominated flow, we used a material-balanced-based forecast methodology after boundaries are reached (requiring an input drainage area). This simple model matches the data fairly well.
not the hydraulic fracture geometry is relatively simple (e.g., Scenario 5 in
Straight-line methods. Figure 3a (page 25) contains the gas production data for the subject multi-fractured horizontal (shale gas) well, and Figure 3b (page 25) contains a diagnostic plot (pseudopressure-normalized gas production rate versus time on a loglog plot) illustrating that the well exhibits a linear flow period (½ slope on the plot). The derivative (not shown) also exhibits a ½ slope. As noted by Bello and Wattenbarger (2008), transient linear flow is the dominant flow regime expected for most shale wells. We can analyze the linear flow period to get either not the hydraulic fracture geometry is relatively simple (e.g., Scenario 5 in The specialty plot used to do this is called a Òsquare-root of timeÓ plot - a can be used to or from which either xf or Acm may be permeability is known. In this example, assuming a matrix permeability of 100 be ~ 2600 ft, which is the sum of the half-lengths of all hydraulic fractures ~ 3 x 106 ft2. This example illustrates why multi-fractured shale wells have hydraulically-fractured vertical well will have xf < 400 ft, and much smaller Because of the ultra-low matrix permeability (100 nd) the more contacted surface
b)
or not the hydraulic fracture geometry is relatively simple (e.g., Scenario 5 in
complex. The specialty plot used to do this is called a Òsquare-root of timeÓ plot - a can be used to or from which either xf or Acm may be permeability is known. In this example, assuming a matrix permeability of 100 calculated to be ~ 2600 ft, which is the sum of the half-lengths of all hydraulic fractures cm is ~ 3 x 106 ft2. This example illustrates why multi-fractured shale wells have typical hydraulically-fractured vertical well will have xf < 400 ft, and much smaller
The specialty plot used to do this is called a Òsquare-root of timeÓ plot - a can be used to or from which either xf or Acm may be permeability is known. In this example, assuming a matrix permeability of 100 to be ~ 2600 ft, which is the sum of the half-lengths of all hydraulic fractures is ~ 3 x 106 ft2. This example illustrates why multi-fractured shale wells have typical hydraulically-fractured vertical well will have xf < 400 ft, and much smaller
Linear flow from which either x f or A cm may be estimated if (matrix) permeability is known. In this example, assuming a matrix permeability of 100 nanodarcies, x f is calculated to be ~ 2,600 ft, which is the sum of the half-lengths of all hydraulic fractures created in this well and A cm is ~ 3 x 106 ft 2 . This example illustrates why multi-fractured shale wells have been so successful – a typical hydraulically-fractured vertical well will have x f < 400 ft, and much smaller contacted surface area. Because of the ultra-low matrix permeability (100 nd) the more contacted surface area the better!
Analytical Simulation. As discussed above, commercial software tools are available for analytical and numerical simulation, and excellent progress has been made in the past few years to accommodate complex shale gas behavior. Numerical simulation will be discussed in Part 8 of this series. A simple approach for analyzing shale wells is to identify and analyze the dominant flow regimes, then use the extracted information to generate a forecast based upon the flow equations corresponding to those flow regimes. This approach is illustrated by Clarkson and Pedersen (2010) for low-permeability oil systems. Nobakht et al. (2010) provided a simple method for forecasting shale gas wells; they assumed that the dominant flow regimes are linear and boundary-dominated flow, and used the slope and intercept of the squareroot of time plot to forecast transient linear flow and the Arps hyperbolic decline curve (see below) to forecast boundarydominated flow. This approach is valid for homogeneous completions (all hydraulic fractures are equivalent length) – Ambrose et al. (2011) have recently developed a method to account for heterogeneous completions.
In our shale gas example, the dominant flow
Empirical Methods. We finish up our analysis of the subject shale gas well with the application of decline curves. As noted above, Arps’ decline curve method is only strictly applicable to wells in boundarydominated flow, although engineers (present authors included) have attempted to fit and forecast shale wells exhibiting transient flow. This remains the subject of much debate (whether to do this or not, and what is an acceptable procedure). A further complication is that a single hyperbolic or exponential curve will not likely fit the entire production history, due to changing b-factors (decline exponent) over time. Newer techniques, such as the PowerLaw Exponential approach (Ilk et al., 2008) account for this changing b-factor over time, but it is still essentially an empirical technique, albeit with more flexible attributes. One approach using the traditional Arps declinecurves is to use a multi-segmented decline curve to fit the data, with different segments having progressively smaller b-factors until b-factors typical of boundary-dominated flow are used (b < 1, generally 0 < b < 0.5 for gas wells during boundary-dominated flow). (Continued on page 28...)
b)
Type-Curve Methods. From the previous section, we know that the dominant flow period in our subject well is linear flow. Linear flow type-curves were developed by Wattenbarger et al. (1998) for the scenario of hydraulically fractured vertical wells exhibiting a linear flow period, followed
Linear flow or
Because of the ultra-low matrix permeability (100 nd) the more contacted surface
Because of the ultra-low matrix permeability (100 nd) the more contacted surface b)
data for subject shale gas well (a). (b) contains a log-log diagnostic plot demonstrates that the well is exhibiting linear flow.
Linear flow or to used or of the all multi-fractured the well well , where x f is hydraulic fracture half-length and A cm is contacted matrix surface area, depending upon whether or not the hydraulic fracture geometry is relatively simple (e.g., Scenario 5 in Figure 1) or more complex. The specialty plot used to do this (Figure 4, page 25) is called a “square-root of time” plot - a straight-line fit on this plot can be used to obtain
Natural Gas Potential in Canada 2005 disc: A Report by the Canadian Gas Potential Committee.
- Complete disc: $150 + GST
- Electronic PDF report: $50 + GST
Facies Models 4 from the Geological Association of Canada
- Member price: $55 + GST
- Non-member price: $100 + GST
Visit www.cspg.org, or contact Caitlin Young at caitlin.young@cspg.org or call 403-513-1227 to order today!
We suggest that the wells first be analyzed using the techniques above, then the Arps curves used to provide a forecast consistent with the analytical methods. An application of the multi-segmented approach to our shale gas well is shown in Figure 7 (page 26):
In this example, we note that a superharmonic (b > 1) decline curve was fit to the (transient flow) data, but that the forecast was changed to exponential after a minimum effective decline rate was specified. The minimum effective decline rate may be based upon analog wells in the field that have reached an advanced level of production; in our example, the minimum decline rate was adjusted so that the remaining reserves from decline analysis was equal to that obtained from the analytical forecast above.
In summary, there are several techniques available to analyze shale gas production data; our knowledge of shale gas reservoir properties and performance characteristics of multi-fractured horizontal wells completed in gas shales continues to evolve, however. Consequently, techniques for analyzing multi-fractured horizontal wells also continue to evolve – recent
examples include the incorporation of stress-dependent permeability (Thompson et al., 2010) and multi-mechanistic flow and desorption (Clarkson and Ertekin, 2010) into algorithms for rate-transient analysis of multi-fractured horizontal wells and the development of type-curves specific to MFHW in shale (Bello and Wattenbarger, 2010; Moghadam et al., 2010). This a rapidly advancing area of research – stay tuned!
Al-Ahmadi, H. A., Almarzooq, A. M., and Wattenbarger, R. A. 2010. Application of linear flow analysis to shale gas well – field cases. Paper SPE 130370 presented at the Society of Petroleum Engineers Unconventional Gas Conference held in Pittsburgh, Pennsylvania, 2325 February.
Ambrose, R. J., Clarkson, C. R., Youngblood, J., Adams, A. Nguyen, P., Nobakht, M., and Biseda, B. 2011. Life-cycle decline curve estimation for tight / shale gas reservoirs. Paper SPE 140519 presented at the Society of Petroleum Engineers Hydraulic Fracturing Technology Conference and Exhibition held in The Woodlands, Texas, 24-26 January.
Bello, R. O. 2009. Rate transient analysis in shale
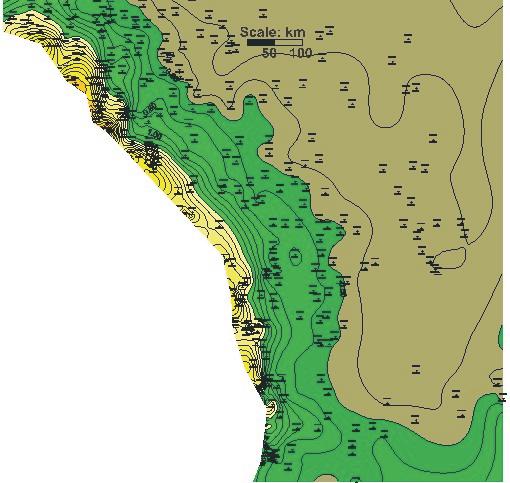
gas reservoirs with transient linear behavior. Ph.D. Dissertation. Texas A & M University, College Station, Texas.
Bello, R. O. and Wattenbarger, R. A. 2008. Rate transient analysis in naturally fractured shale gas reservoirs. Paper SPE 114591 presented at the Canadian International Petroleum Conference / Society of Petroleum Engineers (CIPC/SPE) Gas Technology Symposium 2008 Joint Conference, Calgary, Alberta Canada, 16-19 June.
Bello, R. O. and Wattenbarger, R. A. 2010. Multi-stage hydraulically fractured shale gas rate transient analysis. Paper SPE 126754 presented at the Society of Petroleum Engineers North Africa Technical Conference and Exhibition, Cairo, Egypt, 14-17 February.
Chen, C. C. and Raghavan, R. 1997. A multiplyfractured horizontal well in a rectangular drainage region. SPEJ 2 (December 1997): 455465. SPE-37072-PA presented at the Society of Petroleum Engineers International Conference on Horizontal Well Technology, Calgary, Alberta, Canada, 18-20 November 1996.
Clarkson, C. R. and Beierle, J. J. 2010. Integration of microseismic and other post-fracture surveillance with production analysis: A tight
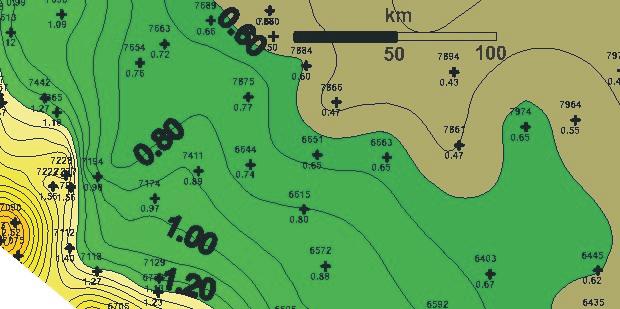
gas study. Paper SPE 131786 presented at the Society of Petroleum Engineers Unconventional Gas Conference held in Pittsburgh, Pennsylvania, 23-25 February.
Clarkson, C. R. and Ertekin, T. 2010. A new model for shale gas matrix flow using the Dynamic-Slippage Concept. Poster presentation at the 2010 American Association of Petroleum Geologists, Hedberg Research Conference on Critical Assessment of Shale Resource Plays held in Austin, Texas, 5-10 December.
Clarkson, C. R. and Pedersen, P. K. 2010. Tight oil production analysis: Adaptation of existing rate-transient analysis techniques. Paper CSUG/SPE 137352 presented at the Canadian Unconventional Resources and International Petroleum Conference held in Calgary, Alberta, Canada, 19-21 October.
Dean, L. and Mireault, R. 2008. Reservoir Engineering for Geologists, Part 4: Production decline analysis. Canadian Society of Petroleum Geologists Reservoir, v. 35, issue 1, p. 20-22.
Ilk, D., Rushing, J. A., Perego, A. D., and Blasingame, T. A. 2008. Exponential vs. hyperbolic decline in tight gas sands – Understanding the origins and implications for reserve estimates using Arps’ decline curves. Paper SPE 116731 presented at the Society of Petroleum Engineers Annual Technical Conference and Exhibition, Denver, CO, 21-24 September.
Javadpour, F. 2009. Nanopores and apparent permeability of gas flow in mudrocks (shales and siltstones). Journal of Canadian Petroleum Technology, v. 48, p. 16-21.
Mattar, L., Mireault, R., and Dean, L. 2008. Reservoir engineering for geologists, Part 6: Well test interpretation. Canadian Society of Petroleum Geologists Reservoir, v. 35, issue 4, p. 22-26.
Mattar, L. Mireault, R., and Dean, L. 2008. Reservoir engineering for geologists, Part 7: Rate transient analysis. Canadian Society of Petroleum Geologists Reservoir, v. 35, issue 5, p. 24-26.
Mayerhofer, M. J., Lolon, E. J., Warpinski, N. R., Cipolla, C. L., and Walser D. 2008. What is stimulated reservoir volume? Paper SPE 119890 presented at the Society of Petroleum Engineers Shale Gas Production Conference, Fort Worth, TX, 16-18 November.
Moghadam, S., Mattar, L., and Pooladi-Darvish, M. 2010. Dual porosity type curves for shale gas reservoirs. Paper CSUG/SPE 137535 presented at the Canadian Unconventional Resources and International Petroleum Conference, Calgary, Alberta, 19-21 October.
Nobakht, M., Mattar, L., Moghadam, S., and Anderson, D. M. 2010. Simplified yet rigorous forecasting of tight / shale gas production in linear flow. Paper SPE 133615 presented at the Society of Petroleum Engineers Western Regional Meeting, Anaheim, California, 27-29 May.
Ozkan, E., Brown, M., Raghavan, R., and Kazemi, H. 2009. Comparison of fractured horizontal-well performance in conventional and unconventional reservoirs. Paper SPE 121290 presented at the Society of Petroleum Engineers Western Regional Meeting, San Jose California, 24-26 March.
Thompson, J. M., Nobakht, M., and Anderson, D. M. 2010. Modeling well performance data from overpressured shale reservoirs. Paper CSUG/SPE 137755 presented at the Canadian Unconventional Resources and International Petroleum Conference, Calgary, Alberta, 19-21 October.
Wattenbarger, R. A., El-Banbi, A. H., Villegas, M. E., and Maggard, J. B. 1998. Production analysis of linear flow into fractured tight gas wells. Paper SPE 39931 presented at the Society of Petroleum Engineers Rocky Mountain Regional / Low-Permeability Reservoirs Symposium, Denver, Colorado, 5-8 April.
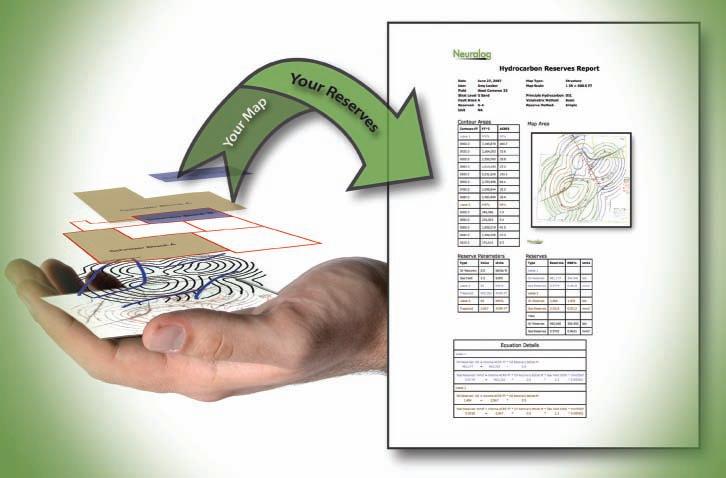
Get the most accurate and reliable Volumetrics and Reserves.
Do you depend on reserve data for your oil and gas valuation or economics? Critical decision making requires reliable and verifiable results. Precise results are derived from accurate data. NeuraMap’s automated data capture and Volumetrics & Reserves tools enable you to produce precise data to achieve better results with your Drilling Program.
Accurate Volumetrics and Reserves
• Basic & Modified Methods
• Presentation Quality Custom Reports
• Scaled and Projected Map Support
• Real-Time Feedback

| By Mir-Yusif Mir-Babayev and Husniya Mamedova
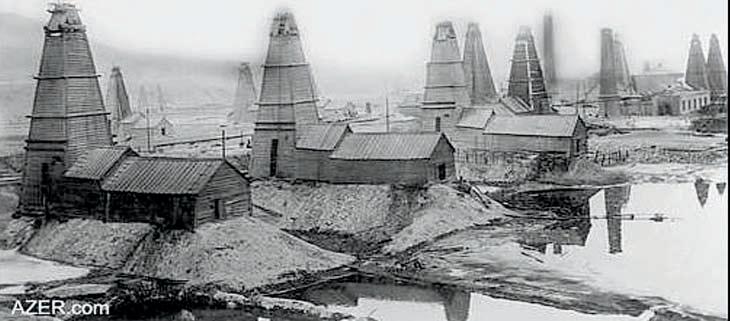
In North America, it is common to think of the “Beginning of the Oil Industry” as Oil Springs / Petrolia in Ontario (1858) or Titusville in Pennsylvania (1859). This is only natural since many of the more famous multi-national oil giants began their lives in the USA. The true history of oil is far more complex, and a lot more interesting, if we
look around a bit.
For example, the oil seeps at Baku on the Apsheron peninsula in present-day Azerbaijan flowed freely centuries before year 1. They played a major role around 600 BC in the Zoroastrian religion of Persia and India, and were an export commodity long
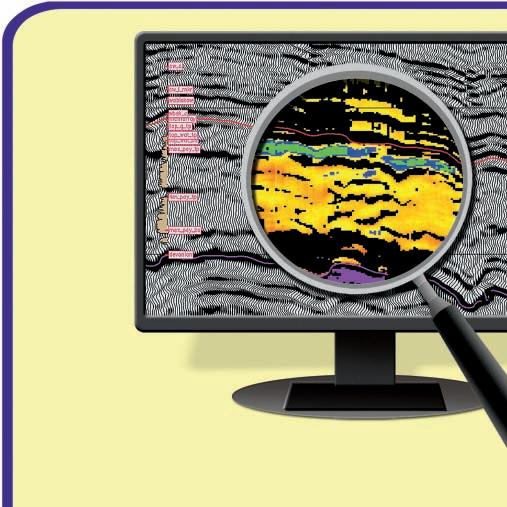
before the birth of Christ or Muhammed.
Oil in large quantities started to be extracted commercially in Azerbaijan much earlier than in the countries of the Americas, Europe, or Asia. The main reason is that the oil of Baku had migrated to shallow reservoirs and escaped to the surface in the form of creeks and springs. In 1594, the “well master” Allahyar Mamedali Nur had built a multi-level oil well at a depth of more than 35 meters in Balakhani, which yielded oil at a significant rate.
The first mechanical oil well drilling operation in the world occurred in Bibi-Heybat, a suburb of Baku (Figures 1, 2). This was initiated in 1846 under the direction of Vasily Semyonov, a member of the Council of the Main Administration of Trans Caucasus. It reached a depth of 21 meters, with positive results. The work was led by Major Alekseyev, director of the Baku oil fields. The archived documents are dated 1847 and are signed by the Grand Duke Mikhail Vorontsov, Governor in Caucasus at the time.


This work predates Edwin Drake’s discovery by 13 years. But there are many similarities. Both Baku and Titusville were known because of seeps and springs. Both drilled wells to about 20 meters depth to increase the oil flow. And both are credited with the “Birth of the Oil Industry”, but Baku came first and fueled Russia and much of Europe; Pennsylvania came later and fueled the development of the US-based multinationals. The Middle East hadn’t even been invented yet!
Transition to well drilling, instead of hand digging, led to a dramatic rise in oil extraction. An average depth of Absheron wells dug prior to 1840 could not exceed 10 meters, but drilling reached 25-45 meters. The highest-rated wells yielded 1.5 tonnes of oil per day (about 10 bopd).
Intensive development of the Baku oil business and attraction of foreign capital into the oil industry of Azerbaijan led to Baku becoming the oil extraction and oil refining center of the Russian Empire between 1870 and 1880. Meanwhile, the Baku Branch of the Imperial Russian Technical Society, founded in March 1879, became the center of scientific research for oil in the Caucasus. Their early papers and Journals predate all but a few English language monographs.
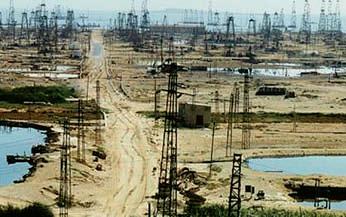
Up to 1901, Baku held first place in the production sweepstakes with more than half of the overall world oil extraction, leaving far behind other oil-producing countries such as the USA, Canada, Venezuela, and Argentina.
Although exploration and production of oil are key ingredients of the oil industry, oil is fairly useless without further processing. The rise of industrial oil refining also takes its first roots in Baku. Samuel Gmelin, from the Saint Petersburg Academy of Sciences, visited Baku in 1771 and confirmed that the white oil had been refined to create useful products.
Mohammed Bekran, the Arabian historian, wrote that oil refining in the Absheron had been known since the beginning of the 13th century and Ioann Lerkh, an employee of the Russian Embassy in Persia, extensively described the refining process of that epoch in Baku in 1733.
More modern refineries were constructed from 1837 to 1864. The first oil refineries in the US (Pittsburgh) were built by Samuel Kier in 1853-55. By 1870, there were 47 oil refineries in Baku producing up to 8,000 tonnes of kerosene per year. Dmitry Mendeleyev introduced a method of uninterrupted oil refining in 1881-82, at the Baku plant of the Nobel Brothers. The oil refining industry of the US started to apply this method in 1899.
There are many other pioneering “firsts” attributed to the Azerbaijan oil industry: the first oil tankers on the high seas (1873), the first long-distance pipeline (880 km, built between 1887 and 1907), and the first off-shore oil wells (1803). The pipeline was ranked among the engineering marvels of the world when it was completed, rivaling the Eiffel Tower in impressiveness.
The first floating drilling rig in the Caspian Sea (near Apsheron peninsula, Baku) started operating September, 1934. In 1936, Baku engineer, A. M. Pobedin, drafted the first structural map of the Caspian Sea and Apsheron Strait, in support of drilling for offshore structures. The world’s first major offshore oilfield, called Neftyaniye Kamni (Oil Rocks), was discovered 100 km from shore in the Caspian Sea in 1949. Today,
the Caspian area is a still a hotbed of oil exploration and development.
Baku inventors developed sidetrack drilling, cluster-side directed drilling (onshore and offshore), as well as exploitation of several horizons of the same well. Construction of the hydraulic pump for oil extraction in the seabed and many other technical innovations are attributed to the Baku oil specialists – workers, engineers, and scientists of Azerbaijan whose achievements favored tapping and exploring new oil and gas reserves not only in the Republic, but also in other regions of the former USSR and abroad. These contributions, too numerous to list here, continued through the 20th and now into the 21st centuries.
Mir-Babayev M.F. 2002. Azerbaijan’s oil history: Brief oil chronology leading up to the Soviet era. Azerbaijan International magazine, Sherman Oaks, CA (US) AI 10.2 (Summer 2002), p 3441. http://azer.com/aiweb/categories/magazine/ ail02_folder/102_articles/102_oil_chronology. htm.
Mir-Babayev M.F. 2003. Azerbaijan’s oil history: Brief oil chronology since 1920. - Part 2. Azerbaijan International magazine, Sherman Oaks, CA (US) AI 11.2 (Summer 2003), p.5663. http://azer.com/aiweb/categories/magazine/ ai112_folder/112_articles/112_chronology.html.
Mir-Babayev M.F. 2004. Foreign investment in Azerbaijan’s oil. Azerbaijan International magazine, Sherman Oaks, CA (US) AI 12.2 (Summer 2004), p.82-85. http://azer.com/ aiweb/categories/magazine/ail22_folder/122_ articles/122_foreign_investment.html.
Mir-Babayev M.F. 2007 Concise history of Azerbaijani oil. – Baku, Azerneshr. 292 p.
Editor’s Note
This article was edited and condensed by E. R. (Ross) Crain, P.Eng., at the request of the authors, from a longer article contained in MirBabayev (2007).
Doctor of Chemical Sciences, Professor of Azerbaijan Technical University, Mir-Yusif MirBabayev is a well known and experienced specialist in the areas of oil chemistry and ecology. He was born in Baku. He graduated from the faculty of Chemical Technology of the Azerbaijan Oil and Chemistry Institute in 1975. In 1986, he defended his Ph.D. thesis on the specialty of Oil Chemistry. He is the author of more than 90 scientific works published in Azerbaijan and abroad (in Russia, Iran, Turkey, USA). He began to study the history of Azerbaijan oil in 1992. At the moment, he is a member of the editorial board of “Azerbaijan Oil Industry” magazine. He can be reached at: mir_yusif@yahoo.com.
Deterministic and Stochastic Inversion developed by Earthworks
Earthworks Seismic Inversion plug-in for Petrel* is an ultra-fast full featured seismic inversion software enabling effective use of impedance data and AVO in the reservoir modeling workflow.
• Fully integrated into Petrel
• Inversion of pre- and post stack seismic data
• Several optional algorithms for both deterministic and stochastic inversion
• Functionality for inspecting results and better understand the geophysical uncertainty in reservoir modeling
Prior Model 3D errors
Deterministic Inversion Stochastic Inversion


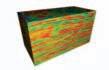
Earthworks Seismic Inversion Training class, Houston March 7 - 9
Sign up or learn more? sales@blueback-reservoir.com
+1 403 538 4821
www.blueback-reservoir.com
| By Brett Frostad
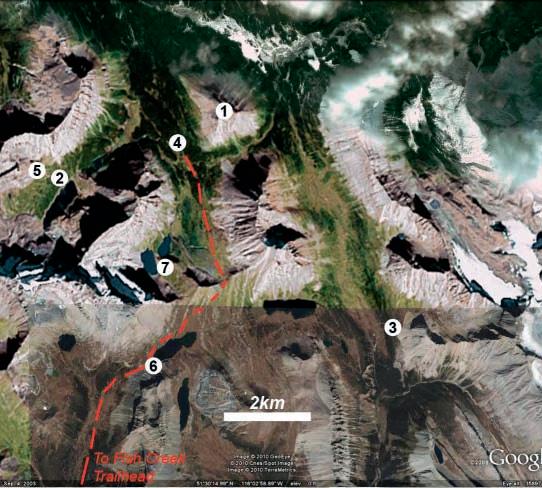
Trailhead: Fish Creek parking lot on the access road to the Lake Louise Ski area (1,750 metre elevation).
Distance: Approximately 12 kilometres into Skoki Lodge.
Max. Elevation: 2,470 metre in Deception Pass (720 metre elevation gain from trailhead).
Day trips range from 4 – 20 kilometres return with varying elevation gains.
Although it is only a few kilometres from the bustling tourist destination of Lake Louise, the Skoki Valley in Banff National Park offers the same incredible scenery with the tranquility of the backcountry.
Starting from the parking area at 1,700 metres, the hike climbs steadily up a ski area access road to Temple Lodge and then through alpine forest to Boulder Pass and Ptarmigan Lake. After skirting around the lake, there is a steep 150 metre climb over Deception Pass (2,470 metres) – the summit of which offers views back over Ptarmigan and Baker Lakes and down the Skoki Valley. From there, it is a 3.5 kilometre downhill trek to the valley.
There are numerous back-country campgrounds in the area that can be used as a base camp for day excursions. Built in 1934, the Skoki Lodge National Historic Site also provides accommodations and meals (reservations required).
The geology of this part of the Slate Range is dominated by Cambrian rocks overthrust on the Ordovician and Devonian along the major Pipestone Pass and Castle Mountain thrust faults.
Within easy walking distance of the lodge you can visit excellent exposures from the Precambrian to the Devonian including; the spires of Merlin’s Castle, overlooking Merlin Lake, the Upper and Lower Skoki Lakes, Devonian corals exposed on the slopes of Skoki Mountain, and an extensive, well-preserved stromatolite assemblage.
Detailed descriptions for most of these hikes can be found in locally published hiking guidebooks of the Rocky Mountains or Banff National Park. Geological information can be found on GSC map sheets 1463A and 1428A.
Special thanks to the staff of Skoki Lodge for their description of, and directions to, the stromatolite outcrop.
The Reservoir Committee welcomes contributions from our readership to this series. If you wish to offer a submission to Go Take A Hike, on your favourite hike of geological interest, email the Reservoir at caitlin.young@cspg.org for more information.
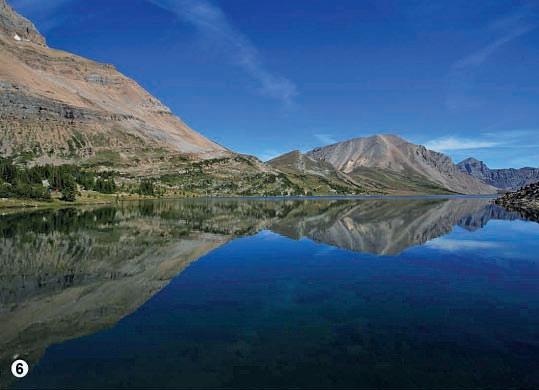

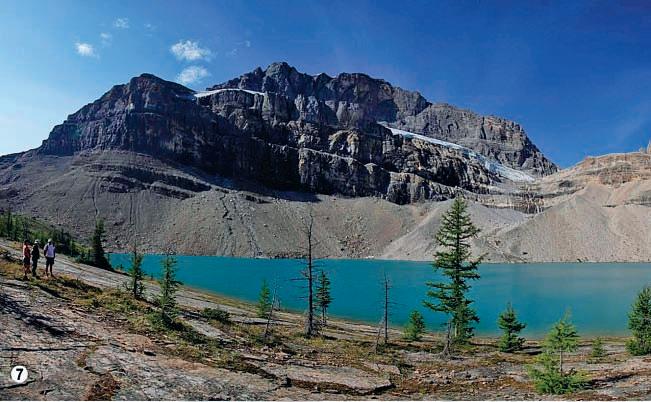

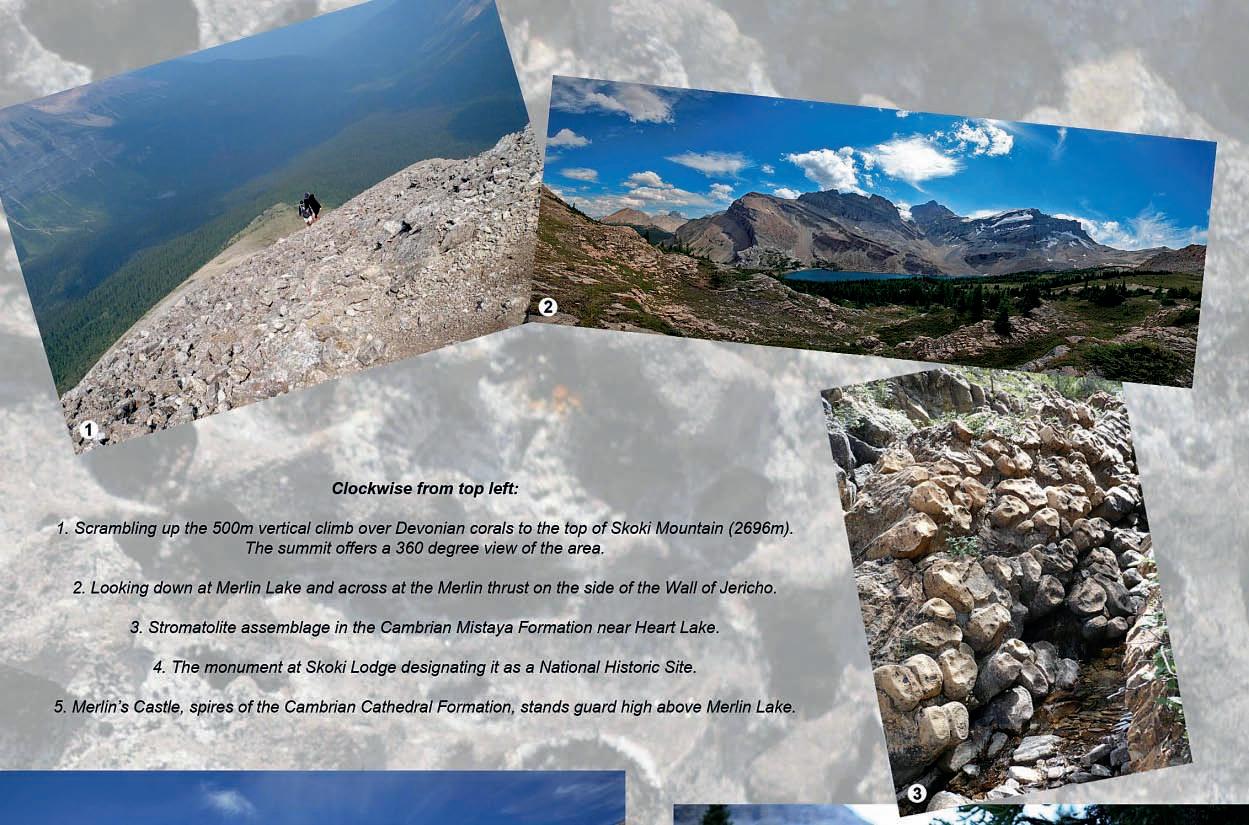
Clockwise from top left:
1. Scrambling up the 500 metre vertical climb over Devonian corals to the top of Skoki Mountain (2,696 metres). The summit offers a 360-degree view of the area.
2. Looking down at Merlin Lake and across at the Merlin thrust on the side of the Wall of Jericho.
3. Stromatolite assemblage in the Cambrian Mistaya Formation near Heart Lake.
4. The monument of Skoki Lodge designating it as a National Historic Site.
5. Merlin’s Castle, spires of the Cambrian Cathedral Formation, stand guard high above Merlin Lake.
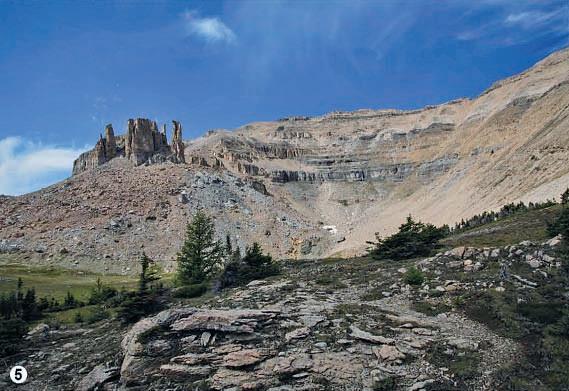
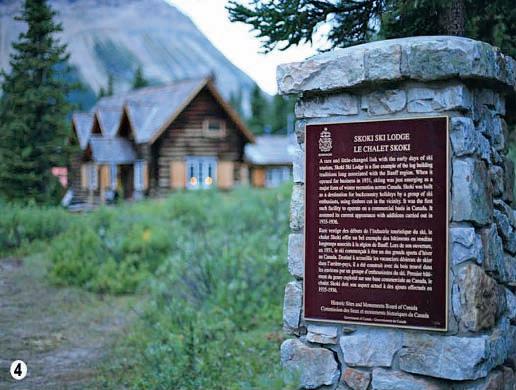
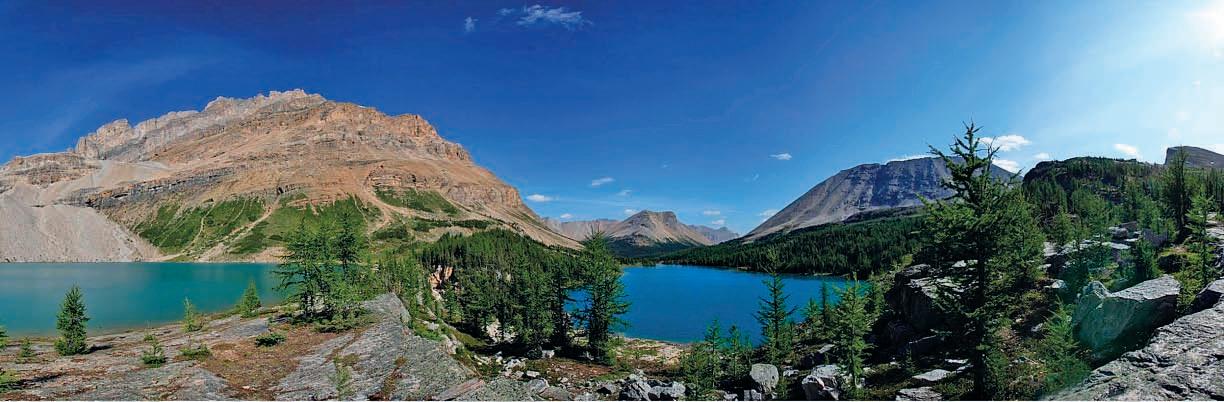


| By Tom Sneddon, Manager of Geoscience Affairs, APEGGA Calgary
The second most common comment I get as Geoscience Affairs Manager is “I have a stamp, but have never used it. Geologists don’t build stuff like engineers do and what I do does not affect the public.” (The first most common comment is “What does APEGGA do for me?”, a topic I will address in another article).
APEGGA publishes practice standards and guides to assist the technical professional in doing the right things correctly. In the case of answering the “to stamp or not to stamp” question, there is a Practice Standard for Authenticating Professional Documents, Version 2.0 dated April 2002. This document is available at www.apegga.org or in hard copy from either the Edmonton or Calgary offices. Copies of the current office consolidation of the Engineering, Geological and Geophysical Professions Act are also available.
Practice does vary from one company to another, with the details of day-to-day workflow being at the discretion of Management and the Responsible Members for each permitted company. It follows that without regard to how a given company manages its affairs or defines what it believes to be professional documentation, any revisions or changes to professional documents must be authenticated, preferably by the person who created the original documents.
More generally speaking, there are several classes of professional geological documents that should be authenticated. Examples of these documents include:
• Well prognosis charts and associated documentation
• Strip logs and well geology reports
• Maps and reports that will be used by a Board of Directors’ Reserves Committee
• Technical information related to natural resources held by a company to be released to the public under National Instrument 51-101.
• Reports that, in the words of The Engineering, Geological and Geophysical Professions Act (Revised Statutes of Alberta 2000, Chapter E11.1, January 2010) involves the practice of geology; specifically:
• Section 1(r) “practice of geology” means (i) Reporting on, advising, evaluating, interpreting, geological surveying, sampling or examining, related to any activity
A) That is aimed at the discovery or development of oil, natural gas, coal, metallic or non-metallic minerals, precious stones, or other natural resources or water or that is aimed at the investigation of geological conditions, and
B) That requires in that reporting, advising, evaluating, interpreting, geological
surveying sampling or examining, the professional application of the principles of the geological sciences, or (ii) Teaching geology
While teaching geology is the practice of geology, Section 2(f) exempts “a person engaged or employed by a university whose practice of the profession consists exclusively of teaching geology at the university.” The exemption does not extend beyond the university, however, and a university employee who consults outside of university duties requires registration and is subject to all the other provisions of the EGGP Act.
Every company and individual practitioner should have specific policies concerning who authenticates what sort of documents at which points in the work flow. It is true that few industry standards or best practices exist at the moment; however, some are evolving. Using the examples noted above, the rationale for authentication could be argued as follows:
• Well prognosis charts and reports fit the “practice of geology” definition and should be authenticated, since both worker and public
health and safety are at risk if a drilling operation is conducted without due regard to prior identification of such hazards as hydrogen sulphide, overpressure zones, and difficult drilling zones that may require the use of invert muds.
• Strip logs from the Wellsite Geologist (or his/her supervisor) preparing these logs from cuttings and core recovered and sampled from a well is the most basic document. The same is true for the report issued by the geologist responsible for documenting the formations penetrated and tested during and following the drilling operation. Mechanical logs and other geophysical data must be calibrated and tied to the well, and the Professional Engineer or Professional Geophysicist deriving data and interpreting the geology of the region surrounding the well must be satisfied it was valid data that accurately describes the lithology discovered there. A strip log is more than data; it is the lithological interpretation of a skilled professional geologist in the field. This is an evolving industry best practice.
• Maps and reports that will be used for evaluation and valuation purposes require the
(Continued on page 36...)
The new Facies Models 4 book published by the Geological Association of Canada has arrived at the CSPG o ce!
The CSPG is extremely proud to present this new book available for purchase through the CSPG bookstore.
Pricing for the book is:
$55 for members $100 for non-members
Drop by our o ce or go online to order at www.cspg.org.
Shipping outside Calgary, within Canada is an extra $18.
Please contact Caitlin Young at 403-513-1227 or by email at caitlin.young@cspg.org if you have any questions or if you would like to purchase this exciting new book!
(...Continued from page 35)
authorization of a Qualified Person (mining properties) or a Qualified Evaluator (oil and gas properties) under the authentication rules specified by the Canadian Securities Administrators and similar authorizations under the United States Securities and Exchange Commission. Once again, the corporate Board sets the ground rules for their organizations. This includes who advises the Board, and who is allowed to convey technical information to the outside world on the Board’s behalf.

RPS Boyd PetroSearch helps evaluate new territory.
Exploring? RPS Boyd PetroSearch offers a comprehensive Project Management service to provide high quality, cost-effective options for seismic exploration. We manage every stage of your exploration program from pre-planning through recording and follow-up.

Our experience in approvals, mapping, permitting and HSE is unbeatable.
Find out how we can reduce your risk in acquiring seismic data by ensuring that your projects are completed safely, on time and on budget.
Please call: Kevin Bowman 403.543.5357 or Larry Herd 403.543.5362
Visit boydpetro.com or rpsgroup.com/canada
rpsgroup.com
• NI 51-101F1 and NI 43-101F1 reports have specific terms and conditions of which all professionals should be aware. Those terms and conditions can be found at the websites for the Securities Commissions where reporting is required. The stock exchanges have an additional set of rules that are found at their websites as well.
• Technical reports that meet the criteria set out in Section 1(r) should be authenticated, although authentication of internal-use-only reports is at the discretion of each organization. When the report leaves the organization (say for review in a data room as part of a divestiture project), it should be authenticated. Further, even internal reports may find their way into the public domain through mergers, acquisitions, farm-outs, and similar unanticipated channels. Therefore, the Professional Geologist should consider those possibilities and can choose to treat certain potentially high-impact internal reports as though they were public documents.
Geologists are particularly reluctant to stamp anything. By choosing not to authenticate a document as final, the paper trail becomes uncertain. As several early versions may have been circulated for review and comment, and should it be necessary to track a series of events after the fact, it is important to identify the “true” final version by authenticating it.
There is also a feeling that by not authenticating a document, there is no liability accruing to the author. This is not true, as the author may be subject to civil liability whether a draft is stamped or not. The authentication applied to the document specifically witnesses that the author accepts responsibility for the document as of the date it is stamped. Since new information invariably contributes to updates and revisions, especially to maps and cross-sections, it is good practice to include a revision history block on each professional document.
Finally, to help defend themselves against false claims, professionals who prepare or supervise the preparation of a document should retain an authenticated copy in their own archives.
If you have any questions concerning authentication, please feel free to get in touch with me or with the Director of Professional Practice, Ray Chopiuk, P.Eng., at APEGGA Head Office in Edmonton.
| By David Eaton, Head of Department of Geoscience, University of Calgary
The R.J.W. Douglas Medal is presented annually for outstanding contributions to the understanding of sedimentary geology in Canada, and includes the related fields of regional tectonics, petroleum systems, and structural geology. The award is open to all geologists who follow the example of R.J.W. (Bob) Douglas in contributing to the development of Canadian sedimentary, petroleum, and structural geology.
The R.J.W. Douglas Medal award committee is pleased to present Dr. Deborah A. Spratt as the recipient of the 2010 award. Dr. Spratt, Professor of Geoscience at the University of Calgary, has been training structural petroleum geologists for 30 years, during which she has supervised 37 graduate students and taught structural and field geology to over 2,800 geoscience students and 1,100 geoscience professionals. She is internationally renowned for using field analogs and geometric analysis to document and visualize the development of 3D structures and fracture systems in petroleum
reservoirs, and to understand how they are controlled by lithology and regional tectonics. As co-Director of the Fold-Fault Research Project (FRP) since 1995, she has worked with nearly two dozen industry sponsors to integrate field mapping, seismic imaging, well data and geometric analysis in numerous projects in the Canadian Rockies, Foothills and Triangle Zones. This work was recognized by the 2000 NSERC Synergy Award and 2002 APEGGA/Alberta Ingenuity Fund Summit Award for research excellence, resulting from the collaboration of academic, industry, and government researchers. Projects involving fieldwork in Alberta, British Columbia, and Northwest Territories have received strong support from NSERC, the Geological Survey of Canada, and the Alberta Geological Survey, providing the students with invaluable field training.
The 2010 R.J.W. Douglas Medal will be presented at the 2011 CSPG Awards Ceremony, Monday, May 9th at the Hyatt Regency Calgary.


The full 2010 R.J.W. Douglas Medal citation will appear in the March 2010 issue of the Bulletin of Canadian Petroleum Geology.
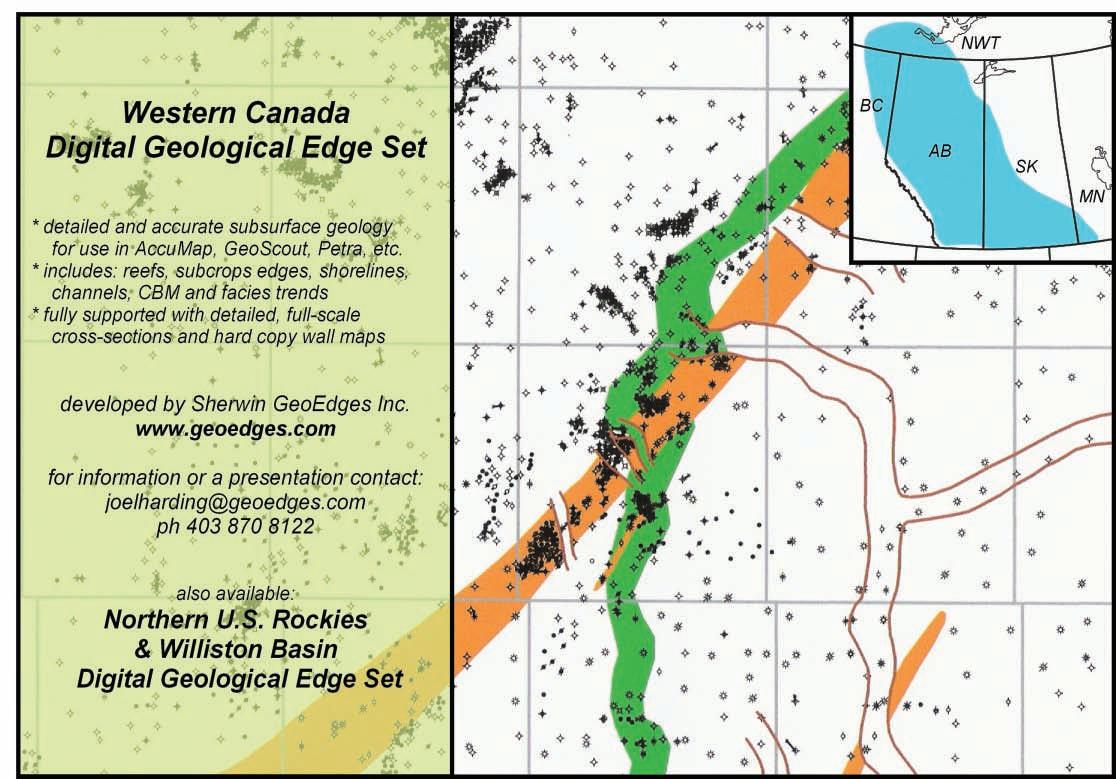
| By Ian Kirkland, Chair, Medal of Merit award committee
The Canadian Society of Petroleum Geologists Medal of Merit is awarded annually for the “best paper related to Canadian petroleum geology” (as specified in CSPG bylaws) published during the previous publication year, in this case for refereed papers published in 2009. The paper chosen this year was written by Jack Wendte, David Sargent, Alan Byrnes, and Ihsan Al-Aasm and is entitled “Depositional facies framework, evolution, and reservoir architecture of the Upper Devonian Jean Marie Member (Redknife Formation) in the July Lake area of northeastern British Columbia”. The paper was published in the September 2009 Bulletin of Canadian Petroleum Geology, v. 57, p. 209-250.
This paper is the first that describes the Jean Marie Member in detail. The Upper Devonian Jean Marie play is the focus of unconventional gas-related development in northeastern British Columbia in the Cordova Embayment, including July Lake, and the Greater Sierra area in the more westerly Horn River Basin.
The Jean Marie is a widespread gassaturated carbonate unit in northwestern Alberta, northeastern British Columbia and the southern Northwest Territories, which has been estimated to contain approximately 10 TCF of gas in place within British Columbia. The authors utilized cores, thin sections, and well logs to characterize the depositional and reservoir aspects and to determine the sequence stratigraphic framework of the Jean Marie in the July Lake area of northeastern British Columbia. Thirteen main lithofacies were characterized and described in detail. Two depositional facies were determined to be the major controls on production: the platy stromatoporoidRenalcis reef core-foreslope facies and the detrital stromatoporoid-coral foreslope facies. The interpreted discontinuity of the primary reservoir facies explains why the historical vertical wells were not very economically attractive while at the same time providing a context for the success of the dense array of horizontal wells that have been drilled to exploit this resource.
The authors also determined that the Jean Marie was deposited in a carbonate ramp setting with the shallow-water, higherenergy depositional facies deposited on very small patch reefs 50 to 100m across which coalesced during progradation.
This paper is an important contribution as it will be valuable in ongoing gas development of the widespread Jean Marie Member. It will also be useful for understanding carbonate ramps and patch reefs in similar geologic settings. In addition, the paper is well illustrated, introduces significant new data, and effectively integrates data from multiple sources.
The 2010 Medal of Merit awards will be presented at the 2011 CSPG Awards Ceremony, Monday, May 9th at the Hyatt Regency Calgary.
The full 2010 Medal of Merit citation will appear in the March 2010 issue of the Bulletin of Canadian Petroleum Geology.

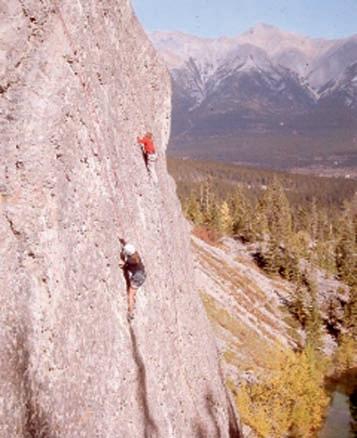
Rock Climbers on the Grassi Lakes Upper Devonian Reef above Canmore, AB
by: Bill Ayrton
New geologists, engineers, geophysicists and landmen, as well as summer students entering the industr y for the first time will find the courses a very beneficial introduction to the petroleu m industry These courses will be extremely useful to nonprofessional and support staff in the oil and gas industry, as w ell as accountants, lawyers, brokerage and financial personnel working primarily alongside the oil and gas industry.
To register or to obtain additional information regarding in-house and upcoming courses, please contact:
Ayrton Exploration Consulting Ltd.
Tel: (403) 262-5440
Email: ayrtonex@shaw.c a
Or visit our website: www.ayrtonexploration.com
Date: April 19th and 20th, 2011
Cost: $945 (includes GST)
Instructor: Bill Ayrton
Effective for personnel just joining the oil patch, or for financial, accounting, and information systems personnel.
• Learn about the many facets of the industry.
• Oil finding, land acquisition, drilling, seismic, well completion, jargon and terminology.
Date: April 27th and 28th, 2011
Cost: $945 (includes GST)
Instructor: Bill Ayrton
Effective for geological technicians or administrative staff, or for those who just want a better understanding of geology to appreciate the world around us.
• Learn about earth structure, geologic time-scale and processes, Western Canada geology, and interesting nearby locations.
• Participate in a rock identification e xercise, cross-section project and a mini-field trip in downtown Calgary.
Date: April 5th, 6th and 7th, 2011
Cost: $1365 (includes GST)
Instructor: Bill Ayrton
Ideal for those who wish to improve their geological understanding of where and how we look for oil and gas fields in Western Canada.
• To visualize what Western Canada looked like throughout the stages of history, for example, the position of the sea versus land, what sediments were deposited, and what type of life that existed and evolved.
• To review the importance of each major stratigraphic unit, i.e. Devonian, Mississippian, Cretaceous, etc.
• Discuss the geological and seismic expression of typical oil and gas fields in each unit.
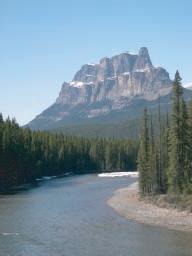
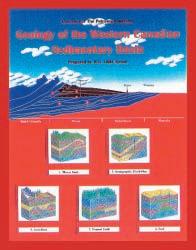
| By Krysta L. Adamski, CA, Senior Tax Manager, WBLI
Chartered Accountants, Bedford, NS, with Alberta rates updated by N. Calvin Stewart, CA, TEP of Kenway Mack Slusarchuk Stewart LLP Chartered Accountants
An often under-utilized tax planning strategy, possibly because it is not understood by many, is the donation of publicly traded securities. A gift of publicly traded securities is a very effective way to give to charity. The tax treatment to the individual is favourable, and the charity can decide whether to hold or sell the security.
When you dispose of securities, you must pay tax on 50% of the capital gain (fair market value at the time of transfer, less adjusted cost base, which is usually your original cost).
Effective May 1, 2006, when you donate publicly traded securities, the capital gain, that would otherwise be taxable, is not included in income. This means that there is no tax to the individual on the transfer to the charity and the individual receives a donation tax receipt for the full value of the security at the time of transfer, which can be claimed on the individual’s personal tax return.
If you hold publicly traded securities that have
increased in value since you purchased them, and you are considering making a donation to a charity, you should look at donating those securities instead of selling the security and donating the net cash proceeds. For example, if you have a security worth $10,000, which you originally purchased for $2,000, and you were to sell this security, assuming a tax rate of 39% (Alberta), you would pay tax on the sale of approximately $1,560, being $8,000 x 50% taxable x 39% tax rate. You would be left with $8,440 to donate to the charity, which would result in a tax credit of $4,220, being 50% on donations in excess of $200. This will offset your taxes on the capital gain of $1,560, leaving you with a credit of $2,660 to be used against taxes on other income.
Instead, if you were to donate the security to charity, your taxes on the transfer would be eliminated, giving you a donation receipt for the full $10,000 value of the security, which would result in a tax credit of $5,000 representing additional tax savings of $2,340,
CD-ROM On-Line at: www.spec2000.net/orders.htm
Narrated Self-Study Courses Available Separately
E. R. (Ross) Crain. P.Eng. Box 29 Site 3 RR 2, Rocky Mountain House, Alberta, Canada, T4T 2A2 Phone: 1-403-845-2527 Email: ross@spec2000.net

Tel4037260666
Fax4034515380 Cell4038192516
farhat@sableconsultants.com SABLECONSULTANTS.COM

being a $2,660 net credit vs. a $5,000 net credit. The tax rates will vary depending upon your province of residence.
In order to use a donation to reduce your current year taxes, it must be received by the charity by December 31st. If you cannot use all of the donation tax credit in the current year, you can carry it forward for five years. You can make a difference by funding a charity you care about while also helping to minimize your own personal taxes.
Kenway Mack Slusarchuk Stewart LLP offers a full range of accounting, tax, and business advisory services to clients in the Calgary and Bow Valley corridor. For more information please visit our website at www.kmss.ca
220, 333-11th Avenue SW, Calgary, AB T2R


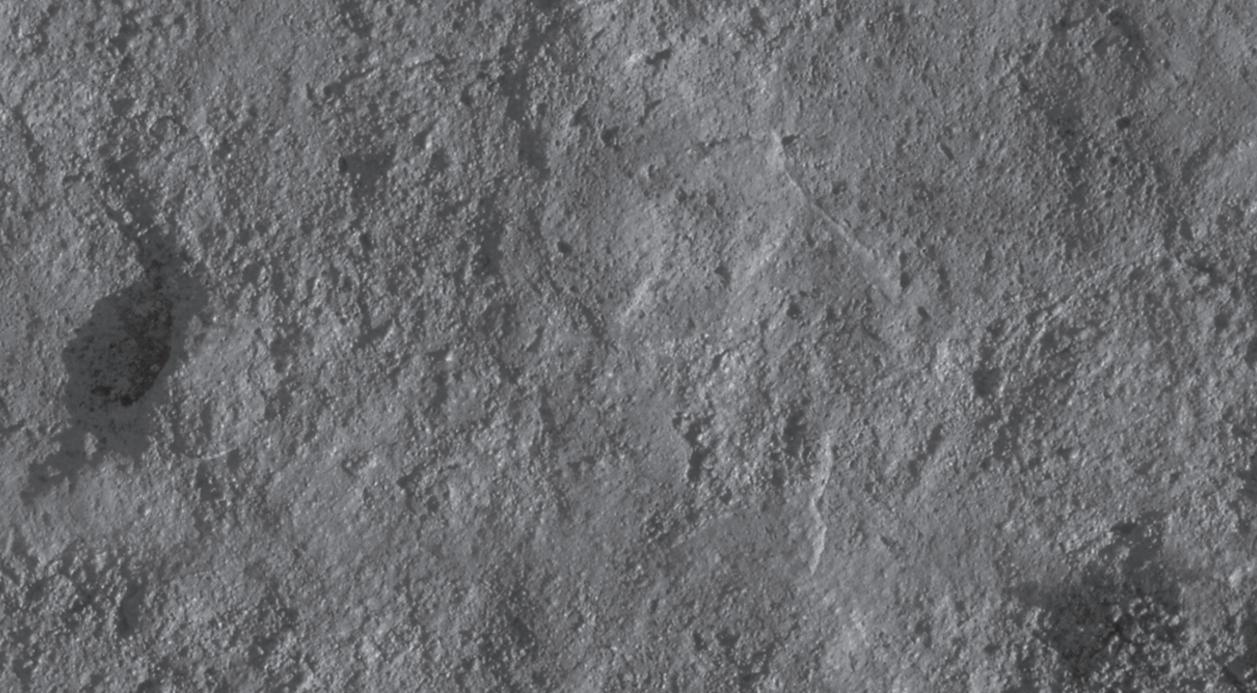

The Earth Science for Society Exhibition (ESfS) is a vibrant showcase of the Earth Sciences with hands-on activities and dynamic demonstrations for all ages and interests. The program was such success in 2010 that it will be held again this year, as an outreach initiative of recovery 2011. Admission is FREE to this interactive and educational earth science exhibition and will be open to the public on Sunday, May 8th from 12-5pm and also on Monday and Tuesday, May 9th and 10th, from 9am3:30pm.
Four pavilions: Energy for Us, Resources and You, One Dynamic Earth, and Our Future! contain exhibits offering hands-on opportunities to experience Earth Science in a unique way. Imagine cracking rocks with hammers to find delicate trilobite fossils, peering down special microscopes at diamonds, fossils, and minerals, getting up close with a piece of the Buzzard Coulee meteorite, or watching exciting demonstrations of simulated coal dust explosions.
Earth Science for Society uses interactive and dynamic exhibits to show students and the general public how Earth Science impacts our daily lives. This year we will be offering 2,000 junior high school students a rare opportunity to learn how Earth Science plays a critical role in our society and to make the connection between their everyday belongings and responsible development of our country’s rich natural resources. They will also gain a new appreciation for how Earth Science integrates many sciences, and some may even be inspired to pursue a career in the geosciences.
Earth Science for Society is an extension of the popular Kids in Science Program (KISP) that operated for several years bringing students to the convention exhibit floor to visit some of the booths. ESfS now features a separate floor space with exhibits specially designed to teach students and the general public about the earth sciences. The students will be escorted by volunteer geoscience guides, who will have the opportunity to pass on their enthusiasm for our discipline and its invaluable contribution to society. If you are interested in being a volunteer guide please email esfsvolunteer@ geoconvention.com.
This program would not be possible without the valued contributions from the generous sponsors, the hard work of the volunteer organizing committee members, the volunteer guides, and the exhibitors, whose exciting displays last year thrilled us all.
Please join us for a fun, interesting, and educational outing exploring the earth sciences and pass the word around. Admission is FREE to this family-friendly event and all ages and interests will be intrigued by the ways they use our Earth’s natural resources. Visit us on Mother’s Day, Sunday, May 8th and enjoy complimentary giveaways for Mom to celebrate Mother’s Day.
For more information please visit http://www.geoconvention.com/earthscience-for-society or email esfsinfo@ geoconvention.com
NEW SHORTER DST COURSE (3 1/2 days) April 5-8, 2011
16 WAyS tO IDENtIfy ByPASSED PAy fROm DSt DAtA (more advanced, for those “comfortable” with DST charts) April 14-15, 2011
HyDRODyNAmICS (Oil and Gas Finding Aspects) April 26-29, 2011
In-house courses available For course outline visit: www.hughwreid.com 262-1261
| By Amanda Perrot and Jane Marzetti
The 47th annual Western Inter-University Geosciences Conference (WIUGC) was held in Brandon, MB, from January 6th9th, 2011. This annual student-organized conference rotates through the western universities, and it was Brandon’s turn this year after a hiatus of 14 years. The organizing committee from Brandon University came back with a bang though, by hosting a well organized conference full of educational and entertaining highlights.
Sixty-five graduate and undergraduate students from six universities (Brandon University, University of Manitoba, University of Regina, University of Saskatchewan, University of Alberta, and University of Calgary) traveled to Brandon to partake in technical presentations and networking events. The CSPG and CSEG representatives included Amanda Perrot and Jane Marzetti (CSPG), and Mike Smorodin and Alem Aklilu (CSEG), who attended to raise awareness about the committees and to answer students’ questions regarding careers in the petroleum industry. A career fair was held Thursday afternoon, and the CSPG and CSEG booths garnered quite a bit of interest, especially from students who are still unsure about their career path. That evening saw the annual ‘Rockbreaker Social’ take place at the Lady of the Lake café and pub.
Academic and industry speakers shared their knowledge and experience on Friday, with talks by Alan Bailes (“The Lalor Lake VMS Deposit”) and Dr. Guy Plint (“The Cretaceous Dunvegan Delta Complex”). The afternoon session featured a short course on “Exploring for IOCG Deposits,” which was put on by Dr. Hamid Mumin. That evening, students were whisked off to a “Destination Unknown,” which happened to be a bus trip to the town of Souris, MB.
It was the students’ turn to shine on Saturday, as a full day of talks took place, with undergraduate talks held in the morning and graduate talks held in the afternoon. The variety in presentations was quite wide; topics from spore and pollen flora to integration of analytical techniques in mineral deposit determination were covered. John Cockbill from Trident Resources (one of this year’s corporate sponsors) then delivered a presentation on his experiences in the oil and gas industry and offered helpful advice to students.
The conference wrapped up Saturday evening with the formal banquet, which was attended by all student delegates, a number of professors and industry representatives. Awards for best presentations were handed out, and the CSPG Award for Best Petroleum-Related presentation went to Carolyn Currie, a graduate student at the University of Alberta working under Murray Gingras, for her talk entitled “Clearwater Formation, Cold Lake Oil Sands Deposit: Estuarine Incised Valley Complex?” Carolyn won a $300 prize and an always sought-after ammonite trophy.
A number of sponsors contributed to the success of the conference, including the CSPG, which donated $1,000. Other sponsors include Shell Canada, the CSEG, the BU Geology Department, Jeejay International Ltd., Cameco Corporation,
Potash Corporation, the BU University Bookstore, Crowflight Minerals, the BU Students Union, ARC Resources, Sigma Exploration Ltd., IRL Supplies, Trident Resources, Nomad Geological Consultants, San Gold Corporation, APEGM, Manitoba Prospectors and Developers Association, the Geological Association of Canada, Petrel Robertson Inc., and the BU Geology Club.
WIUGC 2012 will be hosted by the University of Regina, and the CSPG will again be proud to provide support and delegates to the conference. We would like to encourage all companies who have an interest in hiring new grads, or who would like to sponsor the event, to attend. For further information on next year’s conference in Regina, please feel free to contact Stephen Kitchen at WIUGC2012@gmail.com.
| By Aileen Lozie, Paul MacKay, Rob McGrory, and Satyaki Ray
With this year’s technical program almost finalized, keep checking www. geoconvention.com for updates and the final technical program.
Registration is now open! The early bird deadline is March 31st, 2011. Avoid disappointment and register early. Events at this year’s convention, including the Core Meltdown, Tuesday Night Reception at the Hyatt Regency Hotel and the Monday night After-party are sure to sell out! If you have clients, colleagues, or a spouse that are interested in attending the social events, make sure you buy additional tickets when you register to attend.
Make sure you register early to ensure you receive tickets for this year’s special events including Monday night’s icebreaker reception & after party, Tuesday night’s networking reception, core meltdown and convention luncheons.
Monday, May 9 – Michael Economides, professor and author of Energy and Climate Wars will be speaking at the Hyatt Regency Hotel. Tickets are $45.00 (includes lunch) and can be purchased online at www. geoconvention.com
Wednesday, May 11 – John Furlong, CEO of the Vancouver 2010 Olympic Games and author of Patriot Hearts will be speaking at the Hyatt Regency Hotel. Tickets are $45.00 (includes lunch) and can be purchased online at www.geoconvention. com
Additional tickets for all events can be purchased in advance when you register to attend the convention – so feel free to invite your spouse, partner, co-worker, or potential clients to one or all of the social events.
Mark your calendars for Sunday afternoon May 8, Monday May 9, and Tuesday May 10, 2011 to join us at the Calgary TELUS Convention Centre. Admission is free so bring your friends and family and share the Geoscience world with them in a fun and interactive way.
For more information visit: www. geoconvention.com/earth-science-for-society.
There are several sponsorship opportunities still available for this year’s convention. Ensure your company’s brand is visible at this year’s convention where over 5,000 industry professionals are expected to attend.
Looking to exhibit? Visit www.geoconvention.com for more information on how to submit your exhibitor application. The floor is almost sold out – so act quickly!
The convention’s success relies heavily on the support and dedication of committee volunteers. If you are interested in volunteering for this year’s convention, please email volunteer@geoconvention. com or visit the website for more information.
For more information on this year’s upcoming convention, recovery 2011, please visit the website at www.geoconvention. com or email info@geoconvention.com
Monday, May 9, 2011
Hyatt Regency Hotel Imperial Ballroom 11:30 AM – 1:00 PM
$45.00/ticket – includes lunch.
A chemical and petroleum engineer and an expert on energy geopolitics

Michael J. Economides
Dr. Economides is a professor at the Cullen College of Engineering, University of Houston, and Managing Partner of Dr. Michael J. Economides Consultants, Inc. with a wide range of industrial consulting, including major retainers by several Fortune 500 companies and national oil companies. He is the Editor-in-Chief of Energy Tribune (www.energytribune.com) a newsletter in the energy and related industries and activities and Editor-in-Chief of the peerreviewed Journal of Natural Gas Science and Engineering, published by Elsevier.
Technically, he casts a commanding figure in petroleum and natural gas reservoir and production engineering. With 15 textbooks and almost 300 journal papers and articles, his works are referenced by almost all practitioners in the field.
(Continued on page 44...)
Registration is now open for short courses and eld seminars running during May, 2011. Register online, by telephone or with your convention registration
Registration and Information:
Online: http://www.cspg.org/education/education.cfm
Email: dayna.rhoads@cspg.org
Phone: 403-513-1230
Fax: 403-264-5898


In the relatively recent past he has served as Senior Technical Advisor to China’s CNOOC and subsidiary COSL; to ENI, Italy’s main petroleum multinational company, and for more than five years to Yukos and Sibneft, Russia’s major petroleum companies. During 1997 and 1998 Economides was in Venezuela as the Senior Advisor on Production Technology for PDVSA, the national oil company of Venezuela.
Following his 2000 best seller, “The Color Of Oil,” and a large number of publications in international magazines, he is considered by many to be the premier world expert on the geopolitics of energy, giving about 50 speeches per year to groups from many large professional societies, organizations, and corporations. He is a frequent guest on national and international media. He writes for the editorial pages of major newspapers, magazines, and internet news organizations.
His latest wide-appeal books are “From Soviet to Putin and Back: The Dominance of Energy in Today’s Russia” (www.soviettoputin.com), “Energy: China’s Choke Point,” “Energy and Climate Wars,” and “The Energy Imperative.”
Wednesday, May 11, 2011
Hyatt Regency Hotel Imperial Ballroom 11:30 AM – 1:00 PM
$45.00/ticket – includes lunch.
John Furlong is the leader behind the team that organized and staged the Vancouver 2010 Olympic and Paralympic Winter Games. From the very beginning of the project, Furlong envisioned that the Games could be a true nation builder, helping to improve the fabric of Canadian society. IOC President Jacques Rogge remarked about how Vancouver had taken on the Games in a way that was ‘unheard of in the Olympic movement,’ and considered them as belonging to all of Canada, not surprised that the Games had become a catalyst for national unity.
Prior to his appointment at VANOC in 2004, Furlong was the President and Chief Operating Officer for the Vancouver 2010 Bid Corporation. In his role, he became the Bid’s international face and key spokesperson, tirelessly clocking more than 1.2 million miles in his travels to promote the Bid. Furlong has been involved with athletics all his life, having competed at the international level in Basketball, European handball, and Squash. He became Canadian Squash Champion in 1986. Furlong has

been a long-time member of the Canadian Olympic Committee and has led many high profile sport organizations in Canada.
In 2009, Furlong was named Canada’s Most Influential Sport Figure by both The Globe and Mail and the Canadian Broadcasting Corporation and listed #1 on Vancouver Magazine’s ‘Vancouver Power 50’ 2009 list.
Around the Rings Magazine has listed Furlong as one of the world’s top five most influential Olympic Officials in both 2009 and 2010. Most recently, he was named Sport BC’s Sportsman of the Decade. He has been awarded with Honorary Doctorate Degrees in Law (two) and Technology (one) from the University of British Columbia, The Justice Institute of British Columbia, and the British Columbia Institute of Technology.
Furlong’s service to sport has landed him with numerous other forms of recognition - among them The International Olympic Committee’s Olympic Order and the International Paralympic Committee’s Paralympic Order. In 2003, he was named Executive of the Year by both Sports Media Canada and the Vancouver Executive Association for his contributions to the Vancouver 2010 Bid, and in 2010 was elected as a Fellow of the BC Chamber of Commerce.
John was acclaimed as the 2004 Canadian Sport Awards’ Sport Leadership Winner for his service to sport in Canada over a lifetime. He has won Vancouver’s most prestigious tourism award for the promotion of Vancouver around the world and was inducted into the BC Sports Hall of Fame as the 2004 W.A.C. Bennett Award winner.
Born in Tipperary, Ireland, Furlong has five children and ten grandchildren.
SPECIAL EVENTS
Monday night icebreaker
Monday, May 9, 2011
Calgary TELUS Convention Centre 4:00 PM – 6:00 PM
Join us for the Monday Night Icebreaker on the exhibition floor. Mingle with convention delegates, exhibitors, visitors, and potential clients! This event is free to attend with your convention registration.
Monday night after-Party
Monday, May 9, 2011
Centini Restaurant & Lounge 6:00 PM – 8:00 PM
Continue mingling with delegates, exhibitors, and potential clients while enjoying a beverage and snacks. You must purchase a ticket to attend this event. Don’t wait too long – it’s sure to sell-out quickly.
tuesday night recePtion
Tuesday, May 10, 2011
Hyatt Regency Hotel Imperial Ballroom 5:00 PM – 8:00 PM
Attend this year’s reception in support of Light Up the World – an international development organization dedicated to providing renewable energy and innovative lighting solutions to communities in need in the developing world.
Enjoy good food, good drinks, and entertainment while bidding on some excellent items at the Silent Auction.
This event is free to attend with your convention registration. Purchase additional tickets for guests when you register to attend online.
core MeltdoWn
Friday, May 13, 2011
Geological Survey of Canada 3:00 PM – 7:00 PM
Celebrate the close of another successful convention at the annual Core Meltdown. Join the convention organizing committee, fellow delegates, and exhibitors for some food, drinks, and fun. You must purchase a ticket to attend this event and can do so when you register to attend online.
For more information on any of the above listed events or for information on how to sponsor one of these events, please visit the website at www.geoconvention.com


The Earth Sciences Museum has just added a little more sparkle to their collection thanks to a generous gift, valued at approximately $50,000, from Waterloo Science alumnus Jim Reimer.
Jim and his late father, John, developed a passion for minerals in the early 1970s due to Jim’s interest. Now the family’s hobby will forever be preserved in the Reimer Family Mineral Gallery and Groundwater-driven Mineralization Display at the Museum.
The new collection features specimens gathered by Jim and his father on various family vacations across Canada and the United States, and through eld trips organized by the Kitchener-Waterloo Mineral Club, where the Reimer family served as active members. The collection will also include crystals from former and current members of the club.
Department and, because there was nowhere to
Jim Reimer, a former President of the CSPG, has made a signi cant contribution to his alma mater, the University of Waterloo. Jim donated his extensive mineral collection to the Earth Sciences house this exhibit, he had custom cabinets built.
During the o cial ceremony thanking him, Jim took the opportunity to explain that public education in earth science is very important to the future of society and to Canada in particular. His interactive exhibit is aimed at youth and is designed to capture their interest and imagination. Jim has always been a supporter of public outreach. He is the driving force behind the WHERE campaign that asks young people where material from their everyday lives is derived. During his presidency, Jim was instrumental in supporting the Canadian Federation of Earth Sciences (CFES) as an earth science umbrella organization that has taken on earth science education as one of its important goals.
The Society salutes Jim and thanks him for this donation to the University of Waterloo. His generosity will help produce the geoscientists of tomorrow.
driven Mineralization Display will “allow us to explain the role of groundwater in the
Peter Russell, curator at the Earth Sciences Museum, says that the Groundwaterformation of mineral deposits. This display will also be the rst to have an interactive computer on the subject at the Museum.”
“Jim’s gift shows his passion for geology and his loyalty to the University of Waterloo,” said Terry McMahon, dean of science.
We are pleased to introduce a new feature to the Reservoir – Geologists Giving Back. This will be an intermittent piece, published only when a signi cant contribution is made by one of our members to an educational institution, museum, place of learning, the CSPG, or the Educational Trust Foundation. We want to recognize and thank our members for their generosity and vision in promoting science to the public, especially earth science. While it will be published intermittently, we hope to publish it often.

CORPORATE MEMBERS
APACHE CANADA LTD.
CANADIAN NATURAL RESOURCES LTD
CASEY & ASSOCIATES
CONOCOPHILLIPS CANADA LIMITED
DEVON CANADA CORPORATION
ENERPLUS CORPORATION
GEOLOGIC SYSTEMS LTD.
GEOSTRATA RESOURCES INC.
HUNT OIL COMPANY OF CANADA
IHS
IMPERIAL OIL RESOURCES
LITTLE ROCK DOCUMENT SERVICES
MJ SYSTEMS
NEXEN INC.
PENN WEST PETROLEUM LTD.
RPS ENERGY CANADA LTD.
SHELL CANADA LIMITED
SPROULE ASSOCIATES LIMITED
SUNCOR ENERGY INC.
TOURMALINE OIL CORP.
AS OF FEBRUARY 10, 2011
CSPG welcomes our 2011 Corporate Members! The benefits of being a corporate member include:
• Recognition in the monthly Reservoir and quarterly Bulletin
• One associate membership
• Reserved tables at the technical luncheons with your company logo
• One free pass to the CSPG Core Conference …and more! Contact Kasandra Klein at Kasandra.klein@cspg.org to be a corporate member today!
| By Colin Yeo

One of the more popular features of the Reservoir is the “Go Take a Hike” series. We thought it was just a vehicle to share great outcrops, beautiful vistas, and interesting destinations with the members. Who would have guessed that it would actually elevate the geological content of recreational tours half way around the world?
In November, Petra, Jordan, was showcased by Philip Benham in the Reservoir. As soon as long time CSPG member Gordon Holland received it, his interest was piqued and he was off to the Gallagher Library at the University of Calgary to research the regional geological setting and local stratigraphy. Gordon was taking an educational excursion to Jordan and Syria through the University of Calgary lead by Dr. John Humphries, Professor of Antiquities. There would be a two-day stop at Petra on this trip and Gordon was planning to commandeer the tour and present the geology of Petra to the group when they arrived.
Unbeknownst to Gordon, CSPG President John Varsek was also on this same tour. John also read the Go Take a Hike article and was eagerly anticipating this stop. John was surprised when tour leader Dr. Humphries announced to the group that there was to be a special, in-depth discussion on the geology of the Middle East and North Africa with special emphasis on Petra. Dr.
Humphries then introduced Gordon as the special lecturer.
Gordon proceeded to describe the structural geology and tectonic activity of the African – Arabian plate, the resultant mountain building, volcanic and earthquake activity, and the extension of the great African Rift system. He tied basaltic lava flows to undisturbed porous skeletal limestone Cretaceous beds that are the source of groundwater in the region. He explained the process of differential erosion of basaltic and limestone building blocks that make up the city. Gordon also explained the origin of the colored streaks caused by mineral precipitation of saturated groundwater, which he read about in the Reservoir.
Gordon spoke glowingly about the Reservoir and the article as the source of information for his talk to the group. You can imagine his surprise when President Varsek walked up and introduced himself and congratulated him on a great presentation! Gordon, John, and a smaller group of interested folks sat around after lunch and held an in-depth, impromptu seminar on the geology of Petra and environs.
All of this came about just because of Philip Benham’s Go Take a Hike article! Thank you, Philip.

Want to bring geology back into geophysical interpretation?

Landmark’s new DecisionSpace® Desktop software accelerates seismic interpretation with geomodel-enabled workflows.
The geophysics and geology modules in Landmark’s new unified DecisionSpace® Desktop software share the same topology engine. This gives geophysicists easy access to framework construction tools that combine well picks and horizons to produce a high resolution, accurate geomodel. The geomodel uses conformance technology to produce well-based surfaces at the same resolution as seismic data, enabling a model that truly represents your reservoir. Get better answers faster. Visit halliburton.com/landmark/desktop.
High Science Simplified™