16 Interpretation of Transgressive Barrier-Beach, Shoreface, Lagoon, and Estuary Reservoirs – Use of Modern Analogues: Part 2 – Sand-Body Depositional Geometries 20 Remote Sensing for Geologists IV
– Part 6
16 Interpretation of Transgressive Barrier-Beach, Shoreface, Lagoon, and Estuary Reservoirs – Use of Modern Analogues: Part 2 – Sand-Body Depositional Geometries 20 Remote Sensing for Geologists IV
– Part 6
Looking to maximize opportunities in today’s volatile market?
Combine the power of PETRA® and IHS Critical Information including well and log data to define reservoir parameters and determine new opportunities faster and more cost effectively.
Let IHS information solutions improve your decision-making and reduce your risk.
For more information on PETRA visit us at www.ihs.com/reservoirsolutions


CSPG OFFICE
#600, 640 - 8th Avenue SW
Calgary, Alberta, Canada T2P 1G7
Tel: 403-264-5610 Fax: 403-264-5898
Web: www.cspg.org
Office hours: Monday to Friday, 8:30am to 4:00pm
Executive Director: Lis Bjeld
Email: lis.bjeld@cspg.org
Advertising & Sponsorship Coordinator: Alyssa Middleton
Email: alyssa.middleton@cspg.org
Communications Coordinator: Heather Tyminski
Email: heather.tyminski@cspg.org
Member Services Coordinator: Kasandra Klein
Email: kasandra.klein@cspg.org
Registration Coordinator: Dayna Rhoads
Email: dayna.rhoads@cspg.org
Convention Contacts
Convention Manager: Shauna Carson
Email: scarson@geoconvention.org
Convention Coordinator: Tanya Santry
Email: tsantry@geoconvention.org
EDITORS/AUTHORS
Please submit RESERVOIR articles to the CSPG office. Submission deadline is the 23rd day of the month, two months prior to issue date. (e.g., January 23 for the March issue).
To publish an article, the CSPG requires digital copies of the document. Text should be in Microsoft Word format and illustrations should be in TIFF format at 300 dpi., at final size. For additional information on manuscript preparation, refer to the Guidelines for Authors published in the CSPG Bulletin or contact the editor.
Technical Editors
Ben McKenzie Colin Yeo (Assistant Tech. Editor) Tarheel Exploration EnCana Corporation Tel: 403-277-4496 Tel: 403-645-7724
Email: bjmck@telusplanet.net Email: colin.yeo@encana.com
Coordinating Editor
Heather Tyminski, Comunications Coordinator, CSPG Tel: 403-513-1227, Email: heather.tyminski@cspg.org
ADVERTISING
Advertising inquiries should be directed to Alyssa Middleton, Tel: 403-513-1233, email: alyssa.middleton@cspg.org. The deadline to reserve advertising space is the 23rd day of the month, two months prior to issue date.
The RESERVOIR is published 11 times per year by the Canadian Society of Petroleum Geologists. This includes a combined issue for the months of July and August. The purpose of the RESERVOIR is to publicize the Society’s many activities and to promote the geosciences. We look for both technical and non-technical material to publish. Additional information on the RESERVOIR’s submission guidelines can be found at http://www.cspg. org/publications/pubs-reservoir-submissions.cfm.
The contents of this publication may not be reproduced either in part or in full without the consent of the publisher. Additional copies of the RESERVOIR are available at the CSPG office for $6.50 each. No official endorsement or sponsorship by the CSPG is implied for any advertisement, insert, or article that appears in the Reservoir unless otherwise noted. All submitted materials are reviewed by the editor. We reserve the right to edit all submissions, including letters to the Editor. Submissions must include your name, address, and membership number (if applicable). The material contained in this publication is intended for informational use only. While reasonable care has been taken, authors and the CSPG make no guarantees that any of the equations, schematics, or devices discussed will perform as expected or that they will give the desired results. Some information contained herein may be inaccurate or may vary from standard measurements. The CSPG expressly disclaims any and all
or
and
and
Choose from over 50 exciting field seminars, short courses and online programs all designed with the goal of helping you explore and better understand the science of this industry. Please see the AAPG website for complete descriptions and registration information. Below are the highlights of courses coming up very soon. Make your plans now before seats get filled!
MAY 11-13
MAY 17-18
MAY 19-21
JUNE 7-9
JUNE 9-10
Essentials of Subsurface Mapping
Location: Houston, TX
Instructor: Richard Banks
Reservoir Engineering for Petroleum Geologists
Location: Houston, TX
Instructor: Richard G. Green
Fundamentals of Petroleum Geology
Location: Houston, TX
Instructor: Stephen L Bend
Exploring for Bypassed Pay in Old Wells Using DST Data
Location: Wichita, KS
Instructor: Hugh Reid
The Petroleum Industry: Upstream & Downstream
Location: Dallas, TX
Instructor: Stephen L. Bend
APR 29 E-Symposia:
APRIL 17-22
APRIL 24-30
MAY 16-21
MAY 30 -JUNE 5
JUNE 7-11
Deep-Water Siliciclastic Reservoirs, California
Location: Begins in Palo Alto and ends at the airport in San Francisco, California
Leaders: Stephan Graham and Donald R. Lowe
Clastic Reservoir Facies and Sequence Stratigraphic Analysis of Alluvial-Plain, Shoreface, Deltaic, and Shelf Depositional Systems
Location: Begins and ends in Salt Lake City, Utah
Leader: Thomas A. Ryer
Play Concepts and Controls on Porosity in Carbonate Reservoir Analogs
Location: Almeria Region, SE Spain, begins and ends in Las Negras, Spain
Leaders: Evan K. Franseen, Robert H. Goldstein, Mateu Esteban
Complex Carbonate Reservoirs: The Role of Fracturing, Facies and Tectonics
Location: Begins in Naples and ends at Rome International Airport (Italy)
Leaders: Raffaele Di Cuia, Davide Casabianca, Claudio Turrini
Folding, Thrusting and Syntectonic Sedimentation: Perspectives from Classic Localities of the Central Pyrenees
Location: Spain
Leaders: Antonio Teixell, Antonio Barnolas
Seismic Stratigraphy and Seismic Geomorphology: Applications and Workflows for Lithology Prediction Using 3D Seismic Data Time: 2:00 p.m. for the live event
Instructor: Henry Posamentier
Last Chance:
MARCH 25-26
Field Safety Course for Field Trip Leaders
Location: Houston, Texas
Instructors: Kevin Bohacs, Stephen Oliveri, Robert Clarke
Assessement of Unconventional Shale
Instructor: Dan Jarvie APRIL 10-11
Resources Using Geochemistry
Location: New Orleans, with the AAPG Convention!
LAUNCH DATE
APR 1
Biomass Energy Basics –A Renewable Energy Certificate Course
Instructor: Theresa Coffman
APRIL 9-11
APRIL 27-30
Practical Salt Tectonics
Location: New Orleans, with the AAPG Convention!
Instructor: Mark Rowan
Basic Well Log Analysis
Location: Austin, Texas
Instructors: George Asquith and Dan Krygowski


President John Varsek • Cenovus Energy john.varsek@cenovus.com Tel: (403) 645-5417
Vice President
Kirk Osadetz • Geological Survey of Canada, Calgary kosadetz@nrcan.gc.ca Tel: (403) 292-7022
Past President
Graeme Bloy • Canada Capital Energy Corporation gbloy@capitalenergy.ca Tel: (403) 975-5784
Finance director
Greg Lynch • Shell Canada Ltd. greg.lynch@shell.com Tel: (403) 691-3111
assistant Finance director
Darren Aldridge • Baker Hughes darren.aldridge@bakerhughes.com Tel: (403) 537-3505
Program director
Scott Leroux • EnCana Corporation scott.leroux@encana.com Tel: (403) 645-2000
assistant Program director
Brett Norris • TransGlobe Energy Corp. brettn@trans-globe.com Tel: (403) 264-9896
serVice director
Ayaz Gulamhussein • NuVista Energy Ltd. ayaz.gulamhussein@nuvistaenergy.com Tel: (403) 538-8510
assistant serVice director
Richard Thom • Core Laboratories Canada Ltd. richard.thom@corelab.com Tel: (403) 250-4052
outreach director
Mike DesRoches • Talisman Energy Inc. mdesroches@talisman-energy.com Tel: (403) 513-6843
assistant outreach director
Steve Dryer • Consultant whiskeyjackresources@telus.net Tel: (403) 969-2292
communications director
Stephen Hubbard • University of Calgary steve.hubbard@ucalgary.ca Tel: (403) 220-6236
assistant communications director
Jim Barclay • ConocoPhillips
Jim.E.Barclay@conocophillips.com Tel: (403) 532-3889
executiVe director
Lis Bjeld • CSPG lis.bjeld@cspg.org Tel: (403) 513-1228
A message from the CSPG Program Director, Scott Leroux
Moving into my second year on the CSPG Executive I am pleased to be working with an excellent, energetic new slate of 2010 volunteers including Brett Norris, the incoming Assistant Program Director. I would like to take this opportunity to thank Randy Rice for his generous contribution to the Society and for getting me up to speed in this Program Director role.
Much has already been said about the challenges the CSPG has faced in this economic downturn. Several of the most recent executive comments have addressed the fiscal challenges and how our Society is managing through the uncertainty. We are seeing close to a 30% decrease in many of the metrics (membership, convention profits, sponsorship, etc.), but these are offset by savings due to efficiencies and associated cost reductions.
Part of our responsibility as a society is to promote and advance the science of petroleum geology and foster professional development of the members. Thankfully, the desire to receive training and develop professionally remains as strong as ever. As the Program Director, my job is to link the various technical committees and programs with the CSPG Executive and to foster the growth and improvement in each. Listed below are some of the 2009 highlights and technical revitalization initiatives planned for 2010.
The CSPG currently has 12 Technical Divisions. The divisions represent a broad spectrum of geological interest and have traditionally offered lunchtime and evening talks that are well organized and attended. One specific focus this year will be to use the Divisions as a platform to feed into some of our other programs in an attempt to bolster the technical content. The Executive is currently recruiting for a newly created position called the “Technical Division Chairs Coordinator.” This new leadership
role will oversee the divisions and help promote technical knowledge sharing and development of new field seminars and help streamline the Divisions. With the assistance of the new Volunteer Management System Chair, the coordinator will assist in filling vacant positions, consolidate inactive divisions, and help the individual Division chairs interact with each other and the Executive. We are also looking for ways to encourage some of the Divisions to take on relevant and current topics that could be parlayed into future convention themes. A natural (albeit hopeful) progression could lead to future special publications, field seminars, and even a Gussow conference or special core conference.
The Technical Luncheon Committee continues to run an impressive program and the attendance remains strong through the downturn. We have had another amazing lineup of talks on subjects such as Geomodeling and Sedimentology, to more diverse topics such as Avalanches, Mars, and Meteorite impacts. The speaker lineup has been superb again this past year and cost savings have been realized by the CSPG staff through on-line ticketing and operating the equipment for our own webcasts. The 2010 program again promises to be a diverse and relevant selection of top quality speakers and subjects.
This year’s GeoCanada 2010 is a once-in-adecade convention that brings together the entire spectrum of Earth Science professions, including the traditional participants (CSPG, CSEG, and CWLS). The short course and field seminar component can now be viewed through the convention website: http:// www.geocanada2010.ca/. The convention is slated to offer a record 35 short courses and 21 field seminars this year. This expanded program managed by a dedicated volunteer committee promises to make GeoCanada
(Continued on


CORPORATE MEMBERS
APAChE CANADA LTD
BAkER ATLAS
CANADIAN NATURAL RESOURCES LIMITED
CASEy & ASSOCIATES
CONOCOPhILLIPS CANADA LIMITED
FUGRO AIRBORNE SURVEyS CORP
GEOLOGIC SySTEMS LTD
IhS
IMPERIAL OIL RESOURCES
MJ SySTEMS
MURPhy OIL COMPANy
NExEN INC.
PETROCRAFT PRODUCTS LTD
PULSPETROL
PROVIDENT ENERGy LTD
ShELL CANADA LIMITED
SPROULE ASSOCIATES LIMITED
SUNCOR ENERGy INC
TOTAL E&P CANADA LIMITED
TOURMALINE OIL CORP
(...Continued from page 5)
2010 a huge technical success and Canada’s greatest conference on Earth Sciences.
The 2009 Gussow Conference: Engineering Sustainable Oil Sands Development, held this past October was not only popular, but turned a profit. This was the fifth Gussow Conference, a topic-specific miniconference. With the expanded GeoCanada conference this spring and the AAPG International Conference & Exhibition (ICE) both running in Calgary this fall 2010, it was decided that we would be taking a break from the Gussow Conference this year.
The Continuing Education (Con-Ed) Committee is responsible for another superbly run flagship CSPG program. Outgoing chair and 2009 Tracks Award winner Travis hobbs and the ever-growing volunteer committee (of approximately 12 members) have done an exemplary job building the Continuing Education program into a smoothly run and profitable endeavor. The Committee has assembled a line-up of world-class affordable short courses and field seminars that serve the membership well. This year the chair position duties will be split between Carrie Jeanes (Short Courses), and a soon-to-beannounced Field Seminar Chair. As previously
mentioned, this group services all of the continuing education courses at both the annual (Joint) convention and fall Education Week. To compliment this year’s AAPG (ICE) conference running September 12-15, 2010, CSPG is offering its Education Week short courses as well as its own full slate of fall field seminars and a core conference. This means 2010 provides one of the most diversified training opportunities CSPG has ever offered.
In closing, I would like to thank all of the volunteers under the Programs portfolio for their hard work and dedication. Without you, CSPG’s membership would not enjoy all of the great technical programs that are the backbone of CSPG. As we move forward as a Society, we are revitalizing the technical program, creating new program synergies and defining new volunteer roles that offer technical and leadership development. Please consider the benefits that you have received through your membership in CSPG and promote the value of what you have learned. Let your employer know that you have gained knowledge from a course or talk. If a CSPG paper has helped you with an idea or a field seminar has aided your interpretation, let it be known. The CSPG exists for its members. We need your continued support in order to move forward!
AS OF JANUARY 29, 2010
AUTHOR Jerry Osborn
University
of Calgary, Dept. of Geoscience
11:30 am, tuesday, march 9, 2010 telus convention centre, calgary, alberta
Please note:
the cut-off date for ticket sales is 1:00 pm, thursday, march 4, 2010. csPg member ticket Price: $38.00 + gst. non- member ticket Price: $45.00 + gst.
Each CSPG Technical Luncheon is 1 APEGGA PDH credit. Tickets may be purchased online at http://www.cspg.org/events/eventsluncheons.cfm.
The great majority of climate scientists are convinced that warming over the last few decades is largely due to anthropogenic effects, and many think that serious, perhaps catastrophic, climatically induced problems await humanity in this century. But a small minority of actively publishing climate scientists, a considerable number of scientists in other fields, many politicians, as well as some significant proportion of the general public, remain skeptical, and debate continues in a variety of venues that include scientific journals, the web, pop print media, television, think tanks, houses of governments, courtrooms, schools, churches, and in the case of Alberta, the PEGG (APEGGA’s newspaper). The debate is fierce, bitter, and often personal (in the PEGG the President of APEGGA
recently felt compelled to warn letter-writers to tone down the heated rhetoric), and polarized to the extent that there is not much dialogue between factions other than insults on websites.
To some extent each faction mounts its own conferences and publishes peer-reviewed research in its own friendly journals, and each faction has spokes-heroes who cherrypick evidence or exaggerate to support a point of view. The debate is complicated by fusion of several questions that are not always separated by debaters (Is it warming? Is warming anthropogenic? If so, what should the social response be? If climate is always changing naturally anyway should we attempt to mitigate anthropogenic climate change? Should we worry about potentially calamitous ‘tipping points’ for which there is some, but not robust, evidence?). Left-wing and rightwing political allies on the two sides of the debate use the issue as a prop to promote global governance/justice and free enterprise, respectively. Scientific and social issues are mixed to the degree that interpretations of science are influenced by social/political philosophy.
The result is wildly varying views on scientific issues, defensiveness and entrenchment of scientists, diversions over hockey sticks and oil-company funding, significant filtering of information in electronic and print media, and immense public confusion, as each side belittles the other in an attempt to sway public opinion. The scientific debate has largely been consumed by the political debate, as illustrated by the recent ‘climate-gate’ e-mail hacking incident, whose political significance far outweighs its scientific significance.
Given the entanglement of politics in the science, evaluation of the latter is best considered totally divorced from social issues. Champions of anthropogenic warming cite (1) general correspondence between 20th-
Improve your Risk Management and Decision Making
in Petroleum Exploration & Production
APRIL 5-7, 2010
MICHAEL R. WALLS, PH.D. – INSTRUCTOR COLORADO SCHOOL OF MINES GOLDEN, COLORADO
Join our three-day executive seminar to improve your risk management and strategic decision making skills. For over 20 years, this seminar has provided participants with a “hands-on” approach to the most modern techniques in risk management and strategic decision making for all aspects of petroleum exploration and production.
http://outreach.mines.edu/cont_ed/mrsd.htm
Webcasts sponsored by
century greenhouse gas composition of the atmosphere and global mean temperature, (2) greenhouse warming theory, and its incorporation into general circulation models, that can explain 20th-century warming, (3) declining outgoing (space-bound) radiation at the wavelength bands at which greenhouse gases absorb energy, (4) increasing downward longwave radiation as CO2 levels increase, suggesting increasing greenhouse effect (4) observed patterns of surface and atmospheric warming that are predicted by greenhouse warming theory, and (5) suggestions that recent/current warming is anomalous, as evidence. The latter point was the foundation of the hockey-stick-curve controversy a few years ago, one of the more colourful episodes of the global warming debate.
Skeptics of anthropogenic warming make mainly negative arguments, seeking to find fault in the concepts that it’s getting warmer and/ or that warming is significantly anthropogenic. The most-promoted argument currently is that global warming stopped in 1998 or 2005 (depending on the data set). Skeptics most often cite solar forcing, either directly through irradiance variations, or indirectly via cosmic-ray modulation of ionization in the atmosphere, which influences cloud formation, as the cause of 20th-century warming. Most solar and atmospheric physicists agree that there is some solar influence on climate, and incorporate it in general circulation models, but see little evidence that either the direct or the indirect hypothesis can explain post-1975 warming.
This brief overview of the politics and science involved in the debate over greenhouse-gasgenerated warming will be delivered from a point of view that is disinterested politically and without vested interests scientifically.
Jerry Osborn is a Professor of Geology in the Geoscience Department at the University of Calgary. His interests are surficial and Quaternary geology, with forays into geomorphology and engineering geology, and, on the side, interactions between science and society. His main line of research is Holocene climate change using glacialhistory and lake-sediment proxies. Consulting activities have included aggregate searches, mass-movement hazards analysis, flood hazard analysis, and studies of river migration as applied to boundary-law litigation. Included in the thousands of students that have passed through his introductory geology courses at the University of Calgary are many petroleum geologists working in Calgary. When time allows he searches for the perfect pumpkin pie recipe and teaches his kids the value of listening to Bob Dylan.
How an underground approach to commercial bitumen development of the Grosmont Formation could maximize profitability and minimize environmental footprint
SPEAKERS
Jen Russel-Houston
Osum Oil Sands Corp.
Alan Abrams
Osum Oil Sands Corp.
CO-AUTHOR
Peter Putnam
Osum Oil Sands Corp.
11:30 am, tuesday, march 23, 2010 telus convention centre, calgary, alberta
Please note: the cut-off date for ticket sales is 1:00 pm, thursday, march 18, 2010. csPg member ticket Price: $38.00 + gst. non-member ticket Price: $45.00 + gst.
Each CSPG Technical Luncheon is 1 APEGGA PDH credit. Tickets may be purchased online at http:// www.cspg.org/events/events-luncheons.cfm.
In north-central Alberta near the town of Wabiskaw (the ‘Saleski’ region), substantial bitumen resources are hosted within the Devonian Grosmont Formation. The interval of interest is formed of four regionally consistent parasequences of carbonate platform origin; the upper two (Grosmont C, D) form the major bitumen reservoirs and the basal two (Grosmont A, B) form potential tunneling media. This presentation describes a commercial development concept that places the wellheads within a tunnel system located in the Grosmont B limestone below the Grosmont C and D reservoirs.
At Saleski, Osum has identified 21 sections within its lands in Township 85 Range 18W4 that would make an ideal area for commercial development using an underground well recovery system. In this area, the Grosmont C and D reservoirs have predictable and easily correlatable associations of reservoir facies and an aggregate average net pay of 34 meters (>12% porosity, <50% Sw). Importantly, the tunneling medium within the limestone of the Grosmont B appears to be continuous and unkarsted, and the shaley nonreservoir base of the Grosmont C interval appears to be capable of acting as a basal seal to bitumen development in the reservoir above. The massive bitumen deposit, the predictable nature of the reservoir units, and the tunneling media in this area combine to make this an ideal area with which to plan this development concept.
The proposed underground well recovery system utilizes concepts which were developed within the McMurray Formation oilsands at the Underground Test Facility (UTF) near Ft. McMurray. The transformation of the proven recovery method at the UTF into a commercial production platform offers a viable, cost effective alternative to conventional surfacebased thermal techniques and it also has significant environmental benefits. By placing the network of roads, pipelines, and wellpads below ground in the tunnel complex, the surface footprint is reduced by an estimated 86 percent as compared to conventional in situ development. The ability to operate at minimal formation pressures as demonstrated at the UTF, combined with a centralized pumping system versus hundreds of in-line, downhole pumps, provides for potential lower fuel usage, corresponding greenhouse gas emissions, and considerable decreased operating costs. Sustaining capital costs are estimated to be 25% less due to reduced drilling costs, centralized pumping, and aggregate production. Additionally, the ability to operate year-round in a 15º C ambient climate eliminates many cold-weatherrelated issues and offers the potential for increased productivity. Finally, the wellpairs do not penetrate the overlying cap rock or near-surface aquifers. In light of today’s challenges to develop oil sands resources in a greener and more efficient manner, the environmental and operational advantages offered by the underground well recovery system create the potential to change the way we look at bitumen extraction.
Jen Russel-Houston is the Geoscience Manager at Osum Oilsands Corp., where she leads the team
Webcasts sponsored by
in geological investigations related to thermal development of the Cold Lake Taiga Project and the Wabasca area bitumen-saturated carbonates. Prior to this she was the subsurface team lead for the thermal development of the Peace River Heavy Oil In-situ project with Shell Canada.
Alan Abrams is the Vice President of Underground Operations at Osum Oilsands Corp., where he is responsible for providing overall direction for the application of the ‘Underground’ technique for in situ development, including both technology development and target assessment. He has over 30 years experience in underground tunneling and shaft-sinking construction including a wide array of projects in the heavy civil and mining industries.
Peter Putnam is a geologist with thirty years of global petroleum experience who has had substantial exposure to all aspects of the thermal recovery business. He currently holds the position of Senior Vice President, Geoscience for Osum. He is also the non-executive chairman of Petrel Robertson Consulting Ltd and the chairman and managing director of Central European Petroleum Ltd. Putnam is a past-president of the CSPG.
(3 1/2 days) fROm HUgH REiD
Other Courses Below:
16 WAYS TO IDENTIFY BYPASSED PAY FROM DST DATA
(More advanced, for those “comfortable” with DST charts) April 21-22, 2010 (2 days)
SEMINAR
(Oil & Gas Finding Aspects) April 26-29, 2010 (4 days)
April 6-9 And Oct. 18-21, 2010 in-house courses available. For course outline
microbial acids and gas as an explanation for the dissolution and forming of pores and caves in limestone
SPEAKER
Stephanie Schwabe Department of Earth and Environmental Sciences, University of kentucky
11:30 am, t hursday, a pril 15, 2010 telus convention centre c algary, a lberta
Visit the Members Only section of CSPG’s website (www.cspg.org) to view volume 57, number 3 of the Bulletin of Canadian Petroleum Geology. CSPG members receive digital access to current and archived issues of the Bulletin Interested in purchasing a hard-copy from CSPG’s bookstore? Contact us at (403) 264-5610 for more information.
Volume 57 Number 3 Contents
Depositional facies framework, evolution, and reservoir architecture of the Upper Devonian Jean Marie Member (Redknife Formation) in the July Lake area of northeastern British Columbia, by J. Wendte, D. Sargent, A. Byrnes, and I. Al-Aasm.
Basin-scale distribution of authigenic clay minerals in the Late Maastrichtian–Early Paleocene fluvial strata of the Alberta foredeep: implications for burial depth, by A. khidir and O. Catuneanu.
Fault/fracture controlled hydrothermal dolomitization and associated diagenesis of the Upper Devonian Jean Marie Member (Redknife Formation) in the July Lake area of northeastern British Columbia, by J. Wendte, I. Al-Aasm, G. Chi, and D. Sargent.
An allostratigraphic framework for a retrogradational delta complex: the uppermost Dunvegan Formation (Cenomanian) in subsurface and outcrop, Alberta and British Columbia, by M.J. hay, and A.G. Plint.
Petroleum source rock potential of Whitehorse trough: a frontier basin in south-central yukon, by G.W. Lowey, D.G.F. Long, M.G. Fowler, A.R. Sweet, and M.J. Orchard.
Please note: the cut-off date for ticket sales is 1:00 pm, monday, april 12, 2010. csPg member ticket Price: $38.00 + gst. non- member ticket Price: $45.00 + gst.
Each CSPG Technical Luncheon is 1 APEGGA PDH credit. Tickets may be purchased online at https://www.cspg.org/eSeries/source/ Events/index.cfm.
The current explanation for the formation of caves in the Bahamas is that mixing of CaCO3supersaturated seawater with CaCO3 -saturated groundwater creates under-saturated mixed water that is capable of dissolving the limestone to produce large voids. We now know that the mixing of these bodies of water cannot dissolve limestone unless there is a continuous source of acids to overcome the buffering effects of the limestone. Similarly, rainwater that is slightly acidic via incorporation of atmospheric and soil CO2 cannot remain acidic during its passage through the vadose zone, a time frame that may be as long as two months.
Interstitial bacteria are the obvious sources of the acids needed to initiate and maintain acidic meteoric and ground-water conditions. We have shown that sterile-caught rainwater on San Salvador Island contains 103 bacteria/ ml before contact with the ground, has a ph of 5.6, and is buffered within three minutes following contact with limestone. The ph of dripstone water, measured as it exits a stalactite, contained >104 bacteria colonyforming-units (cfu)/ml and had a ph of 6.7. The ph of a small pool directly below the dripping stalactite had a ph of 7.7. We hypothesize that the dissolution capacity of vadose water is controlled by the assimilation of bacterially generated acids, produced by bacteria living in the pores of the host rock. Abundant bacteria have been documented in the vadose zone (>106 cfu), in phreatic water (>106), and in the rock walls of caves (>106). In an airfilled cave, 2.2 g CO2 /kg/day was measured coming out of the cave ceiling, and 770ppm CO2 was generated by a 0.5 g sample of cave wall rock held in a sealed container. These same gases generated by bacteria are also forming pores as large as two centimetres in unconsolidated sediments. The bacterial mucilage glues the carbonate grains together and as microbial gases accumulate within this mucilage, it expanses generating large pores within the sediment.
Although this research is considered novel, we have discovered that as early as 1904, scientists had discovered that interstitial bacteria were responsible for the disintegration of building stones in England. What they characterized
Webcasts sponsored by
as bacterial disease of rocks, we suggest is the primary driving force for dissolution of limestones in the Bahamas.
Stephanie Jutta Schwabe received her B.A. in Geology from the College of Charleston in 1990, her M.Sc. from Mississippi State University in 1992, and her Ph.D. in Biogeochemistry from the University of Bristol, UK in 1999. She also earned a J.D. with focus in International Environmental Law and Maritime Law from the University of Queensland, Australia in 2003. She was admitted to the Queensland Bar, both as a Barrister and Mediator the same year. She is also a consultant on environmental issues and modern day carbonate rocks, primarily working with Bahamians who are fighting to save their environment.
A native of Charleston South Carolina, Dr. Schwabe has been diving for over 25 years in the Bahamas, and is the founder and director of the Rob Palmer Blue Holes Foundation, named after her husband, following his death. She became a celebrity in the dangerous world of cave diving, fighting powerful interests to protect the “blue holes” of the Bahamas and, as a result, her adventurous stories have been featured in a book titled, “Women of Discovery: A Celebration of Intrepid Women Who Explored the World”; “The Third Man Factor,” which describes near death experiences of explorers; “Champions for Change, Athletes Making a World of Difference,” a UN publication; and a soon-tobe-released book titled, “Women under Pressure,” describing what women have to endure in the mostly male-dominated world of diving. She has just finished writing her own book titled; “Living in Darkness: A Woman’s scientific and exploratory adventures into the Black and Blue Holes of the Bahamas,” published by Greyhound Press.
Her work and adventures have been recorded by Discovery, Discovery Animal Planet, German and French National Television, World of Wonder, Beyond (an Australian Production company), BBC on a series called ‘Oceans,’ and several other international and national TV programs. She recently finished working with NHK Japan Television generating a science film project on the geological story of how the islands and underwater caves of the Bahamas formed.
She taught Geology, Environmental Geology, and Environmental Science and Policy at the College of Charleston for five years. In 2007 she went to the University of San Diego where she taught Geological Oceanography, Environmental Geology, History of Climate Change, and Environmental Law and Policy at the School of Peace and Justice, and has recently began teaching at the University of Kentucky in the Department of Earth and Environmental Sciences.
SPEAKER
Harris Cander
BP America
AAPG Distinguished Lecturer
11:30 am tuesday, a pril 27, 2010 c algary, te Lus convention centre c algary, a lberta
Please note: the cut-off date for ticket sales is 1:00 pm, a pril 22, 2010. csPg m ember t icket Price: $38.00 + gst n on- m ember t icket Price: $45.00 + gst
Each CSPG Technical Luncheon is 1 APEGGA PDH credit. Tickets may be purchased online at https://www.cspg.org/eSeries/source/ Events/index.cfm.
The competition for unconventional resources in North America has resulted, in some cases, in acquisition of acreage prior to a thorough understanding of subsurface technical risks or identification of fairway boundaries and sweet spots. Indeed, the term “resource play” implies to some that subsurface risks are either minimized or irreducible. As well, the term “unconventional gas” connotes that little is to be gained from application of conventional principles of basin evolution and petroleum generation, migration, and entrapment. Under these circumstances, the value of regional geologic understanding of an entire basin prior to acreage capture can be overlooked and the focus turned to completions technology and post-well analysis.
This lecture will discuss the importance of understanding a basin from basement to surface – granite to grass roots – in the search for unconventional fairways. The lecture will include a holistic integration of data and interpretations from basin modeling, petroleum migration modeling, gas
isotope data, pressure history, seismic, and reservoir quality. Linkages will be made from microscopic scale observations to tectonic-scale processes. Examples will be given from various North American basins that illustrate how mega-scale features such as basement architecture and Precambrian rift history have a first-order and transcendent effect on the evolution and occurrence of unconventional resource fairways, including a strong influence on petroleum generation and entrapment as well as changes in reservoir rock during post-orogenic uplift.
Webcasts sponsored by
Harris Cander works in BP America’s Exploration and Technology Group and has focused the past few years on global and domestic exploration for unconventional resources. Since joining BP (Amoco) in 1991, Cander has worked in a variety of international and domestic exploration, production, and commercial roles as well as carbon dioxide sequestration projects.
Cander is the current co-chairman of the AAPG Unconventional Research Group and a past cochairman of the AAPG Carbonates Research Group. He has published on unconventional resources, overpressure and hydrocarbon occurrence in offshore Trinidad, exploration in central Europe, and carbonate diagenesis. His talk on carbonate porosity evolution won the award for best presentation at the 1992 SEPM annual meeting.
Cander received his Ph.D. in Geology from the University of Texas at Austin in 1991 and MBA from Rice University in 2002. He lives in West University Place, Texas, with his wife, Chris, and children, Sasha and Joshua.
SPEAKER
Dr.
Gary L. Prost ConocoPhillips Canada
12:00 noon, Wednesday, march 10, 2010 encana amphitheatre, 2nd Floor east end of the calgary tower complex 1st street and 9th avenue s.e . calgary, alberta
Mapping and seismic data in the East Gobi basin reveal a structural and burial history for basins adjacent to the Zuunbayan and Tsagaan Els oil fields. The tectonic framework was combined with available well and outcrop data to model the timing and magnitude of hydrocarbon generation.
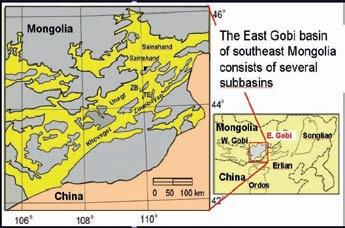
Five structural episodes are recognized: 1) pre-Jurassic northeast-directed shortening that formed the tectonic fabric; 2) Middle Jurassic to Early Cretaceous rifting along northeast trends that formed the subbasins of the East Gobi Basin; 3) late Early Cretaceous north-south shortening and inversion on existing normal faults; shortening caused left-lateral and reverse displacements on northeast-trending faults; 4) Middle Cretaceous uplift and erosion, followed by 5) east-west shortening and right-lateral movement on northeast faults. Folds formed by inversion over Late JurassicEarly Cretaceous normal faults.
Modeling suggests that the bituminous
SUBSURFACE TECHNIQUES - LOG CORRELATIONS, CORES, SEQUENCE STRATIGRAPHY 22, 23 MARCH
Well-log cross-sections- datums, correlations, and criteria for evaluating
Marine, non-marine and channel correlations, with exercises
How to log and interpret cores of major clastic facies of the Alberta Basin
Integration of core interpretation and cross-sections
Subsurface sequence stratigraphy on logs and cores, minimal theory
REGISTRATION: $1375
MANNVILLE EXPLORATION 19, 20, 21 APRIL
Detailed sequence s play types
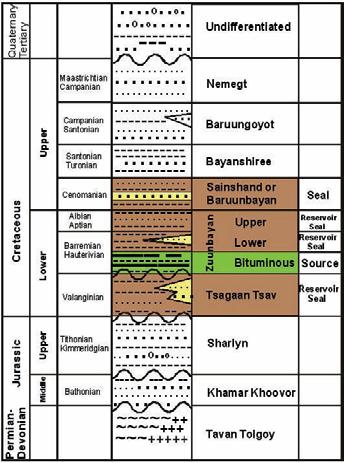
member of the Zuunbayan Formation should be mature over large areas. Oil migrated from mature source areas toward several traps, including the Zuunbayan and Tsagaan Els fields. Modeling suggests that early oil was generated in the Zuunbayan and Tsagaan Els area because of Cretaceous burial. Although generation began in Early Cretaceous, peak generation occurred between 100-90 Ma. Generation continued at a decreasing rate to the present. kerogen maturity suggests that oil is the most likely product. Calculations of hydrocarbon volumes generated indicate that the Unegt basin may have generated up to 86 billion BOE.
Sub-Cretaceous unconformity, overall internal stratigraphy tratigraphy (unconformities), sedimentology, trap types, regional context, and of all subunits core examples
Well-log correlation and of all major units
REGISTRATION: $1690
ROCK CREEK EXPLORATION 26 APRIL
Stratigraphy, sedimentology, reservoir facies, paleostructures
Identifying the Rock Creek vs. Lower Mannville
Internal correlation and reservoir mapping techniques, three types of traps
REGISTRATION: $850
BOOK CLIFFS FIELD - CLASTIC FACIES, SEQUENCE STRATIGRAPHY,UTAH- for companies MAYor SEPT- OCT
World’s best outcrops of fluvial, deltaic, shoreline and shelf sands
Ferron Sand coal bed methane- facies and trapping
Unconformities on reservoir scales- sequence stratigraphy unravelled
Unconventional gas plays- non-marine to shallow marine examples
Alberta Basin analogs on each outcrop
REGISTRATION: $2600 ,
For information/ registration, call (403)949-3810, or 10% discount-3or more registrations. Courses can be given in-house. dcant@personainternet.com
Gary Prost received his Ph.D. in Geology from the Colorado School of Mines and works for ConocoPhillips Canada. He has held Team Leader positions for both the Parsons Lake Gas Development Project and recently the Arctic Exploration program. Over 28 years in the energy industry, he has worked for the U.S. Geological Survey, Superior Oil, Amoco, and Gulf Canada and is author of Remote Sensing for Geologists and English–Spanish Glossary of Geoscience Terms.
There is no charge for this attending this talk. Please bring your lunch. The facilities for the talk are provided complimentary of EnCana and refreshments by Geochemtech Inc. For further information or if you would like to give a talk, please contact Bob Potter at (403) 863-9738 or ropotter@telusplanet.net, or Trent Rehill at (403) 606-6717 or trehill@kulczykoil.ca. Or visit our new Facebook page (“CSPG International Division”).
SPEAKER
Jean-Yves Chatellier
Talisman Energy
12:00 noon.
thursday, m arch 11, 2010 room LPW-910, Livingston Place West 250 2nd st sW, c algary, a lberta
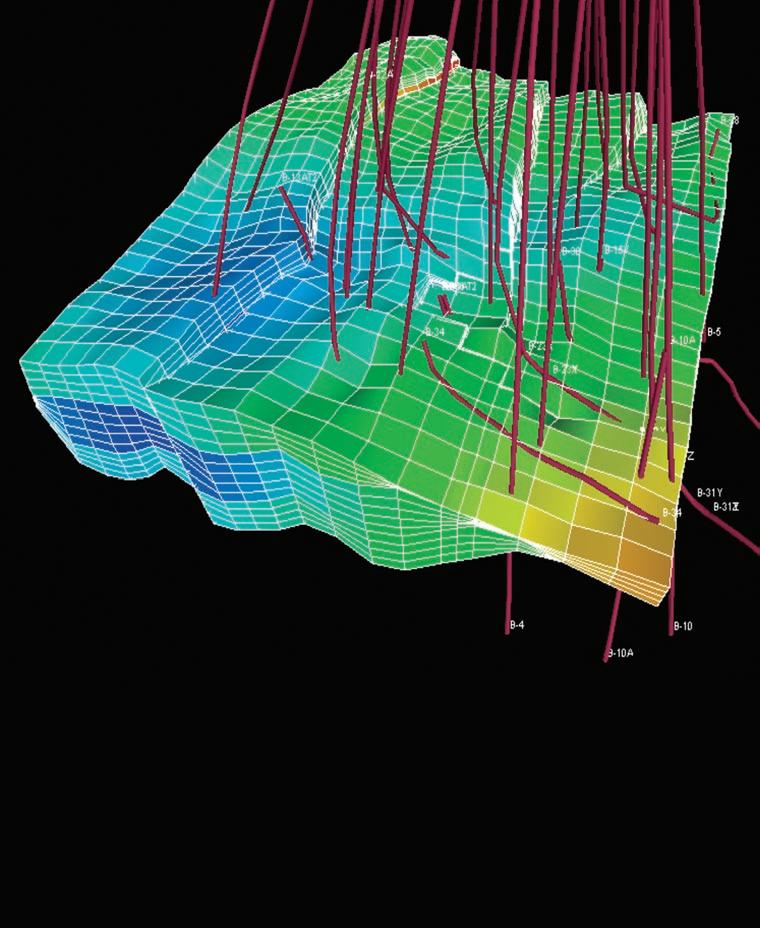
Alternate fault activity can be demonstrated using 4-D views of earthquakes in areas where seismic events are frequent. Examples studied and published by the author includes the December 26, 2004 Aceh earthquake that led to the infamous tsunami and the New Madrid Seismic Zone in the central part of the USA known for a sudden 90 degree change in river pattern in 1812.
For this subsequent study, the available government data that was used encompasses 11,800 earthquakes in Western Canada, 1,024 of which are located in Alberta.
In British Columbia (BC) many major westplunging and south-plunging seismic planes are easily identified. A 3-D earthquake analysis in Eastern BC shows a series of large seismic trends of similar strikes but variable dips, and with similar directions to hydrocarbon trends from the Alberta Foothills
In Alberta, the number of earthquakes recorded does not allow identification of any major plane encompassing many seismic events. however, 2-D and 3-D analyses covering Alberta, BC, and part of Montana unraveled deep-seated patterns of direct interest to the oil industry: many anomalous producers are perfectly aligned with seismicity trends.
Thus, in Alberta a different series of rules and methods had to be applied to unravel patterns of interest. Rule 1: as earthquakes are commonly at the crossing between faults, each earthquake site can be used to define two separate fault trends. Rule 2: regular spacing
between faults can be used as a guide to define the structural grain in the Alberta Plains.
A map-based approach and some outstanding results will be outlined with three selected structural directions common in Alberta, North 93, North 9 and North 72 degrees. The former corresponds to deepseated faults commonly reactivated in leftlateral strike-slip, the other two directions are respectively the antithetic and synthetic Riedel shears. Examples of hydrocarbon sweet spots linked to such earthquakes will


Sponsored by
be from Paleozoic carbonate and Cretaceous sandstone fields.
Jean-Yves Chatellier obtained a Ph.D. in tectonics from Paris VI University and worked around the world for 18 years before setting down in Calgary. In the past 20 years he has studied earthquake patterns in Greece, Romania, southeast Asia, Australasia, and Venezuela. Since 2003 he has focused his attention to North America while working at Tecto Sedi Integrated. He is employed as an explorationist by Talisman Energy in Calgary.


CGGVeritas is committed to service excellence to help you make timely decisions. Our highly experienced technical staff and a dedicated R&D team provide you with the acquisition, imaging and data library services you need to get optimum results. Count on CGGVeritas to help you explore, develop and produce with confidence.
Paleo 2010 is presented in conjunction with the CSPG Palaeontology Division, Alberta Palaeontological Society, and Mount Royal University Earth Sciences Department
Lectures and Poster displays: saturday, march 13, 2010 8:30 am – 5:00 Pm
Workshops:
sunday march 14, 2010 9:00 am – 4:00 Pm
mount royal university 4825 mount royal gate sW calgary, alberta
Saturday lecture events and poster viewings are free and require no registration. Sunday workshops do require registration and minor fee.
L ECTURES: SATURDAY, M ARCH 13
Held in Jenkins Theatre
Speakers confirmed so far include (talk titles are tentative):
8:30 – 8:45 AM
Talk: Introduction
Speaker: APS President Wayne Braunberger
8:45 – 9:15 AM
Talk: New Zealand’s Fossils: Remnants of a Lost Continent
Speaker: Craig Dylke
9:15 – 9:45 AM
Talk: Using High Dynamic Range Imaging in Vertebrate Paleontology
Speakers: Danielle Fraser, Jordan Mallon, Rob Furr, and Jessica M. Theodor, University of Calgary
9:45 – 10:15 AM
Talk: The Art, Culture and Science of Iniskims
Speaker: Lisa Bohach, FMA Heritage
10:15 – 10:30 AM: Coffee Break
10:30 – 11:00 AM
Talk: Reconstruction of Scows Used in Early Paleontological Research and a Commemorative Expedition Planned for 2010
Speaker: Darren Tanke, Royal Tyrrell Museum
11:00 – 12:00 PM
Talk: History, Mystery and Baywatch: Illustrating the Animals of the Burgess Shale
Speaker: Marianne Collins, ArtoFact
12:00 – 1:30 PM
Lunch Break and Poster Session
1:30 – 2:00 PM
Talk: Changing the Face of Tyrannosaur Rear Ends: Tail Muscle Reconstruction in Theropod Dinosaurs
Speaker: Scott Persons, University of Alberta
2:00 – 2:30 PM
Talk: Komodo Dragons
Speaker: Eva Koppelhuis, University of Alberta
2:30 – 3:00 PM
Talk: My ankylosaur is a big dumb tank! Ankylosaur reconstructions in the scientific literature and popular media
Speakers: Victoria Arbour, Mike Burns, University of Alberta
3:00 – 4:00 PM
Talk: Dinosaurs in Science and Art
Speaker: Philip Currie, University of Alberta
4:00 – 4:15 PM: Coffee Break
4:15 – 5:15 PM
Talk: Dinosaurs of the Lost Continent of Laramidia
Speaker: Scott Sampson, Utah Museum of Natural History, University of Utah Book signing afterwards
SUNDAY, MARCH 14
Room B213, Mount Royal University
9:00 – 12:00 PM
Workshop: Permian Vertebrate Fossils from North Central Texas
Presenter: Jason Anderson, University of Calgary Cost: $15 per person
Description: This workshop will cover the faunas typical for the classic Permian
Sponsored by
localities of northern Texas. There will be a brief introduction to the history of collecting in the Permian of Texas. This will be followed by a survey of the most common fossils found. Small collections of fossils from a few localities will be provided for workshop participants to examine and identify. Screenwashed sediments may also be available for participants to examine for fossil remains.
Jason Anderson is a paleontologist and Assistant Professor with the Faculty of Veterinary Medicine at the University of Calgary. he is Associate Editor of the Journal of Paleontology, co-editor of Major Transitions in Vertebrate Evolution (with h ans-Dieter Sues), and a contributing author to Prehistoric Life, The McGrawhill yearbook of Science and Technology 2009, and the McGraw- hill Encyclopedia of Science, 10th Edition. he is the author of over 30 articles on the early evolution of Paleozoic tetrapods.
1:00 – 4:00 PM Workshop: Make-a-Saurus
Presenter: Brian Cooley Cost: $25 per person (materials included)
Description: Using a variety of simple materials and methods, participants will learn how to make their own dinosaur which they will be able to take home at the end of the workshop. Children should wear clothes that they don’t mind getting dirty.
Brian Cooley has been making sculptures of dinosaurs for over twenty-five years. h is sculptures may be seen in museums all over the world, most notably the Royal Tyrrell Museum of Palaeontology in Drumheller, Alberta. h e and his wife, Mary Ann Wilson, are co-authors of the children’s book MakeA-Saurus.
To register for workshops contact Mona Marsovsky (403) 547-0182 or monahome@telus.net. Make cheques payable to the Alberta Palaeontological Society, P.O. Box 35111, Sarcee Postal Outlet, Calgary Alberta, Canada T3E 7C7. Deadline for workshop registration is March 1st, 2010.
For information on the lecture program please contact Philip Benham (Philip.Benham@shell. com) or phone (403) 691-3343.
To inquire about submitting a poster please contact Wayne Braunberger (president@ albertaplaeo.org) or phone (403) 278-5154.
Tel
Fax


| by Gerry Reinson
This article focuses on the types of sand bodies likely to be generated and preserved in the various transgressive scenarios discussed in Part 1. Facies sequences, which are important distinguishing characteristics in the rock record, are presented along with hypothetical log signatures, for each of the sub-environments and depositional settings. Variability of the facies successions is emphasized in order to demonstrate that the most constant characteristic of transgressive coastal deposits is in fact their variability.
The three-dimensional geometry of coastal sand bodies and their internal variations will reflect the geomorphological orientations and size spectrum illustrated in the examples given in Part 1. Lateral and vertical contacts (i.e., bounding surfaces) are extremely important both in defining a reservoir’s extent and understanding the controls on reservoir occurrence and quality. The complexities of the sand-body geometries are illustrated here through the use of modern examples from Prince Edward Island and New Brunswick.
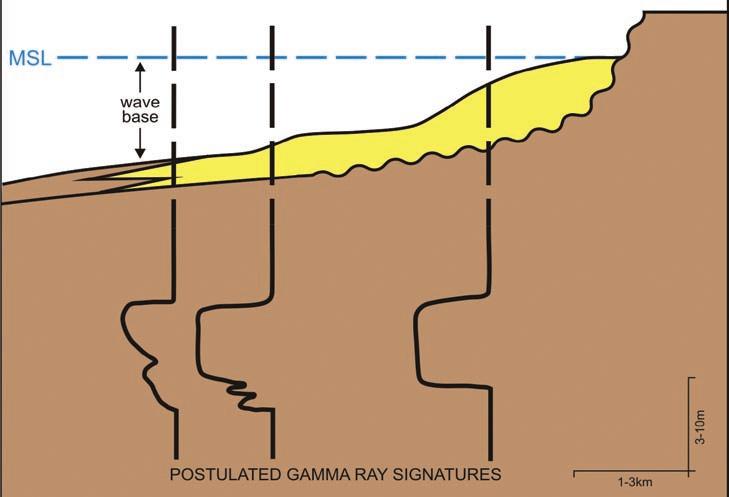
Figure 1 illustrates the “end-member” facies successions likely to be generated in transgressive coastal settings featuring mainland-attached beach segments; lagoonal estuaries; and large, open-ended or funnel-shaped, drowned river valleys. It is emphasized that the simplest succession in terms of lithofacies variation will be the mainland-attached deposit. This is the result of the presence of a limited number of sub-environments due to the minimal amount of available accommodation space. Conversely, the most complex lithofacies successions will be those generated in estuary settings, because of the complexities of sub-environments due to much higher available accommodation space. Estuary facies sequences may vary substantially from those illustrated in Figure 1, depending on location within the estuary itself. This will be demonstrated in the examples discussed later.
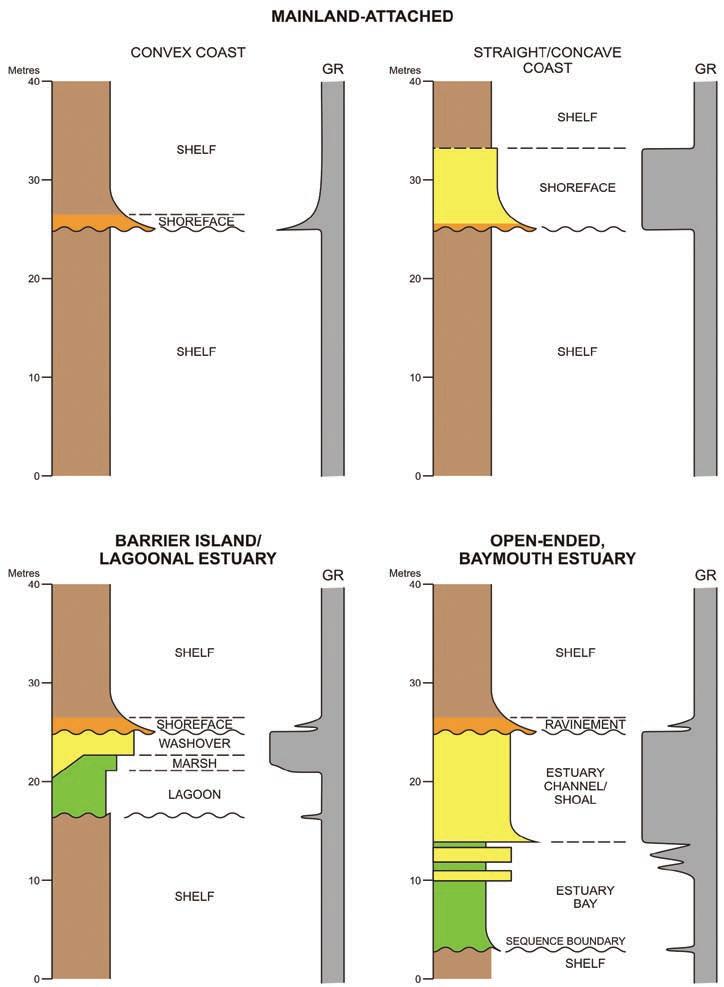
Figure 1. Generalized “end-member” facies successions characteristic of transgressive coastal settings –mainland-attached beach/shoreface, barrier-island/lagoonal, and open-ended estuary.
The preservation potential of coastal facies under transgressive conditions has been a hot topic over the past several decades as sedimentological principles and facies analysis evolved. Many of the early interpretations of ancient coastal deposits were dominated by
the progradational (regressive) model. This was due in large part to the popularity of the Galveston barrier-island stratigraphic model published by Bernard et al. (1962). This paradigm generated much negativity toward the likelihood of transgressive sequences
being preserved in the rock record. For example, klein (1974) considered that only a thin ‘ravinement’ lag deposit could be the only record of preservation of transgressive deposits in rock successions (an example of ravinement lag is shown in Figure 1).
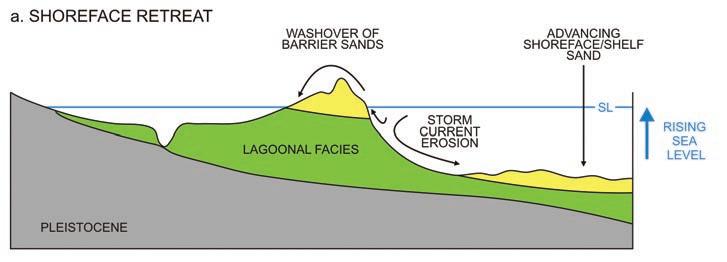
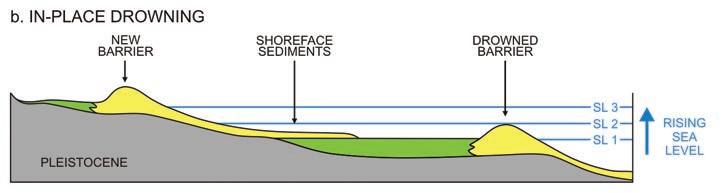
In spite of the popular paradigm of that time, several early workers were on to the preservation potential of transgressive deposits (Fischer, 1961; kraft, 1971), and suggested that the rate of relative sealevel rise should govern the amount of preservation. That is, slow but continuous sea-level rise will lead to shoreface retreat, whereas rapid relative rise should result in complete drowning (Figure 2). It should be apparent that these early workers were basically alluding to rate of increase of accommodation space. As mentioned previously, in areas adjacent to re-entrants such as bays and river mouths, the accommodation space is strongly affected by sea-level fluctuations.
It should be stressed that most of the supratidal and subaerial deposits that are seen forming at present, although demonstrating how these sedimentary processes operate, will not be preserved, but rather lost to erosion under continuing transgressive conditions. Landward re-working of such deposits will be most prevalent in river- or bay-mouth positions, where accommodation space is sufficient enough to receive and retain the sediments.
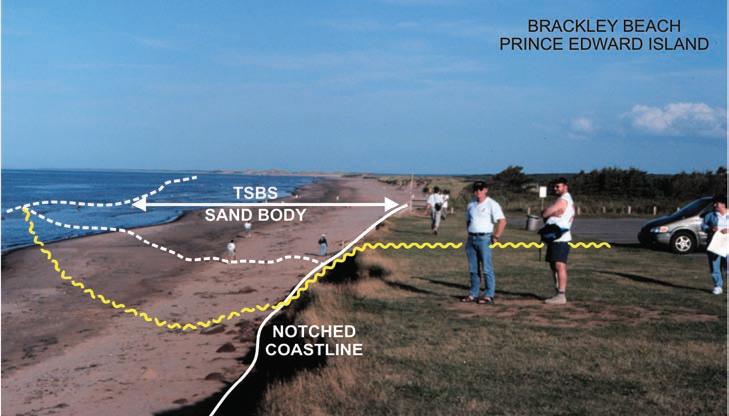
An example of a modern setting that could generate the mainland-attached shoreface successions depicted in Figures 1 is the beach segment depicted in Figure 3. Note the hypothetical cross-section situated normal to shore, and the various gamma ray log signatures that could occur across depositional strike. Such a transgressive deposit would usually display the following characteristics: 1) have a sharp-based bounding surface for most of its width, 2) consist of a single lithofacies (sand or gravel) and, 3) taper off to seaward as the deposit “shaled-out”. There are many examples of such linear, along-shore extensive, but laterally-narrow reservoirs in the Cardium, Viking, Ostracod, and Bluesky formations of the Western Canada Sedimentary Basin. In fact, these transgressive sharp-based shoreface (TSBS) deposits comprise one of the most prolific hydrocarbon-bearing reservoir types in the Lower Cretaceous and much of the Jurassic as well.
(Continued on page 18...)
(Source:
3rd Millennium Edition – Version 3.1
Integrated Petrophysics for Engineering, Geology, and Geophysics Computer-Ready Math, 300 Topics, 2000 Illustrations, Case Histories, Spreadsheet Software
Order CD-ROM On-Line at: www.spec2000.net
Multi-Media Narrated Self-Study Courses Available Separately
E. R. (Ross) Crain. P.Eng. Box 29 Site 3 RR 2, Rocky Mountain House, Alberta, Canada, T4T 2A2 Phone: 1-403-845-2527 Email: ross@spec2000.net
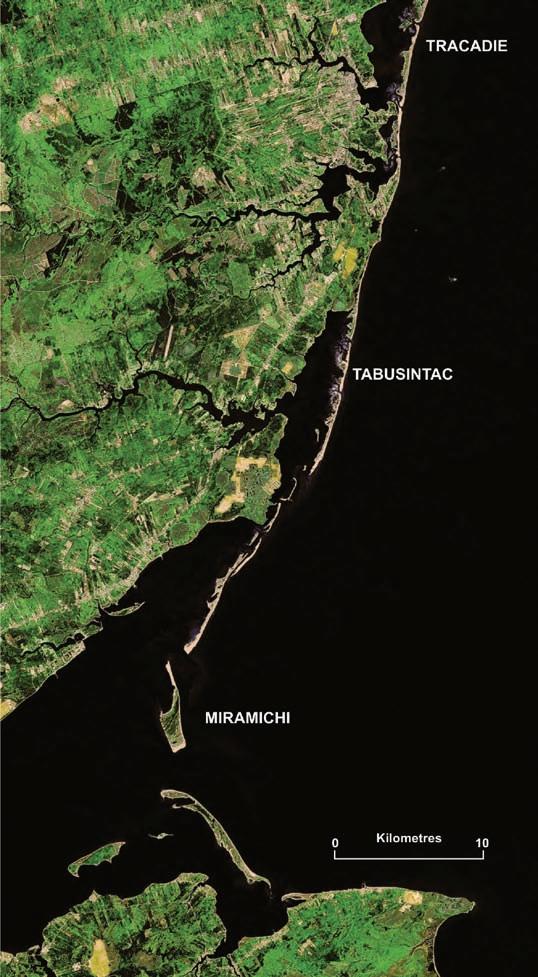
The coastal segment encompassing the Tabusintac – Miramichi depositional system in northeast New Brunswick (Figure 4) includes an example of a lagoonal estuary and a large embaymentfronted river valley (Miramichi). For comparison, the surface area of Tabusintac Bay is 36 km 2 compared to the 295 km 2 area of Miramichi Bay inside the barrier islands. A drainage-basin area of 770 km 2 for the Tabusintac system is rather minimal compared to the 14,000 km 2 drainage-basin area of the Miramichi. As discussed in Part 1 of this series, such differences in drainage-basin size alone, dramatically control the large differences in sand-body geometry and scale, between the two estuary systems.
In the Tabusintac scenario one would expect to find a complex sediment body, generally 5 to 10 metres thick, orientated oblique to sub-parallel to depositional strike (Figure 5). Lithofacies would tend to vary, as would reservoir grade, from cleaner sand or gravelly sand seaward, to muddier sand of lesser reservoir quality, in a landward direction. Thick, high-grade, reservoir channel-fill deposits could be expected to be present, encased within the ‘muddier’ lagoonal facies. The facies successions would vary significantly over short distances as illustrated by the hypothetical gamma-ray log profiles in Figure 5.
The large Miramichi Estuary is similar in geomorphology and depositional aspect to many high-microtidal to low-macrotidal estuaries occurring worldwide, including Delaware Bay, Chesapeake Bay, James River estuary, and Severn estuary, to name a few. The sediment distribution in the Miramichi consists of a 10 to 20 metre-thick, lobate to semi-circular, marine-derived, tidal-delta/shoreface sand and gravel deposit situated seaward of a central mud basin(Figure 6). In this scenario, the barrier islands would be totally removed during transgressive erosion, and much of the wide bay mouth would be filled with this reworked sand, which would onlap the bay muds. Facies successions would vary substantially depending on location within the system, as indicated by the hypothetical gamma-ray log signatures (Figure 6). Note that all types of log signatures could be present in such a system from bell-shaped to funnel-shaped to blocky and compositethus a specific log signature should not be used exclusively as a definitive tool for interpreting estuaries, or any environment for that matter.
courses available. For course outline visit: www.hughwreid.com
The three depositional settings, Brackley Beach, Tabusintac Estuary, and Miramichi Estuary, clearly exhibit a divergent range of sand bodies in terms of scale, orientation, lithofacies complexities, and geometries. Accordingly, under transgressive conditions the resultant reservoir bodies will display these very divergent characteristics. The modern examples discussed here are not meant to be definitive, but rather to stress that it is very tenuous to “jump” on one model, “pigeon-hole” a specific log signature, or rely on “trendology” mapping, to interpret transgressive coastal sand bodies in the subsurface rock record.
Part 3 of this series of articles will deal with the aspects of subsurface mapping of such sand bodies, with respect both to recognizing, and predicting, their depositional trends.
Bernard, H.A., LeBlanc, R.J. and Major, C.F. 1962. Recent and Pleistocene Geology of southeast Texas, In: Geology of the Gulf Coast and Central Texas and Guidebook of Excursions. Houston Geological Society and Geological Society of America annual meeting, 1962, Houston, Texas, p. 175-205.
Elliott, T. 1986. Clastic shorelines, In: Sedimentary Environments and Facies. H.G. Reading, (ed.). Oxford, Blackwell Scientific Publications, p. 143-177.
Fischer, A.G. 1961. Stratigraphic record of transgressing seas in light of sedimentation on Atlantic coast of New Jersey. American Association of Petroleum Geologists, Bulletin, v. 45, p. 1656-1666.
Klein, G. deV. 1974. Estimating water depths from analysis of barrier-island and deltaic sedimentary sequences. Geology, v. 2, p. 409412.
Kraft, J.C. 1971. Sedimentary facies patterns and geologic history of a Holocene marine transgression. Geological Society of America, Bulletin, v. 82, p. 2131-2158.
Rampino, M.R. and Sanders, J.E. 1980. Holocene transgression in south-central Long Island, New York. Journal of Sedimentary Petrology, v. 50, p. 1063-1080.
Reinson, G.E. 1992. Transgressive barrierisland and estuarine systems, In: Facies Models, Response to Sea-Level Change. R.G. Walker and N.P. James, (eds.). St. John’s, Newfoundland, Geological Association of Canada, p. 179-194.
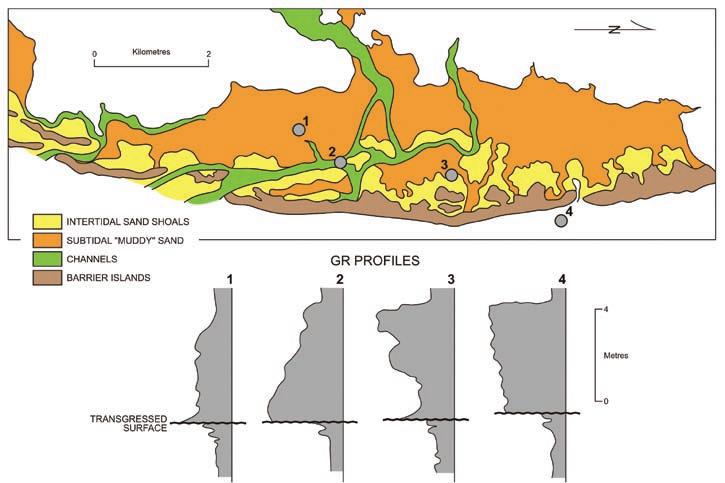
Figure 5: Sediment distribution within the Tabusintac lagoonal estuary system, northeast New Brunswick. Hypothetical gamma-ray profiles are depicted to illustrate the variability of lithofacies successions in close proximity.
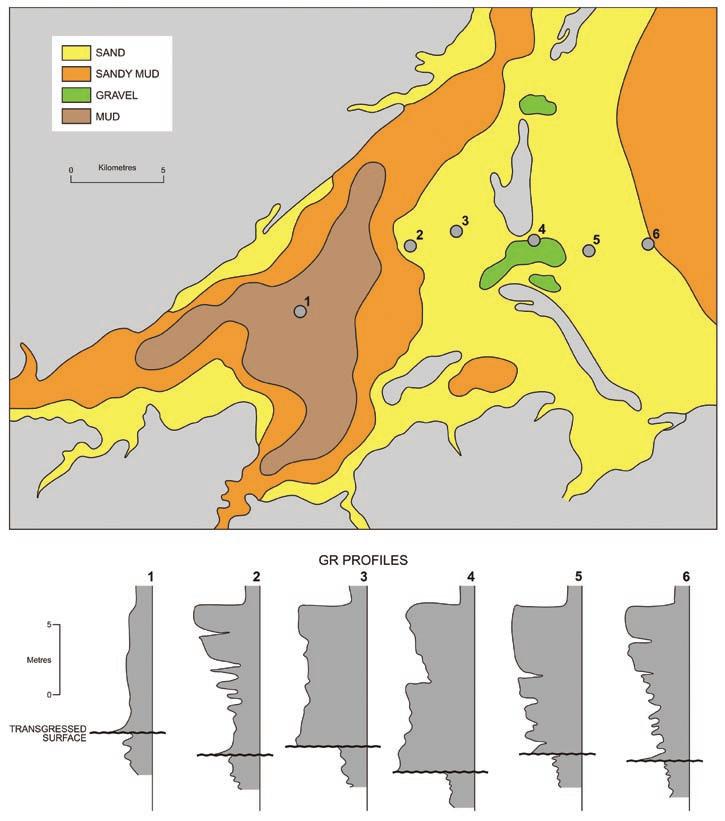
Figure 6: Sediment distribution within the Miramichi estuary, northeast New Brunswick. A series of hypothetical gamma-ray profiles are shown to to demonstrate the variability in lithofacies successions from the central basin seaward into the shoreface.
| by Dr. Mryka Hall-Beyer
Last month I promised to wrap up the series with advice about remote sensing (RS) training and education. The h aitian earthquake of January 12, 2010 intervened, and there has been much in the media about imagery and spatial information systems. So instead, here is more about the role of images in disaster relief, and something about the particular processing techniques useful in disaster relief. They can also be applied to other geological questions.
About a decade ago, I had a graduate student curious about possible contributions of spatial technology to serving aid agencies. he used h aiti as a difficult-case example to test feasibility. he concluded that a system would have to be maintained outside the country (infrastructure problems), that accessibility would have to be through a non-local communications system such as satellite phones, and the biggest problem would be getting agreement from data producers to making it available. At the time, such a system seemed impractical. During the intervening years huge amounts of data have become public and mass-market consumers seeking quite different effects have put technology and skills in the hands of a broad cross-section of people everywhere. People on the ground with smart phones can upload data to the web “cloud” where it is immediately available to everyone. Google Earth overlays can be constructed and made accessible. Applications can automatically map the location of tweets sent from GPSequipped iPhones. We can only wish that such applications could be even quicker, but compared to the logistical challenge faced without any of the information provided by these aids, they are great steps forward. Although publicizing real-time websites in a print medium is dangerous, I would mention http://www.gisuser.com/content/ category/1/152/2/ (accessed January 20), which lists publicly available spatial tools and imagery, and allows upload of new initiatives. In addition, calls have gone out over professional nets for any h aitian data potentially useful to the recovery efforts. The earthquake is a first for the power of public, web-based spatial data and I predict it will spur non-emergency data sharing in other areas.
Disaster response requires many different kinds of information, and so is in the realm of Geographic Information Systems (GIS). These articles are about RS, so let’s look at how images figure in the relief and rebuilding effort. Obviously, one can’t (yet!) get satellite imagery using mass-market electronics. International cooperation in acquiring imagery for disasters started in 1999 when the European Space Agency initiated the “International Charter on Space and Major Disasters.” Canada joined in 2000 and some US government agencies in 2004. Since then, most nations with space programs have signed on, most recently China in 2007. Any government faced with a disaster, or relief agencies concerned, can activate the network. Trained people evaluate what imagery is needed and acquire and deploy it (International Charter, 2010). Experts are available to extract information and produce maps in a format useful to workers on the ground.
In the case of the h aitian earthquake, the Charter acquired imagery from seven satellites. They decided on two kinds of images: Radar and high spatial-resolution
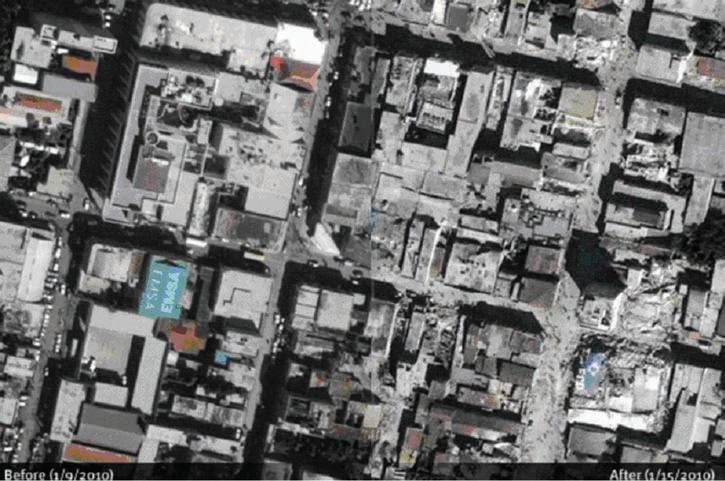
visible/infrared. h aving seven satellites on tap allows for more frequent viewing, since each satellite will be in the right position at a different time. As we saw last month, Radar can acquire images both at night and through clouds. Radar is excellent for human artefacts such as buildings and roads, making it appropriate for urban applications. It is also good at detecting landslides, flooding, and rubble. high spatial resolution imagery boasts pixels smaller than 10m, down to 50cm. At the higher-resolution end, these images are as detailed as anything we would get from air photos, and allow individual people to be picked out and counted (though not personally identified). Figure 1 shows the power of these images, especially when stacked to show before and after.
During the rescue phase, the images are mostly interpreted visually and displayed in the background of other data. h as building x collapsed? Where are unblocked routes between A and B? Where are people congregating and do they have shelter? As time goes on, other requirements take over and need more detailed and automated image processing. Algorithms are developed
com/index.php/27/Sample+Imagery+Gallery. The contents of this site may change over time.)
to track damage for planning reconstruction. They may collect surrogates for various socio-economic data (building average size and density, for example), and create databases that may help with preventing future disasters. how many buildings are destroyed in various sub-sections of the city (the satellites cannot of course see interior damage)? These maps may suggest further questions to ask. Does the damage pattern have some spatial consistency that would indicate something about the underlying rock, the movement during the earthquake, or soil consolidation? On the other hand, were patterns more physically random, indicating perhaps spotty adherence to building codes or the effects of different structural materials? Without knowing the spatial patterns, it would be much harder to get answers.
We are mainly concerned in these questions with two image processing techniques: change detection and “object-oriented” procedures (abbreviated as GeoBIA which stands for “Geo-Object-Based Image Analysis”). As with all other image information extraction, the crux of both is to try to express numerically what the human eye and trained judgement may see intuitively. Both are very important in responding to disasters, especially in the rebuilding phases.
Figure 2 presents the change detection problem: before and after images. The task is to locate landslides. Each image is an array of digital numbers attached to pixel locations - a matrix - so the simplest step would be to simply subtract one image from the other, and differences would represent change at each pixel location. One would do this for each of an appropriate selection of available wavelength bands. Like unsupervised classification (see the second article of this series), the raw results do not specify what kind of change is significant for our purposes. Just looking at figure 2, you can see that clouds have changed, as has overall image brightness. We certainly don’t care about that. In addition, the north bank of Rivière Momance was vegetated in 2008 but bare in 2010. This is probably a seasonal difference, not a permanent change, so not of interest. We want certain kinds of changes, from darker to brighter earth or from vegetated to bare earth. We could train the computer to only classify these changes, so long as we could locate one or more clear examples. In another approach, we might completely classify each image separately, and then see what pixels have changed from chosen classes to other chosen classes. In this case, we would have
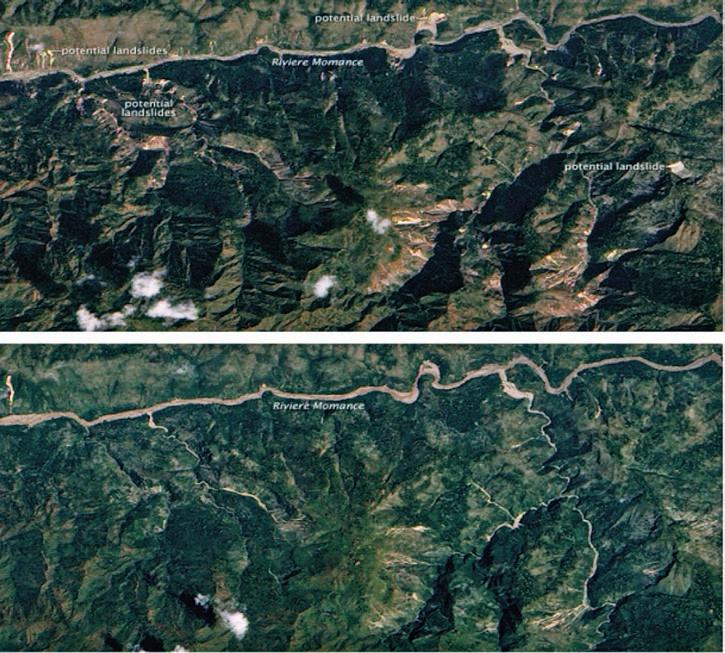
to deal with inaccuracies in each image’s classification. On the good side, we would end up with complete land cover maps that we could use later or for other purposes.
Nevertheless, we still don’t have the final answer. A change in river course might cause pixels to move from vegetated to bare earth. Or, look at the square bare area in the centre right of the top image. It certainly represents a change from vegetated to bare earth. But, is a landslide likely to have that shape and location, or might this be a newly cleared field or a clear-cut in the forest? Perhaps we could bring a digital elevation model into the image and automatically constrain our potential landslide identification by slope thresholds. Moral of the story: to extract information from images you need to know local conditions and processes. you also need to think clearly about what is possible, and apply a bit of “art” to the science. Sounds like Geology!
G eoBIA
Go back to that squarish bare area on figure 2. Shape signalled that it might not be a landslide. Satellite images consist of perfectly square pixels of identical size. What could “shape” mean in that context? It’s not only shape: we can’t use hints
such as size of a unit or what it is next to. GeoBIA is the research area that tries to overcome this problem. The goal is to automate collecting pixels into packages that correspond to something we would call an “object” in the real world. If we could do that, we could measure objects’ size, shape and relationships. Of course we still have spectral data for the objects. how do we get a computer to package our pixels?
Packaging “natural” pixels is not too hard. Many natural objects – say a lake – are composed of the same material, so they are the same colour (spectral signature). We could start with each pixel and work outwards from it until we encounter a sudden change, and draw our object boundary there. When it comes to more variable objects, say a forest, it is a bit more difficult. here, we ask if adding a neighbouring pixel to the growing object would make it more or less homogeneous, and we have to rather arbitrarily set some boundaries about the maximum heterogeneity we will allow. We can also constrain the largest or smallest object we will create, and make size hierarchies (cars are small objects within larger parking lots, for example). A good summary of GeoBIA is in hay and Castilla (2008).
(Continued on page 22...)
You’ve got the power of Pet rel.
A unified seismic-tosimulation solution for geothermal operations.
Geophysics. Geology. Reservoir Engineering.
Petrel* gives you an advantage no other application can offer—a powerful integrated workflow from seismic to simulation. This enables you to model complex geologic structures with pinchouts and truncated faults—and easily incorporate new data to update the model and rerun ECLIPSE* simulations at any time. That really makes the difference in understanding complex geothermal resources.
“With Petrel and its integrated workflow, we can exploit the complete reservoir potential and minimize the exploration risk in geothermal operations.”
Dr. Zoltan Timar-Geng, Geologist GEOenergie Bayern GmbH
www.slb.com/petrel2009
(...Continued from page 21)
Very high spatial resolution images, especially of mainly human artefacts, make object-creation problems. The higher the resolution, the more detail we can see. The more spatial detail, the less homogeneous the desired object is likely to be and the harder to “decide” where to draw the boundary. Zoom in your gaze on your bookshelf, from one m2 areas to one cm2 areas, to see what I mean. If you’re like me, just compare detail with and without your glasses! At high resolution, shadows come into play. Look back at figure 1. h ow might an object-forming algorithm deal with that rooftop with letters written on it? What about a roof with variegated-colour gravel or a rooftop garden? Where might the computer draw the edge of that building in the upper left that casts a shadow? At least in the “before” picture, looking for buildings, we might specify that object edges would have to have straight lines. In the after-image, with collapsed buildings and rubble-filled streets, drawing object boundaries would be even harder. A human interpreter might have trouble discerning a building’s condition after the earthquake –and how many buildings need to be rapidly evaluated when organizing relief! So far, GeoBIA is in its infancy, but object creation algorithms are improving all the time.
GEOLOGICAL APPLICATIONS OF CHANGE DETECTION AND G eoBIA Let’s get back to the main point of this series, which is how you can use these techniques in more everyday geological applications. Change detection is of course useful for any dynamic surface, such as earth movement or volcanic or glacial phenomena. I have heard a lot recently about detecting ephemeral hydrocarbon seeps. If we can recognize the material itself or some surface surrogate (such as slicks or damaged vegetation), then we can use successive images to see when it appears and perhaps point to what controls the flow. The main problem in studies of this kind is the temporal and spatial scale. If doing reconnaissance over a large area, one would need coarser spatial resolution, which often comes with quite a reasonable temporal repeat rate. however, will pixel sizes be small enough to identify the phenomenon? On the other hand, spatially detailed images are small in extent and expensive, and do not come with regular repeats in the past for comparison purposes.
GeoBIA today is finding applications mainly in forestry and urban areas. Size, shape, and proximity of “objects” are not the best way to identify most geologic phenomena. yes, we could map, say, pink
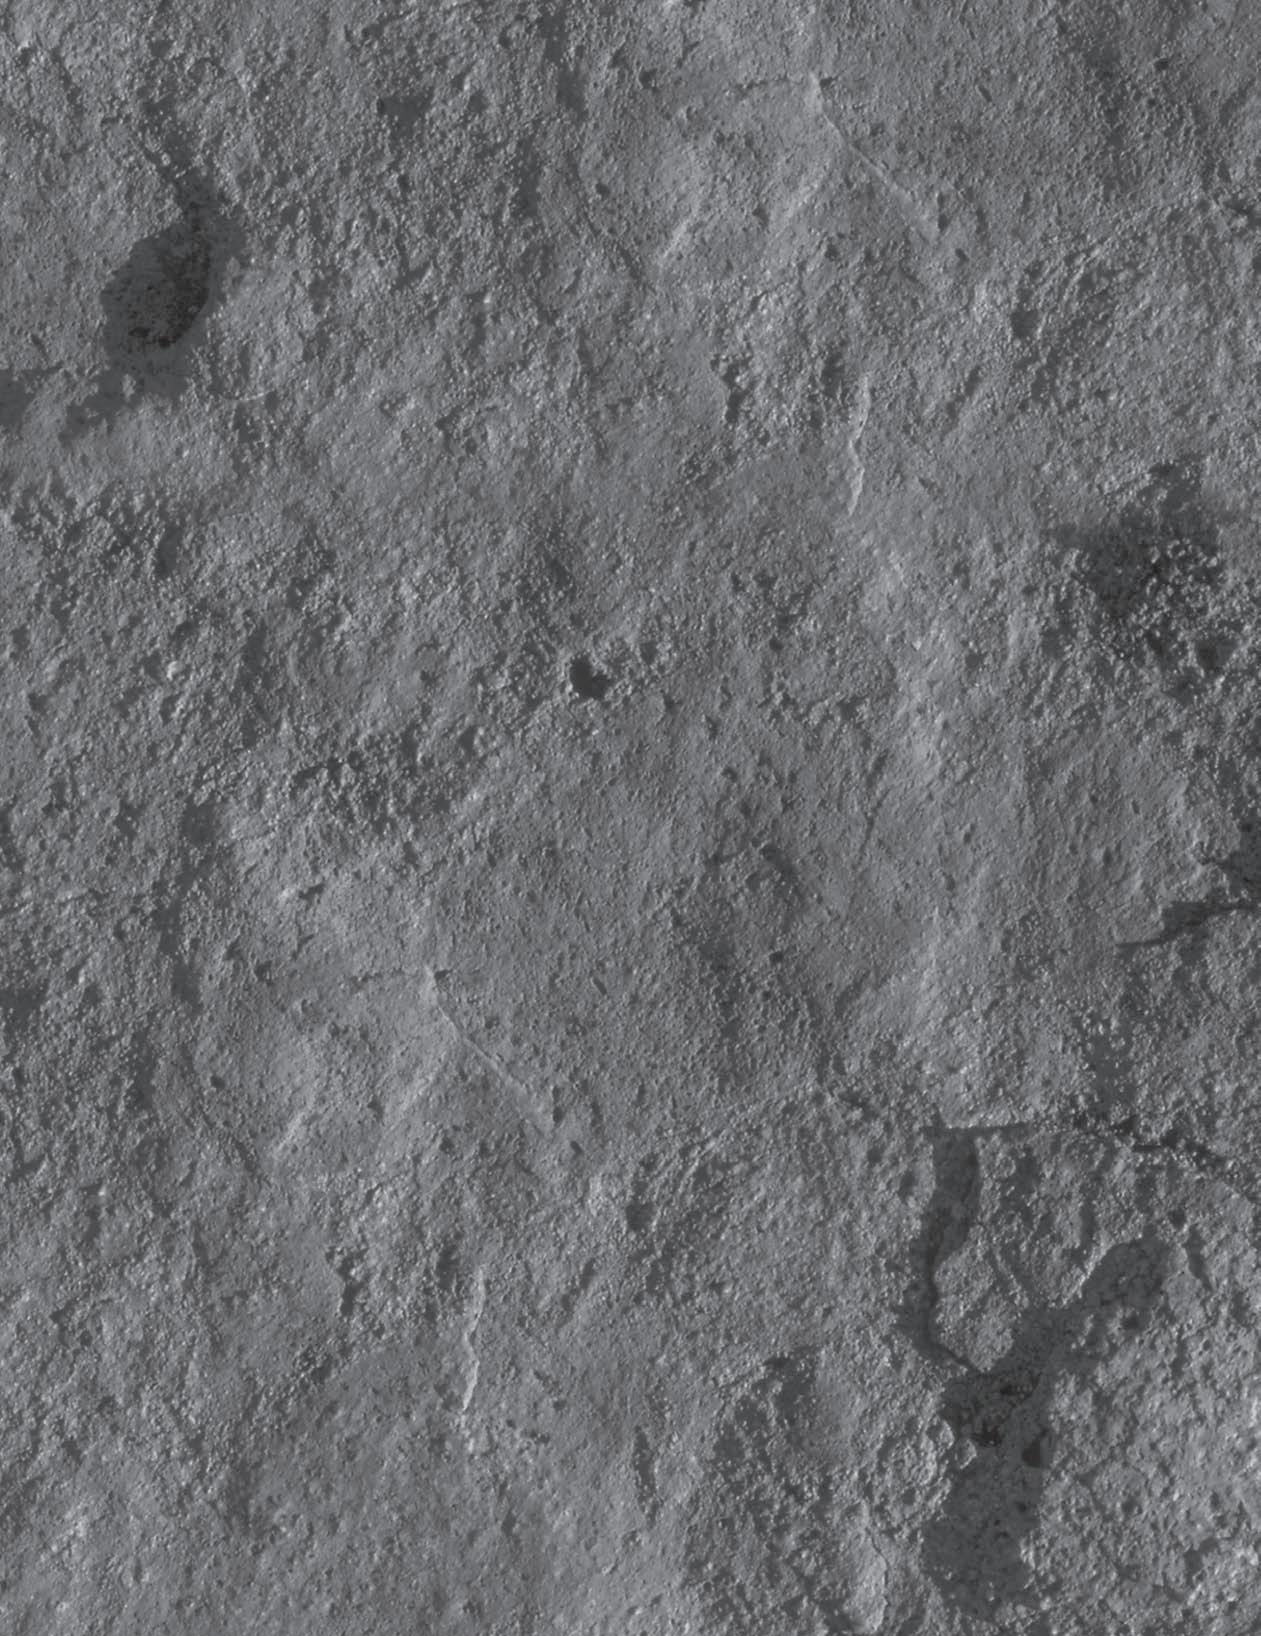
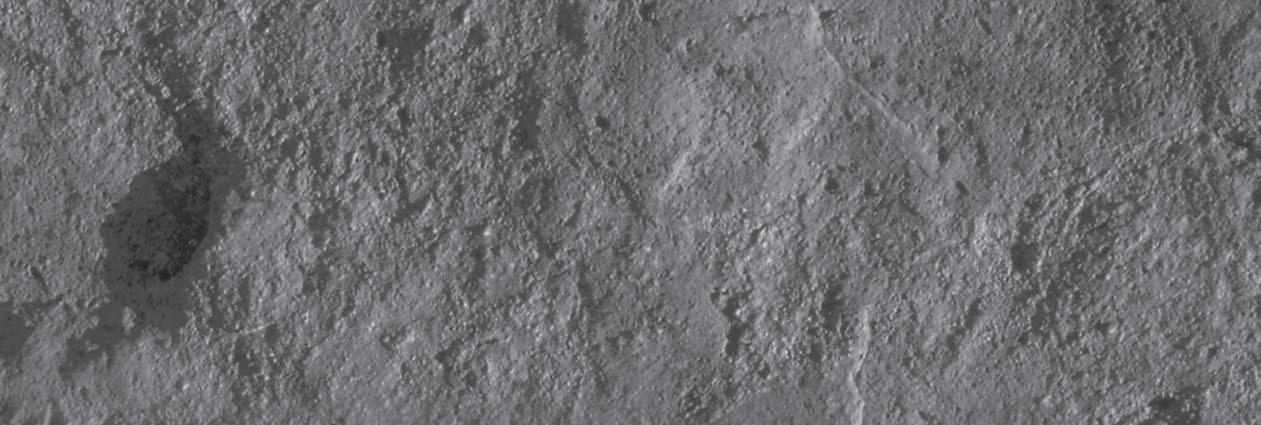
granite masses contacting black basalt flows. But in this case, identification by colour of each individual pixel would create just as good a map – or perhaps better – as one built of objects. I cannot offhand think of geological applications where GeoBIA would be the most advantageous way to go. however, new techniques invite new applications, and surely some are out there awaiting discovery. One interesting area recent GeoBIA application is in defining the extent of lunar craters, to the end of extracting maps of crater density and hence lunar surface ages ( yue et al., 2008).
I hope these articles have given you a broad outline of what satellite imagery and its analysis can do for various geological applications. What is visible on the surface, to our eyes or in another of the instrumented wavelength ranges, that will give me the answer I need? We can enlist other available data, especially surface topography, as long as it is in pixel format. Once we have identified our surface object, we need to find out its characteristic reflectance or emission, and then implement algorithms to flag pixels having the desired spectra. Advantages of satellite imagery are the ability to quickly
survey large areas at a single moment, and then focus in on details with higher spatial resolution images. Training and experience are vitally important to figuring out what surface features might do the trick, and to go right to the most helpful images and techniques. Finally, you now have some idea of the various images available and what each is good for.
There remains an obvious question: how to acquire the expertise. you may have basic RS knowledge and simply need additional information about a particular wavelength range, technique or theory. If targeted specific knowledge is your main need, the best places to go are online tutorials. For a lighter tone and especially for Radar applications, I would recommend the Canada Centre for Remote Sensing tutorials (CCRS, 2010). For more comprehensive information, including some exercises, NASA maintains N. Short’s tutorials (NASA, 2010). With some practical experience and just these (and a lot of time and work!), it would be possible to become an accomplished user of RS.
For textbooks, here are a few suggestions to start you off. I have already mentioned
Pobst (2001) and Sabins (2007), especially for geology and theory related to RS of geological materials. Commonly used university texts include Lillesand et al. (2004), Campbell (2008), and J.R. Jensen (2004). Lillesand is an all-purpose text including manual image interpretation and photogrammetry. Campbell is more quantitative and engineering oriented. Jensen focuses on image interpretation and project development. For more advanced and detailed information, check publications from the American Society for Photogrammetry and Remote Sensing (ASPRS, 2009). Rencz (1999) is a comprehensive ASPRS text relating specifically to geology. A quick search of online bookstores by topic will yield many more specialized texts. Finally, there is an online spectral library showing nearly 2,400 laboratory spectra, mostly of rocks and minerals (CIT, 1999). It got its start in developing RS procedures for mapping Mars’ surface.
you can’t really understand RS without doing some hands-on work. This means software. If all you want is to look at are images, obtain them in .tif format for single bands and .jpg for three-band colour (Continued on page 24...)
combinations. Most are available this way. Any web browser or photo viewer should be adequate, although files may be larger than these viewers are accustomed to. If you are a digital photography aficionado, you can open individual band files or multipleband files and visually enhance them within popular photo-preparation software. While they may have some quantitative capacity, they were not designed for image analysis, especially dealing with more than three colour bands or classification.
There is some software for which image processing is a “sideline.” They are not as versatile as full-blown image software, but if you have access and skill in them, they would be the way to go. Surveying or drafting programs (CAD) are one example. Many offices, even k-12 classrooms, have GIS software. These products are mainly designed to handle vector data. Although they do perform many raster functions, finding what you want beyond visualization is difficult if you are not already an expert. There are also various freeware products, but in my experience most of them are not stable and usually lack the ability to do more than basic manipulation.
Looking at the specialized software, I will mention the most common, and comment from my own experience. Things are constantly being improved. Any one of these will provide all the functionality most users could want, but they are expensive and highly complex, and may not be best adapted to a self-taught newcomer! On the advantage side, there are low-cost versions for students enrolled in courses. One or more is usually available at any lab, school, or company that regularly deals with imagery.
On the inexpensive end, Idrisi (Clark Labs, 2010) is less than $1,500 and is aimed mainly at raster GIS and environmental modelling, but has complete image analysis capacities. It has recently incorporated object-based analysis (segmentation) in its Taiga release.
There are three major multi-purpose RS software products. One company is ERDAS, which produces Imagine and ERMapper (ERDAS, 2010). The latter is developed with geological applications in mind. The second is PCI Geomatica (PCI, 2010). As a Canadian company, PCI was among the first to develop tools specifically
for Radar and maintains this advantage. The third, used especially for hyperspectral imagery (images with dozens to hundreds of wavelength bands) and for automating complex repeated processes is ENVI (ENVI, 2010).
To learn more systematically about RS, you need a course. Sometimes you find RS in Geography or Earth Science (usually with an applications emphasis) and sometimes in Engineering (usually with an algorithm or sensor design emphasis). At an undergraduate level, some universities will have separate RS courses, but the introductory levels are often lumped in with other quantitative techniques, such as GIS or cartography. There are some programs, like our course-based Master’s of GIS at the University of Calgary (plug!), which include intensive introductory graduate-level RS courses. We are planning to offer the RS course online starting next year. There are also online courses offered by universities in the US or in Europe: one source of information is http://www. spatialhydrology.com/coursesonline.html.
you can pick up good RS skills at many technical schools at the college level. In
Our client, an internationally renowned provider of integrated exploration and development geoscience consulting services, requires the expertise and guidance of two seasoned petroleum geoscientists to join the Firm. Consulting to a variety of client organizations with exciting and innovative exploration and development projects within Canada and around the globe, you will apply your technical expertise in the hands-on, pivotal leadership roles of
Suite 225
404 – 6th Ave S W
Calgary, Alberta
T2P 0R9
P: 403-266-8800
Email: rob@rjderkitt associates com
The Chief Geologist will be technically proficient and familiar with basin assessment, risk management and play and prospect development techniques. Ideally, your background will include a broad range of geoscience expertise including hydrocarbon systems analysis, sequence stratigraphy, seismic interpretation, geochemistr y, reservoir characterization, proficiency with workstations and familiarity with a host of exploration and economic analysis software packages The Chief Geophysicist will have the structural and stratigraphic mapping skills combined with a proficiency in utilizing log and petrophysical data in order to assess the quality, risks and potential of prospects Additionally, you will be proficient with the latest technology such as modeling tools, workstations and exploration software including a range of geophysical techniques (2D, 3D & 4D seismic, gravity and magnetics, remote sensing) and their integration into accurate geologic interpretations.
A professional Geologist or Geophysicist with 20 or more years of successful exploration experience augmented with post-graduate training, both Chiefs will demonstrate a keen interest in developing, conducting and managing complex technical projects that could include: regional exploration analyses; exploration prospect generation; basin analysis; development planning; property evaluations; reser ves determinations; and, operations support Your welldeveloped interpersonal and communication skills coupled with strong organizational and project management abilities and an extensive network of contacts from within the industr y and throughout the regulator y, consulting and academic sectors will allow you to contribute to and provide your expertise and opinion on a multitude of ongoing client projects. Possessing a pleasant, enthusiastic and mature personality, the ideal candidates will be recognized as being the ultimate “ mentors ” through their ability to share and encourage new ideas and concepts through the presentation of seminars and project studies, all with the goal of optimizing the potential of the Firm’s geotechnical capabilities in meeting its client’s goals of developing new reser ves
Interested candidates, confident of their ability to successfully apply their expertise within one of Canada’s premiere consulting firms in either of these leadership positions, are encouraged to respond in complete confidence by email to rob@rjderkittassociates com
general, university courses will teach you a lot more theory, preparing you to make independent decisions. College courses will be heavier on software practicalities. The basics will certainly be there in either case.
I hope that these articles have been useful in clearing up some misconceptions, and giving you an idea of the many applications of RS. Thanks to everyone who has sent me suggestions. Anyone who has further questions, would like information about our MGIS program at the University of Calgary, or would just like to chat about the subject, is welcome to contact me at mhallbey@ ucalgary.ca.
American Society for Photogrammetry and Remote Sensing (ASPRS). 2009. Publications Catalogue. http://www.asprs.org/ publications/2009PubsCatalog.pdf. Accessed 2010-01-20.
Campbell, J.B. 2008. Introduction to Remote Sensing. 4th ed. The Guilford Press.
Canadian Centre for Remote Sensing (CCRS). tutorials http://www.ccrs.nrcan.gc.ca/resource/ tutor/fundam/index_e.php. Accessed 2010-01-20.
Clark Labs. 2010. Meeting the challenges of environmental decision-making with GIS. http:// www.clarklabs.org/index.cfm. Accessed 201001-20.
California Institute of Technology (CIT), Jet Propulsion Laboratory. 1999. The ASTER Spectral Library v. 2.0. http://speclib.jpl.nasa. gov/. Accessed 2010-01-22.
Environment for Visualizing Images (ENVI). 2010. http://www.ittvis.com/ProductServices / ENVI.aspx. Accessed 2010-01-20.
Earth Resource Data Analysis System (ERDAS). 2010. Products. http://www.erdas.com/ Products/tabid/56/Default.aspx. Accessed 2010-01-20.
Hay, G. and Castilla, G. 2008. Geographic Object-Based Image Analysis (GEOBIA): A new name for a new discipline. In: Th. Blaschke, S. Lang, and G. Hay (eds.). Object-Based Image Analysis: Spatial Concepts for Knowledge-Driven Remote Sensing Applications. Springer. p. 75-89.
International Charter (Space and Major Disasters). 2010. About the charter. http:// www.disasterscharter.org/web/charter/about. Accessed 2010-01-19.
Jensen, J. R. 2004. Introductory Digital Image Processing. 3rd Edition. Prentice Hall.
Lillesand, T.M., Kiefer, R.W., and Chipman, J.W. 2004. Remote Sensing and Image Interpretation. 5th Ed. John Wiley and Sons.
National Aeronautics and Space Administration (NASA). 2010. Dr. Nicholas Short’s Remote Sensing Tutorials. http://rst.gsfc.nasa.gov/. Accessed 2010-01-20.
PCI Geomatics 2010. http://www.pcigeomatics. com/. Accessed 2010-01-20.
Pobst, G. 2001. Remote Sensing for Geologists: A Guide to Image Interpretation. Taylor and Francis, 2001.
Rencz, A.B. 1999. Remote Sensing for the Earth Sciences. Volume 3 of Manual of Remote Sensing. John Wiley and Sons.
Sabins, F.F. 2007. Remote Sensing: Principles and Interpretation. 3rd Ed.
Yue, Z., Liu, J.Z. and Wu, G.G. 2008. Automated detection of lunar craters based on objectoriented approach. Chinese Science Bulletin. v. 53, no. 23, p. 3699-3704.
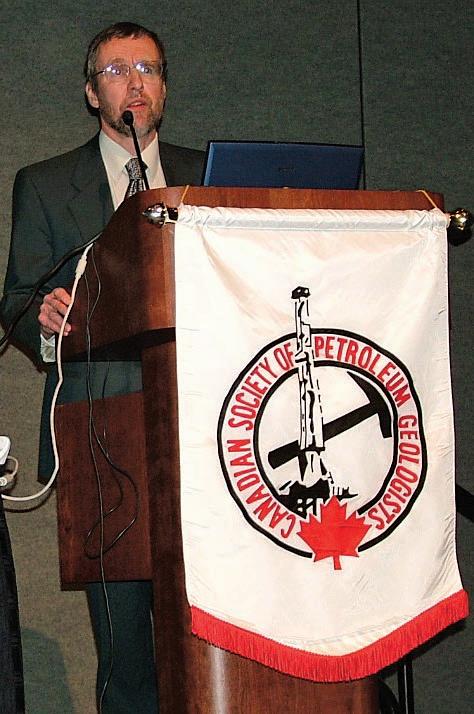
CSPG would like to thank Dave Russum, Vice President Geoscience of AJM Petroleum Consultants, for the Technical Luncheon presentation he delivered Thursday, January 21, 2010, entitled “Unconventional Gas Reservoirs: How Important are they to North America?”
| by Colin Yeo, P.Geol. and Lionel Derochie, P.Eng.
Divisionofinterestsandroyalties receivedandpaidareenteredonthis inputsheetinValueNavigator
ByselectingAlberta,Crownand2009,Albertaroyaltieswillbecalculated,net ofgascostallowance,anddeductedfromtherevenuestream
Workinginterestinthe revenuestreamandcosts
Royaltyincomefrom varioussources
Royaltiespayabletoothers (butnottotheCrown)
Variousdrillingincentives maybeselectedherefor royaltyadjustmentsor credits
Figure 1. Value Navigator’s royalty input screen captures provincial or federal tax regimes, ownership in the revenue stream, ownership of the capital and operating costs, royalties received, royalties paid, and incentives applicable to the well.
In the last installment, we addressed capital and operating costs. Three additional types of costs may be encountered during oil and gas production, namely royalties paid to the resource owner, royalties paid contractually to others, and taxes paid on income to provincial and federal governments.
In western Canada, provincial governments (representing the Crown), first nations, individuals, and companies may own title to the subsurface minerals, including oil and gas, and have the right to extract and sell them. Exploring for and developing oil and gas reserves requires significant capital and is not without risk of failure. It also requires technical expertise so most resource owners are unable or unwilling to engage in development activities directly but, because they recognize the potential value of their resource, they encourage industry to conduct operations on their title lands.
To develop their resources, mineral owners lease their rights to industry and, in return, receive a portion of the resulting production or revenue stream. The most common method of obtaining mineral rights leases is to purchase them at a Crown land sale where a company or individual competitively bids for the right to obtain a lease offered by a province. Sealed cash bids are submitted on a specific date and the highest bidder, not necessarily the company or individual that requested the mineral rights posting, wins a lease for the Crown’s mineral rights. The cash bid (also called a bonus) is not a royalty and
when economically evaluating a prospect, the bonus is considered an up-front capital cost like seismic or drilling. If drilling is successful, a predetermined royalty rate, payable to the Crown, is applied to the production stream.
First Nations mineral rights are auctioned in a similar manner to Crown sales. Individuals and companies that own mineral rights, through historic land grants from the Crown or through purchase from previous owners, often issue leases to other companies. An initial bonus payment is made to the owner and a royalty rate is negotiated between the parties at the outset. The rate can vary between owners and may change over time due to changing economic conditions. Even provinces have been known to vary royalty rates arbitrarily, making it difficult to forecast a cash-flow stream with any certainty.
Mineral ownership sets up divisions of interest. The mineral owner who only takes a royalty is said to have a royalty interest in the production stream. The mineral owner may take the product in kind but more likely will take a percentage of the revenue generated through sales. Another type of royalty interest is an overriding royalty paid to an existing lessee who has taken a lease from a mineral owner or who entered into some contractual agreement with a new lessee. Such royalties are often termed a “GORR” (Gross Over-riding Royalty) and must be applied as a deduction to the gross revenue. The lessee and its partners who invest capital in the prospect are said to
have a working interest ownership in the resulting production. Usually their share is proportionate to their investment although sometimes a capital investment may be disproportionately higher for one partner in order for that party to gain late entry into an evolving play.
When evaluating an opportunity, it is very important to identify and quantify all encumbrances and working interest parties and their respective takes on production or revenue. Evaluation software, like Value Navigator, will calculate Crown and First Nations royalties and provides the flexibility to manually enter unique freehold lessor royalties and GORRs. Figure 1 shows Value Navigator’s royalty input panels.
Royalties are an important component of a provincial government’s revenue stream, especially in a resource-intensive economy such as that in western Canada. Royalties provide the necessary funds for social programs and infrastructure for the residents of the province. Provincial governments take care to balance the rights of its citizens to the resource wealth they own with the need of industry to achieve a reasonable rate of return on its invested risk capital as it develops the resource. Royalty rates are generally set using a sliding scale that is a function of both commodity price and well productivity. In some instances, rates have been adjusted to compete with those levied in other jurisdictions since capital will always flow to places where the rate of return is maximized.
Using Alberta as an example, we will see how these various factors play out. As mentioned, conventional oil royalties are a function of oil price and well productivity. Figure 2 is a graph of conventional oil royalties as a function of oil price and oil well production. As shown, royalty rates never exceed 50%. At $80 per barrel, the royalty rate reaches its maximum when well production meets or exceeds 130 barrels of oil per day (bopd). At the same production rate, but with an oil price of $30, royalty
a function of price and well productivity. The depth factor (DF) is 4. Compare Figure 4 with Figure 3 to see the difference in royalty rates between smaller and larger depth factors.
rates are about 27%. Conversely, an oil well producing 60 bopd will pay a maximum royalty of 50% if the oil price is $120 per barrel or more.
As shown in figures 3 and 4, gas well royalty rates are a function of price, well productivity, and a depth factor. The depth factor ranges between 1 and 4 and is calculated using the measured depth of the well. All other things being equal, depth factors are used to reduce royalties for deep
gas wells and include long-leg and multilateral horizontal gas wells in recognition of the increased risk capital associated with drilling and completing these wells. A depth factor of 1 applies to all wells that have a measured depth less than or equal to 2,000 m and a depth factor of 4 applies to all wells that have a measured depth greater than or equal to 4,000 m. Wells with measured depths between 2,000 and 4,000 m will have a depth factor somewhere between 1 and 4.
As shown in figure 3 for example, at a depth factor of 1, gas well royalties reach a maximum rate of 37% for a gas price of $6 per Mcf at a well rate of 600 Mcf/d. In comparison, at $18 per Mcf, the royalty rate will hit a maximum rate of 50% at well rate of 300 Mcf/d. At this same well rate of 300 Mcf/d, the royalty rate is only 25% for a gas price of $6 per Mcf.
As shown in Figure 4, a gas well with a depth factor of 4 will see royalties reach a maximum rate of 37% for a gas price of $6 per Mcf at a well rate of 2,300 Mcf/d. At a price of $18 per Mcf, the royalty rate hits a maximum of 50% at a well rate of 1,300 Mcf/d.
At $6 per Mcf, a gas well producing at 300 Mcf/d with a depth factor of 4 will hit the minimum royalty rate of 5%. At $18 per Mcf, the royalty rate will be 22% for a gas well with a depth factor of 4 producing at this same rate of 300 Mcf/d.
Natural gas liquids are levied a fixed royalty; butane and propane at 30%, and pentane plus at 40%.
Oil sand production is charged a sliding scale royalty rate of between 1% and 9% if the producer has not yet reached payout on the project and 25% to 40% if payout has been
achieved. The royalty range is a function of West Texas Intermediate prices between $55 and $120 per barrel.
It is very important to determine if the well being analyzed qualifies for one or more of the many incentive programs offered by the provinces because this will significantly boost the economic attributes of the prospect. There are several programs that can reduce royalties through exploration and application of innovative technology that results in incremental oil and gas production. In Alberta, for example, the Deep Exploratory Oil Well Program provides royalty relief on the first 12 months of production up to one million dollars for the first exploratory well in a pool. This program levies reduced royalties on oil production from new, deeper producing zones that are encountered below 2,000 m TVD. The Natural Gas Deep Drilling Program provides a royalty credit for gas wells that have a producing interval that is deeper than 2,500 m TVD. This royalty credit is in addition to the royalty relief already provided through depth factor adjustments. The Innovative Energy Technology Program provides for royalty adjustments on oil and gas production through increased recovery using new technologies. Alberta has also maintained the Enhanced Oil Recovery Royalty program that provides royalty incentives for
the implementation of enhanced oil recovery schemes such a hydrocarbon or CO2 Miscible Floods as well as Alkali-Surfactant-Polymer (ASP) Floods to mention a few.
As a result of the economic downturn, Alberta launched two new incentive programs. The first is the Drilling Royalty Credit program that provides for a $200 per meter drilled royalty credit and the second is the New Well Royalty Reduction Program that caps the royalty at a maximum 5% on the first 50,000 barrels of oil or 500 MMcf of gas production within the first 12 months. Together, these programs encourage new drilling and new production that spurs economic activity while generating royalty revenue for the Province.
Although the focus of this discussion has been on Alberta’s royalty regime, the other provinces and territories have similar royalty charges and incentive programs customized to the jurisdiction. For reference, Figure 5 shows royalty rates as a function of price and productivity in British Columbia and Saskatchewan. Figure 6 compares oil and gas royalties between all three provinces.
Gas cost allowance (GCA) is a deduction to gross royalties on gas wells that compensate the producer for gathering,
and processing the Crown’s share of natural gas and natural gas liquids. There is a comprehensive listing of allowable costs that can be charged to the Crown based on gas composition and geographical location.
If a producer owns a gas plant, a capital cost allowance, custom processing adjustment factor, and operating cost allowance can be charged to the Crown. If the producer is a user of a third-party gas plant, then a custom processing cost allowance may be charged. This gas cost allowance is an off-set to the royalties payable to the Crown.
So far, we have considered most of the elements comprising a cash-flow stream. There is one other consideration we must take into account, namely provincial and federal taxes payable on taxable income. Taxable income is the amount that remains after all eligible deductible expenses have been deducted from the gross revenue. As we have discussed, revenue is derived from oil and gas sales, natural gas processing income, royalty interest income, and freehold income. These income streams are all fully taxable.
Only a portion of capital costs is allowed to be deducted in any particular tax year. you will
recall from the previous discussion on capital costs that investments are assigned to various tax categories: COGPE (mineral land and reserves), CEE (exploration expense), CDE (development expense), and CCA (capital cost allowance) on tangible assets such as gas plants and pipelines. There are specific rules as to how much capital in each category can be written off against income. For example, COGPE is written off at a rate of 10% declining balance while 100% of CEE capital can be written off in one year. Taxable income, calculated by subtracting all deductions from revenue, is multiplied by the corresponding federal and provincial tax rates.
A Freehold Mineral Tax is applied to all production from freehold leases and is payable to the province. It is based on production volumes from the lease. This tax, which is really a form of provincial royalty, is deductible from revenue in calculating taxable income.
We are now able to calculate an annual cash flow stream before and after deducting income taxes. By discounting both the before and after tax annual cash flows and summing them, before tax and after tax net present values can be derived.
This discussion on royalties and taxes has been deliberately kept at a high level. For specific details and calculations, the reader is directed to the following official government websites:
• Alberta: www.energy.gov.ab.ca/About_us/1293.asp
• British Columbia: www.em.gov.bc.ca/subwebs/ resourcerev/royataxs/handbook/default.htm
• Saskatchewan: www.ir.gov.sk.ca/oilgasroyaltytax
Economic evaluation software is adept at keeping track of changing royalty rates as production and price vary, incentive programs are applied and federal, provincial and mineral taxes are deducted. however, the evaluator must ensure that critical well information is correct and that eligible incentive programs are identified. Evaluators should perform quick checks on royalties shown in the summary output to ensure they are reasonable and correct.
Support for this series is provided by Energy Navigator who have reviewed articles, supplied technical consultation, and critiqued manuscripts. We thank them for their help.

Job Description
1. Work with Senior Oil & Gas nancial analysts on speci c company related drilling programs.
2. Detailed analysis of emerging plays and evaluation of comparative economics.
3. Frequent presentations at the rm’s Sales and Trading meetings.
• The candidate should have a B.Sc. in Geology or Engineering with a minimum of ve years of experience in the oil and gas industry. International E&P experience would also be an asset.
• A solid understanding of geology and/or reservoir engineering, including knowledge of WCSB stratigraphy and trapping mechanisms for a variety of reservoir types, as well as reservoir performance characteristics.
• A familiarity with seismic data interpretation would be an asset.
• The candidate must have a high degree of familiarity with GeoScout or a similar search/mapping program.
• Highly competent with respect to economic analysis.
• Good oral and written communication skills required.
• Membership in APEGGA is required.
Compensation will initially be a guaranteed salary with benets, at an above-average level for relative age and experience. After a probationary period, this person will par ticipate in a discretionary performance-based bonus program.
ASAP


Attention: Trudy Lui Applications (no phone calls please)
Peters & Co. Limited 2300 Jamieson Place 308 Fourth Avenue S.W. Calgary, Alberta


Location Calgary, Alberta

Please email résumés to: hr@petersco.com
| By Markus Ebner and Sandra Rosenthal
It was the start of the winter semester for geoscience students when they took a break from their classes to attend the 2010 Western Inter-University Geological Conference (WIUGC) January 7 – 9, 2010. This year’s conference was in Saskatoon, hosted by the University of Saskatchewan’s Ore Gangue. The students at the University of Saskatchewan on the WIUGC organizing committee are commended on a well organized and professionally run conference.
A joint CSPG-CSEG University Outreach contingent consisting of Markus Ebner, Sandra Rosenthal, Stephen kotkas, and Lori Barth attended to raise the profile of our respective societies, and to encourage students to consider a career in petroleum geoscience. The CSPG/CSEG booths were a big draw for students who were curious about careers in petroleum exploration and development, opportunities for research, and simply about living and working in Calgary. Between our outreach programs, a total of $2,900 in prizes and sponsorship monies was donated to this year’s WIUGC.
Congratulations to all delegates who presented their research, and especially to the following award winners:
Best Undergraduate Sedimentology Presentation (CSPG Award) and Best Undergraduate Presentation: Matthew W. Demski, University of Manitoba, “The Ordovician-Silurian Boundary in the Williston Basin Outcrop Belt of Central Manitoba: New Data and Reinterpretations.”
Best Graduate Sedimentology Presentation (CSPG Award): Greg Baniak, University of Alberta, “Facies Characteristics and Depositional Models for highly Bioturbated Siliclastic Strata: an example from the Upper Jurassic Ula Formation, Norwegian North Sea.”
Best Geophysical Presentation (CSEG award): Cassandra Tycholiz, University of Manitoba, “Geoelectric Response of the Crust and Upper Mantle, Lake Nipigon, Ontario.”
Best Undergraduate Poster (tie): Adam Larsen, University of Saskatchewan, “The Making of a Geologic Boulder Map of the University of Saskatchewan Campus” and Aisyah Abdkahar, University of Manitoba, “Pb-Pb isotope signature of the Flin Flon paleosols: Implications for oxidative weathering at ~1.85 Ga.”
Our client, a successful E&P Company with significant production and land holdings throughout South America, is seeking an energetic and experienced geologist to join its Exploration team as
P: 403-266-8800
Email: rob@rjderkitt associates com
Working closely with the VP Exploration and a multi-disciplinary exploration team, the Senior Geologist will take a proactive, hands-on leadership role with: the exploration for oil; the exploitation of the company ’ s operated reservoirs; the development of bitumen resources; and, the development of new exploration targets in other South American Basins
A professional Geologist with at least ten years of combined clastic and carbonate depositional systems experience, the ideal candidate will be recognized for their creative and innovative generation of prospects, which have led to hydrocarbon discoveries within the complex reservoirs and formations found within fold and thrust belt and foreland basin environments Technically proficient with the integration of seismic and geological data in addition to conducting log analysis and DST evaluations, the Geologist will possess a working expertise with a variety of geological software packages (Petra) and geophysical interpretation concepts and be cognizant of all of the engineering issues associated with a prospect ’ s viability Possessing well-developed communication, negotiation and presentation skills, you will demonstrate the organizational and prioritization abilities required to analyze and evaluate the large number of exploration and acquisition prospects in a timely and confidential manner Flexible, open-minded and possessing cultural sensitivity, you will display a mature, enthusiastic and participative work outlook in the achievement of your team ’ s goals and objectives by generating viable new exploration prospects in addition to supporting an aggressive development drilling program Given the international makeup of the Exploration team, preference will be given to those candidates with a good working knowledge of Spanish As the successful candidate, you can expect a moderate amount of travel to the Company’s South American office and other international locations as required Interested candidates are encouraged to respond in complete confidence to Rob Derkitt
Best Graduate Poster: Andrew kingston, University of Saskatchewan, “high-resolution stable-isotope profiles from bivalves: a proxy for the seasonal timing of tsunami events.”
Best Graduate Presentation: Andrew k ingston, University of Saskatchewan, “Oxygen-isotope records from archaeological bivalves as a proxy for holocene climate change on the coast of British Columbia.”
CSPG continues to provide support for our future geoscientists, and we encourage all CSPG/CSEG affiliated companies who plan on employing students and new hires, or who simply want to raise their profile, to attend future WIUGC conferences.
By: Tyler Tolton-Ropchan and Rae Keim
On behalf the 46th annual WIUGC planning committee, I would like to thank all of the delegates and sponsors for making this year’s event a success. This year we had more than 120 delegates from universities across western Canada: University of Alberta, Brandon University, University of British Columbia, University of Manitoba, University of Northern British Columbia, University of Regina and of course the University of Saskatchewan.
SPONSORS
Title Sponsor: Areva Resources Canada; Eclogite Sponsorship Level: Cameco Corporation, Association of Professional Engineers & Geoscientists of Saskatchewan, The Ore Ganugue Alumni, and Natural Sciences & Engineering Research Council of Canada; Granulite Sponsorship Level: Canadian Society of Petroleum Geologists, Canadian Society of Exploration Geophysicists, University of Saskatchewan: Department of Geological Sciences, and Claude Resources; Greenschist Sponsorship Level: Sigma Exploration Inc., Trident Exploration Corp., D. M. kent Consulting Geologist Ltd., North Rim Exploration Ltd., and Canadian Institute of Mining, Metallurgy, and Petroleum; Tour Sponsors: PCS -Cory and ShoreGold.
We would like to give a special thanks to those who participated in judging our technical presentations and posters. Thank you Lori Barth, Sandra Rosenthal, Markus Ebner, kevin Ansdell (Current U of S Geological Sciences Department head), and Mel Stauffer (Professor Emeritis U of S). We would also like to thank our keynote speakers: luncheon speaker, Vincent Martin, CEO of Areva Resources Canada, and banquet speaker, Mel Stauffer.
The WIUGC planning committee wishes Brandon University the best of luck planning the 47th annual WIUGC. We will see you in January 2011.
GeoCanada 2010 will offer two Industry Luncheon presentations. If you are interested in learning more about the speakers or buying tickets to either of these events, visit http://www.geocanada2010. ca/. New this year: reserve a table at either luncheon. Contact Tanya at (403) 513-1226 to learn more!
On November 1, 2006 Ray and two other runners set out on an epic expedition to cross the Sahara Desert by foot. One hundred and eleven days after leaving the coast of Senegal they made history by dipping their toes into the Red Sea and raising the bar of all that we consider possible. The epic expedition had the trio running an average of 70km a day, without a single day of rest. National Geographic tracked this epic expedition by web, and the documentary film “Running the Sahara” – narrated and produced by Matt Damon – will raise awareness for the drinking water situation in northern Africa.

On January 7, 2009 Ray and two other Canadians broke the world speed record for unsupported expedition from h ercules Inlet to the South Pole. In the process, Ray became the first person to trek to the South Pole on this traditional 1,130 km route solely on foot using snowshoes.
Ray will speak Monday, May 10, 2010 at GeoCanada 2010.

Brent Butt is one of the top comedians working today. he has performed his standup show to sold-out audiences across this country. h e is also the creator, head writer, and star of the CTV smash hit television show Corner Gas.
Brent will speak Wednesday, May 12, 2010 at GeoCanada 2010.
See below for the exciting list of GeoCanada 2010 Short Courses. Please note that you must be registered as a full Convention delegate in order to register for any of the short courses listed below. Registration opens March 1 at http://www.geocanada2010.ca/.
Basic Petroleum Economics
Instructor: Dave Volek
Date: May 3, 2010
Cost: $500
Max. Attendance: 14
Shale Gas Critical Fundamentals, Techniques and Tools for Exploration Analysis
Instructor: Basim Faraj
Date: May 3, 2010
Cost: $675
Max. Attendance: 30
Acoustics
Presenters: John Walsh, Doug Patterson
Date: May 3, 2010
Cost: $500
Max. Attendance: 30
Editing Logs for Geophysical Purposes
Presenter: Ross Crain
Date: May 3, 2010
Cost: $500
Max. Attendance: 30
Facies and Depositional Environments in Core
Instructor: Bill Arnott
Dates: May 3 – May 5, 2010
Cost: $1,350
Max. Attendance: 20
Carbonate Petrophysics
Presenter: Gene Ballay
Dates: May 3 – 5, 2010
Cost: $1,000
Max. Attendance: 30
Using Ancient Logs to Find By-Passed Pay
Presenter: Ross Crain
Date: May 4, 2010
Cost: $500
Max. Attendance: 30
Borehole Geophysics: Theory and Practice
Instructor: Ronald C. Hinds and Richard D. Kuzmiski
Dates: May 4 – 5, 2010
Cost: $800
Max. Attendance: 20
Geosteering (Logging While Drilling)
Presenter: Sue Bruce
Date: May 5, 2010
Cost: $500
Max. Attendance: 30
Sequence Stratigraphy:
Principles and Applications
Instructor: Octavian Catuneanu
Dates: May 5 – May 7, 2010
Cost: $975
Max. Attendance: 25
Borehole Imaging
Presenters: Grant Sha, Paul Elliott, Carlos de Silva
Date: May 6, 2010
Cost: $500
Max. Attendance: 30
Shale Gas Petrophysics: Using Clustering and Mineral-Based Interpretation: The Easy Way
Presenter: Bob Everett
Date: May 6, 2010
Cost: $500
Max. Attendance: 30
Risk and Uncertainty Analysis for the Assessment of Unconventional Resource Plays
Instructor: Gary Citron or Bob Turner
Date: May 6, 2010
Cost: $675
Max. Attendance: 25
Practical Sequence Stratigraphy: Concepts and Applications
Instructor: Ashton Embry
Dates: May 6 and May 7, 2010
Cost: $725
Max. Attendance: 25
An Introduction to Petroleum Geostatistics
Instructor: Clayton Deutsch
Dates: May 6 – May 7, 2010
Cost: $825
Max. Attendance: 25
Seismic Attributes for Prospect Identification and Reservoir Characterization
Instructor: Satinder Chopra
Dates: May 6 – 7, 2010
Cost: $800
Max. Attendance: 20
Planning Land 3-D Seismic Surveys
Instructor: Andreas Cordsen
Dates: May 6 – 7, 2010
Cost: $800
Max. Attendance: 20
Microseismic
Presenter: TBA
Date: May 7, 2010
Cost: $500
Max. Attendance: 30
Unconventional (By-Passed) Pay
Presenter: Brian Stambaugh
Date: May 7, 2010 (AM)
Cost: $250
Max. Attendance: 30
NMR Logging Methods
Presenter: Brian Stambaugh
Date: May 7, 2010 (PM)
Cost: $250
Max. Attendance: 30
Fault-Controlled Hydrothermal Dolomite-Leached Limestone Exploration Play
Instructor: Jack Wendte and Graham Davies
Date: May 7, 2010
Cost: $500
Max. Attendance: 20
Theriak-Domino: A Fast, Automatic, and Easy-To-Use Phase Diagram Calculator Based on Free Energy Minimization
Instructor: Christian de Capitani
Dates: May 8 – 9, 2010
Cost: $300 Delegate, $100 Student
Max. Attendance: 30
Concepts, Models, and Case Studies of Dolomitization – with Applications to Hydrocarbon Exploration and Development
Instructors: Hans Machel and Jay Gregg
Dates: May 11 – 12, 2009
Cost: $1200
Max. Attendance: 20
Integrated Basin and Play Analysis
Instructor: Bob Stewart
Cost: $20 per student (student only course)
Dates: May 13 – 14, 2010
Max. Attendance: 30 students
Microseismic Boot Camp
Instructor: Shawn Maxwell
Date: May 14, 2010
Cost: $400
Max. Attendance: 20
Kimberlites and Related Rocks in the Western Canada Sedimentary Basin
Instructors: Roy Eccles and George Read
Date: May 15, 2010
Cost: $300 Delegate, $100 Student
Max. Attendance: TBA
Geomechanical Aspects of Carbon Sequestration and CO 2 Enhanced Oil Recovery
Instructor: Pat McLellan and Chris Hawkes
Date: May 17, 2009
Cost: $500
Max. Attendance: 25
Design, Processing, and Interpretation of Magnetic, Gravity, and Electrical Methods in Hydrocarbon Exploration and Development
Instructor: Ted Glenn
Dates: May 17 – 18, 2010
Cost: $800
Max Attendance: 20
Canada Rocks: The Geologic History of Canada’s Sedimentary Basins
Instructor: Andrew Miall
Dates: May 17 – 18, 2010
Cost: $850
Max. Attendance: 25
Seismic Interpretation of Structural Styles
Instructor: Mark Cooper and Marian Warren
Dates: May 17 – 21, 2010
Cost: $2,250
Max. Attendance: 25
Memory Techniques
Instructor: Bruce Lee
Date: May 18, 2010
Cost: $395
Max. Attendance: 25
The Geology of Sandstone Reservoirs
Instructor: Godfried Wasser
Dates: May 18 – 21, 2010
Cost: $1,300
Max. Attendance: 15
Sequence stratigraphy: A Practical Understanding of Basinal Controls in Mapping and Exploration
Instructor: Andrew Miall
Dates: May 19 – 20, 2010
Cost: $850
Max. Attendance: 25
Structural Styles and Interpretation Techniques in Fold-Thrust Belts
Instructor: Shankar Mitra
Dates: May 19 – 21, 2010
Cost: $1,350
Max. Attendance: 25
The Stratigraphic Setting of Lower and Middle Triassic Strata, Western Canada Sedimentary Basin
Instructor: Jim Dixon
Date: May 21, 2009 (AM)
Cost: $375
Max. Attendance: 20
APEGGA supports the vision and directions established in Alberta’s Provincial Energy Strategy — 2008, and will work with the government plus provincial departments and agencies to meet the many technical challenges of implementing the strategy. Representing professionals, APEGGA will contribute to public dialogue and, when requested, will nominate expert, nonpartisan Members to serve on high level code bodies, advisory agencies and governance boards. APEGGA will also inform and encourage Members to implement progressive best practices with respect to clean energy production and wise energy use.
For more information visit www.apegga.org.
See below for the exciting list of GeoCanada 2010 Field Trips. Please note that you must be registered as a full Convention delegate in order to register for any of the field trips listed below. Registration opens March 1 at http://www.geocanada2010.ca/.
Siliciclastic Depositional Systems in the Cretaceous Book Cliffs Utah – Colorado: Applications to the Subsurface
Leader: Simon Pattison
Date: May 3 – 7, 2010
Cost: $2,300
Max. Attendance: 14
Trip begins and ends in Grand Junction CO.
Airfare not included
Structures and Hydrocarbons in the “Undeformed” Southern Plains
Leader: Marian Warren
Dates: May 4 – 5, 2010
Cost: $650
Max. Attendance: 19
Geoscience of Saskatchewan Potash Deposits
Leader: Jason Berenyi and Chao Yang
Dates: May 5 – 6, 2010
Cost: $660
Max. Attendance: 16
Trip attendees will need to arrange travel to and from Saskatchewan
Geological Walking Tour – The Building Rocks of Calgary Leader: Bill Ayrton
Date: May 6, 2010 (PM)
Cost: $150
Max. Attendance: 30
Fluvial Architecture and Reservoir Considerations of Anastomosed and Meander River Deposits (Lower Tertiary Porcupine Hills and Upper Cretaceous Dinosaur Park Formations), Southern Alberta
Leaders: Derald Smith and Peter Putnam
Dates: May 6 – 7, 2010
Cost: $750
Max. Attendance: 20
Shales and Sandstones of the Upper Cretaceous in the Southern Alberta Foothills
Leaders: Per Kent Pedersen and Karsten Nielsen
Date: May 7 – 8, 2010
Cost: $700
Max. Attendance: 25
The Hydrogeology of Southwestern Alberta: Where the Prairies Meet the Mountains
Leader: Jamie Freeman and Bill Wilmot
Dates: May 8 – 9, 2010
Cost: $700
Max. Attendance: TBA
Glaciation and Climate Change in the Canadian Rockies
Leader: Dr. Nat Rutter
Dates: May 8 – 9, 2010
Cost: $425
Max. Attendance: TBA
Thermal and Mineral Springs of the Canadian Rockies
Instructor: Stephen Grasby
Dates: May 9, 2010
Cost: $140
Max. Attendance: TBA
Barrovian and Buchan Metamorphism and their Tectonic Juxtaposition, Southeastern British Columbia
Leaders: David R.M. Pattison, David P. Moynihan, and Christopher R.M. McFarlane
Dates: May 13 – 16, 2010
Cost: $575
Max. Attendance: 20
City of Calgary Wastewater Treatment – Pine Creek Facility
Instructor: Domi Diaz
Dates: May 14, 2010
Cost: $50
Max. Attendance: TBA
Contrasting the Reservoirs of Braided vs. Meandering Depositional Systems Leader: Jon Noad
Dates: May 14 – 15, 2010
Cost: $525
Max. Attendance: 13
Turtle Mountain (Crowsnest Pass) Structure trip “The Rise and Fall of Turtle Mountain”
Leaders: Willem Langenberg and Tim Hartel
Dates: May 14 (pm) – 15, 2010
Cost: $350
Max. Attendance: 25
A Revised Regional Stratigraphy and Stratigraphic Architecture for the Horseshoe Canyon Formation: Outcrop and Subsurface Leader: David Eberth
Dates: May 15 – 16, 2010
Cost: $750
Max. Attendance: 35
Analogues for Foothills Oil and Gas Drilling in Low Permeability Carbonates, Moose Mountain
Leaders: Andrew Newson and Deborah Sanderson
Date: Monday, May 17, 2010
Cost: $375
Max. Attendance: 17
From Turner Valley to the Calgary Landslide: Three Ages of Deformation Laramide, Pleistocene and Present Leader: Peter Jones
Date: May 17, 2010
Cost: $375
Max. Attendance: 25
Geology of the Athabasca Oil Sands Leader: Murray Gingras and Mike Ranger
Date: May 17 – 19, 2010
Cost: $2,950
Max. Attendance: 14
The Triassic of Northeastern British Columbia: Sedimentary Characteristics and Stratigraphic Architecture of Conventional and Unconventional Reservoir Successions Leader: John-Paul Zonneveld
Dates: May 17 – 20, 2010
Cost: $3,110
Max. Attendance: 14
Trip begins and ends in Fort St. John. Airfare not included.
Horseshoe Canyon Student Field Trip Leader: Dennis Meloche
Dates: May 18
Cost: $80
Max. Attendance: 35
Virgelle Member at Writing-on-Stone Provincial Park, Southern Alberta: Analogue for a Hydrocarbon Reservoir Leader: Rudi Meyer
Dates: May 18 – 19, 2010
Cost: $550
Max. Attendance: 14
Bakken/Sappington formation along Montana’s Rocky Mountain Front Leader: Ted Doughty
Date: TBA
Cost: TBA
Max. Attendance: TBA
| By Helen Isaac
In May 2010, geoscientists from across Canada will gather in Calgary, Alberta for a once-in-a-decade opportunity to share experiences and knowledge at our annual joint convention GeoCanada 2010. As part of this major event, numerous geoscience volunteers are busily organizing Earth Science for Society, a two-day exhibit in the BMO Centre Corral designed to expose junior high school students and the public to the geosciences through a variety of hands-on exhibits. Five themed pavilions with a focus on Earth Science, “Resources and you,” “Energy for Us,” “One Dynamic Earth,” “ your Career?” and “Our Future!,” will give exhibitors the chance to showcase their organizations not only to convention delegates but also to the public and the 2,000 junior high school students we will bring to this event. This is a great opportunity for exhibitors or sponsors to advertise their products or services to the public and to convention delegates.
The objectives of Earth Science for Society are to:
• Expose students and the public to various aspects of Earth Sciences in a fun, educational, and interactive way;
• Inform students about education and career options;
• Demonstrate how Earth Science plays a critical role in our society;
• Make the connection between responsible resource development and the things we use every day.
The exhibits will be open on Monday, May 10 from 9:30 am to 8:30 pm and on Tuesday, May 11 from 9:30 am to 3:30 pm. Admission is free. All delegates are encouraged to bring their family and friends and spread the word to the public.
We are organizing a series of two-hour visits from junior high school students, modeled after the successful k ids in Science Program that was offered for the last several years. As of early January 2010, over 1,800 students have already been signed up by their eager teachers! Volunteer guides will accompany the students around the exhibits, answer their questions and enjoy the company of enthusiastic budding young geoscientists.
We need many guides so please consider offering a few hours of your time to this worthy cause of introducing to young people the rewards of Earth Science that you have enjoyed yourself! To volunteer as a guide please email helen.isaac@ ucalgary.ca
| By Raymond Price
This convocation address was presented June 9, 2009 to students at the University of Calgary graduating from the Faculties of Science and Graduate Studies.
Eminent Chancellor Cuthbertson, President Weingarten, distinguished guests, fellow graduates, ladies and gentlemen, it is a great honour to become part of the distinguished community of individuals who have received degrees from the University of Calgary. I am sincerely grateful for that honour.
It is also a special honour for me to have the opportunity to address the women and men from the Faculties of Science and Graduate Studies, whose scientific expertise and knowledge are about to be formally recognized by the granting of a degree from the University of Calgary. I offer each one of you my sincere congratulations, and my best wishes as you set out to apply your talents in our rapidly changing world.
In my address this afternoon, I would like to share with you some thoughts about the present challenges and the emerging opportunities that our rapidly changing world presents for you. I offer two takehome messages.
The first is: now that your qualifications as scientists have been established, your scientific expertise and knowledge are needed to help find innovative scientific answers and solutions for the challenges we all face because of rapid growth in the human population, and increasingly rapid technological, economic and social changes in our global society, especially the challenges presented by the associated deterioration and disruptions of our fragile human habitat - a vanishingly thin near surface layer on our lonely blue planetSpaceship Earth.
The second message is that as you leave your university studies in the midst of a global recession, extraordinary, new and unexpected opportunities for your participation in innovative scientific and technological developments and applications are emerging because of that global recession. The impact of the recession has expanded the commitment from the Obama administration to transform American science and innovation with unparalleled, large, long-term investments
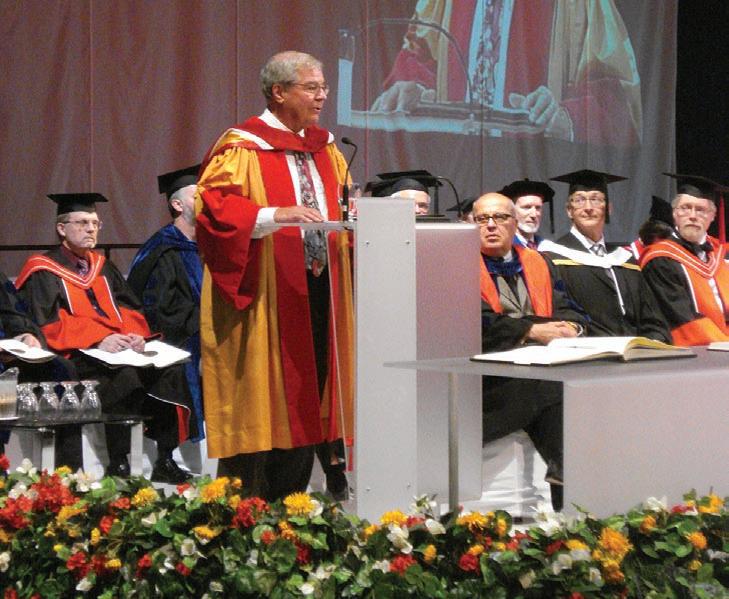
in scientific knowledge and expertise, and in science education. These investments set an example that will affect international science, including Canadian science.
We live in a time of accelerating global change – change that is rooted in the unprecedented growth in the human population and in the per capita consumption of energy, mineral, freshwater, agricultural and ecological resources. In 1955, when I received my B.Sc., the human population on Spaceship Earth was [approximately] 2.8 billion. By [around] 1995, before I retired from teaching, it doubled to more than 5.6 billion. It is now about 7.0 billion.
According to the U.N. Commission on Population and Development, the rate of growth has been decreasing since it reached its highest level (2.04% per year) in the late 1960s; but nevertheless, the total population can be expected to continue to increase - to eight billion in 2028, and nine billion in 2054 - before stabilizing at just above 10 billion after 2200.
The rapid growth in the human population has been accompanied by a corresponding growth in the per capita demand for natural resources, particularly food, energy, mineral, freshwater, and ecological resources. Think about the changes in per
capita consumption of energy resources by residents in your home area - starting with the years just before the arrival of the first Europeans, and continuing at multipleyear intervals to include the arrival of the first European settlers, the introduction of wood-burning steam power, railroads, the use of coal, the onset of urban and then rural electrification, use of petroleum and internal combustion vehicles, natural gas, highway transport services, and air transport, and concluding with your own annual present-day direct and indirect personal energy consumption - including the energy that is required to produce and transport all the things that you buy as well as the energy required to meet your transportation, heating and electrical power needs, at home and at work. This kind of analysis leads to the conclusion that the per capita growth in consumption of food, energy, mineral, water, and ecological resources in Canada and other developed counties, has probably been of the same order of magnitude as the growth in the global population; and furthermore that this growth in per capita resource consumption amplifies substantially the effects of growth in the human population. Now that globalization is making it feasible for people in the very populous developing countries, like China and India, to aspire to
the same levels of profligate consumption of resources that are well established in many of the developed countries. What do you think will be the consequences of many, many more people consuming resources the way we have been doing?
Energy, mineral, freshwater, and most food resources are geographically restricted and unequally distributed among nations, and also within nations. Some nations and some regions are well endowed and can export what they do not require; others must import part or all of what they require. Ecological resources are different. They provide the ecological goods and services that are generated by healthy ecosystems and are beneficial to humans and all other living things. These goods and services include purification of air and water, decomposition and dispersion of wastes, maintenance of biodiversity, and overall maintenance of a sustainable global habitat for human life on Earth. The global oceans and Earth’s atmosphere are good examples of ecological resources that are held in common, as a birthright, by all human beings. No one group has right of ownership and control over them; and everyone is responsible for ensuring that they are sustainable. h owever, both the shared ownership and the shared responsibility are commonly overlooked.
Growth in per capita consumption of resources within a burgeoning human population is adversely affecting our global ecological resources, and thereby, the people who depend on them. Carbon pollution, mainly as gaseous emissions from the use of fossil fuels, has emerged as the most important culprit. Abnormally high accumulations of carbon dioxide and methane that are accumulating rapidly in the global atmosphere are already causing abnormal global climate warming as well as ecologically harmful global acidification of the oceans. These effects will continue for some time after the emissions have stopped. In June 2008, the presidents of the Academies of Science of the G8 + 5 (Canada-France-Germany-Italy-JapanRussia-the United k ingdom and the U.S.A) + (Brazil-China-India-Mexico and South Africa) signed a joint statement calling on world leaders to implement an accelerated transition to a low-carbon society in order to limit the threat of global change. The Joint Academies of Sciences represent the leading scientists of those 13 countries.
With this brief overview of some of the global change challenges that merit your (Continued on page 38...)
T he Canada Region of the Am erican Association of Petroleum Geologists (AAPG) needs you – if you are a m em ber of the AAPG and interested in volunteer ing please consider how you can assist.
2010 will be a bus y year for the Canada Region with the AAPG International Convention and Exhibition being held in Calgar y and with growing interest in the Im perial Barr el Award program for students
Most current volunteers are f rom Calgar y but representation from across the countr y is desired – and it would be great to lower the average age of the group!
Mem bers of the Canada Region ar e wanted to ser ve on various comm ittees, and if you are an Active, Honor ar y or Em eritus Mem ber of the AAPG you are also eligible to tak e advantage of one or both of the opportunities below
Officer positions, including that of Pres ident, will be falling vacant for the 2010-2011 term These officers serve on the Region’s Executive Comm ittee, a body that helps pr omote AAPG services in Canada and pr ovides feedback to AAPG HQ, am ongst other responsibilities
Call for Nominations for Delegates, AAPG
T he Canada Region is currentl y represented in the AAPG House of Delegates b y thirteen Delegates from the Region, and there will be a num ber of vacancies in these 3- year positions for the com ing term of office (2010-2013) T here are also additional opportunities to serve as Alternate Delegates. T he House of Delegates of the AAPG is responsible for all legislative functions of the Association, within the scope of the AAPG’s Constitution and B ylaws As a group, the HOD is an influential bod y and ser ving as a Delegate is a great way to get involved in the work ings of the AAPG. Canadian Region Delegates also participate in the Executive Comm ittee of the Region.
Interested? Want more information? Want to submit your name – or that of another candidate? Then for any of these opportunities please contact one of the following (as soon as possible and preferably before March 31st, 2010):
Paul English, Secretar y
AAPG Canada Region (403) 699-5374
paul english@nexeninc com Or Dave Dolph, Pres ident
AAPG Canada Region (403) 699-4301 david dolph@nexeninc com
attention, let us turn our attention to some important emerging opportunities for meeting these challenges.
A transformational scientific renaissance is underway in the U.S.A. It was described by President Barack Obama, on April 27th, 2009, in his address on: “Science and Innovation,” presented at the 146th Annual Meeting of the National Academy of Sciences in Washington, D.C. The public policy statements presented in this address will have enormous impact on the entire global scientific enterprise, including Canadian science. They will, in my
opinion, become even more of an historical landmark than President John kennedy’s 1961 declaration that the United States would overtake the Soviet Union in the space race by sending a man to the moon and returning him safely to the Earth.
President Obama said, “I’m here today to set this goal: We will devote more than three percent of our GDP to research and development. We will not just meet, but we will exceed the level achieved at the height of the space race – through policies that invest in basic and applied research, create new incentives for private innovation,
promote breakthroughs in energy and medicine, and improve education in math and science.”
This initiative represents the largest investment in science and innovation in American history. And it is underway now. Through the American Recovery and Reinvestment Act, the U.S. government is already providing the largest single boost to investment in basic research in American history. It has doubled the budgets of key agencies including the National Science Foundation, the National Institute of Standards and Technology and the Department of Energy’s Office of Science. To those who say that in a deep recession, the U.S. cannot afford to invest in science, or that research is somehow a luxury at moments defined by necessity, President Obama’s reply is, “I fundamentally disagree. Science is more essential for our prosperity, our security, our health, our environment, and our quality of life than it has ever been.”
While setting a goal for the United States to reduce the nation’s carbon pollution by more than 80% by 2050, he said: “in no area will innovation be more important than in the development of new technologies to produce, use and save energy, which is why my administration has made an unprecedented commitment to developing a 21st century clean energy economy, and why we put a scientist in charge of the Department of Energy. Our future on this planet depends on our willingness to address the challenge posed by carbon pollution. And our future as a nation depends on our willingness to embrace this challenge as an opportunity to lead the world in pursuit of new discovery…the nation that leads the world in 21st century clean energy will be the nation that leads in the 21st century global economy.”
President Obama concluded his remarks by stressing the importance of international cooperation and collaboration in the pursuit of these goals, and by urging the Academy members to join him in creative efforts to engage young people in science.
I conclude my remarks with two observations: My fellow graduates, our dysfunctional global society needs you and your newly acquired expertise and knowledge to help it become functional again, and Barack Obama has explained to the world how your talents can be, and must be, put to work, especially during a deep recession.
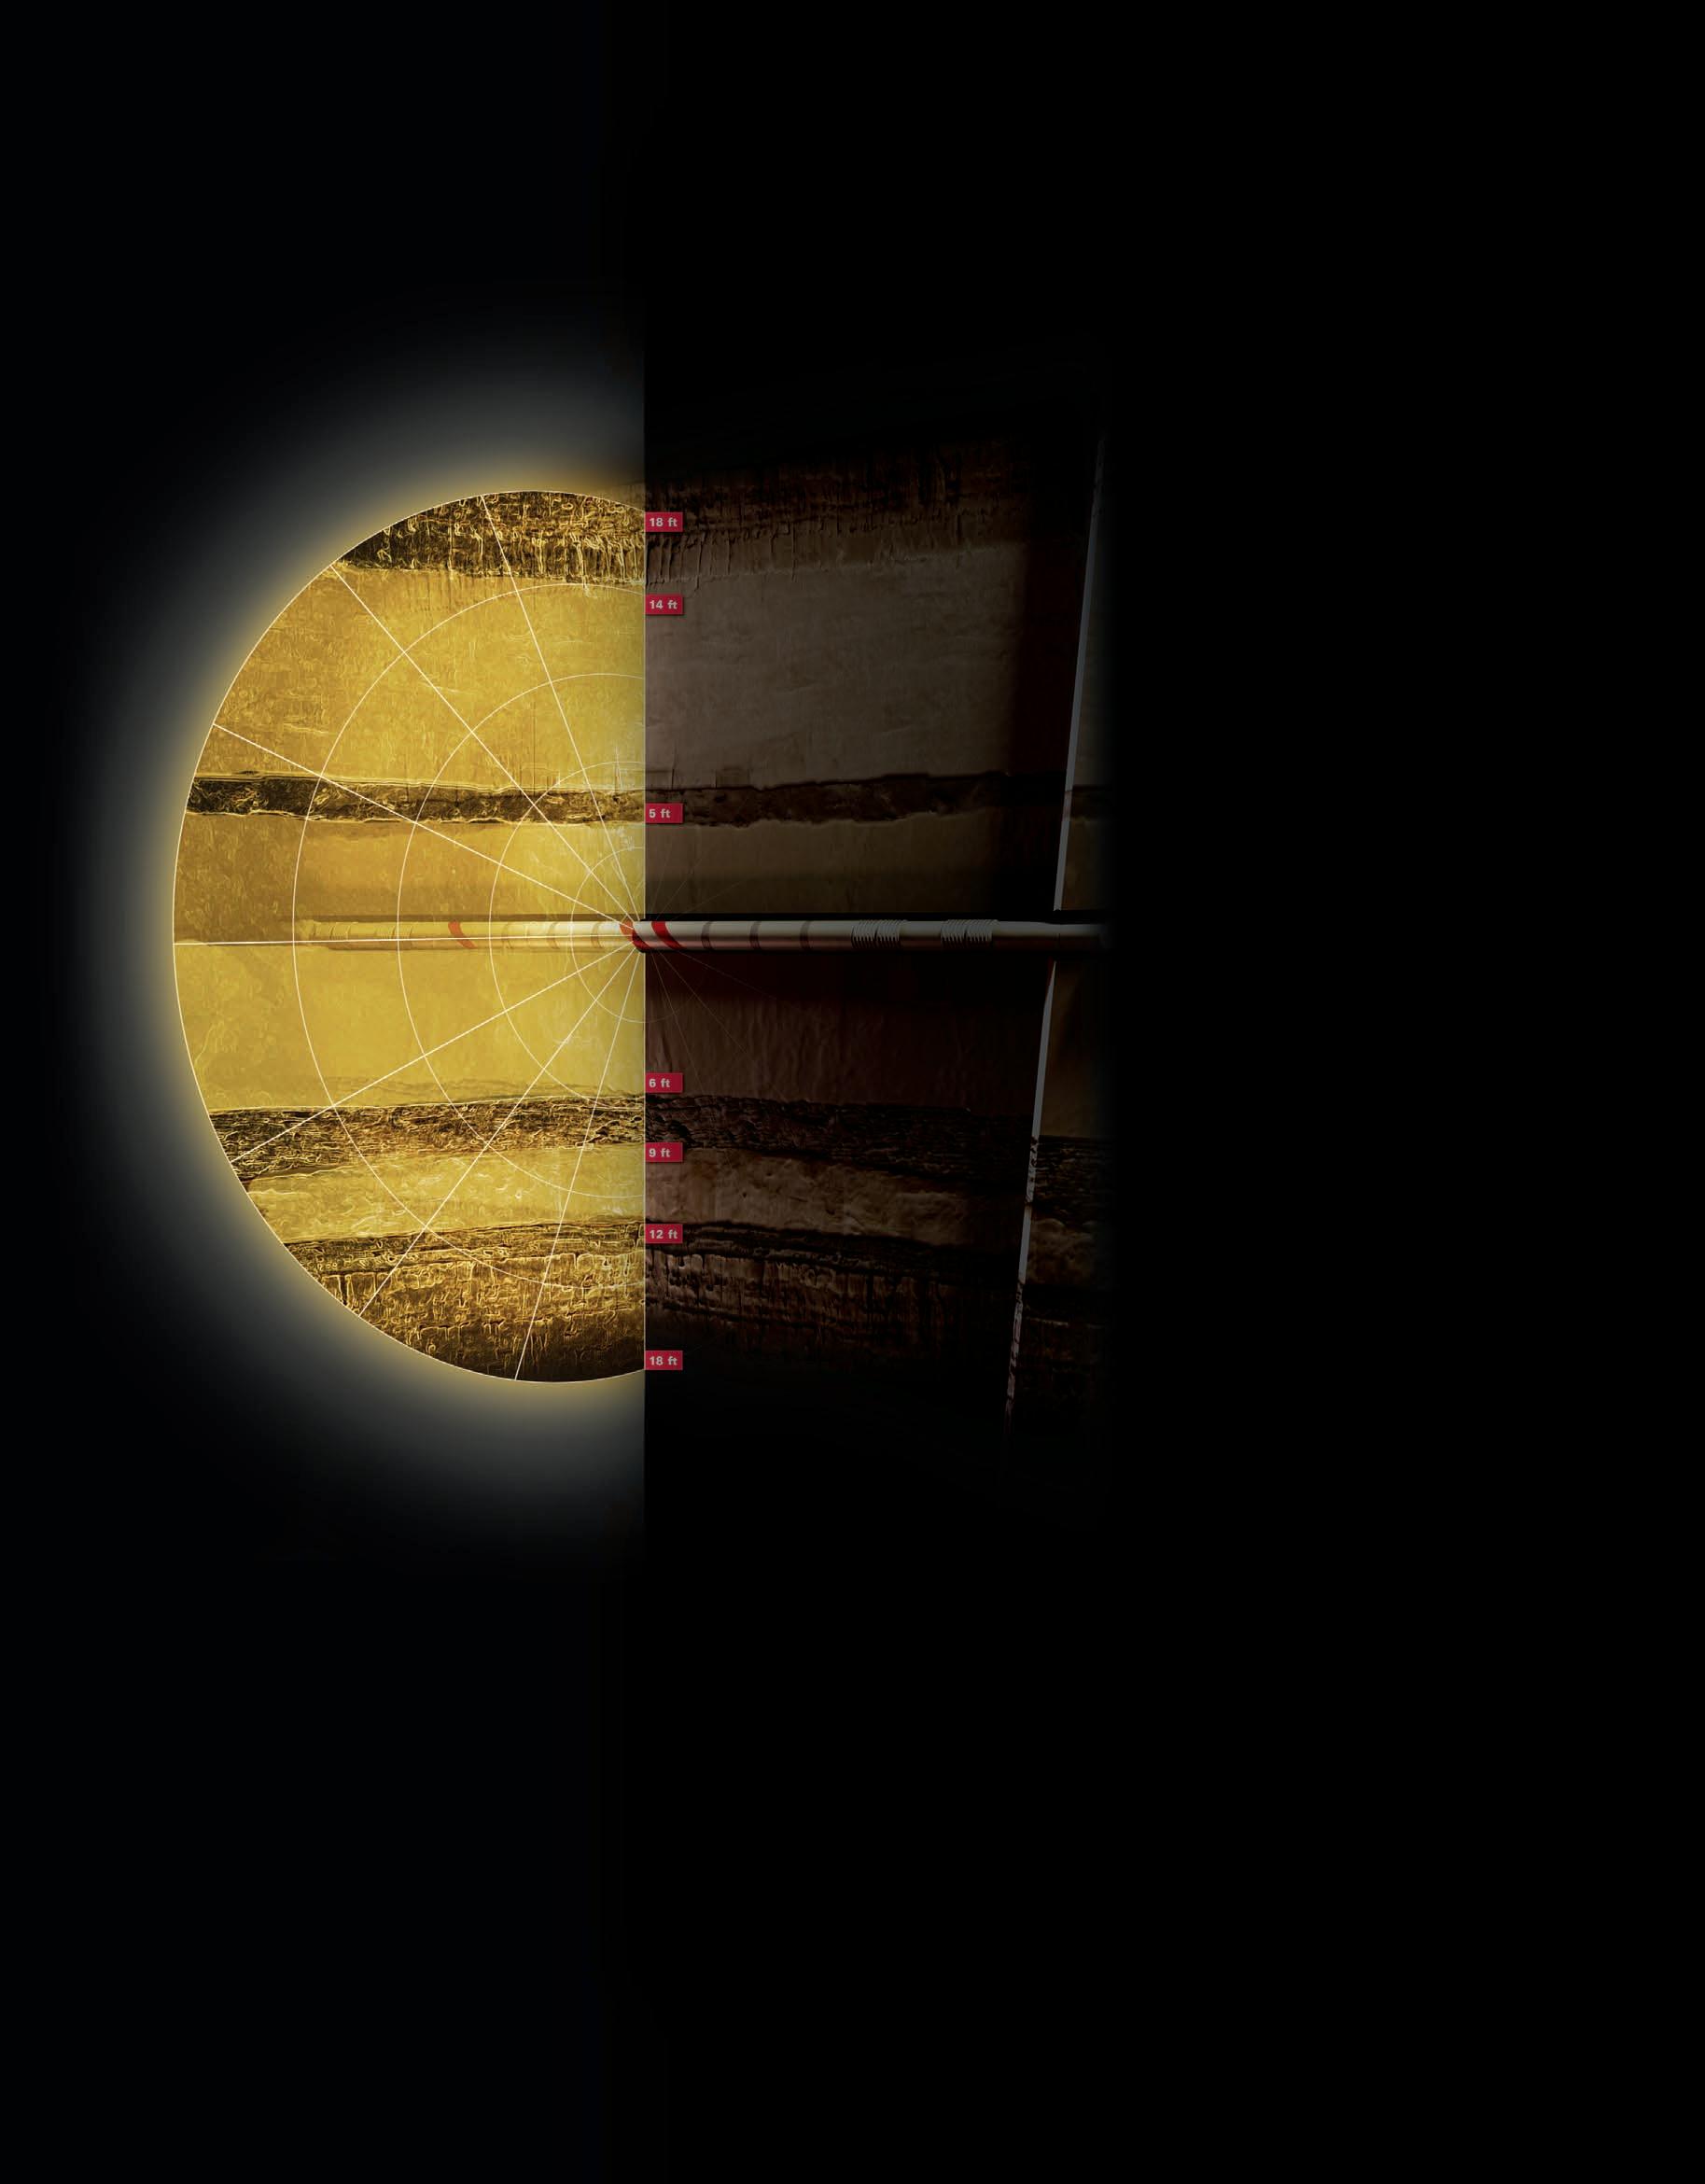
In complex geology, the InSite ADR™ Azimuthal Deep Resistivity sensor helped achieve optimal well placement.
Customer Challenge: Faced with drilling shallow wells in an area of high geological and operational complexity, a Latin American operator needed to improve well positioning and maximize recovery.
Halliburton’s Solution: A combination of InSite ADR™ Azimuthal Deep Resistivity sensor and StrataSteer® 3D geosteering service from Sperry Drilling services for optimized wellbore placement enabled the operator to make immediate geosteering decisions and position wells in the reservoir’s most productive zones.
Results: The operator was able to steer the well path into the best possible target—thereby reducing geological uncertainties, optimizing drilling operations and delivering one of the highest percentages of net pay per lateral length for wells drilled in the past six months.
www.halliburton.com/adr
If you want easy-to-use decision-making
– there’s only one direction to go
industry-leading customer service easy & efficient migration of existing data helping clients increase productivity
geoSCOUT™ uses a Windows-based platform that makes it easy for you to get the oil and gas data you need to make smarter decisions faster and to maximize the return on your oilfield investments. And, our solution provides you with a complete package that all your departments can use.
Thousands of landmen, engineers & geologists use geoSCOUT oil and gas mapping and analysis software every day, to make more efficient, informed decisions. Give us an hour for a demo – we know you’ll see the value. Call 403.262.1992 Email info@geoscout.com | Online www.geoscout.com
Another powerful suite of tools from