30 It’s Bigger! It’s Better! It’s National Engineering and Geoscience Month!
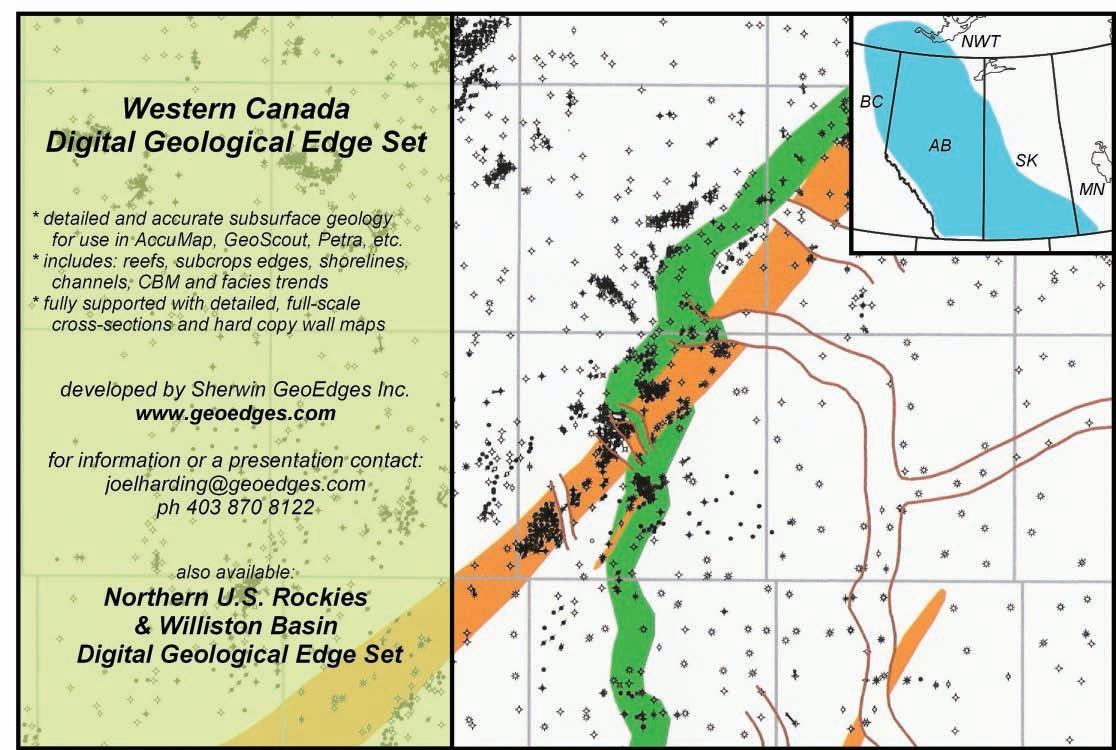
16 Interpretation of Transgression Barrier-Beach, Shoreface, Lagoon, and Estuary Reservoirs – Use of Modern Analogues: Part 1 – Variability in Sub-Environments and Depositional Settings
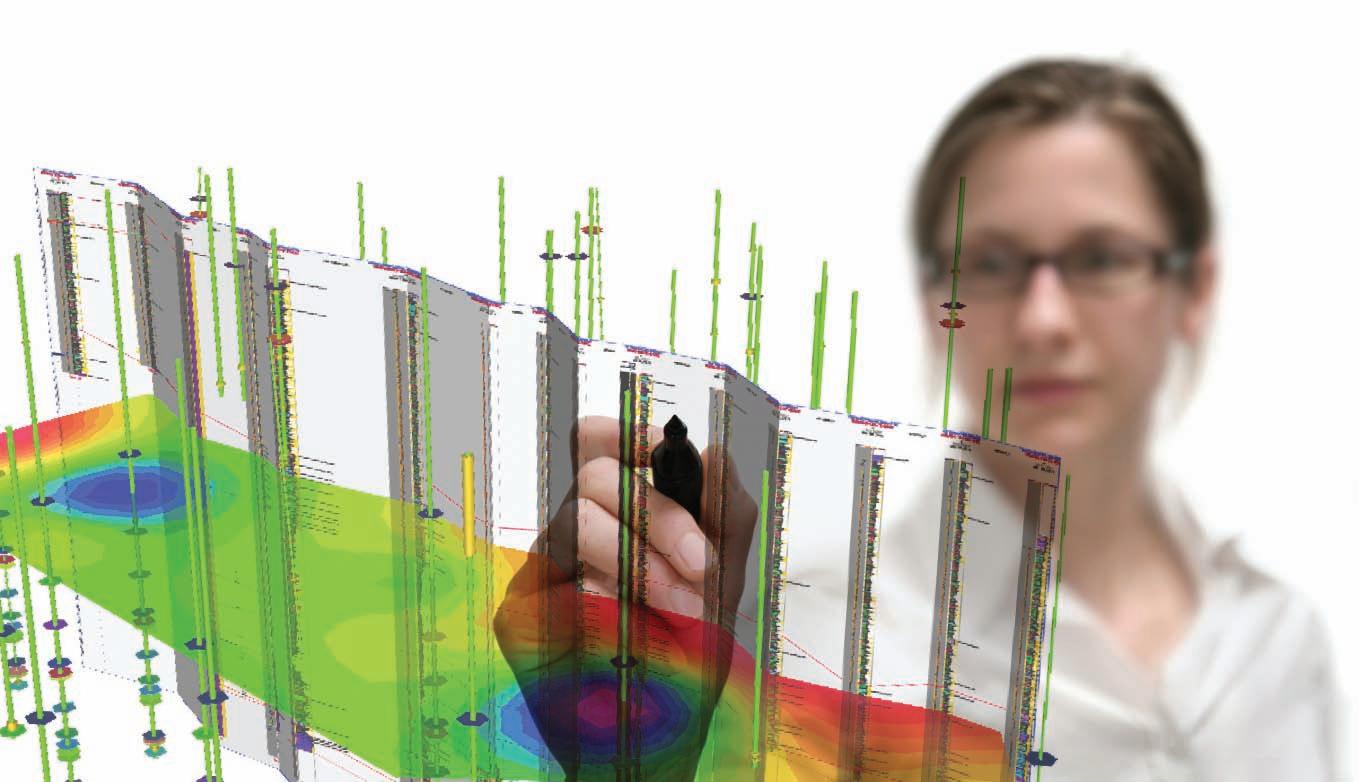
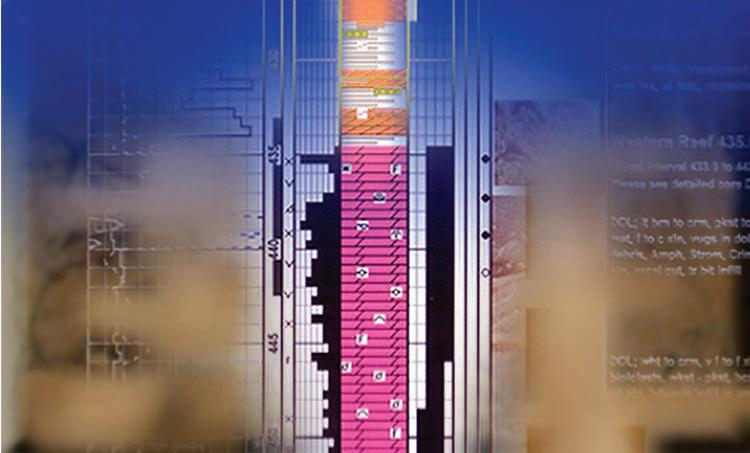
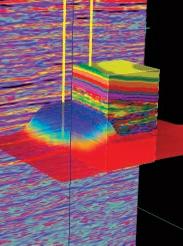
Define Reservoir Parameters with Confidence
Looking to maximize opportunities in today’s volatile market?
Combine the power of PETRA® and IHS Critical Information including well and log data to define reservoir parameters and determine new opportunities faster and more cost effectively.
Let IHS information solutions improve your decision-making and reduce your risk.
For more information on PETRA visit us at www.ihs.com/reservoirsolutions
Please submit RESERVOIR articles to the CSPG office. Submission deadline is the 23rd day of the month, two months prior to issue date. (e.g., January 23 for the March issue).
To publish an article, the CSPG requires digital copies of the document. Text should be in Microsoft Word format and illustrations should be in TIFF format at 300 dpi., at final size. For additional information on manuscript preparation, refer to the Guidelines for Authors published in the CSPG Bulletin or contact the editor.
Technical Editors
Ben McKenzie Colin Yeo (Assistant Tech. Editor) Tarheel Exploration EnCana Corporation Tel: 403-277-4496 Tel: 403-645-7724 Email: bjmck@telusplanet.net Email: colin.yeo@encana.com
Coordinating Editor
Heather Tyminski, Comunications and Public Affairs, CSPG Tel: 403-513-1227, Email: heather.tyminski@cspg.org
ADVERTISING
Advertising inquiries should be directed to Alyssa Middleton, Tel: 403-513-1233, email: alyssa.middleton@cspg.org. The deadline to reserve advertising space is the 23rd day of the month, two months prior to issue date.
The RESERVOIR is published 11 times per year by the Canadian Society of Petroleum Geologists. This includes a combined issue for the months of July and August. The purpose of the RESERVOIR is to publicize the Society’s many activities and to promote the geosciences. We look for both technical and non-technical material to publish. Additional information on the
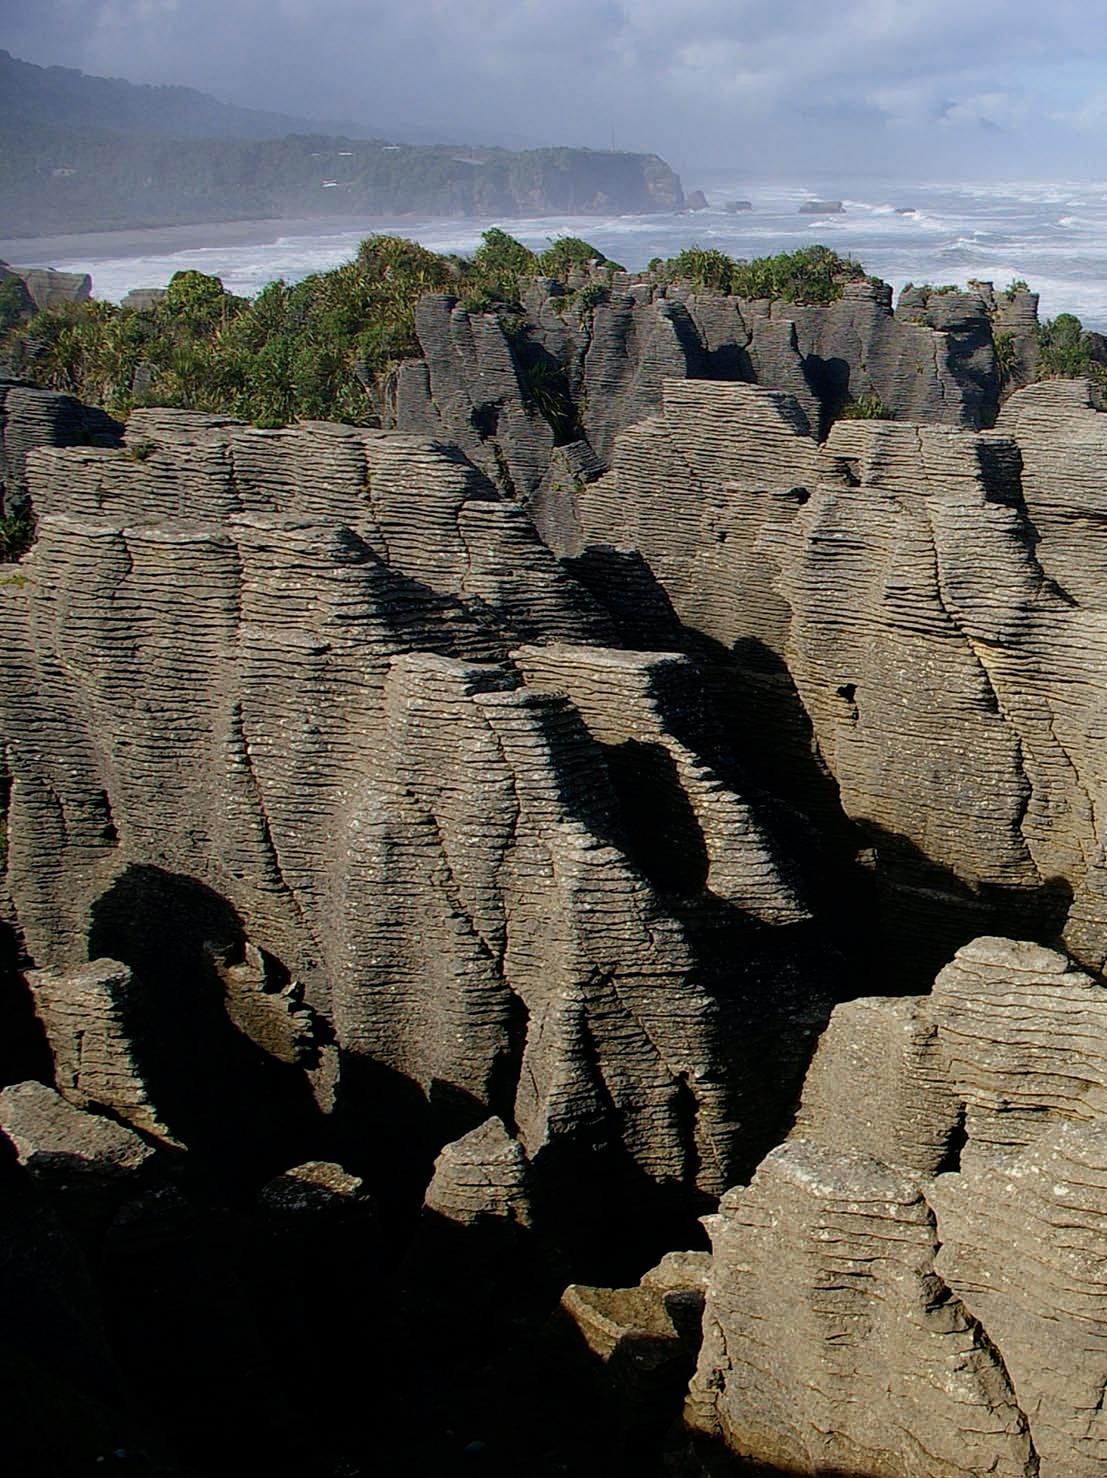
Photo
CSPG EXECUTIVE
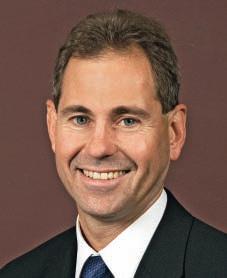
President John Varsek • Cenovus Energy john.varsek@cenovus.com Tel: (403) 645-5417
Thank you for the privilege and responsibility of allowing me to lead the CSPG in 2010! I view the effort as an enormous collaboration with the Executive and directors, with our volunteers, with you as a member and contributor, and in partnership with our employers, sponsors, and affiliated societies.
When 2007 Past-President Colin Yeo asked if I would consider the nomination, it was under the explicit instruction to interpret the vision of the Society, which is to be internationally – my proposed change from ‘nationally’ – recognized as the premier technical organization supporting the petroleum geosciences in Canada. Yes, Colin I accept! I believe we will be successful if we approach strategic changes in increments by building on the strength of the Society’s talent and traditions. We can be assured of success if we continue to engage diverse views on direction, priorities, and content.
In the big picture, competent and progressive geo-science practice is a critical need for society and the CSPG will continue to play a vital role. Not only will we continue to investigate the origin, processes, location, and interplay of technologies to locate and to produce commercial resources more efficiently, we will increasingly contribute to solutions that mitigate the impacts of development.
The CSPG will need to be a flexible organization in order to respond to: 1. Volatile changes in re-investment rate by industry, in product focus, and in regulation; 2. Uncertain revenue streams; 3. The changing relationship between geoscientists and their employers; 4. The narrowing of geological practice where it is routine and compliance-driven; And at the other extreme, 5. a rapid expansion in number and depth of technical niches; 6. Retirements, a trend to a smaller workforce, and a large experience gap; 7. Rapid changes in communication technologies, sometimes sharply along demographic lines; and 8. Challenges from peer organizations.
As an optimist, I believe that these uncertainties and threats present opportunities. Geologists are masters of re-invention and wealth creation. How many times have various Canadian basins been written off? We are in the process of innovation yet again.
With this outlook, the CSPG Executives, both 2009 and 2010, met in mid-November (see pictures). For 2010 we identified three strategic initiatives that work together to elevate the indispensible role of the CSPG in your practice of Canadian petroleum geology. We hope they will be a start in the evolution and revitalization needed for the Society and expect it will involve several years of effort. Each initiative has a leader and working group, and will be developed with a sustainable multiyear volunteer and financial plan.
1. Technical program re-vitalization and relevancy: Greg Lynch (Finance Director) is leading a working group to develop new programs and delivery formats. Yes, we heard from many that the CSPG is doing a good job, but others are less sure. The Executive and Directors believe we must do better. The changing economic and environmental priorities of the petroleum industry and society dictate the technical focus. Also, professional licensure requires maintenance of skills which the CSPG can provide. We compiled over 50 opportunities for consideration, in part by looking to the 2009 membership survey for some great ideas. Did you know that the CSPG has 10 technical forums, including the Convention, Luncheons, Reservoir, and the Bulletin; can you name the others? Expect to hear about the progress we’ve made in the second half of 2010. To better prepare you for the job you’re doing today and to ready you for tomorrow, let the CSPG be an ‘indispensible part of your technical development’.
2. Volunteer management system: We are a society of volunteers! Volunteers are the reason the CSPG exists as a vital and critical contribution to Canadian geosciences and to professionalism in the petroleum industry. As an Executive, our goal is to make volunteering for the CSPG a meaningful and rewarding social, technical, and professional experience. I initiated, and Ayaz Gulamhussein (Service Director) has continued, development of a comprehensive system which will be supported by a committee to manage recruitment, roles descriptions, training, time management, succession planning, feedback, and recognition. I believe that we can foster a culture of volunteerism that embraces the realities of today, because we can provide meaningful purpose. This system reflects the standards of excellence
(Continued
PETROLEUM INDUSTRY COURSES
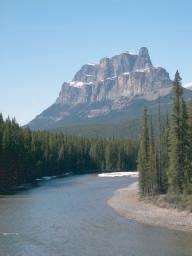
Cretaceous Cardium Formation,
Ayrton
WHO SHOULD ATTEND
New geologists, engineers, geophysicists and landmen, as well as summer students entering the industry fo r the f irs t time will find the courses a very beneficial introduction to the petroleu m industry. T hese courses will be extremely useful to nonprofessional and support staff in the oi l and gas industry, as w ell as accountants, lawyers, brokerage and financial personnel working primarily alongside the oil and gas industry.
TO REGISTER
To register or to obtain additional information regarding in-house and upcoming courses, please contact:
Ayrton Exploration Consulting Ltd.
Tel: (403) 262-5440
Email: ayrtonex@telusplanet.net
Or visit our website: www.ayrtonexploration.com
OVERVIEW OF THE OIL & GAS INDUSTRY IN WESTERN CANADA
Date: March 2nd & 3rd, 2010
Cost: $945 (includes GST)
Instructor: Bill Ayrton
Effective for personnel just joining the oil patch, or for financial, accounting, and information systems personnel.
• Learn about the many facets of the industry.
• Oil finding, land acquisition, drilling, seismic, well completion, jargon and terminology.
GEOLOGY FOR NON-GEOLOGISTS
Date: March 30th & 31st, 2010
Cost: $945 (includes GST)
Instructor: Bill Ayrton
Effective for geological technicians or administrative staff, or for those who just want a better understanding of geology to appreciate the world around us.
• Learn about earth structure, geologic time-scale and processes, Western Canada geology, and interesting nearby locations.
• Participate in a rock identification e xercise, cross-section project and a mini-field trip in downtown Calgary.
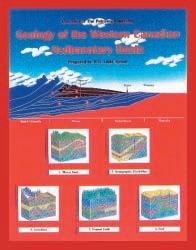
GEOLOGY OF THE WESTERN CANADIAN SEDIMENTARY BASIN
Date: April 13th, 14th and 15th, 2010
Cost: $1365 (includes GST)
Instructor: Bill Ayrton
Ideal for those who wish to improve their geological understanding of where and how we look for oil and gas fields in Western Canada.
• To visualize what Western Canad a looked like throughout the stages of history, for example, the position of the sea versus land, what sediments were deposited, and what type of life that existed and evolved.
• To review the importance of each major stratigraphic unit, i.e. Devonian, Mississippian, Cretaceous, etc.
• Discuss the geological and seismic expression of typical oil and gas fields in each unit.
Upper
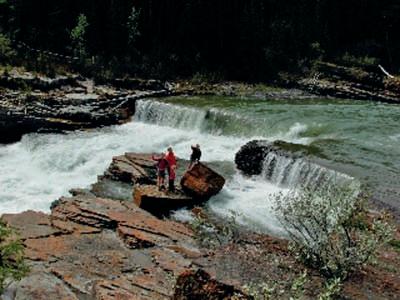
below Seebee Dam on the Bow River.
Photo by: Bill
Since 1927...
CORPORATE MEMBERS
APACHE CANADA LTD.
BAKER ATLAS
CONOCOPHILLIPS CANADA LIMITED
DEVON CANADA CORPORATION
ENERPLUS RESOURCES TRUST
geoLOGIC systems ltd.
GEOMODELING TECHNOLOGY CORP.
HUNT OIL COMPANY OF CANADA
HUSKY ENERGY INC.
IHS
IMPERIAL OIL RESOURCES
LARIO OIL & GAS COMPANY
LITTLE ROCK DOCUMENT SERVICES
MJ SYSTEMS
MURPHY OIL COMPANY
NExEN INC
PENN WEST PETROLEUM LTD.
PETRO-CANADA OIL AND GAS
PETROCRAFT PRODUCTS LTD.
PROVIDENT ENERGY LTD
RPS ENERGY CANADA LTD.
SHELL CANADA LIMITED
SPROULE ASSOCIATES LIMITED
SUNCOR ENERGY INC
TALISMAN ENERGY INC
TECK COMINCO LIMITED
TOTAL E&P CANADA LIMITED
TOURMALINE OIL CORP
AS OF DECEMBER 29, 2009
(...Continued from page 5)
we expect from top industry and non-profit performers. Join us; make a difference; it will be ‘indispensible to your career development’.
3. Marketing the Society: The CSPG should no longer be silent on the benefits it offers members, corporations, and students. Marketing is a long-standing weakness of our Society and one we need to become better at. Kirk Osadetz (Vice President) and his working group will be developing the messages and organizational capability to deliver on this. It is clear, for example, that we cannot have great technical contributions without the support of our employers, or be financially viable without the contributions, in cash or in-kind, from our sponsors. We will explain the value we bring to the profession in terms of knowledge, the intellectual assets of members and networks, and of our data and information repositories. We will explain and reinforce what the CSPG stands for and where we are headed. The benefits of membership should be spelled out to all stakeholders in a variety of media. The goal of the marketing strategy is to: 1. Sustain or increase membership, despite demographic forecasts and the current recession; 2. To increase E&P company technical participation; 3. To identify new revenue streams; and 4. To increase volunteerism.
I expect the marketing strategy to have measurable results, both quantitative (tangible) and qualitative (intangible). The message we want to deliver is, ‘We are indispensible to the success of your career and your company by providing knowledge, networks, and career skills development’.
I will also continue the strategic initiatives from past years which include, society alliances (2009) and national presence (2008). At the risk of stretching the resources of the Executive, Directors, office, and volunteers too far, we have compiled about a dozen other significant programs, which as time and resources permit we will explore. The priority, however, will be to deliver and improve on what we do well and to design and implement the three 2010 strategic initiatives. My hope and aspiration is that by year-end 2010 you will see and feel an
improved CSPG. Either way, I will want your feedback.
I envisage these initiatives as growing, adapting, and having an impact beyond 2010. This isn’t a one-time task! To summarize, I believe that success for our Society lies in: 1. Stimulating and facilitating a range of profound, high impact, quality scientific and technological accomplishments; 2. The ability to develop a volunteer and office organization to deliver its programs effectively; and 3. The effective use of the CSPG’s connected community to evolve partnerships with all who impact our Society. If the community of geologists and corporate bodies recognize the quality and value the CSPG delivers then we will continue as a technically and economically viable Society.
I am thrilled to be the beneficiary of Past-President Graeme Bloy’s effective efforts to re-build our organizational capability in 2009. Among many achievements, he mentored the energetic nonprofit society fiscal expert, Lis Bjeld; he made critical staffing changes to improve the skills and effectiveness of our office, modernized the accounting process, tightened accountability, and developed fiscal flexibility; he also implemented effective communication with JACC (Joint Annual Conventions Committee), the ETF (Education Trust Fund), our partners the CSEG and CWLS, and the AAPG. This indeed is a strong platform to build from. I extend my sincerest thanks Graeme!
I would also like to show my appreciation and thanks to the outgoing directors, Randy Rice (Program), Penny Colton (Service), and Peggy Hodgkins (Communications) – please read about their accomplishments in the columns they wrote in 2009 for the Reservoir. Also, I would like to welcome the incoming team; they are experienced, committed, enthusiastic, and energetic. Please read about them in the November 2009 issue of the Reservoir or check the website.
If you find yourself energized by some of what you read and see yourself reflected in some of the aspirations, call me! The forecast for 2010 is bright! Let’s get started!
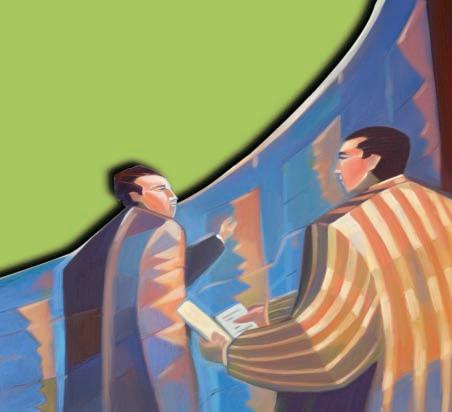
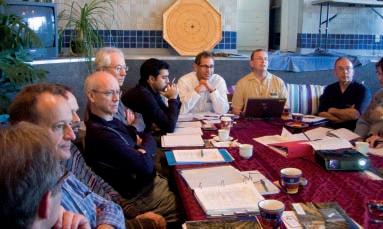
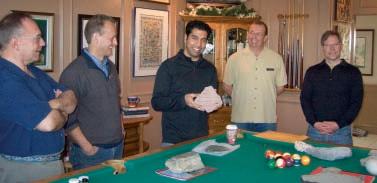
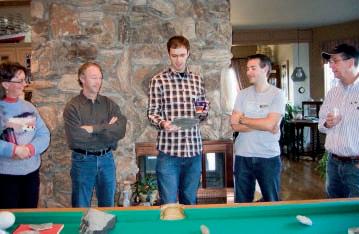
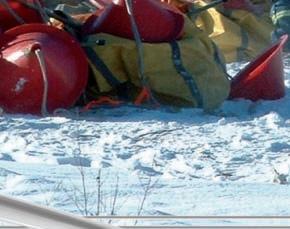
Montage from November 14, 2009 CSPG strategy session with the current and incoming Executive. The fun we had can’t be concealed. The session began with an indoor field trip. Each participant brought a favourite rock and told a story about why it was significant. What struck me was that although many of the specimens were technically interesting, the people stories behind them were often hilarious and fascinating. We gelled as a team around Graeme’s pool table. Later we moved into his swimming pool for strategy discussions.
technicaL Luncheons FEBRUARY LUNCHEON
Reefs under stress – Bermudian reefs and their Devonian counterparts
SPEAKER
Bill Martindale Consultant
C O -AUTHOR
Noel P. James
Queen’s University
11:30 am m onday, February 8, 2010 telus convention centre calgary, alberta
Please note:
the cut-off date for ticket sales is 1:00 pm, Wednesday, February 3, 2010. csPg member ticket Price: $38.00 + gst. non-member ticket Price: $45.00 + gst.
Our understanding of ancient carbonates is based on comparisons with modern analogues. The Bahamas and southern Australia are synonymous with modern tropical and cool water carbonate realms, yet analogues such as these represent end members in the carbonate depositional spectrum. Bermuda occupies a mid-Atlantic location well beyond the range of reefbuilding corals but is paradoxical in that shallow-water reefs of both ‘tropical’ and ‘temperate’ aspect are currently forming on this mid-ocean atoll. Clearly, one or both systems is stressed and operating at the limit of its environmental range. We believe that many Devonian reefs in
western Canada similarly exhibit signs of environmental stress.
Bermuda lies in the Gulf Stream and yet is subject to profound annual cooling – sea temperatures fall as low as 18°C in winter. It is a biologically driven carbonate system - there are no muddy tidal flats or ooid shoals. Reefs range in size from small pinnacles and patch reefs to larger shelf reefs and are constructed predominantly by domal and hemispherical corals. Other components include branching corals, hydrozoans, and various calcified algae.
Co-existing with these ‘tropical’ Caribbean coral reefs is a reef community of distinctly ‘temperate’ water affinity. Vase-shaped cup reefs 5-10m high grow along the Bermuda platform margin. Superficially they appear devoid of framework components, other than a few small corals. Closer inspection reveals a framework of laminar intergrowths of crustose coralline algae, Millepora, and encrusting calcified vermetid gastropods. Synsedimentary cementation results in a wave-resistant structure. Growth cavities are populated by an encrusting biota, in particular the red calcified foraminifer Homotrema. Their laminar framework and abundant cryptic encrusters is reminiscent of Nisku-aged Devonian reefs (e.g., Jean Marie), constructed of thin tabular stromatoporoids, pendant calcified microbial communities, and encrusting stromatolitic laminae.
Both of Bermuda’s reef communities reflect conditions of environmental stress. Are there comparisons that can be made with Devonian reefs of western Canada? Factors such as low faunal diversity in some coral and stromatoporoid communities suggest stressed conditions. Paleoclimatic reconstructions indicate a tropical epicontinental setting for the Devonian. High water temperatures likely generated thermal and salinity stresses,
CSPG BOOKSALE – 50% OFF!
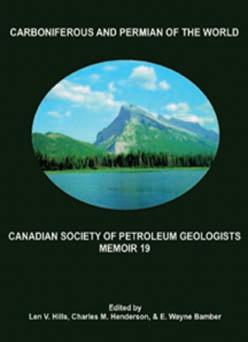
MEMOIR 19 - C ARBONIFEROUS AND PERMIAN OF THE WORLD, XIV INTERNATIONAL CONGRESS OF THE C ARBONIFEROUS AND PERMIAN
This memoir highlights a 100-million-year interval during which the supercontinent Pangea was assembled, addressing issues of sedimentology, stratigraphy, resources, and paleontology. Memoir 19 contains 60 refereed papers representing the selected proceedings of the xIV International Congress on the Carboniferous and Permian held at the
University of Calgary in August 1999. This publication will be valuable to geoscientists interested in Carboniferous and Permian geology, not only in Western Canada, but also around the world. Edited by Len V. Hills, Charles M. Henderson, and E.Wayne Bamber, 2001, hard cover, approximately 800 pages.
Regular price $100 - reduced to $50 (plus G.S.T.) Quantities are limited. Please visit the CSPG Bookstore (600, 640 – 8th Ave SW) to pick up your copy.
particularly in restricted settings during times of sea level fall. Sediment input at this time would compound the situation. Abundant microbes and depauperate coral and stromatoporoid faunas in some late Frasnian reefs suggest that excess nutrients were also a limiting factor in reef growth. Clearly, Devonian reefs grew under a greater range of environmental conditions than ‘classic’ Caribbean analogues would suggest.
BIOGRAPHIES
Bill Martindale is a Calgary-based professional geologist with over 30 years of experience working with carbonate hydrocarbon reservoirs. Martindale received his B.Sc. from the University of Reading in the UK and a Ph.D. from the University of Edinburgh, Scotland, where he studied Holocene and Pleistocene reefs of Barbados. For the past 15 years Martindale has operated a successful consulting company, specializing in the nature, distribution, and quality of carbonate reservoir rocks in the Western Canada Sedimentary Basin. For 14 years prior to this, he was the carbonate specialist with a mid-sized, Calgary-based exploration company. In 2006, Martindale took on the role of adjunct professor at Queen’s University. Recently, Martindale spent one year with Petro-Canada as a staff geologist working carbonate plays throughout North America.
Noel James is Professor and holder of a Research Chair at Queen’s University in Kingston Ontario where he teaches sedimentary geology and oceanography. He received his B.Sc. (Geology) from McGill University, M.Sc. (Oceanography) from Dalhousie University, and Ph.D. (Geology) from McGill University. In the following years he worked for the petroleum industry in Calgary, helped establish the Comparative Sedimentology Laboratory at the University of Miami, taught at Memorial University of Newfoundland, and has been an Industrial Fellow at Marathon Oil Company research laboratories.
technicaL Luncheons FEBRUARY LUNCHEON
Phanerozoic
structural evolution of Eagle Plain,
Yukon
SPEAKER
Larry Lane Geological Survey of Canada
11:30 am
tuesday, February 23, 2010 telus convention centre calgary, alberta
Please note:
the cut-off date for ticket sales is 1:00 pm, thursday, February 18, 2010. csPg member ticket Price: $38.00 + gst. non- member ticket Price: $45.00 + gst.
As a northern Cordilleran ‘intermontane’ basin, Eagle Plain (northern Yukon) was shaped by multiple tectonic events throughout its Phanerozoic history. This structural history is fundamental to our understanding of the basin’s petroleum potential. Of 35 wells drilled in the basin, all but three were spudded between 1957 and 1978, most on large surface structures. In the past 20 years, major advances have been made in defining the basin’s regional architecture and structural evolution, and their impact on the basin’s petroleum prospectivity.
With the breakup of Rodinia in Late Neoproterozoic time, the Franklinian (Arctic) margin formed in the north and the paleo-Pacific margin formed in the south. Eagle Plain sits atop a continental promontory that was left behind at the junction of the two margins. This promontory remained subaerial until Early Cambrian time, when the Richardson Trough, was initiated, separating Eagle Plain from the Mackenzie Platform to the east. Richardson Trough, having developed as a fundamental crustal-scale rift structure in the early Paleozoic, would be reactivated periodically throughout Phanerozoic time.
The tectonic record for Eagle Plain in the late Paleozoic and early Mesozoic is poorly defined locally. Regionally, collision of continental fragments and magmatic arcs
on the paleo-Pacific margin initiated early phases of Cordilleran orogenesis, culminating in the collapse of the Selwyn Basin into fold and thrust belts, followed by emplacement of mid-Cretaceous granitic plutons that plug regional structures. These southern ranges shed clastic debris northward across the area through Late Cretaceous time, accumulating up to two kilometres of strata deposited unconformably across Jurassic to Early Cretaceous rocks.
To the north, initial rifting of the nascent Canada Basin (Arctic Ocean) was underway by the Middle Jurassic. In northern Yukon, rifting culminated in Albian time with the development and infill of massive faultbounded graben systems such as Kugmallit and Blow troughs. Several grabens are imaged seismically in the northern part of Eagle Plain, and probably date from the early stages of rifting.
Tertiary development of the northern Yukon fold complex and adjacent northeastern Brooks Range shaped the present Eagle Plain basin and produced broad north-
trending folds, detached on décollements in the Proterozoic succession. In the western side of the basin, deformation is more intense and the structures are predominantly thrust faults. Tertiary folds and thrust faults have thickened both the late Paleozoic succession (locally four kilometres thick) as well as the Cretaceous succession up to two kilometres thick, providing mechanisms for local burial of source rocks as well as trap formation. Tertiary triangle zones marginal to the basin remain untested for hydrocarbon resources.
BIOGRAPH y
Larry Lane is a Research Scientist with the Geological Survey of Canada and leader of the Yukon Basins Project, in the Geo-Mapping for Energy and Minerals (GEM) Program. Lane is a structural geologist with over thirty years’ experience in bedrock mapping, and structural and tectonic synthesis in the Canadian Cordillera, northern Yukon, Beaufort-Mackenzie Basin and circum-Arctic region. Since joining the GSC in 1986 he has also led major projects under the Frontier Geoscience Program and NATMAP.
The disinterested observer’s 50-minute guide to the global warming debate
AUTHOR Jerry Osborn
University of Calgary, Dept. of Geoscience
11:30 am tuesday, m arch 9, 2010 telus convention centre c algary, a lberta
Please note:
the cut-off date for ticket sales is 1:00 pm, thursday, march 4, 2010. csPg member ticket Price: $38.00 + gst. non- member ticket Price: $45.00 + gst.
Each CSPG Technical Luncheon is 1 APEGGA PDH credit. Tickets may be purchased online at http://www.cspg.org/events/events-luncheons. cfm.
The great majority of climate scientists are convinced that warming over the last few decades is largely due to anthropogenic effects, and many think that serious, perhaps catastrophic, climatically induced problems await humanity in this century. But a small minority of actively publishing climate scientists, a considerable number of scientists in other fields, many politicians, as well as some significant proportion of the general public, remain skeptical, and debate continues in a variety of venues that include scientific journals, the web, pop print media, television, think tanks, houses of governments, courtrooms, schools, churches, and in the case of Alberta, the PEGG (APEGGA’s newspaper). The debate is fierce, bitter, and often personal (in the PEGG the President of APEGGA recently felt compelled to warn letter-writers to tone down the heated rhetoric), and polarized to the extent that there is not much dialogue between factions other than insults on websites.
To some extent each faction mounts its own conferences and publishes peerreviewed research in its own friendly journals, and each faction has spokesheroes who cherry-pick evidence or
exaggerate to support a point of view. The debate is complicated by fusion of several questions that are not always separated by debaters (Is it warming? Is warming anthropogenic? If so, what should the social response be? If climate is always changing naturally anyway should we attempt to mitigate anthropogenic climate change? Should we worry about potentially calamitous ‘tipping points’ for which there is some, but not robust, evidence?). Leftwing and right-wing political allies on the two sides of the debate use the issue as a prop to promote global governance/ justice and free enterprise, respectively. Scientific and social issues are mixed to the degree that interpretations of science are influenced by social/political philosophy.
The result is wildly varying views on scientific issues, defensiveness and entrenchment of scientists, diversions over hockey sticks and oil-company funding, significant filtering of information in electronic and print media, and immense public confusion, as each side belittles the other in an attempt to sway public opinion. The scientific debate has largely been consumed by the political debate, as illustrated by the recent ‘climate-gate’ e-mail hacking incident, whose political significance far outweighs its scientific significance.
Given the entanglement of politics in the science, evaluation of the latter is best considered totally divorced from social issues. Champions of anthropogenic warming cite (1) general correspondence between 20th-century greenhouse gas composition of the atmosphere and global mean temperature, (2) greenhouse warming theory, and its incorporation into general circulation models, that can explain 20th-century warming, (3) declining outgoing (space-bound) radiation at the wavelength bands at which greenhouse gases absorb energy, (4) increasing downward longwave radiation as CO 2 levels increase, suggesting increasing greenhouse effect (4) observed patterns of surface and atmospheric warming that are predicted by greenhouse warming theory, and (5) suggestions that recent/current warming is anomalous, as evidence. The latter point was the foundation of the hockey-stick-curve controversy a few years ago, one of the more colourful episodes of the global warming debate.
Skeptics of anthropogenic warming make
mainly negative arguments, seeking to find fault in the concepts that it’s getting warmer and/or that warming is significantly anthropogenic. The most-promoted argument currently is that global warming stopped in 1998 or 2005 (depending on the data set). Skeptics most often cite solar forcing, either directly through irradiance variations, or indirectly via cosmic-ray modulation of ionization in the atmosphere, which influences cloud formation, as the cause of 20th-century warming. Most solar and atmospheric physicists agree that there is some solar influence on climate, and incorporate it in general circulation models, but see little evidence that either the direct or the indirect hypothesis can explain post-1975 warming.
This brief overview of the politics and science involved in the debate over greenhouse-gas-generated warming will be delivered from a point of view that is disinterested politically and without vested interests scientifically.
BIOGRAPH y
Jerry Osborn is a Professor of Geology in the Geoscience Department at the University of Calgary. His interests are surficial and Quaternary geology, with forays into geomorphology and engineering geology, and, on the side, interactions between science and society. His main line of research is Holocene climate change using glacial-history and lake-sediment proxies. Consulting activities have included aggregate searches, massmovement hazards analysis, flood hazard analysis, and studies of river migration as applied to boundary-law litigation. Included in the thousands of students that have passed through his introductory geology courses at the University of Calgary are many petroleum geologists working in Calgary. When time allows he searches for the perfect pumpkin pie recipe and teaches his kids the value of listening to Bob Dylan.
technicaL Luncheons MARCH LUNCHEON
How an underground approach to commercial bitumen development of the Grosmont Formation could maximize profitability and minimize environmental footprint
SPEAKERS
Jen Russel-Houston
Osum Oil Sands Corp.
Alan Abrams
Osum Oil Sands Corp.
CO-AUTHOR
Peter Putnam
Osum Oil Sands Corp.
11:30 am
tuesday, m arch 23, 2010
telus convention centre c algary, a lberta
Please note: the cut-off date for ticket sales is 1:00 pm, thursday, march 18, 2010. csPg member ticket Price: $38.00 + gst non-member ticket Price: $45.00 + gst
Each CSPG Technical Luncheon is 1 APEGGA PDH credit. Tickets may be purchased online at http:// www.cspg.org/events/events-luncheons.cfm.
In north-central Alberta near the town of Wabiskaw (the ‘Saleski’ region), substantial bitumen resources are hosted within the Devonian Grosmont Formation. The interval of interest is formed of four regionally consistent parasequences of carbonate platform origin; the upper two (Grosmont C, D) form the major bitumen reservoirs and the basal two (Grosmont A, B) form potential tunneling media. This presentation describes a commercial development concept that places the wellheads within a tunnel
system located in the Grosmont B limestone below the Grosmont C and D reservoirs.
At Saleski, Osum has identified 21 sections within its lands in Township 85 Range 18W4 that would make an ideal area for commercial development using an underground well recovery system. In this area, the Grosmont C and D reservoirs have predictable and easily correlatable associations of reservoir facies and an aggregate average net pay of 34 meters (>12% porosity, <50% Sw). Importantly, the tunneling medium within the limestone of the Grosmont B appears to be continuous and unkarsted, and the shaley non-reservoir base of the Grosmont C interval appears to be capable of acting as a basal seal to bitumen development in the reservoir above. The massive bitumen deposit, the predictable nature of the reservoir units, and the tunneling media in this area combine to make this an ideal area with which to plan this development concept.
The proposed underground well recovery system utilizes concepts which were developed within the McMurray Formation oilsands at the Underground Test Facility (UTF) near Ft. McMurray. The transformation of the proven recovery method at the UTF into a commercial production platform offers a viable, cost effective alternative to conventional surfacebased thermal techniques and it also has significant environmental benefits. By placing the network of roads, pipelines, and wellpads below ground in the tunnel complex, the surface footprint is reduced by an estimated 86 percent as compared to conventional in situ development. The ability to operate at minimal formation pressures as demonstrated at the UTF, combined with a centralized pumping system versus hundreds of in-line, downhole pumps, provides for potential lower fuel usage, corresponding greenhouse gas emissions, and considerable decreased operating costs. Sustaining capital costs are estimated to be 25% less due to reduced drilling costs, centralized pumping, and aggregate production. Additionally, the ability to operate year-round in a 15º C ambient climate eliminates many coldweather-related issues and offers the potential for increased productivity. Finally, the wellpairs do not penetrate the overlying cap rock or near-surface aquifers. In light of today’s challenges to develop oil sands resources in a greener and more efficient manner, the environmental and operational advantages offered by the underground well recovery system create the potential to change the way we look at bitumen extraction.
BIOGRAPH y
Jen Russel-Houston is the Geoscience Manager at Osum Oilsands Corp., where she leads the team in geological investigations related to thermal development of the Cold Lake Taiga Project and the Wabasca area bitumen-saturated carbonates. Prior to this she was the subsurface team lead for the thermal development of the Peace River Heavy Oil In-situ project with Shell Canada
Alan Abrams is the Vice President of Underground Operations at Osum Oilsands Corp., where he is responsible for providing overall direction for the application of the ‘Underground’ technique for in situ development, including both technology development and target assessment. He has over 30 years experience in underground tunneling and shaft-sinking construction including a wide array of projects in the heavy civil and mining industries.
Peter Putnam is a geologist with thirty years of global petroleum experience who has had substantial exposure to all aspects of the thermal recovery business. He currently holds the position of Senior Vice President, Geoscience for Osum. He is also the non-executive chairman of Petrel Robertson Consulting Ltd and the chairman and managing director of Central European Petroleum Ltd. Putnam is a past-president of the CSPG.
HUGH REID’S 2010 COURSES
PRACTICAL DST CHART INTERPRETATION
(Thorough Basic Course) April 5-8, 2010 (3.5 days)
16 WAYS TO IDENTIFY BYPASSED PAY FROM DST DATA
(More advanced, for those “comfortable” with DST charts) April 21-22, 2010 (2 days)
HYDRODYNAMICS SEMINAR
(Oil & Gas Finding Aspects) April 26-29, 2010 (4 days)
In-house courses available. For course outline visit: www.hughwreid.com
GEO CANADA 2010
CONVENTION DELEGATES, SPONSORS AND EXHIBITORS
WILL ENJOY:
• A 4-day Technical Program of Oral Sessions at the BMO Centre, May 10 – 13
• Three days on Exhibit Floor at the BMO Centre, May 10 – 12
• Three days of Poster Sessions on the Exhibit Floor, May 10 – 12
• A 2-day Core Conference at the ERCB Core Research Centre, May 13 – 14
• Various GeoCanada Community Outreach initiatives throughout the week
• Valuable short courses and field trips in the two weeks immediately before and after the Convention
• Exciting luncheon speakers May 10 – 12, plus a host of other exciting special events.
Please visit www.geocanada2010.ca for more information.
diVision taLKs BASIN ANALYSIS DIVISION
Airborne geophysical surveys for oil sands exploration and development
SPEAKER
Dr. Jim Henderson
Associated Geosciences Ltd.
12:00 noon, thursday, February 4, 2010 conocoPhillips auditorium, 3rd Floor 401 9th ave sW, calgary, alberta
The focus in Alberta’s oil sands deposits has changed drastically in the last few years from
obtaining leases to exploration and development of these leases. Airborne geophysical surveys are now playing a large role in the exploration and development of both in situ and surface mineable oil sands deposits. Through a series of case histories, the applicability of airborne geophysical surveys to meet a wide variety of objectives will be illustrated. For in situ oil sands deposits these objectives include mapping continuity of the cap rock, differentiation of Quaternary sediments (particularly identification of aggregates and impermeable borrow material), stratigraphic mapping, and paleo-channel mapping. For surface mineable oil sands, the objectives are similar but the mapping of rich versus lean oil sand and the presence of basal water sands can be added to the list. As part of the case histories, the advantages and limitations of airborne geophysical surveys will also be discussed.
diVision taLKs STRUCTURAL DIVISION
Low temperature thermochronology as a tool for dating deformation and constraining thermal evolution in sedimentary
basins: a case study from the Arabia-Eurasia Collision, Iran
SPEAKER
Bernard Guest
The University of Calgary
12:00 noon, thursday, February 11, 2010 room LPW-910, Livingston Place West 250 2nd st sW, calgary, alberta
The use of low-temperature thermochronometers in mixed-siliciclastic basins was limited in the past by a general lack of low-temperature thermochronology techniques (e.g., only fission track was used). Major advances in recent years have led to development of a fast and reliable technique for dating the thermal evolution of any basin that contains minerals like apatite, monazite, and zircon. This approach, called (U-Th)/He thermochronology, allows for the determination of two or more cooling ages for any rock bearing the appropriate minerals. We
have applied (U-Th)/He thermochronology in the Zagros Mountains of Iran to contribute to solving the long-standing problem of the timing of the Arabia-Eurasia collision while testing the analytical technique in a deformed marine, succession.
The timing and kinematic evolution of the Arabia-Eurasia collision remains controversial. This is in part due to the general lack of highresolution data constraining the timing and kinematics of deformation events, and partly due to a general lack of clear consensus as to what the term ‘collision’ means. Continental collision is here defined as: the moment when an active margin transitions from one dominated by negative buoyancy forces (subduction dynamics) where the regional stress regime is mainly extensional, driven by a slab sinking more steeply than it dips, to one dominated by positive buoyancy forces (collisional dynamics) where two buoyant plates converge and the stress regime is dominated by compression. It is in the context of this definition that the Arabia-Eurasia collision should be considered.
The onset of collision between Arabia and Eurasia has been variably estimated as occurring in the Cretaceous, Eocene, Oligocene, Miocene, and Pliocene. Our recent work in the High Zagros (HZ) and central Iran suggests that the shift from extension and regional subsidence to contraction and regional uplift began in the Oligo-Miocene. This result is based on U-Th/ He thermochronology on detrital apatite and zircon from the hanging walls and footwalls of the major thrusts and from xenoliths in salt diapers that have come up along the major faults. Similar thermochronological work
BIOGRAPH y
Dr. Jim Henderson obtained his B.Sc. from the University of Toronto and a Master’s and Ph.D. from the University of Calgary. He is currently the Vice-President of Geophysical Services at Associated Geosciences Ltd. in Calgary.
His first oil sands project was in 1977 and involved mapping a buried channel that posed de-watering issues for a surface mine and on the flip side was a source of sand and gravel. Since that time, he has been involved in many geophysical surveys with objectives ranging from pit wall stability to regional surveys mapping oil sands resource potential and water sources. Geophysical surveys have varied from airborne regional surveys to ground surveys to borehole and the integration of all of these approaches with drill-hole data to provide a geological interpretation.
on metamorphic core complexes in eastern Iran have yielded cooling ages that point to regional cooling and uplift at roughly the same time. An important outcome of this project is that we have demonstrated the power of lowtemperature thermochronometry to date the timing of structure formation while also constraining the thermal evolution of rocks being deformed in a mixed clastic-carbonateevapotite succession.
BIOGRAPH y
Dr. Bernard Guest’s background is in structural geology, clastic sedimentology, and thermochronology. He completed a Masters in Geology at the University of New Orleans (2000) working on the structural evolution of the eastern termination of the Garlock fault in southern California. He completed a Ph.D. in Geology at UCLA (2004) working on the structural and thermal evolution of the Alborz mountains, adjacent to the south Caspian Basin in northern Iran. This included a substantial component of low-temperature thermochronology at Caltech and UCLA. He later completed a postdoctoral fellowship at Caltech working on the evolution of the Stateline fault in eastern CaliforniaNevada. Subsequently, he has worked as an assistant professor at the University of Munich in Germany and recently moved to the University of Calgary where he is trying to build a Pure and Applied Tectonics laboratory (PATs Lab) that will merge field, laboratory, and computational techniques to address geologic problems of interest to industrial partners as well as to the scientific community at large.
INFORMATION
Structural Division talks run every month, generally the first Thursday. All are welcome to attend and there is no charge or registration. For further information or if you are interested in presenting a talk, please contact Darcie Greggs at 403-869-4840.
diVision taLKs PALAEONTOLOGY DIVISION
A tale of two reefs: coral reefs versus sponge reef mounds from the Western Atlantic JurassicCretaceous Shelf Margin
SPEAKER
Leslie Eliuk
Dalhousie University geotours@eastlink.ca
7:30 Pm
Friday, February 19th, 2010 m ount royal u niversity, room B108 c algary, a lberta
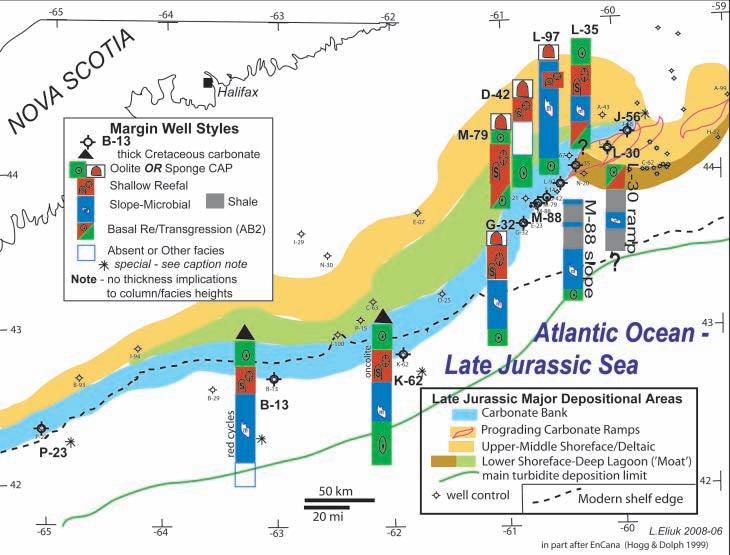
The very term ‘historical geology’ implies stories. So this is the second in a series of tales about the fascinating ancient reefs and carbonates buried offshore Nova Scotia and southward. In this month of the Winter Olympics, it might be fun to think about what it takes to win in the watery Reefal Olympics of the JurassicCretaceous seas off the North American Atlantic coast. It was a smaller ocean then but there were at least three competitors: coral reefs, sponge reef mounds, and microbial mud mounds. The microbialite tale was told in 2008 but we are happy to tell it again if we have time.
It turns out that as usual, where you compete and the conditions have a big effect on the outcome. The Abenaki Formation carbonate platform was flanked by the Sable paleo-delta that grew ever larger over the time span of the carbonates. Also there were changes in sea level and a different sea-water chemistry affecting the outcome. However, it may have been the fundamental differences in the paleobiology of the reef-formers themselves that made the biggest difference. Though corals and sponges live attached to surfaces and feed on other creatures, they have major differences in the size of food and the methods used to get it. In fact one particular group of now extinct corals called microsolenids mimicked the life
Simplified Abenaki Formation depositional facies and margin well styles to show parts of the sections dominated by shallow reefal facies (dominantly corals) versus sponge cap beds (dominantly lithistid sponge reef mounds and associated interbeds).
style of sponges and that allowed them to live in deeper and ‘dirtier’ waters with the sponges.
Ideally, using well exposed outcrop is the best way to ‘view the events’ and that is where we can get insights from analogues in Europe. But offshore we will have to settle for a small amount of core and a lot of well cuttings. Both are needed in deciphering this story of competition as it may continue over a vertical kilometre of carbonate. In contrast, beneath the Venture gas field, it all happens in less than 10 metres – and includes a miniature microbial mud mound.
Who wins in the Reefal Olympics of the J-K seas? If you look at the modern reefs such as those in Florida that are the direct and continuous descendants of the Abenaki, then the corals have won. If you look to the far future, we will have to wait to see whether the corals or microbialites and algae get the gold. But, if you need gas to heat your homes, then we all win since all three reef-builders and reef types contribute to the Deep Panuke gas field set to come on stream in 2010. We need to remind ourselves of the importance of former reefal organisms and their paleobiology not just for our own scientific interest but also for the economic aspect.
BIOGRAPH
y
Leslie Eliuk has a B.Sc. (1968) in Zoology/ Geology and M.Sc. in Geology (1969 in 9 months under Dr. Charlie Stelck on K/T palynology) from the University of Alberta and is apparently slowing down after four decades; he is now a Ph.D. candidate at Dalhousie University, Halifax, Nova Scotia (advised by Dr. Grant Wach). He previously spent 30 years as a Shell Canada petroleum geologist primarily concerned with carbonate reservoirs and sour gas. Then 10 years consulting on and studying mainly Jurassic-Cretaceous carbonates offshore Nova Scotia. Somehow, all those years have not diminished his enthusiasm for carbonates and reefs.
INFORMATION
This event is jointly presented by the Alberta Palaeontological Society, Mount Royal College, and the CSPG Palaeontology Division. For details or to present a talk in the future, please contact CSPG Palaeontology Division Chair Philip Benham at 403-691-3343 or programs@albertapaleo.org. Visit the APS website for confirmation of event times and upcoming speakers: http://www.albertapaleo. org/.
diVision taLKs ENVIRONMENT DIVISION
Wind energy and a vision for a prosperous and clean Alberta
Investment in wind energy represents one of the largest global business opportunities of the next decade. It has been estimated that over one trillion dollars will be invested globally in windenergy-related infrastructure by 2020. With Alberta’s world-class wind resources, deregulated power market, and pro-business attitude, it is possible for Alberta to realize significant economic benefits by taking full advantage of the wind-energy opportunity.
Wind energy is also the best short-term opportunity to improve Alberta’s environmental performance. The largest contributor to Alberta’s greenhouse gas emissions is not the oil sands, but rather power generation which is primarily based on the burning of coal. Significant short-term emissions reductions are possible in Alberta by utilizing proven, cost-effective and reliable energy sources like the wind.
In this presentation, a vision for a prosperous and clean Alberta through the large-scale adoption of wind energy will be shared. More specifically, this presentation will include an overview of the wind-energy industry, a discussion of barriers to its adoption in Alberta, and an examination of proposed policies such as a clean electricity standard, which are essential to Alberta realizing its full wind-energy potential.
BIOGRAPH y
Dan Balaban is the Founder, President, and CEO of Greengate Power Corporation, a leading Calgary-based renewable-energy developer. Greengate is focused on the development of quality wind-energy projects in Alberta in areas with access to existing transmission infrastructure. Greengate is currently developing nine wind-energy projects across Alberta totalling 1,550 MW. It expects to commence construction on Alberta’s largest wind energy project, the 150 MW Halkirk I Wind Project, in 2010. Prior to starting up Greengate, Balaban was the Founder, President, and CEO of Roughneck.ca Inc., a leading provider of software solutions to the Canadian oil and gas industry. Balaban has also worked as a management consultant with Ernst & Young and PricewaterhouseCoopers.
Balaban graduated from the University of Toronto with a B.Sc. in Computer Science. He is a member of the Canadian Wind Energy Association, and was selected as one of Avenue Magazine’s ‘Top 40 under 40’ for 2009.
INFORMATION
All lunch talks are free and open to the public. Please bring your lunch. For information or to present a talk for the Environment Division please contact Andrew Fox at andrew.fox@megenergy.com.
Environmental Responsibility
CGGVeritas is committed to environmental responsibility in all of our operations. With experience working in some of the most sensitive regions of Canada and the world, coupled with an industry-leading QHSE record, we can acquire your seismic data with minimum environmental impact.
Count on CGGVeritas to help you explore, develop and produce with confidence.
INTERPRETATION OF TRANSGRESSIVE BARRIERBEACH, SHOREFACE, LAGOON, AND ESTUARy RESERVOIRS - USE OF MODERN ANALOGUES
Part 1 – Variability in Sub-Environments and Depositional Settings
| by Gerry Reinson
IINTRODUCTION
A major tenet of sedimentary geology is ‘the present is the key to the past,’ and our current understanding of sedimentary deposits certainly derives from observations of, and studies on, modern settings. This is especially so for reef and platform carbonates, alluvial systems, classical deltas, and even deep-water turbidite settings. Although the study of modern coastal barrier-beach and related estuary environments has enabled the identification and mapping of such subsurface reservoirs, their complexities, particularly with respect to variations in size, geometry, and orientation, is still not always recognized or appreciated. The objective of this threepart series of papers is to illustrate this complex variability using microtidal and high mesotidal transgressive settings from the Southern Gulf of St. Lawrence and Northwest Oregon coasts, respectively. The modern examples illustrated here are not unique: similar systems do occur worldwide in transgressive settings, and display the same combinations and variability of environments.
Part 1 deals with sub-environments and
depositional settings, Part 2 with sand-body depositional geometries, and Part 3 with subsurface mapping and interpretation.
SUB-ENVIRONMENTS:
ORIENTATION AND SCALE
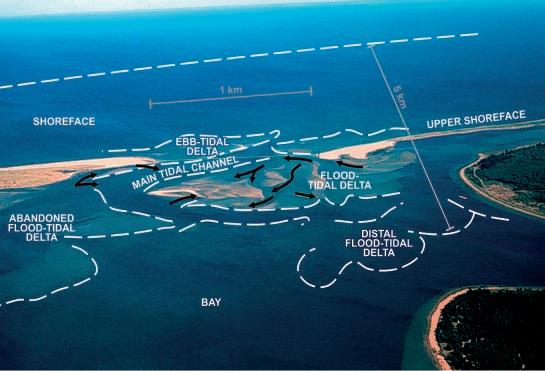
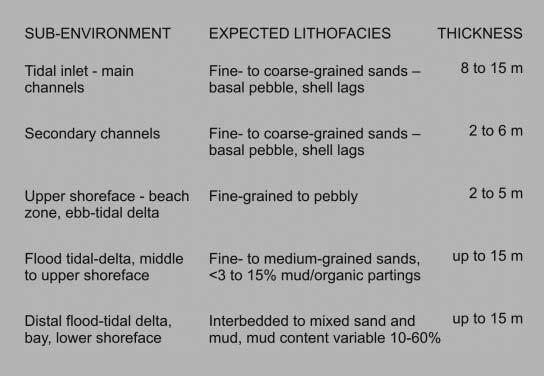
The relatively small barrier / estuary complex in Figure 1 illustrates the wide range of sandy sub-environments that can occur in such settings. The subenvironments are intrinsically associated, and of course, all can be present in similar settings elsewhere, though not necessarily of similar orientation and scale. Specific sizes and resultant lithofacies to be expected in a system such as the Kouchibouguac example are given in Figure 2.
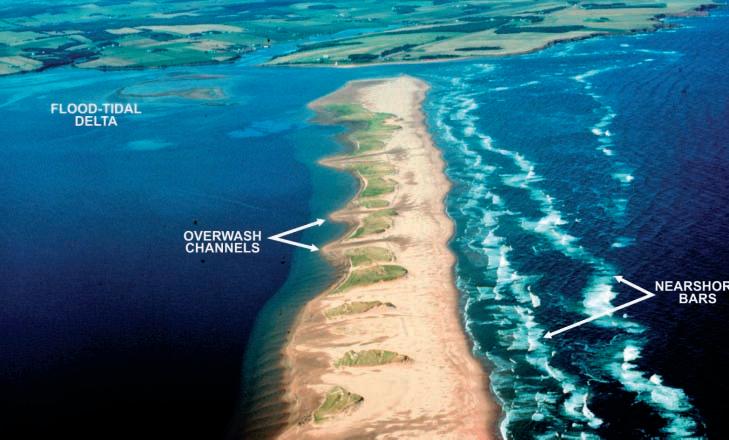
It is emphasized once again that every estuary / barrier setting will be different with respect to degree of prevalence of one sub-environment over another. These differences also apply to the resultant sand bodies generated in terms of their geometry, orientation, and scale. This is amply illustrated by the estuary / barrier spit at Cavendish Beach / New London Bay, Prince Edward Island (Figure 3). In
this setting a highly complex barrierbeach/shoreface wedge (characterized by multiple washover fans and three landward-migrating, wave-formed nearshore bars) is transgressing rapidly landward, but also westward along strike due to strong longshore drift. At the distal end of the barrier spit, a large flood-tidal delta deposit has formed, resulting in termination of the linear sand body into a circular geometric form. The sand body that could be expected to be preserved in the Cavendish scenario will be much different than that at Kouchibouguac. Preservation potential and sand-body geometry will be discussed in Part 2 of this series.
DEPOSITIONAL SETTINGS
The concept of ‘depositional setting’ is often either ignored or misunderstood, when interpreting the presence of coastal and nearshore sand bodies in the rock record. It is still not fully appreciated that depositional setting can vary tremendously both locally and on a regional scale. The need to fit recent popular paradigms to our observations often mitigates proper interpretation of reservoir sand-body
Figure 1. A small transgressive barrier-island / estuary complex in Kouchibouguac National Park, New Brunswick (arrows indicate positions of secondary tidal channels).
Figure 2. Depositional sub-environments and resultant deposits characteristic of the system illustrated in Figure 1. The sediment body, after complete transgression, could be expected to consist of several sub-facies with a total thickness varying from 5 to 15 metres. Bioturbation characteristics will also vary to some extent according to the various sub-environments (see Pemberton et al., 2001).
geometries and subsurface trends. It should be remembered that basin-wide allogenic processes do not have to be invoked to explain the presence of wide variations in estuary / barrier sand deposits both within, and between, coastal segments. Autogenic processes alone are sufficient to induce wide variations in estuary / barrier coastal settings over relatively short distances (Figure 4). Wave climate, tidal range, river discharge, drainage basin size (which is related to antecedent topography), and sediment supply, are all interrelated, and govern the size, orientation, and geometry of sand bodies in any given coastal segment. In other words, we should not hesitate to propose, and in fact should expect to encounter, drastically different sand bodies in proximity in the subsurface.
When undertaking subsurface mapping, it is also important to recognize the regional depositional setting in which one is working. For example, the prograding Belly River succession should not be expected to contain closely spaced sand depositional scenarios such as in Figure 4. In contrast, transgressive settings such as those in the Viking, Ostracod, and Bluesky formations should be expected to contain deposits similar to Figure 4 and the modern settings illustrated in this paper.
Other paradigms that should be viewed with caution are ‘low-stand sand deposit’ and ‘tripartite estuary.’ While both are important conceptual and indeed real depositional occurrences, such deposits do not always exist in every depositional setting. In the case of low-stand sands,
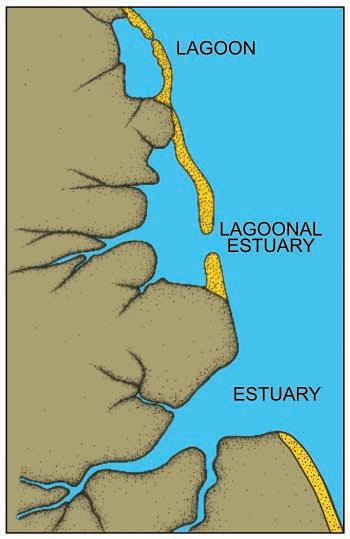
these deposits have often been removed during transgressive erosion. With respect to estuaries, the tripartite concept is real when referring to depositional realms (i.e., marine, fluvial, mixed marinefluvial). However, this three-part realm concept does not always translate into the preservation of three corresponding recognizable deposits in the rock record (i.e., bayhead delta, central basin mud, baymouth sand). It should be remembered that as a depositional model the tripartite estuary is only one type in a spectrum of estuary types (i.e., Figures 4 (below), 5 (page 18)). A detailed and comprehensive review of estuary settings can be found in Boyd et al. (2006).
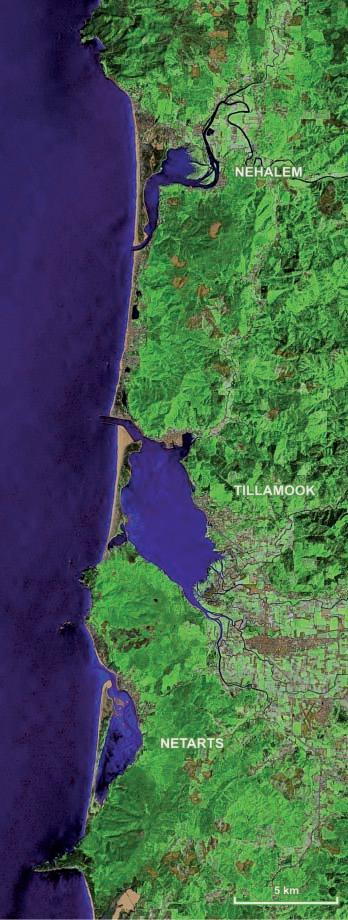
Coastal segments from contrasting tectonic regimes can display similar sets of depositional environments and resultant sand bodies. The ‘leading edge’ coast of northwest Oregon (Figure 5, page 18) displays an array of transgressive depositional environments including mainland-attached beach, lagoonal estuary (Netarts), tripartite estuary (Tillamook), and riverine estuary (Nehalem). All three estuaries are partially enclosed by barrier beach / spit complexes, reflecting the high rate of sediment supplied through littoral drift in the nearshore zone. The main factors governing sand body variability in this coastal segment are the rates of littoral sediment input and the extreme differences in drainage basin area and configuration between the three estuaries (Reinson and Lavigne, 2008). Controlling factors such as tectonics, eustasy, wave climate, maritime climate, and tidal regime, are relatively constant throughout this segment.
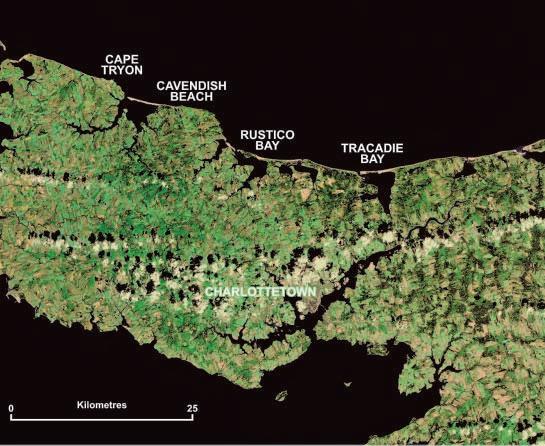
The ‘trailing edge’ coast of Prince Edward Island (Figure 6, page 18) also displays an array of transgressive depositional environments with contained sand bodies of similar size, orientation, and geometries to those present on the Oregon coast. The important point here is that sanddeposit variability within this coastal segment is also very high even though tectonics, eustasy, wave and maritime climate, and tidal regime are constant. The supply of littoral sand is less here than on the Oregon coast, though highly variable due to varying rates of sea cliff erosion. Antecedent topography appears to play the main role in controlling the relatively small but variable drainage-basin sizes.
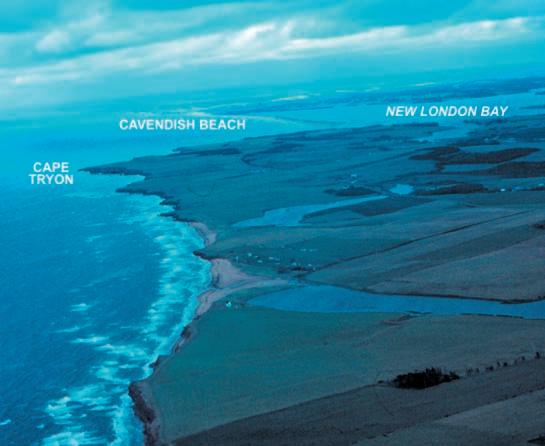
STRANDLINE VARIABILIT y
The variability in sand-body orientation and scale, as well as continuity, is clearly evident when comparing the mainlandattached beach segment west of Cape Tryon (Figure 7, page 18), with the Cavendish Spit segment east of the Cape (Figure 3). It is apparent that the strandline is not at all linear over relatively short distances since the spit is highly offset to landward relative to the headlands (Cape Tryon) to the west. The coastal segment in northwest Oregon (Figure 5, page 18) also displays significant landward offset of the linear barrier islands between headlands.
(Continued on page 18...)
Figure 3. Westward oblique aerial view of Cavendish barrier spit and New London Bay, Prince Edward Island. The linear sets of breaking waves are the expressions of shoreward-migrating shoreface bars.
Figure 4. Diagram illustrating the gradational morphological relationship between lagoons, lagoonal estuaries, drowned river-valley estuaries, barrier islands, and mainland-attached beaches (modified from Reinson, 1992).
(...Continued from page 17)
These types of ‘trendologies’ exhibited in Prince Edward Island and northwest Oregon are not often recognized during subsurface mapping of coastal deposits. It should be evident that although a strandline (shoreline) is continuous in nature, over significant distances its linearity is not, nor is the continuity of the associated sand deposits. At the present time, subtidal shoreface sands offshore Prince Edward Island and Northern Oregon, are probably continuous (or nearly so). Under continued and sustained sea-level rise however, the continuity will likely be broken in front of headland areas. This would result in a series of segmented, discontinuous sand bodies roughly parallel (on a grand scale) to regional strike. Preservation of thick shorefaces would occur mostly at entrances to bays and river mouths – in other words at in-fill or ‘sink’ localities. Highly segmented nearshore sand bodies in the rock record are a characteristic of transgressive settings. Once the transgressive nature of the subsurface unit we are mapping is established, our ‘trendology’ interpretation should include a scenario such as presented here – that of a very discontinous set of linear, lobate, and semi-circular sand bodies whose thick axes may be orientated normal, oblique, or parallel, to the ancient strandline. Such trends are merely reflecting the paleotopography of the ancestral depositional surface.
In Part 2 of this series, the types of sand-body geometries that would be generated (and likely preserved) from the various coastal depositional types, will be discussed. Factors such as vertical.
sequences and log signatures, lateral variations, and bounding surfaces will be illustrated and emphasized.
REFERENCES
Boyd, R., Dalrymple, R. W., and Zaitlin, B. A. 2006. Estuarine and incised-valley facies models, In: Facies Models. H. W. Posamentier and R. G. Walker, (eds.). Society of Paleontologists and Mineralogists, Special Publication 84, p. 171-235.
Pemberton, S. G., Spila, M., Pulham, A. J., Saunders, T., MacEachern, J. A., Robbins, D., and Sinclair, I. K. 2001. Ichnology and Sedimentology of Shallow to Marginal Marine Systems. Geological Association of Canada, Short Course Notes 15, 343 p.
Reinson, G. E. 1992. Transgressive barrierisland and estuary systems, In: Facies Models, Response to Sea-Level Change. R. G. Walker and N. P. James, (eds.). St. John’s, Newfoundland, Geological Association of Canada, p. 179-194.
Reinson, G. E. and Lavigne, J. 2008. Variability in estuarine systems as a function of drainage basin style, north Oregon Coast – implications for interpretation of sandstone reservoirs. Program with Abstracts, 2008 CSPG CSEG CWLS Annual Convention, p. 13.
Figure 5. Satellite image of estuary types along the north Oregon coast (Source: United States Geological Survey, Department of the Interior).
Figure 6. Satellite image of the north coast of Prince Edward Island (Source: Department of Natural Resources Canada).
Figure 7. Eastward oblique aerial view of the mainland-attached shoreface / beach segment adjacent to Cape Tryon, north coast of Prince Edward Island.
ROCK SHOP
Anne Hargreaves, P.Geol. Manager
Tel: 403.284.1112
Cel: 403.862.3319
Fax: 403.284.1115
anne.hargreaves@canstrat.com www.canstrat.com 1, 4639 - 6 Street
Calgary, Alberta T2E 3Z6
Anne Hargreaves, P.Geol. Manager
Tel: 403.284.1112
Cel: 403.862.3319
Fax: 403.284.1115
anne.hargreaves@canstrat.com www.canstrat.com
1, 4639 - 6 Street NE Calgary, Alberta T2E 3Z6
REMOTE SENSING FOR GEOLOGISTS III
Thermal and Microwave Remote Sensing
| by Dr. Mryka Hall-Beyer
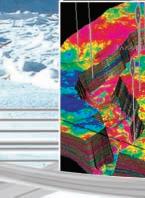
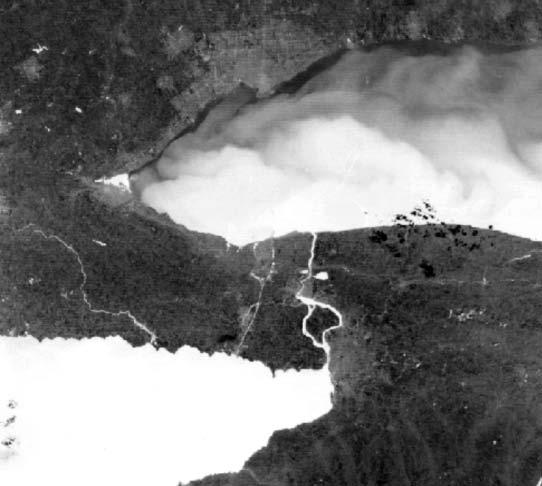
Figure 1. Landsat night-time tir image showing Lakes Erie and Ontario, including Buffalo and Toronto. Warmer temperatures show as lighter tones. Direction of flow of the Niagara River (centre) from south (the warmer L. Erie) to north (cooler L. Ontario) is evident. Currents in L. Ontario and Toronto’s cold waterfront show up well. The black specks centre right are (cold) clouds (source: NASA http://rst.gsfc.nasa.gov/Sect9/ Sect9_6.html).
Thanks to the geologists who have responded to the first two articles about remote sensing (RS). Among them was Gary Pobst, whose book: Remote Sensing for Geologists: A Guide to Image Interpretation (Taylor and Francis, 2001), is an excellent work and I highly recommend it for both theory and practice. I will be talking more about information sources later.
Remote sensing as I’ve defined it images only what is on the surface. When a geologist starts a project that might use RS, the first question has to be “What do I want to see that is on the surface and not covered by uninteresting material?” For some geologists, this might just close the subject, unless they are looking for outcrops in remote areas. However there is a second question: “What is there on the surface that can give me information about what is below?” In other words, is there a surrogate on the surface for what you want to locate? Might an oil seep or an unusual metal concentration affect the chemistry of vegetation? Might alteration products colour soils, or leach out of soils and colour water bodies? Might the surface tension of water be affected by something in it (like an oil seep or slick), and so change the regular pattern of small waves on the water surface? Finally, even if you
Agency 2005).
can’t see the surface you want, could it be imaged by non-visible wavelengths?
Last month, I summarized the most common uses of the most common images, namely classification of ground cover for each pixel, using moderate-resolution multispectral images that record reflected sunlight in wavelengths from about 400 to 2.5μm. I also mentioned a form of spatial enhancement that will highlight ‘visual edges,’ abrupt changes from bright to dark on the image. These edges might represent shadows that are surrogates for things like fault lines or other structural features, or help with stratigraphy made visible by differential erosion.
T HERMAL RS
The useful electromagnetic spectrum does not stop at the short-wave infrared. The thermal infrared (tir) is the next longer wavelength division, and is very useful for geological applications. The tir includes roughly 3 to 20 μm waves, but RS uses mainly 8-13 μm because of atmospheric absorption in other tir wavelengths. Just as our eyes are adapted to the large amount of radiation received from the sun, so our skin senses the tir. While we can sense distance and direction of a heat source, we are not
accustomed to presenting this in an image or map format.
Tir presents a conundrum: we are measuring tir energy that is reflected by objects but also energy that is emitted by them. Physics says the amount of electromagnetic radiation emitted by any object depends on the temperature of the object, and that the range of wavelengths emitted is also determined by temperature (the StefanBoltzmann Law and Wiens’ Displacement Law). The sun, being extremely hot, emits a lot of radiation, maximized in the visible. As you get farther away from this wavelength, less and less radiation is emitted, though because the sun is so hot and emits so much, there is a bit even at wavelengths quite far removed from the visible. These can be reflected by objects. Likewise, the Earth’s surface has a characteristic emission profile of wavelengths and amount – much lower intensity and longer wavelengths than the sun, of course. Earth emissions peak in the tir. So, a tir sensor receives both emitted and reflected radiation.
Any geologist who has walked on a glacier in bright summer sunlight knows about reflected tir radiation, making the air at knee height quite hot whereas the ice surface
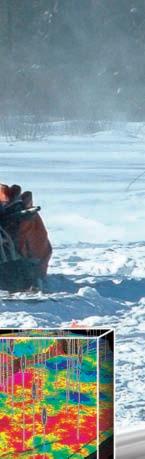
Figure 2. Radarsat 1 image of the Gulf of St. Lawrence showing ice and current formations. Radar images have one band only, so appear as grey scale (source: Canadian Space
remains cold. Each object has a characteristic tir reflectance, just like it has a characteristic visible reflectance. But each object as well has a characteristic emissivity. This allows us to convert emitted thermal energy to actual (kinetic) temperature of the object, but it only works if we measure emitted, not reflected, tir radiation. How do we separate emitted tir from reflected solar tir? Plus, of course, the non-reflected (absorbed) solar radiation of any wavelength can heat up an object and change its temperature, and hence its emissions. Finally, just to make things even more annoying, different objects retain heat (or not) at different rates: just compare touching aluminum foil and a cast iron pan two minutes out of the oven!
All these complications make it complex to interpret tir images, but they also mean there is more potential information available. The most common way around the emissions / reflections problem is to acquire tir images at night when there is no incoming solar thermal radiation to be reflected. Hence the usefulness of night-side Landsat images. But even excluding reflected tir leaves us with some problems. If a pixel contains different objects with different emissivities, they get averaged over the pixel area. So on land, it is hard to get kinetic temperature. However water or snow / ice covering a large area means no mixed pixels, and we can quite easily obtain real temperatures of water surfaces. Sea surface temperatures (such as the maps tracking El Niño development) are derived in this way, using many sophisticated techniques using several different tir wavelengths to eliminate atmospheric interference.
Even if we cannot get surface temperatures on land, Figure 1 shows that we can see relative temperatures. Aerial or even handheld tir imaging is used to find lacking insulation in houses or to track heat loss from whole blocks of buildings, in the interests of improving building energy efficiency (for an example see Balaras and Argiriou, 2002).
Why do geologists use tir? First, to find warmer surfaces. Rising magma heats up the overlying rocks and may appear as a warm area. Lava flows are hot enough to appear bright not only on tir images but can also emit energy in the visible range, showing up nicely on vir images. These help forecast eruptions in unmonitored areas, and inventory eruptions in uninhabited regions. We can track
lava cooling rates using multi-temporal tir imagery. Thermal springs that may help define subsurface structure and hydrology show up on night-time tir images. Seismic activity may expel detectable warm water (Chen et al., 2006).
Tir images can identify rock types that have quite different ways of warming up in the daytime and cooling off at night. Floyd Sabins Jr. did much of the early research in this area using the southwestern US desert, and his 1969 work remains unsurpassed (Sabins, 1969). A more complete summary is in his textbook (Sabins, 2007). In essence, you compare tir images from just after sunset with those near dawn, and so can distinguish rocks that keep their heat from those that do not. The heat vs. time profile of different formations can be calculated and used much like a spectral reflectance curve.
Pixels on tir satellite images are larger than vir, because the lower amount of tir energy per unit area requires viewing a larger area to accumulate enough to record. Landsat images from 1983 through 1999 have thermal bands with 120m pixels (as opposed to vir’s 30m). Since 1999 Landsat tir is available at 60m, and in two formats for detecting cooler and warmer temperatures. Like all Landsat images, these are available at no cost; they are also of the same area and at the same time as the vir images, allowing information synergy. Tir band(s) are also available for many coarserresolution images such as MODIS (1 km pixels) that are also freely downloadable. These are used mostly for oceanic and atmospheric applications. There are also scores of specialized tir sensors: a Google search would be far more productive than anything I can say here briefly.
M ICROWAVE AND R ADAR RS
Tir is somewhat exotic, but still within our sensory experience. At still longer wavelengths, though, we have nothing to relate to personally, although the principles are not different from those used in the vir and tir. Let’s take an example. When Canada’s Radarsat 1 was launched in late 1995, some of the first images beamed down showed the Gulf of St. Lawrence, with two curving lines stretching from shore to shore like enormous drift nets. No air photo ever showed this: what could it be? The wavelength used by Radarsat 1, 9.4 cm, is just right to show surface roughness in the centimetre range. After much discussion, it was hypothesized that the curving lines were small tidal bores, whose continuity across the Gulf had not been suspected. Moral of the story: thinking of images as though they were black and white photos won’t work. Figure 2 shows what such an image looks like, though I have not found the particular image described.
How do we approach ‘exotic’ wavelengths, then? First, by understanding the phenomenon they record. Suppose you want to remotely find the spacing of trees in a forest. You would not send longer-wavelength Godzilla, who would just step over (or on!) the forest. Nor would you send a shorter-wavelength ant, whose likelihood of encountering two adjacent trees is pretty small. No, you’d send something about the same size as the expected tree spacing, maybe a person with outstretched arms. It is similar with wavelengths in RS: the phenomenon they will best report on is from about 0.1 to 10 times the size (wavelength) used.
Visible and near- to mid-infrared radiation reports on molecular distances – chemical composition. Radar uses radiation in the microwave (‘μwave’) range, roughly from 1mm to 1m. For purely historical reasons, people working with μwaves use frequency rather than wavelength (the two are simply related by the speed of light). So we could also say 0.3 to 300 GHz. Microwave ovens use a very narrow waveband in this range (2.45 GHz or 0.3mm) that is strongly absorbed by water, fats, and sugars to produce heat in the food. Microwaves are also used in communication. However our RS interest lies in detecting and recording μwaves that are naturally emitted by earth-surface objects, or those that are reflected by them.
on page 22...)
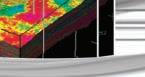
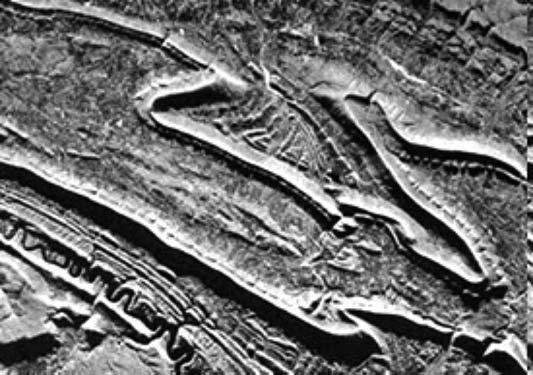
Figure 3. Geological structure (synclines in Pennsylvania) highlighted by radar shadows. This effect works equally well for exposed rock, vegetation-covered rock, and on extraterrestrial bodies (source: Natural Resources Canada). (Continued
Because μwaves are so far from both solar and earth-surface emission maxima, there is very little energy emitted and almost none to be reflected. Looking first at emitted μwaves: since there is so very little energy, we have the same problem as with tir, only more so. Passive (emitted) μwave images have extremely coarse resolution, with pixels of 12.5 to 50 km on a side. This is a far cry from the visible imagers’ tens of metres. Working on regional scales, though, this is not a problem. The most readily available passive μwave imagers measure differences in water content in the atmosphere, and snow cover and sea-ice characteristics. The near realtime sea-ice concentration maps important for arctic navigation are prepared by the NSIDC from NOAA’s ‘DSMP SSM/I’ instrument (Maslanik et al., 2009).
If there is not much emitted radiation in the μwave range, and there is virtually none incoming from the sun to be reflected, an obvious solution is to provide artificial incoming μwaves. This is what Radar does. Knowing about the precise wavelength, time, and geometry of the antenna emitting the μwaves, we have a lot more information about the data we get back and can do a lot more with it. Since Radar does not rely on the sun, we can use it at night. The μwaves used by Radar RS pass unabsorbed and unscattered through clouds. These two characteristics make Radar ideal for observing the dark, cloudy arctic and the cloudy tropics. Arctic applications explain why Canada has concentrated its RS efforts on Radar, launching Radarsat 1 in 1995 and Radarsat 2 in late 2007 (more information about Radarsat 2 and the science connected to it: http://www. radarsat2.info/).
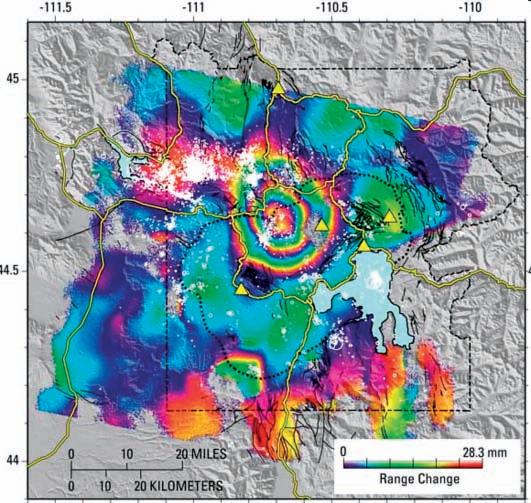
5. Repeat-pass Radar interferometry comparing surface elevations in 1996 with those in 2000. Each ‘fringe’ shown by a rainbow colour cycle shows a 28.3mm elevation change. This shows the basic data: the fringes can be ‘unwrapped’ to create a map of total elevation change (source: Brantley et al., 2006).
Radar images tell us what portion of the outbound waves came back to the sensor. More return – brighter image area. The geometry of emission and reception (to the side rather than straight down) gives us shadows. If a geologist is looking for differential erosion patterns
or topography created by faults, these shadows can be very useful to highlight topographical differences (Figure 3, page 21). The user chooses incidence angles and directions when ordering a Radar image, and lower angles make the shadows more prominent.
Microwave reflection is controlled by two things: roughness of the surface in the mm to cm range, and dielectric constant. Why roughness? Incoming waves get scattered in various directions by differently oriented parts of the ground. Some of the incident μwaves scatter back towards the receiver, but on a rough surface many more scatter in other directions, never to be recorded. A perfectly smooth surface reflects all waves away, like a mirror, giving a black area on the image. Rougher surfaces appear lighter (more returning radiation) than smooth ones. Scattering is related to the wavelength: what appears smooth to a very long wavelength may appear rough to shorter ones (analogy: fabric that feels smooth to your 1cm fingertip may feel rough when probed with a 1mm fingernail). Thus, within an image you can see which areas are rough and which are smooth. Comparing images using multiple wavelengths could give a better idea of the dimensions of the roughness. Unfortunately, the power required to send out the waves means that we do not commonly have ‘multispectral’ satellite Radar images – yet.
Geologists can use roughness to look at outcrop-scale erosion texture and patterns. Rock surface texture can in theory be detected, but don’t forget the dimensions of roughness. We are talking mmto cm-height differences, not the difference between sand and silt. The pixel size of radar images is in the mid-range of vir images, a few meters to 100s of meters. If the surface being examined is very much smaller than this, the image will not be useful.
The other major surface characteristic that influences microwave reflectivity is the dielectric constant (k) of the imaged surface. K is distinct for metals, so human artefacts like bridges and vehicles show up very well. For natural surfaces on Earth, k is a near-perfect surrogate for water content. The higher the water content, the more radiation is absorbed, thus the darker the area on the image. This is useful when looking at differences in soil moisture,
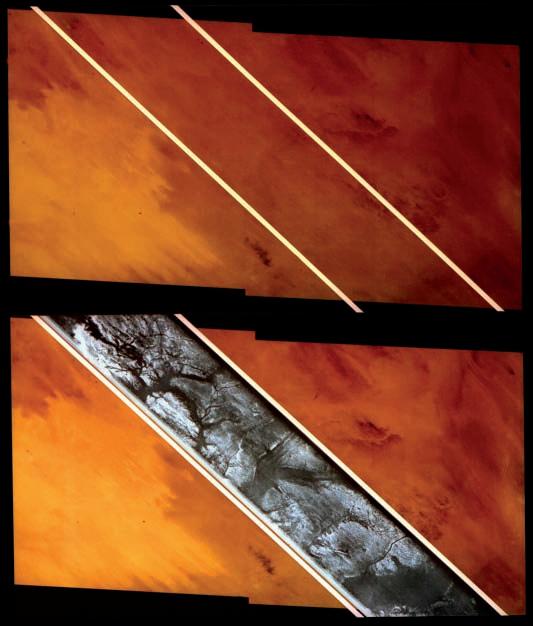
Figure 4. Top shows visible image of eastern Sahara. Strip on bottom shows longwavelength Radar image revealing ancient river channels (dark) (source: JPL/NASA).
Figure
for example. But there is a conundrum. With both roughness and water content combining to determine the tone on the final image, how do you tell one from the other? There is no easy answer. Suffice it to say that if you want to know about water content, better compare two areas with similar surface roughness (e.g., fields ploughed and cultivated the same way). If you want to compare roughness, better use areas with nearly the same water content. Dark areas on Radar imagery of the southern polar area of the Moon led scientists to hypothesize that there might be some unexpected water there – but was it just an abnormally smooth surface instead? RS came to the rescue. First, the unique spectra of hydroxylcontaining minerals were used to confirm their presence (Phillips, 2009). Then, in November 2009 NASA slammed a spent rocket into the area to throw up material and analyse the spectra. It was indeed water (Dino, 2009).
As a result of the k/roughness confounding variables problem, much radar imagery is used in areas where the surface is a single substance (same k), such as water or ice. Telling newly formed ice from thicker ice, for navigation, relies mostly on roughness, although differing salt content in the ice alters the k. Radar is used to distinguish multi-year ice from single-year ice, as we hear a lot about in the summer these days. For a good summary, see Barber et al. (2001).
In 1981, the Space Shuttle acquired a famous Radar image in the Sahara. Since Saharan sand is reasonably uniform as to roughness, and is absolutely dry, long-wavelength radar is able to penetrate it to a depth of a few metres. The image (Figure 4) showed dark where paleo-channels buried under a metre of bone-dry sand were just damp enough to absorb the radiation. Areas without these channels remained light-toned. This situation is very unusual, and only works because of extreme surface dryness. It has unfortunately led many people to mistakenly believe that Radar images can image tens of metres beneath the surface anywhere.
Since we control the Radar μwaves, we can get other information. The emitted waves can be polarised. Some surface objects partially depolarize the incoming waves, changing the polarisation state reflected back to the sensor. Depolarization is a property of objects, just like spectral reflectance, and might help identify them. Since this is an area of a lot of ongoing research, I won’t go into it here (see CCRS, n.d.).
A second novel use of Radar, one that is very important to geology, is possible because we know exactly when the μwaves were emitted from the antenna, and their phase. We can measure the return time and phase and turn this into precise distances to the ground. This Radar interferometry allows us to construct very precise surface elevation models, and to detect changes in elevation or position on the order of 0.1 wavelengths (so in the mm range). Radar interferometry on the Space Shuttle in 2000 produced a 90m-pixel global elevation model, to 1m vertical precision, between 60°N and 56°S (Farr et al., 2006). The uses in regional
erosion and landform studies are obvious. The same process can produce much finer resolution for local studies. Interferometric data can track swelling of volcanic edifices. It can track ground movements along faults, and paint a picture of the spatial variation of these movements (Figure 5). Interferometry may be done from satellites, but also is often flown on aircraft for specialized local purposes.
The Radar we commonly see in weather sites (for example http://www.weatheroffice. gc.ca/radar/index_e.html) is ground-based, (Continued on page 35...)
BAKKEN BEYOND! AND
PETROLEUM ECONOMICS FOR GEOLOGISTS
Part 5 – Capital and Operating Costs
| by Colin Yeo, P.Geol. and Lionel Derochie, P.Eng.
So far in this series, we have focused on revenue which is a combination of price, product, and volume. Now we begin to look at the costs and burdens associated with a project, namely, capital costs, operating costs, royalties, encumbrances, and taxes. Very simply, revenue minus cost is operating income or cash flow from the capital investment.
In the oil and gas industry, an asset is any property that generates, or has the potential to generate, a future cash-flow stream. A company comes to own an asset by deploying capital towards either exploration and development expenditures or by purchasing an existing asset from another company. Operating costs are expenses that enable the asset to continue generating the cash-flow stream. Both are critical to the profitability of the project.
C APITAL COSTS
As geologists, we generate prospects that are conceptual in nature. They are only ideas and they don’t generate cash flow but, with capital investment, ideas can be turned into cash flow. Land is procured through Crown sales, negotiating leases from freehold owners, or by joint ventures and farm-ins. Seismic data is acquired over the prospect. Delineation and development wells follow successful exploratory wells. Surface equipment is installed and connected to an oil battery or a gathering system, pipeline, gas plant, and associated facilities.
Additionally, capital may be spent on an existing producing property to expand its productive capacity by drilling additional wells, installing bigger pumps, wellhead compression, or adding processing capacity at a gas plant. Capital may be spent at any time on a property with the intent of generating incremental cash flow and as long as the net present value of the incremental cash flow stream meets or exceeds corporate hurdle rates and capital funds are readily available, capital investments will be made.
TAX IMPLICATIONS
Capital costs are categorized differently for tax purposes and are written off at different rates that affects taxable income. Land is placed in the COGPE category (Canadian Oil and Gas Property Expense), seismic and exploratory drilling in CEE (Canadian Exploration Expense), and development drilling and surface equipment in CDE (Canadian Development Expense).
ESTIMATING C APITAL COSTS
Most geologists working at oil and gas companies have access to team members who can provide capital cost estimates. Mineral Landmen provide estimates of land bonuses and geophysicists estimate seismic acquisition costs. Drilling and completion engineers work with service company representatives to generate drilling and completion AFEs (authority for expenditure). Similarly, facilities engineers estimate the cost to equip and tie-in wells
and, if necessary, build gas processing plants.
By comparing actual costs to estimates, systemic causes of cost over-runs can be identified, presenting opportunities for correction. If these over-runs are persistent and are unpredictable, a contingency can be applied to future cost estimates making upward adjustments to match historic trends. When this problem is eventually resolved, the factor can be reduced or removed.
If the prospect is in a new area for a company with no historical cost data, general industry trends can be used as a guide to capital costs. Trade associations, like the Petroleum Services Association of Canada (PSAC), report average oilfield service costs for specific geographical regions of Western Canada.
One comprehensive source of high quality, detailed information is petroCUBE. This database is compiled, reviewed, and analyzed by AJM Petroleum Consultants Ltd. and is available online or as a module through the geoLOGIC Systems Ltd. geoSCOUT platform. Figure 1 shows the Group Economic Parameter report for the Lower Mannville in West Central Alberta. Here, capital costs (drilling and activation costs on the sheet) include land acquisition, seismic, drill and abandon, drill and case, abandon and reclamation, complete, equip, and tiein costs. These costs are based on one
Figure 1. petroCUBE Group Economic Parameter report lists various capital costs by region and stratigraphic intervals. These costs are based on PSAC data.
Value Navigator’s Capital Cost Input Sheet
Figure 2. Value Navigator’s capital cost input sheet schedules costs over time and allocates costs to appropriate tax categories. For illustrative purposes, the CEE category is shown but other classes are
spacing unit that is 256 ha for gas wells. This information is gathered from service company averaged data through PSAC by area and is augmented by AJM’s extensive proprietary research and evaluation studies. This information is an excellent source of capital cost data when corporate estimates are not available.
Figure 2 shows the capital cost input screen where data is entered into Value Navigator’s economic modeling package. It is important to allocate costs to the proper tax category so that the program can apply appropriate tax credits when calculating after tax NPV. It is also important to ensure that future capital costs have been inflated for the year of expenditure. By ensuring Value Navigator’s inflation escalation option is activated, both capital and operating costs will be automatically adjusted for forecasted inflation rates. Remember that oilfield inflation rates are sometimes different than the Consumer Price Index.
OPERATING COSTS
is beyond their control. In recent years, electricity costs have increased dramatically and options, such as converting electric compressor drivers to gas-fired engines, are often not practical. While operating costs are not the most important factor in project profitability (price is), those projects with the lowest operating cost generally have the highest netback per barrel or Mcf and attract additional investment capital.
While capital costs create an asset, operating costs enable the asset to continue producing a revenue stream. Figure 3 itemizes many of the costs that are incurred in producing an oil or gas well, demonstrating the complexity of production operations. All of these material and labour costs are subject to inflation and will eventually cause a property to become uneconomic over time as volumes naturally decline. Production engineers, area foremen, and lease operators spend a great deal of time looking for ways to control or reduce these costs but sometimes it
Operating costs are split into fixed and variable costs; fixed costs are independent of production volume while variable costs are proportionate to throughput volume. If a property is shut-in, fixed costs will still be paid but there will be no costs related to variable expenses. Equipment rentals, overhead charges, and municipal property taxes are just a few examples of fixed costs while chemical and trucking charges are considered variable costs.
Operating income (also called netback) is
defined as property revenue minus operating cost, both fixed and variable. The minimum daily production rate for a well at a given price must be sufficient to cover its fixed and variable costs. Of course, one way to ensure that low-productivity wells stay on-stream is to push as much operating cost into the variable category so that fixed costs are low and require less volume for profitability. In reality, experts contend that 80% of operating costs are fixed and this reality needs to be considered when reviewing property financial performance.
If gas is processed at a company-owned facility, plant fixed and variable operating costs are allocated to the gas stream. If the facility is not owned, then the processing fee will be a combination of fixed and variable operating costs plus a charge by the owner to recover their capital investment in the facility. The combined amount will appear as a single entry under operating expenses. If there is available gas processing capacity at a company-owned gas plant, gas production from other companies in the area can be processed and the revenue collected from those producers, effectively reduce the operating costs of the property.
L EASE OPERATING STATEMENTS (LOS)
Production and revenue accountants keep detailed records of production volumes, revenue from sales, crown, freehold, and gross overriding royalty payments and operating cost expenses. Besides being used
(Continued on page 26...)
Figure 3. Typical operating cost categories for an oil or gas well.
Expense Portion of a Lease Operating Statement
Figure 5. Royalty payments are part of the LOS and are used to
Lease Operating Statement Analysis
(...Continued from page 25)
for corporate financial calculations, the LOS provides a valuable check on product type, volume, prices, royalty payments, and operating costs.
In Figure 4 (page 25), the LOS starts with a record of produced volumes. Gas charts, tank or battery inventory, and custody transfer receipts are used to determine well production. This data is submitted to regulatory agencies monthly for crown royalty calculations and conservation monitoring. Gas, oil, and NGL streams are reported separately on the LOS.
Figure 5 (page 25) is the royalty section of the lease operating statement. More will be said about royalties later in this article
and in the series. Figure 6 uses LOS data to graph actual production volumes, price realizations, royalty rates, and operating costs and compares them against budget forecasts. Asset teams will take corrective action on off-target performance.
The LOS reports sales gas, NGL, and oil separately. If the NGL yield (bbl/MMcf) from the raw gas volume seems low on the LOS compared to what is expected from gas analyses, a check should be made to confirm that the gas-processing facility is able to extract the natural gas liquids from the stream (shallow vs. deep cut). Reference can be made to the petroCUBE’s Group Economic Parameter data sheet that shows area and formation average NGL yield. A check should also be made to ensure that, if the NGL yield is lower than expected, the gas price received is higher reflecting liquid rich (and higher BTU) residual sales gas.
contracted price ensures proper value is being received.
Royalties paid to the Crown or freehold owners, mineral taxes, compensatory royalty payments, and gross overriding royalties paid to others are reported in the next section of the LOS. In this example, only 10% is being paid out, which seems low. Upon investigation, the producing wells are found to be low rate and at the time qualified for the Low Productivity Reduction Factor (this royalty program doesn’t exist anymore) that reduced the royalty take to around 12%. The price drop in the later part of the year resulted in lower royalty rates on gas.
Operating costs can also be checked and analyzed through simple plots. Figure 6 shows that monthly operating costs are fairly stable except for January when property taxes were paid in a lump sum. This one-time payment makes the January operating cost an anomaly and serves as a warning that LOS should be viewed over an annual period or longer to identify unique or annual payments and to determine longer-term average operating costs. Operating costs should be normalized to per-unit volume ratios to compensate for fluctuating production volumes.
This careful examination of the LOS is done to determine operating costs, both fixed and variable, and these are entered into Value Navigator’s operating cost input sheet, shown in Figure 7. Data from the LOS is analyzed, categorized, and entered into the model. With costs automatically inflated in future years, pretax operating income can now be calculated.
SUMMARy
Both capital and operating cost data is integral to detailed economic evaluations. Company data or team estimates provide critical information but if that data is not readily available, or if a quick scoping review is required, other sources of information can be found to reduce information gathering time without sacrificing accuracy.
Below the recorded volumes on the LOS, the revenue for each product is reported. Dividing the revenue by the volume provides the price per unit volume received for the product. Comparing this to the posted or
Support for this series is provided by Energy Navigator who have reviewed articles, supplied technical consultation, and critiqued manuscripts. We thank them for their help.
We thank geoLOGIC systems ltd. and AJM Petroleum Consultants Ltd. for their permission to use and show petroCUBE data and displays.
Navigator’s Operating Cost Input Sheet
Figure 6. Key operating indicators help the asset team meet budget forecasts.
Figure 7. Operating cost data is entered into Value Navigator’s input sheet.
PETRO DayzZz: Memorial University Students Reach Out to St. John’s High School Students
| Adapted
from an article
written by Kelly Foss, Faculty of Science Editor, Memorial University
Graduate and undergraduate Earth Sciences students at Memorial University came together in April 2009 to create and deliver an Earth Science-based petroleum workshop for high school students.
Petro DaYzZz was designed for students interested in science careers and the petroleum industry. The two-day interactive program immersed students in aspects of the petroleum industry and was delivered by experts from Memorial University and local industry personnel in the ExxonMobil Canada East office. Petro DaYzZz activities included an introduction to the petroleum system, how oil and gas is formed, the techniques used to find it, the roles of individuals within a petroleum company, and affects and controls on the price of oil.
The brainchild of the program was geophysics graduate student, Tiffany Piercey. “The goal of this program is to introduce the petroleum industry to a younger generation in an interactive and enriching approach. The whole idea came to me this past summer when I was working in the petroleum industry in Calgary. I thought it would be nice to educate students at a time when they’re considering post-secondary studies so they know what their options are in the petroleum industry,” said Ms. Piercey.
On returning to her studies at Memorial, Ms. Piercey discussed her ideas with the head of the Earth Sciences department, a few of her professors and fellow colleagues. “They all thought it was a great idea, but wondered how I could possibly institute it, because it was a considerable amount of work. With strategic collaboration with a national science outreach program called, ‘Let’s Talk Science,’ we were able to form a partnership that successfully executed the course,” she continued.
“The project became a big collaborative effort with LTS handling the logistics because they already had connections with schools in the area. The Geoscience Student Society was able to contribute the resources and create the course material. I also approached petroleum companies for
their support and funding as well,” Piercey said.
Five St. John’s high schools, Holy Heart of Mary, Mount Pearl Senior High, O’Donel, Holy Trinity, and Booth Memorial sent their top students with a total of 29 participants. Ms. Piercey said, “We covered a lot of things including the science behind geology and geophysics. So they’ll certainly take some of that away with them. They will at least understand that oil doesn’t sit in big pools in the ground, you can’t just drill a hole and it all spews out. It’s much more complicated than that.”
She hopes this is just the beginning for Petro DaYzZz. Ms. Piercey indicated they are planning to continue the course again in 2010 and hopes to expand the program to other geographic regions within Newfoundland and Labrador, as well
as help other student societies execute similar projects: “I’m hoping this starts a precedent. It’s great to leave a foundation for someone to come behind us and take the idea and work with it. At the SEG Annual Meeting this past fall, Geoscience Student Society executive, Emma Brand did a best practice presentation to other SEG student chapter executives. This way we can educate all the other student chapters and hopefully develop a resource that we can give to everybody.”
• Logging – Finding the Oil and Gas – April 20-21, Calgary
• Project Management – April 28-30, Calgary • Drilling Operations – May 17-21, Calgary
GEOSCIENCE KNOWLEDGE AND EXPERIENCE Requirements for Professional Registration in Canada
| By Tom Sneddon
“What has APEGGA done for me lately?” is a question I frequently get as Manager of Geoscience Affairs. My usual quick answer has to do with getting a licence to practice the best professions in the world and making a good buck at it to boot. A deeper response is also appropriate, of course, and I like to point out the member benefits one derives from membership, including reduced transportation rates, hotel room costs, insurance in the Engineers Canada group plan for members who do not qualify for company plans or who work alone. Affiliation with an organization (Engineers Canada) of nearly 200,000 members definitely helps. A further benefit that is described in detail on the APEGGA website that many members are often not familiar with is professional liability insurance for late actions (longer ago than two years) provided by the Association.
The list of benefits is pretty long, and not the least of them is the right to participate
in the governance of the Professions. Geoscientists from Dr. John Allen, who was one of the founders of APEGGA in 1922 to Dr. Gordon Williams, P.Geol., the current Past President have played a key role in developing and enhancing the dignity and prestige of geoscience in Alberta. I also like to point out the benefits a person derives from an organization tend to be a function of how much effort one puts into it. To derive the benefits of self governance and the fringe benefits of membership, one has to be a member in good standing.
What qualifications do you need to possess in order to become a Professional Geoscientist in Canada and in particular in Alberta? Everyone likely to read this article has had, or is having, a struggle with this concept, including yours truly. Clearly, it has something to do with a suitable education, followed by a period of ‘hands on training’ working with a licenced member with long experience in
Bringing the right person together with the right joB
thAt’s oUr proMise
Find experts in geoscience & exploration engineering. Find exciting career opportunities.
Hays are the experts in recruiting across the full lifecycle of the global oil and gas industry, including all roles within the geoscience and exploration engineering fields.
We believe the right job can transform a person’s life and the right person can transform a business so we’re passionate about connecting our candidates with the right job. To make this happen, our global network of expert consultants work together to offer a comprehensive range of recruiting services, tailored to your particular needs and location.
That’s why, for over 33 years, we’ve powered the world of work.
For more information please contact recruiting expert Dean glagoloff at dglagoloff@hays.ca or +01 403 513 9465.
unlocking the story of Mother Earth. Just what constitutes a ‘suitable education’ and what sort of ‘hands on training’ is not really clear to most people.
APEGGA, like all the other professional licensing bodies across Canada, wrestled with defining the qualifications for geoscientists for 50 years before finally arriving at today’s standards. Not everyone may agree these qualifications are fair, but at least for the last five years or so they have been well and clearly enunciated through the current APEGGA syllabus and the parallel documents from the ten other jurisdictions that licence Professional Geoscientists.
The ‘experience’ part has never been much of an issue when it came time for registration, the only concern being that the applicant had a broad enough scope to fully appreciate their responsibilities while obtaining hands-on training with the tools of the profession over a four-year formative period. The ‘knowledge’ part has been more of a challenge.
There are still administrative struggles (like prying loose a transcript from a far-away university or coming up with references who know you well enough to qualify), but by and large anyone who wants to, or must have a licence to practice, can do so with some patience, perseverance, and study. This can be somewhat painful for a person who has considered his- or herself to be a geologist for several decades; has a number of published professional papers, and is well respected by other earth scientists; but who is short a course in structural or paleolontology or stratigraphy or whatever other subject from a B.Sc. earned in or before the 1970s. It can be equally, if not more, daunting to a foreign-trained professional who must study for and pass the Professional Practice and Ethics examination in a foreign language still being learned.
About 25 years ago, Dr. Williams and colleagues began a process that would produce the Canadian Council of Professional Geoscientists, its committee structure, and the Canadian Geoscience Standards Board (CGSB). A first draft of a competence standard was drafted, and discussion turned
to developing an approach to accreditation of university geoscience programs, as the engineers have done since the 1920s. The twin proposals of a standard curriculum and university course accreditation met a lot of opposition.
Anyone that has worked at the federal level knows that Confederation is a tough way to do business in a country with as much disparity in size, population, and opportunity as we have in Canada amongst our Provinces and Territories. While we geoscientists are at home everywhere in the world, each jurisdiction isn’t necessarily as comfortable with us. Another challenge is the fact that geoscientists are unevenly distributed across the land.
The four largest populations, in Alberta, British Columbia, Ontario, and Quebec, accounted for over 80% of all registered geoscientists in Canada in 2007. Alberta alone accounts for over 40% of the 2007 population; according to CCPG figures (see Figure 1). The remaining ten jurisdictions, not unreasonably, want their say as to how the profession is managed. Consequently, agreement on any fundamental approach is difficult. Incidentally, as of December 31, 2009, there are 5,367 full geoscience members and members-in-training registered in Alberta
The big breakthrough occurred in June 2008 when the CGSB published its guide entitled “Geoscience Knowledge and Experience Requirements for Professional Registration in Canada” through CCPG. By July 2009, all twelve licensing jurisdictions had approved the guide for use by their boards of examiners. It is now in use across Canada and met the Agreement on Internal Trade deadline of August 31, 2009 for implementation. The guide is available free for downloading at the CCPG website www.ccpg.ca and in hard copy from APEGGA.
ROCK SHOP
APEGGA Geoscience Membership 2001-2009.
Accreditation of university geoscience programs is going to be more challenging to achieve. Even if all jurisdictions agree to establish a geoscience accreditation board, it would be costly to set up and maintain, as it would be an independent body with its own administration. Regular visits to the 30-odd geoscience departments across Canada would be essential, with their attendant travel costs. Our small geoscience community would find those costs quite onerous to bear on a continuing basis. We must find a way if there is to be equity and uniformity of opportunity for students to be prepared for a career in geoscience anywhere in Canada.
Historically, Canada has depended upon universities to offer enough of the right kind of courses to allow students interested in a professional geoscience career to meet the knowledge requirements for the jurisdiction they hope to practice in. This places the onus on students to take the right courses rather than on the universities to supply them. This leads to the possibility that not all the professional track courses are available at all institutions. This led to many people holding degrees in Geology or Geophysics from reputable universities that do not meet
APEGGA standards and leading to a need for examinations in those subjects not covered by the applicant’s degree program. Feelings were hurt and careers sometimes delayed while the deficiencies were made up.
For the moment, we must rely on the judgment of each provincial and territorial Association for uniform application of the new Knowledge and Experience Requirements guide to ensure anyone wishing to practice Geology in Alberta will have credentials that are acceptable to all of us.
The long gestation period for the common set of qualifications ensures that. While some universities will voluntarily ensure that their curricula meet the Requirements document, others will not and students planning a career in Geoscience must choose their university and program carefully to ensure they can go to work anywhere in Canada with the confidence they will be employable in their specialty, without any further qualification.
If you need any information on membership or other APEGGA business (even if you are not a member) please give me a call at (403) 262-7714 or drop me an e-line via tsneddon@apegga.org.
IT’S BIGGER! IT’S BETTER!
It’s National Engineering and Geoscience Month! Design the Future – March 2010
Geoscience and Engineering Professionals across the province work to ‘design the future’ for Albertans every day. Your contributions are being celebrated during National Engineering and Geoscience Month (NEGM) for the entire month of March 2010.
Until now, APEGGA has celebrated National Engineering and Geoscience Week at the end of February and the beginning of March. Starting in 2010, we will be celebrating for a whole month and you and your communities are invited to join in!
“APEGGA and its members are excited about joining the rest of Canada in celebrating the month of March as NEGM,” said Jim Beckett, P.Eng., President of APEGGA. He continues, “We see NEGM as an important opportunity to raise awareness of the wealth generation and quality of life made possible by Geoscience and Engineering Professionals right here in Alberta.”
Kicking off the month on March 3, 2010, are two APEGGA events that challenge Professional Geoscientists and Engineers to compete in a fun
mystery event that will test their skills while the public and other Geoscience and Engineering Professionals cheer them on. The kickoff events will be held over the lunch hour in Calgary at the Eau Claire Market Centre Court and in Edmonton in the Scotia Place lobby.
Be sure to look for the 15th annual NEGM supplement in the March 3 editions of the Calgary Herald, Edmonton Journal, and Fort McMurray Today.
APEGGA members will be taking time throughout NEGM to share their experiences with youth at Science Olympics events and elementary school science nights, with the aim of helping to inspire students to explore careers in math, science, and technology.
The APEGGA Science Olympics will take place in Calgary just prior to NEGM on February 27 at the Commonwealth Hall and Conference Centre, while the Edmonton Science Olympics will be held during NEGM on Saturday, March 6 at the Shaw Conference Centre. Everyone is welcome to come out and cheer on the teams.
Elementary science nights are another great way for members to share their passion for their professions with students. The nights give volunteers the opportunity to bring science to students and their families by visiting schools in Calgary and the Capital Region. They feature a variety of fun and interactive activities and displays that are designed to encourage students to choose career paths in the sciences.
If your organization plans to host an event during NEGM, please contact Bethany Benoit at 780-426-3990, 1- 800 - 661-7020, or by email at bbenoit@apegga.org to have it added to the calendar. For information about the Science Olympics and science nights, please contact Jeanne Keaschuk at the phone numbers above or by email at jkeaschuk@apegga.org.
For more information on what’s happening throughout Alberta during NEGM, and to get involved, visit APEGGA’s calendar of events at www.apegga.org and click on National Eng. and Geo. Month under the K-12 and Teachers section.
ISLANDS OF TIME – MICROEVOLUTION:
The 2009 Honorary Address
| By Linden Achen, Honorary Address Chair
The mandate of the CSPG Honorary Address Committee is to provide an exciting and dynamic scientific presentation targeted at junior high and high school students who could potentially become Canada’s future geoscientists during the morning event, and at the general public in the evening. The committee believes that it has accomplished its goal once again in 2009.
The Committee would like to thank both speakers for their exciting and knowledgeable talks. Dr. Paul Johnston, a Professor in the Earth Sciences Department at Mount Royal University and also a guide with The Burgess Shale Geoscience Foundation in Field, B.C., gave his morning talk to a packed auditorium of Calgary students and put foward an interesting comparison between his mud flow theory at the Burgess Shale and what is interpreted to be a similar set of conditions on Lo, one of the four Galilean moons of the planet Jupiter. The students could not help themselves from asking questions about when the aliens were going to invade the earth and what they might look and smell like. The evening event was Dr. Johnston’s opportunity to introduce the audience to his new theory on the Burgess Shale and its original environment half a billion years ago. The audience was excited to hear this new theory.
Our second and keynote speaker, the popular Brian Keating, currently holds the position of Director of Conservation Outreach for the Calgary Zoo, and as always was exciting and dynamic. He impressed the students during the morning event with stories of his travels around the world identifying species in remote areas. Keating’s evening talk was just as remarkable and he again spoke about his travels and about the different ways in which animals have evolved due to the pressures, or lack thereof, that their local environments impose upon them. Keating gave the audience a 50-minute visual tour of Papua, New Guinea, Madagascar, the Galapagos, northern Canada and lastly, locally here in Calgary. The most enjoyable of all was his last story about a beaver outside of his home on the Bow River that walked on its two hind legs while carrying a large amount of twigs used in re-building its lodge. This beaver could be the only ‘Bipedal Bow River Beaver’ in existence…for now!
Thank You to our Generous Sponsors!
This year, the morning presentation was attended and appreciated by 1,751 Calgary students. The evening event was attended by 350+ individuals of many ages.
The Honorary Address is presented each year by the CSPG in partnership with APEGGA and the CSEG. However, this event would not be possible without the support of the following sponsors: Alberta Lotteries Fund, Nexen Inc., AJM Petroleum Consultants, Sundog, MacLaren McCann, AVW TELAV, and the Burgess Shale Foundation. All of the contributors were very gracious and supportive with their donations, especially in a very difficult financial climate, to help us to fulfill our vision of raising interest in science, in particular geoscience, among junior high and high school students and also the general public. As in past years, Telus World of Science again gave all of the children that attended the morning event a free day pass to their facility.
Of course every year there are a number of individuals that put the Honorary Address
together and we need to acknowledge and thank them for their hard work that made this event such a success: Alyssa Middleton (CSPG), Stacey Sudlow (University of Calgary and Arcis), Alex Wright (Darian Resources), Tom Sneddon (APEGGA), Annette Milbradt (CSEG Outreach), Devon Henderson (Hotwell Canada), Jay Williams (Hotwell Canada), Shawn Lafleur (Caltex Energy Inc), Stephen Kotkas (Sigma Explorations), Jen Dunn (ConocoPhillips), Marissa Whittaker (Oilsands Quest), Dayna Rhoads (CSPG), and Mike DesRoches (Talisman).
The Committee wishes to also thank, once again, the CSEG and APEGGA for their donations and hands on assistance with this year’s event.
Choose from over 50 exciting field seminars, short courses and online programs all designed with the goal of helping you explore and better understand the science of this industry. Please see the AAPG website for complete descriptions and registration information. Below are the highlights of courses coming up very soon. Make your plans now before seats get filled!
Short Courses:
Petroleum Exploration in Fold & Thrust Belts, Austin, TX
Assessment of Unconventional Shale Resources Using Geochemistry, New Orleans, LA (with AAPG Annual Meeting)
Courses: Solar Energy Basics –A Renewable Energy Certificate Course
Practical Salt Tectonics, New Orleans, LA (with AAPG Annual Meeting)
Basic Well Log Analysis, Austin, TX
Field Safety Course for Field Trip Leaders, April 1-2, Houston, TX APRIL 1-2
Biomass Energy Basics –A Renewable Energy Certificate Course
forty-ninth annual cspg Classic Golf Tournament
| By Foon Der
At 1:00 pm June 17, 2009 at Elbow Springs Golf Club, 144 CSPG members and sponsor guests teed off under overcast skies with intermittent showers. The slight amount of inclement weather failed to dampen the spirits of these enthusiastic participants. After three days of golfing and socializing, former champions Mike Hartwick and Jim Young dueled with Mike emerging as Paskapoo Flight winner. The winner of the Chuckwagon (Texas Scramble) was led by Rick Reeves with team-mates Matt Earle, Derek Christie, and Rick Kroeker. The tournament again supported Wellspring Calgary as its charity.
The Tournament Committee would like to thank of all its sponsors. At the Diamond level was: Schlumberger and geoLOGIC. At the Emerald level was: Geostrata Resources, Halliburton, IHS, Pro Geo Consultants, Weatherford Canada Partnership, and Wildcat Scouting. At the Platinum level was: AGAT Laboratories, Baker Atlas Wireline, Belloy Consulting, CSPG, Divestco, Fugro Data Solutions, GLJ Petroleum Consultants, Little Rock Document Services, LogTech Canada, MJ Systems, Ryan Energy Technologies, RECON Petrotechnologies, Sproule Associates, Tucker Wireline, and West Canadian. The above sponsors as well as the Gold, Silver, and Bronze sponsors will receive recognition for their support on the registration form for the 2010 Tournament.
The organizing committee extends an invitation to former players, CSPG members, and sponsors to participate and celebrate the 50th Anniversary Tournament that will be held June 16-18, 2010. New applicants are encouraged to apply with a special invitation to female participants. We hope to see you there.
Look for the registration form in the April Reservoir or the CSPG Website at the end of March (www.cspg.org).
Figure 1. L to R: Don Slater, Mike Hartwick (Paskapoo Flight Winner), Garrett Chandler, Tom Podivinsky.
Figure 2. L to R: Bob Mummery (Leduc Flight Runner-Up), Leanne Ewashen, Cal Gabel, Larry Love.
Figure 3. L to R: Barrie Burch (Pre-Cambrian Flight Runner-Up), Lois Zver, George Ardies, Rick Ippolito.
Figure 4. L to R: Frank Pogubila (Most Dapper Golfer 2009), Leanne Ewashen, Brenda Pearson.
Figure 6. Schlumberger: NW Corner ClubhouseHalfway House Sponsor.
NORTH AMERICAN COMMISSION on Stratigraphic Nomenclature
| By Brian R. Pratt and Octavian Catuneanu
The North American Commission on Stratigraphic Nomenclature acts as the guardian of the North American Stratigraphic Code, and commissioners represent various geological societies and federal, provincial, and state geological surveys, in the USA, Canada, and Mexico. The CSPG maintains a presence on
NACSN through two representatives, and for the past few years this task has fallen to Octavian Catuneanu (University of Alberta) and Brian Pratt (University of Saskatchewan).
The 64th annual meeting was convened in middle October 2009 during the Geological
Pick a card, any card
Improve your exploration odds with Divestco. At Divestco we want the odds to be in your favor so we have given you a whole deck of geological products and services to choose from. Divestco’s integrated offering for geological professionals gives you the ability to choose from a wide range of geological products and services to suit your unique needs. Pick as many individual cards as you want or let our experts deal you a winning hand. Call us at 403.237.9170 or email sales@divestco.com for more information. TSX: DVT www.divestco.com
Society of America annual meeting, held in Portland, Oregon. Entered into the record was a special issue of the journal Stratigraphy (v. 6, no. 2, 2009) which is devoted to NACSN and its good works. Two main items of business this year were the preparation of the Spanish translation of the Code and a resolution to the Geological Society of America Publications Committee to return to their practice of following the Code in maintaining the distinction between points in geological time and intervals of geological time with separate abbreviations for ‘year’ (e.g., Ma versus M.yr., respectively). This resolution was accepted and a motion based on it duly passed by Council of the Geological Society of America. Also being considered for possible inclusion in the Code are formally named hydrostratigraphic units.
CSPG members who have thoughts on this idea should send them to either Brian or Octavian. NACSN is closely linked to the International Subcommisson on Stratigraphic Classification, which is in turn part of the International Commission on Stratigraphy and the International Union of Geological Sciences. Both Brian and Octavian are active in ISSC, with Brian being the current chair. NACSN and other national bodies are awaiting recommendations from ISSC about the nomenclature of sequence stratigraphy and at present an international consensus is being marshalled principally by Octavian. Eventually an updated International Stratigraphic Guide will be published, and it is hoped national codes will be harmonized with it.
The NACSN website is hosted by the American Geological Institute: www. agiweb.org/nacsn. The latest (2005) edition of the North American Stratigraphic Code (AAPG Bulletin, v. 89, p. 1547–1591) can be downloaded from there for free (via the U.S. Geological Survey). Stratigraphy, v. 6, no. 2, 2009 can be obtained from Micropaleontology Press: micropress.org/ stratigraphy.
and uses a short microwave wavelength that is reflected by raindrops and snowflakes.
Radarsat 1 and 2, Canada’s satellites, are commercial imagers. The Radar images are acquired in many different resolutions and formats, and are reasonably expensive. Some are archived, and there are programs for reduced cost for priority research areas. Both Japan and the European Space Agency also have research Radar satellites.
CONCLUSION
always, I welcome questions or suggestions at mhallbey@ucalgary.ca.
R EFERENCES
Balaras, C. A. and Argiriou, A. A. 2002. Energy and Buildings. v. 34, no. 2, p. 171-183.
Barber, D. G., Hanesiak, J. M., and Yackel, J. J. 2001. Sea ice, Radarsat-1 and arctic climate processes: A Review and update. Canadian Journal of Remote Sensing. v. 27, no. 1, p. 51-61. Brantley, S. R., Lowenstern, J. B., Christiansen, R. L., Smith, R. B., Heasler, H., Waite, G., and Wicks, C. 2006. Tracking changes in Yellowstone’s restless volcanic system. United States Geological Survey Fact Sheet 100-03. Available online at http://pubs. usgs.gov/fs/fs100-03/. Accessed 2009-12-16.
Canada Centre for Remote Sensing. No date. Tutorial: Radar Polarimetry. http://www.ccrs.nrcan. gc.ca/resource/tutor/polarim/chapter5/01_e.php. Accessed 2009-12-18.
Chen, H., Parnell, J., and Gong, Z. 2006. Largescale seismic thermal anomaly linked to hot fluid expulsion from a deep aquifer. Journal of Geochemical Exploration v. 89, no. 1-3. p. 53-56.
Farr, T. G., Rosen, P. A., Caro, E., Crippen, R., Duren, R., Hensley, S., Kobrick, M., Paller, M., Rodriguez, E., Roth, L., Seal, D., Shaffer, S., Shimada, J., Umland, J., Werne, M., Oskin, M., Burbank, D., Alsdorf, D. 2007. The Shuttle Radar Topography Mission. Reviews of Geophysics 45: RG2004.
We have looked at a wide range of wavelengths used for RS, explored some of the applications used, and hinted at much more complex techniques to extract desired information. We have also admitted many things that readily available images cannot do, and looked at whether these limitations are theoretical, technical or financial. Next month it will be time to wrap up this series with a bit about hyperspectral imagery and data synergy, a summary and recommendations of where to go for further information, just-in-time training or full-blown academic learning about RS in its various incarnations. There is obviously lots more to say, but this is probably the wrong place to get highly complex. As
Maslanik, J., Stroeve, J., Knowles, K. W., Meier, W., and Cavalieri, D. 2009. Near-Real-Time DMSP SSM/I Daily Polar Gridded Sea Ice Concentrations. National Snow and Ice Data Center, University of Colorado at Boulder. http://nsidc.org/data/ nsidc-0081.html. Accessed 2009-12-14.
Phillips, T. 2009. “Water molecules found on the Moon” Science@NASA, Sept. 24 2009. http://science.nasa.gov/headlines/y2009/24sep_ moonwater.htm. Accessed 2009-12-18.
Sabins, F. F. 1969. Thermal Infrared Imagery and Its Application to Structural Mapping in Southern California. Geological Society of America Bulletin v. 80, no. 3, p. 397-404.
Sabins, F. F. 2007. Remote Sensing: Principles and Interpretation 3rd edition. W. H. Freeman and Co. New York. (...Continued
Dino, J. 2009. Lunar Crater Observation and Sensing Satellite Mission Update, Nov. 13 2009. http://www.nasa.gov/mission_pages/LCROSS/
CLAy TON R IDDELL SELECTED as an Officer of the Order of Canada
| By Sue Riddell Rose
On November 6, 2009, one of the CSPG’s longest-standing practicing members, Clayton Riddell, was appointed as an Officer (O.C.) into the Order of Canada. The Order of Canada is the cornerstone of Canada’s system of honours. It pays tribute to Canadians who exemplify the highest qualities of citizenship and whose contributions enrich the lives of their
contemporaries. The Latin motto of this order of merit – ‘Desiderantes meliorem patriam’ – proclaims the aspirations of its members who, in their lives and work, have shown that they ‘desire a better country.’ The Officer level of membership is designed to recognize national service and achievement. The Governor General’s appointment recognized Riddell’s contributions to Canada on multiple levels.
Riddell has been involved actively in the oil and gas industry for 50 years. As a graduate of the University of Manitoba with a B.Sc. in Geology, Riddell began his career as an exploration geologist with The Standard Oil Company of California in 1959. These were early days for the oil and gas industry and much of the Western Canada Sedimentary Basin was under-explored. Riddell spent many summers mapping surface geology in the Northwest and Yukon Territories, gaining valuable field experience that is rarely
acquired today. By 1969 the entrepreneurial spirit in Riddell took over and he left Chevron to start his own business, C.H. Riddell Geological Consultants Ltd.
In 1971 he incorporated Paramount Oil & Gas Ltd., a private oil and gas company. The company put together drilling prospects for others until 1975 when a busy period of expansion began with the use of drilling funds and joint venture capital. In December 1978 the assets accumulated by Paramount Oil & Gas Ltd. were put into a new public company, Paramount Resources Ltd., which concurrently raised five million dollars on the Alberta Stock Exchange. From the first major grassroots discoveries of shallow gas in the Grosmont Formation in Northeast Alberta to the development of gas in the Liard Basin, Riddell has managed to create tremendous value for not only shareholders but suppliers, service providers, and communities through his visions. Paramount
Resources continues to be an active explorer and producer throughout Western Canada and North Dakota and loyal shareholders in Paramount are also holders of several spin out entities including Paramount Energy Trust, Trilogy Energy Trust, and MGM Energy Corp.
In addition to heading Paramount Resources Ltd., Riddell has shared his expertise in geology and business with many. Riddell has been actively involved in the Geological Association of Canada (GAC) and the Canadian Society of Petroleum Geologists (CSPG) at a technical level, an operational level, and a strategic level, encouraging the advancement of geology and its applications within Canada. In addition to his technical and business contributions, Riddell’s expertise has shaped the oil and gas industry in Canada. As a director of the independent Petroleum Association of Canada (IPAC), he was a strong advocate for the deregulation of the Canadian gas market in the late 1980s and has been a voice helping to shape government policy for several decades. In 1992 Riddell helped to orchestrate the birth of the Canadian Association of Petroleum Producers (CAPP) to create one larger, more unified, voice for industry going forward and he served as the first President of CAPP in 1993.
Riddell has touched the industry and the country by supporting a vast array of entrepreneurs and their entrepreneurial initiatives, focused primarily on energy, but extending to technology and even the restaurant business. He has been a committed volunteer for industry at all levels, and is a generous philanthropist. Notably, his endowment spearheaded the creation of the Faculty of Environment, Earth, and Resources at the University of Manitoba. Further his impact can be measured in a large way throughout the local Calgary community with his support of a multitude of youth and family-related initiatives, including Ronald McDonald House Southern Alberta, numerous sport and infrastructure projects, as well as programs to enhance health care. Riddell is also a strong supporter of UNICEF Canada in their work for children internationally. When the Calgary Flames were hanging by a thread Riddell stepped in to keep a game he loved in Calgary and keep a team Calgary loved in the community.
Congratulations to Riddell on his well deserved appointment to Canada’s highest honour.
UNCOVER THE CLUES
UNCOVER THE CLUES
IN YOUR SEISMIC DATA
IN YOUR SEISMIC DATA
Boyd PetroSearch helps you get to the bottom of seismic mysteries.
For over 30 years, the team at Boyd PetroSearch has been using a keen eye, deductive reasoning and sharp analytical skills to shed light on countless cases of hydrocarbon exploration - in the Western Canadian Basin and around the world.
Put Calgary’s most experienced geophysical team on your next 2-D, 3-D or 4-D seismic case. Specialists in high-resolution and multi-component seismic surveys.
Please call: Larry Herd 403.543.5362 Dick Willott 403.543.5387 or visit www.boydpetro.com Global Geophysical Consultants
H ARLE y N. HOTCHKISS APPOINTED Companion of the Order of Canada
| Bruce G McIntyre, CSPG Past President
On behalf of the Canadian Society of Petroleum Geologists I am honoured to congratulate my friend Harley Hotchkiss on his promotion to Companion of the Order of Canada. The rank of Companion is the highest within the Order and there is a mandated cap of 165 members at one time. In order to be considered as a Companion of the Order the nominee must have demonstrated the highest degree of merit to Canada and humanity, on either the national or international scene. Hotchkiss has been a cornerstone of the community since arriving in Calgary from Tillsonberg Ontario with his wife Becky in 1951. Hotchkiss began his career as a geologist with Canadian Superior in 1951 before moving to the Canadian Imperial Bank of Commerce in 1953. Hotchkiss has been self-employed since 1967 and has been active on a number of boards such as TransCanada Pipelines, TELUS, Nova Corporation, and Alberta Energy Company to name but a few.
Hotchkiss has been active in the health care community where he co-chaired the Partners in Health campaign from 1995-1998. For seven years, he served as both a member and Chair of the Board of Trustees of the Alberta Heritage Foundation for Medical Research. Most recently he was a leader in Reach!, the joint fundraising initiative of the University of Calgary, Alberta
Health Services, and the Calgary Health Trust, helping it surpass its goal of raising $300 million in philanthropic support for health care. Hotchkiss and his family established the Hotchkiss Brain Institute in 2004 with an initial gift of $10 million; an additional commitment of $39 million was announced at the fifth anniversary reception held in November 2009.
Hotchkiss has also played a major role in the development of professional and amateur sport in Canada and is part owner of the Calgary Flames hockey club and was the Chairman of the NHL Board of Governors from 1995 to 2008. In 2006 Hotchkiss was inducted into the Hockey Hall of Fame in the Builder Category. Hotchkiss has recently written a book entitled Hat Trick: A Life in the Hockey Rink, Oil Patch and Community.
Hotchkiss has been a member and a strong supporter of the Canadian Society of Petroleum Geologists since 1953 and has given generously to the CSPG Trust. Hotchkiss has never lost his love of geology and continues to be very ‘hands on.’ I have sat on several Boards with Hotchkiss and he is a wealth of information as he was involved in the development of the Western Canada Sedimentary Basin at a time when there were major conventional pools still being discovered. Hotchkiss remains active in the
oil and gas exploration community. Whenever there is a field operation Hotchkiss is the first to volunteer to go. Most recently Hotchkiss determined that the area in Ontario where his son has a greenhouse operation was prospective for natural gas. Hotchkiss leased the minerals and drilled a well on the property. Hotchkiss was on site for the completion and testing of the successful well and he is currently reviewing the options to tie the well in to supply heat for the green houses. I am currently involved with Hotchkiss in an exploration prospect in northeastern Alberta that we will be drilling early in 2010 and I am sure that Hotchkiss will be on site when the core barrel is recovered. Retirement does not seem to be in Hotchkiss’ vocabulary and most of us can only aspire to have his energy and enthusiasm.
I cannot think of a more deserving recipient of the award.
ConocoPhillips
Glen Ruby Memorial Scholarships in Geoscience
ConocoPhillips is pleased to announce the recipients of the ConocoPhillips Glen Ruby Memorial Scholarships in Geoscience for 2009.
Archa Rowan B. Cocket
Jennifer Fohring
Chris Thompson
ConocoPhillips would like to wish all applicants the best of luck in their studies and future endeavors.
THANK YOU.
Your preferred E&P applications no longer need to stand alone.
Link Up
The DecisionSpace® Environment Enables New Levels of Integration
Landmark’s DecisionSpace® environment, delivered through the R5000 release, has the most open architecture in the industry. It enables seamless integration of your preferred software –whether it’s ours, yours or someone else’s – into efficient, cross-disciplinary workflows. Build stronger, more collaborative business processes and more comprehensive asset understanding using the best software for your needs. Learn how at halliburton.com/landmark.