23 Practical Sequence Stratigraphy IX. Units and Sequence Stratigraphy: Part 1.
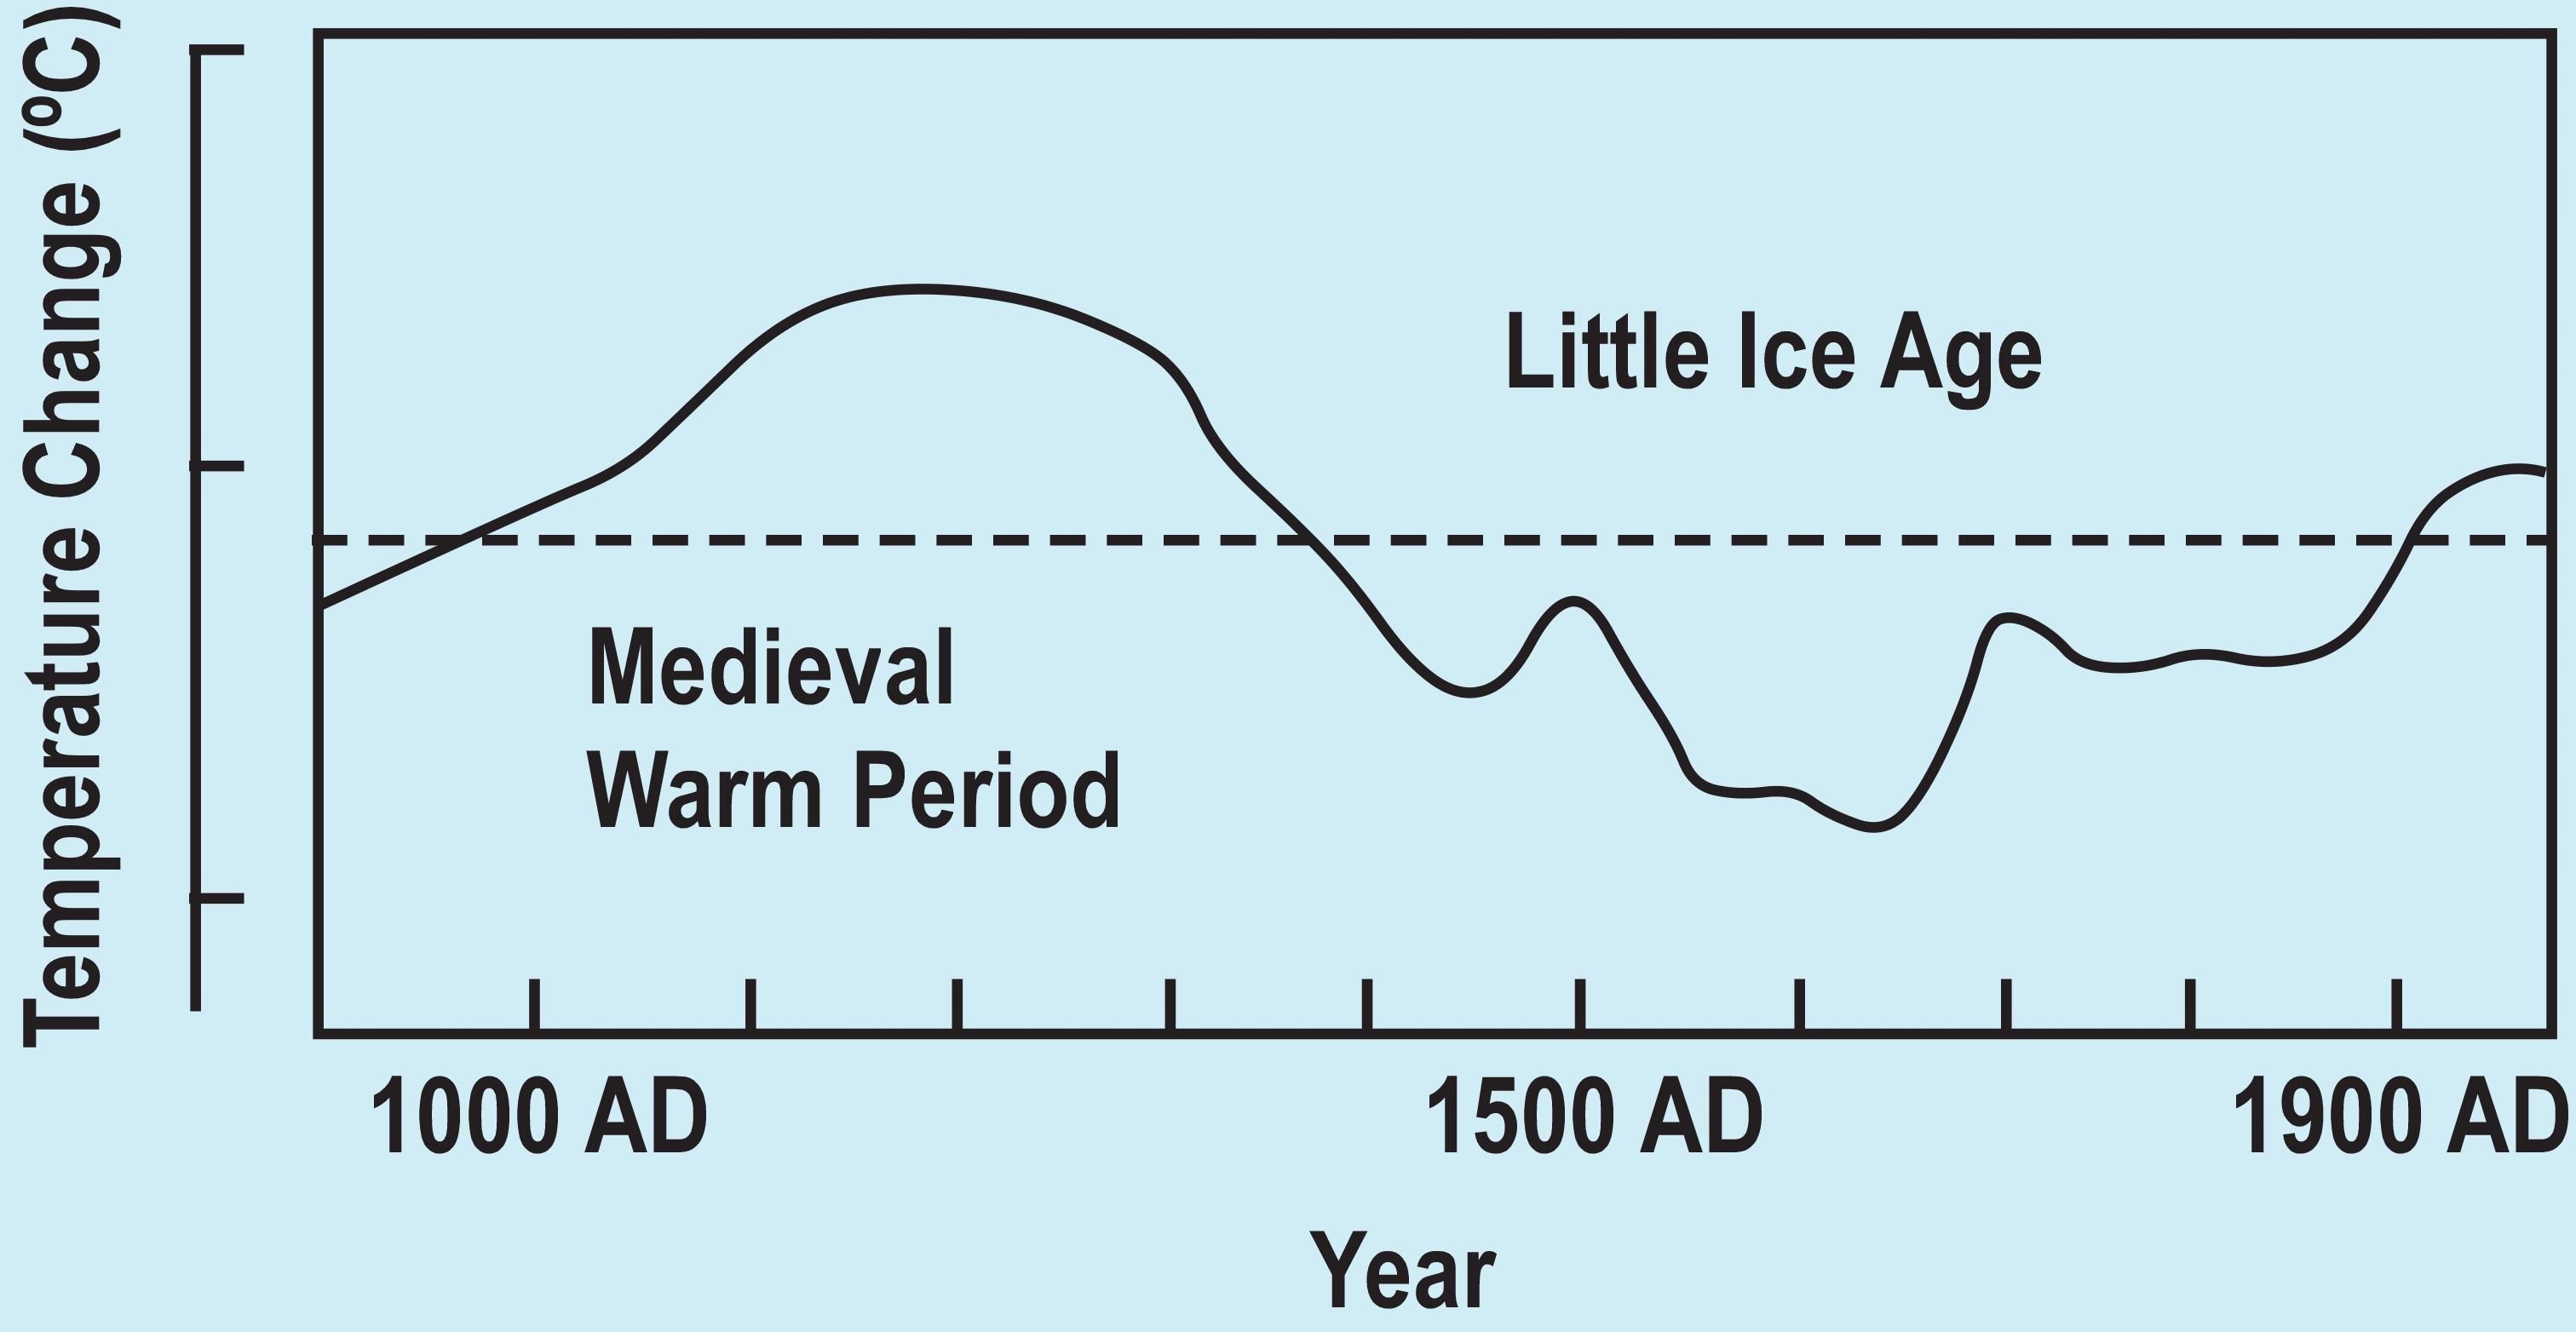
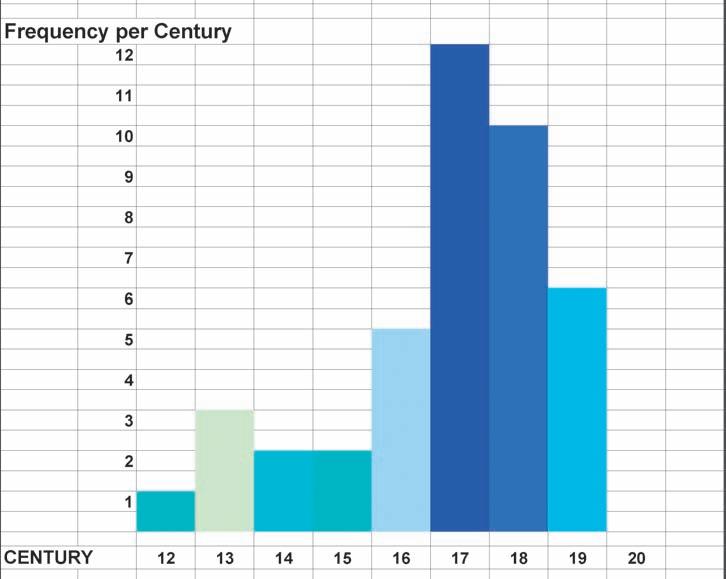
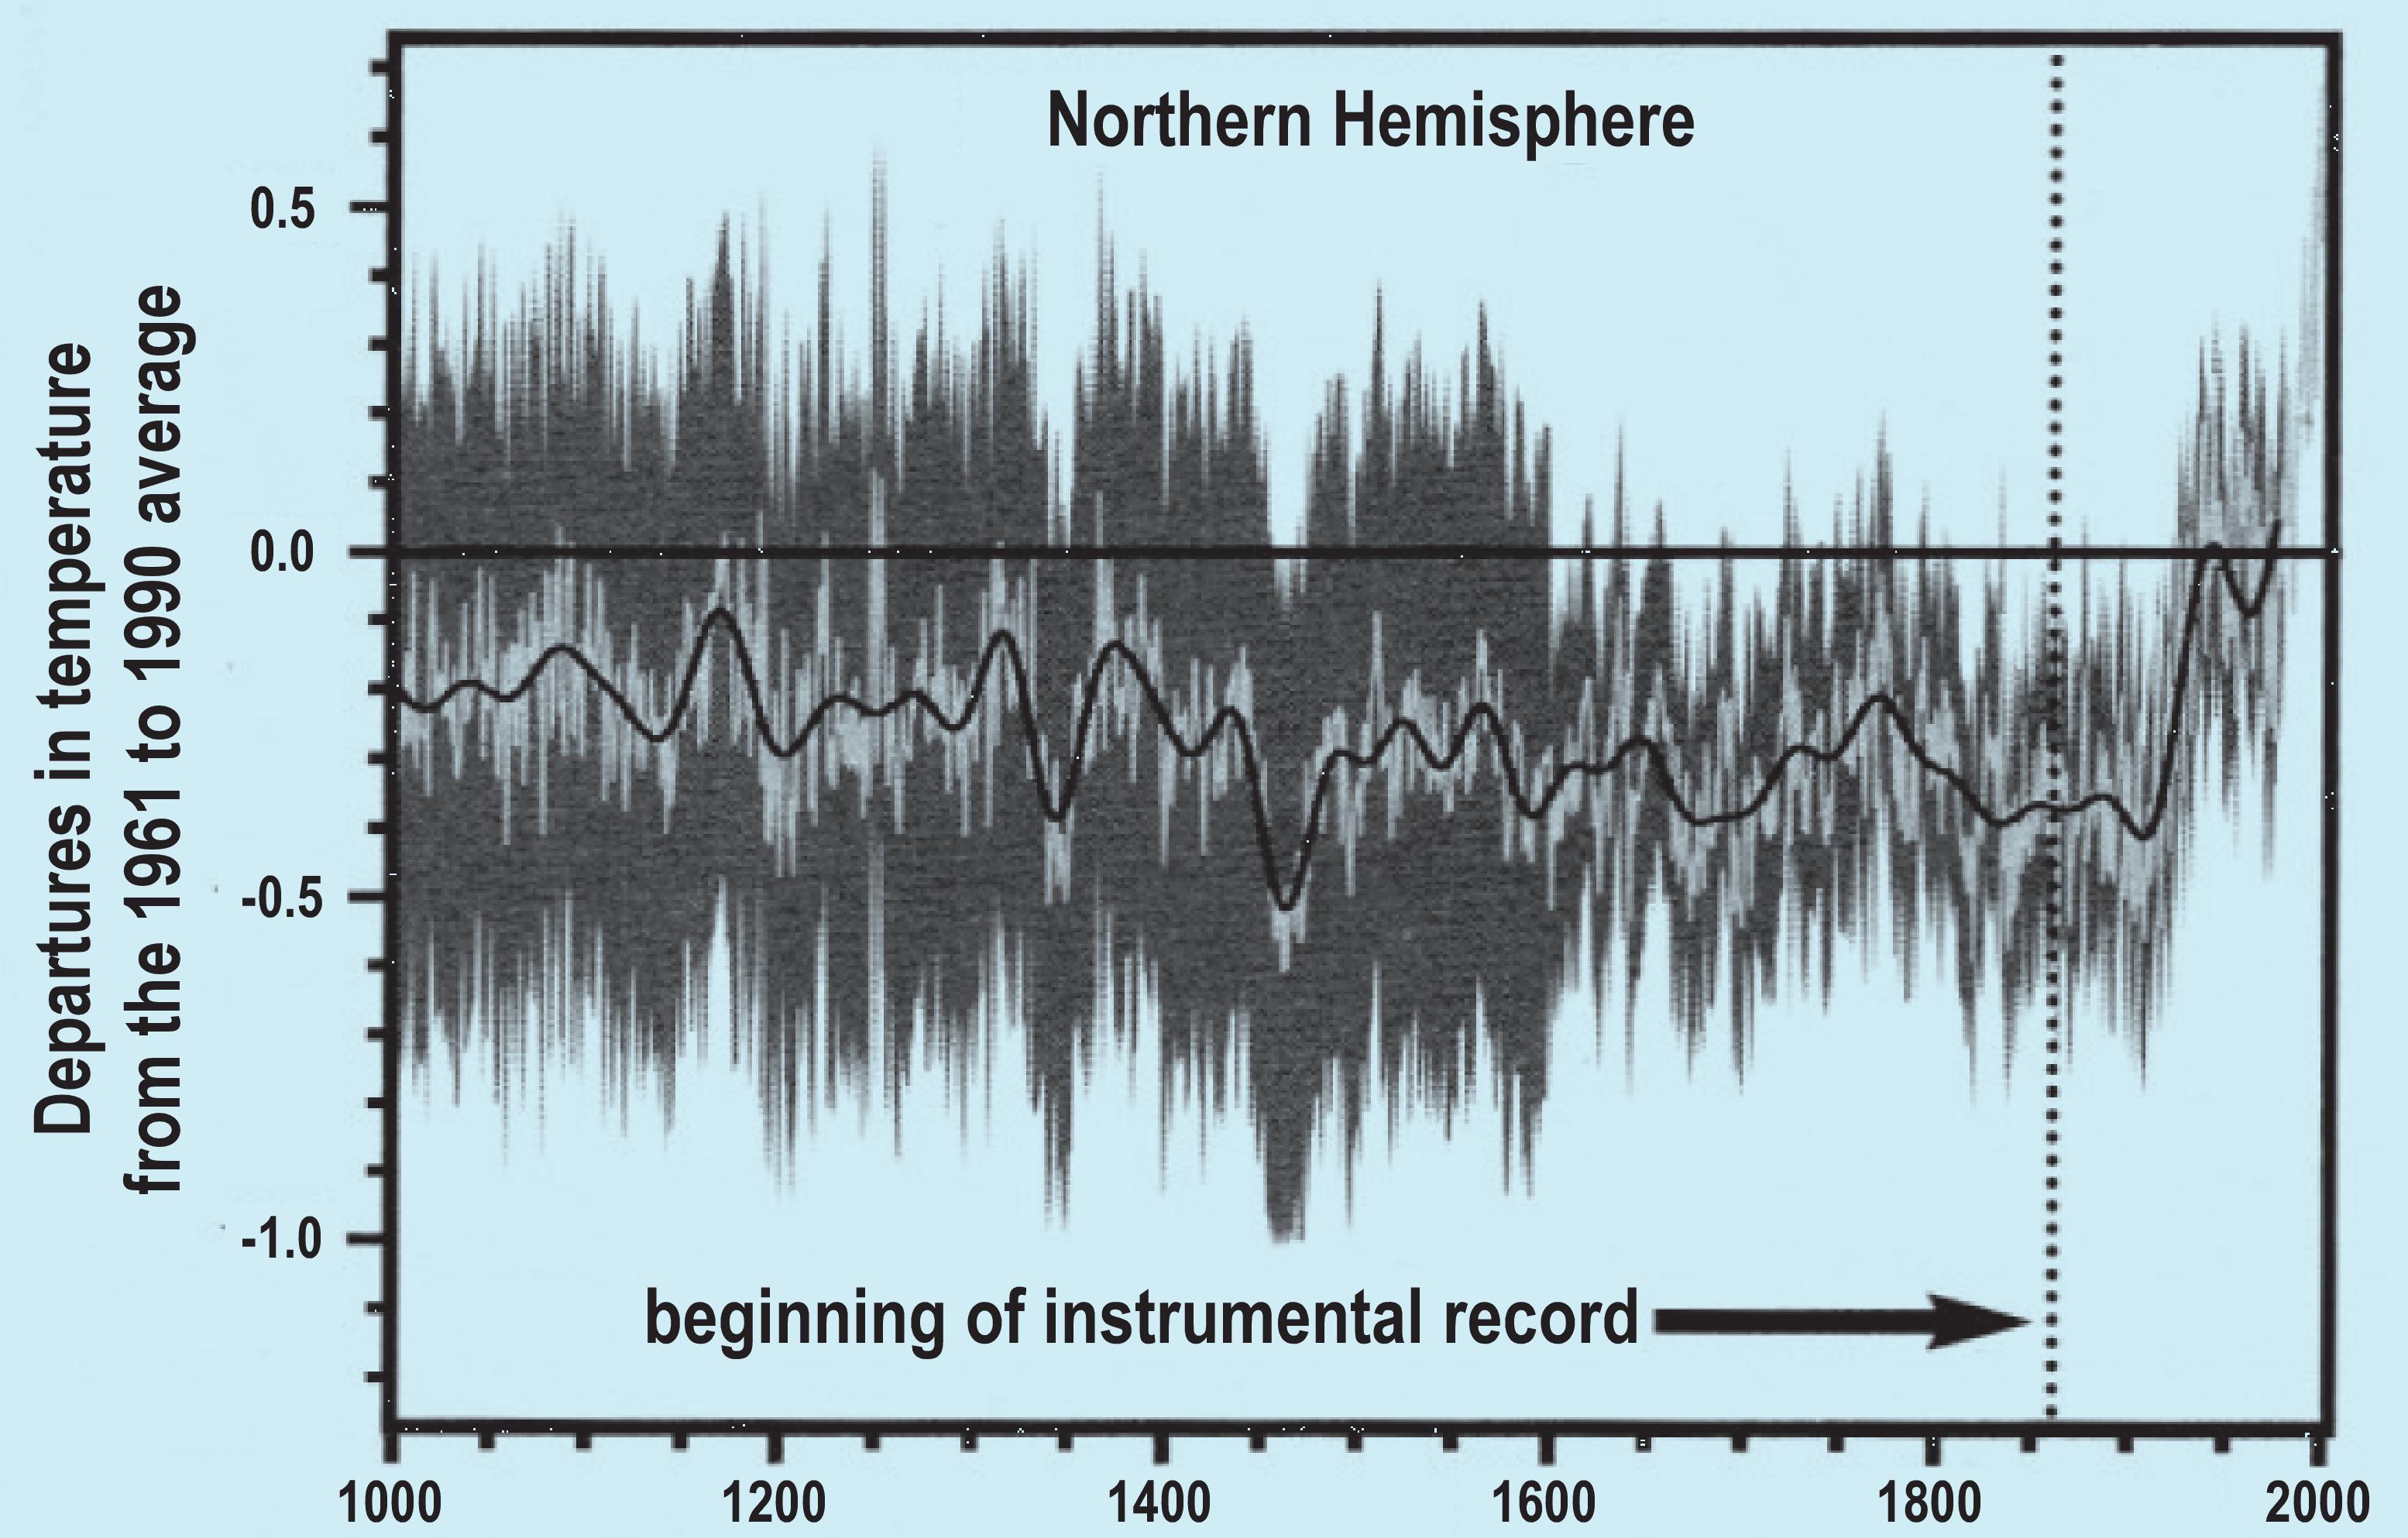
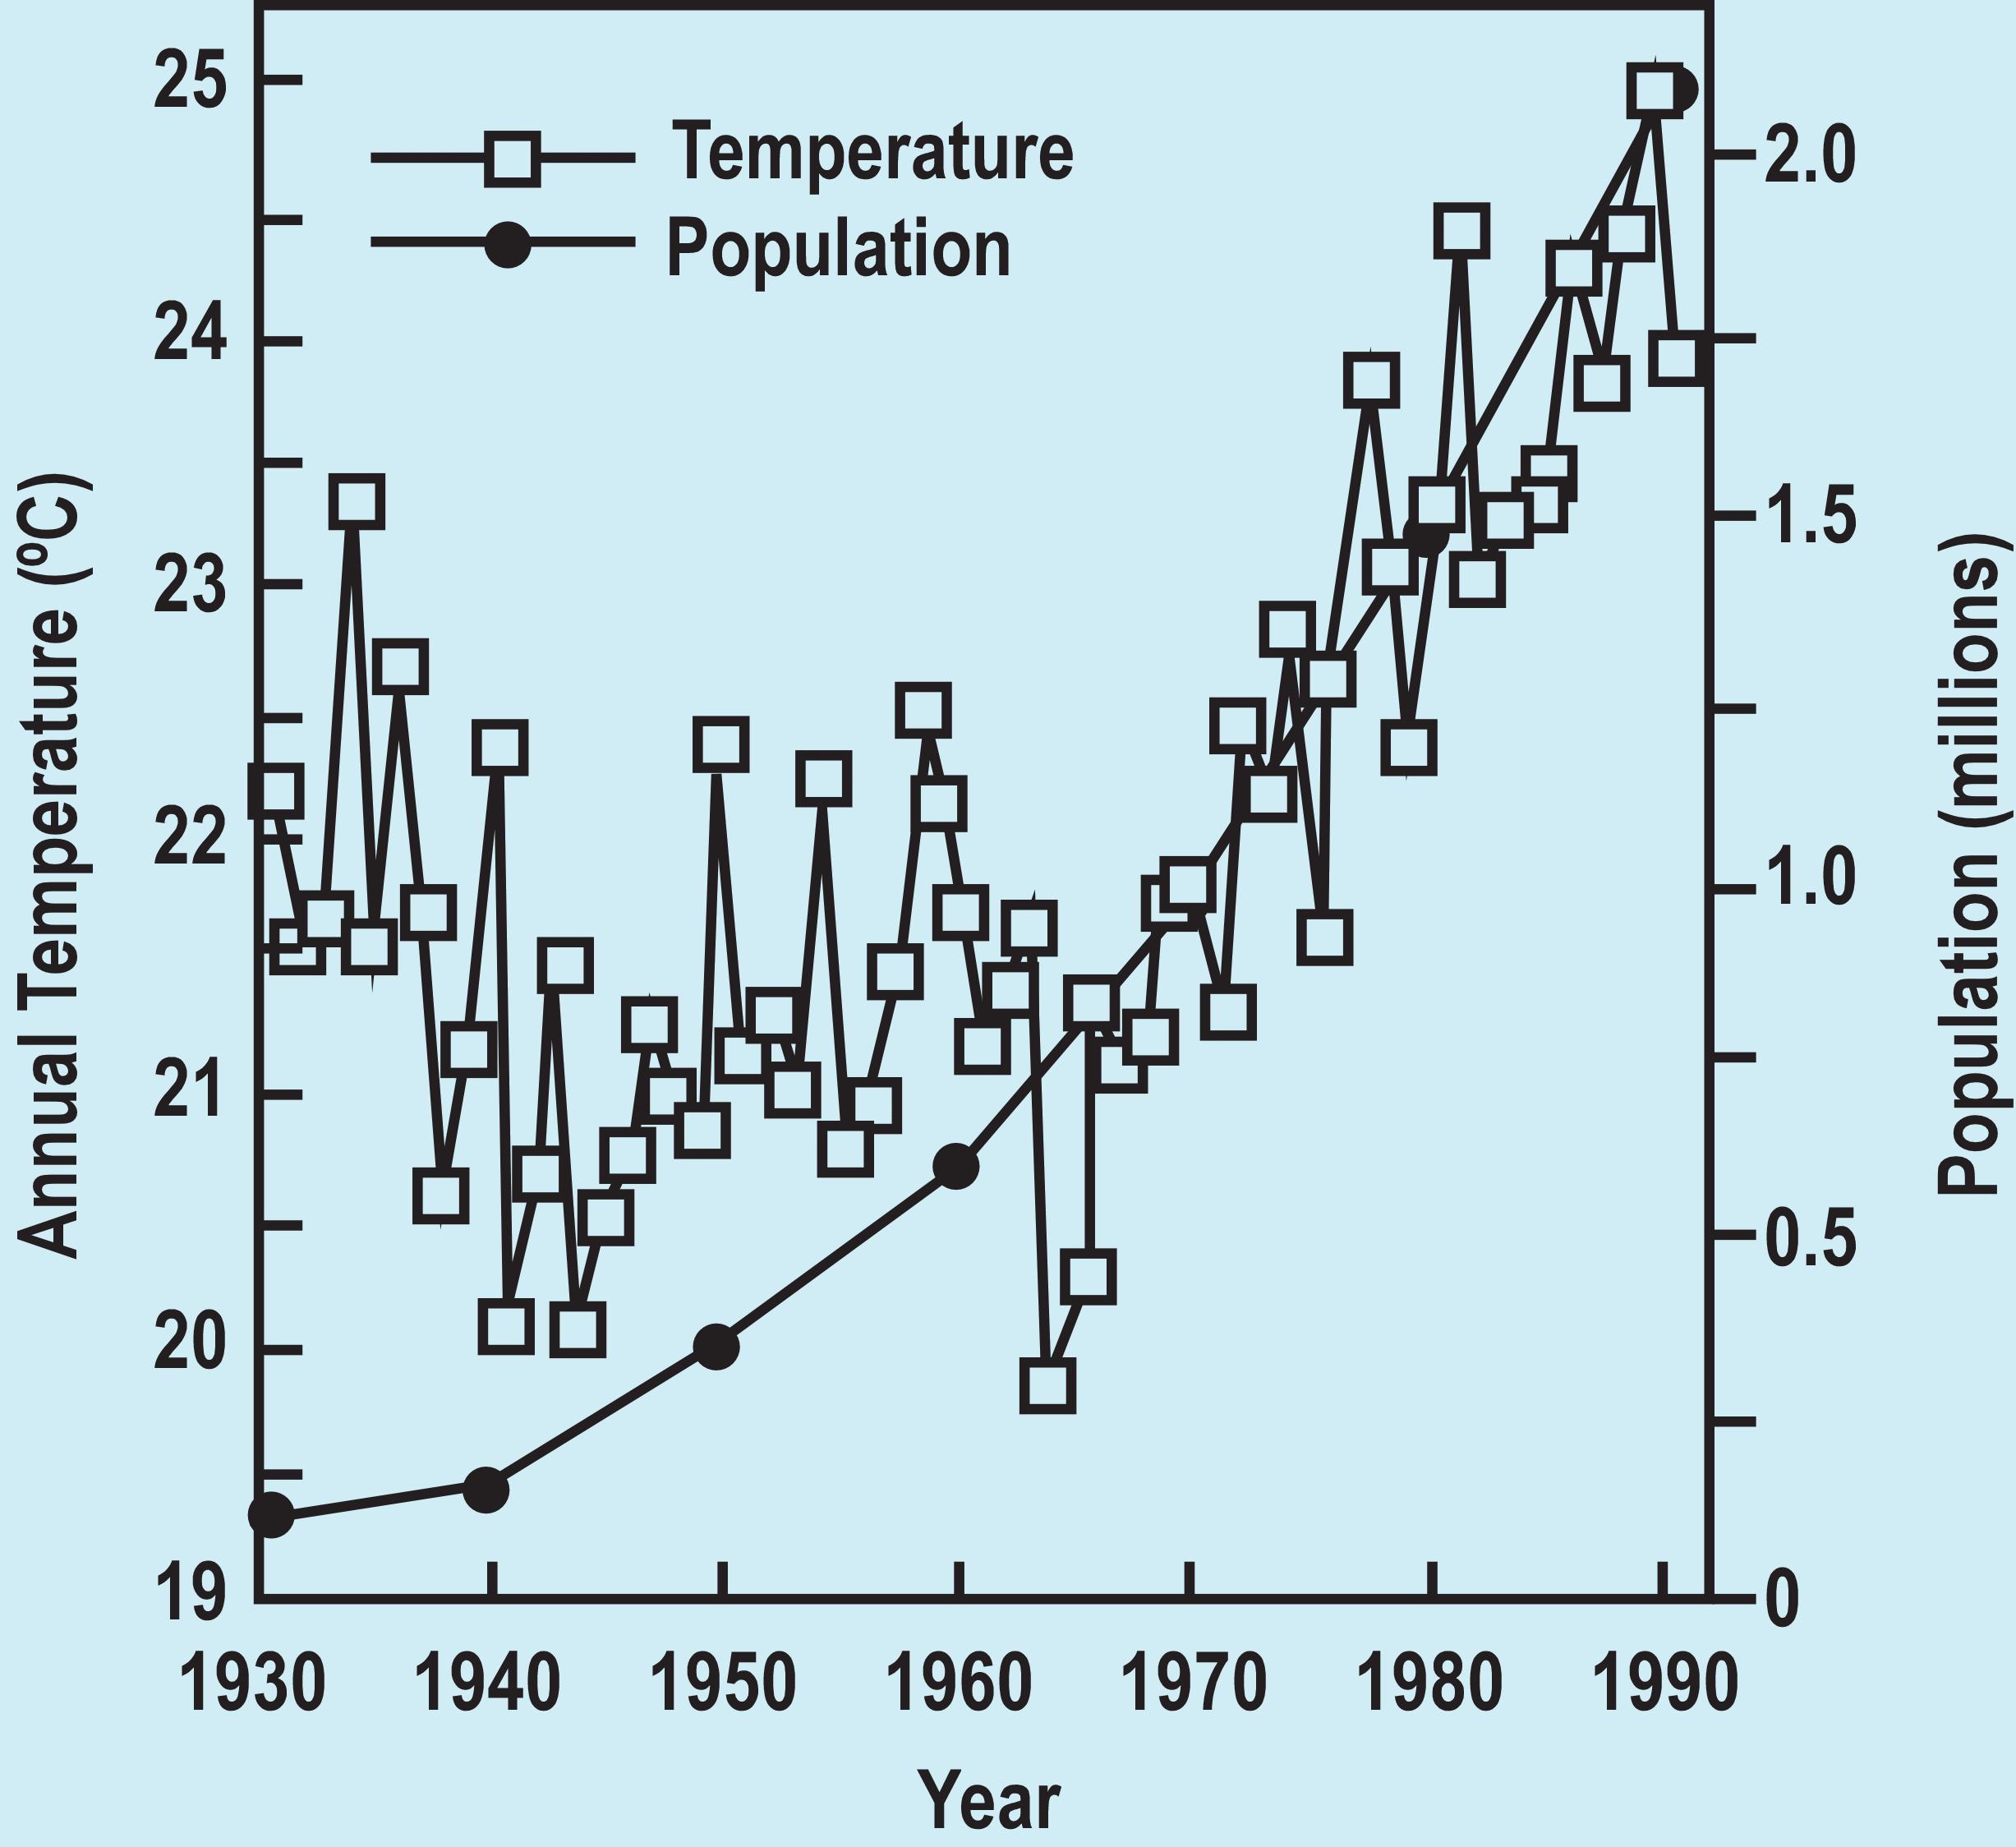
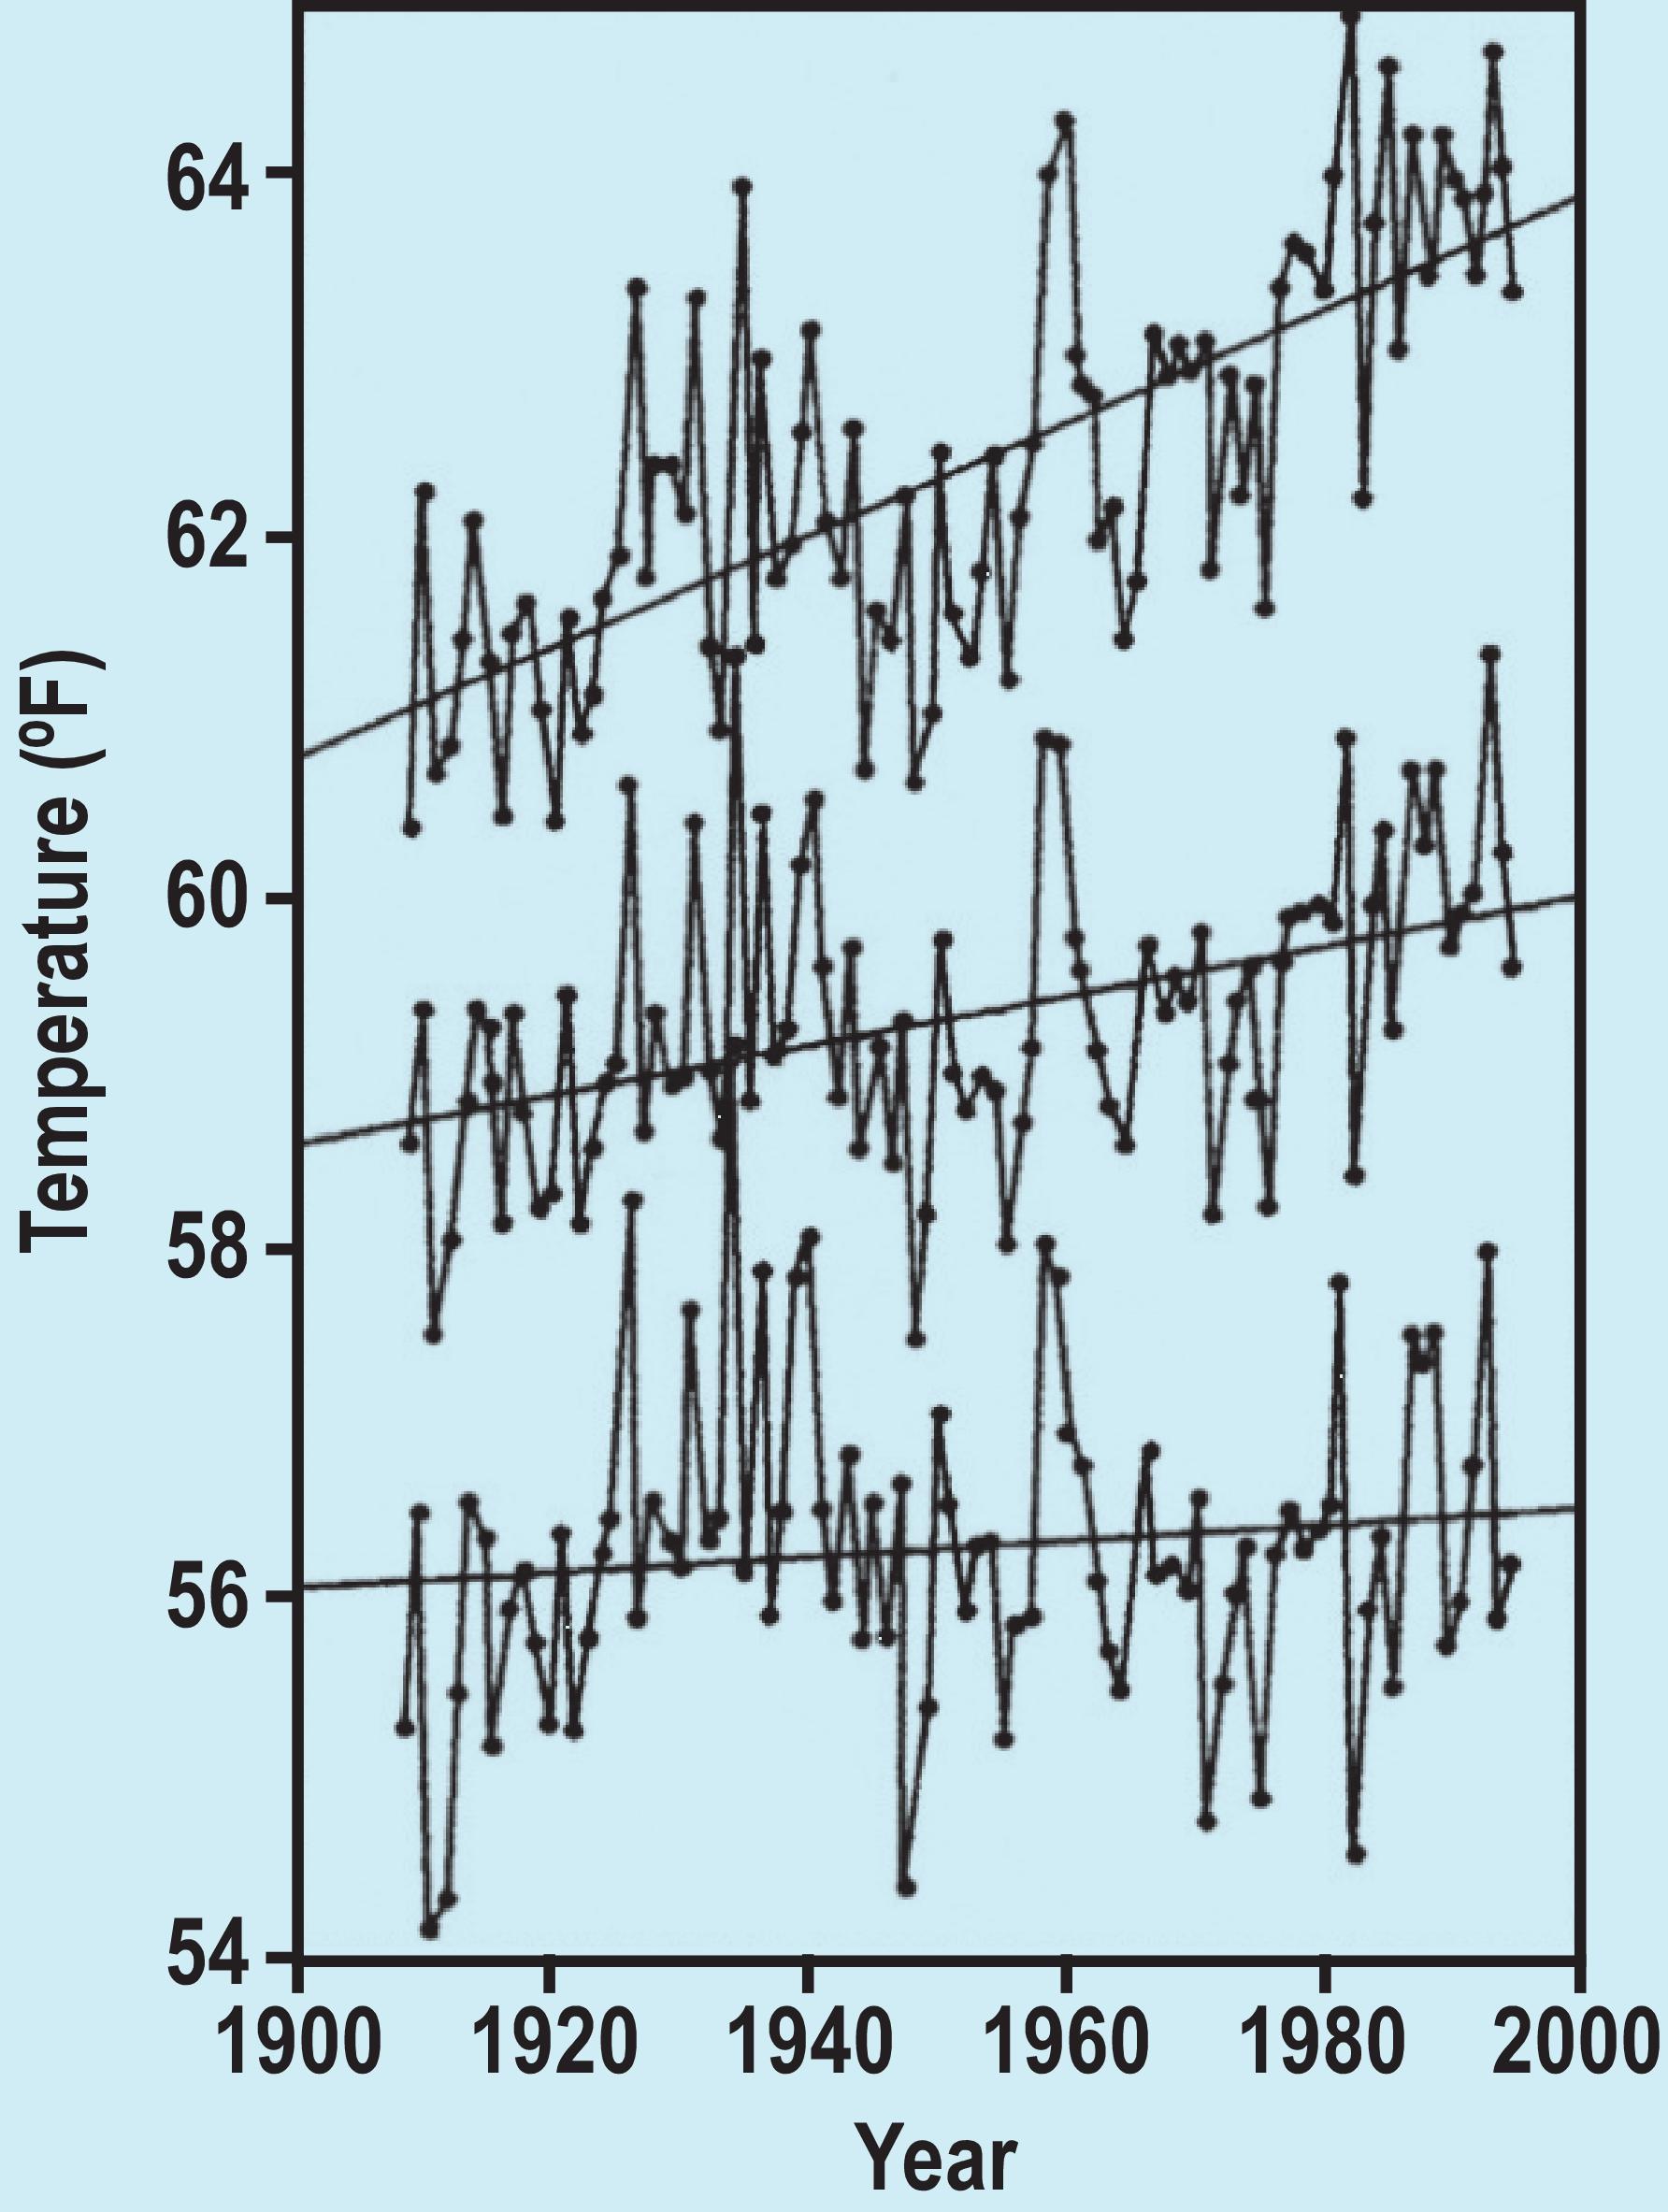
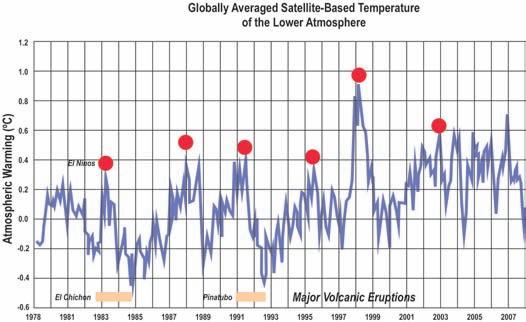
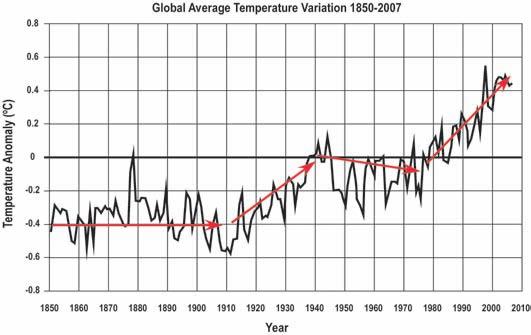
31 Climate Change II: The World’s Historic Climate
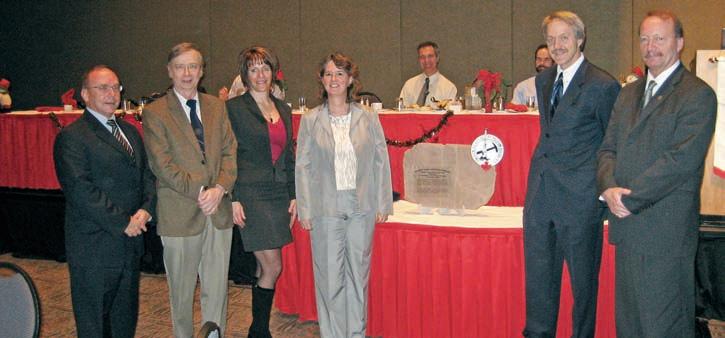
37 CSPG Bestows President’s Award on the Geological Survey of Canada (Calgary)
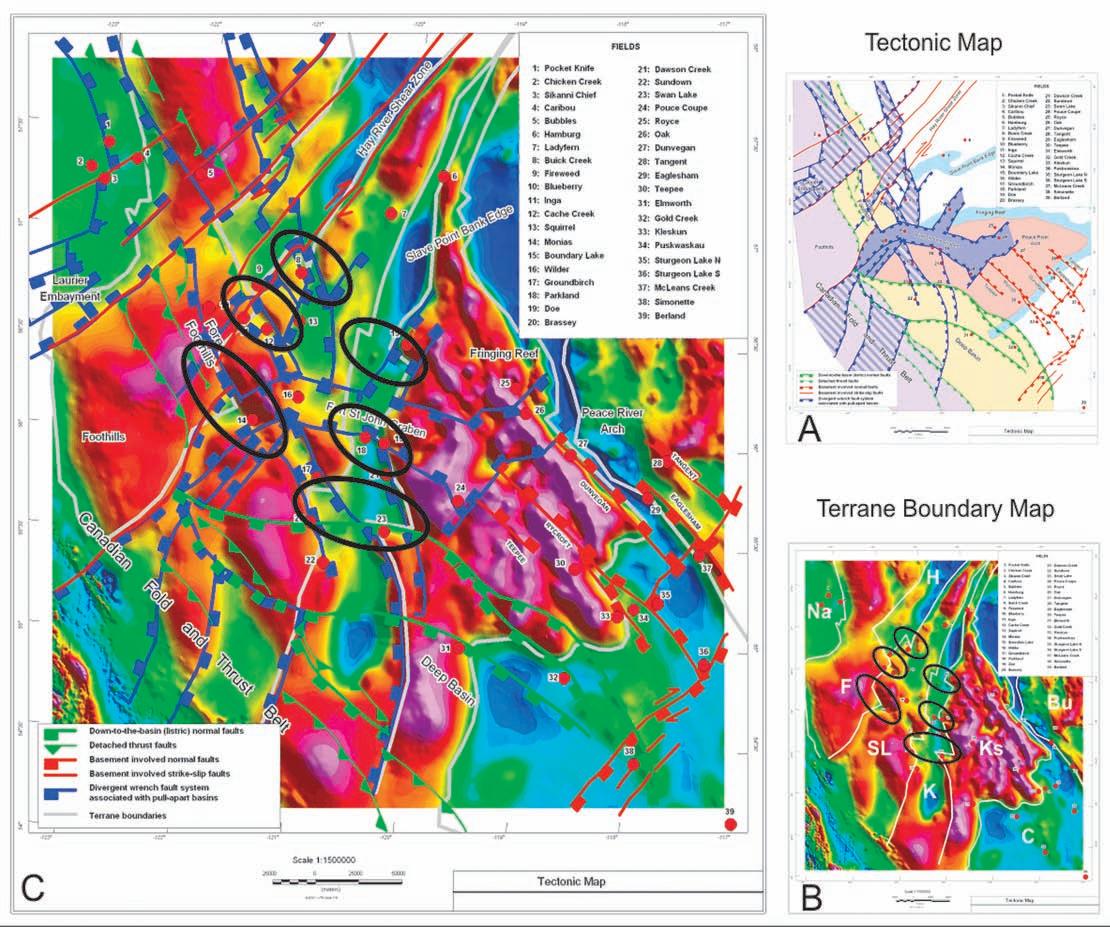
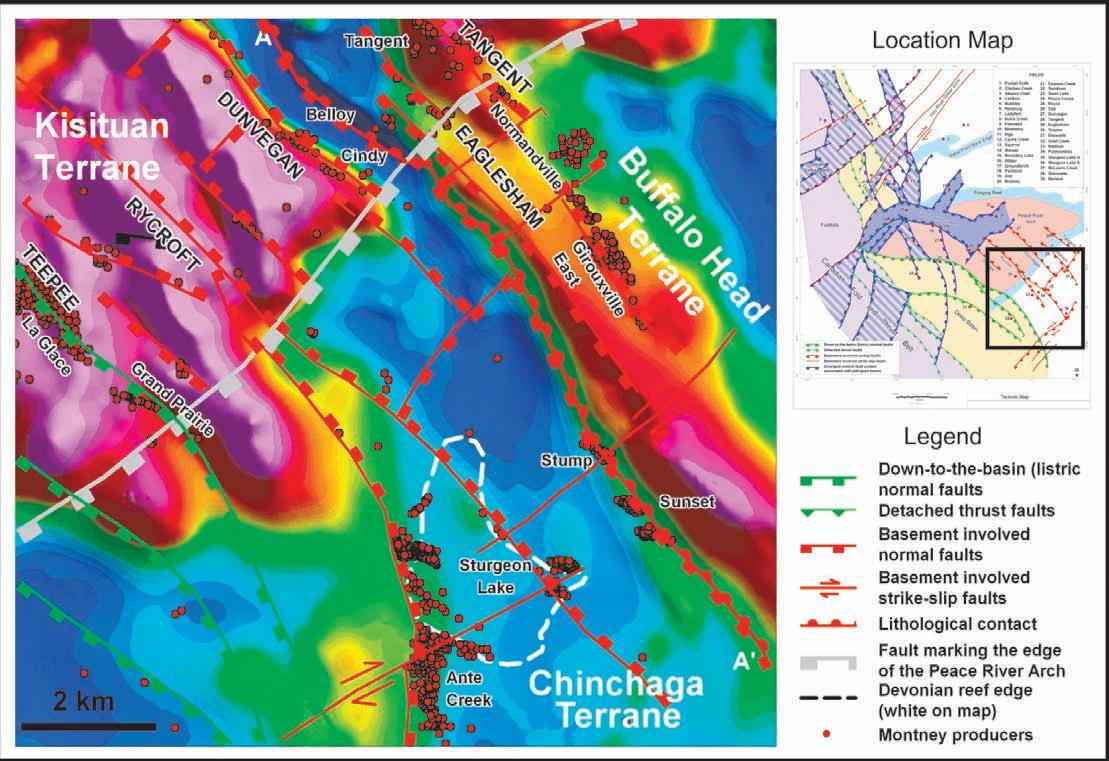
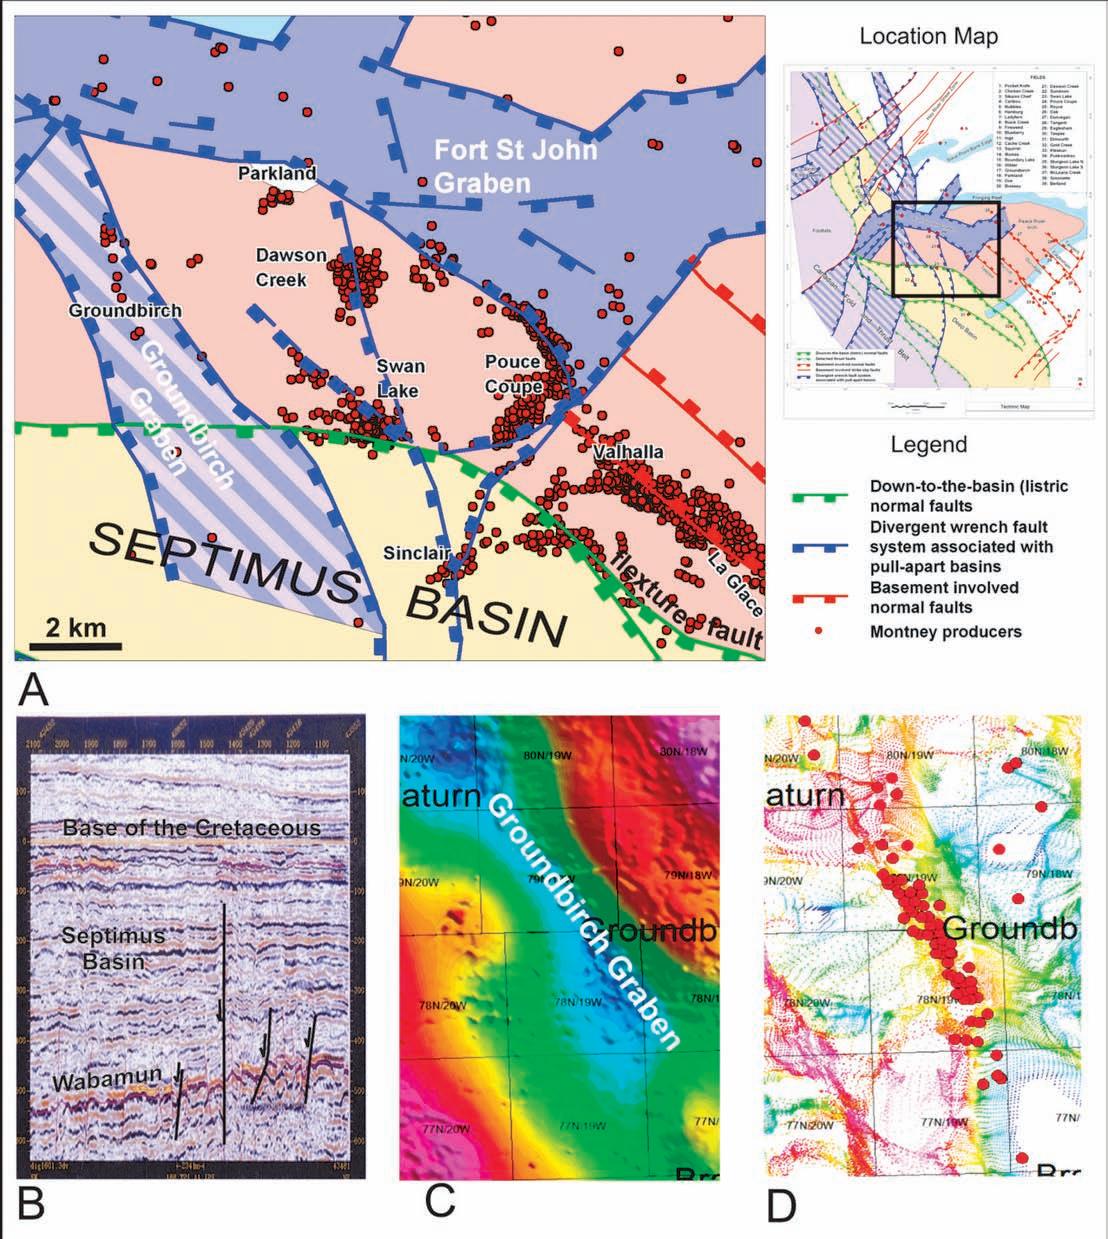
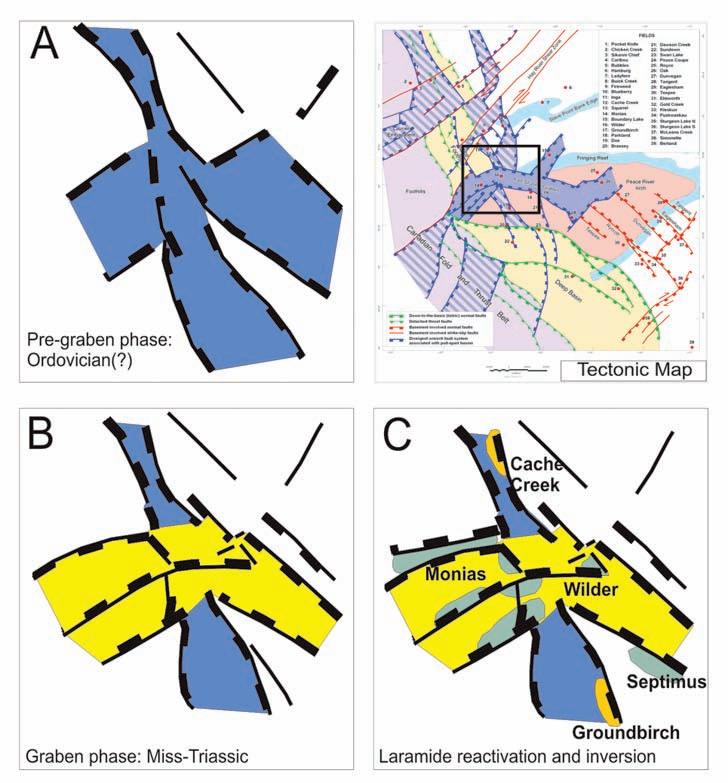
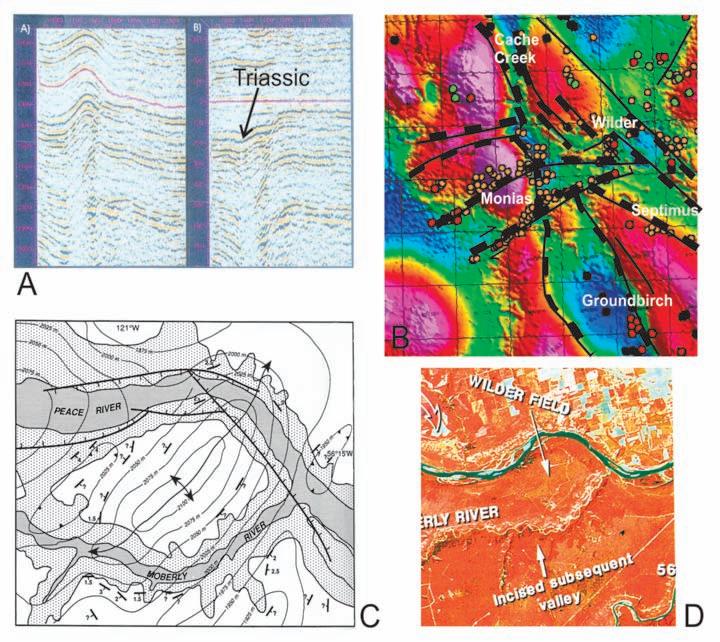
40 Basement Control on Peace River Arch Resource Plays
There’s a Reason Why “Everyone Is Using AccuMap®.”
“Whether it’s cross-sections in AccuLogs, queries and search, or production show maps, AccuMap consistently delivers the quality data I need, when I need it. Its reputation as an industry leader is well deserved.”
John Wittnebel Result Energy Inc., VP Exploration
Strong words. But no newsflash. AccuMap is the premier oil and gas mapping, and data management and analysis tool on the market. Canada ’s most comprehensive dataset – nearly 50 years worth – means faster access to more accurate data. Translation? Quicker data review, enhanced workflow, better decision-making and increased profitability. And it keeps evolving.
For decades now, AccuMap’s been turning data in dollars for you. Which is why so many oil and gas pros like John have it on their desktops. Visit www.ihs.com/accumapconnect to find out about the Well Holding and Spacing module now available in AccuMap.
CSPG OFFICE
#600, 640 - 8th Avenue SW
Calgary, Alberta, Canada T2P 1G7
Tel: 403-264-5610 Fax: 403-264-5898
Web: www.cspg.org
Office hours: Monday to Friday, 8:30am to 4:00pm
Interim Executive Director: Lis Bjeld
Email: lis.bjeld@cspg.org
Communications & Public Affairs: Heather Tyminski
Email: heather.tyminski@cspg.org
Corporate Relations Coordinator: Alyssa Middleton
Email: alyssa.middleton@cspg.org
Membership Services: Dayna Rhoads
Email: dayna.rhoads@cspg.org
Reception: Kasandra Klein
Email: reception@cspg.org
Joint Annual Convention Committee
Convention Manager: Shauna Carson
Email: scarson@geoconvention.org
Convention Coordinator: Tanya Santry
Email: tsantry@geoconvention.org
EDITORS/AUTHORS
Please submit RESERVOIR articles to the CSPG office. Submission deadline is the 23rd day of the month, two months prior to issue date. (e.g., January 23 for the March issue).
To publish an article, the CSPG requires digital copies of the document. Text should be in Microsoft Word format and illustrations should be in TIFF format at 300 dpi., at final size. For additional information on manuscript preparation, refer to the Guidelines for Authors published in the CSPG Bulletin or contact the editor.
Technical Editors
Ben McKenzie Colin Yeo (Assistant Tech. Editor) Tarheel Exploration EnCana Corporation Tel: 403-277-4496 Tel: 403-645-7724 Email: bjmck@telusplanet.net Email: colin.yeo@encana.com
Coordinating Editor
Heather Tyminski
Comunications and Public Affairs, CSPG Tel: 403-513-1227, Email: heather.tyminski@cspg.org
ADVERTISING
Advertising inquiries should be directed to Alyssa Middleton, Tel: 403-513-1233, email: alyssa.middleton@cspg.org. The deadline to reserve advertising space is the 23rd day of the month, two months prior to issue date.
The RESERVOIR is published 11 times per year by the Canadian Society of Petroleum Geologists. This includes a combined issue for the months of July and August. The purpose of the RESERVOIR is to publicize the Society’s many activities and to promote the geosciences. We look for both technical and non-technical material to publish. The RESERVOIR is not intended to be a formal, peer-reviewed publication. Additional information on the RESERVOIR’s guidelines can be found in the May 2008 issue (p.46-48; available at http://www.cspg.org/publications/reservoir/reservoir-archive-2008.cfm).
No official endorsement or sponsorship by the CSPG is implied for any advertisement, insert, or article that appears in the Reservoir unless otherwise noted. The contents of this publication may not be reproduced either in part or in full without the consent of the publisher.
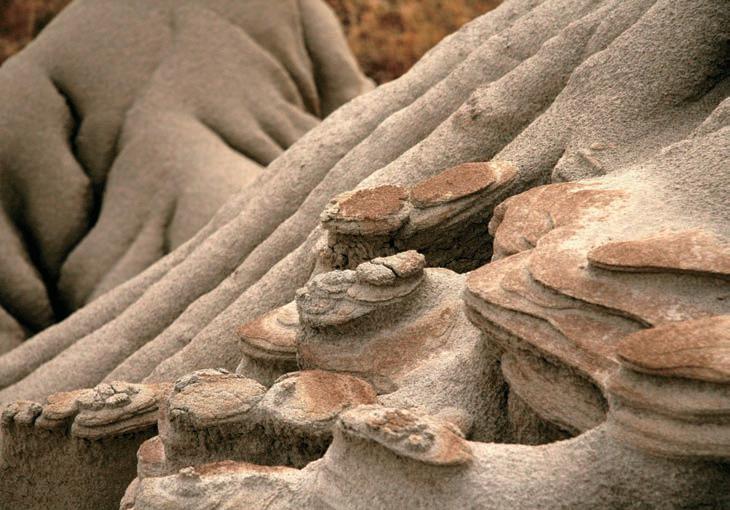
FRONT COVER
Dinosaur Provincial Park, Alberta. Soft sandstones of the Cretaceous Belly River Formation are weathered into arcuate forms in Dinosaur Provincial Park.
Photo by Hamid Farid.
Proudly brought to you by Professionals in Geoscience and Engineering
Alberta’s Professional Geoscientists and Engineers provide Albertans with many of the essentials of daily living. The work that they do allows all of us to enjoy warmth, light, power, water and the ability to travel and communicate over distance.
Since 1920, Members of APEGGA, The Association of Professional Engineers, Geologists and Geophysicists of Alberta, have made a difference in the daily lives of millions of Albertans by bringing science and innovation to life.
The P.Geol., P.Geoph., P.Eng., and R.P.T. professional designations represent the highest standards of quality, professionalism and ethics in geoscience and engineering. APEGGA Members can take pride in the role they play and the contribution they make to Alberta.
APEGGA and its more than 53,000 Members are committed to public safety and well-being through the self-regulation of the geoscience and engineering professions in Alberta.
Visit www.apegga.org for more information.
Geologists Geophysicists Engineers
Since 1927...
CSPG EXECUTIVE
President
Graeme Bloy • West Energy Ltd. gbloy@westenergy.ca Tel: (403) 716-3468
Vice President
John Varsek • EnCana Corporation john.varsek@encana.com Tel: (403) 645-2000
Past President
Lisa Griffith • Griffith Geoconsulting lgriffith@griffithgeoconsulting.com Tel: (403) 669-7494
Finance director
David Garner • Chevron Canada Resources davidgarner@chevron.com Tel: (403) 234-5875
What a difference one year makes: we have abruptly entered into a new era with the near collapse of world-wide financial systems. How this will affect how we do our business in the search for hydrocarbons in a lower price regime and stifling high finding costs will be challenging. The veterans of the oil-patch will tell you that there is a future, but hold on – it’s going to be a roller coaster ride you won’t forget. What the future will be like is anyone’s guess right now. There will be changes, and we the hydrocarbon-finders will be at the forefront, as usual, leading the way.
These financial changes have already affected CSPG; the challenge will be to ensure that CSPG is viable and pertinent to its members’ needs. Over the past two decades, the CSPG has evolved from a local technical society to a non-profit national organization providing support and services to its members. The CSPG now provides and supports its members with:
• Professional development programs such as the bi-weekly Technical Luncheons (the largest in the geological world), the joint CSPG-CSEG-CWLS Convention, Technical Division talks, the Gussow Conference, field seminars, the Honourary Address, and Education Week;
• Encouraging and fostering networking of its members through a variety of social programs such as the Road Race, Squash Tournament, and golf tournaments; and
• Promoting national awareness of petroleum geology through the support of the Student Industry Field Trip, Canadian Geoscience Education Network, the Canadian Federation of Earth Sciences, and outreach university programs to encourage students to pursue a career in petroleum geology.
To continue to achieve these objectives and goals of the Society in 2009, the Executive will pursue the following actions:
• The Society is moving forward in the personnel search for an Executive Director, as over the past several years it has been difficult to co-ordinate the Society’s goals and objectives (as outlined above) with the day-to-day operations of this $2.5 million-dollar not-for-profit business. This individual will be responsible for implementing CSPG Executive directives, the daily administration of the Society and related functions and responsibilities of the office, co-ordinate the many volunteers, be responsible for business performance, and represent CSPG locally and nationally. The ideal candidate for this position should have knowledge of the Society, a passion for the Society, and an extensive personal network in the industry. We will initiate this search in February.
• CSPG is dependant on its many volunteers (300+). This year we will implement a program that sincerely thanks them and recognizes their service and efforts in making the Society the success it is.
• CSPG will continue to pursue its program of national awareness of the profession as outlined by past-president Lisa Griffith, in January’s Reservoir. Also, on the international front, CSPG will continue to strengthen its affiliation with the American Association of Petroleum Geologists.
Over the next few years, the CSPG will undergo significant changes. With many of our members retiring and leaving the business, the actions listed above will be the first steps in ensuring the Society’s continuity in the coming years.
May
4-8,
2009 CSPG CSEG CWLS CONVENTION
Roundup Centre & ERCB Core Research Centr e, Calgar y, Alberta
Geologists , geophysicists and engineers continuously push back the frontiers of science, technology, and business into new landscapes. Whether confronting the frontiers of the mind, with innovative new ideas and concepts, or tackling geographical and resource frontiers with new challenges that need to be overcome, our geoscience and engineering communities continue to expand the limits of what is possible.
Frontiers may be places far away, or they may be close at hand but hard to reach – the word is used to denote far places, but also borders, and we know from recent history how yesterday’s long-established border can become today’s town centre! It just takes a shift in viewpoint.
Innovation may be something completely new, but it’s often the application of an idea from one field of endeavor to another area of practice that generates the breakthrough.
Come and bring your own unique perspective to the 2009 CSPG CSEG CWLS Convention and help us show the world that Canada is the leader in oilfield innovation!
REGISTRATION OPENS MONDAY MARCH 16, 2009
Registration fees for this year’s convention are as follows. Please note prices do not include GST.
Early Bird Registration Deadline: April 3, 2009 (cutoff time is 6:00pm MST)
Regular Registration Deadline: April 21, 2009 (cutoff time is 6:00pm MST)
On-Site Registration May 4 - 7, 2009
Day Pass – Exhibit Floor Only Monday or Tuesday $65/day
Luncheon Tickets Monday or Tuesday $50 each
Icebreaker Tickets (additional tickets may be purchased for guests of convention delegates)
Core Meltdown Tickets
$35 each
$15 each
*Please note that delegates must have renewed their Society memberships by March 1, 2009 in order to be eligible for Convention Member rates.
Avoid the Monday morning on-site registration rush….REGISTER EARLY!
On-line registration will be available through www.GEOconvention.org using VISA or MC. Please make cheques or money orders payable to 2009 CSPG CSEG CWLS Convention. Registrations may also be mailed, faxed or dropped off at the Convention Department c/o CSPG/CSEG office. #600, 640 8th Avenue SW, Calgary, Alberta T2P 1G7
Registrations received after 6:00pm (MST) Tuesday, April 21, 2009 will be held and processed on-site. On-site registration fees will be applied.
CORPORATE MEMBERS
ABU DHABI OIL CO., LTD. (JAPAN)
APACHE CANADA LTD.
BAKER ATLAS
BG CANADA EXPLORATION & PRODUCTION, INC
BP CANADA ENERGy COMPANy
CANADIAN FOREST OIL LTD
CONOCOPHILLIPS CANADA
CORE LABORATORIES CANADA LTD.
DEVON CANADA CORPORATION
DUVERNAy OIL CORP.
ENERPLUS RESOURCES FUND
FUGRO AIRBORNE SURVEyS
geoLOGIC systems ltd.
GRIZZLy RESOURCES LTD
HUNT OIL COMPANy OF CANADA, INC
HUSKy ENERGy INC.
IHS
IMPERIAL OIL RESOURCES LIMITED
LARIO OIL & GAS COMPANy
LITTLE ROCK DOCUMENT SERVICES LTD
MJ SySTEMS
MURPHy OIL COMPANy LTD
NEXEN INC
PENN WEST PETROLEUM LTD.
PETRO-CANADA OIL AND GAS
PETROCRAFT PRODUCTS LTD.
PROVIDENT ENERGy LTD.
RPS ENERGy CANADA LTD.
SHELL CANADA LIMITED
SPROULE
SUNCOR ENERGy INC
TALISMAN ENERGy INC.
TAQA NORTH LTD
TECK COMINCO LIMITED
TOTAL E&P CANADA LIMITED
WEATHERFORD CANADA PARTNERSHIP
AS OF DECEMBER 29, 2008
SECOND ANNUAL Education Week
| by Tina Donkers
This is the second year of the annual CSPG Education Week, organized by CSPG’s Continuing Education Committee. This event, coupled with the Annual Joint Convention, strives to meet the professional development needs of members by offering affordable educational and developmental opportunities to members several times a year.
This year, five lecture-style courses were held at the IBM Canada Centre, and two core courses located at the ERCB Core Research Centre were offered; attendance for all the courses was 108 members, up from 85 participants the previous year. Unfortunately, five new courses were cancelled due to lack of registration. Some of the courses came very close to having the minimum number of registrants required, so they may be offered in the spring during the convention.
The Continuing Education Committee attempts to have a balance of course topics available. However, in the end, it is the members that decide which courses are necessary.
How did the courses go overall? Many of the instructors spoke positively about the students’ engagement, which makes instruction so much more enjoyable. It was great to receive positive comments from the instructors, such as how well organized it was, and that it was beneficial to have people from the Education Committee there every morning to make sure everything was set up and running smoothly.
Overall, the attendees greatly enjoyed the courses offered and felt that Education Week was a great learning opportunity. The most common constructive comments about the courses were: to have an increased number of practical exercises; show more Canadian examples; and take more time to look at core. The evaluations about the courses and facilities will be looked at by the Committee as well as forwarded to the instructors. Overall, participants felt that training facilities were very good, with a few minor complaints.
Interestingly, one of the most common complaints for the Committee to address
was the food. Specifically, “We want healthier food.” Comments and suggestions like this are appreciated. After all, hasn’t it been proven over and over again that good food helps your brain work better? So we’ll attempt to replace those breakfast pastries with muffins (hopefully a healthy variety), and have more water and juice on hand and less pop. Coffee is still a definite requirement, especially for that early morning wake-up.
The courses offered during Education Week and the Annual CSPG Convention, as well as field trips offered during the convention, are facilitated, organized, and executed by Committee coordinators who work with the instructors. The Continuing Education Committee takes care of course budgets, facilities/AV equipment, printing course material, insurance, advertising, accounting, editing agreements and documents, organizing website information, and a myriad of other details. The CSPG office staff organizes the registration, catering, and shipping.
Heading up the Continuing Education Committee of 10 people is Travis Hobbs, who, with his exceptional team, put on the First Education Week in 2007. Travis’s experience and advice guided the team and made for the smooth running of Education Week this year and hopefully we will have continued success with the 2009 Annual Convention. Evelyn, a temporary employee working with our committee, made one comment which said it all: “ you do all of this on a voluntary basis. This is a huge amount of organizing.”
On a personal note, this was my first year on the Education Committee and what I enjoyed the most was the positive attitude and helpfulness that each of the team members brought to the table. Volunteering on the committee has benefited me by allowing me to develop and improve on skills and has given me new connections with people in the industry and in research. I am pleased to be part of a team that brings educational opportunities to the members of the CSPG.
technicaL Luncheons FEBRUARY LUNCHEON
The Wembley Doig “ATSB” field
is anomolous no longer: a coastal barrier bar prograding off an antecedant
shelf
SPEAKER
Jessica Beal
MegaWest Energy Corp.
CO-AUTHOR
Dr. John Harper
ConocoPhillips Canada,
11:30 am
t hursday, February 5, 2009 telus convention centre c algary, a lberta
Please note: the cut-off date for ticket sales is 1:00 pm, monday, February 2, 2009. csPg member ticket Price: $38.00 + gst. non- member ticket Price: $45.00 + gst.
Due to the recent popularity of talks, we strongly suggest purchasing tickets early, as we cannot guarantee seats will be available on the cut-off date. To find out how to buy tickets, visit www.cspg.org or call CSPG’s office at (403) 264-5610.
Deposition of the Anomalously Thick Sand Body (ATSB) of the Wembley Field, in the Triassic Doig Formation, is a result of a prograding barrier bar off an antecedent shelf. The Wembley Field is a sand body that overlies and is laterally encased by Doig shale. Inter-Doig sand caps both the main Doig sand and the laterally adjacent shale; it separates the Doig sand and shale from the overlying Halfway shale.
The Wembley Field Reservoir was deposited during a relative sealevel stillstand. It widens and thickens to the south. The western edge has a distinct N-S linear trace. The eastern margin is serrate due to arcuate sand bodies verging eastward away from the linear western margin. The field extended southward as
lobes of sand shingled the previous deposits. Shale lenses separate each lobe.
Several log signatures have been identified which can be simplified into four basic characters. They represent transitions eastward from the western margin blocky log shape as the massive sands intercalate with the eastern shale packages. Characteristic core sequences document this transition eastward into the shales. The main log character, a blocky gamma ray signature, is a continuous vertical sand body that overlies a basal thin interval of sand tongues, and is typical of the linear western margin of the field. The thickness of this unit increases southward. This character also defines the arcuate sand bodies which verge eastward from the western linear margin. Cores indicate the presence of high-angle breccias and slump deposits at the base of the section. The section passes transitionally upward into an interval of decreasing angle of dip and minor contorted sands with associated extensional faults. This interval lacks bioturbation, any significant deformation, or bioclasts.
The section then grades into very lowangle layering and lamination. Typically, this massive sand is capped with a leached layer, representative of a transgressive cap. Individual shale layers occur within the massive body, and are correlatable between closely spaced wells. These shales separate lobes of sand containing repeats of portions of the above sequence.
Both eastward from the western margin of the field, and normal to the trace of the arcuate sand bodies, cores indicate sands which interfinger with the lateral shales. Those sands record segments of the overall vertical sequence described above. The actual sequences identified in these individual sands reflect the depth position of the sands relative to the main sand sequence.
Lateral to the western margin of the Wembley sand body, the Doig shales can be subdivided into three units. The lowermost shale unit predates deposition of the Doig sand body, thinning westerly from an eastern platformal setting, and can be traced beneath the sand body. It is parallel laminated, with no obvious evidence of marine life or any significant sedimentary structures. The overlying second unit is the lower portion of the shale laterally equivalent to the main sand body itself. Slumping and deformation
with high bedding angles, slump blocks, and a mud conglomerate are all observed within this shale unit. A shallower third unit of shale younger than the Wembley sand body completes the filling of the interval lateral to that body. It has low to horizontal bedding angles, with no signs of slumping and very little deformation.
To the east of the sand body, the previously described shale unit, which predates the sand body, has thickened to the platform setting. An overlying second shale is age equivalent to the sand body. No slumping or deformation is observed in this second shale. Bedding is near horizontal within this unit. The third unit of shale is laterally adjacent but younger than the Wembley sand body and has evidence of intense burrowing as well as deposited bioclasts.
An erosional unconformity at the top of the Doig shale is marked by a pebblerich conglomerate layer. This unconformity resulted from a relative drop in sea level and was subsequently overlain by a thin sand unit, the inter-Doig sand. This unit is variously excluded or included with the Doig depending on the workers involved, but it is clearly post-unconformity sand and postdates the Wembley sand body. This unit has low amounts of shale and silt at both the base and top but has interbedded silt and sand in between. Sometimes the coarse interbedded intervals have a bioclastic-rich layer. Due to high levels of fragmentation, it is difficult to determine the origins of the bioclasts, although they are likely molluscan. Irregular orientation of the shell debris may be a result of storm deposits.
A second unconformity, at the top of the inter-Doig sand, is equivalent to a similar unconformity at the top of the main Doig sand body and is also marked by a conglomerate layer. This latter conglomerate represents a transgressive cap, which is part of the transgressive portion of the depositional cycle that ultimately was deposited over the entire area and heralds the beginning of Halfway deposition.
The integrated data are interpreted to represent longshore progradation of a barrier sand body off an antecedent shelf and into deepening water. Progradation occurred in a shingled fashion as beach ridges were added southward to the spit. Storm washovers resulted in the interbedding of the sands with the shales to the east. Spit curvature to the east was characterized
by extension of the massive sands from the western margin creating the observed serrate eastern side. Production verifies the linearity of the western margin and the arcuate nature of each lobe front. Each lobe is separated from the previous lobe by shale layering, which occurred during the subsequent lobe shift. Such shifts are interpreted to have occurred during major storm erosion along the coast, which would have provided significant volumes of sand for accelerated growth.
The rapid supply of sediment resulted in instability and slumping of sands into deeper water. Extensional faults are the shallow record of the development of slump planes. Sands slumped along the spit front and interfingered with the lateral shales. Evidence of slumping is preserved in both the slumped sands and the deformed shales. The decrease in dip up-section reflects the increased tractional forces in the shallowing water.
A modern-day analogue to the Wembley field is that of a barrier bar prograding off an antecedent shelf at an angle to the coastline, as seen off the coast of Newfoundland (Davis and Harper, 2005). This modern barrier clearly records such slump fans along its outer margin. This active barrier growth process has been documented with seismic, sidescan sonar, cores, historical aerial photography, and video, to name a few of the analyses undertaken.
This model is not suggested to replace previous interpretations of the ATSBs. It represents a detailed study of the Wembley field alone. Previous models may be correct for the specific areas to which they refer as there is probably more than one model that will account for the variations seen for the regional Doig. What this study shows is that high-resolution analysis of individual Doig fields is critical for regional understanding.
R EFERENCES
Davis, L. and Harper, J.D. 2005. Conglomerates: Interpretation of depositional environments and bounding disconformities. CSPG Luncheon Presentation, January 2005.
BIOGRAPHY
Jessica Beal, B.Sc. Honours, graduated in 2006 from St. Francis Xavier University’s Earth Sciences Department in Geology. She is currently employed at MegaWest Energy Corp. exploring, developing, and producing the Pennsylvanianage Warner Sandstone of the Cherokee Basin in the USA. Prior to that, she consulted for HBK Resources where the majority of her projects were based on the McMurray Formation.
Beal has worked as a summer student with both ConocoPhillips Canada and Nexen Inc., working with the Doig and Bakken formations, respectively. Her B.Sc. Honours Thesis is an offshoot of her summer work with ConocoPhillips Canada. She is currently a member of the CSPG, AAPG, and the GAC.
John D. Harper, Ph.D., P. Geol., FGSA, FGAC, is presently Senior Geological Advisor, ConocoPhillips Canada Ltd. and Retired Full Professor, Petroleum Geology and Sedimentology (Carbonate and Clastics), and the first Director
AmericanAssociation of PETROLEUM
of the Centre for Earth Resources Research at Memorial University of Newfoundland. Formerly with Shell Development, Shell Oil, Shell Canada, and Trend Exploration, he has operational, management, and research credentials over the past 36 years in reservoir characterization and basin analysis for Canadian, US, and International onshore and offshore basins. His most recent activities have been in the Mackenzie Delta – Beaufort, Arctic Islands, Scotian Shelf and Deep Water, East and West Newfoundland, and the Grand Banks.
Annual Convention & Exhibition
7-10 June2009• Colorado Convention Center• Denver, Colora USA
Whetheryou wanttohear about recentdevelopments or seethe latesttechnologies available, you can’t miss the AAPG2009 Annual Convention &Exhibition,7-10June 2009inDenver, Colorado. It’s a world-classpetroleum E&P convention thatgivesyou anopportunityto:
•Buildyourskills
•Hear aboutthe latest big discoveries
• Master tightgasandshalegasplays
•Network withe xperts and friends
•Staycurrent inyour specialty
The excitementisbuilding. Make plansto head West!
Watchforthe TechnicalProgram&
TECHNICAL LUNCHEONS FEBRUARY
Early Cenozoic
climate and carbon cycling: the sedimentary record of global warming and massive carbon input
SPEAKER
Gerald Dickens
Rice University
AAPG Distinguished Lecturer
11:30 am
Tuesday, February 17, 2009
Telus Convention Centre
Calgary, Alberta
Please note:
The cut-off date for ticket sales is 1:00 pm, Wednesday, February 11, 2009.
CSPG Member Ticket Price: $38.00 + GST.
Non-Member Ticket Price: $45.00 + GST.
Due to the recent popularity of talks, we strongly suggest purchasing tickets early, as we cannot guarantee seats will be available on the cut-off date. To find out how to buy tickets, visit www.cspg. org or call CSPG’s office at (403) 264-5610.
The “Greenhouse Earth” of the late Paleocene and early Eocene was generally characterized by warm temperatures and elevated CO2 Climate and carbon cycling were, however, far from equable during this interval, as once believed. Surface temperatures slowly warmed by about 5° C from 59 Ma to the Early Eocene Climatic Optimum centered about 50 Ma. This long-term warming generally coincided with greater inputs of
carbon, presumably caused by volcanism. Superimposed on this background change were a series of “hyperthermals,” the most pronounced corresponding to the Paleocene / Eocene Boundary ca. 55 Ma. These were geologically brief (<200 kyr) events that began with rapid warming across the globe and massive input of 13C-depleted carbon. They were also times of extreme variations in ecosystems and the hydrological cycle.
Our current understanding of the late Paleocene and early Eocene allows us to link disparate and unusual observations in strata from across the globe with a holistic perspective. In particular, the start of the PETM (Paleocene Eocene Thermal Maximum) is clearly identified in scores of sedimentary records by a prominent negative carbon isotope excursion in carbonate, organic carbon, or both. This excursion precisely coincides with profound mammal and plant migrations in the northern hemisphere, a mass extinction of benthic foraminifera, elevated terrigenous discharge to many continental margins, laminated sediment facies on continental slopes, and a carbonate dissolution horizon in the deep ocean.
Similar changes, though of lesser magnitude, appear to mark the other hyperthermals. Although cause-and-effect relationships during hyperthermals, as well as links between them, remain uncertain, the hyperthermals and their sedimentary expressions are, without doubt, somehow related to extreme global warming and tremendous additions of carbon to the ocean and atmosphere. Speculative links will be discussed.
BiogRAPhy
Gerald Dickens attained his Master’s in 1993 and his Ph.D. in 1996, both from the University of Michigan at Ann Arbor. From 1997 to 2001 he was a Lecturer at the Department of Earth Sciences, James Cook University in Australia. He has been Associate Professor and Professor at the Department of Earth Sciences, Rice University, since 2001.
He is the author or co-author of over 90 scientific papers. From 2006 to present he has served as the Chief Editor of Paleoceanography. In 20022003 he was named Distinguished Lecturer for the Joint Oceanographic Institutions / U.S. Science Advisory Committee.
Dr. Dickens’s professional interests include Cretaceous and Cenozoic Paleoceanography, the submarine methane cycle, and sedimentary responses to climate and sea-level change.
Depth Imaging
Before drilling your next well, work with CGGVeritas to obtain a superior structural image and experience the advantages of effective collaboration between interpreter and imager.
Expertise
> largest team of depth imaging specialists in Canada
> extensive experience processing foothills, deep basin, permafrost, and marine data
> largest in-house geophysical R&D team in Canada
ENVISION SUCCESS
Service
> dedicated imagers, supported by industryrecognized processing experts
> visualization facilities for effective QC and interactive analysis
> leverage communication and teamwork to achieve your goals
Technology
> advanced 2D and 3D model building tools
> anisotropic Kirchhoff and other leading technologies designed for land and marine data
> thousands of CPU nodes enable large throughput capacity
Rely on CGGVeritas to maximize your exploration accuracy. You’ll have access to leading seismic imaging technologies, highly sought 3D and 2D data, the most advanced acquisition capabilities and a staff dedicated to helping you succeed.
Focus on Performance. Passion for Innovation. Powered by People. Delivered with Integrity.
technicaL Luncheons MARCH LUNCHEON
New
petroleum reservoir modeling techniques improve field management and optimize recovery
SPEAKER
Marjorie Levy
Chevron Energy Technology Company
AAPG Distinguished Lecturer
11:30 am tuesday, m arch 10, 2009 telus convention centre c algary, a lberta
Electron Microscopy and X-ray Microanalysis for Geoscientists
Short Courses
Friday, Feb. 20, 2009
Introduction to SEM and X-ray Microanalysis
Monday-Tuesday, March 2-3, 2009 SEM and X-ray Microanalysis in the Petroleum and Mineral Industries (hands-on lab course)
For rates and course details, contact Robert Marr, Dept.of Geoscience, U of C tel: 403-220-6443 email: rmarr@ucalgary.ca
Please note: the cut-off date for ticket sales is 1:00 pm, thursday, march 5, 2009. csPg member ticket Price: $38.00 + gst. non- member ticket Price: $45.00 + gst.
Due to the recent popularity of talks, we strongly suggest purchasing tickets early, as we cannot guarantee seats will be available on the cut-off date. To find out how to buy tickets, visit www.cspg.org or call CSPG’s office at (403) 264-5610.
Because of the extremely high cost of developing a subsurface reservoir, commonly a billion dollars or more, it is critical to understand the volumes of hydrocarbon that are present within the reservoir and the amount that can be recovered. Each well is expensive, so we must make the most of the information collected from each well to constrain the uncertainty surrounding the architecture of the reservoir, its extent, and its internal heterogeneities, as well as the impact on recoverability. We approach this by constructing a geocellular model of the hydrocarbon accumulation that incorporates a reasonable range of possible reservoir characteristics, and then simulate the flow of fluids – hydrocarbons and water – throughout the life of the field. The results from any reservoir simulation are strongly dependent on the accuracy of the underlying geologic models. Until recently, it has not always been possible to build geocellular models that accurately portray the subsurface geology.
Over the past several years, Chevron has developed a new geologically based modeling workflow, which combines Multiple Point Statistics (MPS) and Facies Distribution Modeling (FDM) to generate a 3D geologically robust geocellular reservoir model. MPS is an innovative depositional facies modeling technique, developed by Chevron in collaboration with Stanford University, which incorporates 3D geological concepts in training images that more accurately integrate geological information into reservoir models. Training images allow MPS to retain complex spatial relationships among multiple facies and to model non-linear shapes such as sinuous channels or irregular bar forms that conventional variogram-based modeling techniques typically fail to reproduce. In addition, because MPS is pixel-based, not object-based, MPS models can be constrained by very large numbers of wells. FDM is a novel technique that is used to generate a facies probability cube to better constrain the facies spatial distribution in geostatistical models.
The MPS/FDM workflow above is preferred to variogram-based and object-based techniques to model important Chevron assets in both shallow-water and deepwater clastic reservoirs, and more recently, in carbonate reservoirs. Additionally, this workflow has been used in synthetic studies to explore the potential impact of architectural and textural parameters on flow behavior. Using experimental design methods, it is possible to determine the relative impact on production of a variety of field parameters. With this information, one can focus on better understanding the key subsurface parameters and gather new data to reduce their uncertainty. This work flow enables field management by lowering risk and optimizing production.
BIOGRAPHY
In 1999, Marjorie Levy joined Chevron Energy Technology Company, where she is now a Senior Staff Research Geologist with Chevron Energy Technology Company. She received her M.A. in 1986 from the Lamont-Doherty Geological Observatory of Columbia University and in 1991 her Ph.D. from Lamont-Doherty Geological Observatory of Columbia University. From 1984 to 1991 she was a Faculty Fellow at LamontDoherty Geological Observatory of Columbia University, and from 1991 to 1999 she was a Research Geologist with Chevron Petroleum Technology Company. Levy has been a Senior Staff Research Geologist with Chevron Energy Technology Company since 1999.
Levy has authored and co-authored papers and presentations on geocellular modeling, reservoir characterization, and subsurface flow. Professional memberships include American Association of Petroleum Geologists and European Association of Geoscientists and Engineers. Professional interests include stratigraphic architecture with particular interest in using it to constrain geocellular reservoir models and evaluate its impact on fluid flow response.
technicaL Luncheons MARCH LUNCHEON
Controls on sedimentology and geomorphology of holocene isolated, shallow, tropical carbonate platforms: Bahamas and beyond
SPEAKER
Gene Rankey University of Kansas AAPG Distinguished Lecturer
11:30 am tuesday, m arch 24, 2009 telus convention centre c algary, a lberta
Please note: the cut-off date for ticket sales is 1:00 pm, thursday, march 19, 2009. csPg member ticket Price: $38.00 + gst. non- member ticket Price: $45.00 + gst.
Due to the recent popularity of talks, we strongly suggest purchasing tickets early, as we cannot guarantee seats will be available on the cut-off date. To find out how to buy tickets, visit www.cspg.org or call CSPG’s office at (403) 264-5610.
Isolated carbonate platforms are the archive of much of geologic history. Similarly, in many cases, they host large hydrocarbon reservoirs (e.g., Miocene of southeast Asia, Devonian-Carboniferous of Caspian Basin). Although we understand the general factors influencing the stratigraphic evolution of isolated platforms, factors controlling platform-scale geomorphic and sedimentologic details within individual timeslices are less well constrained. The purpose of this talk is to systematically explore controls on facies patterns of Holocene platforms from a ‘process-response’ spectrum, based on field, remote sensing,
and lab observations of several Holocene isolated platforms in the Caribbean and Pacific oceans. The results provide testable conceptual models that might be used to predict stratal architecture and potential reservoir quality in subsurface analogs.
To begin to develop these predictive models, this study compares geomorphic and sedimentologic patterns on platforms across a ‘process-response’ spectrum. Sedimentologic and geomorphic comparison of Caribbean (Great Bahama, CrookedAcklins, Caicos) and Pacific (Aitutaki, Maupiti, Nonouti) shallow-water (<25 m) platforms from settings with a range of island and reef-rim configuration, tidal amplitude, and significant wave height reveals several themes:
1) Neither an open windward margin nor currents driven by strong winds are fundamental controls on the occurrence of grainy platform interiors;
2) Tide-dominated platforms commonly have broader, more gradational lateral facies changes normal to platform margins; wave-dominated platforms have more abrupt facies boundaries related to dissipation of wave energy at the margins;
3) Well-developed reefs and reef aprons are likely on margins facing open-ocean swell, which may or may not be coincident with windward margins;
4) On individual platforms, and between platforms, grain size, sorting, and type are not strongly correlated with water depth, but are related instead to hydrodynamics (wave and tide energy) and setting (e.g., proximity to shelf margin); and
5) Although an open windward margin or
currents driven by strong winds may indeed facilitate removal of muds, their absence does not dictate that a muddy platform interior is present.
These results from Holocene analogs illustrate and quantify the importance of waves, tides, and currents on platformscale facies patterns. As such, they provide conceptual facies models for understanding field and inter-well facies variability, and can aid in developing more robust geologic models of reservoirs in isolated carbonate platforms.
BIOGRAPHY
Gene Rankey is an Assistant Professor of Geology at the University of Kansas. He received his B.Sc. in 1991 from Augustana College, Illinois, M.Sc. in 1993 from the University of Tennessee, and Ph.D. in 1996 from the University of Kansas. From 1996 to 2000 he was with ExxonMobil Upstream Research. From 2000 to 2002 he was at Iowa State University and from 2002 to 2008 at the University of Miami.
Rankey has authored and co-authored numerous papers on ooid shoals, shallow shelf carbonate facies, and geomorphic changes on carbonate tidal flats. Gene Rankey was awarded with the Outstanding Paper Award from the Journal of Sedimentary Research in 2002.
diVision taLKs GEOFLUIDS DIVISION
Mechanical force fields as drivers of fluid migration at carbon sequestration sites Part 2: ‘Buoyancy Forces’ and geological storage of CO 2
SPEAKER
Udo Weyer
WDA Consultants Inc, Calgary, AB
3:30 pm
thursday, February 5, 2009 room 136, earth sciences Building university of calgary calgary, alberta
A previous presentation dealt with the physics and basic principles of fluid flow in the subsurface and the pattern and effects of deep-reaching groundwater flow systems on CO 2 disposal. It was established that the directions of pressure potential forces of all fluids in the subsurface are determined by the deeply penetrating force field of fresh groundwater. Thus the force field of the fresh groundwater has a pronounced effect upon the flow directions of oil, gas, and CO 2 which are generally not vertically upwards as widely assumed. In this presentation the physical meaning of so-called ‘buoyancy forces’ will be highlighted under hydrostatic and hydrodynamic conditions.
In the past solely ‘buoyancy forces’ and capillary forces or solely pressure gradients have often been used in modeling the long term fate of CO 2 sequestration. The mechanical force fields of groundwater flow systems have so far not been implemented into these models, as they should have been.
With respect to CO 2 storage in oil and gas fields, the significant role of abandoned deep wells on the rearrangements of force
fields of groundwater and the associated flow of other fluids will be assessed. Two field examples and mathematical models from Alberta visualize the effect of leaking abandoned wells on deep reaching groundwater flow systems.
BIOGRAPHY
Udo Weyer is a Senior Hydrogeologist with over 30 years experience in physical hydrogeology (regional and local groundwater flow, water supply, and man-induced changes), contaminant hydrogeology (petroleum industry, base metal and coal industry, chemical industry, steel industry, landfills), mine dewatering, and subsidence in North America, Europe and Asia. He has supervised the utilization of numerous geochemical and groundwater flow models. In addition, Dr. Weyer has managed and conducted consulting work and complex field studies of hydrogeology, hydrology, engineering geology, geology and other issues of environmental nature in a wide variety of geographical and climatological settings, from the tropics to permafrost regions. He has prepared over two hundred reports and technical papers and published a book on subsurface contamination by hydrocarbons.
ConocoPhillips Glen Ruby Memorial Scholarships in Geoscience
ConocoPhillips is pleased to announce the recipients of the ConocoPhillips Glen Ruby Memorial Scholarships in Geoscience for 2008.
Kaylee Anderson
Bradley Evans
Rachel Lea
ConocoPhillips would like to wish all applicants the best of luck in their studies and future endeavors.
DIVISION TALKS INTERNATIONAL
Reconstructing the paleoelevation of the Central Andes
SPEAKER
Andrew Leier
Assistant Professor, Department of Geoscience University of Calgary
12:00 Noon
Wednesday, February 11, 2009 Encana Amphitheatre 2nd floor,
East end of the Calgary Tower Complex, 1st Street and 9th Avenue S.E. Calgary, Alberta
The stratigraphy of a foreland basin is intimately related to the development of the adjacent fold-thrust belt. Although it is generally assumed that surface uplift in fold-thrust belts coincide with faulting, recent oxygen isotope paleoaltimetry data suggest this is not necessarily true. This study examines Cenozoic sedimentary units deposited within the hinterland of the Central Andes in an effort to better understand the timing, magnitude, and causes of surface uplift in fold-thrust belts.
Oligocene-Miocene clastic stratigraphic units deposited in the Altiplano and Eastern Cordillera of the Central Andes consist of the Luribay Conglomerate and the overlying Salla Beds. The Luribay Conglomerate is composed of syn-deformational pebbleboulder conglomerate beds deposited in alluvial fan and coarse-grained fluvial systems. The overlying Salla Beds are composed of siltstone and minor sandstone and contain paleosols with pedogenic carbonate. The Salla Beds onlap and overlap structures in the area and are themselves undeformed, indicating deformation ceased by 27 Ma.
Calcium carbonate nodules from paleosols in the Luribay Conglomerate and Salla Beds were collected and their oxygen isotope ratios analyzed to determine paleoelevation. Oxygen isotopes from beds with ages of ca. 27 Ma have values indicating paleoelevations of <1 km above sea-level. Oxygen isotope values from beds with ages of 24-22 Ma are more negative, and indicate up to 2 km of surface uplift occurred between 27 and 24 Ma.
This rapid pulse of surface uplift is interpreted as resulting from isostatic rebound associated with lithosphere delamination. The timing of the increase in elevation postdates upper crustal deformation, but coincides with voluminous mafic volcanism. The location (200 km behind the arc) and geochemistry of the volcanic units have been interpreted as evidence of a ca. 25 Ma delamination event in the region. This investigation suggests fold-thrust belts can be subject to episodic pulses of surface uplift not associated with upper crustal deformation. Such geodynamic processes may impact foreland basin stratigraphy.
BIOGRAPHY
Andrew Leier received a B.S. from Bucknell University (Pennsylvania), an M.S. from the University of Wyoming, and a Ph.D. from the University of Arizona in 2005. From 2005-2007 Leier was a post-doctoral student at Princeton University. In 2008 Leier joined the University of Calgary as an Assistant Professor in the Department of Geoscience. Leier’s interests are in basin-scale sedimentary studies and investigating controls on the sedimentary record. Leier has worked in the Appalachian foreland basin, the Western U.S. foreland basin, Tibet,
South America, southern California, and on understanding Martian eolian deposits.
UPCOMING EVENTS
February 11, 2009
Rock Shots – Sig Joiner
March 18, 2009
Rock Shots – TBA
Main Event – Paul MacKay Fracture Systems in Carbonate Reservoirs –Gulf of Suez
April 15, 2009
Rock Shots – TBA
Main Event – Dennis Meloche Modern Depositional Analogs in Mexico/Baja California.
INFORMATION
There is no charge. Please bring your lunch. The facilities for the talk are provided complimentary of EnCana and refreshments by Geochemtech Inc. For further information or if you would like to give a talk, please contact Bob Potter at (403) 863-9738 or ropotter@telusplanet. net or Trent Rehill at (403) 615-2386 or trent. rehill@artumas.com.
Reservoir Characterization
Expertise in heavy oil & deep basin reservoirs
• AVO / LMR Analysis
• Neural Network Analysis
• PP & PS Registration
• Joint PP & PS Inversion
• Fracture Detection Analysis using Azimuthal AVO
• Spectral Decomposition Time Lapse Analysis
Carmen Dumitrescu
P.Geoph., M.Sc., Manager, Reservoir Geophysics
Direct: 403-260-6588 Main: 403-237-7711
www.sensorgeo.com
diVision taLKs S TRUCTURAL GEOLOGY DIVISION
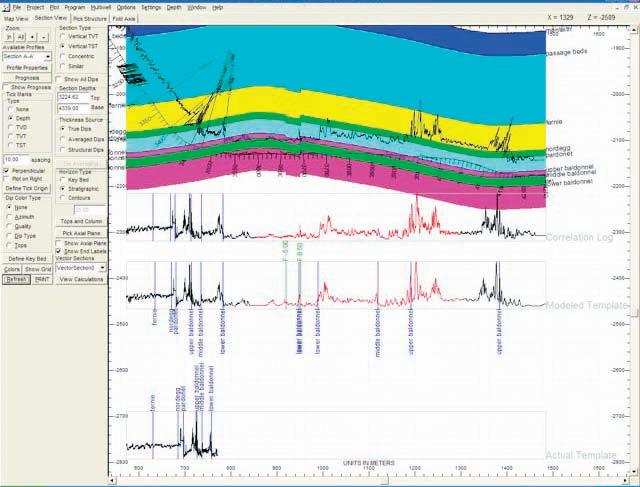
RDA dip interpretation suite (RDA), real time dipmeter interpretation, and its impact on the reservoir modeling of structural plays
SPEAKER
Andrew C. Newson Moose Oils Ltd.
CO-AUTHOR
Charles R. Berg
Resdip Systems
12:00 noon
Wednesday, February 18, 2009 room LPW-910, Livingston Place West 250 2 st sW, calgary, alberta
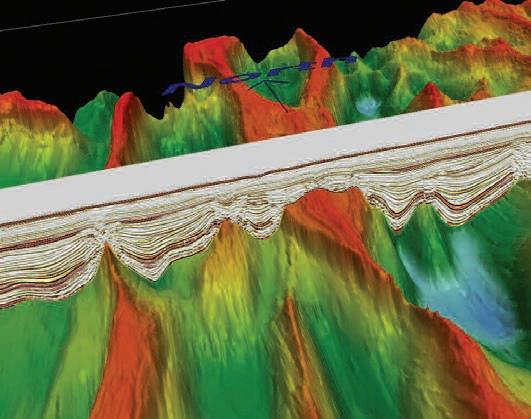
As we explore for and develop more complex reservoirs, the impact of borehole position becomes critical. When the bed dips are highly variable and complex the interpretation of the dip and strike can be difficult. In addition, a horizontal or vertical well may pass through multiple structural domains within the reservoir horizon. RDA offers the ability to be able to interpret the stratigraphic position of the borehole during drilling and before a dipmeter has been run.
Using a close-offset gamma as a template correlation log, the software allows the users to calculate the bed dip and strike, axial surface, and fault positions. In addition, it can accurately calculate the fault throws. This is carried out in real time on the screen in a series of interactive steps while the well is being drilled. The key to this operation is the calculation of the True Stratigraphic Thickness (TST) of the reservoir horizon and the adjacent formations in each of the structural domains.
In addition, the TST has an impact on many aspects of the exploration and development of hydrocarbons in structural domains:
• Velocity models for seismic depth conversion;
• Well prognosis;
• Measurement while drilling (MWD) well monitoring;
• Structural interpretation of objective horizons;
• True thickness for sequence stratigraphic interpretation;
• Balanced cross-section construction; and
• Reserve calculations.
The TST of a bed is calculated using: TST = MT * (cos - sin * cos * tan) * cos, where MT = measured thickness, TST = true stratigraphic thickness, = dip, = the dip azimuth minus the borehole azimuth, and = borehole inclination from vertical. (Tearpock and Bischke, 1991).
In this talk we will look at how RDA uses three dimensional trigonometry and interactive windows to correct a single log or a suite of logs from measured depth to TST. The software achieves this by rotating the poles to the dips along the great circle containing the adjacent poles. By using eigenvector analysis, vector mean, or vector median to average (smooth) the data, an accurate TST calculation can then be made in zones of highly variable dip density and direction. This can then be displayed real time as a Vector Section.
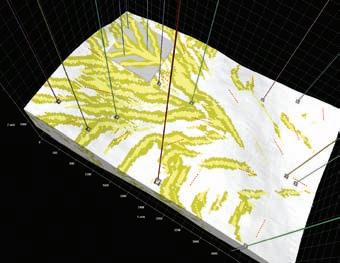
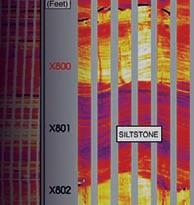
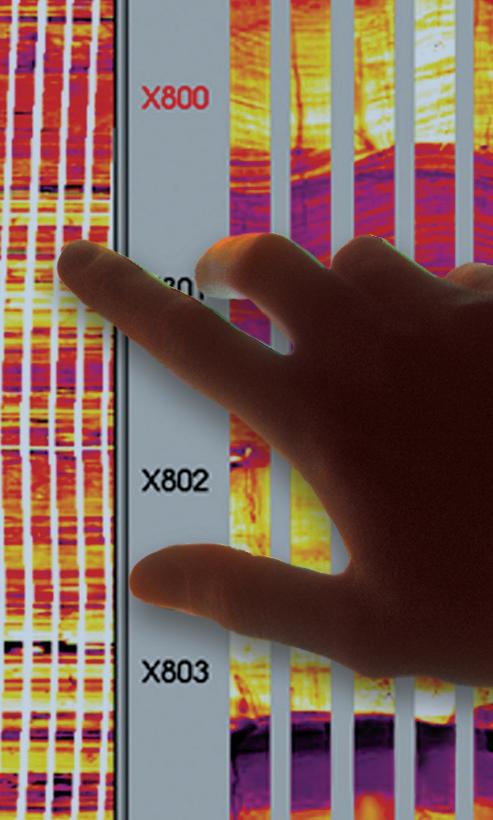
As an operational tool RDA allows the operator to GeoSteer a horizontal well so that it stays in a thin undulating reservoir horizon (Figure 1). In addition, the prognosis tool enables the geologist and drilling engineer to predict intra-formation tops given a variety of drilling scenarios, thereby reducing the engineering risk and contributing to a successful well.
R EFERENCES
Tearpock, D.J. and R.E. Bischke. 1991. Applied Subsurface Geological Mapping. Prentice-Hall, Inc. Englwood Cliffs, New York.
RDA Dip Interpretation Suite is produced by Resdip Systems, Houston, Texas.
BIOGRAPHY
Andrew Newson has nearly 35 years of experience in geological and geophysical evaluations. He is a Professional Geological Consultant registered in the province of Alberta and is currently living in Calgary. Newson graduated in 1972 with a B.Sc. Honours in geology from London University, England. Since then he has worked as a structural geologist specializing in the exploration and exploitation of hydrocarbon prospects in overthrust belts around the world.
As a consultant for 17 years, Newson has been involved with numerous projects for clients among the major, independent, and junior oil and gas companies. To facilitate this, he incorporated Moose Oils Ltd. in 1994. Through Moose Oils Ltd. he teaches in-house workshops on fold-and-thrust play evaluation techniques and regularly leads field trips for industry to the Canadian Rocky Mountains. He is closely involved in developing balanced cross-section and dipmeter analysis software packages to assist in the structural interpretation of thrust and fold plays.
INFORMATION
Talks are free and do not require pre-registration. Please bring your lunch. Refreshments are provided by HEF Petrophysical Consulting.
Figure 1. To illustrate the functionality of this technique, we will look at two examples. One from a well drilled vertically into a reservoir and one from a well that is drilled horizontally into a reservoir.
diVision taLKs PALAEONTOLOGY DIVISION
North America’s smallest dinosaur: Albertonykus
Borealis
SPEAKER
Nick Longrich University of Calgary
7:30-9:00 pm
Friday, February 20, 2009 room B108, m ount royal college c algary, a lberta
The Alvarezsauridae are among the most bizarre and puzzling of all dinosaurs. They are small, birdlike dinosaurs with short, stubby forelimbs, gracile hindlimbs, and long jaws filled with needle-like teeth; little is known about the biology of these enigmatic animals.
In 2006, while examining fossils from Dr. Philip Currie’s Dry Island Albertosaurus bonebed, housed at the Royal Tyrrell Museum of Paleontology, the thumb claw of an alvarezsaurid was discovered. Further examination of the collections eventually resulted in the identification of a dozen bones, from at least two dinosaurs. This animal, Albertonykus borealis, is the oldest
and most complete alvarezsaur known from North America.
Weighing an estimated eight pounds, Albertonykus is the smallest dinosaur yet discovered in North America. Although the skeleton is very incomplete, Albertonykus had the same striking proportions found in other alvarezsaurs.
The hind limbs were probably well suited to running, but the short, stubby forelimbs show large muscle attachments for digging. The single, hook- like thumb claw is similar to the claw seen in anteaters, suggesting a similar function. Albertonykus may have ripped open insect nests in search of food.
Given that the temperate climate of Late Cretaceous Alberta would not have supported mound-building termites, and given that mound-building termites may not have existed in the Cretaceous, it seems likely that Albertonykus preyed on woodnesting termites.
Examination of fossil wood from the Late Cretaceous Horseshoe Canyon Formation
(where Albertonykus is found) shows that the wood is often filled with burrows, which may represent termite galleries. It therefore appears that the rise of social insects in the Cretaceous was followed by the evolution of dinosaurs that could exploit these new resources.
BIOGRAPHY
Nick Longrich received his B.Sc. from Princeton in 1998 and his M.Sc. in 2000 from the University of Chicago. He recently received his Ph.D. in Biological Sciences at University of Calgary. His studies focus on dinosaurs and fossil birds and he combines art interests to create lively illustrations of these creatures.
I NFORMATION
This event is jointly presented by the Alberta Palaeontological Society, Mount Royal College and the CSPG Palaeontology Division. For information or to present a talk in the future please contact CSPG Palaeontology Division Chair Philip Benham at 403-691-3343 or programs@albertapaleo.org. Visit the APS website for confirmation of event times and upcoming speakers: http://www.albertapaleo. org/.
BIT BY BIT, DRILLERS ARE MAXIMIZING RETURNS BY SHELVING “OFF-THE-SHELF” BITS in favor of customized solutions
| by Steve Hawkins
Every well is unique in its architecture and lithology. Those facts would seem to dictate that, if it could be designed quickly and subsequently yield a better return on investment, a customized drill bit would almost always be the optimal match for the challenge at hand.
Indeed, all over Canada – and the world at large – drill bit customization is yielding drillers not only less bit wear and more successful bit runs, but significant time savings as well. As the only drill bit manufacturer to offer customers truly customized bit solutions via its unique DatCITM (Design at the Customer Interface) service process, Halliburton’s Security DBS Drill Bits (SDBS) group is changing the way drillers approach their hard rock, directional drilling, and hole enlargement challenges. Backed by over fifty years of inCanada drill bit experience, Security DBS’
Canstrat Sample Logging Course
March 2-6, April 13-17 May 25-29, 2009
Practical Wireline Logging
March 12-13, April 23-24, 2009
For complete course outline, please refer to our website www.canstrat.com/courses or phone (403) 284-1112
unique DatCI service process uses local knowledge and local experts to custom design the customer’s bit “on the spot.” In effect, this means that because the bit is a custom solution to the project’s unique well architecture and lithology, the bit “has the customer’s name on it.”
FROM PLANNING TO SOLUTION, SCIENCE HELPS BUILD A BETTER BIT
In the planning stage, Security DBS employs both design and performance monitoring techniques to first clearly define the application. It’s here that detailed information is gathered from the geologist, drilling engineer, and directional well planner.
Once Security DBS’ Application Design and Evaluation (ADE) specialist has gathered all necessary information pertaining to the well to be drilled, he refers to Security’s global bit-run database and downloads relevant performance records of bit runs in the surrounding area. This database contains details of all the essential parameters of offset bit runs and the associated bit performance. The task of determining the relevant bit runs is the key to performance evaluation. Because no two wells are the same, the ADE must select relevant wells according to clearly defined criteria to ensure an “apples to apples” comparison.
Evaluation of offset performance begins with a detailed inspection of the worn bit. The ADE describes the location on the cutting structure and the type of the bit wear. He then look through similar formation intervals for indications in the bit run of possible wear causes, including drilling very hard interbedded formations, vibrations coming from drill string dynamics, and incorrect parameters. The cutting structure layout can then be modified to minimize these effects.
DETERMINING ROCK DRILLABILITY
Because the full definition of rock drillability incorporates a number of measurable characteristics – notably unconfined compressive strength, tensile strength, pore pressure, abrasiveness, mud overbalance, permeability, bed thickness, well borestrata intercept angle, and formation
compressibility – core samples would be the ideal source of rock drillability data. (Over the years, rock compressive strength has become the industry reference for rock drillability. Unconfined strength (UCS) and confined compressive strength (CCS) are the quantitative measures.) Cores, however, are generally restricted to reservoirs and are prohibitively expensive to cut and recover. Plus, cores are almost always unavailable in the majority of all footage drilled preceding the reservoir.
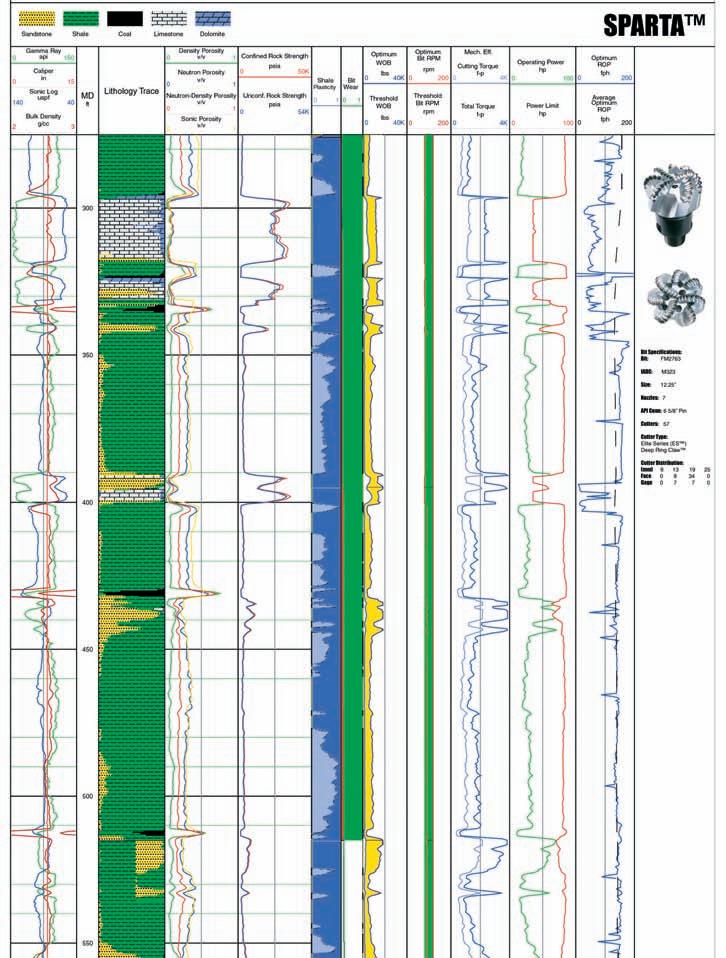
Unfortunately most drill bit issues arise before drilling the reservoir. Even extreme geographical closeness does not guarantee that the section to be drilled will duplicate that of a similar well. Therefore, a more accurate comparison and evaluation of the lithology needs to be determined. That is done by using Security DBS’ patented SPARTATM (Scientific Planning And Real Time Application) rock strength evaluation package.
The selection of drill bits and their subsequent performance evaluation should refer to the rocks drilled in the application. While determining the drillability of rocks is still a complex and not fully resolved question in the drilling business, Security DBS; however, has successfully used the SPARTA application as a practical solution to evaluating rock drillability since 1996.
Figure 1. The Security DBS DatCI™ service is a powerful platform for optimizing bit and drilling performance through in-depth planning, bit design, and post-well evaluation.
The SPARTA rock strength model allows the ADE to derive a lithology column from the log data. In the art of well log analysis, lithology determination does not follow a simple set of rules. The SPARTA lithology determination application function allows the user to make both horizontal and vertical trend analysis. The more logs available, the more accurate the interpretation. Input to the SPARTA rock mechanics application must include a minimum of a gamma ray and some type of porosity log. To be most effective, a mud log and bit record are also required.
DESIGN STAGE
In the design stage, by using state-of-the-art CAD tools such as IBitS™ software, the ADE can optimize the bit’s cutting structure in terms of drilling efficiency and durability.
The cutting structure and gauge geometry can be further optimized for a purposed directional application using CAD (computer aided design) package DxD™ software. Hydraulics and bit cleaning can be further improved with CFD (Computational Fluid Dynamics) analysis. A complete drill bit program is then defined for the customer. Once the new bit design is run, a full evaluation of the bit performance is made to help ensure the required performance has in fact been achieved.
APPLICATION EVALUATION
Typically, application evaluation begins with studying the well’s profile plan, which is designed with consideration of the geological section to drill, state of earth stresses and formation pore pressures.
The plan shows the formation names, expected depths, casing diameters, shoe depths, expected mud weight requirements, and directional requirements. The ADE will first work with the project geologist and drilling engineer to establish the objectives and issues in the section and work with the directional company’s well planner to discuss directional issues.
CUSTOMIZED SOLUTION
For the challenge at hand, the ADE now has powerful CAD design tools at his disposal. IBitS software models the bit geometry precisely through finite element analysis of the forces acting across the cutting structure, calculating the load on each cutter in the three dimensions: axial, radial, and lateral. Very small changes in cutter position or orientation (backrake / siderake / exposure) can significantly change the spread of the load across the cutting structure. Global force balancing of (Continued on page 20...)
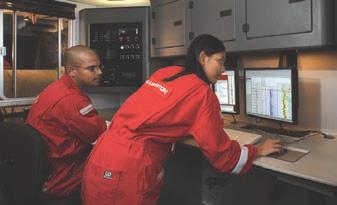
Figure 2. Security DBS’ Application Design and Evaluation (ADE).
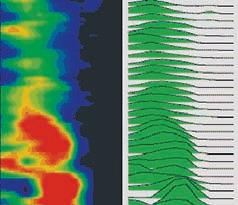
Figure 3. With this SPARTA™ evaluation data application, the first and the fifth tracks reveal raw log data. The third track represents the derived lithology, clearly showing bed thicknesses and mineral content. (Quartz content is the primary indicator of abrasiveness). The fourth track shows unconfined and confined compressive strengths.
axial and lateral forces result in a restoring force on the bit to retain axial rotary motion.
CASE HISTORY: WILD RIVER AREA Challenge:
With the final goal of targeting deeper Devonian reservoirs, initial Cretaceous exploration wells were drilled in the Wild River Field in the 1960s. While exploration began in the 1980s with a number of wells successfully drilled and completed in the tight-gas formations, large-scale development did not occur until the late 1990s.
As activity at Wild River began to accelerate, PDC bits were increasingly used to drill the multiple stacked Cretaceous sandstone reservoirs. Initially, however, PDC bits generated flat wear because it was difficult to apply sufficient weight on the bit to fracture the rock while drilling these formations.
In recent Wild River Field applications, sequences of sandstone / shale were typically drilled to 3,200-3,400m MD. Security DBS was challenged to provide a bit capable of maintaining fast penetration rates while
HUGH REID’S SPRING COURSES
PRACTICAL DST CHART INTERPRETATION
(Thorough Basic Course) Mar. 30-Apr. 3, 2009
16 WAYS TO IDENTIFY BYPASSED PAY FROM DST DATA
(More advanced, for those “comfortable” with DST charts) Apr. 15-16, 2009
HYDRODYNAMICS SEMINAR
(Oil & Gas Finding Aspects) Apr. 20-24, 2009
In-house courses available. For course outline visit: www.hughwreid.com 262-1261
drilling the maximum run length through these changing formations.
Solution:
After evaluating formation strengths (which range from 5-10 kpsi in the shale to upwards of 25 kpsi in the abrasive sand), Security DBS determined the application was PDCdrillable with Hypercut™ bit hard rock technology.
To customize Hypercut bit designs for specific hard and abrasive formations, field-deployed ADE specialists employed a unique design process using “first-hand” customer input and powerful optimization tools. Working directly with customer engineers and geologists, ADE personnel used SPARTA well planning software to analyze formation properties, precisely define the application and match design to application using powerful 3-D IBitS software to model cutting structures – and then evaluate the forces acting on them to optimize bit design.
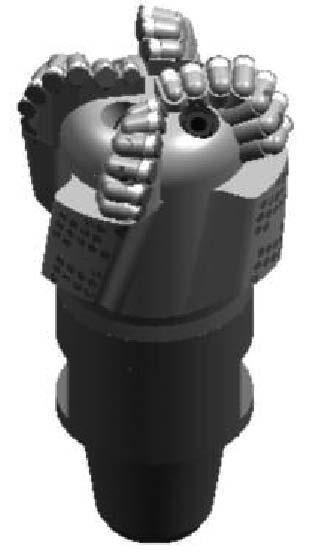
A four-bladed FMHX443ZR bit was then designed with an aggressive dual-row cutting structure featuring advanced Z3® PDC cutters and R1 backup cutters. Part of the FM3000™ bit series, this Hypercut bit design incorporates this dual row cutter technology with force management and drilling dynamics optimization to deliver high ROP without compromising bit life. The primary Z3 cutters are 20 times more abrasion resistant than industry standard cutters, while non-planar R1™ PDC backup
cutters prevent primary cutter overengagement
Value Created:
In this highly abrasive application, a single Hypercut FMHX443ZR bit from Security DBS drilled at 26.26m/hr, more than double the previous best ROP runs by competitors. In addition to establishing a new benchmark ROP performance for the 156mm hole section, this outstanding run dropped cost per meter to a new low of $222/m, resulting in a savings to the customer of approximately $81,000 (CAD).
In the deep gas drilling application of Wild River, dual-row PDC cutting structures are quickly becoming the bit design of choice. Optimized dual-row designs of Hypercut hard rock bits have proved an effective way to extend bit runs at fast drilling rates.
WHEN IT COMES TO SELECTING THE RIGHT BIT, SCIENCE TRUMPS HISTORICAL SELECTION AND BUYING PATTERNS
In today’s energy environment, obtaining – and optimizing – the right technology, services, and expert advice has never been more critical to a company’s bottom line. Drilling bits are no exception. Until Security DBS’ introduction of truly customized bit solutions (the DatC service process), bit buying was directed by a general, historical, or cost-driven idea of what was needed. Not the best way, in most cases, to get optimal bit performance, speed, and a significant decrease in NPT. Indeed, when it comes to selecting the right bit, science always trumps historical and buying patterns.
BIOGRAPHY
Steve Hawkins is a 1999 graduate of Memorial University in Newfoundland and has spent his career with Halliburton. Past positions include Logging Geologist with Sperry Sun and MWD/ LWD engineer with Sperry Drilling Services. In his five years with Halliburton’s Security DBS group, Steve has served as a Senior Technical Professional, ADE (Steve still devotes a portion of his time to designing bits). He is now Security’s Drill Bit Technology Manager – Canada.
This article was contributed by Halliburton. CSPG thanks Halliburton for the contribution.
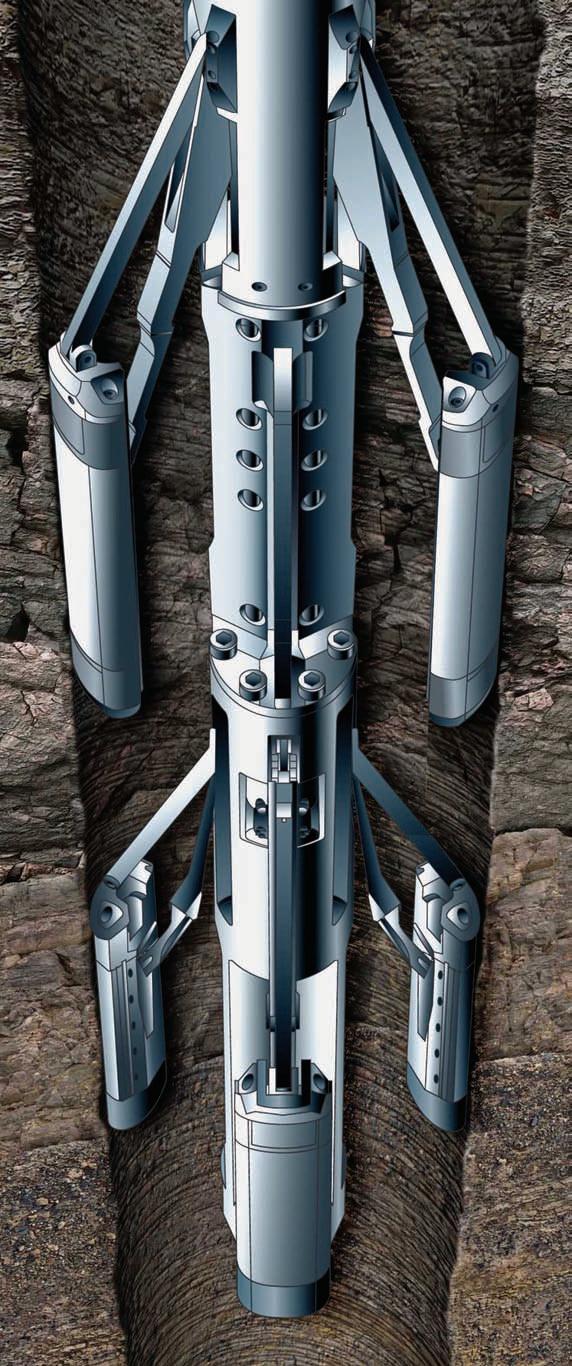
Figure 4. Security DBS Four Bladed FMHX443ZR PDC Bit.
Tap into the AAPG’s reservoir of knowledge.
For more on field seminars and short courses, call 918-560-2650 or visit www.aapg.org/education.
SHORT COURSES
Essentials of Subsurface Mapping
April 30 - May 1, 2009 / Houston, TX
Instructor: Richard Banks, Scientific Computing Applications, Inc., Tulsa, OK http://www.aapg.org/education/shortcourse/details.cfm?ID=29
Reservoir Engineering for Petroleum Geologists
May 19-20, 2009 / Austin, TX
Instructor: Richard G. Green, Saxon Oil, Dallas, TX http://www.aapg.org/education/shortcourse/details.cfm?ID=71
Deep-Water Salt Tectonics
May 20-21, 2009 / Austin, TX
Instructor: Martin P. A. Jackson, The University of Texas at Austin http://www.aapg.org/education/shortcourse/details.cfm?ID=8
FIELD SEMINARS
Deep-Water Siliciclastic Reservoirs, California
April 27-May 2, 2009 / Begins in Palo Alto and ends at the airport in San Francisco, CA
Leaders: Stephan Graham and Donald R. Lowe, Stanford University, Stanford, CA http://www.aapg.org/education/fieldseminars/details.cfm?ID=17
Controls On Porosity Types and Distribution in Carbonate Reservoirs
May 17-22, 2009 / Almeria Region, SE Spain, begins and ends in Las Negras, Spain. Fly from London/Barcelona/Madrid. Leaders: Evan K. Franseen, University of Kansas, Lawrence, KS; Robert H. Goldstein, University of Kansas, Lawrence, KS; Mateu Esteban, Consultant, REPSOL-YPF, Mallorca, Spain http://www.aapg.org/education/fieldseminars/details.cfm?ID=2
Complex Carbonate Reservoirs: The Role of Fracturing, Facies and Tectonics
May 24-30, 2009 / Begins in Naples and ends at Rome International Airport, Italy
Leaders: Raffaele Di Cuia, G.E. Plan Consulting, Ferrara, Italy; Davide Casabianca, Marathon Oil International, Aberdeen, UK; Claudio Turrini, Consultant, Paris, France
Instructors: Twelve expert instructors in eleven technical and practical application courses.
PRACTICAL SE qUENCE STRATIGRAPHY IX. The Units of Sequence Stratigraphy: Part 1 Material-Based Sequences
| by Ashton Embry
I NTRODUCTION
Over the past 50 years, three different, general types of sequence stratigraphic units have been introduced: sequence (Sloss et al., 1949), systems tract (Brown and Fisher, 1977), and parasequence (Van Wagoner et al., 1988). Specific types of sequences and systems tracts have also been defined. Each specific type of sequence stratigraphic unit is primarily defined by the sequence stratigraphic surfaces which bound it. In this article and the next, I will describe the evolution of sequence boundary definition, discuss the two specific sequence types which have become popular, and illustrate the various types of material-based, sequence boundaries which have been introduced into the literature over the past 20 years. The next article will look at time-based sequence boundaries and summarize all the different types of sequence boundaries which have been proposed. The following two articles will look at systems tracts and parasequences, respectively.
E VOLVING DEFINITION OF A SEqUENCE BOUNDARY
In the beginning – As was described in my earlier articles that dealt with the historical development of sequence stratigraphy (Embry, 2008a, b), a sequence was first defined as a stratigraphic unit bound by large-scale, regional unconformities (Sloss et al., 1949). Wheeler (1958) retained this overall definition but included units bound by smaller-scale unconformities. Although a particular type of bounding unconformity was not specified by either Sloss et al. (1949) or Wheeler (1958), applications of this concept in the 1950s and 60s used either subaerial unconformities or unconformable shoreline ravinements as the bounding unconformities of a sequence (e.g., Wheeler, 1958; Sloss, 1963). Because these types of unconformities are, for the most part, confined to the flanks of a basin, and a sequence boundary was restricted to the unconformity, most sequence boundaries and their enclosed sequences could not be correlated over much of the central portions of a basin (see Figure 1 in Embry, 2008a). This greatly limited the practical application of sequences for subdividing the stratigraphic succession of a basin and such a stratigraphic methodology was not widely applied until 1977.
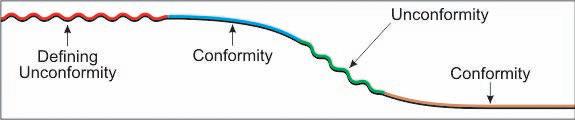
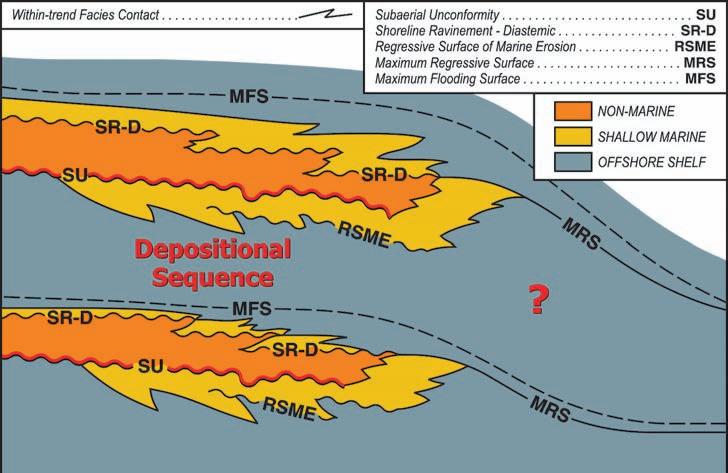
Figure 1. A diagrammatic representation of a sequence as a generic unit. A sequence is defined as a specific type of unconformity (red unconformity) and its correlative surfaces (blue conformity, green unconformity, and brown conformity). The correlative surfaces must adjoin to the end of the defining unconformity and join together so as to form one continuous sequence boundary.
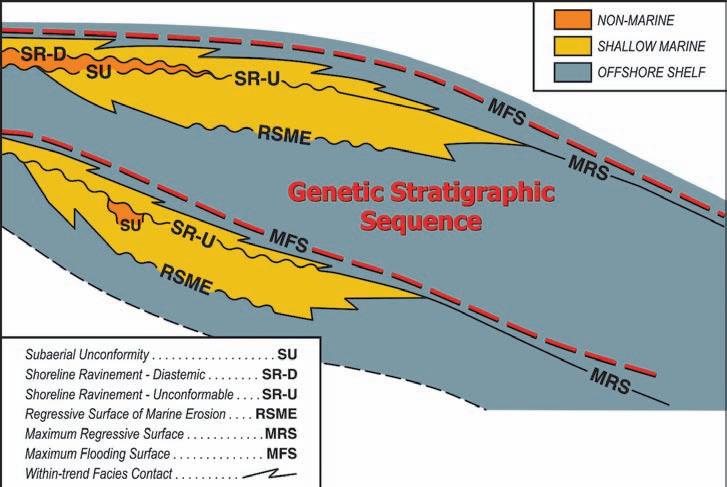
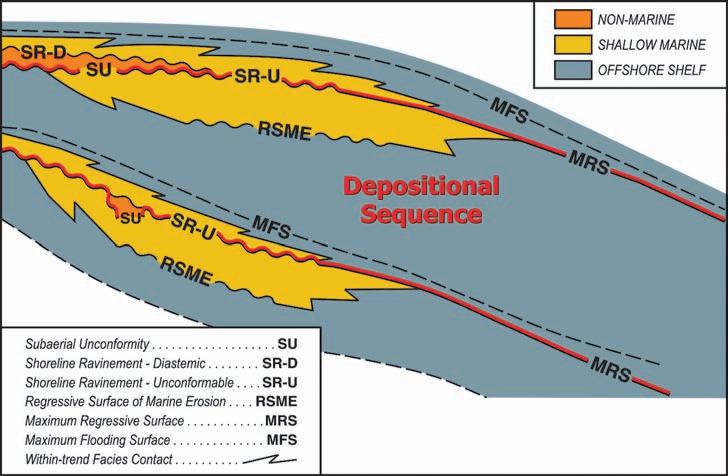
2. The boundaries (MFS) of a genetic stratigraphic sequence are shown in red on this sequence model characterized by a ramp setting with a fast initial base level rise rate. The boundaries of such a sequence are the same for all sequence models.
New definitions – The 1977 watershed publication, Seismic Stratigraphy - AAPG Memoir 26 (Payton, 1977), contained a series of articles on sequence stratigraphy by Exxon scientists. A key observation was that a seismic reflector that encompassed a basin flank unconformity similar to that used by Wheeler (1958) for bounding a sequence (i.e., characterized by truncation) could be followed basinward where it encompassed submarine unconformities and conformities (Vail et al., 1977). On this basis, the Exxon researchers modified the definition of a sequence from a unit bounded by unconformities to one “bounded by unconformities or their correlative conformities” (Mitchum et al., 1977) and they called such a unit a depositional sequence. This, in effect, defined a sequence boundary as a combination of surfaces rather than
one specific type of surface as Sloss et al. (1949) and Wheeler (1958) had done. Most importantly, such a modification allowed sequence boundaries to potentially be correlated across an entire basin and this greatly expanded the application of sequence boundaries for correlation and subdividing the stratigraphic succession of a basin.
In 1988, Exxon scientists modified the definition of a depositional sequence boundary to a subaerial unconformity and correlative conformities (Van Wagoner et al., 1988, p. 41), thus making it a much more specific unit. At the same time, Galloway (1989) defined a very different type of sequence boundary which he termed a genetic stratigraphic sequence boundary, and it consisted solely of a maximum flooding
Figure
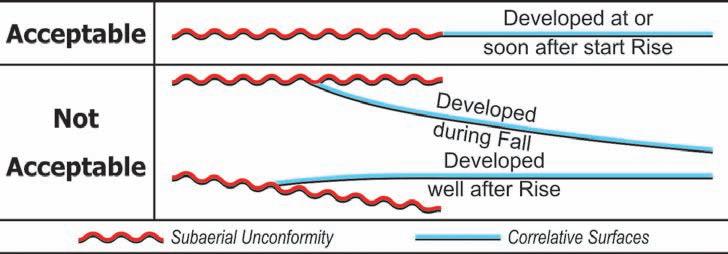
Figure 3. A depositional sequence boundary includes all of a given subaerial unconformity by definition. One of the correlative surfaces must join with the basinward termination of the subaerial unconformity to ensure a continuous, through-going, sequence boundary. Because the SU reaches its basinward extent at the end of base level rise, the correlative surfaces must be developed at or soon after the start of base level rise to ensure one joins with the end of the SU. Surfaces developed well before or after the start of rise do not join with the end of the SU and a continuous boundary is not possible.
in a sequence being a general unit and specific types of sequences can be defined and named on the basis of different types of unconformities.
Correlative surfaces are an important part of the generic definition and are essential for allowing a sequence boundary to be extended over all or most of a basin. Correlative surfaces are sequence stratigraphic surfaces which join with the end(s) of the defining unconformity and with each other so as to form one continuous sequence boundary (Figure 1). Correlative surfaces can be unconformities, diastems. or conformities and, for maximum utility for subsequent facies analysis in a sequence stratigraphic framework, they preferably have low diachroneity or are time barriers. As will be demonstrated, the current controversies concerning sequence boundaries centre on correlative surfaces.
As noted earlier, two different, specific sequence types have been defined in the literature and are in use today. These are the genetic stratigraphic sequence of Galloway (1989) and the depositional sequence of Mitchum et al. (1977) / Van Wagoner et al. (1988) and they are described below. Other specific sequence types may be defined in the future.
GENETIC STRATIGRAPHIC SEqUENCE
A genetic stratigraphic sequence was defined by Galloway (1989) and the unconformable portion of the maximum flooding surface (MFS) is the specific type of unconformity which defines this sequence type. The correlative surfaces which compose the remainder of this type of sequence boundary are the diastemic and conformable portions of the MFS. Given that the MFS is a readily recognizable, material-based surface, such a sequence type can be delineated in most cases with objective analysis.
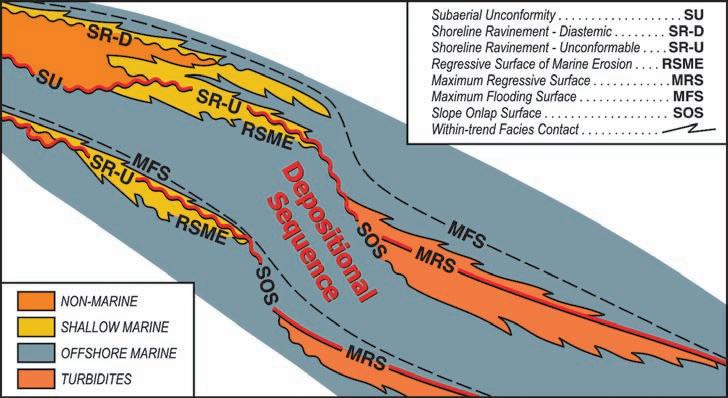
Figure 4B. A sequence model for a shelf / slope / basin / setting with a slow initial base level rise based on exposures of Eocene strata on Svalbard (Johannessen and Steel, 2005). The Van Wagoner et al. (1988) depositional sequence boundary is outlined in red.
(...Continued from page 23) surface (MFS). Because a portion of an MFS is often unconformable, such a proposed sequence boundary fit the Mitchum et al. (1977) general definition of a sequence boundary but was clearly much different from the depositional sequence boundary of Van Wagoner et al. (1988).
Generic definition – In light of the fact that two specific types of sequences have been defined in the literature, a suitable, generic definition of a sequence is required. To fulfill this need, Embry et al. (2007) defined a sequence as “a stratigraphic unit bound by a specific type of unconformity and its correlative surfaces”. This definition results
Consequently, a genetic stratigraphic sequence is classified as a material-based sequence type and it is a very straight forward and uncomplicated type of sequence. Its boundaries are illustrated on a ramp, fast-initial-rise sequence model in Figure 2. Notably, such boundaries can be delineated, without modification, on any type of sequence model with either a ramp or shelf / slope / basin physiography and with either a slow initial base level rise or a fast initial rise. As will be seen, this “one boundary fits all models” situation is not the case with a depositional sequence, and such simplicity is one of the attractive features of a genetic stratigraphic sequence.
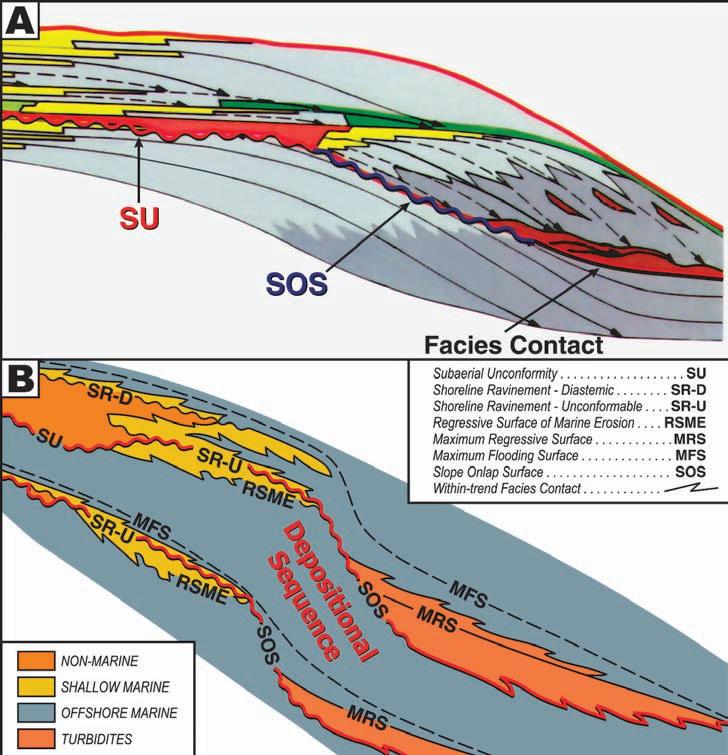
Figure 4A. The Van Wagoner et al. (1988) depositional sequence boundary for a shelf / slope setting consists of a subaerial unconformity (SU) on the shelf, a slope onlap surface (SOS) on the slope and the facies change at the base of the submarine fan deposits in the basin (modified from a portion of Figure 2 of Van Wagoner et al., 1988).
The one serious drawback of a genetic stratigraphic sequence is that it commonly encloses a subaerial unconformity or an unconformable shoreline ravinement on the flanks of a basin (Figure 2). Given that a major time gap can be associated with such surfaces, not to mention a notable structural discordance, such a sequence is really two, very different genetic units on the basin flanks. However, the MFS is usually the most readily recognizable and objective sequence surface on both logs and seismic sections in the offshore and deep marine areas where subaerial unconformities are absent. In these areas, a genetic stratigraphic sequence clearly has great value for mapping and communication.
DEPOSITIONAL SEqUENCE
Introduction – A depositional sequence was introduced by Mitchum et al. (1977) and the definition was refined by Van Wagoner et al. (1988). The specific type of unconformity that defines this sequence type is a subaerial unconformity. There is no doubt of the need and utility of designating a subaerial unconformity as the defining unconformity for a depositional sequence boundary because of the time gap and significant depositional and tectonic changes which are often associated with such a surface. It was these properties of a subaerial unconformity that led Sloss et al. (1949) to put such a surface on the boundaries of a stratigraphic unit rather than within it, thus giving birth to the concept of a sequence as a stratigraphic unit.
Multiple depositional sequence
boundaries – Unlike the genetic stratigraphic sequence boundary which encompasses only a single surface type (MFS), eight different combinations of a subaerial unconformity with correlative surfaces have been put forward in the literature to constitute a depositional sequence boundary. Thus, it is not hard to understand why there is considerable confusion and controversy when it comes to how one delineates and correlates a depositional sequence boundary.
This wide variety of depositional sequence boundaries results from two main sources. One is the existence of both a materialbased approach and a time-based one to sequence stratigraphic classification as has been described in previous articles. Materialbased, depositional sequence boundaries use only material-based, sequence stratigraphic surfaces as correlative surfaces whereas time-based, depositional sequence boundaries also use the two time-based surfaces in this capacity. Another source of such diversity is the existence of different
sequence models which include specific combinations of either a ramp or shelf / slope / basin physiography with either a slow initial base level rise rate or a fast initial base level rise rate. Some of these models were described in previous articles and are used herein to illustrate the different ways in which a depositional sequence boundary has been delineated. Siliciclastic sediments are used in the models but the same stratigraphic surfaces with the same relationships to each other would occur on the models if carbonate sediments were used instead.
Valid correlative surfaces – As a preface to the description and evaluation of each proposed depositional sequence boundary, it is imperative to briefly review the criteria for what constitutes a valid correlative surface for a subaerial unconformity. First of all, any designated correlative surface must be a sequence stratigraphic surface and represent either a break in deposition or a change in depositional trend. Just like magnetostratigraphic surfaces would not be suitable for bounding a biostratigraphic unit, only sequence stratigraphic surfaces can be used as part of the boundary of a sequence stratigraphic unit.
Secondly, because the entire, preserved subaerial unconformity must be part of a given depositional sequence boundary, one of the correlative surfaces has to join with the basinward termination of the defining subaerial unconformity. All of the correlative surfaces then have to join with each other so as to form one continuous boundary (see Figure 1). Furthermore, given that the subaerial unconformity reaches its maximum basinward extent at the end of base level fall (Jervey, 1988), correlative surfaces must develop at or soon after the start of base level rise so as to fulfill this second criteria (Figure 3). As illustrated in Figure 3, surfaces which develop well before or well after the start of base level rise will not join with the basinward termination of the subaerial unconformity and thus would not form a continuous boundary which includes all of the subaerial unconformity.
With these fundamental concepts and constraints in mind, the various proposals for a depositional sequence boundary can be evaluated as to their validity and utility. Material-based, depositional sequence boundaries will be examined first, followed by proposed, time-based boundaries.
(Continued on page 26...)
Figure 5A. The Van Wagoner et al. (1988) depositional sequence boundary for a ramp setting with a slow initial base level rise rate consists of a subaerial unconformity (SU), a facies change at the base of shallow water sandstones (yellow) and an unknown surface within the shelf mudstones (grey). This unknown surface may represent the time surface at the start of base level rise (correlative conformity, CC) (modified from a portion of Figure 3 of van Wagoner et al., 1988).
Figure 5B. Proposed placement of a depositional sequence boundary for a carbonate ramp setting (modified from Burchette and Wright, 1992, Figure 13). The authors followed Van Wagoner et al. (1988) and extended the depositional sequence boundary along the facies change at the base of the shallow water carbonates. Such a boundary is invalid because the facies change is a lithostratigraphic surface, not a sequence stratigraphic one.
M ATERIAL -BASED, DEPOSITIONAL SEqUENCE BOUNDARIES
Early depositional sequence boundaries – The first, material-based, depositional sequence boundaries were proposed and illustrated by Van Wagoner et al. (1988). They illustrated the boundary on two different sequence models – a shelf / slope / basin with a slow initial rise rate (Figure 4A) and a ramp with a slow initial rise rate (Figure 5A).
On their shelf / slope / basin model, the subaerial unconformity occurs on the shelf where it is overlain by nonmarine strata. The basinward termination of the SU joins with a slope onlap surface, which in turn eventually joins with the facies contact at the base of the submarine fan (Figure 4A). A slightly different rendition of this model, based on exquisite cliff exposures in Svalbard (Johannessen and Steel, 2005) (Figure 4B), better illustrates the Van Wagoner et al. (1988) depositional sequence boundary (SU / SOS / facies change).
The one major flaw which invalidates such a combination of surfaces for a depositional sequence boundary is the inclusion of the facies boundary at the base of the submarine fan strata. This is a lithostratigraphic surface rather than a sequence stratigraphic one and is not a valid correlative surface. As will be subsequently shown, a minor alteration to sequence boundary placement on such a model allows a valid depositional sequence boundary to be drawn.
The Van Wagoner et al. (1988) depositional sequence boundary for a ramp setting with a slow initial rise is more problematic. As shown on Figure 5A, the correlative surfaces employed for such a boundary include the facies change at the base of the shallow water sandstone and a non-descript surface within the shelf mudstone facies. This non-descript surface may or may not represent an attempt to place the boundary on a time surface equal to the start of base level rise (CC). Unfortunately this portion of the boundary is not discussed in their text. This combination of surfaces has no validity for a depositional sequence boundary because it includes a lithostratigraphic surface (facies change) and a completely unknown and uncharacterized surface inside the mudstone facies.
Subsequent studies of the sequence stratigraphy of ramp successions often attempted to apply the Van Wagoner et al. (1988) boundary. In such analyses, the base of a shallow water unit is used as a correlative surface of the SU despite their being no justification for it joining with the termination of the subaerial unconformity and the fact that it is not a surface of sequence
stratigraphy. Figure 5B illustrates an example of such an invalid depositional sequence boundary which was proposed in a major review of carbonate ramps by Burchette and Wright (1992). Notably, the literature is replete with examples of such inappropriate boundary placement for both carbonates and siliciclastics.
Ramp setting – Stratigraphic relationships in a ramp setting tend to be simpler than those in a shelf / slope / basin setting and this generalization applies to sequence
stratigraphy. Figure 6 illustrates a sequence model characterized by a ramp physiography and a fast initial base level rise. As shown, a valid depositional sequence boundary can be readily identified on such a model. The subaerial unconformity is truncated basinward by a shoreline ravinement (SR-U) which in turn joins to a maximum regressive surface (MRS) farther basinward. Thus the SR-U and MRS are correlative surfaces of the SU in this model and all three together form a continuous, depositional sequence boundary from basin edge to basin centre.
Figure 6. The boundaries of a material-based, depositional sequence are shown in red on this sequence model characterized by a ramp setting with a fast initial base level rise rate. Due to the fast initial rise, the shoreline ravinement (SR-U) truncates the basinward portion of the subaerial unconformity (SU) and becomes a correlative surface. The basinward termination of the shoreline ravinement joins the landward termination of the maximum regressive surface (MRS). Thus a continuous, depositional sequence boundary consists of a SU, a SR-U, and a MRS.
Figure 7. The boundaries of a material-based, depositional sequence are shown in red on this sequence model characterized by a ramp setting with a slow initial base level rise rate. The boundaries consist only of the subaerial unconformities that are restricted to the basin flanks. There are no material-based, correlative surfaces, which would allow the sequence boundaries to be extended into the basin.
Figure 8. The boundaries of a material-based, depositional sequence are shown in red on this sequence model characterized by a shelf / slope / basin setting in which slope onlap surfaces (SOS) form. The correlative surfaces of the subaerial unconformity are an unconformable shoreline ravinement, a slope onlap surface, and a maximum regressive surface. This combination of surfaces forms a viable depositional sequence boundary that has great utility.
Such stratigraphic relationships are created by a fast initial base level rise rate such that transgression occurs soon after the start of base level rise and the shoreline ravinement (SR) cuts out the basinward portion of the subaerial unconformity (SU). Notably, a large amount of empirical data for both siliciclastic and carbonate successions confirm the common existence of these stratigraphic relationships (references in Embry, in press) and substantiates the validity and utility of such a depositional sequence boundary (SU / SR-U / MRS).
Figure 7 illustrates the sequence stratigraphic relationships for a sequence model which combines a ramp with a slow initial base level rise rate. In this case, transgression occurs significantly later than the start of base level rise and the shoreline ravinement does not truncate the basinward portion of the subaerial unconformity. The net result is that the SR and MRS are not correlative surfaces (i.e., do not join with) of the SU and, as illustrated on Figure 7, there are no correlative, material-based surfaces for an SU in such a model. The depositional sequence boundary is limited to the SU and cannot be extended farther basinward than the termination of the SU. Such a depositional sequence boundary is valid but of limited utility. Of interest, no convincing examples of such stratigraphic relationships have ever been well documented in the literature but there is no doubt that they are theoretically possible and likely await discovery.
Shelf / slope / basin setting – The sequence stratigraphic relationships for a sequence model with a shelf / slope / basin physiography are illustrated in Figure 8. The lower sequence boundary was generated
under conditions of fast initial rise whereas the upper boundary represents slow initial base level rise. For both boundaries, base level fell to the shelf edge such that a slope onlap surface (SOS) was generated. Notably, the key stratigraphic relationships are the same for both boundaries despite the difference in initial rise rate.
As illustrated on Figure 8, the defining subaerial unconformity (SU) is truncated basinward by the shoreline ravinement (SR-U). The SR-U then joins the SOS at the shelf edge and a maximum regressive surface, which occurs within the submarine fan deposits, onlaps the SOS. Thus the SR-U, SOS, and MRS are all correlative surfaces of the SU and, in combination, allow a depositional sequence boundary to be delineated from basin margin to the deep basin. Such a depositional sequence boundary (SU / SR-U / SOS / MRS) represents a modification of that proposed by Van Wagoner et al. (1988) which is illustrated in Figure 4A. The one change is that, within the basin, the MRS near the top of the submarine fan deposits, rather than the highly diachronous, facies change at the base of the submarine fan strata, is used as the correlative surface.
In shelf / slope / basin settings in which an SOS is not developed, a depositional sequence boundary is readily drawn along the SU / SR-U on the basin flank and along the correlative MRS which is developed on the outer shelf, slope and basin.
A sequence is best defined as a generic unit that is bound by a specific type of unconformity and its correlative surfaces. Two specific types of sequences have
been recognized and defined so far – a genetic stratigraphic sequence (part MFS, defining unconformity) and a depositional sequence (SU, defining unconformity). The genetic stratigraphic sequence has the same boundaries for all sequence models and the bounding surfaces are always material-based. Numerous combinations of material-based and time-based surfaces have been proposed for a depositional sequence boundary.
For a material-based, depositional sequence boundary in a ramp setting, the only combination of surfaces which is valid and has widespread utility consists of a subaerial unconformity, an unconformable shoreline ravinement, and a maximum regressive surface. A similar combination of surfaces, with or without the addition of a slope onlap surface, is valid and has great utility for a depositional sequence boundary for a shelf / slope / basin setting.
The next article will examine the time-based boundaries which have been proposed for a depositional sequence in both ramp and shelf / slope / basin settings.
R EFERENCES
Brown, L. and Fisher, W. 1977. Seismic-stratigraphic interpretation of depositional systems: Examples from the Brazilian rift and pull-apart basins. In: Seismic stratigraphy: application to hydrocarbon exploration. C. Payton, (ed.). American Association of Petroleum Geologists Memoir 26, p.213-248.
Burchette, T. and Wright, V.P. 1992. Carbonate ramp depositional deposits. Sedimentary Geology, v. 79, p. 3-57.
Embry, A. F. 2008a. Practical Sequence Stratigraphy II: Historical Development of the Discipline: The First 200 Years (1788-1988). Canadian Society of Petroleum Geologists, The Reservoir, v. 35, issue 6, p. 35-40.
Embry, A. F., 2008b. Practical Sequence Stratigraphy III: Historical Development of the Discipline: The Last 20 Years (1988-2008). Canadian Society of Petroleum Geologists, The Reservoir, v. 35, issue 7, p. 24-29.
Embry, A. F. 2009. Practical Sequence Stratigraphy VIII: The Time-based Surfaces of Sequence Stratigraphy. Canadian Society of Petroleum Geologists, The Reservoir, v. 36, issue 1, p. 27-33.
Embry, A. F. In press. Correlating Siliciclastic Successions with Sequence Stratigraphy. In: Application of Modern Stratigraphic Techniques: Theory and Case Histories. K. Ratcliffe and B. Zaitlin (eds.). Society of Economic Paleontologists and Mineralogists, Special Publication.
(Continued on page 29...)
ROCK SHOP
Embry, A., Johannessen, E., Owen, D, and Beauchamp, B. 2007. Recommendations for sequence stratigraphic surfaces and units (abstract). Arctic Conference Days, Abstract Book. Tromso, Norway.
Galloway, W. 1989. Genetic stratigraphic sequences in basin analysis I: architecture and genesis of flooding surface bounded depositional units. American Association of Petroleum Geologists Bulletin, v. 73, p. 125-142.
Jervey, M. 1988. Quantitative geological modeling of siliciclastic rock sequences and their seismic expression. In: Sea level changes: an integrated approach. C. Wilgus, B.S. Hastings, C.G. Kendall, H.W. Posamentier, C.A. Ross, and J.C. Van Wagoner, (eds.). Society of Economic Paleontologists and Mineralogists, Special Publication 42, p. 47-69.
Johannessen, E. J. and Steel, R. J. 2005. Shelf-margin clinoforms and prediction of deep water sands. Basin Research, v. 17, p. 521-550.
Mitchum, R, Vail, P., and Thompson, S. 1977. Seismic stratigraphy and global changes in sea level, part 2: the depositional sequence as the basic unit for stratigraphic analysis, In: Seismic stratigraphy: application to hydrocarbon exploration. Payton, C. (ed.). American Association of Petroleum Geologists Memoir 26, p. 53-62.
Payton, C. (ed.). 1977. Seismic stratigraphy: applications to hydrocarbon exploration: American Association of Petroleum Geologists Memoir 26, 516 p.
Sloss, L. 1963. Sequences in the cratonic interior of North America. Geological Society of America Bulletin, v. 74, p. 93-113.
Sloss, L., Krumbein, W., and Dapples, E. 1949. Integrated facies analysis. In: Sedimentary facies in geologic history. Longwell, C. (ed.). Geological Society America, Memoir 39, p. 91-124.
Vail, P. et al. 1977. Seismic stratigraphy and global changes in sea level. In: Seismic stratigraphy: applications to hydrocarbon exploration. Payton, C. (ed.). American Association of Petroleum Geologists Memoir 26, p. 49-212.
Van Wagoner, J. C., Posamentier, H. W., Mitchum, R. M., Vail, P. R., Sarg, J. F., Loutit, T. S., and Hardenbol, J. 1988. An overview of the fundamentals of sequence stratigraphy and key definitions. In: Sea level changes: an integrated approach. C. Wilgus, B.S. Hastings, C.G. Kendall, H.W. Posamentier, C.A. Ross, and J.C. Van Wagoner, (eds.). Society of Economic Paleontologists and Mineralogists, Special Publication 42, p. 39-46.
Wheeler, H.E. 1964. Base level, lithosphere surface and time stratigraphy. Geological Society of America Bulletin. v. 75, p. 599-610.
Broad integration. Deep science. Open architecture.
Petrel* 2009 gives my company an advantage no other application can offer— efficient modeling of multimillion cell models using advanced geological population methods like multipoint statistics, and parallel processing to honor the finest reservoir details—that really makes the difference in understanding the geometries of complex facies.
Petrel 2009. Empowering you to do more.
EXHIBITING ON THE FRONTIER
| by Flo Reynolds, Convention Exhibit Chair
I have been in the volunteer position of Exhibit Chair since the 2007 Joint Convention Let it Flow. With the assistance of the office staff and a small but energetic committee, we have organized successful exhibitions and brought in new opportunities and ideas to the exhibitions.
The Exhibit Floor of each Annual Convention provides a market place for exhibitors to show their latest and greatest. This benefits the delegates since they have the opportunity to view competitor’s wares in the same venue. Over the course of two days, vendors are able to connect with delegates from various companies to reveal innovations, provide corporate announcements, have company key people available to network with contacts, and have some social time with staff and clients. This is of great benefit for company leaders that do not have daily connection with clients and for our many exhibitors that are from out of town, province, and country. A portion of exhibitors will be part of the Government Pavilion. This will provide government agencies from across Canada with the unique opportunity to share with delegates the latest activities in their area.
There are a variety of programs that run along with the exhibition. The Kids In Science Program (KISP) provides guided tours to junior and high school students to various companies’ exhibits where students gain an appreciation of the earth sciences, and in turn they consider the earth sciences as a career option. The Light Up the World charity has numerous tables of donated silence auction items, and the funds from this auction supports KISP.
At the 2008 Back to Exploration Convention the Geophysics Challenge Bowl was held in the Boyce Theatre along with a student mixer. The students also had an area on the Exhibit Floor which brought additional networking opportunities for our young delegates. This year, the 2009 Frontiers and Innovation Convention will see the return of the Exhibit Floor Passport where delegates will visit numerous booths, seek out information from the vendor and enter into a draw for qualified passports.
One of our successes on the Exhibit Floor was moving the poster papers to the centre of the exhibition. In many conventions the poster papers are in a corner or in another section of the convention hall. The Technical Oral Sessions take a break each morning and finish in time for delegates to attend poster presentations. This provides a focus on these papers and brings delegates onto the Exhibit Floor. The areas directly adjacent to the poster papers are deemed to be prime locations for exhibitors.
The afternoon poster sessions are followed by social events. What would a convention be without opportunities to socialize and network on the Exhibit Floor? First we ensure everyone is fed. We start each day with Breakfast with the Exhibitors where continental breakfast and coffee are available at various locations on the floor. Last year we introduced complimentary bagged lunches, which were received with an astounding acceptance; we are planning to provide additional lunches this year. Each evening there are food and refreshments with light entertainment. This gives delegates and exhibitors an opportunity to have a more
relaxed atmosphere to their presentations. In addition to the main hall of the Exhibit Floor, last year we expanded into the Corral to give the opportunity for field equipment to be displayed. Field equipment had been part of the convention in the past but as outdoor exhibits; however inclement weather and lack of traffic did not really benefit either the exhibitors or the convention. Expanding to the Corral was run as a pilot project last year with positive feedback from the exhibitors. Added refreshment venues were stationed in the Corral to assist in the traffic flow and to compliment the relaxed atmosphere of these exhibits. We hope to add to the exhibits in the Corral to ensure this side of our business is represented better in 2009.
New this year is the Exhibit Floor online. With the purchase of new software, exhibitors were able to select desired booth locations. With this same program, delegates to the 2009 Convention will now be able to see an interactive floor plan prior to visiting the Exhibit Floor, complete with company description, product information, and a searchable index.
We work with the various committees to ensure the Exhibit Floor is a wealth of information, a great place to do business, a place to see old friends and colleagues and of course to have some fun. We do put a lot of effort into creating the policies for exhibiting and remind exhibitors these policies are in place to ensure all exhibitors have a great convention. If you are interested in becoming an exhibitor in the 2009 Convention, please contact the Convention Manager, Shauna Carson, at 403.264.5610.
The 2008 Convention Exhibit Floor.
One of the owls displayed at Boyd PetroSearch’s booth in the 2008 Convention.
CLIMATE CHANGE II: The World’s Historic Climate
| by Dr. A. Neil Hutton
1. This figure was published without attribution by the IPCC in their 1990 report as figure 7c, but it is clear that it was based on the work of Lamb 1965 (see McIntyre, 2008 Climate Audit May 9th 2008).
Hubert H. Lamb was regarded as one of the greatest climatologists of his time with a list of over 150 publications between 1939 and 1995. He was instrumental in establishing the Climatic Research Unit at the University of East Anglia. Perhaps more than any other scientist, he convinced the world of the inconstancy of present climate. Furthermore, he utilized a broad range of observations from economic, botanical, archaeological, agricultural, and historical data in order to establish climatic history. In 1990 the Intergovernmental Panel on Climate Change (IPCC) published their then understanding of global climatic variability in the last 1,000 years which is illustrated in Figure 1.
This figure was based on Lamb’s pioneering work and quite clearly shows medieval temperatures higher than our present maxima during 1998, thus denying the claim that the warming of the 20th Century was greater than at any time in the last millennium. So what scientific evidence did Lamb have to actually provide an estimate of temperature? Lamb has documented that there was a commercial wine-making industry in the South of England between 1100 to about 1300 that was competitive with producers in France. This represents a northward latitude shift of 500 km from the current grape-growing areas of France and Germany, indicating average temperatures 1.0 ºC warmer than in the past decades. In Germany, during this warm period, vineyards were found at higher elevations, about 780 meters above sea level. Today the maximum elevation is about 560 m. Assuming a temperature gradient of 0.6-0.7 ºC per 100 meters, then the average mean temperature then was 1.0-1.4 ºC warmer than our 20th and 21st Century maxima. This is quantifiable information since we know the climatic requirements for viniculture.
Lamb also observed and documented a descent of the tree line in the Alps by 70300m. The evidence being the presence of older peat deposits and forest remains at higher elevations. A drop of the tree line of 100-200m occurred in Northern Germany while Iceland experienced a 300m drop to present levels and once-productive farms were covered by advancing glaciers. So severe was the climatic change experienced by Icelanders that Denmark considered evacuating all the islanders and settling them in Europe.
Lamb used a variety of indicators to develop a temperature profile, such as economic values of produce, winter severity recorded in historical records, agricultural productivity, changes in crop type, distribution, and other factors as discussed. Lamb produced a brilliantly detailed account of European and north Atlantic climate which demonstrated distinct climatic variability with the Medieval Warm Period warmer than our 20th Century Warm Period and separated from it by the Little Ice Age. During the Little Ice Age, the River Thames froze 40 times, with the greatest frequency occurring during the seventeenth and eighteenth centuries
as shown in Figure 2. This was no skim of ice on the surface of the river but was sufficient to support the hauliers and their teams of horses and wagons who preferred to cross directly rather than use the bridges. A team of horses with loaded wagon is in excess of five tons. Accounts indicate that it was so cold that fish became trapped in pools and were frozen into the ice. The citizens of London abandoned the city for the pubs and entertainment on the ice in the legendary Frost Fairs which are delightfully described in Helen Humphrey’s book “The Frozen Thames”. During this period sea ice was reported impeding coastal traffic and, in 1684-1685, the English Channel was icecovered from Dover to Calais. At the same period, Iceland was totally surrounded by sea ice as far as the eye could see from the highest mountains. Similarly, the freezing of the Baltic was such that people traveled by sleigh from Sweden to Poland. These events which are extensively reported in historical documents have been criticized as being anecdotal and not providing an accurate measure of temperature variation and without global significance. However they appear to provide a better evaluation of historic climate than tree rings
(Continued on page 32...)
Figure
Figure 2. The frequency of freezing of the River Thames during The Little Ice Age with the maxima occurring during the 17th and 18th Centuries.
Since the documentation of the Little Ice Age, (LIA) and the Medieval Warm Period, (MWP) was dropped by the IPCC in 2001, there has been an avalanche of papers from around the world documenting the occurrence of the MWP and the LIA. There are some 500 citations from around the world. Repeatedly these publications cite the average temperature of the MWP as up to 1ºC warmer than the present warm period. An excellent citation index is available from CO2 Science which is available at www. co2science.org for both the MWP and LIA.
Notwithstanding this body of evidence, in 2001 the IPCC in their Third Assessment Report (TAR-2001) published a diagram purporting to represent Global Surface temperature for the last millennium (Figure 3) based on tree-ring data. The diagram shows a flat and slightly cooling linear trend until 1900 when, in a brilliant visual stroke, Mann compared his apples to oranges by grafting on the actual surface temperature record for the 20th Century, “the blade”, on to the nine centuries of proxy treering data, “the handle”. This has since been derisively named the “Mann Hockey Stick” which became the clarion call of the IPCC and the green lobby claiming that 1990 was the hottest decade and 1998 the hottest year of the millennium. This scientific travesty was published in a peer-reviewed journal, yet none of the obvious problems were questioned until a publication by McIntyre and McKitrick in 2003. Only by great persistence and perseverance did they obtain the data. Their conclusion: “the particular “hockey stick” shape derived in the Mann, Bradley, and Hughes (1998) proxy construction – a temperature index that decreases slightly between the early 15th century and early 20th century and increases dramatically up to 1980 – is primarily an artifact of poor data handling, obsolete data, and incorrect calculation of principal components.
Nevertheless, IPCC continued to use this diagram in their literature while in the US National Assessment (2000) the diagram lost its error bars and was promoted from a Northern Hemisphere indicator to Global stature. The National Academy of Sciences (NAS 2006) also used the Mann hockey stick, notwithstanding the damning criticism of McIntyre and McKitrick. The spin continued until the Energy and Commerce Committee of the United States Congress requested an independent review. This resulted in the establishment of the Wegman committee (2006), an independent group of scientists with statistical expertise working pro bono. They concluded decisively that the statements of Mann, Bradley, and Hughes (1998) which
Figure 3. The Infamous Hockey Stick of Mann, Bradley, and Hughes. Note that this figure obliterates the Medieval Warm Period and the Little Ice Age. The graph is not temperature but the deviations from the 1961 to 1990 average. The smooth line is a 50-year moving average and the dark grey error bars represent 95% confidence limits. Note high levels of uncertainty at periods earlier than 17th Century. After 2001 UN IPCC, Summary for Policymakers, p. 3.
Figure 4. Mean annual air temperature in Phoenix, Arizona, from 1931 to 1990 and population growth for the Phoenix metropolitan Area Source: After Balling, 1992.
indicated that the 1990s was the hottest decade in a millennium and that 1998 was the hottest year of the millennium cannot be supported. Although the “hockey stick” was dropped from the IPCC Fourth Assessment in 2007, the authors simply ignored the well documented historical data demonstrating several cycles of warming and cooling (Figure 1), to save the embarrassment of a nearly flat-line proxy CO2 curve from ice core data covering the same period. Either the CO2 proxies are wrong or CO2 is not a significant driver of the earth’s climate. In reality, this can only be seen as a deliberate evasion of the fact that climate variability has occurred for millennia with temperature fluctuations of similar magnitude to those occurring at present.
Instead, the IPCC authors took the political way out, and in the IPCC 2007 Fourth Assessment they simply removed the historical data and presented truncated data commencing in 1850 so that all that remains is the warming as the climate recovers from the maximum cooling in the LIA. For this
completely unscientific manipulation they received the Nobel Prize.
As an aside, given the common emphasis on peer review, one might wonder how such a poor scientific product as the Mann, Bradley, and Hughes (1998) study was originally published, given its defective statistics that contradicted everything that was known about historic climate and, yet, was still accepted by IPCC for the Third Assessment Report in 2001. The Wegman Committee did address this issue and concluded that within the paleoclimate community there are several intensively coupled groups or cliques – meaning that every member of the group has one or more coauthor relationships with every other member of the group, which suggests that the peer-review process failed to fully vet papers before they were published. In turn, the peer-review process may result in censorship where the views expressed are contrary to the views or the agenda of the clique. Mann, Bradley, and Hughes presented what the climatological community wanted to hear and so they ignored all previously published data on climate variability.
The IPCC has relied principally on the average global surface temperature to support their claim of anthropogenic global warming (AGW); however, warming in itself is not proof of the cause. Claims that AGW is occurring that are backed by accounts of melting glaciers and disappearing Arctic sea ice are simply confusing the consequences of warming with the causes. The question is how much of the warming can be linked to increases in greenhouse gases.
There is a well founded concern that the surface temperature record is seriously contaminated by the urban heat island effect. Therefore, rural stations are crucial to develop a baseline in order to remove the effects of urbanization. But the number of true rural stations is small, accounting for only 7% of the earth’s area. A recent survey of the US Climate Reference Network (USCRN) shows that only 4 % of the stations have appropriate recording conditions with sensors located at least 100 meters from artificial heating or reflecting surfaces and parking lots. An amazing 70% are located within 10 meters of, or adjacent to, or on top of an artificial heating source such as a building, roof top, parking lot, air conditioning exhaust, or concrete surfaces. (See: http:// wattsupwiththat.com/) These problems are not confined to the US, the Goddard Institute for Space Studies (GISS) includes temperature stations in Canada which do not meet the required siting specifications. The City Centre Airport in Edmonton is a good example which clearly demonstrates the
5. Average annual air temperatures at 93 California climate stations from 1947 to 1993 stratified by 1990 county population: over 1 million (top); between 1 million and 100,000 (middle); and less than 100,000 (bottom). Source: Goodridge, 1996.
effect of urban heat island effects and there are many more.
The direct relationship between population
growth and temperature increase is well documented as shown in Figure 4 showing the mean annual air temperature in Phoenix Arizona. The coincidence of the population growth with temperature increase is striking. While in Figure 5 data from 93 climate stations in California is presented by county population. Where the population is over one million, the mean annual air temperature shows an increase of almost 3 ºF, while in counties with a population less than 10,000 the temperature increase is only 0.25 ºF and, even in the latter case, it is likely that the temperature stations have been affected by urban construction.
The last three decades of the 20th century have been a period of vigorous economic growth and construction and expansion coinciding with the growth in the global average temperature (McKitrick and Michaels, 2007). Meanwhile, the geographic distribution and sampling has deteriorated over time, especially since the 1970s. Ideally, coverage should provide some 2,592 grid boxes at five degrees of latitude and longitude but with the decline in stations the coverage has dropped from 1,200 to 600 stations – a decline in grid station coverage from 46 to 23%! The majority of the remaining stations tend to be located in more populated areas.
Nevertheless, the IPCC claims that their global average surface temperature has been deurbanized, but they have declined to release the data or methodology so that it can be independently verified. Dr. Jones of the Climate Research Unit (CRU) at the University of East Anglia famously responded to a request for the basic data and methodology with, “Why should I make the data available to you, when your aim is to find something wrong with it.” This does not suggest that the CRU have high confidence in their work or of their contribution to the IPCC. This also confirms Stephen McIntyre’s point that there is greater due diligence done on small public offerings on the TSX than there has been on Climate Science where the IPCC proposals could cost billions. The Wegman Committee similarly concluded that, where massive amounts of public monies and human lives are at stake, academic work should have a greater level of scrutiny and review.
Temperatures over the ocean are not taken by thermometers in the air two meters above the surface, but by taking the temperature of the sea water itself, the so-called sea surface temperature. (SST) Several different methods have been used to measure SST, although (Continued on page 34...)
Figure
Figure 6. NASA Satellite Data. Lower tropospheric temperature since 1978 measured by microwave sounding units. Note the lack of any clearly defined warming trend. The record is dominated by the Pacific Decadal Oscillations of El Nino / La Nina together with cooling resulting from major volcanic eruptions. The plunge in temperature from January 2007to January 2008 of 0.7 ºC has been attributed to La Nina. Thus if CO2 has any effect at all it is quite insignificant in respect to other climate drivers.
(...Continued from page 33)
currently this is done mainly by buoys and satellites. In the past, temperatures have been taken from a variety of depths from one mm (satellites) to two meters (ship engine water intakes) which may not reflect air temperature because of variable ocean currents temperatures and prevailing wind systems.
The merit of calculating global average surface temperature has been questioned since there is not one global climate but a large variety of climates depending on latitude, geographic distribution of land masses, and atmospheric dynamics. Weather is not about homogeneities but differences. It is the redistribution of heat that generates weather and climate. As an example, 1947 was the coldest year in the UK since records have been kept but appears as one of the warmest years in global records. Much has been made of the potential loss of the Greenland ice cap which may cause widespread sea level rise; however, temperature records on Eastern and Western Greenland and adjacent eastern Canada show significant cooling since 1960. (Rogers, 1989 and Morgan et al., 1993).
The IPPC has depended almost exclusively on the rise in Global Average Surface Temperature as proof of anthropogenic global warming (AGW). The AGW hypothesis proposes that ‘greenhouse’ gases trap heat in the upper atmosphere. The general circulation models supporting this hypothesis show an increasing warming trend with altitude, peaking at roughly two times the surface value at around ten kilometers. Therefore, the diagnostic test of the validity of AGW theory is to actually measure the temperature increase at 8-10 km in the troposphere. Such measurements have actually been taken in the troposphere for the last 50 years, from 1957
Figure 7. Globally averaged temperature variations between 1850 and 2007. The temperature increase to the 1940s reflects natural rebound of temperature from the Little Ice Age independent of CO2. The cooling from 1940 to 1970 occurs while CO2 is increasing and the only correlation with rising CO2 is from 1980 to 1998. Although CO2 continues to increase global temperatures have shown no warming in the last ten years. Source: HadCRUT3 dataset from the UK Met Office and U. of East Anglia.
to 1980, by radiosonde balloons, and since 1980 by Microwave Sounder Units (MSU) onboard NASA satellites. The accuracy and compatibility of the MSU data has been validated independently by measurements from radiosonde balloons. The MSU data provides excellent global coverage and a high degree of accuracy but it shows no meaningful warming trend as shown in Figure 6. Therefore, the AGW hypothesis is shown to be incorrect by the satellite records. In scientific terms, the hypothesis fails.
Finally, the recent reports from the world’s temperature monitoring stations, the UK’s Hadley Centre and in the US, NASA’s GISS, UAH, and RISS all show that in the last year, from January 2007 to January 2008, the global average temperature has dropped considerably. The cooling ranges from 0.65-0.75 ºC (Figure 6), which is the largest single drop ever recorded. Furthermore, the Secretary General of the World Meteorological Society, Michael Jarraud, has agreed that temperatures have dropped and will continue to do so through 2008. The cooling is attributed to La Nina although this was never factored into any of the climate model predictions of the IPCC in any of their assessment reports (1990, 1995, 2001, and 2007). Moreover in the IPCC 2007, “Summary For Policymakers”, it was claimed that average Northern Hemisphere temperatures during the second half of the 20th Century were very likely (their italics) greater than in any other 50-year period in the last 500 years and likely (their italics) the highest in the last 1,300 years. The detailed work of Hubert Lamb shows that this is simply incorrect. The Mann “Hockey Stick” incident shows a level of desperation to establish the link to AGW and the failure to acknowledge this in IPPC 2007, reports indicates that we
are no longer dealing with science but the politics of a belief system.
In conclusion, we can say that the World’s Historic Climate has well documented pronounced cycles of warming and cooling occurring independent of CO 2 levels in the atmosphere. Only in the last century can a possible link be established to CO 2 when its production has increased since the industrial revolution. However, even then, the correlation of atmospheric CO 2 with global average surface temperature is relatively poor. The rebound of temperature from the Little Ice Age to the average temperature highs of the 1930s and 1940s occurs when CO 2 values lie between 290 to 310 ppmv but cooling occurred while CO 2 increased from 310 to 330 ppmv from the 1950s to the early 1970s. The only direct correlation occurs in the period from 1975 to 1998 when CO 2 increased from 330 to 365 ppmv (Figure 7). While the CO 2 content continues to increase, there has been no increase in temperature this century (see Figure 6). Therefore, a relationship between global average surface temperature and CO 2 content can only be demonstrated for the period from 1975 to 1998. This has no statistical significance on the millennial scale of climate. Furthermore, there is very good reason to suggest that a significant part of the average temperature increase is related to the urban heat island effect. Since surface warming in itself is not proof of Anthropogenic Global Warming, and there is a failure to observe any significant warming of the troposphere, then there is clear evidence that the AGW hypothesis is wrong.
Finally it is clear that in the 2007 IPCC reports, all scientific objectivity has been abandoned in order to establish the authors’
political objectives. Unfortunately they have been rather successful since the media are quite happy to go along with the unsupported scientific conclusions and appear to be blind to the unprincipled distortion of the evidence.
REFERENCES
Carter, R .M. 2007. The Myth of Human Caused Climate Change. The AusIMM New Leaders Conference. Brisbane, QLD, May 2-3.
Balling, R. C. Jr. 1992. The Heated Debate: Greenhouse Predictions Versus Climate Reality. San Francisco, Pacific Research Institute for Public Policy.
Goodridge, J. D. 1996. Comments on Regional Simulations of Greenhouse Warming including National Variability. Bulletin American Meteorological Society, v. 77, p. 3-4.
Humphreys, Helen. 2007. The Frozen Thames. McLelland and Stewart, Toronto.
IPCC. 1990. Climate Change: The IPCC Scientific Assessment. Cambridge University Press, Cambridge.
IPCC. 2001. Climate Change 2001: The Scientific
ROCK SHOP
Basis. Cambridge University Press, Cambridge. IPCC. 2007. Climate Change: The Physical Science Basis, Summary for Policymakers. Fourth Assessment report, Intergovernmental Panel on Climate Change. Geneva, Switzerland.
Lamb, H. H. 1965. The Early Medieval Warm Epoch and Its Sequel. Palaeogeography, Palaeoclimatology, Palaeoecology, v. 1, p. 13-37.
Lamb, H. H. 1967. Britain’s Changing Climate. Geographical Journal, v. 133, p. 445-468.
Lamb, H. H. 1977. Climate – Present Past and Future. Volume 2, Climatic History and Future. Methuen, London.
Mann, M. E., Bradley, R. S., and Hughes, M. K. 1998. Global scale temperature patterns and climate forcing over the past six centuries. Nature, v. 392, p. 779.
McIntyre, S. and McKitrick, R. 2003. Corrections to the Mann et al. (1998) Proxy Data Base and Northern Hemispheric Average Temperature Series. Energy and Environment, v. 14, no. 6, p. 751-771.
McKitrick, R. and Michaels P. 2007. Quantifying the influence of anthropogenic surface processes
and inhomogeneities on gridded global climate data. Journal of Geophysical Research, v. 112, D24S09.
Morgan, M. R. et al. 1993. Temperature trends at Coastal Stations in Eastern Canada. Climatology Bulletin, v. 27 no. 3.
NAS. 2006. Surface Temperature Reconstruction for the Last 2,000 Years. National Academy Press, Washington DC.
National Assessment Synthesis Team (NAST). 2000. Climate Change Impacts on the United States: The Potential Consequence of Climate Variability and Change. Overview Document, USGCRP, June 2000.
Rogers, J. C. 1989. Seasonal Temperature Variability over the North Atlantic Arctic. 13th Annual Climate Diagnostics Workshop. NOAANWS, p. 170-178.
Wegman, E. J. et al. 2006. Ad Hoc Committee Report on the ‘Hockey Stick’ Global Climate Reconstruction. Report presented to the U.S. House of Representatives, Committee on Energy and Commerce, July 14 2006. www.uoguelph.carmckitri/researchWegmanReport.pdf.
M AKING A WORLD OF DIFFERENCE: National Engineering and Geoscience Week 2009 February 26 – March 7, 2009
| by Amy Pilikowski
Geosciences and engineering professionals across the province of Alberta are “Making a World of Difference” in the lives of Albertans every day. Their contributions will be celebrated during APEGGA’s (The Association of Professional Engineers, Geologists, and Geophysicists of Alberta) 17th annual National Engineering and Geoscience Week (NEGW), to be held February 26 – March 7, 2009.
Kicking off NEGW on February 26 are two APEGGA events that will challenge professional geologists, geophysicists, and engineers to compete in a fun mystery event that will test their skills, while the public and other professionals cheer them on. The kickoff events will be held in both Calgary and Edmonton, Alberta.
APEGGA members will take the opportunity throughout NEGW to share their experiences with youth at Science Olympics events and elementary school Science Nights. The Science Nights are intended to inspire students to explore careers in math, science, and technology.
The APEGGA Science Olympics will take place in Calgary on February 21st at the Big Four Building (at the Calgary Stampede Grounds) and the Edmonton Science Olympics will be held on March 7th at the Shaw Conference Centre. Everyone is welcome to come out and cheer on the teams.
Elementary Science Nights are another great way for APEGGA’s members to share their passion for their professions with students. The Nights give volunteers the opportunity to bring science to students and their families by visiting schools in Calgary, Edmonton, and the two cities’ surrounding areas. They feature a variety of fun and interactive activities and displays that are designed to encourage students to choose career paths in the sciences.
Pick a card, any card
Improve your exploration odds with Divestco. At Divestco we want the odds to be in your favor so we have given you a whole deck of geological products and services to choose from. Divestco’s integrated offering for geological professionals gives you the ability to choose from a wide range of geological products and services to suit your unique needs. Pick as many individual cards as you want or let our experts deal you a winning hand. Call us at 403.537.9904 or email sales@divestco.com for more information.
TSX: DVT www.divestco.com
To learn more about NEGW and some of the professional geoscientists and engineers who are making a world of difference in Alberta, look for the 14th annual special NEGW supplement in both the Calgary Herald and Edmonton Journal on February 26th.
There are many ways you can join in and help celebrate NEGW. you can:
• Plan a challenge between departments within your organization, or with other companies or technical societies;
• Host a coffee session for other employees and tell them about NEGW; or
• Visit a school in your area to talk with students about your profession.
For more information on the events throughout Alberta during NEGW, and to get involved, refer to the calendar of events at http://www/ apegga.org/K12/negw/events.html.
If your organization plans to host an event during NEGW, please feel free to contact Amy Pilikowski at (403) 262-7714 or apilikowski@apegga.org to have it added to the calendar of events. For information about Science Olympics and Science Nights, please contact Jeanne Keaschuk at (780) 426 -3990, 1-800 - 661-7020, or jkeaschuk@apegga.org.
CSPG BESTOWS PRESIDENT’S SPECIAL R ECOGNITION AWARD on the Geological Survey of Canada (Calgary)
The Geological Survey of Canada (Calgary) (GSCC) received the President’s Special Recognition Award from the Canadian Society of Petroleum Geologists at CSPG’s December 9, 2008 Technical Luncheon, which was held at the Calgary Telus Convention Centre. Over 800 people listened as CSPG President Lisa Griffith read the citation detailing the tremendous support the Society has received from the GSCC over the last 40 years and presented a sculpture of Potsdam Sandstone affixed with CSPG’s logo and an abbreviated citation.
Receiving the award on behalf of the Geological Survey of Canada (Calgary) was Assistant Deputy Minister of Natural Resources Canada, Mr. Mark Corey. In thanking the Society, Mr. Corey reflected on the history of GSCC with its first office in the old Customs Building on 11th Avenue in 1967 and how it moved to its current location in 1969. He spoke of how the GSCC integrated well with the geoscience community as it achieved its mandate of informing industry and the public about the geology of Canada, especially petroleum geology. Mr. Corey finished by graciously acknowledging that the GSCC has learned as much from industry as it has conveyed over the years. He wrapped up by asking all current and former employees of the GSCC to stand and be recognized by CSPG.
Below are Lisa Griffith’s words at the December 11th luncheon.
The Canadian Society of Petroleum Geologists President’s Special Recognition Award has only been presented three times in the history of the Society. The award is
presented to individuals, institutions, or organizations whose sustained efforts have brought great honour and distinction to the Society and to the geoscience community, or have provided significant, outstanding, and sustained contributions to Canadian petroleum geology.
The Canadian Society of Petroleum Geologists is pleased to announce that the Geological Survey of Canada (Calgary), a Division of Natural Resources Canada, is today’s recipient of the President’s Special Recognition Award, in acknowledgement of their many contributions to the Canadian petroleum industry and to the Canadian Society of Petroleum Geologists.
This award recognizes GSC Calgary (GSCC) for its outstanding scientific and technical programs and projects including,
• Publications in support of defining the geology of this country;
• Discovery of Canada’s natural resources;
• Sharing geoscience knowledge;
• Transferring technologies and innovative ideas with energy and enthusiasm; and
• Taking leading roles in collaboration with industries, universities, and other governments.
All of which are vital to the exploration and development of Canada’s natural resources.
(Continued on page 38...)
Mr. Kirk Osadetz, Dr. Sandy McCracken, Ms. Suzanne Twelker, CSPG President Lisa Griffith, Mr. Mark Corey and Mr. Bill Reynen.
In particular, GSCC’s efforts in detailed assessments of the potential of Canada’s hydrocarbon resources have inspired and helped many geologists and their management teams, in exploring and finding new resources thereby increasing Canada’s wealth and knowledge of its potential.
GSCC’s staff has pushed back many geographic and scientific frontiers, with pioneering efforts and innovative techniques and ideas. Geological mapping; structural, stratigraphic, and paleontological interpretations; and resulting basin analyses have been critical to the industry’s exploration and development efforts. At the same time, the staff at GSCC has always made itself available and has been very professional in assisting geological explorationists in finding and understanding the information they need to be successful in their exploration efforts. Along the way, GSCC has collected or captured and preserved or published an enormous wealth of geoscience knowledge. A great quantity of both public and private sector information that would have otherwise been lost has been archived and preserved. All of this becomes even more critical as we move forward to develop Canada’s hydrocarbons
in more remote or unconventional areas where new ideas are needed to define increasing difficult exploration targets. This is particularly essential in the north where sovereignty is a growing issue.
GSCC staff has always given outstanding support to many national scientific, technical, and educational organizations. For more than forty years GSCC has supported CSPG technically, operationally, and strategically in fulfilling its mandate to promote the science of petroleum geology and to develop its members professionally. Their contributions include numerous society presidents, directors, committee members, conferences chairs and organizers, publication editors, and volunteers. Simply put, CSPG would not be the internationally recognized geological organization that it is without the help and support of GSCC staff.
CSPG is a repository of Canadian petroleum geological knowledge that has been and continues to be the principal beneficiary of the extensive scientific knowledge and scholarship of GSCC. It is without doubt that their technical contributions to the Society’s peer reviewed journal, The Bulletin of Canadian Petroleum Geologists, and its
topical technical magazine, the Reservoir, have educated generations of geologists about the petroleum resources of Canada. Additionally, numerous technical luncheon presentations by many GSCC staff in Calgary and across Canada have successfully transferred ideas, concepts, plays and prospects to a very wide audience – locally, nationally, and internationally. As field trips leaders, GSCC staff has generously shared their knowledge and skills with CSPG members at locales throughout Canada. GSCC Staff have clearly demonstrated their commitment to discovery, synthesis, and technology transfer that develops Society members professionally, improving their efficiency and effectiveness in adding energy reserves and production for the benefit of all Canadians.
It is therefore my privilege to bestow this prestigious award upon the Geological Survey of Canada (Calgary), its employees both past and present, for its sustained and outstanding contributions to the Canadian petroleum industry and to the Canadian Society of Petroleum Geologists. On behalf of CSPG, I hereby present the President’s Special Recognition Award to Assistant Deputy Minister Marc Corey from Natural Resources Canada.
ATLANTIC U NIVERSITIES Geoscience Conference 2008
| by Megan Trites
The 2008 Atlantic Universities Geoscience Conference (AUGC 2008) was hosted by the University of New Brunswick (UNB) in Fredericton from October 23rd to 25th. The Conference was a great success thanks to the over 95 participants from six Atlantic Universities: Memorial, Acadia, Saint Mary’s, St.Francis Xavier, Dalhousie, and UNB.
Four field trips were offered on Friday, October 24th by UNB professors and their colleagues. Dr. David Lentz (UNB) and David Shinkle (Adex) led a field trip to the Mount Pleasant Caldera Deposit, offering educational insight on W-Mo-Bi and Sn-ZnCu-In deposits. Dr.David Keighley (UNB) and Dr. Adrian Park (UNB) ran a trip to the gas fields near Sussex, New Brunswick to view outcroppings of sandstone beds containing trapped gas from oil shales, as well as the Norton Fossil forest. Dr. Randy Miller from the New Brunswick Museum led a geological history and geo-tourism trip around Saint John, New Brunswick. Our fourth trip to the Minto Coal Mine was led by Michelle Coleman (New Brunswick Coal), Dr. Bruce Broster (UNB) and Dr.
Nick Susak (UNB). This trip included information on the life cycle of the mine, from mine operation to restoration work.
On Saturday, October 25th, students presented their research results to their peers through a series of high-calibre oral and poster presentations. The Frank Shea Memorial Award for the best presentation in the field of Economic Geology was awarded to April Coombs from Memorial University. The Canadian Society of Petroleum Geologists Award for the best oral presentation was awarded to Darren Lefort from Saint Mary’s University. The NSERC-APICS (Natural Sciences and Engineering Research Council of Canada and Atlantic Provinces Council on the Sciences) Award for the best paper was presented to Luke Hilchie from Dalhousie University. The Canadian Society of Exploration Geophysicists Award for the best geophysical presentation was awarded to Nicole M. Peters from Dalhousie University, and the Imperial Oil Poster Award, was presented to Morgan Quinn from Dalhousie University.
These awards were presented to students by conference sponsors at the well attended closing banquet. Students were honoured to have Robert Quartermain, President and CEO of Silver-Standard Resources, speak at the banquet. I would like to extend our gratitude to Robert for giving an intriguing talk.
Angie Dearin (Imperial Oil) attended AUGC 2008 on behalf of CSPG’s University Outreach Committee. Angie was one of several industry professionals that participated in the Conference by networking with students, judging presentations, presenting the CSPG award, and giving a talk that included information on what CSPG offers to students.
I would like to thank the CSPG and all our sponsors for contributing to AUGC 2008. The attendees would also like to thank AUGC 2008 Co-Chairs Kim Klausen and Megan Trites for organizing this successful conference.
AUGC 2009 will be hosted by St. Mary’s University in Halifax in October 2009.
For information of CSPG’s involvement in AUGC please contact Angie Dearin (angela. dearin@esso.ca).
Field trip group to the Mount Pleasant caldera.
Field Trip to Minto Coal Mine.
Conference Co-Chairs Kim Klausen and Megan Trites with Robert Quartermain.
THE CONTRIBUTION OF INTEGRATED HRAM STUDIES TO EXPLORATION AND EXPLOITATION OF UNCONVENTIONAL PLAYS IN NORTH AMERICA.
Part 2: Basement structures control on the development of the Peace River Arch’s Montney/ Doig resource plays
| by Dr. Zeev Berger,1* Michelle Boast,2 and Martin Mushayandebvu3 (Image Interpretation Technologies Inc.)
Figure 1. The tectonic map and corresponding magnetic images of the Peace River Arch area. The tectonic map in Figure 1A is based on integrated analysis of magnetic data, with seismic and well data. Figure 2B shows the location of major basement terranes in the study area. The identification of the basement terranes was slightly modified from Ross et al. 1994. Figure 2C shows the magnetic expression of structures that were identified in this region. Major pools that are somewhat controlled by basement structures are also shown. The oval shaped features marked on Figures 1B and 1C represent areas where major basement boundaries are cross-cut and offset by basement faulting.
The emergence of unconventional plays in North America provided us with the opportunity to critically review high resolution aeromagnetic (HRAM) studies of several mature basins in the USA and Canada. The results of these studies have been compiled onto a series of structural/tectonic maps that are designed to illustrate the relationships between basement structures and the presence of “sweet spots” and “preferred trends” within these unconventional plays. In a series of short articles, that we began to publish in the November 2008 issues of the CSPG Reservoir (for Canadian examples) and the AAPG Explorer (for US examples) we attempt to provide brief overviews of the methods that we use to interpret and integrate magnetic data as well as present some intriguing results of our work both in Canada and the US.
In the November issue of the Reservoir, we presented a tectonic map of the Peace River Arch (Figure 1A of this article). The tectonic map which was based on
integrated analysis of magnetic data, was used to illustrate the control of basement structures on the development of several important unconventional plays in the Peace River Arch area including: the hydrothermal dolomite (HTD) reservoir plays of the Wabamun, Debolt, and Banff formations, the Granite Wash-like plays of the Beaverhill Lake and Puskwaskau formations, as well as the emerging resource plays of the Montney / Doig formations. The location, structural style and timing of deformation of the structures which were presented on the tectonic map were also constrained with the analysis of key seismic lines, well information, remote sensing images, and numerous key hydrocarbon pools that appear to be controlled by basement features.
The ideas presented in the November article have been well received by readers of the Reservoir who have sent in several comments, suggestions, and inquiries. Most readers wanted to see more examples of actual interpretation of low and high resolution aeromagnetic data, particularly
how it related to the development of the Montney / Doig plays. They also asked to see how the key geological features identified on the magnetic images are correlated with regional seismic, well, and remote-sensing data. The objective of this paper is to address some of these requests.
REGIONAL MAGNETIC INTERPRETATION OF THE PEACE RIVER ARCH
The analysis of regional magnetic data must always begin with the recognition of the different basement terranes that dominate the signature of the magnetic data. For example, the magnetic image of the Peace River Arch area consists of eight different basement terranes that exhibit different magnetic characteristics (Figure 1B). The unique characteristics of the magnetic data are related to the lithological make-up of the basement as well as its structural fabric. The boundaries between the different basement terranes are often easy to map and recognize on the magnetic data. Major basement terrane boundaries
(Continued on page 42..)
Figure 2. Magnetic data interpretation of the southern edge of the Peace River Arch and the Deep Basin area. The magnetic data over this region defines three different basement terrains with well defined boundaries. The faulted edge of the Peace River Arch is well manifested by the sharp change in magnetic intensity which reflects significant change in the depth of the basement across the fault .The known Montney pools in this region are largely controlled by basement structures.
Figure 3. A composite of the tectonic map, seismic, and magnetic data of the Septimus Basin area. The tectonic map, (3A) shows the close spatial relationships between different fault systems and the development of the Montney producing trends. The regional seismic line, (3B), datumed at the base of the Cretaceous, illustrates the structural setting of the Septimus Basin, which is characterized by the presence of down-to-the-basin, listric normal faults. Figure 3C shows the HRAM magnetic data expression of the Groundbirch Graben. Figure 3D illustrates how sophisticated processing techniques such as Extended Euler Deconvolution can be used to better define the faulted edges of the graben and its influence on the Doig Play. HRAM data courtesy of FUGRO.
(...Continued from page 41)
can often act as zones of weakness, which can lead to structural reactivation and / or differential erosional processes. These boundaries often become the focal point
of hydrocarbon plays. Examples of this phenomenon have been demonstrated for the Puskwaskau and Beaverhill Lake plays that are emerging along the boundaries of the Ks and Bu terranes south of the
Peace River Arch area (Berger, Boast, and Mushayandebvu, 2008; Figure 5, page 44).
Major structural elements that developed after the emplacement of the basement
terranes also produce strong expressions on the magnetic images of the Peace River Arch area (Figure 1C). The associated faults can be divided into the following categories: 1) basement-involved normal and strike-slip faults, 2) divergent wrenchfault system associated with pull-apart basins, 3) down-to-the-basin listric normal faults, and 4) detached thrust faults. Each category of fault exhibits unique structural styles and related patterns of deformation that often produce detectable expressions on the magnetic data. Basement-involved (normal and strike-slip) faults exhibit long and linear fault-line traces that often follow major lithological boundaries of the basement. Thus, the orientation of these faults is largely controlled by the orientation of the pre-existing basement grain of each terrane. (e.g., the Hay River Shear fault as a strike-slip example and the Dunvegan fault for a normal fault example). In contrast, divergent wrench fault systems are usually characterized by the presence of short and multi-directional fault-line traces that cut across several
terrane boundaries and do not follow the typical expression of the basement grain (e.g., the Fort St. John graben (FSJG) and its satellite graben features). Downto-the-basin, listric normal faults also cut and offset the magnetic grain but the expressions of their fault-line traces typically form a long and arcuated fault-line trace (e.g., the north bounding fault of the Septimus Basin, Figure 3C, referred to as the Flexure Fault). Detached thrust faults are easy to recognize on magnetic data because their fault-line traces manifest on magnetic data as a series of short and sinuous features that exhibit a high frequency magnetic signature, which can normally be detected with HRAM data.
It is interesting to note that several major oil and gas pools in the study area are located in places were basement terrane boundaries are offset by crosscutting faults (shown in oblique circles in Figures 1B and C). This phenomenon further illustrates the strong relationships between basement structures and the
development of different hydrocarbon plays in the region.
THE CONTROL OF BASEMENT STRUCTURES ON THE MONTNEY PLAY IN THE SOUTHERN EDGE OF THE PEACE RIVER ARCH AND THE DEEP BASIN AREA
The magnetic image of the southern edge of the Peace River Arch and the Deep Basin area can be used to further illustrate several different aspects of integrated structural interpretation of magnetic data (Figure 2). The magnetic data is dominated by the presence of three different basement terranes, the Kisituan, Buffalo Head, and Chinchaga terranes, that exhibit distinct magnetic characteristics with well defined terrane boundaries. The deepening of the basement toward the Deep Basin is also reflected by changes in magnetic anomaly intensities and wavelengths. This phenomenon is well manifested along the edge of the Peace River Arch as well as by the gradual deepening of the basement from Girouxville westward toward the Sturgeon Lake area.
Structural analysis of the magnetic data also points out that all the known conventional Montney pools are somewhat controlled by basement structures. The Sunset and Stump fields appear to develop along the faulted boundary of the Buffalo Head and Chinchaga terranes, Ante Creek, Dunvegan, Tangent, and other fields are largely controlled by basement-involved normal faults. Whereas, Grand Prairie and La Glace are control by down-to-the-basin listric normal faults. Sturgeon Lake field appears to be controlled by the positive relief of the reef complex (which is also controlled by basement structures).
BASEMENT CONTROL OF THE MONTENY PLAY IN THE SEPTIMUS AREA
The Septimus Basin area, shown in Figure 3A, marks the boundary between the conventional Montney play and the newly developing Montney / Doig resource plays. The tectonic map of this area illustrates however, that the emerging resource play is also strongly controlled by basement structures. Preferred trends of Montney / Doig can be identified along the faulted edge of the FSJG. Also identified is the listric, normal fault that marks the northern edge of the Septimus Basin – which is named here as the flexure zone – as well as the narrow Groundbirch Graben that is interpreted as a failed arm of an old “pullapart” basin.
(Continued on page 44...)
Figure 4. Tectonic evolution of the FSJG. The sketch illustrates the structural evolution of the western dog-leg feature of the FSJG.
The different structural elements that were identified using magnetic data can also be recognized on regional seismic data. The “squeezed” regional seismic section shown in Figure 3B, images the configuration of the Septimus basin before it was influenced by late Laramide reactivation. The boundary between the Septimus Basin and the stable platform of the Peace River Arch is marked by the presence of several down-to-thebasin listric normal faults and a general thickening of the sedimentary section to the west.
HRAM data can be used to image the faulted boundaries of the Groundbirch Graben and its offset by the flexure zone fault (Figure 3C). The high resolution data contains high frequency features that reflect the propagation of basement structures into the sedimentary section. More sophisticated processing of the HRAM data can be used to better define the faulted edge of the graben which clearly became the “sweet-spot” of the Doig play (shown as red dots in Figure 3D) in this area.
STRUCTURAL
/ TECTONIC SYNTHETIC OF THE MONIAS AREA
The Monias field is located along the western “dog-leg” Montney / Doig feature of the FSJG (Figure 4). This feature is likely to become a hot area of exploration because it is located immediately north the Groundbirch trend and south of the Buick Creek, Fireweed, Cache trend. This area has remained relatively unexplored because is located in an extremely structurally complex area that is characterized by highly dissected stream valleys.
The structural complexity of this area reflects an interesting multi-phase tectonic evolution, illustrated in Figure 4. Prior to the development of the FSJG, the area was dominated by the presence of basement-involved fault systems that may have developed in association with largescale divergent wrench-fault systems. The collapse of the Peace River Arch led to reactivation of the pre-existing faults and the development of the deep FSJG. During the major graben phase, the graben was filled with thick Kiskatinaw sediments. This was followed by minor extension and the development of a “graben sag” phase that resulted in the accumulation of a thick section of Halfway and other Triassic sediments. Finally, late Laramide compression led to reactivation of existing faults and the development of inverted structures. These structures include the
various Monias fields as well as the Wilder field. The main production from this field is from the Halfway reservoir sands.
The rugged topography of this area, which hampers the collection of seismic data, is directly attributed to the late reactivation and inversion of structures in this area. Hence, most of the deeply entrenched stream valleys are largely controlled by the graben’s faults. This phenomenon is further illustrated in Figure 5.
Figure 5 shows some of the data sets that were used to identify geological features in the Monias area. The seismic line across the Monias field (Figure 5A) can be used to illustrate the unique process of structural reactivation and inversion of the dogleg area. The seismic image on the right side, which was flattened on the base of the Cretaceous, shows a deep-seated graben with a clear wedge of Triassic sediments. The seismic image on the left shows the present-day configuration of the Monias field. This area was reactivated and inverted by late Laramide compression associated with the development of the thrust belt to the west.
The recent reactivation of faults in the
dog-leg area caused structures to propagate upward into the shallow section. These near-surface and surface features can be easily detected with HRAM and remotesensing data. For example, the HRAM image of the dog-leg area shows the presence of many high-frequency linear features that reflect the fault-line traces of the reactivation faults (Figure 5B). Some of these faults also control the pattern of the incised valley systems that can be depicted on remote sensing data. The Wilder field, for example is manifested at the surface as a box-shaped feature, which is outlined by incised stream valleys and typical linear fault escarpments that can be detected on Landsat imagery (Figure 5D). The structure map of the Dunvegan formation created from stereophotography illustrate that configuration of the Halfway structures is clearly mimicked at the surface (Figure 5C).
CLOSING REMARKS
Exploration and exploitation of resource plays present new and exciting challenges to the geosciences community. Geologists and geophysicists, which traditionally are looking for well defined structural and stratigraphic traps, are now being asked to identify extremely subtle trends and sweet
Figure 5. Geological and geophysical data of the Monias area. This data includes: a seismic line across the Monias field that illustrates the inversion process (5A). An HRAM image showing the magnetic expressions of near-surface faults and their relationships to known producing fields (5B). Surface structure map of the Wilder field, which was made from stereo photography (5C) and Landsat imagery showing the surface expression of Wilder Field (5D).
spots that are often difficult to detect by conventional interpretation techniques of seismic and well data. The identification of such trends can clearly make or break the economic success of any resource play. In the case of the Montney / Doig play for example, early identification of the Groundbirch Graben area has been extremely rewarding to its explorers. The observations made in this article clearly suggests that, within their respective reservoir fairways, these plays are likely to develop and mature along different faults and fracture systems that are identified in this study.
This article illustrates the value of using magnetic data as a base for tectonic synthesis of resource plays in the Peace River Arch area. The utility of this type of work is largely dependent on three main factors: 1) the use of high quality, high resolution magnetic data that can provide “prospect scale” structural details, 2) the integration of other exploration tools such as seismic, well, and remote-sensing data, and 3) the interpretation of the magnetic data and other exploration tools must be guided by sound understanding of the tectonic history of the area. We hope that some of these principles have been demonstrated in this article.
REFERENCES AND SELECTED BIBLIOGRAPHY
Barclay, J. E., Krause, F. F., Campbell, R. I., Utting, J. 1990. Dynamic casting and growth faulting: Dawson Creek Graben Complex, Carboniferous-Permian Peace River Embayment, Western Canada. In: Geology of the Peace River Arch. S.C. O’Connell and J, S. Bell (eds.). Bulletin of Canadian Petroleum Geology, v. 38a, p. 115-145.
Berger, Z. 1994. Satellite hydrocarbon exploration: Interpretation and integration techniques. Springer-Verlag Berlin Heidelberg. New York. 319 p.
Berger, Boast, and Mushayandebvu. 2008. The contribution of integrated HRAM studies to exploration and exploitation of unconventional plays in North America. Canadian Society of Petroleum Geologists. The Reservoir, v. 35, issue 10. p. 42-47.
Canadian Discovery Ltd. 2008. The Doig Formation in Peace River Country. Canadian Society of Petroleum Geologists. The Reservoir v. 35, issue 7, p. 32-35.
Canadian Discovery Ltd. 2007. Puskwaskau –Beaverhill Lake Sand Oil, Alberta T71, R26W5.
Canadian Society of Petroleum Geologists. The Reservoir v. 34, issue 2, p. 33-36. Cant, D. J. 1988. Regional structure and development of the Peace River Arch, Alberta: A Paleozoic failed-rift system? Bulletin of Canadian Petroleum Geology, v. 36, p. 284295.
Davies, G. R. 1997. The Triassic of the Western Canada Sedimentary Basin; tectonic and stratigraphic framework, paleogeography, paleoclimate, and Biota. In: An issue focused on the study of Triassic of the Western Canada sedimentary basin. Bulletin of Canadian Petroleum Geology, v. 45, no. 4, p. 434-460.
Davies, G. R. 2001. Hydrothermal dolomite (HTD) reservoir facies with related shalehosted SEDEX Pb-Zn and dolomite hosted MVT Pb-Zn ore deposits also showing extension-related paleozoic igneous intrusive/ extrusives. Fourth edition. Graham Davies Geological Consultants Ltd, Calgary. Map.
Davis, G. R. and Smith, L. B. 2006. Structurally controlled hydrothermal dolomite reservoir facies; an overview. In: Structurally controlled hydrothermal alteration of carbonate reservoirs. Bulletin of the American Association of Petroleum Geologists, v. 90, no. 11, p. 16411690.
Durocher, S. and Al-Aasm, I. S. 1997. Dolomitization and neomorphism of Mississippian (Visean) upper Debolt Formation, Blueberry Field, northeastern British Columbia; geologic, petrologic, and chemical evidence. Bulletin of the American Association of Petroleum Geologists, v. 81, p. 954-977.
Dix, G. R., Barclay, J. E., and O’Connell, S. C. 1990. The origin, history, and regional structural development of the Peace River Arch, Western Canada. In: Canadian Society of Petroleum Geologists Special Volume 38A, p. 4-24.
Harding, T. P., Verbuchen, R. C., and ChristieBlick, N. 1985. Structural styles, plate tectonic settings and hydrocarbon traps of divergent (transtensional) wrench faults. In: Strike-slip deformation, basin formation and sedimentation. K.T. Biddle and N.H. ChristieBlick (eds.). Society of Economic Paleontologists and Mineralogists Special Publication 37, p. 51-77.
Mushayandebvu, M. F., van Driel, P., Reid, A. B., and Fairhead, J. D. 2001. Magnetic source parameters of two-dimensional structures using extended Euler deconvolution. Society of Exploration Geophysics, Geophysics, v. 66, p. 814-823.
Norgard, G. 1997. Structural inversion of the middle Triassic Halfway Formation, Monias field, northern British Columbia. In: An issue focused on the study of Triassic of the Western Canada Sedimentary Basin. T. F. Maslow and J. Wittenburg (eds.). Bulletin of Canadian Petroleum Geology, v. 45, no. 4, p. 614-623.
O’Connell, S. C., Dix, G. R., and Barclay, J. E. 1990. The origin, history, and regional structural development of the Peace River Arch western Canada. In: Geology of the Peace River Arch. S.C. O’Connell and J.S. Bell (eds.). Bulletin of Canadian Petroleum Geology, v.38a, p.4–24.
Packard, J. J., Al-Aasm, I., Samson, I., Berger, Z., and Davies, J. 2001. A Devonian hydrothermal chert reservoir: the 225 bcf Parkland field, British Columbia, Canada. Bulletin of the American Association of Petroleum Geologists, v. 85, no. 1, p. 51-84.
Packard, J. J., and Pellegrin, G. 1989. Diagenesis and dolomitization associated with hydrothermal karst in Fammenian Upper Wabamun ramp sediments, northwest Alberta. In: The development of porosity in carbonate reservoirs, G. R. Bloy, M. G. Hadley, and B. V. Curtis (eds.). Canadian Society of Petroleum Geologists, Calgary. Continuing education short course notes, Section 8.
Ross, G. M., Broome, J., and Miles, W. 1994. Potential fields and basement structure Western Canada Sedimentary Basin. In: Geological Atlas of the Western Canada Sedimentary Basin. G.D. Mossop and I. Shetsen (compilers). Calgary, Canadian Society of Petroleum Geologists and Alberta Research Council, p. 41-48.
Stoakes, F. A. 1997. Fault controlled dolomitization of the Wabamun Group, Tangent Field, Peace River Arch, Alberta. In: Devonian lithofacies and reservoir styles, Alberta. F. F. Krause and O. G. Burrows (eds.). Calgary. Canadian Society of Petroleum Geologists Core Conference, p. 73-85.
Zhang, C., Mushayandebvu, M. F., Reid, A. B., Fairhead, J. D., and Odegard, M. E. 2000. Euler deconvolution of gravity tensor gradient data, Society of Exploration Geophysics, Geophysics, v. 65, p. 512-520.
CSPG VOLUNTEER PROFILE
Talking to Krista Jewett
| by Heather Tyminski
NAME: K RISTA JEWETT
EMPLOYER : BG INTERNATIONAL POSITION: GEOLOGIST
How long have you been volunteering for the CSPG?
I’ve been volunteering with the CSPG since May 2002, so six and a half years. I entered the work force in 2001 and started volunteering the next year.
Why did you decide to volunteer?
I had considered volunteering and then was approached by Brad Hayes, whom I was working with at the time, to join a committee. He was starting up the University Outreach Committee and as I had just graduated two years before, this committee seemed like a good fit for me. I also thought that because I was new to the oil and gas industry, volunteering would help me meet people and to learn more about the industry in general.
In what capacity have you volunteered for the CSPG in the past?
I had actively spent approximately three years on the University Outreach Committee helping to organize the CSPG’s involvement in student conferences (WIUGC, AUGC, and ASERC). I then started to work with Astrid Arts on the Electronic Communications Committee to design and update the webpage for the University Outreach Committee.
About the same time, I was asked by a friend to join the newly formed Continuing Education Committee. I thought this would be a good opportunity to try something different and meet more new people and it sounded interesting to me.
Tell us about your experience on the Education Committee and chairing it. I originally joined the Education Committee because I thought it would be a great challenge. When I started out on this committee, I was in charge of advertising our courses and overall program. This involved deciding on an image for our committee, which has evolved over the years, and creating Reservoir and Technical Luncheon advertisements and more to showcase our program.
When Astrid Arts was developing the new CSPG website, I worked with her to create the Continuing Education webpage and gave the web designer updates as needed. I was involved with this for about three years (Spring 2003-2006).
During this time, the Continuing Education Chair, Godfried Wasser, asked me to become his co-chair and I soon succeeded him as committee chair when he decided to retire from the committee. I thought this was an initiative that I wanted to take on, as by this time, I had been volunteering for four years already and was looking forward to more responsibility. After Godfried retired that summer, I found a new co-chair (Travis Hobbs), who would eventually take over from me and this handover is happening as we speak. As a co-chair, I was responsible for making sure our field trips were a success, integrated into the convention and making sure that we are also progressing with our other initiatives.
One initiative that I personally took on was our safety program, as there were misunderstandings in the current safety program. I found that the documents we had in place were a bit cumbersome to deal with and saw that the AAPG / Exxon had a field trip safety program already laid out and available for use by societies such as ourselves. So I used what the CSPG had in place already and what the AAPG recommended and came up with a new set of documents. The project is definitely not final yet and will require some work in the near future.
How much time did volunteering involve?
While organizing the advertising for the committee took a few hours a month, when I became Chair my workload increased significantly because you need to immerse
yourself in all aspects of what the committee is doing. We also seemed to be short on volunteers and taking on a lot more responsibility as a committee, so this required more time from Travis and me.
What did you enjoy about chairing a committee?
I enjoyed being in a leadership position and trying to figure out what works and what doesn’t work. It also enhanced my decision making skills and broadened my network. Chairing and volunteering were great experiences and I enjoyed meeting all the people I worked with over the years. It’s also exciting when one is personally involved in a successful program.
How did you find a balance between working and volunteering? you just have to stop and remember that it’s not a full-time job. It’s really easy to get wrapped up in all that is going on, sometimes more often than other times, so you need to be careful to keep your work / life balance in check.
What is your opinion of current volunteerism in the CSPG?
I do think it’s pretty amazing to see the number of people who devote a lot of their time to the CSPG over the years. But I think overall it can be difficult to find new volunteers because our industry is so busy right now and it is difficult sometimes to find that work / life / volunteering balance for a lot of people.
I think that volunteers are integral to the continuation of the Society because without them, there would be no Society and it certainly wouldn’t be doing all that it is doing for its members and the community. I think demands are getting larger with the Society and maybe a larger fulltime office staff would be a good idea, as we rely heavily upon the office staff to get our work done and there are not enough volunteers.
Halliburton Wireline and Perforating Services has the most reliableimaging solutions in the world—including the new Oil Mud ReservoirImager (OMRI™) tool and its X-tended Range Micro Imager (XRMI™) tool version—both of which generate crisp, digitalwellboreimages across the full range of formation resistivitiesand with excellentvertical resolution.
Before you get in too deep, look into Halliburton Wireline and Perforating Services— the leader in reliability and service excellence. For more information, call 1-888-775-6447 or visit us at www.halliburton.com/wireline.
It’s easy to switch to geoSCOUT. We’re prepared.
We know that almost everyone who tries geoSCOUT™ wants to use geoSCOUT. So, why hasn’t everyone already switched to geoSCOUT? Probably because, in general, people don’t like change. But, in this case we’ve got you covered, so change is good – very, very good.
Just ask the thousands of landmen, engineers & geologists currently using geoSCOUT oil and gas mapping and analysis software to make solid decisions every day. Give us an hour for a demo – we know you’ll see the value. Call 403.262.1992 | Email info@geoscout.com | Online www.geoscout.com/demo
Another powerful suite of tools from geoLOGIC industry-leading customer service easy & efficient migration of existing data helping clients increase productivity