
Define Reservoir Parameters with Confidence
Looking to maximize opportunities in today’s volatile market?
Combine the power of PETRA® and IHS Critical Information including well and log data to define reservoir parameters and determine new opportunities faster and more cost effectively.
Let IHS information solutions improve your decision-making and reduce your risk.
For more information on PETRA visit us at www.ihs.com/reservoirsolutions


CSPG OFFICE
#600, 640 - 8th Avenue SW Calgary, Alberta, Canada T2P 1G7
Tel: 403-264-5610 Fax: 403-264-5898
Web: www.cspg.org
Office hours: Monday to Friday, 8:30am to 4:00pm
Executive Director: Lis Bjeld
Email: lis.bjeld@cspg.org
Advertising & Sponsorship Coordinator: Alyssa Middleton
Email: alyssa.middleton@cspg.org
Communications Coordinator: Heather Tyminski
Email: heather.tyminski@cspg.org
Member Services Coordinator: Kasandra Klein
Email: kasandra.klein@cspg.org
Registration Coordinator: Dayna Rhoads
Email: dayna.rhoads@cspg.org
Joint Annual Convention Committee
Convention Manager: Shauna Carson
Email: scarson@geoconvention.org
Convention Coordinator: Tanya Santry
Email: tsantry@geoconvention.org
EDITORS/AUTHORS
Please submit RESERVOIR articles to the CSPG office. Submission deadline is the 23rd day of the month, two months prior to issue date. (e.g., January 23 for the March issue).
To publish an article, the CSPG requires digital copies of the document. Text should be in Microsoft Word format and illustrations should be in TIFF format at 300 dpi., at final size. For additional information on manuscript preparation, refer to the Guidelines for Authors published in the CSPG Bulletin or contact the editor.
Technical Editors
Ben McKenzie Colin Yeo (Assistant Tech. Editor) Tarheel Exploration EnCana Corporation Tel: 403-277-4496 Tel: 403-645-7724
Email: bjmck@telusplanet.net Email: colin.yeo@encana.com
Coordinating Editor
Heather Tyminski, Comunications and Public Affairs, CSPG Tel: 403-513-1227, Email: heather.tyminski@cspg.org
ADVERTISING
Advertising inquiries should be directed to Alyssa Middleton, Tel: 403-513-1233, email: alyssa.middleton@cspg.org. The deadline to reserve advertising space is the 23rd day of the month, two months prior to issue date.
The RESERVOIR is published 11 times per year by the Canadian Society of Petroleum Geologists. This includes a combined issue for the months of July and August. The purpose of the RESERVOIR is to publicize the Society’s many activities and to promote the geosciences. We look for both technical and non-technical material to publish. Additional information on the RESERVOIR’s submission guidelines can be found at http://www.cspg. org/publications/pubs-reservoir-submissions.cfm. The contents of this publication may not be reproduced either in part or in full without
Photo by Ali Dalir Abdinia .

Investing in the Future
At APEGGA we like to make science fun! We also hope to attract the best and brightest students to careers in geoscience. And we remain committed to building strong relationships with the geoscience community. Put that all together and you get an active geoscience outreach and sponsorship program.
In fact, every year APEGGA provides in-kind donations and thousands of dollars to multiple groups as a sponsor of organizations and events including: Burgess Shale Foundation, Canmore Museum and Geoscience Centre, Doodle Train, Geophysics Undergraduate Student Society, Geoscience Day, Honorary Address, Kids in Science Program, P.S. Warren Undergraduate Geological Society, PTAC Spring Water Forum, Rock ‘N’ Fossil Clinics, Rundle Group of Geology, Science Alberta Foundation, Seismic in Motion, Stones and Bones Summer Camp, TELUS World of Science Calgary and Edmonton and W.C. Gussow Geoscience Conference as well as multiple science olympics and science fairs.
That’s because, like you, we see sponsoring geoscience outreach organizations and events as an investment in future human capital and an important opportunity to raise awareness of the wealth generation and quality of life made possible by geoscientists right here in Alberta.
By working with Alberta’s geoscience community, we help to ensure that today’s students become tomorrow’s geoscience leaders.
Investing in the Future: Visit www.apegga.org for more information or call Tom Sneddon, P.Geol., Geoscience Affairs Manager at 403-262-7714 or 1-800-661-7020.
This ad is the seventh in a series


CSPG EXECUTIVE
President John Varsek • EnCana Corporation john.varsek@encana.com Tel: (403) 645-5417
Vice President
Kirk Osadetz • Geological Survey of Canada, Calgary kosadetz@nrcan.gc.ca Tel: (403) 292-7022
Past President
Graeme Bloy • Canada Capital Energy Corporation gbloy@capitalenergy.ca Tel: (403) 975-5784
Finance director
Greg Lynch • Shell Canada Ltd. greg.lynch@shell.com Tel: (403) 691-3111
assistant Finance director
Darren Aldridge • Baker Hughes darren.aldridge@bakerhughes.com Tel: (403) 537-3505
Program director
Scott Leroux • EnCana Corporation scott.leroux@encana.com Tel: (403) 645-2000
assistant Program director
Brett Norris • TransGlobe Energy Corp. brettn@trans-globe.com Tel: (403) 264-9896
serVice director
Ayaz Gulamhussein • NuVista Energy Ltd. ayaz.gulamhussein@nuvistaenergy.com Tel: (403) 538-8510
assistant serVice director
Richard Thom • Core Laboratories Canada Ltd. richard.thom@corelab.com Tel: (403) 250-4052
outreach director
Mike DesRoches • Talisman Energy Inc. mdesroches@talisman-energy.com Tel: (403) 513-6843
assistant outreach director
Steve Dryer • Consultant whiskeyjackresources@telus.net Tel: (403) 969-2292
communications director
Stephen Hubbard • University of Calgary steve.hubbard@ucalgary.ca Tel: (403) 220-6236
assistant communications director
Jim Barclay • ConocoPhillips
Jim.E.Barclay@conocophillips.com Tel: (403) 532-3889
executiVe director
Lis Bjeld • CSPG lis.bjeld@cspg.org Tel: (403) 513-1228
EXECUTIVE COMMENT
A message from the CSPG Finance Director, Greg Lynch

A secure energy future, so now what? Or, how success hurts.
Working late, discussing the next location, we turned to Rita who was emptying the trash; Rita said, “I have heard of this shale gas stuff too you know.” Leaning over the map she pointed her bright yellow Rubbermaid-clad index finger to an empty section and said “Drill here, Einstein”. There is nothing like stating the obvious. Then Rita was off to the next stop on her rounds. I guess you have to start to worry when even the cleaning lady can do your job for you. Or worse yet is having statistics run your program.
Resource play developments are rolling through the countryside with surface access issues, facilities availability, and land expiries dictating the where and when of the next pad. Geologists have been somewhat marginalized in certain instances, and are not used to taking a back seat. In particular, petroleum geologists have taken a hit during a recent wave of mergers, acquisitions, and re-organizations. With large material positions now established in emerging resource plays, geosciences staffing has been reduced due to an increased emphasis on other technical disciplines, coupled with abandonment of conventional areas.
However, despite Rita’s pin-pointing of our next location, the demise of the geosciences has been greatly exaggerated. We just move ahead of the curve. Much of this has to do with scale, both in the details of a play as well as in the big picture, which is where geologists will continue to shine. At a strategic level, new concepts as well as regional assessments steer companies into the right basins in the first place, and once there the detailed work sorts out the optimum recipe for success.
We are however, the victims of our own success. Flush with supply from new resource developments, gas prices have plummeted to rock-bottom levels. Prices should eventually increase again as new gas plants are built and offshore export
facilities established, but some argue that the lag time to do so coupled with continued production increases will equate to low prices for a long time to come. One thing seems apparent on the gas side: our energy future (electricity) is now secure. Certainly we can all benefit from lower gas prices, including of course other sectors of the economy. For this, geologists can take some of the credit. Furthermore the new abundance of natural gas provides a cleaner alternative relative to other options. Anyhow, personally I’m just glad I didn’t sign up recently for the long-term fixed-price promoted by the door-to-door utilities representative – “Sorry, I’ll just wait and see what the market does, but thanks anyways”.
As the fortunes of the oil and gas industry go, so do those of the CSPG. It has been a tough year. Accordingly, some rationalization is also taking place within our programs, trimming here, adding there, but mostly trimming. Activities are being categorized and prioritized, with of course our mission statement underpinning the rankings and decisions being made. In fact, revising the budget has been a recurring theme as we struggle to scale our programs within a shrinking revenue stream. The anticipated revenue for this fiscal year (September 1, 2009 - August 31, 2010) has now been adjusted to $2.1 million, down from an initial $2.5 million forecast in May 2009. This is nonetheless a large budget, placing the CSPG within the top 5% of non-profit organizations in Canada, and reflects the broad scope of endeavors as well as the complex nature of our Society. Furthermore, unlike most businesses, aiming for zero profit makes for a very narrow target and means you are perpetually living on the edge.
However, we have recently taken steps to better monitor our financial health through restructuring our database and
(Continued on page
Choose from over 50 exciting field seminars, short courses and online programs all designed with the goal of helping you explore and better understand the science of this industry. Please see the AAPG website for complete descriptions and registration information. Below are the highlights of courses coming up very soon. Make your plans now before seats get filled! Field Safety Course for Field Trip Leaders, April 1-2, Houston, TX
1-2
Petroleum Exploration in Fold & Thrust Belts, Austin, TX
Assessment of Unconventional Shale Resources Using Geochemistry, New Orleans, LA (with AAPG Annual Meeting)
Practical Salt Tectonics, New Orleans, LA (with AAPG Annual Meeting)
Biomass Energy Basics –A Renewable Energy Certificate Course

CORPORATE MEMBERS
APACHE CANADA LTD.
BAKER ATLAS
CONOCOPHILLIPS CANADA LIMITED
DEvON CANADA CORPORATION
ENERPLUS RESOURCES TRUST
geoLOGIC systems ltd.
GEOMODELING TECHNOLOGY CORP.
HUNT OIL COMPANY OF CANADA
HUSKY ENERGY INC.
IHS
IMPERIAL OIL RESOURCES
LARIO OIL & GAS COMPANY
LITTLE ROCK DOCUMENT SERvICES
MJ SYSTEMS
MURPHY OIL COMPANY
NExEN INC
PENN WEST PETROLEUM LTD.
PETRO-CANADA OIL AND GAS
PETROCRAFT PRODUCTS LTD.
PROvIDENT ENERGY LTD
RPS ENERGY CANADA LTD.
SHELL CANADA LIMITED
SPROULE ASSOCIATES LIMITED
SUNCOR ENERGY INC
TALISMAN ENERGY INC
TECK COMINCO LIMITED
TOTAL E&P CANADA LIMITED
TOURMALINE OIL CORP
AS OF NOVEMBER 29, 2009
accounting system. Over past years the accounting system has not kept pace with the growth and increasing complexity of the Society. Through the diligence and efforts of the CSPG office team, the books are now in order – a fundamental step in ensuring the continued viability of the Society. Auditors recently came into the office to find a well organized, accurate, and auditor-friendly set of records, giving us two thumbs up. We can now better assess where we stand from month to month, and take appropriate actions where needed to control our spending.
Tracking our expenses is critical, but it still does not help increase our revenue which is down in just about all areas: membership, Reservoir advertising, fall Continuing Education short-course registration, Gussow Conference attendance, Technical Luncheon ticket sales, and sponsorship of Technical Divisions, among others. These of course are core items to the Society as well as important sources of revenue. To combat this decline we have implemented web-based tools for registration and
renewals for instance, making it much easier to sign up for a membership or Technical Luncheon tickets. Also, we are working on a new marketing and communications initiative and we are now implementing the new volunteer Management System ( v MS), enabling you to become involved in the Society more easily. Indeed, it is at times like this that the Society can be of most service to its members, providing training and networking opportunities through short courses, volunteer positions, and social events.
So while we can’t change the economy, and are faced with weathering the storm just like everybody else, we do believe that the Society can help you ride out these tougher times. We are committed nonetheless to fiscal discipline and will deliver a program that is aligned with the realities of the present economy, making the adjustments where necessary. But just like mountain weather and the five-minute rule, the economy can suddenly shift. Maybe by the next column I’ll have a rosier forecast, and along with that, will also report back the results of the Rita-01 pad.
MORE THAN A GOOD LUNCH
CSPG Technical Luncheon Committee (...Continued
You may think here is no such a thing as a free lunch, but when you attend a CSPG Technical Luncheon, you definitely get more than what you pay for! In additional to a great meal (complete with dessert), you can get professional development credit for attending the session: each CSPG Technical Luncheon is 1 APEGGA PDH (Professional Development Hours) credit. Another valuable aspect of CSPG Technical Luncheons is the networking opportunity it provides: while enjoying your lunch and learning new geosciences information, you can meet your peers in a professional setting.
The Technical Luncheon Committee continues to bring world-class scientists to share their work with you. Our speakers can be from just down the street or from halfway around the world and the spectrum of topics presented range from the controversial (climate change), to the adventurous (science done in faraway and exotic places), and to the latest exploration trends. There is always something for everyone.
The upcoming schedule begins with a talk by Alan Hildebrand and Ellen Milley on the Buzzard Coulee valley Meteorite. Below is a list of some of the other speakers and topics for 2010:
Toni Simo of ExxonMobil, Houston T x: isolated carbonate platforms and mounds (AAPG Distinguished Lecture Series);
Jerry Osborne, University of Calgary, will present on global warming and the intersection of science and politics;
Jen Russel-Houston, Osum Oil Sands Corporation, Calgary: reducing the footprint of the thermal production operations used to recover heavy oil from the Grosmont;
Guy Plint from the University of Western Ontario, London, ON: Middle Cretaceous Delta complexes on the Western Canada Foreland Basin.
If you have a suggestion for a Technical Luncheon talk, please contact any member of the Technical Luncheon Committee.
Chris Seibel at chris_seibel@nexeninc.com or (403) 699-4558
Riona Freeman at riona.freeman@ harvestenergy.ca or (403) 233-6624
Ryan Mohr at ryan_mohr@nexeninc.com or (403) 699-4755
Tim Bergen at tim_bergen@nexeninc.com or (403) 699-4349
Let’s do lunch!
technicaL Luncheons JANUARY LUNCHEON
A bright multiple fragmentation fireball and meteorite fall at Buzzard Coulee, Saskatchewan, Canada, November 20, 2008
SPEAKER
Alan R. Hildebrand
University of Calgary
CO-AUTHOR
Ellen Milley
University of Calgary
11:30 am tuesday, January 12, 2010
HUGH REID’S 2010 COURSES
PRACTICAL DST CHART INTERPRETATION
(Thorough Basic Course) Feb. 1-4, Apr. 5-8, 2010 (3.5 days)
16 WAYS TO IDENTIFY BYPASSED PAY FROM DST DATA
(More advanced, for those “comfortable” with DST charts) Apr. 21-22, 2010 (2 days)
HYDRODYNAMICS SEMINAR
(Oil & Gas Finding Aspects) Apr. 26-29, 2010 (4 days)
In-house courses available. For course outline visit: www.hughwreid.com 262-1261
telus convention centre c algary, a lberta
Please note:
the cut-off date for ticket sales is 1:00 pm, thursday, January 7, 2010. csPg member ticket Price: $38.00 + gst non-member ticket Price: $45.00 + gst
The 2010 AGM will be held at this Technical Luncheon.
Each CSPG Technical Luncheon session is 1 APEGGA PDH credit.
Tickets may be purchased online at https:// www.cspg.org/eSeries/source/Events/index. cfm.
A bright fireball was widely observed across the Prairie Provinces and Montana during late twilight on November 20, 2008. The fireball and subsequent dust trail, and the shadows cast by the fireball, were serendipitously widely recorded by video cameras. The fireball fragmented multiple times over ~3 seconds with significant fragmentation continuing deep within the atmosphere to ~18 km altitude; three remaining large pieces were individually recorded to shallower than 12 km altitude.
Since the initial meteorite recovery in Buzzard Coulee, SK, Nov. 27, 2008, a strewn field ~13 km long and ~3 km wide with a wind drift tail of an additional ~3 km eastwards has been crudely outlined. Organized searches and the alerted public have recovered more than two thousand individual fragments ranging from <1 g to 13.1 kg mass (totaling >200 kg) during the first year.
Abundant sonic phenomena were reported by witnesses – including anomalous sounds, explosion booms, staccato cracks, and late-stage whirring sounds. The staccato cracks are interpreted as closely spaced arrivals of discrete sonic booms from individual fragments while the latter were still supersonic in the early portion of their dark flight; this type of sound was reported only within ~50 km of the fall. The whirring sounds were reported only within ~20 km of the fall and are interpreted as produced by individual rotating fragments falling to ground while in subsonic dark flight.
At least six North American infra-sound stations (deployed as part of the monitoring mandated by the Comprehensive Test Ban Treaty) detected signals from the fireball. The rich waveforms from many stations offer
the prospect for the first time of resolving which fragmentation events produced signals at which stations with detailed ray trace modeling. The stratospherically ducted peak frequency measured at each of the three calibrated IMS stations are consistently near 0.32 Hz. Using this measurement yields an infrasonic energy estimate for the source of 0.32 ±0.09 kilotons; this energy yield implies an entry mass of ~10 tonnes for the meteoroid.
Buzzard Coulee is an H4 chondrite at the low end of the thermal range and may be transitional to type 3. Two lithologies are contrasted by variation in the chondrule sizes; the finer-grained phase has an abundance of <200 micron cryptocrystalline chondrules. The meteorite is also distinguished by the presence of light-coloured, igneous-textured inclusions up to 8 mm in size. Brecciation is only rarely visible in hand specimen, but where observable the inclusions are found only in the matrix. The meteorites are distinguished by the large number of specimens with immature surfaces (angular shapes with numerous small piezoglypts) presumably reflecting the meteoroids’ late stage fragmentation low in the atmosphere. The low abundance of veins and relatively cryptic brecciation are consistent with the low S2 shock state. Densities span 3.30 g/cm3 to 3.58 g/cm3 with some evidence for a bimodal distribution. The bulk density range mostly reflects porosity variations from 3 to 11%.
BIOGRAPHIES
Alan R. Hildebrand is an Associate Professor in the Department of Geoscience at the University of Calgary where he holds the Canada Research Chair in Planetary Science. After graduating from the University of New Brunswick with a B.Sc. in Geology in 1977, he worked in the mineral exploration industry before turning to a research career. In 1992 he received a Ph.D. in Planetary Sciences from the University of Arizona. His current research is aimed at understanding the small body population (asteroids and comets) of the Solar System and its interaction with the planets.
Ellen Milley grew up in Halifax, Nova Scotia, completing a B.Sc. Hon. Physics at Mount Allison University in Sackville, New Brunswick. Her undergraduate thesis work focused on the light phenomena associated with meteors, a research area that has continued into her graduate studies. She is now a Master of Science graduate student in the Department of Geoscience at the University of Calgary.
technicaL Luncheons JANUARY LUNCHEON
Isolated carbonate platforms and mounds (ICPM): initiation, growth, and demise
SPEAKER
Toni Simo
ExxonMobil, Upstream Research Company, Houston, Texas
11:30 am, thursday, January 21, 2010 telus convention centre, calgary, a lberta
Please note:
the cut-off date for ticket sales is 1:00 pm, monday, January 18, 2010.
csPg member ticket Price: $38.00 + gst non-member ticket Price: $45.00 + gst.
Each CSPG Technical Luncheon is 1 APEGGA PDH credit. Tickets may be purchased online at https:// www.cspg.org/eSeries/source/Events/index.cfm.
Isolated carbonate platforms and mounds (ICPM) originate on topographic highs in
shallow marine waters and are surrounded on all sides by deeper-water environments. Comparative studies of modern and ancient isolated platforms allow insights into mechanisms that control the platforms.
Detailed information on the organisms and environments of deposition can provide insights into the dominant controls on facies type and dimensions today. However, there is a challenging lack of information regarding how the facies and size change through time. This challenge can be addressed through high-resolution seismic images, which provide sequential and spatial information and allow for comprehensive analysis on ICPM initiation, amalgamation, and demise.
Two- and three-dimensional seismic surveys from Southeast Asia show internal seismic geometries and positions of margins, providing clues on the evolution of the ICPM. Mounds initiate as small positive features that amalgamate to form platforms of different sizes and geometries prior to drowning. The distance between the mounds appears to be the first-order control on amalgamation and ultimate platform size.
Understanding the feedbacks between mound amalgamation and carbonate production
technicaL Luncheons FEBRUARY LUNCHEON
Reefs
under stress –
Bermudian reefs and their Devonian counterparts
SPEAKER
Bill Martindale Consultant
C O -AUTHOR
Noel P. James
Queen’s University
11:30 am, m onday, February 8, 2010 telus convention centre, calgary, a lberta
Please note: the cut-off date for ticket sales is 1:00 pm, Wednesday, February 3, 2010.
csPg member ticket Price: $38.00 + gst. non-member ticket Price: $45.00 + gst.
Our understanding of ancient carbonates is based on comparisons with modern analogues. The Bahamas and southern Australia are
synonymous with modern tropical and cool water carbonate realms, yet analogues such as these represent end members in the carbonate depositional spectrum. Bermuda occupies a mid-Atlantic location well beyond the range of reef-building corals but is paradoxical in that shallow-water reefs of both “tropical” and “temperate” aspect are currently forming on this mid-ocean atoll. Clearly, one or both systems is stressed and operating at the limit of its environmental range. We believe that many Devonian reefs in western Canada similarly exhibit signs of environmental stress.
Bermuda lies in the Gulf Stream and yet is subject to profound annual cooling – sea temperatures fall as low as 18°C in winter. It is a biologically driven carbonate system - there are no muddy tidal flats or ooid shoals. Reefs range in size from small pinnacles and patch reefs to larger shelf reefs and are constructed predominantly by domal and hemispherical corals. Other components include branching corals, hydrozoans, and various calcified algae.
Co-existing with these “tropical” Caribbean coral reefs is a reef community of distinctly “temperate” water affinity. vase-shaped cup reefs 5-10m high grow along the Bermuda platform margin. Superficially they appear devoid of framework components, other than
will have implications for predicting control mechanisms and building conceptual models. High amalgamation rates imply large areas of shallow-water carbonate deposition and high carbonate production resulting in the formation of mega-platforms. Smaller areas of shallow-water deposition tend to drown faster when environmental conditions deteriorate and platforms cannot keep up with increased accommodation.
Modern and ancient datasets are used in parallel to evaluate what and how certain processes control initiation, growth, and demise of isolated carbonate platforms and mounds. This allows us to predict the controls for ancient ICPM, thus establishing a framework of rules for predictive conceptual models.
BIOGRAPH y
Toni Simo completed his B.Sc., M.Sc., and Ph.D. in Geology at the University of Barcelona. He is currently Research Associate for Upstream Research Company, ExxonMobil. Before that he was a professor at University Polytechnic Barcelona and before that, a professor at the University of Wisconsin. Some of his previous publications include Controls on Carbonate Platform and Reef Development, Advances in Carbonate Sequence Stratigraphy, and Cretaceous Carbonate Platforms.

a few small corals. Closer inspection reveals a framework of laminar intergrowths of crustose coralline algae, Millepora, and encrusting calcified vermetid gastropods. Synsedimentary cementation results in a wave-resistant structure. Growth cavities are populated by an encrusting biota, in particular the red calcified foraminifer Homotrema. Their laminar framework and abundant cryptic encrusters is reminiscent of Nisku-aged Devonian reefs (e.g., Jean Marie), constructed of thin tabular stromatoporoids, pendant calcified microbial communities, and encrusting stromatolitic laminae.
Both of Bermuda’s reef communities reflect conditions of environmental stress. Are there comparisons that can be made with Devonian reefs of western Canada? Factors
Figure 1. Low angle oblique aerial view of Bermuda, looking southwest.
PETROLEUM INDUSTRY COURSES
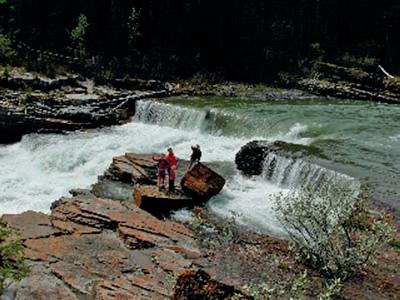
Upper Cretaceous Cardium Formation, below Seebee Dam on the Bow River.
Ayrton
WHO SHOULD ATTEND
New geologists, engineers, geophysicists and landmen, as well as summer students entering the industry fo r the f irs t time will find the courses a very beneficial introduction to the petroleu m industry. T hese courses will be extremely useful to nonprofessional and support staff in the oi l and gas industry, as w ell as accountants, lawyers, brokerage and financial personnel working primarily alongside the oil and gas industry.
TO REGISTER
To register or to obtain additional information regarding in-house and upcoming courses, please contact:
Ayrton Exploration Consulting Ltd.
Tel: (403) 262-5440
Email: ayrtonex@telusplanet.net
Or visit our website: www.ayrtonexploration.com
OVERVIEW OF THE OIL & GAS INDUSTRY IN WESTERN CANADA
Date: March 2nd & 3rd, 2010
Cost: $945 (includes GST)
Instructor: Bill Ayrton
Effective for personnel just joining the oil patch, or for financial, accounting, and information systems personnel.
• Learn about the many facets of the industry.
• Oil finding, land acquisition, drilling, seismic, well completion, jargon and terminology.
GEOLOGY FOR NON-GEOLOGISTS
Date: March 30th & 31st, 2010
Cost: $945 (includes GST)
Instructor: Bill Ayrton
Effective for geological technicians or administrative staff, or for those who just want a better understanding of geology to appreciate the world around us.
• Learn about earth structure, geologic time-scale and processes, Western Canada geology, and interesting nearby locations.
• Participate in a rock identification e xercise, cross-section project and a mini-field trip in downtown Calgary.
GEOLOGY OF THE WESTERN CANADIAN SEDIMENTARY BASIN
Date: May 25th, 26th and 27th, 2010
Cost: $1365 (includes GST)
Instructor: Bill Ayrton
Ideal for those who wish to improve their geological understanding of where and how we look for oil and gas fields in Western Canada.
• To visualize what Western Canad a looked like throughout the stages of history, for example, the position of the sea versus land, what sediments were deposited, and what type of life that existed and evolved.
• To review the importance of each major stratigraphic unit, i.e. Devonian, Mississippian, Cretaceous, etc.
• Discuss the geological and seismic expression of typical oil and gas fields in each unit.
Photo by: Bill

such as low faunal diversity in some coral and stromatoporoid communities suggest stressed conditions. Paleoclimatic reconstructions indicate a tropical epicontinental setting for the Devonian. High water temperatures likely generated thermal and salinity stresses, particularly in restricted settings during times of sea level fall. Sediment input at this time would compound the situation. Abundant microbes and depauperate coral and stromatoporoid faunas in some late Frasnian reefs suggest that excess nutrients were also a limiting factor in reef growth. Clearly, Devonian reefs grew under a greater range of environmental conditions than “classic” Caribbean analogues would suggest.
BIOGRAPHIES
Bill Martindale is a Calgary-based professional geologist with over 30 years of experience working with carbonate hydrocarbon reservoirs. Martindale received his B.Sc. from the University of Reading in the UK and a Ph.D. from the University of Edinburgh, Scotland, where he studied Holocene and Pleistocene reefs of Barbados. For the past 15 years Martindale has operated a successful consulting company, specializing in the nature, distribution, and quality of carbonate reservoir rocks in the Western Canada Sedimentary Basin. For 14 years prior to this, he was the carbonate specialist with a mid-sized, Calgary-based exploration company. In 2006, Martindale took on the role of adjunct professor at Queen’s University. Recently, Martindale spent one year with Petro-Canada as a staff geologist working carbonate plays throughout North America.
Martindale has worked Silurian, Devonian, and Mississippian carbonate plays throughout the WCSB and Alaska. He has published numerous papers, reports, and multi-client studies and has given many talks and core-based workshops to industry and universities over the years. For the past 11 years, Martindale has partnered with Noel James and Jeff Packard to offer a series of very successful industry courses focused on
technicaL Luncheons FEBRUARY LUNCHEON
Phanerozoic structural evolution of Eagle Plain, Yukon
SPEAKER
Larry Lane
Geological Survey of Canada
11:30 am, tuesday, February 23, 2010 telus convention centre, calgary, a lberta
Please note:
the cut-off date for ticket sales is 1:00 pm, thursday, February 18, 2010. csPg member ticket Price: $38.00 + gst non-member ticket Price: $45.00 + gst.
As a northern Cordilleran “intermontane” basin, Eagle Plain (northern Yukon) was shaped by multiple tectonic events throughout its Phanerozoic history. This structural history is fundamental to our understanding of the basin’s petroleum potential. Of 35 wells drilled in the basin, all but three were spudded between 1957 and 1978, most on large surface structures. In the past 20 years, major advances have been made in defining the basin’s regional architecture and structural evolution, and their impact on the basin’s petroleum prospectivity.
With the breakup of Rodinia in Late Neoproterozoic time, the Franklinian (Arctic) margin formed in the north and the paleoPacific margin formed in the south. Eagle Plain sits atop a continental promontory that was left behind at the junction of the two margins. This promontory remained subaerial until Early Cambrian time, when the Richardson Trough, was initiated, separating Eagle Plain from the Mackenzie Platform to the east. Richardson Trough, having developed as a fundamental crustal scale rift structure in the early Paleozoic, would be reactivated periodically throughout Phanerozoic time.
The tectonic record for Eagle Plain in the late Paleozoic and early Mesozoic is poorly defined locally. Regionally, collision of continental fragments and magmatic arcs on the paleo-Pacific margin initiated early phases of Cordilleran orogenesis, culminating in the collapse of the Selwyn Basin into fold and thrust belts, followed by emplacement of mid-Cretaceous granitic plutons that plug regional structures. These southern ranges shed clastic debris northward across the area through Late Cretaceous time, accumulating up to two kilometres of strata deposited unconformably across Jurassic to Early Cretaceous rocks.
To the north, initial rifting of the nascent Canada Basin (Arctic Ocean) was underway by the Middle Jurassic. In northern Yukon, rifting culminated in Albian time with the
Mississippian and Devonian carbonate reservoir rocks in western Canada.
Noel James is Professor and holder of a Research Chair at Queen’s University in Kingston Ontario where he teaches sedimentary geology and oceanography. He received his B.Sc. (Geology) from McGill University, M.Sc. (Oceanography) from Dalhousie University, and Ph.D. (Geology) from McGill University. In the following years he worked for the petroleum industry in Calgary, helped establish the Comparative Sedimentology Laboratory at the University of Miami, taught at Memorial University of Newfoundland, and has been an Industrial Fellow at Marathon Oil Company research laboratories.
James’ research concerns the sedimentology and diagenesis of carbonate sediments and rocks throughout geologic history. He is currently engaged in researching the cool-water carbonate depositional realm, particularly in the Southern Ocean and in late Paleozoic limestones worldwide. He has written and co-edited books on Modern and Fossil Reefs, Cool-Water Carbonates, Paleokarst, Facies Models, and Precambrian Limestones. He is a fellow of the Royal Society of Canada, and has received the Logan Medal from the Geological Association of Canada, and the Twenhofel Medal from SEPM, the highest awards of these societies.
sponsored by
development and infill of massive faultbounded graben systems such as Kugmallit and Blow troughs. Several grabens are imaged seismically in the northern part of Eagle Plain, and probably date from the early stages of rifting.
Tertiary development of the northern Yukon fold complex and adjacent north-eastern Brooks Range shaped the present Eagle Plain basin and produced broad north-trending folds, detached on décollements in the Proterozoic succession. In the western side of the basin, deformation is more intense and the structures are predominantly thrust faults. Tertiary folds and thrust faults have thickened both the late Paleozoic succession (locally four kilometres thick) as well as the Cretaceous succession up to two kilometres thick, providing mechanisms for local burial of source rocks as well as trap formation. Tertiary triangle zones marginal to the basin remain untested for hydrocarbon resources.
BIOGRAPH y
Larry Lane is a Research Scientist with the Geological Survey of Canada and leader of the Yukon Basins Project, in the Geo-Mapping for Energy and Minerals (GEM) Program. Lane is a structural geologist with over thirty years’ experience in bedrock mapping, and structural and tectonic synthesis in the Canadian Cordillera, northern Yukon, Beaufort-Mackenzie Basin and circum-Arctic region. Since joining the GSC in 1986 he has also led major projects under the Frontier Geoscience Program and NATMAP.
Figure 2. Typical assemblage of Caribbean-type reefbuilding organisms on the Bermuda platform.
2009 CSPG AWARDS
President’s Special Recognition Award
Gordon Williams
Presented to individual CSPG Members, institutions, or organizations whose sustained efforts have brought great honor and distinction to the Society and to the geoscience community, or have provided significant, outstanding, and sustained contributions to Canadian petroleum geology.
Stanley Slipper Gold Medal
Michael Rose
The Stanley Slipper Gold Medal was established in 1989 and is the CSPG’s most prestigious award. The award is named for Mr. Stanley E. Slipper (1890-1982) who was the Alberta Society of Petroleum Geologists first President and a pioneer of early exploration efforts in Alberta. The contributions of the winner of this award encompass activities related to aspects of petroleum exploration such as the following: initiating and / or leading exploration programs, teaching and / or training and mentoring of explorationists, innovative exploration concepts, and involvement and demonstrated leadership within geological societies and professional organizations.
RJW Douglas Medal
James Dixon
Presented annually for outstanding contributions to the understanding of sedimentary geology in Canada, commending major contributions to regional tectonics, petroleum, and structural geology.
President’s Award
Tony Cadrin
The highest volunteer award presented in a year. It recognizes a CSPG Member who has contributed to the society through outstanding service, and is chosen by the CSPG President at the end of their operating year.
Link Award
Jon Noad
“The Sedimentology of Ancient Mangroves: Swamped with Hydrocarbon Potential.”
Presented June 18, 2009 at the Calgary TELUS Convention Centre. The Link Award is awarded for the best oral presentation at one of the Society’s Technical Luncheons.
Honorary Membership
Ashton Embry John Maher
Rick Young
Awarded for distinguished service to the Society. Honorary memberships are awarded to persons who have made outstanding contributions to the Society, earth scientists who have made outstanding contributions to petroleum geology on a national or international basis, and Past Presidents at the age of retirement.
Medal of Merit
Daniel J.K. Ross R. Marc Bustin
“Characterizing the shale gas resource potential of Devonian-Mississippian strata in the Western Canada Sedimentary Basin: Application of an integrated formation evaluation.” AAPG Bulletin, v. 92, No. 1 (January 2008), p. 87-125.
Awarded annually to authors of the best paper published during the previous year on a subject related to the petroleum geology of Canada.
Medal of Merit Honorable Mention
Stacy C. Atchley David M. Cleveland Lawrence W. West
“A case for renewed development of a mature gas field: the Devonian Swan Hills Formation at Kaybob South field, Alberta, Canada.” Bulletin of Canadian Petroleum Geology, v. 56, no. 2 (June 2008), p. 165-190.
HM Hunter Award
Peter Harrington Peter Hay
Presented to CSPG members who have provided long-term service to the Society in a variety of capacities.
Tracks Award
Norbert Alwast
Mike Cecile
Travis Hobbs Ben McKenzie
Chris Seibel
Presented to CSPG Members who have made outstanding contributions to CSPG through committee or other work. The award is designed to recognize individuals who have set new standards of excellence within the Society – those who have made “tracks” for others to follow.
Service Awards
Philip Benham Peter Boyle
Mark Caplan Barrie Dargie
Foon Der Ian DeWolfe
Steve Donaldson Ned Etris
Andrew Fox Stephen Grasby
Darcie Greggs Denise Hodder
Michele Innes William Jamison
Peter Kouremenos Mike LaBerge
Therese Lynch Blair Mattison
Jessie Mitton Guillaume Nolet
Claude Ribordy Eileen Scott
Darren Steffes Martin Teitz
Richard Willot
Given to members of CSPG who have contributed to the welfare of the society through committee or other volunteer work, generally awarded for 5-10 years of service on a CSPG committee and for exiting committee chairs, or volunteer service on multiple committees.
Volunteer Awards
Presented every year to those members of the CSPG who have demonstrated significant service to the Society through volunteer work.
volunteer Awards – Two years of service
Mitch Allison Tim Bergen
Andrew Cook Tom Cox
Markus Ebner Dan Edwards
Vince Ekvall Samantha Etherington
Simon Haynes Shawn LaFleur
Steve Larter Tim McCullagh
Ryan Mohr Marianne Molgat
Jon Noad Megan O’Reilly
Kyla Poelzer Mike Rogers
Sandra Rosenthal Justine Sagan
Claus Sitzler Heather Slavinski
Tom Sneddon Clint Tippett
volunteer Awards – Three years of service
Tracy Allen Pratt Barndollar
Julia Baumeister Tina Donkers
Riona Freeman Chad Glemser
Ernie Greenwood Carrie Jeanes
Debbie Legaspi Erin Linley
Brenda Pearson Mark Radomski Weishan Ren
volunteer Awards –Four or more years of service
Megan Barefoot David Caldwell
Allan Carswell Penny Colton
Jennifer Dunn David Garner
Aaron Grimeau Adam Hedinger
Dawn Hodgins Wim Jalink
Cory MacNeill Indy Raychaudhuri
Kevin Root
diVision taLKs INTERNATIONAL DIVISION
In search of a new (old) play in the infracambrian petroleum system in the Bikaner Basin in Rajasthan
SPEAKER
Miles Leggett
GeoGlobal Resources Inc.
12:00 noon
Wednesday, January 13, 2010 encana a mphitheatre, 2nd Floor e ast end of the calgary tower complex 1st street and 9th avenue s.e . calgary, a lberta
The Bikaner-Nagaur Basin in Rajasthan, India, is a proven petroleum basin with the potential for billions of barrels of additional

reserves. The Basin has undergone two extensions and two compressions in the last 600 million years, preserving Precambrian structures that filled with hydrocarbons during the Permian, sourced from infraCambrian rocks. This hydrocarbon system is contemporaneous with and linked to the prolific and well understood Ghaba and Fahud Salt Basins of Southern Oman. The Oman province has been assessed at containing 11.3 billion bbls of recoverable oil.
A recent (2008) 1,600 square kilometre 3D seismic survey has enabled the exploration team to view this exciting basin with new eyes, opening up the potential for deeper prospects in these ancient sediments in two exploration blocks located to the west and east of a billion-barrel heavy oil field. The burial history of the deeper prospects on the flanks indicates that there is a greater chance of finding lighter oil in significant quantities in the Precambrian Jodphur sands, with excellent reservoir quality.
Interpretation of the 3D seismic dataset leads us to believe that there may be preserved Precambrian sediment below what has
been traditionally thought of as economic basement, but never fully explored. These deeper targets have never been penetrated but are to be added as a tertiary target in the first phase of exploration drilling.
BIOGRAPH y
Miles Leggett, currently the Geophysicist at GeoGlobal Resources Inc. has 17 years experience of reservoir characterization in oil and gas basins worldwide. He spent the last four years working for GeoGlobal Resources in all phases of the E&P cycle. Prior to this Leggett worked for Fugro-Jason in various parts of the globe and British Gas in the U.K. He has a B.Sc. in Geophysics from The University of Edinburgh and a Ph.D. from Durham University.
INFORMATION
There is no charge. Please bring your lunch. The facilities for the talk are provided complimentary of EnCana and refreshments by Geochemtech Inc. For further information or if you would like to give a talk, please contact Bob Potter at (403) 863-9738 or ropotter@telusplanet.net or Trent Rehill at (403) 606-6717 or trehill@ kulczykoil.ca.
Loring Tarcore Labs
diVision taLKs STRUCTURAL GEOLOGY DIVISION
Transtensional fault networks: similar fault geometries in highly variable tectonic settings
SPEAKER
Robert Brady
Husky Energy
C O -AUTHOR
Rick Schroeder
University of Calgary
12:00pm – 1:00pm
t hursday, January 14, 2010
room LPW-910, Livingston Place West
250 2nd st s W
c algary, a lberta
Transtensional fault networks, which simultaneously accommodate both strikeslip and extension, display similar geometries over a wide range of scales and tectonic settings; this permits the use of a relatively simple geometric model that has considerable predictive power in a range of settings. The most important piece of this model is the recognition of a typical map-view rhombic fault pattern. This fault pattern has often been interpreted around pull-apart basins along strike-slip systems (also known as rhombochasms), but also appears to be common in extension-dominated regions and in regions with only very minor transtensional deformation. When coupled with some understanding of tilting patterns adjacent to normal or oblique-slip faults, this simple model allows prediction of facies distributions and probable structural trap locations.
Case studies will be used to illustrate typical transtensional geometries in very different settings. The similar fault patterns that are seen in these different tectonic settings give credence to the idea of applying this
relatively simple geometric model in many areas. Interestingly, the patterns of faulting, facies distribution, and isopachs of Mesozoic units in the vicinity of the Peace River Arch seem to fit with a simple transtensional faulting model; suggesting that the area might be better understood by thinking in terms of transtensional deformation, rather than simple extension and/or compression.
BIOGRAPH y
Robert Brady is currently a Senior Staff Geologist at Husky Energy, and an Adjunct Associate Professor at the University of Calgary. Brady received a B.Sc. (First Class Honours), Geology (1993) from the University of Calgary, and M.Sc. (1995) and Ph.D. (1998) degrees in Geology from Caltech, Pasadena, California.
Brady has led and conducted numerous structural, geophysical, and geochronological studies; including regional geologic studies in the Basin and Range Province of the southwestern U.S., and along the strike-slip fault systems of California, as well as work on slip rates of normal faults in the Baikal Rift, Siberia.

diVision taLKs PALAEONTOLOGY GEOLOGY DIVISION
Darwin’s origin of species: a guided tour
SPEAKER
Dr. Jeremy Fox
Department of Biological Sciences, University of Calgary
7:30 Pm
Friday, January 15, 2010
mount royal university, room B108 calgary, a lberta
Charles Darwin’s On the Origin of Species was published on or about November 24, 1859. It was an immediate sensation, sparking the first truly public scientific debate in history. Darwin’s ideas remain the foundation for evolutionary biology today, and the implications of his ideas continue to be debated. Fox will present a guided tour
of the first edition of Darwin’s revolutionary book. Compared to later editions, the first edition is the clearest and most forceful statement of Darwin’s ideas, and turned out to be the most correct statement. The tour will include highlights from each chapter and remarks on how Darwin’s ideas have stood the test of time.
BIOGRAPH y
Jeremy Fox earned a B.A. in Biology at Williams College (USA) in 1995, and a Ph.D. in Ecology & Evolution at Rutgers University (USA) in 2000. He spent four years as a postdoctoral researcher at the NERC Centre for Population Biology at Imperial College London, Silwood Park (UK) before joining the University of Calgary’s Department of Biological Sciences in September 2004. He is currently an Associate Professor. In 2008-2009 he served as the lead organizer for a year-long series of events marking Charles Darwin’s 200th birthday and the 150th anniversary of the publication of Darwin’s On the Origin of Species.
I NFORMATION
This event is jointly presented by the Alberta Palaeontological Society, Mount Royal College, and the CSPG Paleontology Division. For details or to present a talk in the future please contact CSPG Palaontology Division Chair Philip Benham at 403-691-3343 or programs@albertapaleo. org. Visit the APS website for confirmation of event times and upcoming speakers: http:// www.albertapaleo.org/.
REMOTE SENSING FOR GEOLOGISTS II
Reality Check: Why
you can’t get any image you want, and the most common automated processing
| by Dr. Mryka Hall-Beyer
In last month’s introduction to Remote Sensing (RS) for Geologists, I defined RS as having to do with digital images of Earth’s surface acquired (mostly) by satellites. These images come in various spatial resolutions (how much detail is visible) and in different numbers and locations of wavelength bands. Images come at different expense, ranging from quite expensive to no cost to the user (NASA prefers this term to ‘free’, correctly pointing out that there is indeed a cost to taxpayers!).
Many people suffer from what we might call the ‘Google Earth Fallacy’, since we extrapolate from the huge amount of data that appears on that website to the idea that anything is possible. If you have such a large budget that you can fly aerial images for your project, and plenty of time and logistics flexibility this may be true. However those conditions almost never apply, especially in current economic times, and even if they did they would rarely be the best use of resources. This month, I will explain some of the theoretical and practical limitations of image acquisition, and also introduce the most widespread of automated information extraction techniques.
W H y WOULD yOU WANT TO USE RS
The main reasons a geologist would want to use RS are to see a large area at a single moment in time (synoptic imagery), to reconnoitre remote or inaccessible places, and to generate data layers or maps for interpretation. The other common requirement for images, namely repeatedly seeing the same area, is usually less important for geology, although rapid changes in ground conditions can be very important in volcanology, glaciology, and neotectonics.
If RS can’t do everything, what can it do? There are some limitations inherent in technology – this is rocket science! –and some trade-offs must be made. I will concentrate on the cheapest, most easily used images: the moderate-resolution Landsat series mentioned last month. The principles can be extended to other image series, however.
offices is an ‘image’ of the world from space. Seeing these, people think “Oh my, they can just take a snapshot of the whole Earth any time they want.” There are features of those wall hangings that should immediately clue us in that this statement is false. First, there are no clouds. Second, it is summer in both hemispheres, and third, the image is projected on a flat map! No snapshot this. Similarly, the zoom function on Google Earth makes one think that any image can be seen at various levels of detail. But check again: many areas are severely limited in detail. Both these images are carefully built up from many individual small images selected from a long time period. It is true that we have a series of weather satellites that continuously image subcontinent-sized swaths of the surface and download an image every few minutes, allowing us to build the animations seen on weather websites (for example http://www. weatheroffice.gc.ca/satellite/). These have neither the spatial nor spectral detail useful for geology.
CONTROLS OF MODERATERESOLUTION IMAGE ACqUISITION
A satellite is not an airplane that can be guided around near-Earth space like a hobbyist’s balsa plane. Once positioned in orbit, the satellite carries only enough fuel to perform small and infrequent position corrections. The satellite’s position at any given time results directly from its orbit design. The orbit needs to be as close to circular as possible, so pixels will always be the same size. Next, the orbit is chosen after a complex calculation of the relation between the sun angle on the ground and the time it takes for the satellite to complete an orbit. The nearly universal
solution for sensor-carrying satellites is a sun-synchronous orbit tilted about 9 from due N-S. This orbit assures that every time the satellite passes over any given spot on the surface, the local time of day is the same. The favoured time is in mid-morning; the exact time varies with latitude. Landsat 7, for example, passes over Calgary at about 9:30 a.m. +/- 15 minutes local sun time – about 11:00 a.m. clock time on daylight savings. Morning is generally less cloudy and the air is less hazy.
The daytime pass is the ‘descending’ orbit, the satellite moving north to south. Of course, if the satellite overflies one side of the Earth in the morning, the other ‘ascending’ half of the orbit will be at night. At first the night images were not recorded, but later they were kept, and have yielded interesting information on volcanoes (Ganas and Lagios, 2003), coal fires (Kuenzer et al., 2007), and forest fires (Figure 1) as well as images of intensity of artificial lighting at various places (see for example London Tourism, 2006). However, because of the orbit you will be unable to get an image acquired at, say, 3 p.m., should you want to for some reason. I have used Landsat as an example, but all imaging satellites are in
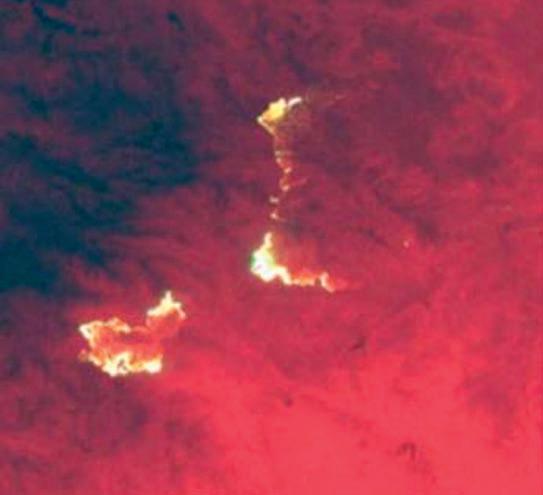
Figure 1. Landsat night-time (ascending node) image of forest fires in California, 2006 (source: http://landsat.usgs.gov/gallery_view.php?category=orangeflag&t hesort=mainTitle).
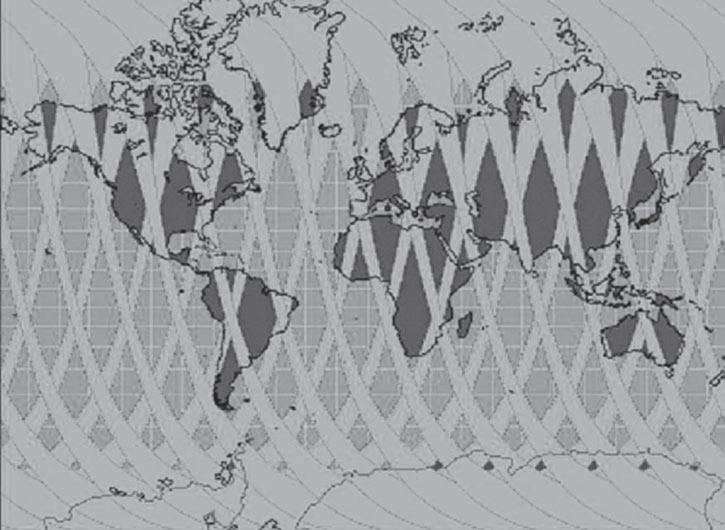
Figure 2. One day’s paths for one sun-synchronous orbit. Ascending and descending paths are both shown, at reversed angles. Successive paths do not adjoin one another in mid to low latitudes; there is increasing overlap at high latitudes. Paths differ between satellites, but the pattern is the same. Apparent increase in path width at higher latitudes is an artefact of the map projection (source: CCRS, 2008).
sun-synchronous orbit, though the particular characteristics vary from one to another.
Developing this kind of orbit automatically controls how often the satellite will repeat its exact path. It also means that two paths do not occur adjacent to one another. Landsat repeats its path every 16 days, and adjacent paths are acquired several days apart. If you need to mosaic images across a path boundary (i.e., one image is east or west of the other) you will not have them from the same day. Some corollary of Murphy’s Law must state that most field areas do require an across-path mosaic! Figure 2 illustrates the paths for one day. Closer to the poles, the same ground is imaged more often as the paths overlap. At high latitudes, you might see a particular ground location on the left in an image from one path and on the right in another, on images more frequent than the path repeat time. Since the satellite orbits at about 700 km altitude, there is little difference in viewing angle from one side of the image to another. The general principle is that you cannot select a specific date for your image, but the higher the latitude the greater the number of possible images to choose from. Luckily, entering the location or area of interest in an image search engine will return all possible images (http://www.landcover. org/data/landsat/).
So far we have considered Landsat and similar images, with a swath about 185 km across and pixels 30m on a side. Satellites with higher, but still moderate, spatial resolution have
narrower swaths and longer repeat times. The trade-off for less area is reasonable file size and download speed. To be more flexible in imaging a desired location at a desired time, the sensors may be tilted. Tilting has obvious advantages for applications where time is of the essence, such as disaster recovery (Navalgund, 2005) or military operations. Tilting also allows stereo imaging and viewing, if this is desired, and construction of digital elevation models. Since rocks usually stay in one place over time, most geologists are less concerned with tiltability.
very high-resolution satellites (pixels under 1m) were never intended to image the whole Earth. Their swaths are about 10 km wide. They can be tilted, and are tasked to look at certain areas when a buyer hires them to do so. Resulting images may have a very oblique look angle or be acquired at odd times of day. When not tasked, these imagers build an archive of commonly requested images. These are mostly of urban areas, because such detail is mostly required by planners or businesses (it is rumoured that WalMart counts cars in its parking lots, though I have not been able to document this). This ordering and tasking explains why highresolution images are very expensive.
These spatially detailed imagers usually have only three visible and one nir band, and so lack the extra information about rock type provided by the swir bands (see last month’s article). Geologists would use them to look at surface relief and identify exposed rocks
distinctive in these bands. In looking for relief, oblique-look angles or shadows might be an advantage (see below). Overall, though, the image geometry may be quite complex and create problems in accurately locating points, thus limiting the precise mapping that high resolution is intended to provide. As users of aerial photographs will recognize, the tilt angle also makes the pixel size variable (Wolnieiwcz, 2009). It is possible to specify maximum look angles when ordering, but that limits possible time on task and increases the likelihood of cloud contamination (see GeoEye, 2006, as an example). In sum, highresolution satellites approach aerial imaging in terms of their problems, lack its flexibility, and may be close in cost – so are less often used for geological applications.
SHADOWS AND IMAGE DATE
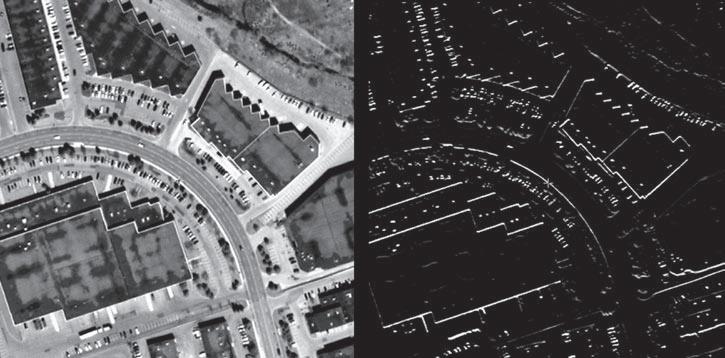
Shadows are usually avoided by image analysts. Nevertheless, shadows often highlight topography linked to rock structure, such as faults, folds, lineaments, or differential erosion. Even for the same overpass time, shadow length will vary with the date. Near the summer solstice, shadows will be at their minimum, but still present. Mid-winter images would have the most oblique sun angle, but as Canadians know by sad experience, in winter there simply is not very much total sunlight to be reflected and recorded by the sensors. Geologists wanting shadows will prefer an image in spring or early fall, when sun angle is lower but total light is not too diminished. Snow might enhance shadows, and will reflect more light, so some winter images might be useful. If lineaments and shadows are your sole interest, you would probably be better off using radar images. I will discuss these in detail in a later article. Image processing allows many digital enhancements that either brighten or isolate linear features for visual interpretation; figure 3 shows an example.
CLOUDS
Just because a satellite is busily imaging your field site does not give you a usable image. It cannot see through clouds, and no amount of fiddling with algorithms will make those clouds go away. It is possible to reduce haze, most simply by not using the shorter wavelength bands, especially blue. Our atmosphere most strongly scatters light of blue wavelengths (that’s why the sky is blue), and scattering is what interferes with clarity on the image. There are ways to reduce haze in other bands as well, but none is 100% effective. The only way to really ‘see through’ clouds is to use certain microwave wavelengths, but these give quite different information from what we want from the visible and infrared regions. We must simply wait for an overpass day that is clear enough.
(Continued on page 18...)
Luckily for geologists, areas where rocks are exposed at the surface – no vegetation – are generally dry and so have less cloud. The other main area of exposed rocks is the arctic, and it unfortunately is often cloudy there. Arctic cloud is partly offset by the more frequent imaging of high-latitude areas (Figure 2) But still, it is unusual to get more than one or two clear images a year without satellite tilting. Cloud cover percent is part of image metadata, and can be used to pre-reject images greater than a chosen percent cloud. You can also preview an image to see if the cloud is in fact a problem for your particular area of interest. There may be another Murphy’s Law corollary about clouds!
CLASSIFICATION AND MAP MAKING
With image in hand, we turn to automated information extraction. The following will merely scratch the surface of possibilities. RS researchers keep quite occupied customizing, improving, and tweaking algorithms to answer ever more detailed and exotic questions. I will consider well established routines that are incorporated into all image-processing software.
Classification assigns a number to each pixel, representing a feature of interest such as limestone, based on the pixel’s resemblance to some ideal limestone spectral pattern. Classification ideally would produce the equivalent of a ground-drawn map, with neat lines drawn around distinct units that have some meaning with respect to the purpose of the map. But there are problems. Some are common to all mapping: rocks are often covered; strike and dip can only rarely be measured from a distance. Others problems are specific to images. A class of interest might not occupy a whole pixel. You might be interested in two rock types that have the exact same overall colour, even considering non-visible spectral bands. Images classify each pixel separately, although there are more advanced techniques that either create homogeneous ‘objects’ or consider the relation of a pixel to its neighbours. The best that standard automated algorithms can produce is a land cover (LC) classification of spectrally distinct LCs. This may provide the raw material allowing a skilled interpreter to extrapolate contacts and infer formation relationships, just as ground mapping or hand-done aerial interpretation might do.
Last month’s article showed some spectral reflectance curves. Another set is shown in Figure 4. The greater the difference in reflectance at a given wavelength between the various LCs, the more easily that LC can be identified using image information at that
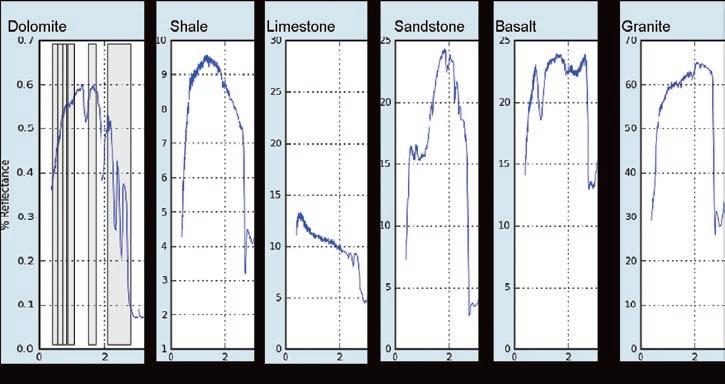
the dolomite example. Any small feature such as a dip or rise that occurs entirely within a single band cannot be distinguished. To use a distinct narrow feature in classification, a narrower sensor wavelength band (hyperspectral sensor) is needed (source: adapted from http://speclib.jpl.nasa.gov/; see Baldridge et al., 2008(9).
wavelength. Comparing curves will to show you if the materials you are interested in are possibly spectrally distinct outside of the visible range. The most complete set of labmeasured spectra is available at no cost from ASTER (Baldridge, 2008(9)). The numerical data can be downloaded into a spreadsheet. The 2008 version contains spectra for 1,748 minerals, 473 rocks and 69 soils, as well as a few other materials. Each includes information such as grain or particle size and a detailed petrologic description. Of course, your actual occurrence may not conform to these ideal specimens. Clark (1999) exhaustively covers the theory of how differences in characteristics may alter spectra.
The second, more common way to decide if you can distinguish your LCs is to look at the image itself. Processing software provides many ways to view the non-visible bands on the screen. The first question, then, is whether your eye can tell LCs apart in some combination of bands. If yes, then you will likely be able to train the computer to do so
automatically. If no, there still may be hope, but the process will be more complicated. There are also computations that will numerically represent the separability of your classes.
T HE CLASSIFICATION PROCESS
If you are doing reconnaissance mapping in a little-known area, you can leave LC class decisions at the first go-round to the computer: this is called unsupervised classification. You must make some decisions, though. How many classes will be produced?
A good bet is to start with two to three times the number you think you will end up with. The computer will then define the requested number of “clusters”, on the basis of colour alone (meaning “colour” in the broad sense of amount of light reflected in all of the input bands, whether our eyes could see them or not). For example, a visible rainbow could be divided into 7 colours or 25, as you choose, but the boundaries between them would be in different places (the paint mixer’s dilemma!). The algorithm will conveniently ignore all colours that do not show up on the image.
Figure 3. Example of automated edge enhancement. This algorithm removes the background image and records horizontal or near-horizontal lines as white. This is a high-resolution (1m pixels) image (source: author).
Figure 4. Spectral reflectance curves of representative samples of some common rocks in the visible-near infrared spectral regions. Vertical scales are different, but distinct patterns can be seen. Landsat bands are illustrated on
The problem, of course, is that once the algorithm is done we have to decide what LC each cluster represents on the ground. We do this by combining visual interpretation, looking at known spectral reflectance curves for various cover types, and experienced intuition. Often LCs we want may be split between two clusters, or may encompass several. At this point we can merge clusters together, but splitting them can’t be done except by starting over with a larger initial number. If this seems to get you nowhere, you may be right – as I said, it is reconnaissance or (to sound better) data exploration.
Fortunately, we often have a good idea of what is on the image. When this is the case, we can use supervised classification. If we have some idea of a few places where each desired LC occurs, we can direct the computer to those places called training sites, and it will automatically create a signature for that class. The signature of an LC is a statistical construct, consisting of the mean and standard deviation of reflectance in each band used, computed over all the pixels in that LC’s training site. The computer then compares the reflectance values of each pixel with each of the LC signatures. The LC that the pixel matches with the greatest probability will be assigned to it. This process depends on our having chosen LC samples that are pretty representative of the LC as a whole. The advantage of a supervised classification is that we know before we start what each LC is. The disadvantage is that we need to have some samples of each proposed LC and their locations. And, of course, the LCs must be different from one another. Murphy’s Law lurks again.
What about the problem of a single pixel containing several different LCs? A 30x30m pixel might be, say, half water and half basalt. There is an advanced technique for coping with this situation, called ‘spectral unmixing’. The output would be several maps, each one indicating the percent of each pixel covered by the chosen class. This technique, interestingly, was developed in the 1980s during planning for Mars missions. On Mars, all we see is rock and ice. The early missions had very large pixels so unmixing was critical. We are limited in number though, and can only unmix (x+1) LCs where x is the number of input bands.
These overview articles are not the place to delve into all the details, particularly of classification techniques. That would require several RS courses! But this gives you an idea of how information can be used in an automated fashion. So far we have covered the most common imagery available, that in the visible and near infrared bands. Next,
we can look at more exotic imagery, namely hyperspectral and the thermal and microwave spectral ranges. So far, we have looked at passive RS, using reflected sunlight. There is also a huge and developing field of active RS, where the sensor emits its own illumination. Since we can control the emitted light, we can get more information from the reflected beam. This field covers RADAR and LiDAR imagery. These will be the subject of next month’s article.
R EFERENCES:
Baldridge, A. M., Hook, S. J., Grove, C. I., and Rivera, G. 2008(9). ASTER Spectral Library version 2.0. Jet Propulsion Laboratory, California Institute of Technology, Pasadena CA. http:// speclib.jpl.nasa.gov/. Accessed 2009-11-12.
Canada Centre for Remote Sensing. 2008. Radar Remote Sensing Tutorial. http://ccrs.nrcan.gc.ca/ resource/tutor/gsarcd/downld_e.php. Accessed 2009-11-12.
Clark, R. N. 1999. Spectroscopy of Rocks and Minerals, and Principles of Spectroscopy, In: Manual of Remote Sensing, Volume 3, Remote Sensing for the Earth Sciences, A.N. Rencz, (ed.). John Wiley and Sons, New York, p. 3-58. Available online from USGS at http://speclab. cr.usgs.gov/PAPERS.refl-mrs/refl4.html. Accessed 2009-11-12.
Ganas, A. and Lagios, E. 2003. Landsat 7 night imaging of the Nissyros Volcano, Greece. International Journal of Remote Sensing, vol. 24, no. 7, p. 1579-1586.
Geo Eye. 2006. IKONOS Imagery Products Guide v. 1.5. http://www.landcover.org/library/guide/ IKONOS_Product_Guide_jan06.pdf. Accessed 2009-11-12.
Kuenzer, C., Zhang, J., Li, J., Voigt, S., Mehl, H., and Wagner, W. 2007. Detecting unknown coal fires: synergy of automated coal fire risk area delineation and improved thermal anomaly extraction. Remote Sensing of Environment, vol. 28, no. 20, p. 4561-4585.
London Tourism. 2006-2009. London By Night Landsat Satellite. http://www.london-city-tourism. com/london-pictures/london-by-night-landsatsatellite-photo.html. Accessed 2009-11-12.
Navalgund, R. R. 2005. Sumatra tsunami of Dec 26 2004. Journal of the Indian Society of Remote Sensing, vol. 33, no. 1, p. 1-6.
Wolnieiwcz, W. 2009. Geometric potential of IKONOS images. Geospatial Development, Geospatial Resource Portal http://www. gisdevelopment.net/technology/ip/wie_3.htm. Accessed 2009-11-12.
DOUG CANT GEOLOGICAL CONSULTING SHORT COURSES 2010
SUBSURFACE TECHNIQUES
SEQUENCE STRATIGRAPHY 22, 23 MARCH - LOG CORRELATIONS, CORES,
Well-log cross-sections - datums, correlations, and criteria for evaluating
Marine, non-marine and channel correlations, with exercises
How to log and interpret cores of major clastic facies of the Alberta Basin
Integration of core interpretation and cross-sections
Subsurface sequence stratigraphy on logs and cores, minimal theory
REGISTRATION: $1375
MANNVILLE EXPLORATION 19, 20, 21 APRIL
Sub-Cretaceous unconformity, overall internal stratigraphy
Detailed sequence stratigraphy (unconformities), sedimentology, trap types, regional context, and play types of all subunits
Well-log correlation and core examples of all major units
REGISTRATION: $1690
ROCK CREEK EXPLORATION 26 APRIL
Stratigraphy, sedimentology, reservoir facies, paleostructures
Identifying the Rock Creek vs. Lower Mannville
Internal correlation and reservoir mapping techniques, three types of traps
REGISTRATION: $850
BOOK CLIFFS FIELD - CLASTIC FACIES, SEQUENCE STRATIGRAPHY, UTAH - for companies MAY or SEPT - OCT SEMINAR
World’s best outcrops of fluvial, deltaic, shoreline and shelf sands
Ferron Sand coal bed methane - facies and trapping
Unconformities on reservoir scales - sequence stratigraphy unravelled
Unconventional gas plays - non-marine to shallow marine examples
Alberta Basin analogs on each outcrop
REGISTRATION: $2600 ,
For information / registration, call (403)949-3810, or 10% discount - 3 or more registrations. Courses can be given in-house. dcant@personainternet.com

ROCK SHOP


PETROLEUM ECONOMICS FOR GEOLOGISTS
Part 4 – Production Forecasting Applications
| by Colin Yeo, P.Geol. and Lionel Derochie, P.Eng.
INTRODUCTION
In the last installment, we reviewed the basic fundamentals of forecasting petroleum production and reserves. We looked at three independent means of determining producing rates and calculating or extrapolating recoverable reserves, namely, volumetric, decline analysis, and material balance methodologies. We also described how type wells are constructed from a group of similar producing wells.
We also saw how cumbersome, iterative, and time-consuming production and reserve forecasting can be. Computing software has made this tedious, but necessary, process faster, easier, more accurate, and, ultimately, cheaper. In this article, we look at how the Energy Navigator suite of products, specifically value Navigator, can make forecasting tolerable.
We are spending a lot of time on this subject because it is a significant variable in the discounted cash flow (DCF) model. It is the geologist who provides rock property values and guides the selection of analog wells that are used to forecast oil and gas production and reserves and ultimately it is the geologist who is accountable for drilling wells that meet or exceed rate and reserve predictions. By using a product like value Navigator, analyzing offset producers and tying volumetric and material balance calculations to them generates an excellent data set that can be used to forecast a deterministic or probabilistic production profile.
PRODUCTION FORECASTS FROM BASIC DATA
As was pointed out in Part 3, simply using the recoverable oil- and gas-in-place (original-oil-
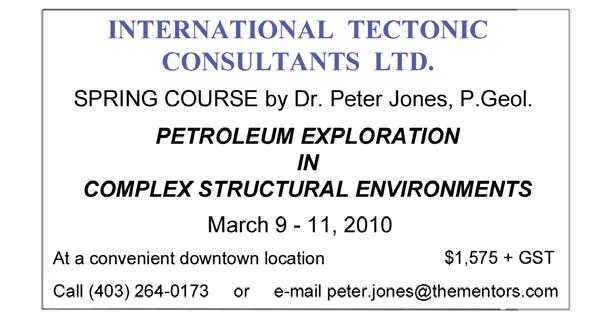
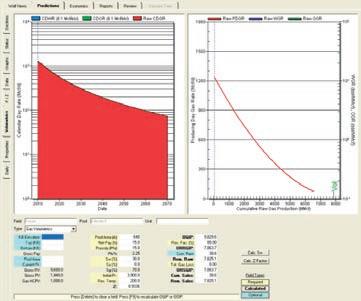
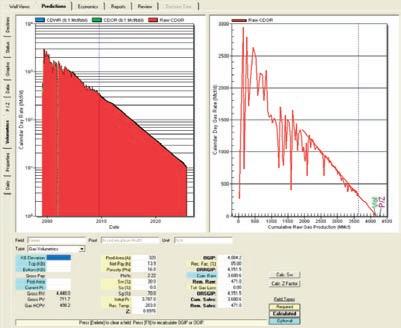
and gas-in-place multiplied by the recovery factor), the initial oil and gas rate from the Darcy Radial Flow Equation, or the gas well inflow equation and estimating the decline exponent based on a knowledge of the reservoir and expected fluids, value Navigator can generate a production forecast. Figures 1 and 2 show a production and reserve forecast for an Ellerslie prospect in west central Alberta that was constructed from basic data.
On the volumetrics tab of value Navigator, values for area, net pay, porosity, gas saturation, pressure, temperature, and recovery factor are entered. For gas, compressibility is calculated from a gas analysis. value Navigator then calculates original oil and gas in place and, by applying the recovery factor, determines recoverable oil and gas in place. This value is plotted as an end point on the x axis of the rate vs. cumulative production graph. Data from the example prospect has been entered as shown in Figure 1. OGIP is 9.8 Bcf and RGIP is 7.9 Bcf using an 80% recovery factor.
After an initial oil or gas rate is calculated using the Darcy equation or the gas well inflow equation, by switching to the Declines tab, this value can be entered as an initial point on the Y axis of the rate vs. cumulative production graph. Figure 2 shows an initial producing day gas rate (PDGR) of 1.25 MMcf/d has been entered along with a decline exponent (n) of 0.5. The decline exponent was selected based on the low permeability nature of the reservoir (see Figures 6 and 7 in Part 3 of this series).
With this information, value Navigator constructs a production forecast that can be
used in the DCF model. This forecast was generated with very little data but does come with a great deal of uncertainty as explained in Part 3.
PRODUCTION FORECASTS FROM DECLINE A NALySIS
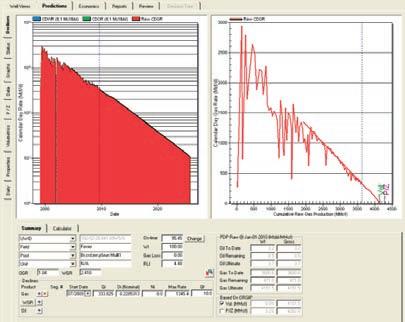
This Ellerslie prospect was drilled in 1998. The well was perforated, frac’d, and put on stream in January, 1999. The well experienced intermittent production over the next several months and averaged approximately 2.9 MMcf/d in its first 85 days. Over the next 10 years, the well produced about 3.7 Bcf and is expected to ultimately produce 4.2 Bcf. Figure 3 (page 22) shows the production history of the well and the forecast of future production.
The regression line, which also predicts future production, fits the data well. You will recall that the forecast of rates and reserves using the volumetric method generated an initial production of 1.25 MMcf/d and recoverable reserves of 7.8 Bcf. This well had an IP of 2.9 MMcf/d but forecasts reserves of only 4.2 Bcf. The higher than expected IP was related to a fracture treatment performed on the well that was not assumed in the pre-drill estimate but the lower reserve estimate is thought to be due to a smaller than estimated drainage area. By arbitrarily halving the pool area to 320 acres from 640 and making minor changes from estimated reservoir parameters to actual values, the volumetric ORGIP is reduced to 4.2 Bcf, which is the decline analysis prediction. Figure 4 (page 22) shows the volumetric input values used by value Navigator to calculate and plot RGIP.
value Navigator has the capability of honoring
(Continued on page 22...)
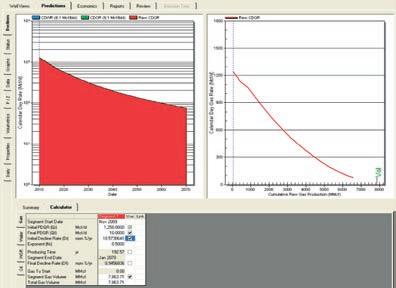
Figure 1. Inputting values into the
Figure 2. Inputting
(...Continued from page 21)
the volumetric estimate while calculating a regression line through actual production data. In Figure 5, by activating the ‘based on ORGIP (original recoverable gas in place) vol (MMcf)’, value Navigator will draw a best-fit line through production data and terminate at the volumetric estimate of 4,151 MMcf. In this example, because RGIP determined by decline analysis is so close to the volumetric estimate, there is virtually no change to the forecast line.
Pressure data is also available on this well and can be used in a material balance calculation. This data is exported to value Navigator with production information from commercial databases. The material balance projection of original gas in place is plotted on the rate vs. cumulative production plot and serves as another anchor for decline analysis. In this well, the P/Z volume, colored purple, is immediately adjacent to the volumetric estimate as shown in green on Figure 6.
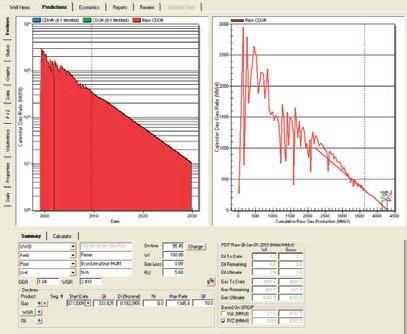
When this option is activated, the regression line passes through the more recent production trend, making an excellent fit to the data, while intersecting with the P/Z value on the x axis. Material balance predicts a reserve of 4,283 MMcf, only slightly more that volumetric and decline analysis. In practical terms, all three methods point to the same reserve volume and gives confidence as to the true RGIP.
Not all wells show such close alignment between different methodologies. Figure 7 is the production from a well drilled later. There is a significant discrepancy between volumetric, decline analysis, and material balance estimates.
The first observation is that the well has actually produced more reserves than predicted by material balance. Upon examining the pressure data, it is found that a static gradient was run. Because this rock is low permeability, sufficient time was not
allowed for a proper buildup to reservoir pressure. Therefore, the P/Z estimate is disregarded. The volumetric estimate, generated by using wellbore parameters, forecasts larger reserves than decline analysis. As previously discussed, volumetric estimates have a large range of uncertainty associated with them because of geological variability and are often discounted in favour of decline analysis estimates. Figure 8 shows reservoir parameters entered into the volumetrics tab of value Navigator with the resulting calculation of RGIP.
With this data entered, the “Based on ORGIP vol” option is chosen forcing value Navigator to find a best-fit regression line that honours both the production data and intersects the cumulative production axis at the volumetric RGIP estimate. The result is shown in Figure 9.
The regression line matching production data and tying to the volumetric RGIP is curvilinear, meaning that the decline exponent
Figure 3. A decline analysis on the Ellerslie well shows a best-fit regression line through later time, pseudo-steady state flow. Ni, the decline exponent is 0 indicating exponential decline. The decline analysis predicts 4.2 Bcf will be produced during the life of the well.
Figure 4. Changing the pool area provides a close match to the decline analysis forecast.
Figure 5. Integrating volumetric estimates of original recoverable gas in place with estimates from decline analysis provides confidence in reserve levels and production forecasts.
Figure 6. By activating the “P/Z (MMcf)” option, the regression line is forced through the P/Z ORGIP volume on the X axis of the rate vs. cumulative production plot.
is not exponential but either hyperbolic or harmonic. Ni has a value of 0.55 and is hyperbolic. This is not unexpected because the reservoir is low permeability. A case can be made that the decline analysis estimate of 3.1 Bcf is conservative and the volumetric estimate of 3.9 Bcf may be reasonable. By considering all the estimates, a range of possible reserve levels can be considered.
Not all gaps between decline estimates and volumetrics can, or should, be closed by forcing the regression line through volumetric RGIP. Figure 10 shows a gap between estimates. Production data is showing no sign of the decline exponent being anything but exponential, so to invoke a sudden change in decline exponent is not appropriate.
By simply adjusting the pool area from 320 acres to 275 acres, a geologically insignificant and reasonable change, the volumetric estimate is very close to the decline analysis estimate (Figure 11, page 24).
There is one other interesting observation. At the beginning of this article, we calculated
the volumetric estimate of reserves for the Ellerslie prospect. RGIP was 7.8 Bcf, assuming a drainage area of 640 acres. Figure 3 is the discovery well for the pool and, you may recall, its drainage area had to be cut back to 320 acres to match decline analysis and material balance estimates. Its reserves are 4,161 MMcf. Figure 10 is the second well in the section and its reserves are estimated to be 3,588 MMcf. Summing the expected reserves from the two wells yields 7.7 Bcf, which is remarkably close to the original estimate based on 640 acres. Because of its lower permeability, downspacing to two wells per section is required to effectively drain a section.
Ty PE W ELLS
So far, we have been analyzing individual well performance and carefully making production forecasts by examining production decline while considering volumetric and material balance estimates. As the Ellerslie prospect is developed, we observe a variation in IP and EUR. Figure 12 (page 24) shows IPs and EURs from wells in the Ellerslie Prospect are lognormally distributed (they plot as a
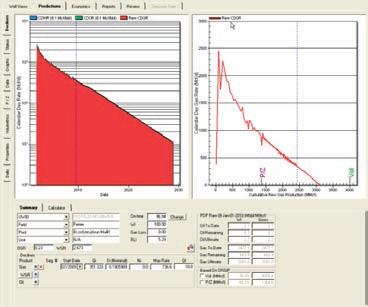
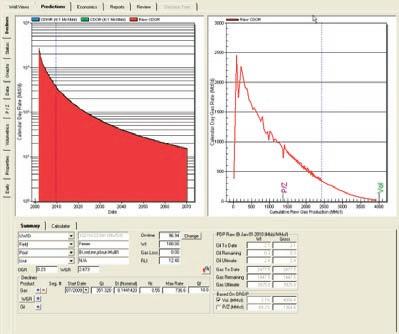
straight line on probability paper) and show significant variation.
As discussed in Part 3, making a timenormalized plot of all wells and averaging production creates a type, or statistical, well. Figure 13 (page 24) is the type well for the 9 wells that define the Ellerslie prospect.
Again, we notice that the volumetric estimate generated by using pool average reservoir parameters is larger than the EUR estimated by decline analysis. Figure 14 (page 24) shows the reservoir inputs that were used.
By forcing the regression line through the volumetric estimate of RGIP, the decline analysis is aligned with the volumetric assessment. Figure 15 (page 24) shows the result.
The type curve is a good representation of the range of rates and reserves that are expected from further drilling in the Ellerslie prospect. Pmean EUR from the probability distribution is 2,509 MMcf compared to (Continued on page 24...)
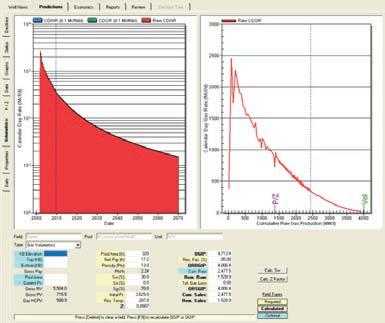
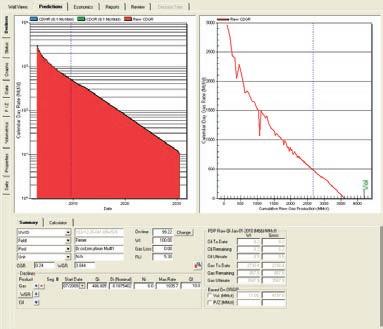

Figure 7. This production plot shows a large variation in reserve estimates using different techniques.
Figure 8. Reservoir data is input into the volumetrics panel to calculate RGIP.
Figure 9. Using the “Based on ORGIP Vol” option, an excellent decline curve fit can be made between production data and the volumetric estimate.
Figure 10. Another well in the area shows different estimates of RGIP when using different methodologies.
By Making a Small Change to the Pool Area, the Volumetric RGIP
Estimate Matches the Decline Analysis Estimate
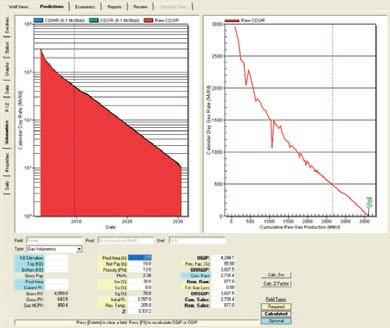
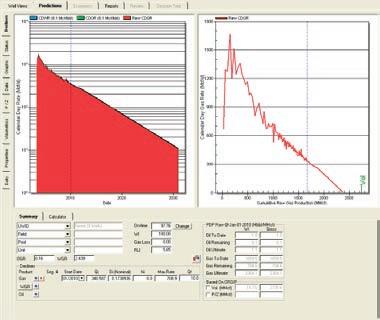
(...Continued from page 23)
2,494 MMcf from the type well. IP from the probability distribution is 1,915 Mcf/d compared with 1,852 Mcf/d from the 90-day producingday-rate average. Breaking the type curve into segments, describing each segment mathematically and then linking all the segments together generates a type well forecast that can be used as an input into the discounted cash flow model. This type curve can be multiplied to simulate drilling programs and can be staggered in time to reflect a continuous drilling program with a resulting aggregate production profile. This kind of economic modeling is more representative of actual operations and yields smoother production growth from drilling programs.
SUMMARy
value Navigator uses enhanced curve-fitting software that considers volumetric RGIP and material balance estimates when performing decline analysis. This allows the evaluator to weigh the importance of reserves estimates from several independent methodologies, which leads to more robust forecasts. variations in single-well production profiles can be accommodated by generating a statistical type well, which lends itself to replication and staggering for program assessments.
value Navigator’s power and simplicity makes forecasting easy and quick. This allows more data to be gathered and processed, increasing production forecast accuracy. An accurate production forecast is key to the discounted cash flow model.
Support for this series is provided by Energy Navigator who have reviewed articles, supplied technical consultation, and critiqued manuscripts. We thank them for their help.
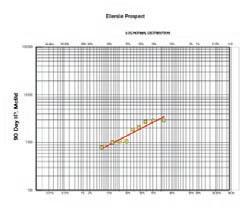
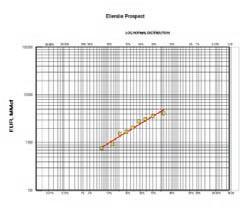
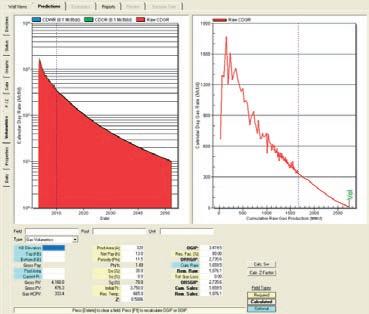
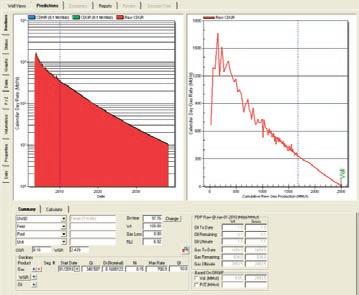
15. The type curve is a very close approximation to Pmean rates and reserves. The decline exponent is a reasonable value.
Figure 11. Slight changes to volumetric inputs align estimates of RGIP.
By Reducing Pool Area 15% to 275 Acres Aligns Decline Analysis and Volumetric Estimates
Figure 12. IP and EUR values from Ellerslie prospect wells follow a lognormal distribution.
Figure 13. Ellerslie Prospect type well.
Figure 14. Average pool reservoir values are used to generate a volumetric estimate of RGIP.
Figure
DON’T MISS CANADA’S
GREATEST CONFERENCE ON EARTH SCIENCES

GEO CANADA 2010
CALGARY, ALBERTA MAY 10–14, 2010
WORKING WITH THE EARTH
GeoCanada 2010 is a once-in-a-decade opportunity for anyone who works with the Earth. This valuable event provides the opportunity to discuss and explore the latest developments across a complete spectrum of Earth Science professions. It is the ultimate opportunity to gain insight into your profession and the Earth, sharing experiences and knowledge with your peers from across Canada.
CALL FOR ABSTRACTS
GeoCanada 2010 is now accepting abstracts for oral, poster and core presentations. The Technical Committee encourages and supports proposals from all facets of the Earth Science community. For a complete list of technical sessions and full details on the abstract submission process, please visit the GeoCanada 2010 website at www.geocanada2010.ca

THE IMPACT OF WELLSITE GEOLOGy on Petroleum Exploration and Development
| By APEGGA and CSPG Committees
The foundation of our Oil and Gas industry is the rock below our feet. Exploration for these valuable hydrocarbon resources starts with an idea that suitable rock formations for hosting economic volumes of oil and natural gas exist in a specific area. Typically, an exploration petroleum geologist studies rock formations on the surface for hints below and/or studies subsurface evidence from data gathered on previously drilled wells.
This rock record, as evidenced either by mapping, geophysics, cores, and stored cuttings, has helped guide the industry to many discoveries and the proper development of these new discoveries. Along the way, the optimization of these resources has lead to constant changes in drilling technology from bits to rig equipment to formation extraction techniques.
Two key groups of people specialize in collecting, characterizing, and authenticating samples from wells: wellsite geologists (commonly called wellsiters) and core and sample analysts. Wellsite geologists have the responsibility for ensuring target rock units are fully characterized, while core and cuttings analysts confirm formation tops according to current standards and interpret the petrology of the source rock.
Wellsiters may be Professional Geologists when a great deal of interpretation of cuttings is required for the benefit of the headquarters exploration team and will generally work without supervision. Routine holes will often be supervised by Registered Professional Technologist (Geological) qualified staff who can also work without
continuous supervision. Simple drillhole data may be collected and catalogued by a Geological Technician under the direct supervision of a Professional Geologist or a Registered Professional Technologist (Geological), either at the wellsite or from headquarters.
Core and cuttings analysts may also be either Professional Geologists or Registered Professional Technologists (Geological) depending upon the individual’s qualifications and scope of work assigned by the clients.
Our understanding, as geologists, of spatially controlled changing properties of rock formations points us towards the next target. New and exciting plays such as the Bakken in Saskatchewan and the shale gas of BC required an immense amount of research into the rock properties before a test well was drilled. Many formation characteristics are not always apparent from petrophysical logs, and explorationists often use the more hands-on approach of looking at the rock. Once matched with the new engineering technologies, these often bypassed or overlooked targets are becoming a driving force in our industry.
W ELLSITE GEOLOG y
The role of the professional wellsite geologist and stored sample / core analyst in our industry has become more important over the years. We are in charge of gathering that rock record and providing the first hands-on look at the rock properties. As important as the rock analysis is, the other forms of pertinent data gathered during the drilling (drilling parameters, mud properties, ROP, gas responses, etc) that we monitor,
verify, and display in a clear, concise format allows quick response, during drilling, to target changes as well as providing a data trail for future research. The utilization of this rock and data information as one of the standard tools in exploration often sets the more successful operators apart from the pack and its record will consistently play an important part in the next big discovery.
Wellsite geologists act as the field representatives for an oil company’s play geologists, effectively serving as their eyes and ears. They are responsible for making sure that critical decisions (such as core points, intermediate casing points, and picking total depths) are carried out at the right depths, the right times, and in accordance with specific instructions.
To perform their duties effectively, wellsite geologists must take a wide variety of information from many disparate sources on a drilling rig. They must then distill the important details from all of this information, and relay these details to the play geologists in a concise, timely manner so that important decisions can be made in the oil company’s head office. Once these decisions are made at head office, wellsite geologists must then relay critical instructions from the head office back to the various field personnel in a timely manner.
The most fundamental part of a wellsite geologist’s work is the examination of drill cuttings that are circulated out of the ground as a well is being drilled. Drill cuttings travel up a wellbore at a consistent rate, and if that rate (the “annular velocity”) is determined accurately then in most wells the drill cuttings
are very representative of the intervals from which they originated. If collected properly, the data from these samples is extremely valuable as a permanent record of the rocks encountered by a particular well.
Alberta’s Energy and Resources Conservation Board (ERCB) mandates the collection of sample data for all wells drilled in new fields or new pools, and was created by oil and gas companies as a centralized vehicle for regulating this data collection. It is in the best interests of both the ERCB and oil and gas industry to ensure that good quality sample data is collected, in the event that future analysis takes place to generate new exploration plays. A wellsite geologist ensures that these samples are collected at the proper times and intervals, and using the correct methodology, and in fact is the only person who can vouch for the veracity of the samples at the time they are collected.
It may seem surprising that tiny chips of rock can provide much useful information, but in fact an experienced wellsite geologist can determine a great deal about the various formations in a wellbore by examining the drill cuttings. In clastic formations specific lithological features such as average grain size, cement types, argillaceous content, or pebble content may prove to be very important when making production decisions.
Similarly for carbonate wells, recognition of features such as crystal textures, specific fossils or facies types, extent of dolomitization, and the presence of fractures or vugs can have a tremendous influence on the decisions that are made. For either clastic or carbonate reservoirs, recognition of hydrocarbon shows and determination of the type of shows that are present (heavy oil, light oil, natural gas liquids, or
pyrobitumen) can be vital to the decisionmaking process.
The primary tools of the trade for a wellsite geologist are a binocular microscope and a fluoroscope. A binocular microscope allows the wellsite geologist to examine drill cuttings at a range of magnifications, allowing him or her to pick out many details that cannot be observed with the naked eye. The fluoroscope is an ultraviolet light source which can detect hydrocarbons. An experienced wellsite geologist can evaluate both the type of hydrocarbon shows and their relative strength under a fluoroscope. A third extremely important tool is the recording mud gas detector, which is now run on most conventional oil and gas wells. A wellsite geologist constantly monitors and maintains the gas detector to ensure it is running properly, and makes sure that the gas data is properly lagged to represent the correct depth intervals. The wellsite geologist imports the gas data into his or her striplog, and provides a qualitative analysis of the gas peaks he or she observes.
The wellsite geologist creates a visual representation of the well called a “striplog” and a report that compiles all of the information being gathered and presents it in one comprehensive plot. This plot is the wellsite geologist’s reconstruction of the rock column that has been drilled through by a particular well. In addition to sample descriptions and lithology, the striplog also captures other relevant streams of information, such as rate of penetration (ROP), mud gas values from total hydrocarbon detectors, and gamma ray values from MWD tools, and presents those in conjunction with the lithological interpretation. Creating a striplog is very much like detective work. A proper lithological interpretation takes what is observed in samples, factors in the profiles observed in the ROP and gas curves, then compares and contrasts these observations with striplogs from previously drilled wells.
the striplog is the single most comprehensive record of the events that took place as a well was drilled. If a new company is drilling in a previously explored area, an old striplog can act as an all-inclusive reference that captures the finer points of drilling in that region.
In addition to basic lithology, striplogs capture all of the other petrographic details that a wellsite geologist observes, such as crystal or grain size, cement types, accessories, macro- or micro-fossil types, visual porosity and permeability estimates, and especially traces of hydrocarbons. As well, many wellsite geologists now own digital cameras they can use with their microscopes. Digital photomicrography allows them to capture images of these petrographic details and transmit them via data link to their clients in near-real time. A good quality striplog takes all of these features and combines them with ROP and total gas (and possibly gamma ray) curves to create a detailed synopsis of each formation that is encountered in a wellbore.
Many of the features identified by wellsite geologists simply cannot be distinguished by conventional petrophysical logs, and this is where a wellsite geologist’s true value lies for an oil company. As conventional oil plays out in the WCSB, it becomes increasingly more important to detect and record information about bypassed pay left in the ground. The level of detail required to evaluate potential bypassed pay zones can only be gathered if a wellsite geologist is present while a well is being drilled.
The striplog also serves to capture many other details from a well’s drilling history (such as mud reports, directional surveys, bit records, etc.). In many cases
Features such as grain size, accessory minerals, cement types, fossil types, pebble content, and fractures or vugs can only be recorded by a physical examination of the cuttings from a wellbore. Properly trained wellsite geologists can also provide a visual estimate of various formations’ permeabilities, which can be extremely valuable in determining where the best potentially productive zones are located.
Aside from the primary roles of data creation, preservation and interpretation, the wellsite geologist has several other duties on a rig. One of the most critical (and stressful) duties is to identify coring points when needed. An oil company’s prognosis provides an estimate of where a core point depth is expected to be, but it is up to the wellsite geologist to compare the prognosis to actual observed data as a well is drilled, and to modify the intended coring depth where necessary. The wellsite geologist needs to ensure that not too much
(Continued on page 28...)
non-reservoir rock is captured in the core barrel, while also ensuring that the critical zone of interest is not drilled through. After a core has been cut, it is the wellsite geologist’s responsibility to ensure that the core is properly recovered, labeled, described, boxed, and secured for transport, and to determine whether any additional coring is necessary. For wells that are coring in oil sands areas, the cores are housed in plastic tubes. On such wells wellsite geologists must also ensure that these plastic tubes are properly cut, capped, labeled, and fully documented. The wellsite geologist also provides a visual description of the material observed at the ends of each of the core tubes. The wellsite geologist is the most qualified person on a rig site to ensure that oil sands cores are properly recovered and documented.
It is important to emphasize that wellsite geologists work at a rig site as part of an overall team effort. To drill a successful oil or gas well, many different disciplines need to work together and coordinate their efforts, including the drilling supervisor, rig crews, tool push, directional drilling personnel, and various other professions and trades. Wellsite geologists serve to inform the other rig personnel about potential geological hazards that may be encountered while drilling (chert beds, anhydrite beds, thick coal seams). They can also alert the other rig personnel about when to expect other potential hazards, such as sour (H2S-bearing) zones, underpressured (lost circulation), or overpressured (possible kick) zones, which can allow the rig personnel to prepare for otherwise unexpected events.
On deviated and horizontal wells a wellsite geologist gathers information from directional surveys and gamma ray plots, examines this information and makes
informed decisions about where to direct a well’s path. Certain decisions, such as what T vD (true vertical depth) to reach a horizontal point and what MD (measured depth) to set intermediate casing, are vital to the successful drilling of a horizontal well.
In most cases the final decisions are made on site by a wellsite geologist (in conjunction with directional drillers and the other rig personnel on site). While drilling in the horizontal wellbore, wellsite geologists constantly evaluate a multitude of variables (samples, ROP, mud gas, gamma ray profile, directional surveys), and using the observed data they consult with the oil company’s geologist back at the client’s headquarters to make decisions about where to direct the well’s path.
On every well on which he or she is present, the wellsite geologist makes the final determination of when total depth (TD) has been achieved, and then conveys this information to the drilling supervisor. Well licenses that are issued by the ERCB indicate an estimated TD, which is usually relative to a specific geological horizon (the “terminating zone”). In many cases if a well drills too far below the terminating zone it risks going into trespass, which could cost the owning oil company a lot of money in fines. By determining exactly where the base of the terminating zone is, a wellsite geologist can prevent a trespass event from happening.
At the end of a well, a striplog and the accompanying well data summary report provide the basis and calibration data for the open-hole geophysical logs that are performed after drilling (or that accompany the report in the case of logging-whiledrilling data). Although in most cases they do not make production decisions, wellsite geologists have a basic understanding of the most common tools used in open-hole logging. They are the ones who can provide a quick-look QC during a logging run, to ensure that no data is amiss. Wellsite geologists observe logging results in real time and can relay these results most quickly to the oil company geologists in head office. Wellsite geologists are also responsible for
picking formation tops from these logs, and in many instances are responsible for submitting these picks to the ERCB.
There are many challenges that wellsite geologists must overcome in order to do a thorough and professional job. First and foremost, they must be constantly vigilant to ensure that good quality samples are collected from the shaker by the roughnecks. If samples are of good initial quality, it allows wellsite geologists to do more thorough and representative descriptions, which in turn allows for better interpretations upon which companies can generate new exploration targets.
Due to the advent of polycrystalline diamond compact (PDC) bits, wellsite geologists must often deal with extremely rapid penetration rates. Many wells which in the past could take several days to drill now require a wellsite geologist to finish a complete striplog and report 24 in hours or less, which adds to the stresses that they face. Drilling with invert (diesel fuel-based) mud presents additional challenges, both with respect to the additional time needed to clean these samples as well as the noxious fumes that are generated by the invert mud. The time constraints are such that on many wells the wellsite geologist must work 20 hours or more in a 24 hour period just to keep up with the demands of the job and the drilling schedule.
S AMPLE AND CORE A NALy STS
Sample and core analysts are employed in the preliminary development of an exploration play through the drilling and completion decision process.
A fully trained analyst can use drill cuttings to determine environment of deposition, fine-tune tops and geological correlations, and make comparative estimates of porosity and permeability of reservoirs using core and cuttings. These specialists usually examine core and cuttings with the support and integration of other data including openhole logs, production data, drillstem tests, and special rock analysis. (i.e., thin sections, xRD, SEM).
With the additional insight provided by this other data the specialists can “fine tune” their estimates of porosity and perm and become increasingly accurate and consistent. This degree of accuracy gives the prospect-generating geologist confidence in the reservoir quality estimates (as well as environmental interpretation, etc.) when proposing prospective drilling locations.
In the operational phase of a new drill the
(...Continued from page 27)
core and cuttings specialists can provide “real time” evaluations of cuttings, often before the well is TD’d or logged (samples are often “hot-shotted” to the same specialists that looked at offset wells and provided input into the selection of the location) so that casing and completion decisions can be made with greater confidence and decreased risk.
Sample and core specialists can also provide support to wellsite geologists prior to and during the drilling of a well by alerting them of subtle features of the zone(s) of interest from a rock perspective so the wellsiter can concentrate on certain characteristics of a zone that may determine if it is commercially viable. These may include grain size, degree of cementation, type of hydrocarbon shows, etc. Sample and core analysts perform a similar but usually more quantitative evaluation of rock samples than wellsite geologists because of the amount of supporting data they have access to in order to fine tune their accuracy.
Another important role of the sample and core analyst is knowing when to recommend special rock analysis (thin-sections, xRD, SEM) in order to be more definitive in the absolute identification of specific minerals,
clays, or pore distribution. Many core and sample analysts will have at least some experience in wellsite practice so they understand the limitations of core and cuttings and can anticipate and adjust lag times (the time required for cuttings to rise from the drill bit up the mud column to the shale shaker) or account for cavings or foreign material in the samples. In many cases, the wellsite geologist’s report of core and samples may be more descriptive than interpretive, where the C&S analysts will try to be as interpretive as possible.
CONCLUSION
The professional practice of wellsite supervision and sample/core analysis has played a major role in the petroleum industry on both the domestic and international scene for many years. These roles have allowed oil and gas companies to more efficiently exploit challenging yet productive and profitable plays. It has also acted as a stepping stone for many office geologists and continues to be a career of choice for many who understand sacrifices will be made in return for a well paying profession that is always changing and evolving.
In this day and age of cost savings and lean approaches, mentoring has become rare.

We are proud to say that in our profession, it occurs immediately after a graduate geology student or foreign geologist is hired by a wellsite company. Experienced wellsite geologists often pass along their tricks of the trade only because “someone did it for them”. Mentoring continues throughout a wellsite geologist’s career with constant quality control checks, technical and communicative coaching, and the introduction to more challenging targets based on achieved skill level.
Often, the most valuable input for many wellsite geologists and sample/core analysts is from their clients. They provide the greater scope or “big picture” view of a play and outline the specific targets with certain expectations for “quality of product”. This is often the most valuable form of mentoring in our team approach in making the next big discovery.
Special thanks to the main contributors of the article: Michael Freeman, Doug Hayden, Doug Oicle, and Tom Sneddon.
LETTER TO THE EDITOR: Wisdom and vision in CSPG management?
Recent actions taken by the former CSPG President and Executive cause me to question the judgement of CSPG management, specifically their cost-cutting priorities and decision to publish the Bulletin digitally.
In early July 2009, authors of current papers submitted to the Bulletin of Canadian Petroleum Geology received a notice, in a letter signed by President Graeme Bloy, that issues of the Bulletin, as of March 2009, will be published digitally. CSPG will only print a limited number of bound hard copies to send to university libraries and for those who wish to purchase them. The only explanation given for this action was that “we need to reduce our costs and hence digitize the Bulletin as of 2009” and that “under the current situation, this is the only way to keep the CSPG’s Bulletin up and running”. Later in the letter, President Bloy referred to the Bulletin as the “flagship publication of our society.”
“Surely,” I thought, “CSPG must be in dire financial condition.” Then I read President Bloy’s Executive Comment (Tough Fiscal Times – What actions has the CSPG taken?) in the September 2009 issue of the Reservoir. In this issue, President Bloy described costs related to restructuring the CSPG office (subject to final audit and reporting at the AGM in January 2010 – Ed), including the hiring of an Executive Director to a contract. Bloy also informed the CSPG membership that the “rainy-day fund” still has a healthy balance of $656,000, as of June 30, 2009, although appreciably diminished from that of $1,032,000, the balance at the beginning of the 20082009 fiscal year according to CSPG Finance Director David Garner in the October issue of the Reservoir. President Bloy emphasized that CSPG will scrutinize its expenditures. However, nothing was said about the need to save money by eliminating the expense of producing bound hard copies of the Bulletin. Nor was anything mentioned about this matter in the follow-up Executive Comment by David Garner in the October issue of the Reservoir. Words of omission often speak louder than words actually spoken. Could this omission imply that the decision to eliminate bound hard copies of the Bulletin was a minor issue unworthy of future discussions by the Executive? In terms of priority, just where does the Bulletin stand with the Executive?
The action of the President and Executive can be questioned on several fronts.
First of all, if the Bulletin is really the “flagship publication” of the Society, why risk the viability of the Bulletin by going nearly solely digital? It should be obvious that most authors prefer to have the results of their research published in bound hard copies. The decision in going digital will surely result in a lower number of high-quality papers submitted to the Bulletin. Already, I know of one submission, initially targeted to the Bulletin of Canadian Petroleum Geology, that has been rerouted to another journal because of this change in policy. Potentially, this change in publication format may result in a drastic reduction in submission of highquality papers, resulting in the ultimate demise of the Bulletin.
Secondly, are there other serious drawbacks in going digital? Certainly, of course. Many CSPG subscribers prefer to read articles in the Bulletin at home or on trips, away from computer terminals. The change in publication format will severely handicap these readers. Many others simply prefer to read a printed copy. Furthermore, one of the main selling points of the Bulletin to me is the inclusion of foldout diagrams designed to display stratigraphic and structural crosssections. How many CSPG subscribers who don’t work for large-size companies or institutions have easy access to printers that will reproduce large-format diagrams? Even if they do, will readers make the extra effort of running off large-format diagrams or purchasing them from CSPG? I have found that even official reviewers of my own papers are reluctant to make the effort to run off oversize diagrams. viewing only segments of a large-format diagram on a computer screen seriously hampers the comprehension of the overall diagram.
Thirdly, if there is a financial shortfall in the projected budget, why shouldn’t the “flagship publication” of the Society qualify for funding from the CSPG “rainy-day fund”? According to the CSPG Financial Statements published in the December 2008 issue of the Bulletin, the net cost of the Bulletin for the 20072008 fiscal year was approximately $87,000. Furthermore, I would estimate about half of this cost is a fixed expense, irrespective of the style of production, for copy editing and layout. Thus, the cost to produce bound hard copies is roughly $50,000 per year.
Fourthly, doesn’t the decision to publish the Bulletin digitally, retroactively to include all unpublished papers submitted prior to the
announcement of going digital, violate the implicit agreement between the Bulletin and the submitting authors? You bet it does! Those of us who submitted current papers prior to the announcement of the Bulletin going digital followed the directions given in “Guidelines to Authors” posted in all issues of the Bulletin prior to 2009. We expended considerable effort in writing texts and designing figures (including foldouts) that followed these guidelines, with the expectation of ultimately publishing a paper in a printed journal. Certainly the decision by the Executive to go digital, retroactively, can only be interpreted as CSPG breaking its own word, or in my view the implicit contract between the Bulletin and the submitting authors. Furthermore, the decision to go digital, retroactively, lowers the quality of the 2009 year issues. Extremely long crosssections, intended to be facing foldouts in bound hard copies, are now illustrated as two separate diagrams.
I view the decision by the CSPG Executive to publish the Bulletin in a digital format to be short-sighted. I believe that the Executive needs to stand back and take a broader, longer-term view of the role of the Bulletin and how this decision impacts the vision of this role. In essence, I ask the Executive to clearly define what the long-term purpose of CSPG is and what role the Bulletin plays in implementing this role. Is it scientific, educational or social? Clearly, many past Presidents of CSPG have considered the publication of the Bulletin to be its singlemost-important output. What meaningful record of CSPG will exist 20 or 50 years from now, if not for the Bulletin or for Special Publications? How many members recall the contents of talks given 10 to 20 years ago at CSPG annual conventions or at the Technical Luncheons? Why risk the viability and the quality of the Bulletin? The production of bound hard copies has served the membership well since the onset of the Bulletin in 1963. Stopping the production of bound hard copies of the Bulletin should be done only as a very last resort and not until absolutely necessary. The present financial position of CSPG does not warrant the decision to go digital.
The Executive should give strong consideration to reversing its decision.
Jack Wendte October 27, 2009
REPLy: Wisdom and vision in CSPG management?
| By Lisa Griffith, CSPG Past President
Jack, thank you for caring enough about the CSPG to take the time to express your concerns to the Executive. I also want to acknowledge the tremendous contribution you have made to the Bulletin of Canadian Petroleum Geology with at least seven refereed papers dating from the 1990s to present. As I understand from your letter, you are primarily questioning the decision to publish the Bulletin digitally. You also have associated concerns in the context of overall cost-cutting decisions and priorities, and poor communication with authors. Let me first address the issue of a digital Bulletin, then I’ll go over the other issues.
First, let me assure you that the CSPG Bulletin is still the most important tool that the CSPG has for communicating peerreviewed scientific insights on Canadian geology, and contributions from Canadian authors on other basins to our community and the rest of the world. Reducing CSPG expenses was one of the most immediate drivers to take the Bulletin digital, but it wasn’t the only – or even the most important - reason. In fact, most readers and subscribers actually prefer digital copies, and many members consider going digital a service improvement. Only 18% of CSPG members would request hard copy if the Bulletin were digital, according to our 2009 survey. This preference is part of a larger trend occurring in other print media and similar societies. A 2006 AAPG membership survey showed that only 34% of AAPG members would be willing to pay extra for a paper copy of the AAPG Bulletin. Another sister society, the SEPM, notes that the official copy of record is the online version of Journal of Sedimentary Research. In terms of our corporate subscribers (company, public, and university libraries), the number of subscribers has dropped from approximately 335 in 2005 to approximately 90 in 2009. In contrast, our royalties have been increasing from companies that post the digital version of the Bulletin (such as GeoScience World). Some of GeoScience World’s current subscribers are former Bulletin subscribers. With 44% percent of our members retiring within the next 10 years, the remaining younger demographic push will be toward more digital media at the expense of hard copy. And speaking of expenses, they are
rising sharply for both publication and mailing. We anticipate they will continue to do so.
There are also distinct advantages to digital copies of the Bulletin. The archives are searchable. You can print only the papers you want to read, or download them onto a digital book and bring them on the plane, rather than hauling along the whole journal. You can highlight, and sketch in the margins of the paper while you’re reading (a bad habit of mine), and still have a clean back-up copy. You can’t lose them. They don’t take up a basement’s worth of storage space. The dog can’t eat them. It is far easier to share a great paper with a colleague by email or internet link than to snail mail a hard copy or send them to a library. The Bulletin is easily available through GeoScience World and AAPG Datapages via the CSPG website. In the judgment of the Executive as far back as 2007, the question was not whether the Bulletin should go digital, only when. The current economic climate expedited that decision.
Fold-outs are another story. Fold-outs are the most expensive part of the publication. As you point out, they can also be a critical component of the geological story. Other publications such as the AAPG Bulletin address this problem by asking authors to cover the cost of their own fold outs. The CSPG has historically recognized the importance of fold-outs to the geological community, so authors haven’t been burdened with the associated expense. However, as a result of the CSPG decision to go digital, fold-outs are difficult to accommodate. In the short term, the CSPG has chosen two options. One is to have high-resolution versions of the fold-outs available digitally. These are available in GeoScience World, accessible to CSPG members through the Members Only section of the CSPG website. Nonmembers can subscribe to GeoScience World directly to obtain access to these high-resolution files. Alternatively, hard copies of the fold-outs will be available at the CSPG Bookstore for purchase. Costs will be determined individually based on the length, detail, and colour required for reproduction. In the longer term, geologists need to find alternative creative
solutions that display the information in a digital-friendly format. After all, creativity is our strength.
As you mention, Jack, hard copies of the Bulletin are available for purchase through the CSPG Bookstore or on request. If there are sustained requests and feedback for hard copies following the recent roll-out of the all digital Bulletin, the Executive will look at the possibility of including an option for hard copy (at additional cost) to the membership renewal process. We will track the response, and communicate options for the membership to consider. Regardless of member demand, a limited number of Bulletins will continue to be published in hard copy for the foreseeable future due to legal and scientific requirements such as formal recognition of new biostratigraphic nomenclature. The CSPG may also compile an annual hard copy “best of” volume based on the number of hits per paper on our website, GeoScience World, and AAPG Datapages, to be available for purchase in the Bookstore. It is our opinion that the scientific merit and viability of the CSPG Bulletin will not be compromised by a digital format.
Moving on to your other points, fund allocation is one of the most important responsibilities of the Executive, and it should reflect the priorities of the Society. Our audited finances will be discussed in some detail at our annual January AGM. In the meantime, let me review some of our broad strategies to put your concerns in perspective. First, the Rainy Day Fund. The Rainy Day Fund was put in place to cover the cost of running the Society for one year if a major financial disaster occurs such as a significant decrease in our membership revenue, or cancellation of the annual convention. The Fund is also seen as the way to fund extraordinary, single-time expenses that the Society could not otherwise afford. In the context of the Bulletin, ongoing price escalations are not seen as “one of”. In addition, the Executive anticipates a longer-term trend of decreasing CSPG Society revenues as the industry continues to consolidate, resource plays reduce the requirement for exploration earth scientists, and many of our members retire. The responsible (Continued on page 33...)
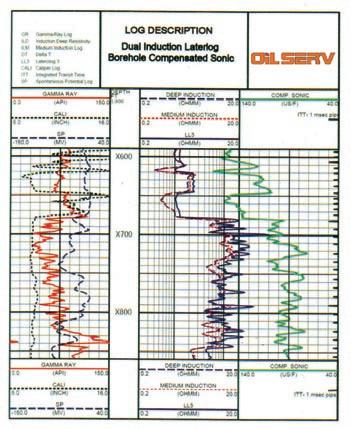
First Iraqi company providing logging services for:
• Open hole services
• Cased hole services
• Perforations
• VSP
• PLT
Unique system, Decades of tools performance and accuracy

strategy is to reduce costs where possible. Our current major expenditures are in the areas of Outreach, Office, and the Bulletin. In addition to taking the Bulletin digital, we have implemented other digital services such as webcasting, the eNewsletter, and e-registration for luncheons and membership renewal. We have initiated cost reductions in the audit and staffing, and we are investigating opportunities to share office space. The CSPG will continue to look for ways to be more efficient. We have drafted plans to reduce outsourcing by developing the skills of our staff to deliver communications more efficiently, and creating more opportunities for volunteer participation. Cutting programs is our last choice.
Finally, please accept the CSPG’s apologies for the very poor way that we communicated the upcoming change in the delivery of the Bulletin to all the stakeholders, but most importantly, to the authors with papers in the queue. The CSPG will strive to do a better job of communicating major changes that affect the delivery of our programs with protocols such as publishing proposed changes in the Reservoir and in our CSPG eNewsletter, and announcing them at the Technical Luncheons. In the future, individual authors will be made aware of the changes via the criteria for publication. Because the Executive recognizes the increasing strategic importance - and work required - in the Communications portfolio as we move into the future, we have added an Assistant Communications Director to the Executive this year. We are fortunate to have two very enthusiastic, qualified people to direct this dynamic portfolio.
In conclusion, the decision to publish the Bulletin digitally is part of a broader, long-term vision that sees most of our communication becoming digital. The CSPG is primarily a technical society. Its mission is to “promote the science of petroleum geology; foster networking and professional development of its members; and advance community and national awareness of the profession.” In answer to your question, that mission involves balancing the scientific, educational, and social needs of our members. The Bulletin holds pride of place in a suite of programs to “promote the science of petroleum geology,” which also includes Technical Luncheons, Technical Division talks, webcasts, and several conventions annually. These programs are supported with other technical programs aimed at the professional development of our members such as Continuing Education courses and field seminars. The Executive envisions the Bulletin improving, and continuing its flagship role for the foreseeable future. The success of our Society is not measured in dollars and cents, but we need financial viability to achieve our mission. As the digital roll-out of the Bulletin proceeds, the Executive will inform the membership of transition issues related to the decision.


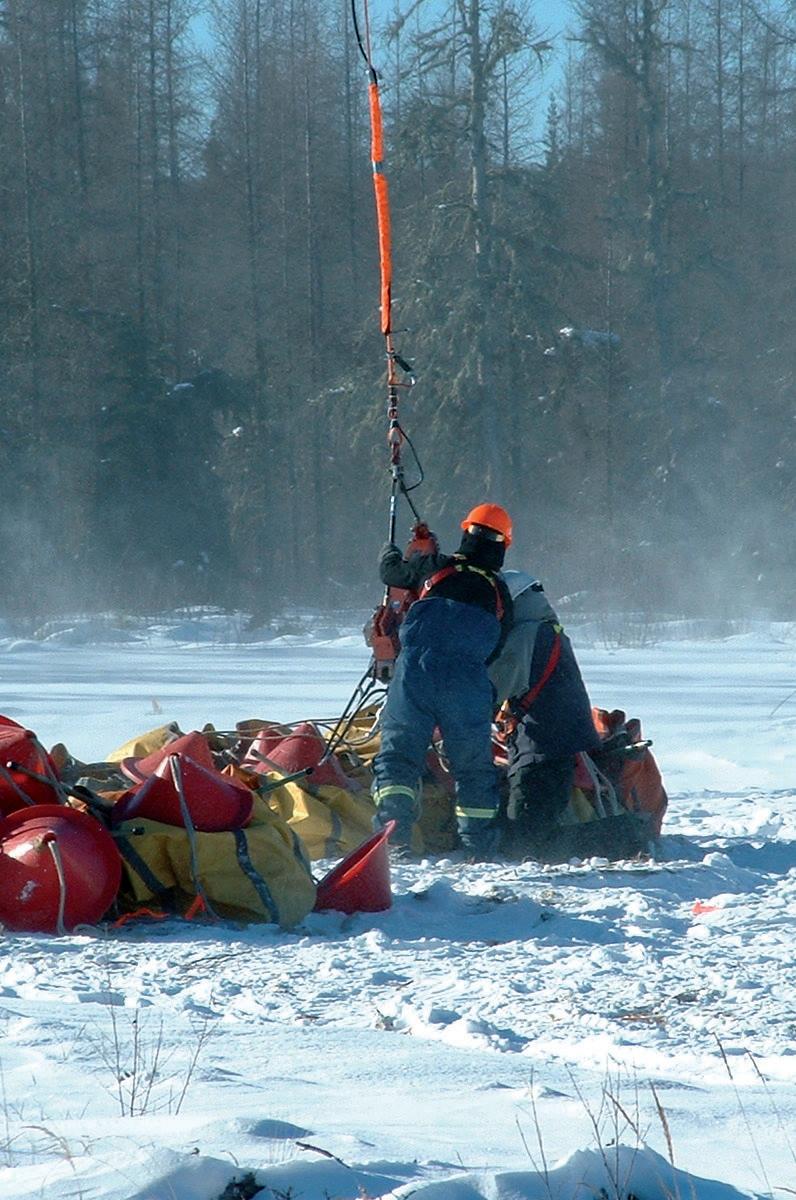

Environmental Responsibility
CGGVeritas is committed to environmental responsibility in all of our operations. With experience working in some of the most sensitive regions of Canada and the world, coupled with an industry-leading QHSE record, we can acquire your seismic data with minimum environmental impact.
Count on CGGVeritas to help you explore, develop and produce with confidence.
GRADUATE T HESIS AWARDS PRESENTATION
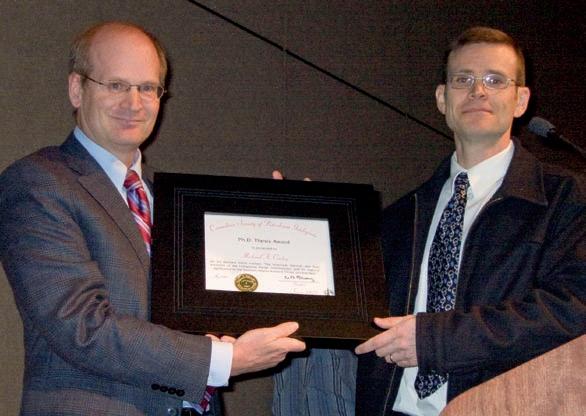
Each year the CSPG Graduate Thesis Awards are presented for the best Ph.D. and M.Sc. theses either produced in a Canadian university, regardless of project location, or deal with a Canadian sedimentary/petroleum geology topic, regardless of university of origin. This year these awards are made possible through the generous support of ARC Financial Corporation.
Michael Cooley, the winner of the 2008 Ph.D. Thesis Award, was presented with a framed certificate at the CSPG Technical Luncheon on November 12, 2009 at the Calgary TELUS Convention Centre. Lauchlan Currie, President and Director of ARC Financial Corporation, was at the luncheon to present and congratulate Cooley. Cooley’s thesis, “The structural, thermal, and fluid evolution of the Livingstone Range anticlinorium, and its regional significance to the Southern Alberta Foreland Thrust and Fold Belt” was supervised by Professor Ray Price at Queen’s University.
The award for best M.Sc. went to Aaron DesRoches (who was not in attendance at the
luncheon) for his thesis “Integrated Ichnology, sedimentology and stratigraphy of the lower Falher Member, Spirit River Formation, northeastern British Columbia and central Alberta” (supervised by Professor James MacEachern at Simon Fraser University).
Two honorable mentions were recognized in the Ph.D. category to xavier RocaArgemi (University of Western Ontario, supervised by Professor Guy Plint) for his thesis “Tectonic and eustatic controls on the allostratigraphy and depositional environments of the lower Colorado Group (upper Albian) central foothills and adjacent plains of Alberta, Western Canada Foreland Basin” and to Daniel J. K. Ross (University of British Columbia, supervised by Professor Marc Bustin) for his thesis “Investigation into the importance of geochemical and pore structure heterogeneities for shale gas reservoir evaluation.”
The full Graduate Thesis Award citations appear in the March 2009 issue of the Bulletin of Canadian Petroleum Geology.
Sponsored by:
CSPG SqUASH TOURNE y ENTERS 27TH y EAR
| By David Caldwell, CSPG Squash Tournament Chair
The CSPG squash committee has been hard at work since October to prepare for the upcoming 27th Annual event. While some committee members have moved along and others paused to have babies, new and eager rookies have jumped aboard the planning committee to lend a hand.
The tournament will once again be held at the World Health Club in Edgemont (Calgary, Alberta) on February 4-6 2010. Both singles and doubles play will be offered again to all players entering the competition. Registration should be up and running in December. Enter early as this event fills up quickly. The limit will be about 130 players plus or minus a few depending on which divisions need players. This tournament is open to all players and abilities. We typically have an A division for highly skilled players all the way down to E or Beginner level.
Look for great food and social opportunities at this three-day tournament. Last year we had a Pizza & Calzone night followed by Asian wrap night and the traditional pasta night at the banquet dinner. We also had a great
Saturday morning brunch featuring custommade omelets and a wild-game chili.
The CSPG Squash tournament has been a sold-out event for the past 10 years and continues to grow in popularity. The event hosts a variety of earth scientists including a large number of geophysicists who entered last year. Students are always welcome and have been generously sponsored by Encana in the past.
Mark your calendars for Monday, January 25 to fine tune your stroke in the Tucker Wireline Practice Session at the Bow valley Club in Bow valley Square downtown. Once
again, Tucker has stepped forward as the title sponsor for the event. Please contact David Caldwell at 403.852.5571 or the CSPG Office at 403.264.5610 for sponsorship opportunities.

Lauchlan Currie (left) presents Michael Cooley (right) with the 2009 Graduate Thesis Award for Best Ph.D. Thesis.
27th ANNUAL CSPG SQUASH TOURNAMENT
February
4 – 6, 2010
World Health Club • 722 Edgemont Blvd NW
there is a maximum of 125 players!
Get your entry form in early to avoid disappointment! Register online at www.cspg.org/events/events-social-squash-register.cfm
EVENTS: Men’s and Women’s A, B, C, D, and Novice.
ENTRY FEE: $75.00 Members (Members of the CSPG and CSEG, Spouse/Partner)
$110.00 Non-Members
$20.00 Doubles
• Two guaranteed matches (Saturday teams tourney), T-Shirt, refreshments and food during the tournament, Saturday night dinner and draw prizes.
• Pre-tournament drop-in squash at Bow Valley Racquet Club (2nd Street and 5th Avenue S.W.) on Monday, January 25, 2010 from 6:00 pm to 8:00 pm. Generously sponsored by Tucker Wireline Services.
• Pre-tournament Registration Social will be at the Bow Valley Racquet Club (2nd Street and 5th Avenue S.W.) on Tuesday, February 2, at 5:00 pm. Pick up your tournament kit and first draw time. Enjoy a free pint of ale with munchies.
• All door prize draws Saturday evening – must be present to win.
ENTRY DEADLINE: Early Bird Deadline January 4, 2010. Qualify for Early Bird Draw Prize. Registration Deadline January 14, 2010. No refunds after this date.
REGISTRATION DETAILS:
q CSPG q CSEG Member # _________________________________________ qNon Member
Name: _________________________________________________Email: _____________________________________ Company: ________________________________________________________________________________________
Phone: Daytime: ____________________________ Evening: __________________________ q Male q Female Shirt size: q S q M q L qXL q XXL
Level/Frequency of Play: q A q B qC q D q Novice
Doubles Squash ($20.00 extra for Doubles if playing singles as well): q Yes q No
Will you be attending dinner: q Yes q No Meal Preference: q Meat q Veggie
Guest Name: ______________________________________________________________________________________
q Male q Female Shirt size: qS q M q L qXL q XXL
Level/Frequency of Play: q A q B q C q D qNovice
Doubles Squash ($20.00 extra for Doubles if playing singles as well): q Yes q No
Will you be attending the dinner: qYes q No Meal Preference: q Meat q Veggie
PAYMENT DETAILS (GST Included. GST# 118836295):
$75.00 Member/Spouse
$110.00 Non-Member (CSPG/CSEG members will be given first priority.)
$20.00 Doubles
$35.00 Extra Meal Ticket (Non-playing guests. Maximum 15 spots; first-come, first served).
TOTAL
q VISA q MC qCheque (Payable to Canadian Society of Petroleum Geologists)
Card Number: ______________________________________________ Expiry: _______________________________
Name of Card holder (Please Print): _______________________________ Signature:
REGISTRATIONS TO BE SENT TO: Canadian Society of Petroleum Geologists Attn: Squash Tournament 600, 640 8 AVE SW, Calgary, AB T2P 1G7 Phone: (403) 264-5610 Fax: (403) 264-5898
9 TH A NNUAL ATLANTIC UNIVERSITIES Geological Conference (AUGC)

October 22 – 24, 2009 saw a packed schedule of top-notch academic talks, posters, and field trips mixed with a harbor cruise, a football game, and a formal banquet at the 59th Annual Atlantic Universities Geological Conference (AUGC). The 2009 conference was held at Saint Mary’s University in Halifax, NS. Student delegates from six Atlantic universities attend the conference each year. This year, the conference had over 120 students from Saint Mary’s, University of New Brunswick, Acadia, Dalhousie, Memorial, and St. Francis x avier in attendance.
The conference started off on the Thursday evening with a Harbor Cruise where the SEG Challenge Bowl, a geosciences trivia competition, was held. Teams of two from each university participated in the Challenge Bowl. The winners of the game were Alexander Kaul and Leah Chiste from Acadia University. Alexander and Leah won a trip to the GeoCanada 2010 Convention to be held here in Calgary, where they will participate in the National Challenge Bowl competition.
Friday was a field-trip day. Trips were to the Joggins Fossil Cliffs (UNESCO World Heritage Site), Pope’s Harbour Mafic Dyke and xenoliths, Canada-Nova Scotia Offshore Petroleum Board Geoscience
Research Center (Core Lab), and a short course on Fluid and Melt inclusions in precious metal Deposits (sponsored by Barrick Gold). The day wrapped up with everyone at the conference getting a ticket
to a football game between Saint Mary’s and St. Francis x avier… with Saint Mary’s winning 41:7.
This year there were 16 talks and 11 posters presented from Undergraduate Honours students. Topics ranged from “The use of Strontium Isotopes in Apatite as a tracer of Iron Ore Apatite (IOA) Mineralization Processes” to “Mud Accumulation on the Open Coast: A Sedimentological Puzzle.” The CSPG gives an award for Best Petroleum-related Presentation, which this year went to Jordan Nickerson (Dalhousie) for his talk on “Architecture and Geometry of a Braided Channel Complex in the Wolfville Formation.” Other awards and their winners were the Frank Shea Award: Darren Lefort (Saint Mary’s), APICS - NSERC Award: Matt Stimson (Saint Mary’s), Poster Award: Mary Leaman (Memorial University), and CSEG Award: Byron Kelly (Memorial University). The conference was wrapped up with a banquet and awards ceremony on the Saturday night. Dr. Marcos Zentilli spoke about Arctic Exploration during the banquet.
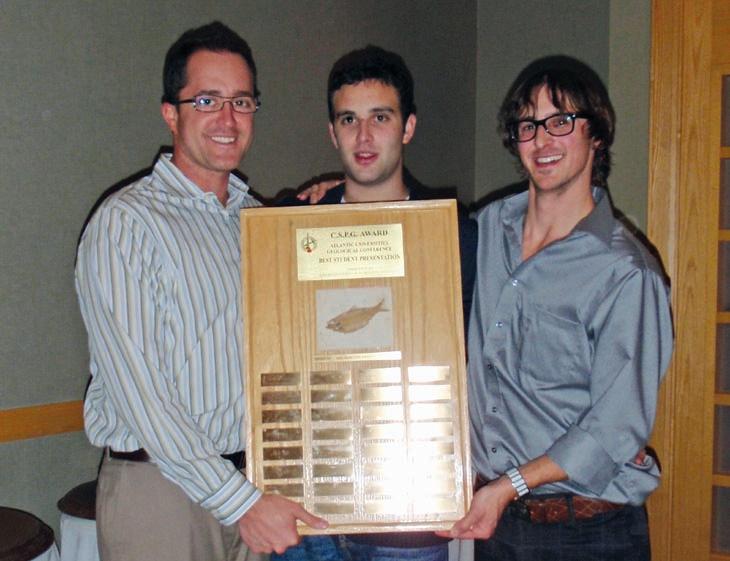
Figure 1. AUGC 2009 Organizing Committee (left to right): Greg Howard, Michael Warren, Linette MacInnis, Crystal Winters, Evan Gladney (missing are Dr. Jacob Hanley and Dr. Victor Owen).
Figure 2. CSPG Award Winner: Jordan Nickerson of Dalhousie (centre) being awarded the CSPG Award and $500 from Aaron Grimeau (left) and Cory MacNeill (right).
EDUCATION WEEK
|
By Tina Donkers
This year eight courses were offered and five of them had enough people registered to go ahead. In some cases there was enough registration to just cover costs. That is our main objective: to run courses on a break-even basis and offer our members an opportunity to brush up with a great training opportunity. After course costs and instructor honorariums are paid, any course profits are shared between the CSPG (60%) and the instructor(40%).
It is gratifying to know that despite the lower registration numbers that we were still able to offer five courses to the CSPG members in a year when companies are reducing budgets, particularly in areas of training. The number of registrations was down. A possibility for the reduced numbers is that some of the courses offered are at saturation point and the number of registrations could continue to decline in future years. Interest could be renewed with a higher number of new graduates in the industry. We would like to be able to offer more courses for the fall Education Week, but we have more difficulty attracting available instructors at that time of the year than we do at the spring conference.
The CSPG Education Committee would like to thank Husky Energy for their support, allowing Stuart Tye to volunteer his company time to co-instruct with Kerrie Bann for the course “Basic Core Logging with Integrated Ichnological Techniques.” It was obvious from the response of people registered in this course that it is still a well sought-after course. Other courses that were offered and are still popular are Basim Faraj’s “Shale Gas Critical Fundamentals, Techniques and Tools for Exploration Analysis”, Octavian Catuneanu’s “Sequence Stratigraphy: Principles and Applications” and Ashton Embry’s “Practical Sequence Stratigraphy, Concepts and Applications.” “Reservoir Geology of Sandstones” instructed by Godfried Wasser is a new course that was offered to the members this year. Thank you to the instructors who take the time to offer their courses for the benefit of the CSPG and its membership.
Evaluations generally were positive with some constructive criticism. One particular theme for several of the courses was to expand the course for an extra day with more core examples or practical work exercises.
Evaluations will be sent to instructors for their perusal to make changes if possible. Another comment heard on several occasions was “why not make colour copies for the notebooks.” Some of the course notes are in colour, whereas others are in black and white along with a colour copy of the notes on a CD. It comes down to balancing the budget and costs of the course relative to expected registration and remaining competitive in the market.
The Education Committee consists of a group of volunteers with various duties to pull the courses together. The volunteer committee and CSPG staff facilitate the booking and organization of courses, budgeting, accounting, advertising, and registration. I appreciate how everyone takes on their responsibilities and works together to help the committee achieve positive results. Heading up this great committee of volunteers is Travis Hobbs, and although Travis is ready to move on to new duties, particularly as a new dad, the rest of us appreciate his vast experience, knowledge, and continued commitment.
COMMENT ON LISA GRIFFITH’S PRACTICAL SEqUENCE STRATIGRAPH y: A wider horizon
I would like to thank Lisa Griffith for her kind words about my recent series of articles on sequence stratigraphy (Griffith, 2009). I would also note that a single file compilation of all these articles will be available for download from the CSPG website.
The main theme of Lisa’s comment, as reflected in her title “A Wider Horizon” is that she believes a paper by Catuneanu et al. (2009) provides a more comprehensive approach to sequence stratigraphy than that provided in my articles. I have to disagree with such an assessment from a number of perspectives.
First of all, Catuneanu et al. (2009) consider only a time-based approach in which surfaces are defined on the basis of site-specific events (see Figure 1 in Griffith, 2009). The lack of discussion of a material-based approach to sequence stratigraphy, in which surfaces are defined on the basis of recognizable, physical characteristics, limits the scope of the Catuneanu et al. (2009) paper.
Lisa repeats the view in Catuneanu et al. (2009) that a nomenclatural system for sequence stratigraphy is equivalent to a sequence stratigraphic model. All of us work with the same sequence stratigraphic model that was published by Jervey (1988) and that was based on the pioneering work of Barrell (1917) and Wheeler (1958). This basic model is derived from the input variables of a base level rise/ fall cycle with a constant sediment supply. In my articles, I discussed two variations of this basic model – a fast initial rise model and a slow initial rise model (see Figure 8 in Embry, 2008). Catuneanu et al. (2009) only consider one variation of the basic model – that of slow initial rise. Both these model variations have to
ROCK SHOP
be discussed if one is to understand the value of a given, proposed, nomenclatural system. A variety of options for a nomenclatural system have been proposed for the two variations of the basic sequence stratigraphic model. For example, Catuneanu et al. (2009) discuss five different nomenclatural systems which have been proposed (see Figure 1 of Griffith, 2009). Again, I would claim these sequence nomenclatural systems are not sequence models.
In my series I looked at ten different published proposals for sequence boundaries (see Figure 4 in Embry, 2009). These included six that are discussed in Catuneanu et al. (2009) as well as four others that have to be considered if a “wider horizon” is to be achieved for sequence stratigraphy.
Another difference between my articles and Catuneanu et al. (2009) is that I critically evaluated each proposed nomenclatural system on the basis of the validity and the practicality of the boundaries of the proposed units. Catuneanu et al. (2009) do not discuss the problem of the combination of surfaces that do not form a continuous boundary and also avoid a much needed discussion of the problem of a lack of any physical characteristics for some boundaries of proposed units.
Finally, in terms of comparing the breadth of both contributions, I would note that I defined and discussed eight surfaces of sequence stratigraphy that are currently in use. In contrast, Catuneanu et al. (2009) discuss only seven. By overlooking the slope onlap surface, Catuneanu et al. (2009 offered a narrower, not wider, perspective on sequence stratigraphy. I certainly agree with Lisa that the Catuneanu
et al. (2009) paper is worth reading, if only to gain a good understanding of the time-based approach to sequence stratigraphy. However, do not expect to gain a broad perspective on sequence stratigraphy or to find a critical evaluation of all the different methods which have been proposed.
R EFERENCES
Barrell, J. 1917. Rhythms and the measurements of geologic time. Geologic Society of America Bulletin, v. 28, p. 745-904.
Catuneanu, O., et al. 2009. Towards the Standardization of Sequence Stratigraphy. Earth Science Reviews. v. 92, p. 1-33.
Embry, A. F. 2008. Practical Sequence Stratigraphy VII: The base level change model for material-based sequence stratigraphic surfaces. Canadian Society of Petroleum Geologists, The Reservoir, v. 35, issue 11, p. 31-37.
Embry, A. F. 2009. Practical Sequence Stratigraphy X: The Units of Sequence Stratigraphy, Part 2, Timebased Sequences. Canadian Society of Petroleum Geologists, The Reservoir, v. 36, issue 3, p. 21-24.
Griffith, L. 2009. Practical Sequence Stratigraphy: A Wider Horizon. Canadian Society of Petroleum Geologists, The Reservoir, v. 36, issue 9, p. 19.
Jervey, M. 1988. Quantitative geological modeling of siliciclastic rock sequences and their seismic expression. In: Sea level changes: an integrated approach. C. Wilgus, B. S. Hastings, C. G. Kendall, H. W. Posamentier, C. A. Ross, and J. C. Van Wagoner, (eds.). Society of Economic Paleontologists and Mineralogists, Special Publication 42, p. 47-69.
Wheeler, H. E. 1958. Time stratigraphy. American Association of Petroleum Geologists Bulletin, v. 42, p. 1208-1218.
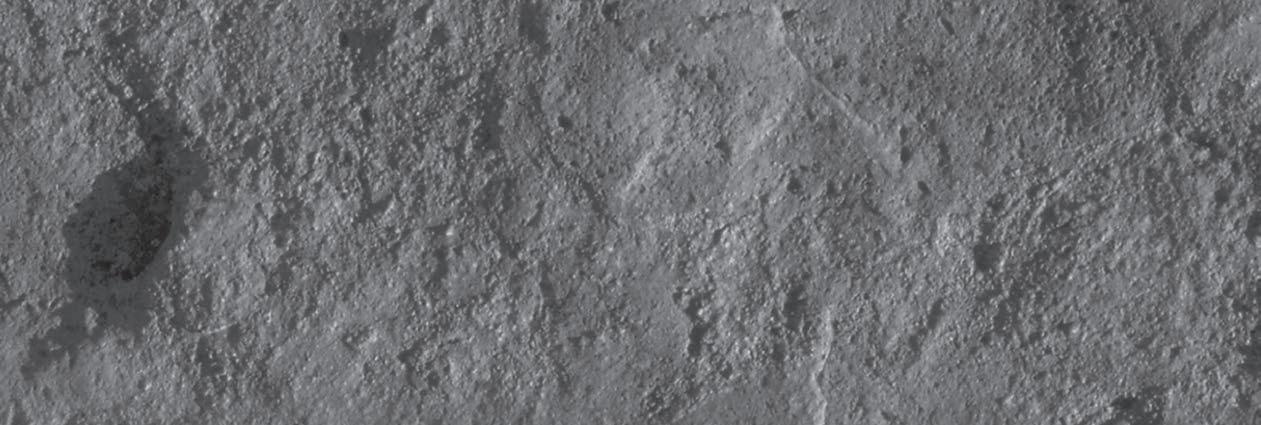
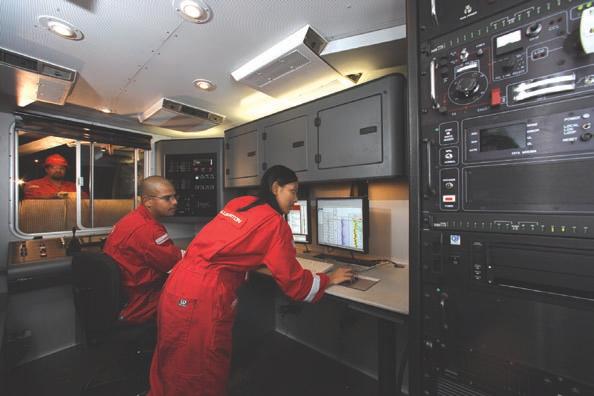
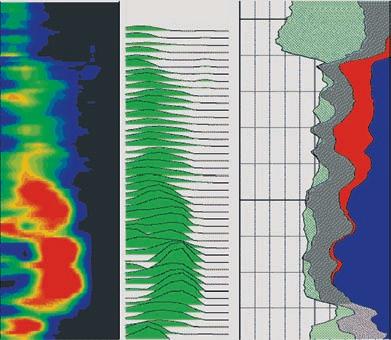

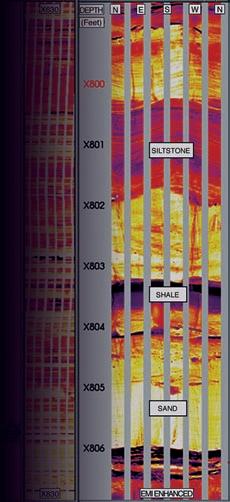


Halliburton Wireline and Perforating Services
reliableimaging solutions in the world—including the new Oil Mud ReservoirImager (OMRI™)
Range Micro Imager (XRMI™) tool version—both of which generate crisp, digitalwellboreimages across the full range of formation resistivitiesand with excellentvertical resolution.
Before you get in too deep, look into Halliburton Wireline and Perforating Services— the leader in reliability and service excellence. For more information, please visit us at www.halliburton.com/wireline. For rock-solid reliability— miles underground—look into our precise imaging
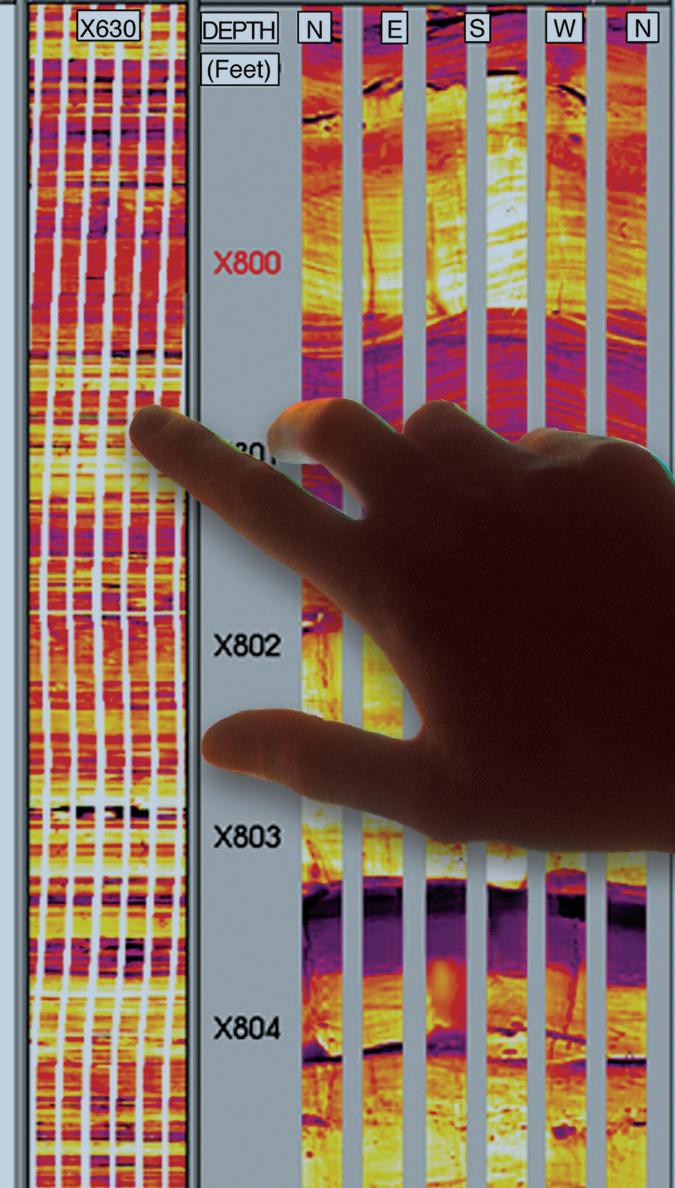

THANK YOU. Without you there, our industry-leading, fully-integrated solution wouldn’t be complete.