
BUDGET FY 2023-24 Operating Budget Capital Improvement Program Strategic Digital Transformation Investment Program C I T Y O F C A R L S B A D , C A L I F O R N I A
Budget preparation team
Finance team
Zach Korach, Finance Director
Brigid Drury, Finance Manager
Jeremy Bates, Senior Management Analyst
Bridget Desmarais, Management Analyst
Leadership team
Scott Chadwick, City Manager
Cindie McMahon, City Attorney
Geoff Patnoe, Assistant City Manager
Gary Barberio, Deputy City Manager, Community Services
Paz Gomez, Deputy City Manager, Public Works
Laura Rocha, Deputy City Manager, Administrative Services
Michael Calderwood, Chief, Fire Department
Maria Callander, Director, Information Technology
Sheila Cobian, Director, Legislative & Constituent Services
Tom Frank, Director, Public Works Transportation
Morgen Fry, Management Analyst, Office of the City Manager
David Graham, Chief Innovation Officer, Innovation & Economic Development
Jason Haber, Director, Intergovernmental Affairs, Office of the City Manager
Zach Korach, Director, Finance
Kyle Lancaster, Director, Parks & Recreation
Faviola Medina, City Clerk Services Manager, Office of the City Clerk
Mandy Mills, Director, Housing & Homeless Services
Jeff Murphy, Director, Community Development
Vicki Quiram, Director, Public Works Utilities
Kristina Ray, Director, Communication & Engagement
Suzanne Smithson, Director, Library & Cultural Arts
Judy Von Kalinowski, Director, Human Resources
Mickey Williams, Chief, Police Department
James Wood, Jr., Director, Public Works Environmental Sustainability
Department budget preparers & reviewers
Shoshana Aguilar, Utilities
Sue Armstrong, Communication & Engagement
Amanda Baker, Police
Bonnie Elliott, Parks & Recreation
Ed Garbo, Risk Management
Brent Gerber, Information Technology
Chad Kantner, Utilities
John Maashoff, Fleet & Facilities
Jennie Marinov, Fire Department
Roxanne Muhlmeister, Finance
Robin Nuschy, City Attorney’s Office
Megan Powers, Environmental Sustainability
Kim Riboni, Finance
Jason Rosado, Finance
Sarah Sanders, Risk Management
Richard Schultz, Library & Cultural Arts
Baq Taj, Construction Management & Inspection
Rosario Aranda, Housing & Homeless Services
Conrad Avila, Finance
Pat Downie, City Clerk’s Office
Fiona Everett, Library & Cultural Arts
Shawn Gaskari, Fleet & Facilities
Kayla Hanner, Finance
Esther Lan, Transportation
Tom Mallory, Communication & Engagement
Debbie Jo McCool, Library & Cultural Arts
Bradley Northup, Fleet & Facilities
Debbie Porter, Human Resources
Sarah Reiswig, Workers’ Compensation
Lauren Rogers, Finance
Laureen Ryan, Community Development
Katie Schroeder, City Treasurer’s Office
Craddock Stropes, Public Works Admin.
Cynthia Vigeland, Community Development
INTRODUCTION City Manager’s transmittal letter A-1 Readers guide A-5 Budget process .............................................................................................................................A-6 5-Year Strategic Plan A-8 Annual workplan ..........................................................................................................................A-9 Community engagement A-11 About Carlsbad A-13 Organization chart ........................................................................................................................A-20 Fiscal issues and financial management A-21 Financial management policies ....................................................................................................A-24 Appropriation limit A-28 Debt management .......................................................................................................................A-29 Basis of budgeting ........................................................................................................................A-31 Budgetary fund structure A-32 Budget awards .............................................................................................................................A-34 OPERATING BUDGET Overview B-1 Revenue B-2 Expenditures ................................................................................................................................B-13 Personnel allocations B-21 Schedule of projected fund balances ...........................................................................................B-23 Schedule of revenue estimates B-25 Schedule of budget expenditures ................................................................................................B-31 PUBLIC SAFETY Summary C-1 Organization chart ........................................................................................................................C-2 Fire Department ...........................................................................................................................C-3 Police Department C-10 PUBLIC WORKS Summary D-1 Organization chart D-2 Public Works Administration ........................................................................................................D-3 Construction Management & Inspection D-5 Environmental Sustainability .......................................................................................................D-7 Fleet & Facilities D-14 Transportation D-19 Utilities .........................................................................................................................................D-26 COMMUNITY SERVICES Summary E-1 Organization chart ........................................................................................................................E-2 Community Services Administration E-3 Community Development E-5 Housing & Homeless Services ......................................................................................................E-16 Library & Cultural Arts E-26 Parks & Recreation .......................................................................................................................E-41
TABLE OF CONTENTS
ADMINISTRATIVE SERVICES
STRATEGIC DIGITAL TRANSFORMATION INVESTMENT
CA PITAL IMPROVEMENT PROGRAM
Summary F-1 Organization chart F-2 Administrative Services Administration .......................................................................................F-3 Finance F-5 Human Resources ........................................................................................................................F-7 Information Technology F-14 Innovation & Economic Development F-16 Miscellaneous Non-Departmental ...............................................................................................F-18 POLICY & LEADERSHIP Summary G-1 Organization chart ........................................................................................................................G-2 Office of the City Council G-3 Office of the City Treasurer G-5 Office of the City Manager ...........................................................................................................G-7 Office of the City Attorney G-9 Office of the City Clerk .................................................................................................................G-11 Communication & Engagement G-13
PROGRAM Overview H-1 Investing in digital transformation ...............................................................................................H-2 Project evaluation H-2 Strategic Digital Transformation Investment Program projects H-4 Estimated total appropriations by goal H-5 Projects to pursue communitywide digital transformation H-7 Projects to build capacity for data-driven decision making .........................................................H-13 Projects to foster a vibrant civic engagement culture H-17 Projects to enhance accessibility and transparency ....................................................................H-18 Projects to promote security and sustainability through connectivity ........................................H-20 Minor projects H-24 Future projects .............................................................................................................................H-24 Detail five-year schedule of projects by Connected Carlsbad goal H-27 Detail five-year schedule of projects by fund ..............................................................................H-28 Project funding sources H-29 Projected fund balances H-29 Revenue projections schedule H-30 Budget expenditure schedule H-30 Project estimated operational requirements ...............................................................................H-31 Fiscal year 2023-24 roadmap H-32 Five-year roadmap .......................................................................................................................H-33
Overview ......................................................................................................................................I-1 Investing in our quality of life I-2 Project evaluation ........................................................................................................................I-2 Fiscal year 2023-24 appropriations by category I-3 New capital improvement projects I-5 Capital Improvement Program revenues .....................................................................................I-10 Future growth and development I-11
Future projects .............................................................................................................................I-12 Calculation of future fees .............................................................................................................I-13 Unfunded projects I-13 Projected fund balances for fiscal year 2022-23 ..........................................................................I-14 Projected fund balances for fiscal year 2023-24 I-15 Revenue projections schedule .....................................................................................................I-16 Budget expenditure schedule I-17 Project estimated operational requirements I-18 Detail 15-year schedule of capital projects ..................................................................................I-19 Capital Improvement Program summary by fund I-31 Glossary of capital project funding sources .................................................................................I-43
Planned major capital outlay items fiscal year 2023-24 J-1 Fund classifications and descriptions ...........................................................................................J-3 Department/fund relationship J-9 Glossary ........................................................................................................................................J-11 Acronyms J-13 Budget communications J-15 General Fund forecast ..................................................................................................................J-17 Resolutions adopting the budget J-35
APPENDICES
Future projects .............................................................................................................................I-12 Calculation of future fees .............................................................................................................I-13 Unfunded projects I-13 Projected fund balances for fiscal year 2022-23 ..........................................................................I-14 Projected fund balances for fiscal year 2023-24 I-15 Revenue projections schedule .....................................................................................................I-16 Budget expenditure schedule I-17 Project estimated operational requirements I-18 Detail 15-year schedule of capital projects ..................................................................................I-19 Capital Improvement Program summary by fund I-31 Glossary of capital project funding sources .................................................................................I-43
Planned major capital outlay items fiscal year 2023-24 J-1 Fund classifications and descriptions ...........................................................................................J-3 Department/fund relationship J-9 Glossary ........................................................................................................................................J-11 Acronyms J-13 Budget communications J-15 General Fund forecast ..................................................................................................................J-17 Resolutions adopting the budget .J-35
APPENDICES

Dear City Council:
The City Council’s prudent budget policies and disciplined focus on long-term strategic goals have resulted in a fiscal year 2023-24 budget that invests in the community’s top priorities, while continuing to set money aside for future infrastructure needs and grow the city’s cash reserves. Notably, this budget also reduces base spending to help bring future projected expenditures into alignment with expected revenues.
Budget Overview
The fiscal year 2023-24 budget maintains the city’s high level of service, which includes several programs added in recent years to address the City Council’s top priorities. These include a beach lifeguard program, a program to reduce homelessness, an additional fire station and two additional ambulances, a police ranger program for city parks and trails, increased spending on the arts, more pool lifeguards, additional parks and enhanced efforts to protect the environment.
The budget also reflects increasing costs due to inflation and supply chain issues and includes new and expanded services to meet state mandates from the last several years that did not come with new funding. This includes housing laws, stricter recycling regulations, protecting water quality and managing public records.
Even with these pressures, the fiscal year 2023-24 budget reduces city staffing by the equivalent of 12 positions and identifies various base spending reductions totaling $2.3 million in the General Fund and $3.3 million citywide, at a time when inflation is 6%.
All city departments continue to follow a data-driven approach to budgeting, which has allowed the City Council to make strategic decisions about where to focus resources and how to phase in larger investments over time.
The City Council’s 5-Year Strategic Plan
The adoption of the City Council’s 5-Year Strategic Plan in 2022 allows staff to focus on five main areas, with the annual budget outlining how the city will work to accomplish the strategic plan’s objectives and work toward the plan’s vision in the year ahead.
Community Character Maintain Carlsbad’s unique community character and connectedness
In five years, even though the city has grown and changed, residents agree that it still has the smalltown beach community character and connectedness that made them want to live here in the first place. Diverse community members of all ages enjoy participating in the wide array of programs and events offered by the city, where they run into neighbors, meet new friends and, mostly importantly, feel welcome and included.

A-1
Quality of Life and Safety
Prioritize the safety and well-being of the community
In five years, the City of Carlsbad remains one of the safest cities in the region due to new investments in fire and emergency medical services and a well-equipped and highly trained Police Department that enjoys excellent relationships with the community. Critical infrastructure like roads and pipes are well-maintained, while parks, community centers, libraries and other facilities reflect the community’s high standards.
Sustainability and the Natural Environment
Protect the environment and natural resources

In five years, thanks to the city’s strategic approach to environmental sustainability, Carlsbad is seen as a model for how to leverage partnerships and innovation to achieve climate and environmental goals. City residents and businesses feel supported in their own environmental sustainability efforts, whether it’s complying with new mandates or taking advantage of opportunities to go above and beyond. As a result, the city has met or exceeded goals for eliminating greenhouse gas emissions, reducing what goes to landfills, keeping creeks, lagoons and the ocean clean, and protecting native habitat and natural open space.
Economic Vitality

Foster a healthy local economy
In five years, the City of Carlsbad has a strong and diverse economy that combines a thriving small business community with leading industries of the future. Smart, talented professionals want to work here, and entrepreneurial leaders want to invest in their own startup ventures. Those looking to grow their skills will find opportunities for workforce development in Carlsbad. Carlsbad has excellent relationships with key industries, business organizations, other cities in the region, and academic institutions. By achieving this goal, the city as a whole is financially stable and more residents have the jobs they want right in their own backyards.
Organizational Excellence and Fiscal Health


Be a model for effective and efficient local government
In five years, the City Council, the community and city employees have remained aligned around common goals established in the 5-Year Strategic Plan. This sustained focus has not only generated measurable results, it has translated into operational efficiencies and cost savings. The very best in their fields want to work for the City of Carlsbad because of the culture that has been created around innovation, inclusivity and engagement. The city’s financial health has been maintained while meeting or even exceeding the community’s high expectations for service delivery. Investments in technology have led to enhanced efficiency, transparency, accountability and value.
Local traffic safety emergency
Much of the previous fiscal year was spent under a proclamation of local emergency to address traffic safety. When ratifying the local emergency Sept. 27, 2022, the City Council appropriated $2 million from the fiscal year 2021-22 budget surplus to fund immediate safety education, engineering and enforcement actions. In addition to this funding, staff reprioritized existing projects and resources to reflect the local emergency needs.
A-2
Although the traffic safety emergency continues into fiscal year 2023-24, no additional funding has been requested. As of this writing, the emergency is scheduled to end Sept. 8, 2023, pending any significant change in conditions. At this time, the city would continue the ongoing work initiated under the emergency proclamation as part of normal daily operations. This includes providing traffic safety training and education, partnering with local schools, reconfiguring roads and enhancing enforcement in key collision areas.
Changes to the budget
The fiscal year 2023-24 budget reflects a call for all departments to increase efficiency and find new ways to reduce ongoing spending. In addition to lowering base spending in the General Fund by $2.3 million at a time when inflation is 6%, the proposed budget reduces city staffing by the equivalent of 12 positions.
Because the city has forecasted that ongoing spending will exceed ongoing revenues as soon as fiscal year 2025-26, this year’s budget scales back custodial services, nonessential parks maintenance, printing and other administrative expenses, travel and training for city staff, and city cell phone use, among other areas expected to have a minimal impact on the community.
Due to ongoing economic uncertainty, city staff will provide regular financial updates to the City Council throughout fiscal year 2023-24. Identifying a potential structural deficit early has allowed the city to take a thoughtful approach to solutions, exploring new ways to reduce spending and increase revenue.
Capital Improvement Program
The City of Carlsbad Capital Improvement Program reflects the city’s ongoing commitment to maintaining the highest standards of quality facilities for our community today and in the future.
The fiscal year 2023-24 Capital Improvement Program includes $97.7 million in new appropriations to support construction and maintenance projects, including those related to streets, libraries, parks, fire stations, administrative facilities, and water, sewer and drainage facilities. In total, 227 projects are planned over the next 15 years.
Five new projects totaling $2.7 million in fiscal year 2023-24 are proposed to be added to the program, including traffic safety projects and projects that support the strategic plan.
Strategic Digital Transformation Investment Program
Over the years, the city’s use of technology has become as critical to city operations as traditional infrastructure. The city’s Strategic Digital Transformation Investment Program increases efficiencies, security, transparency and data-driven decision making through investments in the city’s digital infrastructure. In total, 44 continuing and new projects are planned over the next five years.
The fiscal year 2023-24 budget includes $4.57 million in new budget appropriations to support digital transformation projects.
A-3
General Fund reserve
The City Council has a policy to maintain the equivalent of 40% of the annual General Fund operating budget in a reserve account. This helps ensure that during emergencies and economic downturns the city can continue to meet the community’s needs. In June 2023, the city was projected to have $112.9 million in reserves or 59% of the annual General Fund operating budget.
Pension strategy
At a time when cities throughout California are challenged by increasing payments into the California Public Employees' Retirement System, the City of Carlsbad’s pension is funded at 86%, exceeding the City Council’s target of 80%.
Decisions to invest surplus budget funds over the past eight fiscal years to pay down pension debt and implementing a lower pension benefit for new hires (in advance of statewide pension reforms) has reduced pension liability for the City of Carlsbad. However, continued vigilance is needed, as CalPERS investment returns, which help fund pension benefits, remain vulnerable to market volatility.
Looking to the future
The city remains financially healthy today, with a AAA credit rating, healthy reserves and among the lowest pension debts in the region, even though we face new fiscal challenges as we transition from a growing city to one focused on maintaining its high level of service in the face of increasing costs and changes to revenue sources.
Fees from development, which have funded much of the city’s current infrastructure, are expected to decrease as the last major new master planned communities in Carlsbad are built. In the city’s fiscal year 2023-24 budget, development revenue is down 21% overall.
We knew this was coming, and that’s why the city has implemented several new budget policies and added rigor to the annual budget process. Work has also begun on a multi-year process to develop a new framework for managing growth in a way that protects our quality of life and the city’s financial health.
Finally, the City Council’s approval of Carlsbad’s first long-term strategic plan will focus resources on those things most important to the community as we prepare for the future.
I would like to thank the City Council for its continued leadership and commitment to those we serve. Your prudent stewardship has helped Carlsbad set the standard for responsive and transparent local government, working in partnership with the community to realize a shared vision for the future.
Sincerely,
 Scott Chadwick City Manager
A-4
INTRODUCTION
The annual budget is the most significant expression of how City Council policies are translated into daily operations. In this document, you will see where the city gets the money it uses to carry out its mission and how that money will be spent during the fiscal year that begins July 1, 2023
More than a spending plan, the annual budget is also intended to provide a window into the complex and dynamic economic environment within which your local government operates. As such, this document reviews local, state and national trends affecting city finances, as well as demographic information, regulations and policies that affect how, when and where the city invests resources.
READERS GUIDE
Some of the information included in this budget document is required by state law. Other details are provided for context and transparency. More than anything, city staff have prepared this budget to serve as a practical guide and tool for ensuring the City of Carlsbad lives up to its standard of being the best run government, period.
The following information is included in the four main sections of the budget:
Introduction
• Information about the city, its size, its demographics, the city government structure and other background
• How the budget is prepared and approved
• Input city staff received from the public and how it has been incorporated into city spending priorities
• The economic and fiscal issues facing the city
• Financial management policies
Operating Budget
• An overview of where the city gets the money (“revenue”) to fund daily operations
• A big picture summary of city staffing levels, spending broken out into different categories and other aggregate information
• Detailed budgets for all city functional areas
Strategic Digital Transformation Investment Program
• Major city digital transformation projects (online permitting, records management system, police computer aided dispatch system, hardware and software, security strategy, etc.) included in this year’s budget
• How projects are identified and prioritized
• Sources of funding and long-term plan
Capital Improvement Program
• Major city construction projects (roads, water and wastewater systems, parks, etc.) included in this year’s budget
• How projects are identified and prioritized
• Sources of funding and long-term plan
A-5
BUDGET PROCESS
The City Council sets the overall policy direction for the City of Carlsbad and helps staff prioritize programs, projects and services to support that direction. Public input plays a critical role in setting both the long-range policy direction of the city and decisions about day-to-day spending. The city operates on a fiscal year that begins July 1. City staff in all departments prepare individual budgets for their functional areas. These budgets are then combined into an overall city budget that is presented to the City Council each spring for review and input.
The City Council has the authority to approve the annual budget and may amend it during the year if needed. The legal level of budgetary control is at the fund level, which means spending in each different type of fund may not exceed the budgeted amount without City Council approval. Additional information regarding the budgetary controls can be found in the resolution approving the annual operating budget in the appendices.
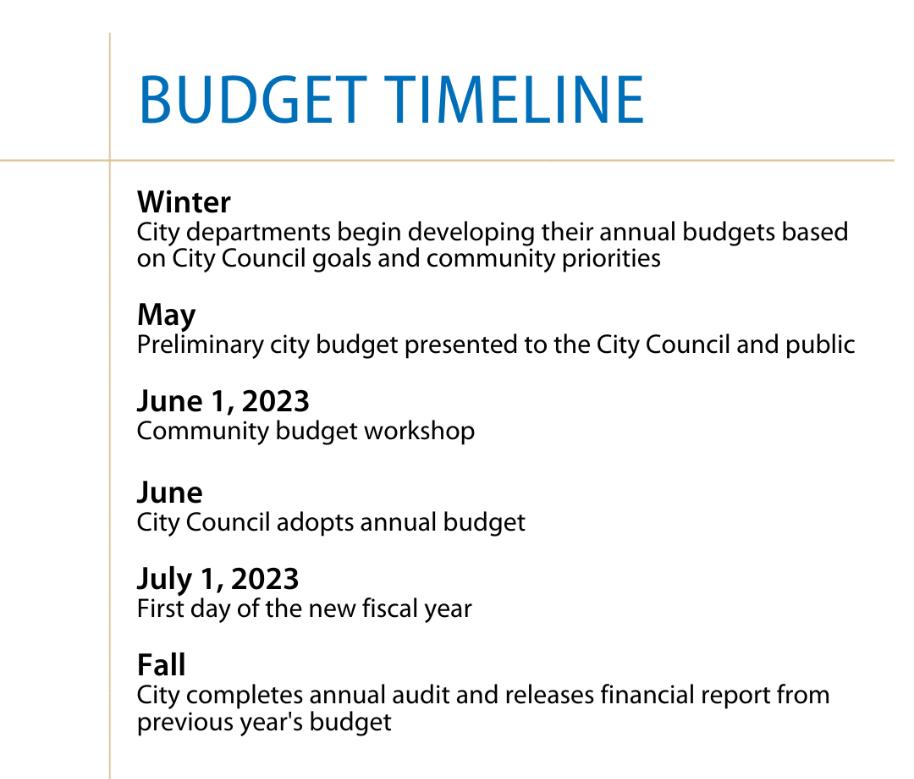
December
Finance Department staff hold individual meetings with departments to discuss budget goals and timelines for the upcoming fiscal year. Finance Department staff also prepare base budgets for each department during this time based on prior fiscal year appropriations.
January
City staff hold a budget kick-off meeting to discuss priorities for the upcoming budget cycle, any changes to the budget process compared to last fiscal year, and the calendar for submission of required budget forms. Departments begin developing their budget submissions based on the base budgets provided by the Finance Department and their needs and budget guidelines for the new fiscal year
A-6
February
Departments provide their budget submissions to the Finance Department. These submissions include any requests departments make to amend their budgets, along with general information about existing personnel allocations and budget for professional and outside services. Finance Department staff review submissions, analyze requested budgets and work with departments to make any necessary changes.
March
Departments present their budgets, including significant changes and requests for new funding, to the City Manager. Departments submit estimates for current fiscal year-end revenues and expenditures to Finance.
April
Based on meetings with individual departments, the City Manager decides the budget that will move forward for City Council consideration. Finance Department staff prepare the preliminary budget document.
May
Staff present the preliminary budget to the City Council for consideration. After this public meeting, staff amends the preliminary budget document for any City Council-directed changes. City staff also hold a public budget workshop to discuss the preliminary budget with the community and answer questions about it.
June
At a public hearing, staff present the final proposed budget to the City Council for consideration and adoption.
A-7
5-YEAR STRATEGIC PLAN
The City of Carlsbad is guided by a 5-Year Strategic Plan, which was adopted by the City Council in 2022. The plan serves as a road map during the budget process by identifying specific, measurable objectives to be achieved during the five-year timeframe.
The plan was developed by working closely with the community to identify a vision for the Carlsbad community, strategic plan goals and project priorities. The community will continue to be engaged in refining specific projects and initiatives within the strategic plan as it is implemented. This input is also incorporated into the annual budget process.
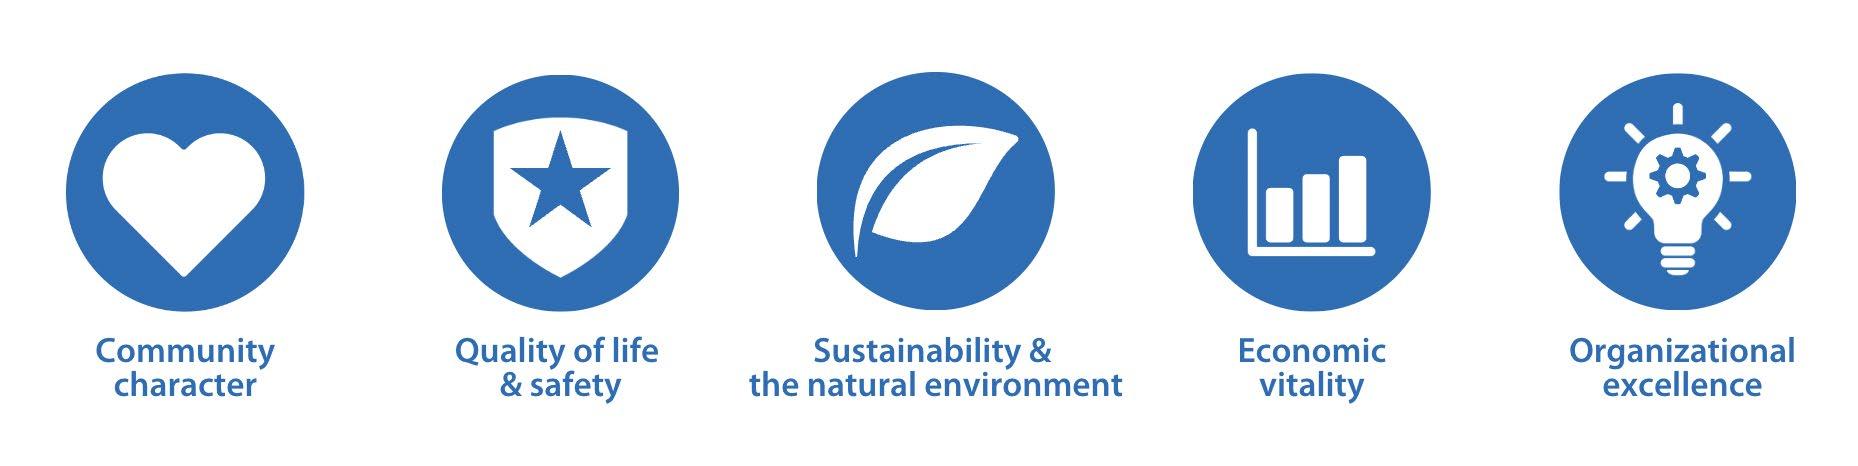
2023-2027 Strategic Goals
The 5-Year Strategic Plan includes high level goals, objectives, projects and service commitments that support the Carlsbad Community Vision.
Core Services
The city fulfills its purpose and supports the 5-Year Strategic Plan goals every day by providing core services and functions of municipal government at a very high level of quality. From a resource perspective, these ongoing services represent the vast majority of the city’s annual budget.
A-8
ANNUAL WORKPLAN
Specific work plans and resource allocations to support the 5-Year Strategic Plan are developed each year and included in each department’s budget program summaries. Some of the key initiatives, projects and services that support strategic plan goals in the fiscal year 2023-24 budget include:
• Begin planning for Carlsbad’s newest park, Robertson Ranch Community Park.
• Work with the veterans’ community to develop a vision for public art at Veterans Memorial Park.
• Present recommendations from a growth management citizens committee and continue to the next step of developing a new approach to managing growth, based on the City Council’s direction.
• Complete the development of objective design standards for new multifamily and mixed -use projects, helping to ensure their design complements Carlsbad’s unique character.

• Seek funding to advance a project to lower the railroad tracks through the Village and Barrio areas.
• Provide high quality library services, programs and events that bring people together and support lifelong learning.
• Accept applications for a new Mills Act program to allow owners of historic properties to receive a property tax break in exchange for restoration efforts.
• Continue to implement a comprehensive Homeless Action Plan to help address homelessness in Carlsbad and its effects on the community.
• Provide affordable housing through a variety of programs and policies reflected in the city’s approved Housing Element.
• Continue a high level of public safety services including a full-service Police Department, fire and emergency medical services, a park ranger program and city lifeguards.
• Manage, maintain and enhance the city’s roadways to provide a safe, efficient and costeffective multi-modal transportation system.
• Promote traffic safety through cooperative programs with local schools, businesses and other partners, safety training programs, enforcement and public education.
• Continue to provide school resource officers and crossing guards to local schools.

A-9
• Complete an update to the city’s Climate Action Plan.
• Increase citywide electric vehicle charging infrastructure and transition fleet vehicle purchases to electric vehicles, with the exception of public safety vehicle purchases, which will be electric where feasible.
• Maintain the city’s 6,200 acre preserve system according to the standards of the city’s Habitat Management Plan.

• Continue to implement new sustainable materials management programs, including organics recycling and reducing use of single use plastics.
• Create a strategic approach for a vibrant economy that includes talent and workforce strategies, small business assistance, inclusive growth and diverse business support, key industry cluster development, and fostering of an ecosystem for startups and entrepreneurs to thrive.
• Provide resources to grow and support key industries in Carlsbad’s economy.

• Support the long-term viability of small businesses, startups and entrepreneurs in partnership with local and regional collaborators.
• Implement the policies and programs in the Carlsbad General Plan and Economic Development Strategic Plan based on annual budget appropriations by the City Council.
• Implement a new performance tracking, management and reporting program for the 5Year Strategic Plan.
• Foster a culture of continuous improvement that equips the organization to deliver excellent service to the community.

• Expand the city’s Digital Information Network.
• Implement a new Enterprise Asset Management System.
• Implement a new Computer Aided Dispatch system with a real time crime center.
• Implement new tools for citywide project management.
• Attract and retain a talented, diverse and engaged workforce.
• Maintain CalPERS funded status of 80% or greater (Council Policy No. 86).
A-10
COMMUNITY ENGAGEMENT
The City of Carlsbad is guided by two documents built on extensive feedback from the community:
• Carlsbad Community Vision
• City Council 5-Year Strategic Plan
The Carlsbad Community Vision was first developed over 10 years ago through an 18-month public engagement process. Since that time, the city has checked in with the community every few years to validate the nine core values that make up the community’s vision for the future.
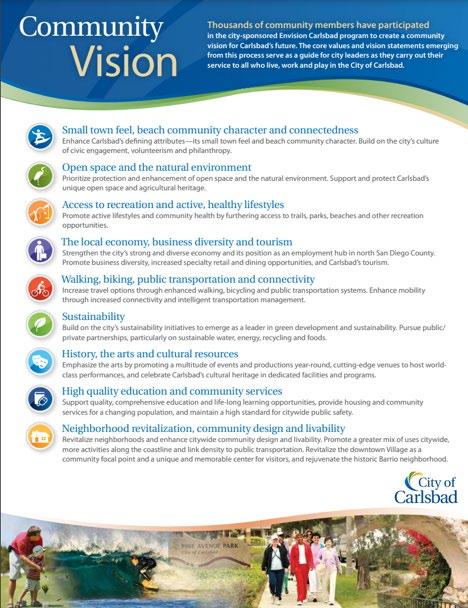
While areas of emphasis have shifted based on current events, the economy and other factors, the values have stood the test of time.
Strategic Planning Input Process

In 2021, the City Council decided to develop a 5-Year Strategic Plan that focuses building momentum on a limited number of priority goals. Previously, the City Council developed goals annually, often causing new goals to be added to the list before the previous year’s goals could be completed. As a result, progress could be slowed as staff’s efforts were spread among too many competing priorities.

Starting with the Carlsbad Community Vision, the City Council chose five main areas of focus within the Community Vision, based on input received from the community. Then, the public was invited to share their ideas and priorities within each area. This public engagement process yielded the largest amount of community input since the city launched a formal community engagement program in the early 2000s.
The fiscal year 2023-24 budget represents the work plan and resource allocation for year two of the strategic plan’s implementation.
A-11
Ongoing Input
The city continues to engage the community on specific projects and initiatives within the strategic plan. Input helping to shape decisions reflected in the fiscal year 2023-24 budget included:

• Over 500 comments received at meetings of the City Council and city boards, commissions and committees.
• Over 700 emails from community members.
• Public workshops, online surveys and other engagement for specific projects:
o A new approach to managing growth
o Locations for new housing in Carlsbad
o Design standards for new multi-family and mixed use projects
o Designs for permit ready ADU plans
o Public art for Fire Station 2
o Traffic safety priorities
o Road improvements for the south Carlsbad coastline, Tamarack and Carlsbad Boulevard and the area around Kelly Elementary School
o Reducing speeding on Tamarack Avenue between Skyline and Adams
o Reducing speeding in 11 residential neighborhoods
o Improving lighting in the Barrio
Budget Input
Finally, the city also sought input on the budget itself through a public workshop, public meetings, social media and other channels. The Budget Communications appendix at the end of this document contains more information on the city’s efforts.
A-12

A-13
CARLSBAD, CALIFORNIA
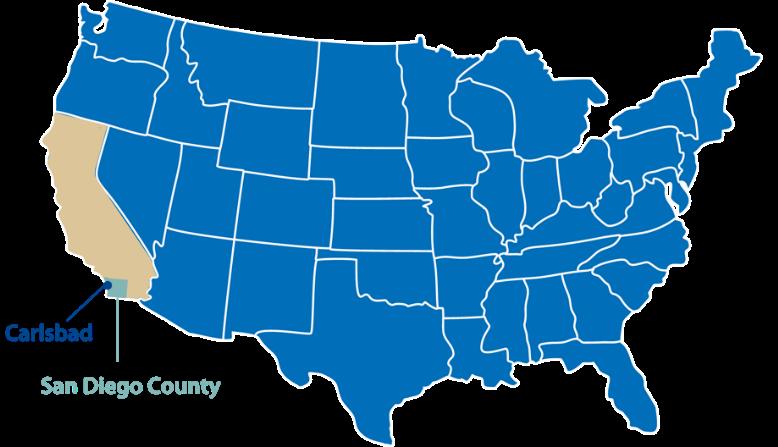
The City of Carlsbad is situated in north San Diego County where a great climate, beautiful beaches and lagoons, and abundant natural open space combine with world class resorts, family attractions, wellplanned neighborhoods, a diverse business sector and a charming village atmosphere to create the ideal California experience.
Our History
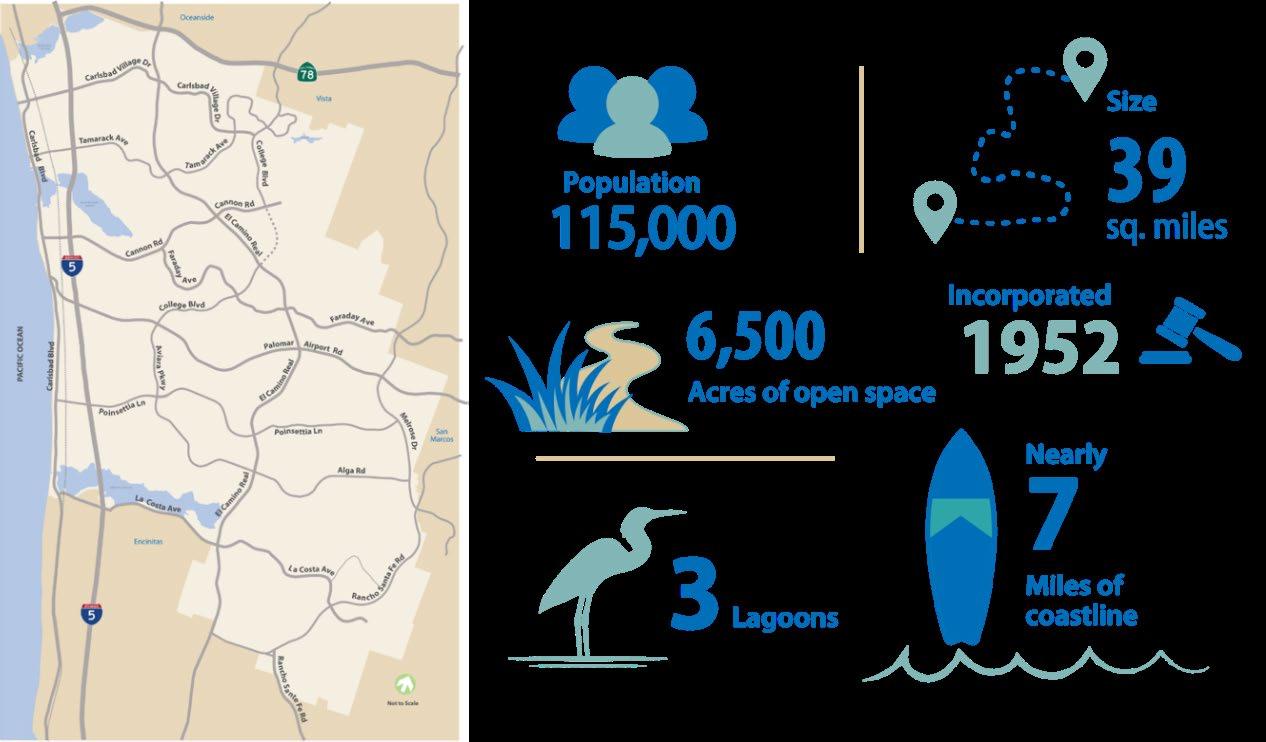
Named for a famed 19th Century European spa whose mineral springs were found to be remarkably similar to those found here, the City of Carlsbad’s history reflects the heritage of many cultures. The shoreline of the city’s Agua Hedionda Lagoon was home to the indigenous Luiseño and Diegueños Indians for centuries before the arrival of the Spaniards. The area known today as Carlsbad was once a territory of Spain and then Mexico. The City of Carlsbad was incorporated in 1952 and today is home to more than 100,000 people. Guided by an award-winning growth management plan approved by voters in 1986, the City of Carlsbad has matured into a well-rounded community where parks, roads and other infrastructure have kept pace with development. Now that the period of rapid growth is coming to an end, the city is focused on sustaining an excellent quality of life for residents and continuing to foster a strong sense of community.
A-14
CITY GOVERNMENT
The City of Carlsbad is a municipal corporation following the council-manager form of government. The City Council, the city’s legislative body, defines the policy direction of the city. The city manager oversees the day-to-day operations of the city. The City of Carlsbad also has an elected City Clerk and City Treasurer
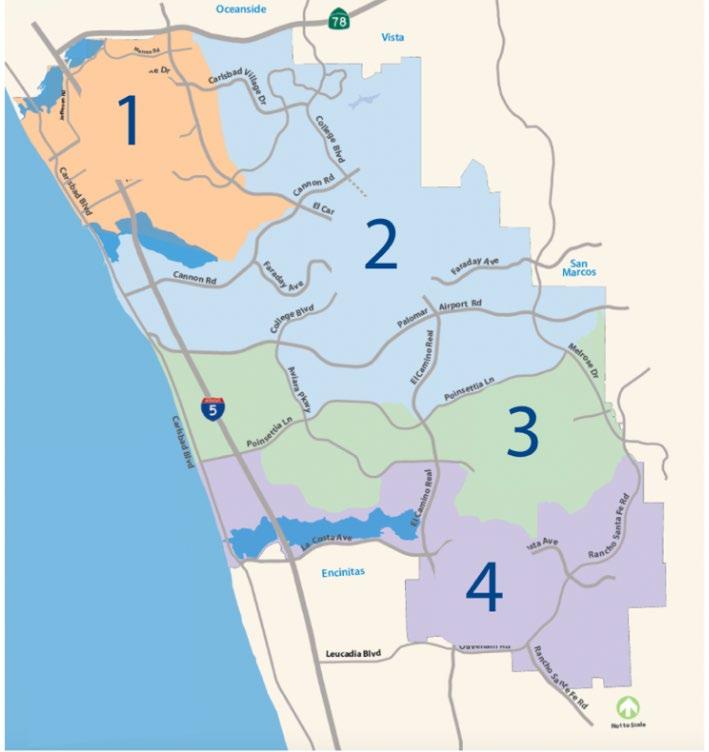
Districts
The City Council consists of an elected mayor and four elected council members. Each serves a four-year term. In 2017, the city switched to a system where City Council members are elected by district instead of at large or citywide. District boundaries were updated following the 2020 Census.
Charter City
There are two types of cities in California: charter and general law. Charter cities follow the laws set forth in the state’s constitution along with their own adopted “charter” document. General law cities follow the laws set forth by the state legislature.
In 2008, City of Carlsbad residents voted to approve the charter city measure, Proposition D, by 82%. The charter gives the City of Carlsbad more flexibility on such issues as purchasing and contracting, because the process mandated by the state can be expensive and cumbersome, causing project delays. Certain affairs, such as traffic and vehicle regulation, open and public meetings laws, certain planning and environmental laws, and eminent domain, remain matters of state authority even as a charter city.
Boards and Commissions
The City Council appoints members to a variety of boards and commissions, which provide opportunities for community engagement and recommendations to the City Council.
Agricultural Conversion Mitigation Fee Committee
Arts Commission
Beach Preservation Commission
CDBG Commission
Golf Lodging Business Improvement District
Historic Preservation Commission
Housing Commission
Library Board of Trustees
Parks & Recreation Commission
Planning Commission
Senior Commission
Tourism BID
Traffic & Mobility Commission
Village & Barrio Design Review Committee
A-15
DEMOGRAPHICS
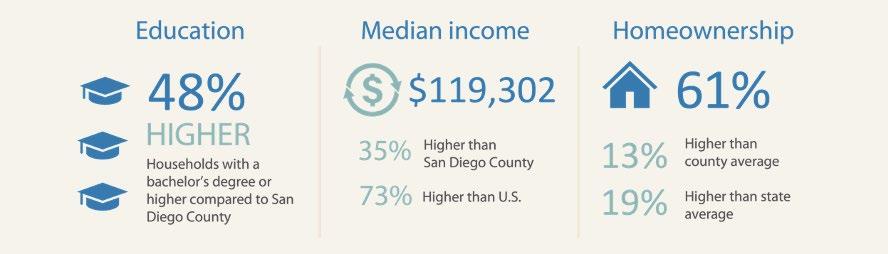
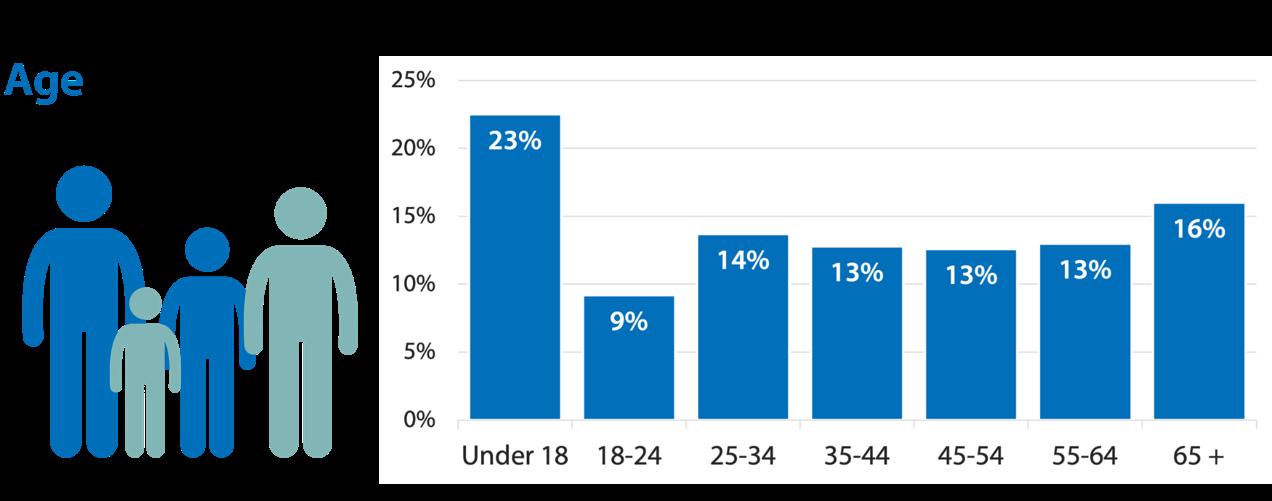
A-16
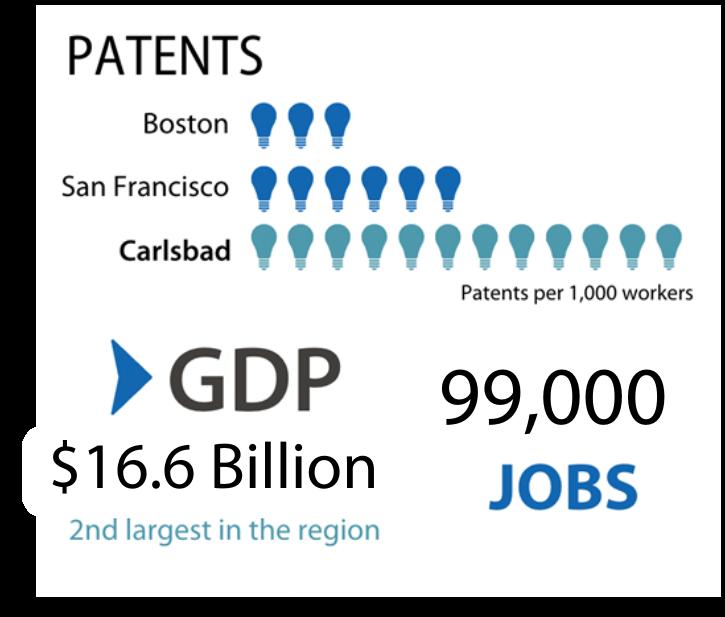
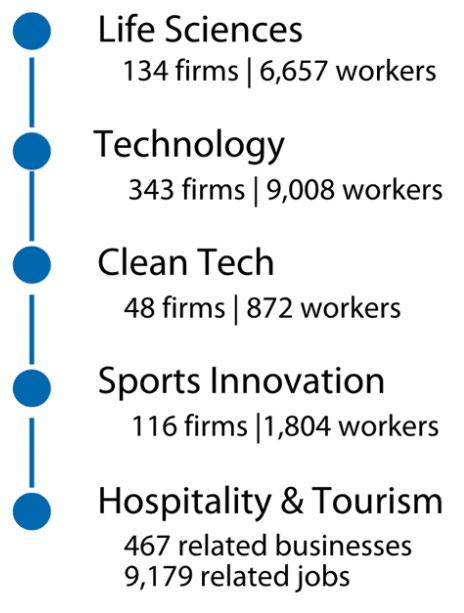
BUSINESS SECTOR
Top Employers
Top Industries (as of 2022 survey)
Top Sales Tax Generators*
Apple Stores Life Technologies
Bob Baker Chrysler/Dodge/Jeep/Ram Lowe’s Home Centers
Bob Baker Hyundai Omni La Costa
Bob Baker Subaru Park Hyatt Aviara Resort
Chevron Service Stations Premier Cadillac/Buick/GMC of Carlsbad
Costco Wholesale Premier Chevrolet of Carlsbad
Fashionphile Premier Kia of Carlsbad
Hoehn Motors Shell Service Stations
Jaguar/Land Rover Carlsbad Tesla
Ken Grody Ford Toyota Scion
Legoland California Viasat
Legoland Food & Beverage Vons Grocery Company
Lexus Carlsbad
*Alphabetical order
A-17
Name Industry Employees Viasat Information Technology 4,213 Legoland California Hospitality and Tourism 2,300 Thermo Fisher Scientific Life Sciences 2,332 Carlsbad Unified School District Education 1,094 Omni La Costa Resort & Spa Hospitality and Tourism 900 City of Carlsbad Government 783 Gemological Institute of America Research and Education 771
HOW CARLSBAD COMPARES


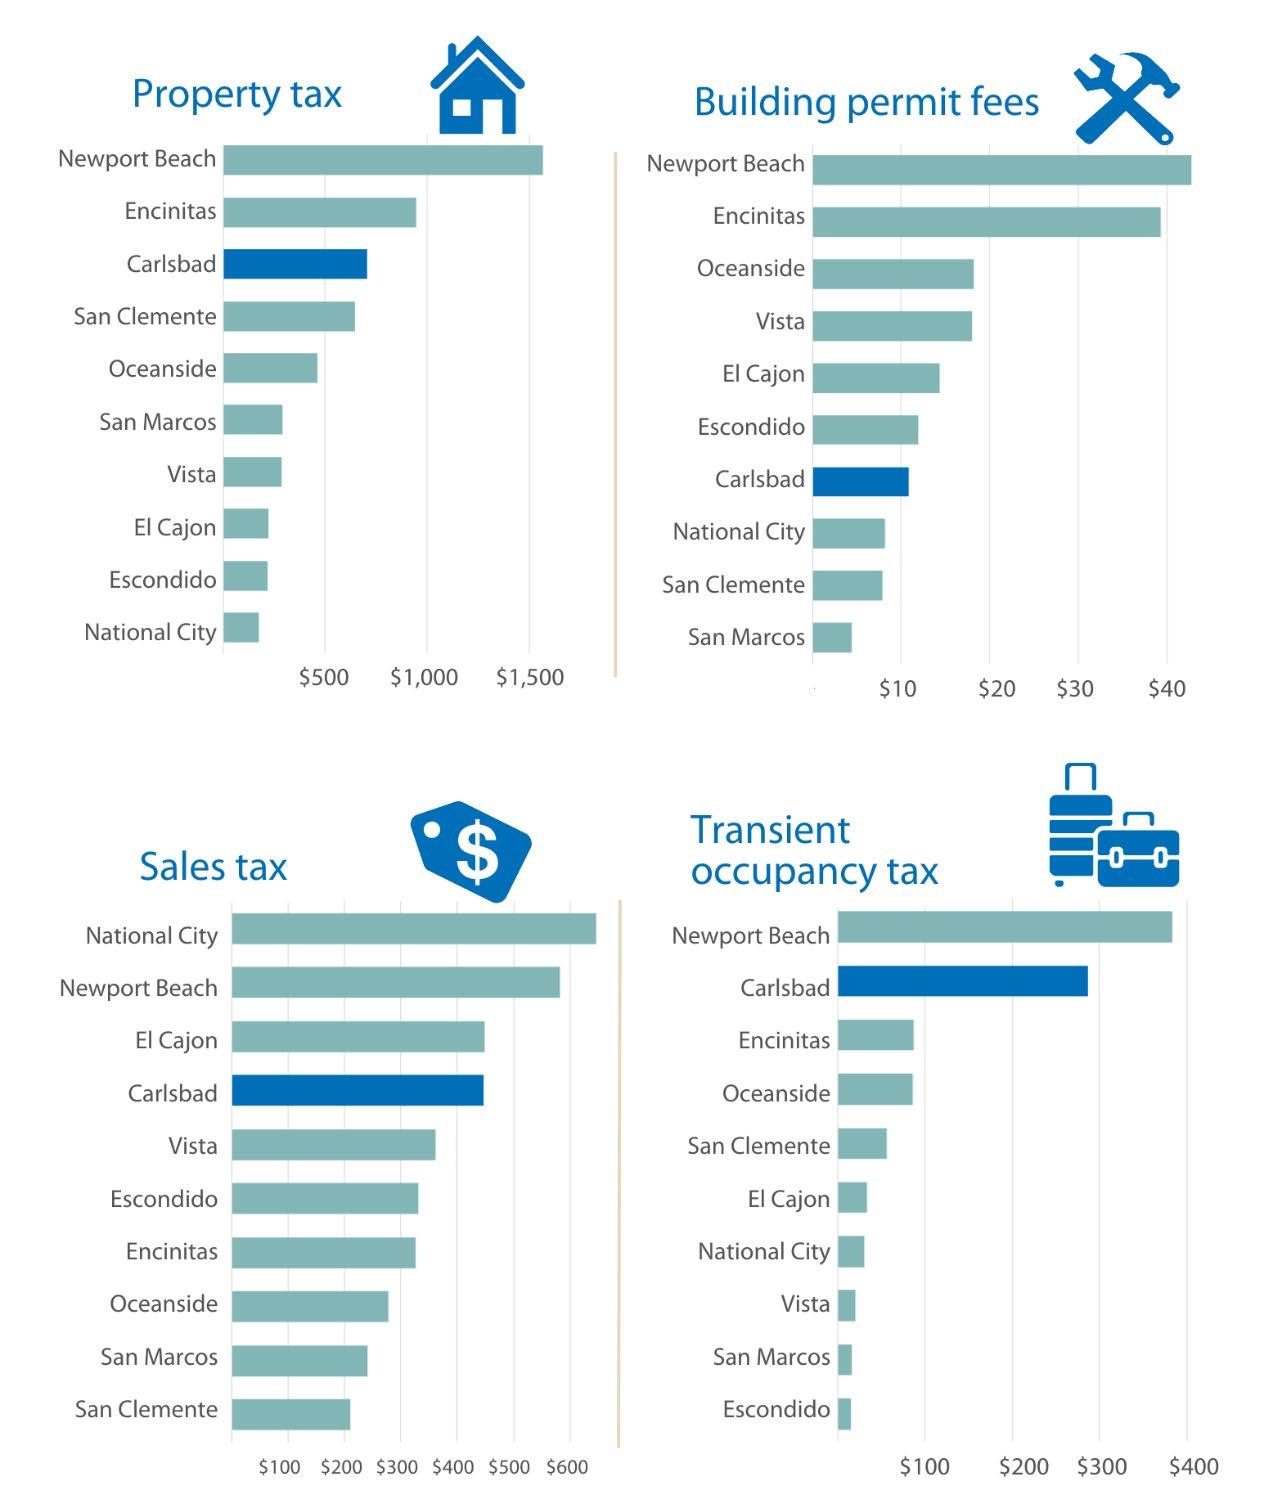
The table below shows General Fund revenue comparisons with neighboring jurisdictions for fiscal year 2023-24 adopted budgets. Population estimates for 2023 and total General Fund budgets are included for additional context.

A-18
Population (2023 est.) General Fund Budget Property Tax Sales Tax Hotel Tax* Building Permit Fees Carlsbad 114,549 $216,929,604 % 39.7% 24.1% 15.5% 0.6% $735.47 $445.87 $286.87 $10.91 El Cajon 104,619 99,954,889 % 27.6% 47.7% 3.6% 1.5% $259.66 $447.97 $33.77 $14.34 Encinitas 61,085 102,763,751 % 62.8% 19.8% 5.3% 2.4% $1,032.70 $326.09 $86.44 $39.29 Escondido 149,799 130,892,070 % 27.5% 38.9% 1.8% 1.4% $234.10 $330.49 $15.35 $11.95 National City 60,974 70,803,712 % 16.1% 56.5% 2.6% 0.7% $183.64 $646.14 $30.11 $8.20 Newport Beach 85,411 293,917,485 % 45.4% 16.0% 10.5% 1.2% $1,654.14 $581.85 $383.48 $42.80 Oceanside 171,063 223,800,487 % 38.1% 21.3% 6.6% 1.4% $497.31 $277.88 $85.59 $18.18 San Clemente 63,237 85,106,290 % 54.3% 16.8% 4.5% 0.6% $683.70 $211.03 $56.17 $7.91 San Marcos 94,530 $90,582,910 % 33.7% 26.2% 1.7% 0.5% $309.47 $240.28 $15.87 $4.44 Vista 99,835 $115,283,305 % 27.9% 31.0% 1.7% 1.5% $325.79 $361.58 $19.95 $18.05
* Transient occupancy tax
Per capita % Percent of General Fund revenue
2023-24 Revenue Per Capita Comparisons
A-19
A-20
FISCAL ISSUES & FINANCIAL MANAGEMENT
A-21
ECONOMIC AND FISCAL ISSUES FACING THE CITY
At the time of developing the Fiscal Year 2023-24 Proposed Budget, the nation, state and city had largely recovered from fiscal impacts of the COVID-19 pandemic. However, unprecedented inflationary levels were challenging the economy. In the City of Carlsbad, high inflationary levels have actually boosted some of the city’s revenue sources like sales and transient occupancy tax, but the city’s expenditures have also increased tremendously. While the Federal Reserve has taken swift action to combat the rise in inflation by increasing interest rate targets, we have yet to see inflation levels return to more historically normal levels. As the city moves forward, and as the level of disposable income, personal savings and pent-up demand continues to diminish as a result of these sustained inflationary levels, uncertainty about the city’s revenues keeping pace with its expenditures increases.
Prior to the pandemic, the city boasted a low unemployment rate of 2.9%. At the height of the pandemic, unemployment spiked to 13.8%. Over the past three years, the unemployment rate has had some correlation to the prevalence of COVID-19 in the region. However, with the pandemic’s economic impacts behind us, unemployment rates settled between 2% and 3% during calendar year 2022. Through the first quarter of calendar year 2023, macro-trends in the tech industry pushed unemployment up nationally, but the labor market is still considered to be very tight. As of March 2023, the unemployment rate was 4.8% at the state level, 3.7% at the county level and 3.5% at the local level.
National interest rates, which dropped significantly during the pandemic, have eclipsed pre-pandemic rates for all categories. One-year rates are currently at 1.63%, ten-year rates are currently at 2.32%, and 30-year rates are at 2.44%. With lingering concerns surrounding inflation, the Federal Reserve has begun to raise interest rates and has done so over the Federal Open Market Committee’s last eight meetings resulting in current interest rate targets of 5%-5.25%. As of May 2023, local inflation had decreased year-over-year from 8.3% to 5.2%.
Maintaining good fiscal health must remain a top priority. Meeting this objective preserves the city’s ability to continue providing important programs and services to the community. Past economic challenges and prudent financial planning have provided opportunities for developing solutions to address lost revenues while preserving vital services. The positive effect of inflation on some of the city’s revenue sources have been significant but is considered one-time and something to be very closely monitored moving forward. As inflation is likely to decline in the future, so will revenue growth. Disciplined spending and long-term financial planning remain critical to ensuring the future sustainability of important city programs and services.
A-22
Long-Term Financial Planning
Strategic planning begins with determining the city's fiscal capacity based upon long-term financial forecasts of recurring available revenues and future financial obligations. Prior to the adoption of the annual budget, the finance department will prepare a Ten -Year Financial Forecast (Forecast) that evaluates known internal and external issues impacting the city's financial condition. The methodology for preparing the Forecast can be found in the appendix of this document. The Forecast is intended to help the city:
• Attain and maintain financial sustainability,
• Have sufficient long-term information to guide financial decisions,
• Have sufficient resources to provide programs and services for the stakeholders,
• Identify potential risks to on-going operations in the long-term financial planning process and communicate these risks on an annual basis,
• Establish mechanisms to identify early warning indicators, and
• Identify changes in expenditure or revenue structures needed to deliver services or to meet the goals adopted by the City Council.
It is important to stress that the Forecast is not a budget. The Forecast does not dictate expenditure decisions, but rather highlights the need to prioritize the allocation of the city’s limited resources to ensure the continuation of core city services. The purpose of the plan is to provide the City Council, key stakeholders and the public an overview of the city’s fiscal health based on various financial and service level assumptions over the next ten years. It also allows for the discussion of necessary steps to be initiated during the development and implementation of future budgets. The Forecast is intended to look beyond the annual budget cycle and serve as a planning tool to bring a long-term perspective to the budget process. The Forecast also takes into consideration Council Policies that need to be met on an annual basis including General Fund reserve guidelines, pension funding guidelines, etc. Should projected expenditures exceed projected revenues in any given year, the City Manager will need to identify steps to mitigate the shortfalls prior to presenting a balanced budget to the City Council for consideration during the annual budget development process.
It should be noted that the Forecast is a snapshot in time and will change as additional information is made available and incorporated into the fiscal projections. Inflation and the uncertainty associated with the economy has increased the volatility of projecting future revenues.
The city prepares a long-term financial model for both capital and operating needs. It is imperative that the city plan for the impacts of development, the construction and operation of new public facilities, and planning resources needed to build them. The city prepares a ten-year operating forecast for the General Fund, a five-year Strategic Digital Transformation Investment Program, and a fifteen-year Capital Improvement Program. As part of the new Strategic Digital Transformation Investment Program and the Capital Improvement Program, the city annually calculates the amounts needed to pay for the projects and anticipated operating budget impacts. In this way, the city can anticipate the effects of development from both a capital and an operating perspective.
One important initiative the city has undertaken to ensure its financial health is the development of an Infrastructure Replacement Fund. With this fund, the city sets aside a portion of General Fund revenues on an annual basis for major maintenance and replacement of its infrastructure. Much of the city’s infrastructure is relatively new; thus, the city is just now experiencing the impact of maintenance requirements. By setting aside funds now, the city’s residents can be assured that the proper maintenance and replacement will be performed, as needed, on streets, parks and many facilities for which the city is responsible.
A-23
Employee retirement costs continue to require ongoing prudent fiscal management. The City Council issued a pension funding policy to codify its commitment to ensure that resources will be available to fulfill the city’s contractual retirement promises to its employees, and to minimize the chance that the funding of these benefits will interfere with providing essential services to the community. The policy outlines a funding discipline to ensure that adequate resources will be accumulated in a systematic and disciplined manner to fund the long-term cost of benefits to the plan participants and annuitants. Overall funding levels of the city’s plans are reviewed annually to ensure the city’s funding level remains at least 80% – the city’s minimum targeted level. While this enhances the city’s funding position, risks remain in the system. Required employer contributions will continue to increase over the next few years and actual contribution increases could exceed expectations if future investment return rates or other factors are unfavorable
Revenue and expenditure growth projections
The city’s Forecast considers the annual growth of all currently known elements of city revenues and expenditures. Projecting revenues is particularly difficult when considering rising inflation and impacts to consumer demand. When forecasting expenditures, some of the major factors considered are rising healthcare and workers’ compensation costs, underperforming pension programs, and general inflation in both personnel and operating expenditures. Currently, the city projects expenditure growth will outpace revenue growth in the near future. To support the increase in ongoing costs, the city will need to consider alternative options, such as ways to increase economic activity that will drive sustainable increases in the city’s current revenue base, an expansion of the city’s revenue base, or a reduction of the city’s current service offerings and associated costs.
FINANCIAL MANAGEMENT POLICIES
Revenue Policies
The development and maintenance of balanced and reliable revenue streams will be the primary revenue objective of the city. Efforts will be directed to optimize existing revenue sources while periodically reviewing potential new revenue sources. One method to maximize existing revenue sources it to promote a healthy business climate. Revenue estimates will be prepared on an annual basis during the preparation of the budget and major revenue categories will be projected on a tenyear basis. Revenues will be estimated conservatively using accepted standards and estimates provided by the state and other governmental agencies. Alternative revenue sources will be periodically evaluated to determine their applicability to meet identified city needs. Sources of revenue will be evaluated and modified as necessary to assure a diversified and growing revenue base that improves the city’s ability to handle fluctuations in individual revenue sources.
Revenues from “one-time” or limited duration revenue sources will not be used for ongoing operating expenses. Fees and charges for services will be evaluated and, if necessary, adjusted annually to ensure that they generate sufficient revenues to meet service delivery costs. The city will establish user charges at a level generally related to the full cost (operating, direct, indirect and capital costs) of providing the service, unless the City Council determines that a subsidy from the General Fund is in the public interest. The city will also consider market rates and charges levied by other municipalities of similar size for like services in establishing rates, fees and charges. Enterprise and internal service funds will be self-supporting.
A-24
Expenditure and Budget Policies
Major expenditure categories will be projected on a ten-year basis. The city will operate on a current funding basis. Expenditures will be budgeted and controlled so as not to exceed current revenues plus the planned use of any accumulated fund balances. Annual budgeted operating expenditures shall not exceed annual operating revenues, including budgeted use of reserves, unless directed by the City Council.
The City Manager shall prepare and submit to the City Council annually a proposed operating, strategic digital transformation investment program and capital improvement program budget and the budgets will be adopted by June 30 of each year. Budget status reports are prepared quarterly, distributed to all departments and posted on the city’s website. Because the budget is based on estimates, from time to time, it is necessary to make adjustments to finetune the line-items within it. Various levels of administrative control are utilized to maintain the budget’s integrity. Program managers are accountable for the line-item level of control of their individual program budgets. Department heads are accountable for the fund level of control for funds within their departments. The Finance Department oversees the general level of accountability related to budgetary integrity through systematic checks and balances and various internal controls.
Council Policy No. 87 – General Fund Surplus Policy outlines the use of surplus funds resulting from unrestricted General Fund actual revenues exceeding total actual expenditures, encumbrances, and commitments for a given fiscal year. It is the intent of the city to use all surplus funds generated to meet reserve policies, and the reduction or avoidance of long term liabilities. The city will not use year-end surplus funds to fund ongoing operations unless otherwise approved by the City Council.
The city will use surplus funds to replenish any General Fund deficiencies, up to the minimum level as set forth in Council Policy No. 74 – General Fund Reserve Policy and then any pension liability deficiencies, as defined in City Council Policy No. 86 – Pension Funding Policy.
The City Manager is authorized to approve the carryforward of any unencumbered and unspent budget for a particular item equal to or less than $100,000 into the following fiscal year. These items will be one-time expenditures and not for ongoing services, programs or personnel. Any remaining surplus funds in excess of reserve and pension liability deficiencies and items equal to or greater than $100,000 will be brought forward for City Council approval.
The city adheres to long-range financial planning, which forecasts revenues and expenditures over a long-term period, using assumptions about economic conditions, future spending scenarios and other salient variables. Financial planning allows the city to execute overall strategies to support the process of aligning financial capacity with long-term service objectives. Financial forecasts are updated at least once a year, or more often if unexpected changes in economic conditions or other unforeseen circumstances exist. Any significant changes will be reported to the City Manager and the City Council. Otherwise, these financial forecasts will be used as a tool during the development of the annual budget process and to set utility rates as needed.
Reserve Policies
The city formally mandates the levels at which reserves shall be maintained for the General Fund and informally sets minimum target levels for the enterprise and internal service funds.
Council Policy No. 74 – General Fund Reserve Policy was most recently updated and approved by the City Council in June 2019. The purpose of the policy is to establish a target minimum level of designated reserves in the General Fund to:
A-25
• Reduce the risk of financial impacts resulting from a natural disaster or other catastrophic events;
• Respond to the challenges of a changing economic environment, including prolonged downturns in the local, state or national economy; and
• Demonstrate continued prudent fiscal management and creditworthiness.
The city commits to maintaining General Fund reserves (the term reserve refers to any unassigned fund balance) at a target of 40% of General Fund annual operating expenditures. The total reserve level will be calculated using the prior year’s adopted General Fund budgeted expenditures.
At the discretion of the City Council, reserve levels in excess of the 40% target requirement may be used for one-time opportunity cost purposes. Reserve funds will not be spent for any function other than the specific direction in the annual budget or by a separate City Council action.
As a general budget principle concerning the use of reserves, the City Council decides whether to appropriate funds from reserves. Reserve funds will not be spent for any function other than the specific purpose of the reserve account from which they are drawn without specific direction in the annual budget or by a separate City Council action.
Council Policy No. 96 – Utilities Reserve Policy was approved by the City Council in March 2023 to establish guidelines to ensure the fiscal stability of the potable water, recycled water and wastewater funds and provide guidance to staff in the management of each utility’s finances. These funds will target a reserve funding level of 100% of annual debt service costs, 120 days of operating costs, and 1% of system replacement value in emergency capital. The Wastewater Fund will target a reserve funding level of 50% of the five-year rolling average of annual spending on capital improvement projects while the Potable and Recycled Water funds will target 100% of this average. Also, the Wastewater Fund will target a reserve of 10% of rate revenues while the Potable and Recycled Water funds will target a reserve of 20% of rate revenues to provide a source of funds to smooth rates or avoid rate increases in the vent of short- or mid-term disruption to revenues such as drought-related demand reductions. The city or the Carlsbad Municipal Water District’s potable water, recycled water and wastewater utilities will treat the minimum reserve levels as practical reserve floors and allow reserves to increase or decrease as necessary within the minimum and target levels prescribed above.
The city’s Workers’ Compensation Fund will maintain a minimum reserve equal to the estimated outstanding claims as calculated by a third-party administrator. Additional reserve amounts may be set aside as deemed appropriate based on a third-party actuarial study completed at two year intervals. During the annual budget process, the target confidence level will be compared with the projected fund balance, and if the projected fund balance is greater than or lesser than the target, a plan to adjust the fund balance will be considered, using either or both increasing revenues through interdepartmental charges and one-time cash contributions from those funds contributing to the shortfall.
The Risk Management Fund (General Liability) will maintain a minimum reserve equal to the estimated outstanding claims as calculated by a third-party administrator. Additional reserve amounts may be set aside as deemed appropriate based on a third-party actuarial study completed at two-year intervals. During the annual budget process, the reserve level will be compared with the projected fund balance, and if the projected fund balance is greater than or lesser than the target, a plan to adjust the fund balance will be considered, using either or both increasing revenues through
A-26
interdepartmental charges and one-time cash contributions from those funds contributing to the shortfall.
The Information Technology Asset Replacement Fund shall maintain a minimum reserve level defined as the amount of accumulated depreciation of capitalized assets based on the original cost of each capitalized asset and up to a maximum reserve level defined as the accumulated depreciation based on the estimated replacement cost of each capitalized asset.
The Vehicle Asset Replacement Fund shall maintain a minimum reserve level defined as the amount of accumulated depreciation of capitalized Fleet assets based on the original cost of each capitalized asset up to a maximum reserve level defined as the accumulated depreciation based on the estimated replacement cost of each capitalized asset.
Investment Policy
The city has established a formal Investment Policy. It is the policy of the City of Carlsbad to invest public funds not required for immediate day-to-day operations in safe, liquid and medium-term investments that shall yield an acceptable return while conforming to all California statutes. It is intended that the policy cover the investment activities of all contingency reserves and inactive cash under the direct authority of the city. Investments of the city and its component units will be made on a pooled basis; however, investments of bond proceeds will be held separately if required.
Pension Funding Policy
The city’s Council Policy No. 86 – Pension Funding Policy embodies funding and accounting principles to ensure that resources will be available to fulfill the city’s contractual promises to its employees. The policy objectives include using actuarially determined contributions, or ADC, provided by CalPERS to fund the full amount of the ADC each year, maintaining no less than a combined minimum 80% funded ratio, and demonstrating accountability and transparency by communicating all information necessary for assessing the city’s progress toward meeting its pension funding objectives.
In the event the city is unable to meet the minimum combined pension funded ratio of 80% with current resources (i.e., without borrowing or using reserves), the Finance Director will identify a reasonable period to return to a minimum 80% funded ratio status.
Long Term General Fund Capital Funding Policy
The city’s Council Policy No. 91 – Long Term General Fund Capital Funding Policy ensures the needs of the city are met and demonstrates continued prudent fiscal management by providing a funding source for long-term, large value capital purchases. Many city assets demand large capital expenditures, examples include roads, building, parks and information technology infrastructure. The city funds the General Fund portion of these necessary investments by adopting an annual budget that includes a transfer from the General Fund to one or more of the city’s long-term capital funds. These long-term capital funds include the General Capital Construction Fund, the Infrastructure Replacement Fund and the Technology Investment Capital Fund. The city commits to targeting a transfer to the city’s long-term capital funds of 6% of budgeted General Fund revenues. The transfers are proposed during the annual budget process or on an as needed basis for the City Council’s consideration.
Full versions of these policies and other City Council policies are available on the city’s website at www.carlsbadca.gov/city-hall/laws-policies/council-policies.
A-27
APPROPRIATION LIMIT
The appropriations limitation imposed by the state, otherwise known as the Gann limit, creates a restriction on the amount of revenue that can be appropriated in any fiscal year. The basis for calculating the limit began in fiscal year 1978-79 and is increased based on population growth and inflation. The appropriation limit applies only to those revenues defined as proceeds of taxes.
• Population growth of Carlsbad, OR
• Population growth within San Diego County, AND
• Growth in California per capita income, OR
• Growth in non-residential assessed valuation due to new construction in the city.
The factors used to calculate the fiscal year 2023-24 limit were:
• Population growth of Carlsbad AND
• Growth in California per capita income.
The formula is outlined below:
The City of Carlsbad’s appropriation limit is currently almost three and a half times its annual appropriations. With such a large margin, it is unlikely that the city will reach the appropriation limit in the foreseeable future.
A-28
Fiscal year 2022-23 expenditure limit $582,535,354 % Population growth within Carlsbad 0.9987 Growth in California per capita income X 1.0444 Net increase factor 1.0430 Fiscal year 2023-24 limit (2022-23 limit x factor) $607,584,374 Current appropriation of proceeds of taxes (Subject to the limit) $184,275,214
$$100 $200 $300 $400 $500 $600 $700 2020 2021 2022 2023 2024 Millions Appropriations Limit by Fiscal Year Gann Appropriation Limit Appropriations Subject to Limit
DEBT MANAGEMENT
The City of Carlsbad has a AAA credit rating and is widely acknowledged for its financial stability and responsible management of resources. The use of debt has always been a primary issue in the development of the Capital Improvement Program and the policies to implement the city’s Growth Management Program. Over the years, the city has issued millions of dollars of bonds and Certificates of Participation to fund streets, buildings, sewer and water facilities, open space acquisitions, and other infrastructure projects. The city is continually evaluating its outstanding debt as well as potential future issues to ensure that interest costs are kept at a minimum and the use of the bond funds is appropriate.
The Government Code of the State of California has established maximum general obligation debt limits for local governments within the state. The city’s outstanding general obligation debt should not exceed 15% (as adjusted by 25% per the law) of total assessed property value. As of June 30, 2022, the city’s calculated debt limit for general obligation debt was $1.4 billion.
The city currently has approximately $47.1 million of debt outstanding as of June 30, 2023. Of that $47.1 million, $1 million is Redevelopment Tax Allocation Bonds, $10.7 million is water construction loans and the remainder is debt of financing districts. Outstanding debt obligations of financing districts (special districts and/or assessment districts) within the city do not obligate the City of Carlsbad and are not paid from the city’s General Fund. No new debt is anticipated to be issued for the General Fund in the upcoming year.
A-29
City of Carlsbad Outstanding Debt Issues
Reassessment District No. 2012-01 consisting of Poinsettia Lane East, and Benefit Area No. 1 (College Boulevard and Cannon Road East) of Assessment District No. 2003-01, was refunded in fiscal year 2022-23. The refunding resulted in $1.4 million in net present value savings or 6.26% of the refunded bonds. This savings translates to average savings per parcel of approximately $174 annually through 2035.
A-30
Principal Repayment Bond Retirement Outstanding Debt Issue Name SourceFund Rating Year at 6/30/23 1993 Redevelopment Tax Allocation Bonds Tax Increment 801 AAA 2023 1,000,000 $ Refund 1988 bonds and obtain additional redevelopment funds CFD #3 2016 Improvement Area 1 Special Tax BondsSpecial District 434 Unrated 20366,210,000 Refunding of CFD 1 CFD #3 2016 Improvement Area 2 Special Tax BondsSpecial District 434 Unrated 203810,105,000 Refunding of CFD 2 1998 Rancho Carrillo (AD 96-1) Limited Obligation Assessment 409 Unrated 20282,835,000 Fund improvements within Rancho Carrillo Improvement Bonds District 2022 College/Cannon & Poinsettia Refunding Bonds Limited Obligation Assessment 425 Unrated 203516,240,000 Refund Poinsettia/College/Cannon Improvement Bonds District State Water Resources Control Board Loans 2005 Construction Loan 502 20251,246,772 Fund phase II of Industrial Park Pipelines 2006 Construction Loan 502 20274,648,182 Fund phase II of Industrial Park Pipelines 2014 Construction Loan 507 20554,850,437 Fund phase III of Industrial Park Pipelines Totals 47,135,391 $ Debt Issue Name Principal Interest Total Principal Interest Total Principal Interest Total 1993 Redevelopment Tax Allocation Bonds 1,000,000 $ 26,500 $ 1,026,500 $ 1,000,000 $ 26,500 $ 1,026,500 $ 15,495,000 $ 15,473,210 $ 30,968,210 $ CFD #3 2016 Improvement Area 1 Special Tax Bonds 375,000 159,713 534,713 6,210,000 1,313,531 7,523,531 8,290,000 2,537,069 10,827,069 CFD #3 2016 Improvement Area 2 Special Tax Bonds 520,000 283,175 803,175 10,105,000 2,657,038 12,762,038 13,015,000 4,738,675 17,753,675 1998 Rancho Carrillo (AD 96-1) Limited Obligation 410,000 144,998 554,998 2,835,000 493,572 3,328,572 19,600,000 18,007,741 37,607,741 Improvement Bonds 2022 College/Cannon & Poinsettia Refunding Bonds Limited Obligation 890,000 789,750 1,679,750 16,240,000 5,721,750 21,961,750 16,240,000 6,190,906 22,430,906 Improvement Bonds State Water Resources Control Board Loans 2005 Construction Loan 615,690 31,169 646,859 1,246,772 46,946 1,293,719 9,694,504 2,595,825 12,290,329 2006 Construction Loan 1,122,715 106,908 1,229,623 4,648,182 270,309 4,918,491 19,382,546 5,174,387 24,556,933 2014 Construction Loan - - - 4,850,437 797,101 5,647,538 4,804,281 780,424 5,584,705 Totals 4,933,405 $ 1,542,213 $ 6,475,618 $ 47,135,391 $ 11,326,747 $ 58,462,138 $ 106,521,331 $ 55,498,236 $ 162,019,567 $ Debt
During FY 2023-24 Debt
FY 23-24 to Maturity Debt Service Payments Total from Inception to Maturity
Service Payments
Service Payments from
Purpose Recycled Water User Fees Unrated
BASIS OF BUDGETING
The city budgets on a modified accrual basis for all funds except for its enterprise and internal service funds, which are budgeted on a full accrual basis. This is consistent with the city’s basis of accounting as reported in its Annual Comprehensive Financial Report.
The city's Governmental fund budgets consist of:
• The General Fund
• Special revenue funds
• Capital project funds
To summarize, under this basis, revenues are estimated for the fiscal year if they are susceptible to accrual, e.g., amounts can be determined and will be collected within the current period. Principal and interest on general long-term debt are budgeted as expenditures when due, whereas other expenditures are budgeted for liabilities expected to be incurred during the current period or shortly thereafter to pay current liabilities.
Proprietary fund budgets are adopted using the full accrual basis of accounting whereby revenue projections are developed recognizing revenues expected to be earned in the period, and expenditure estimates are developed for all expenses anticipated to be incurred during the fiscal year. The city's proprietary fund types consist of enterprise and internal service funds because the city has municipally-owned utilities or other enterprise activities.
Fiduciary funds are used if the city has a fiduciary or custodial responsibility for assets. The city currently budgets for one fiduciary fund, the Successor Agency to the Former Carlsbad Redevelopment Agency.
The legal level of Budgetary Control is the fund level and expenditures should not exceed budgeted amounts at the fund level. Budgetary control is maintained through the city’s accounting system, as well as through monthly reporting on all revenue and expenditure accounts and other special reports summarizing the financial position of the city. The City Council adopts the formal budget for all funds prior to the beginning of each fiscal year and may amend the budget, as necessary by City Council action, throughout the year. All unencumbered, unspent appropriations expire at year-end unless specifically carried into the new fiscal year in accordance with Council Policy No. 87 – General Fund Surplus Policy.
Internal Controls exist within the accounting system to ensure safety of assets from misappropriation or unauthorized use or disposition, and to maintain the accuracy of financial record keeping. These internal controls must be established consistent with the sound management practices based on the cost and benefit of the controls imposed. The cost of a control should not be excessive in relation to its benefit as viewed by city management. The internal controls in existence within the city’s system are sufficient to ensure, in all material aspects, both the safety of the city’s assets and the accuracy of the financial record keeping system.
Controls on the use and transfers of budget funds are outlined in the adopted budget resolution in the appendix of this document.
A-31
BUDGETARY FUND STRUCTURE
The budget of the city is organized based on funds, each of which is considered to be a separate accounting entity. The operations of each fund are accounted for by providing a separate set of selfbalancing accounts that comprise its assets, liabilities, fund equity, revenues and expenditures.
Detailed descriptions of each fund and a department/fund budget relationship matrix can be found in the appendix of this document. The various funds are grouped as follows:
GOVERNMENTAL FUNDS
General Fund
Special Revenue Funds
• Affordable Housing
• Agricultural Mitigation Fee
• Buena Vista Channel Maintenance District
• Citizens’ Option for Public Safety (COPS)
• Community Activity Grants
• Community Development Block Grant
• Cultural Arts Donations
• Habitat Mitigation Fee
• Library and Arts Endowments
• Library Gifts and Bequests
• Lighting and Landscaping District 2
• Local Cable Infrastructure
• Median Maintenance District
• Opioid Settlement Fund
• Permanent Local Housing Allocation
• Police Asset Forfeiture
• Public Safety Grants
• Recreation Donations
• Rental Assistance/Section 8 Program
• Senior Program Donations
• Street Lighting Maintenance District
• Street Tree Maintenance District
• Tyler Court Apartments
Capital Project Funds
• Bridge and Thoroughfare District 2 – Poinsettia Lane/Aviara Parkway
• Bridge and Thoroughfare District 3 – Cannon Road West
• Community Facilities District 1
• Gas Tax
• Gas Tax-Road Maintenance and Rehabilitation
• General Capital Construction (GCC)
• Grants-Federal
• Industrial Corridor Park Fees
• Infrastructure Replacement (IRF)
• Park in-Lieu Fees (PIL)
• Parking in-Lieu Fees
• Planned Local Drainage Area Fees (PLD)
• Public Facilities Fees (PFF)
• Technology Investment Capital
• Transportation Development Act (TDA)
A-32
• Traffic Impact Fees (TIF)
• TransNet
PROPRIETARY FUNDS
Internal Service Funds
• Workers’ Compensation
• Risk Management
• Vehicle Maintenance
• Vehicle Replacement
• Information Technology Operations
• Information Technology Replacement
Enterprise Funds
• Potable Water Operations
• Potable Water Connection
• Potable Water Replacement
• Recycled Water Operations
• Recycled Water Connection
• Recycled Water Replacement
• Wastewater Operations
• Wastewater Connection
• Wastewater Replacement
• Solid Waste Management
• Watershed Protection
• The Crossings Golf Course
FIDUCIARY FUND
Private Purpose Trust Fund
• Successor Agency to the Redevelopment Agency
A-33
The California Society of Municipal Finance Officers, or CSMFO, recognizes those entities with highly professional budget documents with two levels of certificates. The first level is the “Meritorious Budget Award,” which requires the entity to meet a very specific list of criteria defined by CSMFO. The second level is the “Operating Budget Excellence Award,” which requires that the organization meet even higher criteria which effectively enhances the usability of the document.
In preparing the budget for fiscal year 2023-24, the city has once again followed CSMFO’s award criteria. This budget document will be submitted to CSMFO for the fiscal year 2023-24 budget award program.
A-34
Government Finance Officers Association of the United States and Canada, or GFOA, presented a Distinguished Budget Presentation Award to City of Carlsbad, California, for its Annual Budget for the fiscal year beginning July 1, 2022. To receive this award, a governmental unit must publish a budget document that meets program criteria as a policy document, as a financial plan, as an operations guide and as a communications device.
This award is valid for a period of one year only. In preparing the budget for fiscal year 2023-24, the city has once again followed GFOA’s award criteria. This budget document will be submitted to GFOA for the fiscal year 2023-24 budget award program.
A-35
A-36
OPERATING BUDGET OVERVIEW
This section includes a summary of the revenues and expenditures included in the fiscal year 2023-24 operating budget. Spending is presented by funding source, department and type, such as personnel or maintenance and operations. For context, previous years’ spending levels are often presented alongside this information. Financial tables are presented to the nearest hundred thousand; rounding differences may exist.
Detailed summaries of department services and expenditures are included within the five main sections of the operating budget following this overview. The five city branches include:
• Public Safety
• Public Works
• Community Services
• Administrative Services
• Policy & Leadership
Information about the city’s approach to planning for and funding digital transformation efforts throughout the city is included in the Strategic Digital Transformation Investment Program section.
Information about capital projects, such as construction of roads and pipelines, the development of parks and construction and maintenance of city facilities, is included in the Capital Improvement Program section.

B-1
OPERATING BUDGET REVENUE SUMMARY
The Operating Budget for fiscal year 2023-24 totals $377.3 million, with revenues for the year estimated at $362.8 million. General Fund revenues are estimated at $212.0 million and General Fund budgeted expenditures are $216.9 million, which includes an additional $7.4 million in one-time transfers to the General Capital Construction Fund and $5.2 million in one-time General Fund reserves toward the Carlsbad Village Trench Project Excluding the one-time uses of General fund surplus and reserve, the General Fund budgeted operating expenditures are $204.3 million.
Revenue estimates for the Operating Budget indicate the city will receive a total of $362.8 million in fiscal year 2023-24, a change of 0.5% or $1.9 million above the estimated fiscal year 2022-23 revenues. General Fund revenues are expected to increase by $13.2 million compared to the prior year’s adopted revenues and $4.2 million or 2% compared to fiscal year 2022-23 estimates. Special Revenue funds are projected to increase by 4.5% or $0.8 million over fiscal year 2022-23 estimates Enterprise Fund revenues are projected to increase by 4.2% or $3.7 million in the upcoming fiscal year. Internal service funds are increasing over the prior year’s adopted budget but decreasing compared to fiscal year 2022-23 estimates. This is driven by one-time transfers in from the General Fund to fund Workers’ Compensation, Risk Management and Fleet Maintenance. The Successor Agency Housing Trust revenues are expected to decrease by $1.0 million over current estimates as the loan owed to the General Fund has now been fully repaid. More detailed information on the city’s revenue sources is provided in the following discussion.
The following table shows the total operating revenues anticipated to be received by the city for fiscal year 2022-23, as well as those budgeted for fiscal year 2023-24.

B-2
EstimatedBudgeted $ % 2022-232023-24 ChangeChange General Fund 207.8 $ 212.0 $ 4.2 $ 2.0% Special Revenue 18.7 19.5 0.8 4.5% Enterprise 89.1 92.8 3.7 4.2% Internal Service 44.2 38.4 (5.8) -13.3% Successor Agency Housing Trust 1.0 - (1.0) -100.0% Total 360.8 $ 362.8 $ 1.9 $ 0.5%
(In
Fund
REVENUE SUMMARY BY FUND TYPE
Millions)
General Fund
General Fund revenues provide a representative picture of the local economy. These revenues are of particular interest as they fund basic city services such as Police, Fire, Library & Cultural Arts, Street and Park Maintenance and Recreation programs. The table below provides a summarized outlook of the General Fund revenues.
The COVID-19 pandemic created immense uncertainty about the city’s revenues, most notably in sales tax and transient occupancy tax. City leadership adopted the fiscal year 2021-22 budget anticipating continued adverse impacts from the pandemic with moderate recovery; however, accelerated recovery driven by the staggered lessening of COVID-19 restrictions, pent-up demand and inflationary increases resulted in sales tax and transient occupancy tax revenue reaching historically high levels. Revenue estimates in the fiscal year 2022-23 adopted budget were not impacted by uncertainty related to COVID-19 but did reflect new uncertainty surrounding the economy. From geopolitical conflict to unprecedented inflationary increases, city staff compiled a budget taking into consideration potential impacts on disposable income, tourism and the housing market. Based on current fiscal year 2022-23 revenue estimates, inflation has not yet negatively impacted the city’s revenue sources. However, as personal savings accumulated during the pandemic is absorbed by pent-up demand and inflation, the looming risk of recession and continued inflationary increases indicate that the most prudent path is to maintain a conservative outlook for the city’s revenues in the future
Nearly 80% of General Fund revenues are derived from three sources: property tax, sales tax, and transient occupancy tax. Sales tax and TOT revenues tend to be much more sensitive to changes in economic conditions, unlike property tax revenues, which remain relatively stable because of the mitigating effect of Proposition 13, which limits annual growth in assessed values.
Property tax, the largest source of General Fund revenues, is expected to grow by 3.4% over last year’s estimates. While the residential real estate market in Carlsbad has seen significant increases in values in recent years, the growth has begun to cool off. Commercial property assessed values are expected to remain relatively flat as the increase in interest rates has created immense uncertainty in the sector With the COVID-19 emergency officially ended, the focus on the housing market shifts to other economic factors. In response to the unprecedented inflationary increases experienced over the last year and a half, the Federal Reserve has responded by raising rates to a current range of 5.0-5.25%, the highest range since July 2006 This has made home purchasing more difficult for borrowers. While demand remains relatively high both locally and around the state, these increases have certainly
B-3
EstimatedBudgeted $ % 2022-232023-24 ChangeChange Property Tax 81.5 $ 84.2 $ 2.7 $ 3.4% Sales Tax 51.4 51.1 (0.3) -0.6% Transient Occupancy Tax 32.5 32.9 0.4 1.1% Franchise Taxes 7.0 7.1 0.1 1.6% Business License Tax 6.2 6.4 0.2 3.1% Development Revenues 4.2 3.3 (0.9) -21.1% All Other Revenue 25.0 27.0 2.0 8.0% Total 207.8 $ 212.0 $ 4.2 $ 2.0% GENERAL FUND REVENUES (In Millions)
contributed to the median home value in Carlsbad falling to $1.3 million, roughly the same value as in December 2021. Proposition 8 allows owners to have their property temporarily revalued if market value is lower than the factored base year value, posing a risk that commercial property values could temporarily decrease.
Assessed values on the residential real estate side are expected to grow modestly, capped by California’s Proposition 13. Adopted in 1978, Proposition 13 limits the annual increase in assessed values for property. Under this proposition, assessed values (and the related property tax) can grow by no more than 2% per year. The value upon which the tax is based is only increased to the full market value upon the sale of a property. The maximum increase of assessed values when properties are not sold is by the change in California’s Consumer Price Index, which was 1.036% in fiscal year 2021-22 – below the 2% cap for the first time since 2016-17. In recent years, residential activity has been driven by low interest rates on mortgages, pent-up demand that built during the shutdown and an increase in the ability to work remotely. Now, increasing rates and diminishing pent-up demand as we move past the pandemic will likely have adverse impacts compared to prior periods Based on resale data from Zillow, the median price of a single family residence in Carlsbad is $1.3 million, up by 0.7% year over year in March 2023.
Property and Sales Tax Revenues
Changes in property tax revenues lag behind changes in the housing market, as the tax revenue for the upcoming fiscal year is based on assessed values from the previous January. Thus, the taxes to be received for fiscal year 2023-24 are based on assessed values as of January 1, 2023
Property taxes tend to grow slowly unless there is a significant amount of development-related activity. In past decades the city has seen robust growth in property tax revenue due to new development, high turnover of existing homes and double-digit growth in housing prices. However, as opportunities for new development and growth lessen, development-related revenues have slowed. In addition to recent interest rate increases, slower development combined with minimal commercial property transactions and tax reform has caused a slowing in property tax growth in the city.
B-4
$$10 $20 $30 $40 $50 $60 $70 $80 $90 2015 2016 2017 2018 2019 2020 2021 2022 2023e 2024e $ Millions Fiscal Year
Property Tax Sales Tax
Sales Tax revenues generally move in step with economic conditions and overall, Carlsbad’s economy has absorbed the inflationary increases experienced over the past 12-18 months. The restrictions resulting from the COVID-19 pandemic led to increases in segments like auto sales, construction, drug store sales, chemical products, food markets and recreational products, while others like restaurants and general retail took a major hit. With the pandemic and its impacts mostly behind us, the uncertainty rests with continued levels of inflationary increase and whether the rise in interest rates will lower inflation levels adequately
Sales tax revenues improved markedly up until fiscal year 2019-20, peaking in fiscal year 2018-19 at $40.8 million. The onset of the pandemic in March 2020 resulted in swift reductions in sales tax revenues and the city ended the year with $38 million in sales tax revenues. During fiscal year 202021, sales tax levels generally correlated with shelter-in-place mandates. As restrictions were lifted, the city’s sales tax levels recovered the city ended fiscal year 2020-21 with $44 million in sales tax revenues. Fiscal year 2021-22 experienced the most accelerated recovery, ending the year at a historic high of $51.2 million in sales tax revenues. The fiscal year 2022-23 sales tax estimates reflected uncertainty surrounding market and economic conditions like inflation and impacts to disposable income. These inflationary increases have yet to adversely impact sales tax revenues through the first six months of the fiscal year and staff anticipate another historic high of sales tax revenues. However, this positive experience does not change the outlook. With continued levels of inflation and a risk of recession looming, staff have proposed a conservative estimate of $51.1 million in budgeted revenue for fiscal year 2023-24 which represents a decrease of $0.3 million, or 1%, over fiscal year 2022-23 estimates
As indicated in the chart above, the city’s sales tax base is heavily weighted in the transportation (comprised heavily of new auto sales) and general retail sectors, which combined account for over half of taxable sales in Carlsbad. New auto sales are highly elastic or responsive to changes in price in comparison to economic trends, and tax revenues from new auto sales fell precipitously during the recession, from $6.7 million in 2007 to $4.4 million in 2009. Since that dip, auto sales tax

B-5
revenues hit a high of $13.4 million for the four quarters ended December 31, 2022. With general retail sales tax suffering for the year ended December 31, 2020, and recovering in the year after, the most recent four quarters have shown full recovery increasing nearly 57% and reaching historic levels.
Transient Occupancy Taxes
The third highest General Fund revenue source is Transient Occupancy Tax, also known as TOT or hotel tax. TOT was the revenue category most adversely impacted by COVID-19. From historic highs of $26 million in fiscal year 2018-19, the city experienced year-over-year decreases of 27% and 16%. Recovery from the pandemic was estimated conservatively; however, fiscal year 2021-22 proved otherwise, reaching a historic high of $32.4 million driven by the easing of restrictions, pentup demand and an increase in average daily room rates. This trend continued in fiscal year 2022-23, whereby actual revenues exceeded conservative estimates that were applied to account for sustained levels of unprecedented inflation. It is estimated that TOT revenues will once again reach a historic high this year.
According to a report from Tourism Economics, San Diego County tourism will see continued growth in visitation demand of around 9.8% in calendar year 2023. The projected increase is supported by the thought that travel has, since the pandemic, been “reclassified” as a necessary expense rather than a discretionary one. Furthermore, the influx of financial aid and savings achieved throughout the pandemic may likely indicate that uncertainty in the economy can be mitigated by these additional funds. However, group business travel has yet to fully return to pre-pandemic levels and uncertainty around rising inflation and diminishing pent up demand continue to drive a moderately conservative estimate in fiscal year 2023-24. The City of Carlsbad currently has approximately 4,776 hotel rooms, 343 registered vacation rentals and over 660 timeshares.
B-6
Sales tax revenues include those received under Proposition 72, a 0.5 cent increase in California sales tax for the funding of local public safety services.
$20 $22 $22 $24 $26 $19 $16 $32 $33 $33 $$5 $10 $15 $20 $25 $30 $35 2015 2016 2017 2018 2019 2020 2021 2022 2023e 2024e $ Millions Fiscal Year
Franchise Tax revenue has stabilized in recent years and is projected at $7.1 million in fiscal year 2023-24. Franchise taxes are paid by certain industries that use the city’s right-of-way to conduct their business. The city currently has franchise agreements for cable TV service, solid waste services, cell sites, fiber optic antenna systems and gas and electric services. The solid waste franchise fee has experienced minor revenue increases that mirror growth in population and changes in rate structures. Cable TV franchise revenue is expected to remain relatively consistent from $1.39 million in fiscal year 2022-23 to $1.41 million in fiscal year 2023-24. This revenue source will most likely remain stable or decline in future years as more subscribers cut cable services and move to online streaming services.
In April 2021, a new franchise agreement for solid waste was approved with Republic Services of San Diego. The city receives 7.5% of revenues collected as well as an annual payment of $0.8 million in support of AB 939 and $1.3 million storm water fee. The increase in fiscal year 2023-24 is relatively modest compared to the increase experienced in the prior year that was driven by the $0.8 million payment to assist with AB 939.
San Diego Gas & Electric pays franchise taxes for the use of the public land over which they transport gas and electricity. The city also receives an “in-lieu” franchise tax based on the value of gas and electricity transported on SDG&E lines but purchased from another source. The “in-lieu” tax captures the franchise taxes on gas and electricity that is transported using public lands, which would not otherwise be included in the calculations for franchise taxes due to deregulation of the power industry. This revenue source experienced a significant increase in fiscal year 2022-23 of $919,000 due to price increases but is expected to remain relatively flat over the next several years.
Business license taxes are closely tied to the health of the local economy and are projected to increase to $6.4 million in fiscal year 2023-24. This represents growth of $0.2 million or 3% when compared to last year’s adopted budget. Increases in business license taxes correlate with sales tax revenue increases as businesses either pay taxes based on the amount of their gross receipts or based on set fees. There are currently about 9,514 licensed businesses in the City of Carlsbad, 77 less than in the prior year with 6,375 of them located in the city
Development-related revenues are derived from fees for planning, engineering and building permits, and fees paid by developers to cover the cost of reviewing and monitoring development activities, such as plan checks and inspections. These revenues are difficult to predict as many of the planning and engineering activities occur months or years before any actual development.
B-7
Over the last 10 years development-related revenues have fluctuated in line with increases and decreases in residential, commercial and industrial development. In fiscal year 2023-24 the city expects a 21% decrease in development related revenues to approximately $3.3 million This follows higher than anticipated development activity occurring in fiscal year 2022-23. The projected decrease in development-related revenues is tied to the volume and type of development projected to be permitted, multi-family versus single-family, and a drop in the revenues derived from building fees which occur in the early stages of development.
Interdepartmental charges are generated through engineering services charged to capital projects, reimbursed work from other funds and miscellaneous interdepartmental expenses charged to funds outside the General Fund for services performed by departments within the General Fund. Miscellaneous interdepartmental charges are expected to increase by 10% compared to the prior year’s adopted budget, driven by labor, inflation and cost of construction increases.
Income from investments and property include interest earnings as well as rental income from city-owned land and facilities. The city is expected to earn about $3.2 million in interest on its General Fund investments for fiscal year 2022-23 and another $2.7 million in rental and lease income. The yield on the city’s portfolio is forecasted to average 1.5% and cash balances are expected to remain flat as increases in receipts are projected to be offset by increases in expenditures as the City Council’s goals are operationalized.
Ambulance fee revenues are estimated to increase $3.3 million over last year’s estimates, from $3.9 million to $6.3 million. This increase is due to the Fire Department’s addition of two medical transports. The increase is also driven by the Ground Emergency Medical Transportation Certified Public Expenditure Program, which helps cover uncompensated costs for Medi-Cal fee-for-service transports. The department submitted cost reports for fiscal year 2018-19 through 2022-23 and is expected to receive a one-time reimbursement of $666,000 Furthermore, the department will participate in the Public Provider Ground Emergency Medical Transport Intergovernmental Transfer Program which will provide add-on reimbursement payments to help cover uncompensated costs in the future. This will generate approximately $883,000 in additional revenue annually. Lastly, the Fire Department recently completed an ambulance fee study and is proposing to increase the fees to better align cost recovery levels in comparison with jurisdictions in the region. The additional revenue will amount to approximately $2 million annually.
Transfer taxes are those taxes paid to the county upon the transfer of interests in real estate. The tax is $1.10 per $1,000 of property value, split equally between the county and the city. Carlsbad expects to receive approximately $1.6 million in transfer taxes for fiscal year 2023-24 which is a 3.5% increase from fiscal year 2022-23 estimates and relatively consistent with current year estimates. The residential real estate market continues to remain strong; however, this will likely be influenced by rising interest rates. While housing prices in Carlsbad have decreased in recent months, inventories are expected to remain low due to the insulated local demand.
B-8
Other intergovernmental revenues include miscellaneous receipts received from the state or federal governments as well as local school districts. With the city receiving its two annual American Rescue Plan Act payments in fiscal 2020-21 and fiscal year 2021-22 totaling $12.6 million, intergovernmental revenues decreased substantially in fiscal year 2022-23 and are expected to remain relatively consistent in fiscal year 2023-24
The All other revenues category includes fines and forfeitures, transfers in, miscellaneous reimbursed expenses, and other charges and fees. The estimate for fiscal year 2022-23 totals $1.5 million and is expected at just over $1.0 million in fiscal year 2023-24
General Fund Revenues
Overall, and as reflected in the bar chart above, General Fund revenues are expected to increase $4.2 million or 2% from fiscal year 2022-23 estimates The General Fund’s primary tax revenues are estimated to increase conservatively to account for the current economic uncertainty and risk of recession. While development-related revenues are expected to decline over prior year estimates, ambulance fee revenues are projected to increase approximately 43% compared to fiscal year 202223 estimates due to a recent ambulance fee study to better align cost recovery with jurisdictions throughout the county. With much of the pandemic’s adverse fiscal impacts behind us, uncertainty surrounding inflation, diminishing pent up demand, impacts to the housing market and overall risk of recession contribute to a conservative outlook that will be monitored into the future
In the late 1990s the city experienced revenue growth between 9% and 17% due to the opening of new hotels, restaurants, retail centers and new home development. Those levels of planned growth were not sustainable. As new development slows, it will be increasingly more difficult to produce double-digit growth in revenues. In fact, revenue growth has now slowed to 4% over the last ten years. While General Fund revenues have recovered from the pandemic and have thrived through this period of unprecedented inflation, the economic outlook and risk of recession is driving conservative revenue estimates into the future.
B-9
$141 $148 $152 $159 $179 $174 $182 $201 $208 $212 $$50 $100 $150 $200 $250 2015 2016 2017 2018 2019 2020 2021 2022 2023e 2024e $ Millions Fiscal Year
Other Funds
Revenues from Special Revenue funds are expected to total $19.5 million, an increase of $0.8 million or 4.5% from fiscal year 2022-23 estimates Funds collected in this category are restricted to specified purposes. The types of programs supported within Special Revenue funds are those funded by specific revenue streams such as:
• Federal Grants (Rental Assistance and Community Development Block Grants)
• Special fees and assessments (Affordable Housing and maintenance assessment districts)
• Donations (Library, Cultural Arts, Recreation and Senior Donations)
FY 2023-24
58%
Compared to the fiscal year 2022-23 adopted budget, the most noteworthy changes in the Special Revenue funds occurred in the Lighting and Landscaping District 2 fund where increases of $0.4 million are expected to occur These revenues are funded from property owner assessments Additionally, the city will be receiving new funding from the Permanent Local Housing Allocation program.
There is no revenue budgeted in the Successor Agency Housing Trust Fund. Although the Carlsbad Redevelopment Agency has been dissolved, the California Department of Finance has approved the repayment of the approximately $8.1 million (plus accrued interest) loaned to both the city’s former redevelopment areas by the General Fund as well as debt service payments remaining on the former agency’s 1993 Tax Allocation Refunding Bonds. All outstanding loans and interest accrued have been paid to the city by the end of fiscal year 2020-21 and only debt service payments remain. Payments are distributed annually from available property tax revenues allocated by the state to the successor agency. The last debt service payment on the bond will be in September 2023.
Enterprise fund revenues for fiscal year 2023-24 are projected at $92.8 million representing an increase of 4.2% or $3.7 million over fiscal year 2022-23 estimates. The revenue breakdown by activity is shown in the graph below.
B-10
Rental Assistance $11.4M,
Affordable Housing $0.5M,
CDBG $0.5M,
Maintenance Districts $4.0M,
Donations and Grants $0.4M, 2% Permanent Local Housing Allocation $1.1M, 6%
Others $1.1M, 6%
3%
3%
22%
All
Special Revenue Funds
Budgeted Revenues $19.5 Million
Enterprise funds are similar to a business in that rates are charged to support the operations that supply the goods or services. Carlsbad enterprise funds include water and recycled water delivery, wastewater services, solid waste management and the operation of a municipal golf course
Enterprise Funds
FY 2023-24 Budgeted Revenues $92.8 million
The Water Enterprise Fund revenue for fiscal year 2023-24 is estimated at $48.1 million representing an increase of $1.4 million or 3% when compared to fiscal year 2022-23 revenue estimates. This is driven by increases in water delivery charges. Projected revenues for Recycled Water of $8.9 million are expected to increase by $0.1 million or 1.6% as minor customer growth is expected and a 1% rate increase is forecasted.
Forecasted revenues for Wastewater are $22.4 million representing a 16.6% or $3.2 million increase over fiscal year 2022-23 estimates. This increased estimate is largely driven by rate increases of 20% in 2023 to support rising treatment costs and aging infrastructure costs.
Estimated revenues from operations of the Golf Course are $10.2 million, a slight decrease of $0.3 million or 3.2% when compared to fiscal year 2022-23 estimates. This minor decrease is driven by a projected normalization of golf rounds played compared to the spike in demand experienced throughout the pandemic.
Solid Waste Management revenues are projected to decrease by 17.9% or $0.7 million when compared to fiscal year 2022-23 estimates. This decrease is mainly driven by a storm water reimbursement from the city’s new waste hauler contract that was received in the previous fiscal year that will not be received in fiscal year 2023-24
B-11
Water Operations $48.1M,
Recycled Water $8.9M, 10% Wastewater Operations $22.4M, 24% Solid Waste Management $3.2M, 3% Golf Course Operations $10.2M,
52%
11%
Internal Service funds project estimated revenues of $38.4 million for fiscal year 202324 representing a decrease of 13.3% or $5.9 million over fiscal year 2022-23 projections. This decrease is driven by one-time transfers from the General Fund of $10.2 million to fund Workers’ Compensation, Risk Management, and Fleet Maintenance programs.
Internal service funds account for services provided within the city itself, from one department to another and on a cost reimbursement basis. These include programs such as the self-insurance funds for Workers’ Compensation and General Liability (Risk Management), as well as Vehicle Maintenance and Replacement, and Information Technology. Departments pay for these services and therefore the rates charged are based on the cost to provide the service. The goal of an internal service fund is to match budgeted expenses with charges to the departments.
A recent actuarial review of the Workers’ Compensation fund determined that the city should continue to set aside cash reserves in anticipation of future workers’ compensation claims. To achieve this, charges to city departments need to increase by 10-15% annually over the next several years. These planned increases went into effect in fiscal year 2021-22 and are continuing into fiscal year 2023-24. The fiscal year 2023-24 operating budget includes $6.1 million for Workers’ Compensation and $7.1 million for Risk Management.

Vehicle Maintenance and Replacement charges are budgeted at $3.7 million and $4.3 million, respectively. Vehicle Maintenance revenues are down compared to fiscal year 2022-23 estimates due to a one-time transfer in from the General Fund of $1.4 million. Vehicle replacement costs rise when the number of vehicles and the price of new vehicles or the cost to maintain those vehicles increases. For example, many older generation sedans at the end of their useful lives are now being replaced with hybrids and plug-in hybrids at a higher per unit cost. There have also been significant cost increases over the last several years in specialized vehicles such as fire trucks and ambulances as well as supply chain disruptions and unprecedented inflation that have significantly driven up prices.
Information Technology charges to departments have increased by 4.0% or $0 7 million when compared to fiscal year 2022-23 estimates. The main reason for this increase is due to contractual costs previously funded by the Strategic Digital Transformation Investment Program, or SDTIP, continuing beyond their initial year of implementation. The increase is also attributable to contractual increases to existing service contracts.
B-12
OPERATING BUDGET EXPENDITURE SUMMARY
The city’s Operating Budget for fiscal year 2023-24 totals $377.3 million, which represents an increase of about $34.9 million or 10.2% as compared to the adopted fiscal year 2022-23 budget. A summary of the changes in each of the city’s programs will be discussed below. Further information about each program can be found in the individual program summary pages.
BUDGET EXPENDITURE SUMMARY
The General Fund contains most of the discretionary revenues that support core city services. However, this should not diminish the importance of the other operating funds as they also contribute to the array of services available within Carlsbad. The remainder of this section will provide more information about the budgeted expenditures by fund and program.
To ensure the city continues to maintain a balanced budget and analyze its use of taxpayer dollars, the City Manager asked departments to reduce their existing budgets for fiscal year 2023-24 and decrease discretionary spending wherever possible. This directive came after budget reductions of nearly 2% were achieved in fiscal year 2022-23. In fiscal year 2023-24, General Fund departments were able to reduce their ongoing base budgets by $2.3 million while increasing revenues by $1.1 million. This was accomplished despite the increase in costs for certain mandatory fees and unavoidable costs such as SDG&E rate increases and other rising contracted services costs. Some examples of budget reductions proposed in fiscal year 2023-24 include:
• Reducing several types of maintenance work, including discretionary parks and trails maintenance, custodian services and vehicle maintenance
• Eliminating Sunday operation hours at the city’s three libraries
• Reducing the number of city cell phones
• Reducing holiday hours at community centers
• Reducing TGIF concerts from 9 to 6
• Reducing total full-time equivalent staffing levels by 12.06 over the previous year
These efforts contributed immensely to the city’s ability to present a balanced budget in fiscal year 2023-24 and into the future. The reductions proposed were carefully evaluated to ensure ongoing service level impacts were mitigated as much as possible. Through this process, it became clear that the city’s budget has reached a point where further reductions, if pursued, will likely result in significant service level impacts.
B-13
BudgetBudget $ % 2022-232023-24 ChangeChange General Fund 198.4 $ 216.9 $ 18.5 $ 9.3% Special Revenue 17.3 20.2 2.9 16.8% Enterprise 92.9 105.7 12.8 13.8% Internal Service 32.6 33.3 0.7 2.2% Successor Agency Housing Trust 1.1 1.1 - 0.0% Total 342.3 $ 377.3 $ 34.9 $ 10.2%
By Fund Type (In Millions)
The total Operating Budget for the General Fund for fiscal year 2023-24 is $216.9 million which is $18.5 million or 9.3% more than the previous year’s adopted budget of $198.4 million. These changes are discussed in more detail on the following pages.
Personnel costs make up 60% of the General Fund budget. The total personnel budget for fiscal year 2023-24 is $130.1 million which is $6.0 million or 4.8% greater than the previous year’s total personnel budget of $124.1 million. This is driven by negotiated compensation increases as well as anticipated step increases. In fiscal year 2023-24, the preliminary budget continues to propose including a line item for “vacancy savings.” This represents the estimated amount of budgeted personnel savings that will be realized by the end of the fiscal year. This mechanism is proposed for multiple reasons: (1) budgeting for vacancy savings reduces the total amount of the General Fund budget, (2) budgeted personnel costs more closely align with actual personnel costs over the course of the fiscal year, (3) historically, the city would bring recommendations to repurpose budget savings at the mid-year point of the fiscal year. This mechanism pre-emptively achieves that objective, and (4) budgeting vacancy savings will achieve alignment with the city’s 10-year forecast which has historically included a line item for vacancy savings.
The table above shows the breakdown of personnel costs for the General Fund. General Fund salaries include full-time and part-time staff costs and are expected to increase in fiscal year 2023-24 by $5.2 million or 6.2%. The increase is primarily due to negotiated salary increases offset by a reduction in total full-time equivalents of 12.06. The full-time staffing changes are listed below.
• Library & Cultural Arts added 1.0 Production Technician and 1.0 Senior Librarian in Adult & Teen Services. The addition of these two full-time positions is offset and funded by the reduction of
B-14
BudgetBudget $ % 2022-232023-24 ChangeChange Salaries and Wages 83.3 $ 88.5 5.2 6.2% Salaries and Wages, gross 85.3 90.5 5.2 6.1% Vacancy Savings (2.0) (2.0) - 0.0% Retirement Benefits 23.0 23.2 0.2 0.8% Health Insurance 10.7 10.7 - -0.1% Other Personnel 7.1 7.7 0.6 8.6% Total 124.1 $ 130.1 $ 6.0 $ 4.8% Personnel Costs (In Millions) GENERAL FUND BudgetBudget $ % 2022-232023-24 ChangeChange Personnel 124.1 $ 130.1 $ 6.0 $ 4.8% Personnel, gross 126.1 132.1 6.0 4.8% Vacancy Savings (2.0) (2.0) - 0.0% Maintenance & Operations 59.2 64.8 5.6 9.5% Capital Outlay 1.5 0.1 (1.4) -94.7% Transfers 13.6 21.9 8.3 61.1% Subtotal 198.4 $ 216.9 $ 18.5 $ 9.3% GENERAL FUND SUMMARY By Expenditure Type (In Millions)
part-time staff equal to 5.55 full-time equivalent positions, resulting in ongoing savings to the General Fund of approximately $100,000
• The Fire Department added 1.0 Senior Office Specialist. The addition of this full-time position is offset and funded by the reduction of two part-time positions. In conjunction with additional changes made during fiscal year 2022-23, a cost neutral fiscal impact was achieved
• Community Services Administration eliminated a full-time administrative position as part of departmental reorganization efforts within the branch
• The Utilities Department eliminated one vacant Meter Services Supervisor position in relation to technological advances that resulted in operational and business need changes within the department.
Retirement Benefits Cost
CalPERS administers the city’s defined benefit pension plan and costs have been increasing in past years as CalPERS addresses a structural shortfall in plan assets to cover unfunded liabilities. As part of CalPERS’ strategy to ensure the plan’s sustainability, CalPERS deliberately raised participating agencies’ contributions over several years to improve the plan’s long-term funded status. The pension system continues to pursue tactics in support of its strategy to ensure plan sustainability such as investing in assets with the objective of achieving a long-term rate of return that meets or exceeds 7%. While pension costs are increasing, there is some downward pressure on costs as new employees receive lower pension benefits. CalPERS has taken significant steps to ensuring plan sustainability, but pension costs still pose a significant risk on the city’s cost profile.
In support of CalPERS strategies for plan sustainability and as part of the city’s strategic, longterm approach to financial management, the city actively manages its unfunded pension liability. Since fiscal year 2016-17, the City Council has approved additional discretionary contributions of $56.4 million to decrease future costs of the city’s unfunded actuarial liability and achieve a funded status of 80% in accordance with City Council Policy Statement No. 86 This active management helps ensure that resources are available to fulfill the city’s contractual promises to its employees and minimizes the chance that funding these pension benefits will interfere with the city’s ability to provide essential public services
In support of CalPERS strategies for plan sustainability, and as part of the city’s strategic, long-term approach to financial management, the city actively manages its unfunded pension liability.
General Fund Health Insurance costs in the General Fund are remaining relatively flat at $10.7 million. Other Personnel Costs include workers’ compensation expenses and other miscellaneous costs such as Medicare, unemployment and disability which are increasing collectively by $0.6 million or 8.6%
Maintenance and Operations costs represent about 29.9% of the total General Fund budget and include the budgets for all program expenses other than personnel, capital outlay and transfers. Overall, total maintenance and operations costs are projected at $64.8 million, which represents an increase of about $5.6 million or 9.5% for fiscal year 2023-24 when compared to fiscal year 2022-23. However, this category includes a one-time appropriation of $5.22 million from General Fund reserves toward regional efforts to lower the railroad tracks in Carlsbad. Excluding this one-time use of reserves, the maintenance and operations costs are projected at $59.6 million, which represents
B-15
an increase of just 0.7% for fiscal year 2023-24 when compared to fiscal year 2022-23. With yearover-year increases in inflation of 8.2% and 6.4%, respectively, this relatively minor increase in maintenance and operations is a tremendous achievement that was accomplished through a strategic analysis of budget reductions. These reductions (1) enabled the General Fund to absorb new unfunded mandates and regulatory budget items, (2) contributed to the proposed budget surplus in fiscal year 2023-24, and (3) will assist in delaying the timing for when expenditures are projected to exceed revenues in the General Fund.
Capital Outlay includes budgeted equipment purchases over $1,000. Capital outlay purchases of $0.1 million are budgeted in the General Fund for fiscal year 2023-24. This represents a decrease of $1.4 million or 95% and is a result of the lack of new vehicle purchases when compared to the prior year
Operating Costs Associated with Capital Investments
As the city completes major capital projects, the costs of maintaining and operating the facilities and improvements, including additional personnel, if necessary, are added to departmental operating budgets. The city’s Capital Improvement Program and Strategic Digital Transformation Investment Program budgets include future projected operating impacts, which are estimated in the tables found in sections H and I, respectively.
Advances
Advances and repayments of prior advances are amounts anticipated to be transferred from the General Fund to other city funds with expectation of repayment in future years. No General Fund advances are included in this year’s operating budget.
General Fund Expenditures
Expenditures in the General Fund remained relatively consistent until fiscal year 2015-16, when the budget reflected an 8.2% increase in expenditures primarily due to increased personnel costs. In fiscal year 2016-17, expenditures included $25.3 million in one-time costs, including $10.5 million for a transfer to the Capital Improvement Program for Fire Station 2 reconstruction and $14.8 million to pay off the golf course construction bonds.
B-16
$121 $129 $171 $148 $168 $164 $216 $199 $213 $217 $$50 $100 $150 $200 $250 2015 2016 2017 2018 2019 2020 2021 2022 2023e 2024e $ Millions Fiscal Year
The expenditures for fiscal year 2017-18 reflect a substantial decrease due to the one-time costs reflected in fiscal year 2016-17 These cost reductions were partially offset by an additional one-time payment to CalPERS to address the city’s unfunded pension liability, the addition of nine staff members, additional legal and expert costs associated with the county airport expansion and the Safety Training Center lawsuit, higher personnel costs due to normal salary and benefit increases and higher mutual aid costs.
Expenditures in fiscal year 2018-19 reflect an additional one-time $20 million payment to CalPERS to further bring down the city’s unfunded pension liability. Fiscal year 2019-20 included the addition of 34 new full-time employees but was largely offset due to the city’s response to the COVID-19 pandemic and the need to reduce discretionary spending as much as possible during that unprecedented time.
Fiscal year 2020-21 expenditures reflect an additional $10 million one-time payment to CalPERS to further bring down the city’s unfunded pension liability. The increase was largely offset by the continuation of the COVID-19 pandemic and the city’s efforts to curb and defer expenditures.
Fiscal year 2021-22 expenditures reflect the plan to reinstate city services back to pre-pandemic levels and operationalize the City Council’s goals. The increase includes $5.9 million in one-time costs associated with the goals and the addition of 18 new full-time and 6.7 part-time employees which are mostly associated with the goals. The city again made an additional one-time $6.4 million payment to CalPERS to bring down the city’s unfunded pension liability.
Fiscal year 2022-23 expenditures include the addition of 24 full-time employees as well as a number of new one-time requests to execute City Council goals, as well as a total of $10.6 million in one-time transfers to fund Workers’ Compensation, Risk Management, and Fleet Maintenance. Lastly, a $2 million allocation was approved to fund the Safer Streets local emergency.
Another way of looking at the General Fund budget is by Program Expenditures. The chart on the following page compares the total fiscal year 2023-24 budget to those amounts adopted in the previous year. A detailed description of each department, its services, budget summary and department accomplishments and priorities can be found in the department program summary pages.
A detailed description of each department’s budget can be found in the department program summaries
B-17
GENERAL FUND EXPENDITURES
Transfers are amounts anticipated to be transferred from the General Fund to another city fund. The transfers included in the adopted budget are as follows:
• $12.6 million split evenly between the Infrastructure Replacement Fund, General Capital Construction Fund and the Technology Investment Capital Fund ($4.2 million each). This will fund major new construction, maintenance and replacement of city infrastructure and facilities, and the city’s future technology needs. This represents 6% of budgeted General Fund revenues and is in line with the requirements set forth in Council Policy No. 91 – Long Term General Fund Capital Funding Policy
• $7.4 million in additional transfers to the General Capital Construction Fund resulting from the estimated General Fund surplus. The General Capital Construction Fund is funded by the General Fund and includes many capital projects programmed in the future. The level o f funding necessary to fully fund these projects is an increasing concern. This one-time transfer amount will assist with funding the city’s general capital construction into the future.
• $0.3 million to the Storm Water Program for reimbursement of the General Fund portion of Storm Water expenses.
• $1.6 million to the Median Maintenance and Street Tree Maintenance Special Revenue Funds to cover cash shortfalls, as annual assessments collected from property owners do not cover annual operating expenditures. Annual assessments can only be increased with a majority vote of the property owners.
B-18
BudgetBudget $ % 2022-232023-24 ChangeChange Administrative Services - Administration 0.6 $ 0.8 $ 0.2 4.9% Administrative Services - Finance 5.5 5.3 (0.2) -2.7% Administrative Services - Human Resources 5.3 5.0 (0.3) -4.5% Administrative Services - Innovation & Economic Dev. 2.5 2.6 0.1 0.9% Community Services - Administration 0.7 0.6 (0.1) -13.4% Community Services - Community Development 10.4 11.0 0.6 6.1% Community Services - Housing & Homeless Services 3.1 2.8 (0.3) -11.8% Community Services - Library & Cultural Arts 14.1 13.6 (0.5) -3.2% Community Services - Parks & Recreation 21.2 21.1 (0.1) -0.5% Policy & Leadership Group 8.5 8.4 (0.1) -0.6% Public Safety - Fire 37.8 37.8 - 0.3% Public Safety - Police 51.2 55.6 4.4 8.5% Public Works - Administration 1.4 1.6 0.2 8.4% Public Works - Construction Mgmt. & Inspection 3.3 3.3 - -0.2% Public Works - Environmental Sustainability 1.2 1.2 - 1.6% Public Works - Facilities 6.8 7.5 0.7 10.8% Public Works - Transportation 9.7 9.7 - 0.3% Non-Departmental 15.1 29.0 13.9 91.7% Total 198.4 $ 216.9 $ 18.5 $ 9.3%
Department (In Millions)
By
General Fund Summary
The operating budget for fiscal year 2023-24 provides a balanced General Fund budget for the coming fiscal year with General Fund revenue estimates exceeding General Fund budgeted expenditures by $0.3 million, before considering the one-time appropriation of $5.22 million in General Fund reserves for the Carlsbad Village trench project that the City Council added to the proposed budget at adoption
Fiscal Year 2023-24 General Fund Operating Budget
General Fund fiscal year 2023-24 revenue estimates $212.0 million
General Fund fiscal year 2023-24 preliminary expenditures $211.7 million
Projected operating surplus for fiscal year 2023-24 $ 0.3 million
One-time use of reserves for Carlsbad Village trenching $ 5.2 million
General Fund use of reserves after operating surplus $ 4.9 million
General Fund Reserves
Projected unassigned balance at June 30, 2023 $117.9 million
Less: projected fiscal year 2023-24 use of reserves $ (4.9 million)
Equals: projected unassigned balance at June 30, 2024 $113.0 million
Changes in Other Funds
Special Revenue funds are budgeted at $20.2 million representing an increase in expenditures of 16.8% or $2.9 million when compared to fiscal year 2022-23 Except for the new funding source, Permanent Local Housing Allocation, spending in most programs is expected to remain at similar or slightly higher levels over the prior year.
Expenditure increases of $0.9 million or 8.9% are planned in the Rental Assistance Fund largely because of program expansion and corresponding increase in rental assistance payments. This reflects additional revenue received from federally funded programs to assist more lower-income households in Carlsbad.
Enterprise funds total $105.7 million, which represents an increase of $12.8 million or 13.8% over the fiscal year 2022-23 adopted budget. The Potable Water and Recycled Water funds continue to operate and maintain critical infrastructure systems and provide the safe delivery of drinking water, conservation outreach and treated irrigation water. The cost of purchased water continues to increase, causing an overall increase in the Potable Water budget. The Wastewater fund provides reliable wastewater collection services. The budget for this fund’s increase is primarily due to an increase in the transfers out to fund its related capital improvement fund.
The Internal Service funds total $33.3 million, which represents an overall increase of $0.7 million or 2.2% over fiscal year 2022-23 Much of the increase in Workers’ Compensation and Risk Management costs is attributable to rising insurance liability rates, claims filed and administrative costs. Vehicle Maintenance and Replacement and Information Technology expenditures, in total, decreased because of vehicle replacement timing. The fiscal year 2022-23 adopted budget included multiple high-dollar vehicle replacements compared to smaller purchases scheduled in fiscal year 2023-24 More detail regarding the increase in Information Technology due to the reorganization of personnel can be found in the internal service fund piece of the revenue summary section earlier in this document.
B-19
The budget for the Successor Agency Housing Trust Fund for fiscal year 2023-24 is approximately the same as the prior year’s adopted budget of $1.1 million. The Recognized Obligation Payments Schedule identifies financial commitments of the former Redevelopment Agency, including the remaining scheduled debt service payments on the Redevelopment Agency bond issue, the outstanding loan from the city’s General Fund and minor allowable administrative costs. The last debt service payment on the bond issue is scheduled for September 2023 and the city loan was paid off in fiscal year 2020-21 These obligations are to be paid from semi-annual property tax increment revenue received by the Successor Agency.

Changes to Fund Balance
While the projected cumulative change in the city’s non-major operating funds’ ending balances is not significant, two major operating funds are projected to see changes in their fund balances greater than 10% The Water Operations Fund is expected to decrease by 21.5% by the end of fiscal year 2023-24, largely due to increasing operations costs and cash transfers to account for depreciation. The Recycled Water Operations Fund is expected to decrease significantly by the end of fiscal year 2023-24 mainly due to a large cash transfer to account for depreciation and the funding of capital projects.
B-20
PERSONNEL ALLOCATIONS
The adopted budgets for fiscal years 2021-22 and 2022-23 include various reorganizations and personnel transfers between departments.
B-21 AdoptedAdoptedAdoptedAdopted BudgetBudgetBudgetBudget Department 2020-212021-222022-232023-24 City Attorney 8.008.008.008.00 City Clerk Services 7.007.007.007.00 City Council 2.002.002.002.00 City Manager 7.007.007.007.00 City Treasurer 1.001.001.001.00 Communication & Engagement 7.007.009.009.00 Administrative Services - Administration 0.003.003.003.00 Finance 31.0028.0026.0026.00 Human Resources 17.0017.0018.0018.00 Information Technology 37.0037.0043.0043.00 Innovation & Economic Development 4.004.009.009.00 Community Services - Administration 3.003.003.002.00 Community Development 61.7553.0052.0052.00 Housing & Homeless Services 0.0014.0016.0016.00 Library & Cultural Arts 52.5052.5051.0053.00 Parks & Recreation 55.0055.0059.0059.00 Fire 97.75111.00123.00124.00 Police 184.00186.00187.00187.00 Public Works 172.75177.75182.75181.75 Total Full-Time Personnel 747.75773.25806.75807.75 Hourly Full-Time Equivalent Personnel 186.59193.81180.90 167.84 Total 934.34967.06987.65975.59
Notes:
B-22
SCHEDULE OF PROJECTED FUND BALANCE
ProjectedProjected
* For the General Fund only, this represents unassigned fund balance.
B-23
Beginning Ending Change as % of Fund Balance EstimatedEstimated Fund Balance July 1, 2022 Fund July 1, 2022 Revenues Expenditures June 30, 2023 Fund Balance General Fund 122,554,527 $ * 207,801,063 $ 212,492,054 $ 117,863,536 $ * -3.8% Special Revenue Funds Affordable Housing 17,341,701 884,406 288,618 17,937,489 3.4% Agricultural Mitigation Fee 1,186,588 13,500 392,687 807,401 -32.0% Buena Vista Channel Maintenance District 1,527,280 119,095 195,245 1,451,130 -5.0% Citizens' Option for Public Safety 389,368 287,200 265,705 410,863 5.5% Community Activity Grants 1,079,163 12,000 - 1,091,163 1.1% Community Development Block Grant 569,707 701,309 728,372 542,644 -4.8% Cultural Arts Donations 334,071 28,424 85,489 277,006 -17.1% Habitat Mitigation Fee - 52,002 52,002 - 0.0% Library and Arts Endowments 259,307 2,500 4,000 257,807 -0.6% Library Gifts and Bequests 1,692,630 136,500 275,041 1,554,089 -8.2% Lighting and Landscaping District 2 4,825,153 759,743 335,033 5,249,863 8.8% Local Cable Infrastructure 806,259 299,000 435,000 670,259 -16.9% Median Maintenance District 315,473 1,316,900 1,476,870 155,503 -50.7% Opioid Settlement Fund - 238,846 - 238,846 0.0% Parking In Lieu Fee 1,146,591 13,000 53,000 1,106,591 -3.5% Permanent Local Housing Allocation - - - - 0.0% Police Asset Forfeiture 239,638 2,368 105,869 136,137 -43.2% Public Safety Grants 19,485 301,796 321,281 - -100.0% Recreation Donations 307,647 58,711 84,809 281,549 -8.5% Rental Assistance 196,913 10,850,661 10,860,729 186,845 -5.1% Senior Donations 299,770 20,646 43,500 276,916 -7.6% Street Lighting Maintenance District 2,712,485 1,000,972 916,850 2,796,607 3.1% Street Tree Maintenance District 255,061 920,500 1,075,168 100,393 -60.6% Tyler Court Apartments 68,224 681,472 748,339 1,357 -98.0% Total Special Revenue Funds 35,572,514 18,701,551 18,743,607 35,530,458 -0.1% Enterprise Funds Water Operations 31,998,456 46,727,000 48,000,000 30,725,456 -4.0% Recycled Water Operations 4,335,400 8,787,905 9,000,000 4,123,305 -4.9% Wastewater Operations 10,692,480 19,168,000 16,900,000 12,960,480 21.2% Solid Waste Management 12,748,480 3,854,582 4,982,227 11,620,835 -8.9% Golf Course 3,917,630 10,586,297 8,660,962 5,842,965 49.2% Total Enterprise Funds 63,692,446 89,123,784 87,543,189 65,273,041 2.5% Internal Service Funds Workers' Compensation 1,084,141 14,008,855 6,267,000 8,825,996 714.1% Risk Management (200,336) 4,971,351 5,155,035 (384,020) 91.7% Vehicle Maintenance 150,341 4,725,118 4,017,238 858,221 470.9% Vehicle Replacement 18,715,868 3,970,753 7,398,750 15,287,871 -18.3% Information Technology 9,349,922 16,542,819 17,086,055 8,806,686 -5.8% Total Internal Service Funds 29,099,936 44,218,896 39,924,078 33,394,754 14.8% Successor Agency Housing Trust Fund 1,150,471 1,008,646 1,038,203 1,120,914 -2.6% Total Operating Funds 252,069,894 $ 360,853,940 $ 359,741,131 $ 253,182,703 $ 0.4%
SCHEDULE OF PROJECTED FUND BALANCE
ProjectedProjected
* For the General Fund only, this represents unassigned fund balance.
B-24
Beginning Ending Change as % of Fund Balance EstimatedAdopted Fund Balance June 30, 2023 Fund June 30, 2023 Revenues Budget June 30, 2024 Fund Balance General Fund 117,863,536 $ * 212,012,126 $ 216,929,604 $ 112,946,058 $ * -4.2% Special Revenue Funds Affordable Housing 17,937,489 581,663 668,530 17,850,622 -0.5% Agricultural Mitigation Fee 807,401 13,000 - 820,401 1.6% Buena Vista Channel Maintenance District 1,451,130 116,000 195,245 1,371,885 -5.5% Citizens' Option for Public Safety 410,863 252,500 295,298 368,065 -10.4% Community Activity Grants 1,091,163 12,000 30,000 1,073,163 -1.7% Community Development Block Grant 542,644 585,275 702,305 425,614 -21.6% Cultural Arts Donations 277,006 3,424 148,750 131,680 -52.5% Habitat Mitigation Fee - - - - 0.0% Library and Arts Endowments 257,807 2,500 6,000 254,307 -1.4% Library Gifts and Bequests 1,554,089 90,500 462,785 1,181,804 -24.0% Lighting and Landscaping District 2 5,249,863 854,900 367,500 5,737,263 9.3% Local Cable Infrastructure 670,259 282,000 538,956 413,303 -38.3% Median Maintenance District 155,503 1,400,000 1,396,580 158,923 2.2% Opioid Settlement Fund 238,846 - 21,466 217,380 -9.0% Parking In Lieu Fee 1,106,591 13,000 56,000 1,063,591 -3.9% Permanent Local Housing Allocation - 1,119,126 1,119,126 - 0.0% Police Asset Forfeiture 136,137 2,400 75,000 63,537 -53.3% Public Safety Grants - - - - 0.0% Recreation Donations 281,549 49,200 81,200 249,549 -11.4% Rental Assistance 186,845 11,334,677 11,339,700 181,822 -2.7% Senior Donations 276,916 18,500 33,500 261,916 -5.4% Street Lighting Maintenance District 2,796,607 1,024,754 1,100,077 2,721,284 -2.7% Street Tree Maintenance District 100,393 1,005,000 1,004,763 100,630 0.2% Tyler Court Apartments 1,357 774,967 604,523 171,801 12560.4% Total Special Revenue Funds 35,530,458 19,535,386 20,247,304 34,818,540 -2.0% Enterprise Funds Water Operations 30,725,456 48,149,000 54,759,803 24,114,653 -21.5% Recycled Water Operations 4,123,305 8,926,380 11,849,122 1,200,563 -70.9% Wastewater Operations 12,960,480 22,356,000 23,068,138 12,248,342 -5.5% Solid Waste Management 11,620,835 3,165,200 5,950,634 8,835,401 -24.0% Golf Course 5,842,965 10,249,500 10,121,000 5,971,465 2.2% Total Enterprise Funds 65,273,041 92,846,080 105,748,697 52,370,424 -19.8% Internal Service Funds Workers' Compensation 8,825,996 6,098,510 5,157,892 9,766,614 10.7% Risk Management (384,020) 7,109,660 6,718,232 7,408 -101.9% Vehicle Maintenance 858,221 3,632,863 3,696,339 794,745 -7.4% Vehicle Replacement 15,287,871 4,311,539 1,068,564 18,530,846 21.2% Information Technology 8,806,686 17,204,775 16,637,475 9,373,986 6.4% Total Internal Service Funds 33,394,754 38,357,347 33,278,502 38,473,599 15.2% Successor Agency Housing Trust Fund 1,120,914 - 1,059,500 61,414 -94.5% Total Operating Funds 253,182,703 $ 362,750,939 $ 377,263,607 $ 238,670,035 $ -5.7%
SCHEDULE OF REVENUE ESTIMATES
* Interest is calculated on an amortized cost basis.
B-25
2022-23 2023-24 Change as % Difference 2021-22 EstimatedEstimated of 2022-232022-23 to R evenue Source Actuals Revenue Revenue Estimated 2023-24 General Fund Taxes Property Tax 80,015,372 $ 81,509,276 $ 84,246,868 $ 3.4%2,737,592 $ Sales Tax 51,175,423 51,379,433 51,064,943 -0.6%(314,490) Transient Occupancy Tax 32,402,771 32,500,000 32,861,193 1.1%361,193 Franchise Tax 6,370,942 6,971,000 7,084,717 1.6%113,717 Business License Tax 6,619,296 6,242,000 6,435,502 3.1%193,502 Transfer Tax 2,178,717 1,570,000 1,624,950 3.5% 54,950 Total Taxes 178,762,521 180,171,709 183,318,173 1.8%3,146,464 Intergovernmental Homeowners Exemption 338,265 353,000 353,000 0.0%Other Intergovernmental 7,387,339 821,418 657,951 -19.9%(163,467) Total Intergovernmental 7,725,604 1,174,418 1,010,951 -13.9%(163,467) Licenses and Permits Building Permits 1,691,494 1,800,000 1,250,000 -30.6%(550,000) Other Licenses and Permits 1,054,108 867,980 850,500 -2.0%(17,480) Total Licenses And Permits 2,745,602 2,667,980 2,100,500 -21.3%(567,480) Charges for Services Planning Fees 698,900 476,800 445,000 -6.7%(31,800) Building Department Fees 863,329 1,008,000 860,000 -14.7%(148,000) Engineering Fees 933,326 929,100 772,000 -16.9%(157,100) Ambulance Fees 3,425,287 4,430,000 6,330,000 42.9%1,900,000 Recreation Fees 2,701,108 2,529,837 2,598,600 2.7% 68,763 Other Charges or Fees 1,715,034 1,202,575 1,584,245 31.7%381,670 Total Charges For Services 10,336,984 10,576,312 12,589,845 19.0%2,013,533 Fines and Forfeitures 342,948 355,770 276,200 -22.4%(79,570) Income from Investments and Property (5,524,578) 6,021,288 5,948,225 -1.2%(73,063) Interdepartmental Charges 5,314,617 5,375,335 5,746,232 6.9%370,897 Other Revenue Sources 1,351,103 1,458,251 1,022,000 -29.9%(436,251) Total General Fund 201,054,801 $ 207,801,063 $ 212,012,126 $ 2.0%4,211,063 $
SCHEDULE OF REVENUE ESTIMATES
B-26
2022-23 2023-24 Change as % Difference 2021-22 EstimatedEstimated of 2022-232022-23 to Revenue Source Actuals Revenue Revenue Estimated 2023-24 Special Revenue Funds Affordable Housing Affordable Housing Fees 342,149 $ 247,946 $ 247,000 $ -0.4% (946) $ Property Tax - - - 0.0%Interest Income (491,215) 587,196 329,663 -43.9%(257,533) Other Revenue 1,112,930 49,264 5,000 -89.9%(44,264) Total Affordable Housing 963,864 884,406 581,663 -34.2%(302,743) Agricultural Mitigation Fee Agricultural Mitigation Fees 210,100 - - 0.0%Interest Income (49,135) 13,500 13,000 -3.7% (500) Total Agriculutural Mitigation Fee 160,965 13,500 13,000 -3.7% (500) Buena Vista Channel Maintenance Assessment Fees 161,000 100,000 100,000 0.0%Interest Income (61,578) 19,095 16,000 -16.2% (3,095) Total Buena Vista Channel Maintenance 99,422 119,095 116,000 -2.6% (3,095) Citizens' Option for Public Safety State Funding (AB3229) 283,504 282,500 250,000 -11.5%(32,500) Interest Income (16,893) 4,700 2,500 -46.8% (2,200) Total Citizens' Option For Public Safety 266,611 287,200 252,500 -12.1%(34,700) Community Activity Grants Interest Income (45,969) 12,000 12,000 0.0%Total Community Activity Grants (45,969) 12,000 12,000 0.0%Community Development Block Grant Federal Grant 1,036,043 508,874 545,490 7.2% 36,616 Interest Income 50,419 10,047 10,147 1.0% 100 Other Revenue 325,511 182,388 29,638 -83.8%(152,750) Total Community Dev. Block Grant 1,411,973 701,309 585,275 -16.6%(116,034) Cultural Arts Donations Donations 48,000 25,000 - -100.0%(25,000) Interest Income (14,453) 3,424 3,424 0.0%Total Cultural Arts Donations 33,547 28,424 3,424 -88.0%(25,000) Habitat Mitigation Fee Mitigation Fees 64,552 51,562 - -100.0%(51,562) Interest Income 648 440 - -100.0% (440) Total Habitat Mitigation Fee 65,200 52,002 - -100.0%(52,002)
SCHEDULE OF REVENUE ESTIMATES
B-27
2022-23 2023-24 Change as % Difference 2021-22 EstimatedEstimated of 2022-232022-23 to Revenue Source Actuals Revenue Revenue Estimated 2023-24 Special Revenue Funds - Continued Library And Arts Endowment Fund Interest Income (11,044) $ 2,500 $ 2,500 $ 0.0% - $ Total Library And Arts Endowment Fund (11,044) 2,500 2,500 0.0%Library Gifts/Bequests Gifts and Bequests 248,851 120,000 74,000 -38.3%(46,000) Interest Income (73,328) 16,500 16,500 0.0%Total Library Gifts/Bequests 175,523 136,500 90,500 -33.7%(46,000) Lighting And Landscaping District 2 Assessment Fees 661,641 686,700 781,200 13.8% 94,500 Interest Income (201,598) 73,043 73,700 0.9% 657 Total Lighting And Landscaping Dist. 2 467,567 759,743 854,900 12.5% 95,157 Local Cable Infrastructure Fund Cable Fees 301,514 290,000 275,000 -5.2%(15,000) Interest Income (32,840) 9,000 7,000 -22.2% (2,000) Total Local Cable Infrastructure Fund 268,674 299,000 282,000 -5.7%(17,000) Median Maintenance Assessment Fees 346,058 365,000 365,000 0.0%Other 952,289 951,900 1,035,000 8.7% 83,100 Total Median Maintenance 1,298,347 1,316,900 1,400,000 6.3% 83,100 Opioid Settlement Fund Settlements - 238,846 - -100.0%(238,846) Total Median Maintenance - 238,846 - -100.0%(238,846) Parking In Lieu Parking In Lieu Fees 44,960 - - 0.0%Interest Income (49,043) 13,000 13,000 0.0%Total Parking In Lieu (4,083) 13,000 13,000 0.0%Permanent Local Housing Allocation Federal Grant - - 1,119,126 0.0%1,119,126 Total Police Grants - - 1,119,126 0.0%1,119,126 Police Asset Forfeiture Asset Forfeitures 2,672 - - 0.0%Interest Income (10,275) 2,368 2,400 1.4% 32 Total Police Asset Forfeiture (7,603) 2,368 2,400 1.4% 32 Public Safety Grants Federal Grant 171,776 301,796 - -100.0%(301,796) Total Police Grants 171,776 301,796 - -100.0%(301,796) Recreation Donations Donations 67,052 55,981 46,500 -16.9% (9,481) Interest Income (13,157) 2,730 2,700 -1.1% (30) Total Recreation Donations 53,895 58,711 49,200 -16.2% (9,511)
SCHEDULE OF REVENUE ESTIMATES
B-28
2022-23 2023-24 Change as % Difference 2021-22 EstimatedEstimated of 2022-232022-23 to Revenue Source Actuals Revenue Revenue Estimated 2023-24 Special Revenue Funds - Continued Rental Assistance Federal Grant 8,933,219 $ 8,988,081 $ 9,035,487 $ 0.5% 47,406 $ Other Revenue 1,109,397 1,862,580 2,299,190 23.4%436,610 Total Rental Assistance 10,042,616 10,850,661 11,334,677 4.5%484,016 Senior Donations Donations 3,035 6,400 5,000 -21.9% (1,400) Interest Income (12,822) 3,500 3,500 0.0%Other Revenue 11,137 10,746 10,000 -6.9% (746) Total Senior Donations 1,350 20,646 18,500 -10.4% (2,146) Street Lighting Assessment Fees 739,284 740,000 740,000 0.0%Other Revenue 155,790 228,222 254,754 11.6% 26,532 Interest Income (117,704) 32,750 30,000 -8.4% (2,750) Total Street Lighting 777,370 1,000,972 1,024,754 2.4% 23,782 Street Tree Maintenance Assessment Fees 471,860 470,000 470,000 0.0%Other Revenue 440,239 450,500 535,000 18.8% 84,500 Total Street Tree Maintenance 912,099 920,500 1,005,000 9.2% 84,500 Tyler Court Apartments Rental Income 649,402 680,000 772,982 13.7% 92,982 Other Revenue 3,196 1,472 1,985 34.9% 513 Interest Income 69 - - 0.0%Total Tyler Court Apartments 652,667 681,472 774,967 13.7% 93,495 Total Special Revenue Funds 17,754,767 $ 18,701,551 $ 19,535,386 $ 4.5%833,835 $
SCHEDULE OF REVENUE ESTIMATES
B-29
2022-23 2023-24 Change as % Difference 2021-22 EstimatedEstimated of 2022-232022-23 to Revenue Source Actuals Revenue Revenue Estimated 2023-24 Enterprise Funds Water Operations Water Sales 27,783,136 $ 27,012,000 $ 27,822,000 $ 3.0%810,000 $ Ready-to-Serve charge 12,737,089 13,462,000 13,866,000 3.0%404,000 Property Tax 4,694,121 4,705,000 4,705,000 0.0%New Account Charges 105,269 108,000 108,000 0.0%Back-Flow Program Fees 167,823 168,000 168,000 0.0%Penalty Fees 189,399 391,000 411,000 5.1% 20,000 Interest Income (1,498,707) 319,000 389,000 21.9% 70,000 Engineering Overhead 95,307 155,000 155,000 0.0%Service Connection Fees (13,700) 15,000 20,000 33.3% 5,000 Other Revenue 3,679,732 392,000 505,000 28.8%113,000 Total Water Operations 47,939,469 46,727,000 48,149,000 3.0%1,422,000 Recycled Water Operations Water Sales 6,924,934 7,103,000 7,210,000 1.5%107,000 Ready-to-Serve charge 1,271,831 1,350,000 1,370,000 1.5% 20,000 Interest Income 320,128 (89,600) (80,000) -10.7% 9,600 Other Revenue 214,299 424,505 426,380 0.4% 1,875 Total Recycled Water Operations 8,731,192 8,787,905 8,926,380 1.6%138,475 Wastewater Operations Service Charges 16,057,876 18,741,000 21,927,000 17.0%3,186,000 Misc. Sewer 162,518 12,000 12,000 0.0%Engineering Overhead 65,119 120,000 120,000 0.0%Penalty Fees 61,779 120,000 120,000 0.0%Interest Income (551,699) 108,000 110,000 1.9% 2,000 Other Revenue 238,485 67,000 67,000 0.0%Total Wastewater Operations 16,034,078 19,168,000 22,356,000 16.6%3,188,000 Solid Waste Management Recycling Fees (AB939) 428,284 800,000 800,000 0.0%Penalty Fees 32,307 1,500 - -100.0% (1,500) Trash Surcharge 3,223,792 1,900,000 1,300,000 -31.6%(600,000) Interest Income (524,899) 132,260 125,200 -5.3% (7,060) Other Revenue 578,967 1,020,822 940,000 -7.9%(80,822) Total Solid Waste Management 3,738,451 3,854,582 3,165,200 -17.9%(689,382) Golf Course Operations Charges for Services 10,424,281 10,437,122 10,085,000 -3.4%(352,122) Interest Income (103,721) 68,675 84,000 22.3% 15,325 Other Revenue 102,878 80,500 80,500 0.0%Total Golf Course Operations 10,423,438 10,586,297 10,249,500 -3.2%(336,797) Total Enterprise Funds 86,866,628 $ 89,123,784 $ 92,846,080 $ 4.2%3,722,296 $
SCHEDULE OF REVENUE ESTIMATES
B-30
2022-23 2023-24 Change as % Difference 2021-22 EstimatedEstimated of 2022-232022-23 to Revenue Source Actuals Revenue Revenue Estimated 2023-24 Internal Service Funds Workers' Compensation Interdepartmental Charges 4,524,120 $ 5,174,620 $ 5,908,510 $ 14.2%733,890 $ Interest Income (567,118) 190,000 190,000 0.0%Other Revenue 849,077 8,644,235 - -100.0%(8,644,235) Total Workers' Compensation 4,806,079 14,008,855 6,098,510 -56.5%(7,910,345) Risk Management Interdepartmental Charges 3,305,532 3,890,450 7,069,660 81.7%3,179,210 Interest Income (206,581) 40,000 40,000 0.0%Other Revenue 49,453 1,040,901 - -100.0%(1,040,901) Total Risk Management 3,148,404 4,971,351 7,109,660 43.0%2,138,309 Vehicle Maintenance Interdepartmental Charges 3,038,651 3,272,355 3,605,863 10.2%333,508 Interest Income (13,555) 10,807 7,000 -35.2% (3,807) Other Revenue 67,848 1,441,956 20,000 -98.6%(1,421,956) Total Vehicle Maintenance 3,092,944 4,725,118 3,632,863 -23.1%(1,092,255) Vehicle Replacement Interdepartmental Charges 3,574,152 3,575,367 3,948,539 10.4%373,172 Interest Income (802,235) 220,386 213,000 -3.4% (7,386) Other Revenue 1,505,548 175,000 150,000 -14.3%(25,000) Total Vehicle Replacement 4,277,465 3,970,753 4,311,539 8.6%340,786 Information Technology Interdepartmental Charges 14,759,399 16,408,619 17,123,775 4.4%715,156 Interest Income (355,281) 82,000 81,000 -1.2% (1,000) Other Revenue 29,949 52,200 - -100.0%(52,200) Total Information Technology 14,434,067 16,542,819 17,204,775 4.0%661,956 Total Internal Service Funds 29,758,959 $ 44,218,896 $ 38,357,347 $ -13.3%(5,861,549) $ Trust Funds Sucssessor Agency Housing Fund Property Tax Increment 848,207 954,059 - -100.0%(954,059) Interest Income 54,646 54,587 - -100.0%(54,587) Total Successor Agency Housing Fund 902,853 1,008,646 - -100.0%(1,008,646) Total Trust Funds 902,853 $ 1,008,646 $ - $ -100.0%(1,008,646) $ Total Operating Funds 336,338,008 $ 360,853,940 $ 362,750,939 $ 0.5%1,896,999 $
SCHEDULE OF BUDGET EXPENDITURES
B-31
2022-23 Change as % 2020-212021-22 Estimated 2022-232023-24 of 2022-23 Department Actuals Actuals ExpendituresBudget BudgetBudget General Fund Policy And Leadership Group City Council 487,977 $ 534,144 $ 546,770 $ 652,220 $ 607,078 $ -6.9% City Attorney 2,036,466 2,081,883 2,000,000 2,033,508 2,115,596 4.0% City Clerk 1,207,035 1,296,312 1,300,000 1,394,162 1,274,455 -8.6% City Manager 1,939,537 2,013,122 2,058,720 2,156,145 2,184,823 1.3% City Treasurer 235,400 243,289 214,500 249,945 279,149 11.7% Communication & Engagement 1,493,938 2,037,551 2,029,500 1,979,186 1,953,098 -1.3% Total Policy And Leadership Group 7,400,353 8,206,301 8,149,490 8,465,166 8,414,199 -0.6% Administrative Services Administration - 706,556 741,397 747,797 784,107 5% Finance 5,810,863 5,623,094 5,300,000 5,472,176 5,323,368 -2.7% Human Resources 4,359,159 4,388,148 4,829,000 5,264,775 5,029,995 -4.5% Innovation & Economic Development 1,427,603 1,334,163 2,579,800 2,585,951 2,608,489 0.9% Total Administrative Services 11,597,625 12,051,961 13,450,197 14,070,699 13,745,959 -2.3% Community Services Community Services Administration 654,001 663,579 675,000 675,917 585,411 -13.4% Community Development 10,715,350 12,064,408 10,690,000 10,384,700 11,012,958 6.0% Housing & Homeless Services - - 2,657,643 3,134,115 2,765,195 -12% Library & Cultural Arts 12,344,689 13,024,082 13,262,900 14,088,425 13,637,285 -3.2% Parks & Recreation 16,786,632 19,251,458 21,597,193 21,167,014 21,055,565 -0.5% Total Community Services 40,500,672 45,003,527 48,882,736 49,450,171 49,056,414 -0.8% Public Safety Fire 30,712,871 33,684,622 38,995,265 37,756,943 37,882,886 0.3% Police 47,615,546 50,824,125 56,456,326 51,240,884 55,615,155 8.5% Total Public Safety 78,328,417 84,508,747 95,451,591 88,997,827 93,498,041 5.1% Public Works Public Works Administration 1,808,997 1,760,326 1,414,235 1,440,649 1,562,272 8.4% Construction Management & Inspection 2,728,545 2,909,255 3,301,343 3,262,768 3,257,906 -0.1% Environmental Sustainability 1,030,453 1,238,207 1,030,986 1,159,789 1,178,783 1.6% Fleet & Facilities 5,341,736 6,297,998 8,001,952 6,768,736 7,497,115 10.8% Transportation 7,553,800 8,048,352 9,223,272 9,707,559 9,732,215 0.3% Total Public Works 18,463,531 20,254,138 22,971,788 22,339,501 23,228,291 4.0% Miscellaneous Non-Departmental Expenditures Community Contributions & Village trenching 2,595 - - - 5,220,000Dues & Subscriptions 72,714 75,069 80,000 80,000 80,000 0.0% Legal Services 755,312 519,683 275,000 1,000,000 750,000 -25.0% Professional Services 34,194 33,980 45,000 41,658 39,700 -4.7% Other Miscellaneous Expenditures 1,055,650 50,787 60,000 100,000 100,000 0.0% Personnel Related 184,337 155,595 144,000 1,050,000 1,637,000 55.9% COVID-related 245,579 177,677 44,000 - -Vacancy savings - - (2,000,000) (2,000,000) (2,000,000) 0.0% Property Tax & Other Administration 759,165 725,588 730,000 750,000 750,000 0.0% Total Miscellaneous Non-Departmental Expenditures 3,109,546 1,738,379 (622,000) 1,021,658 6,576,700 543.7%
SCHEDULE OF BUDGET EXPENDITURES
B-32
2022-23 Change as % 2020-212021-22 Estimated 2022-232023-24 of 2022-23 Department Actuals Actuals ExpendituresBudget BudgetBudget General Fund - Continued Transfers Transfer to General Capital Construction Fund 4,500,000 $ 13,283,056 $ 3,956,000 $ 3,956,000 $ 11,600,000 $ 0.0% Transfer to Infrastructure Replacement Fund 4,500,000 283,000 3,956,000 3,956,000 4,200,000 0.0% Transfer from Infrastructure Replacement Fund - - - - -Transfer to Technology Investment Capital Fund 10,656,000 3,956,000 3,956,000 4,200,000 Transfer To LLD#1 (Medians & Trees) 700,000 1,390,000 1,400,000 1,400,000 1,570,000 0.0% Transfer To Storm Water Program 281,040 322,000 332,000 332,000 340,000 0.0% Other Miscellaneous Transfers 47,031,506 993,748 10,608,252 - - -100.0% Total Transfers 57,012,546 26,927,804 24,208,252 13,600,000 21,910,000 61.1% Total Miscellaneous Non-Departmental 60,122,092 28,666,183 23,586,252 14,621,658 28,486,700 94.8% Subtotal General Fund 216,412,690 198,690,857 212,492,054 197,945,022 216,429,604 9.3% Contingencies - - - 500,000 500,000 0.0% Total General Fund 216,412,690 $ 198,690,857 $ 212,492,054 $ 198,445,022 $ 216,929,604 $ 9.3% Special Revenue Funds Affordable Housing 4,674,625 $ 237,513 $ 288,618 $ 393,385 $ 668,530 $ 69.9% Agricultural Mitigation Fee - - 392,687 - -Buena Vista Channel Maintenance 80,982 75,104 195,245 195,245 195,245 0.0% Citizens' Option For Public Safety 263,590 181,912 265,705 265,705 295,298 11.1% Community Activity Grants - - - 30,000 30,000 0.0% Community Development Block Grant 936,783 1,429,464 728,372 636,728 702,305 10.3% Cultural Arts Donations 25,447 37,840 85,489 131,750 148,750 12.9% Habitat Mitigation Fee 16,961 14,535 52,002 - -Library And Arts Endowment Fund - 480 4,000 6,000 6,000 0.0% Library Gifts/Bequests 144,279 137,515 275,041 394,467 462,785 17.3% Lighting And Landscaping District 2 287,307 258,171 335,033 338,070 367,500 8.7% Local Cable Infrastructure Fund 336,001 403,843 435,000 395,006 538,956 36.4% Median Maintenance 1,036,374 1,067,645 1,476,870 1,329,900 1,396,580 5.0% Opioid Settlement Fund - - - - 21,466Parking In Lieu 48,244 49,674 53,000 53,000 56,000 5.7% Permanent Local Housing Allocation - - - - 1,119,126Police Asset Forfeiture 54,225 12,228 105,869 125,000 75,000 -40.0% Public Safety Grants 117,267 78,602 321,281 - -Recreation Donations 26,165 38,755 84,809 81,009 81,200 0.2% Rental Assistance 9,024,886 10,081,418 10,860,729 10,409,089 11,339,700 8.9% Senior Donations 5,367 37,796 43,500 50,500 33,500 -33.7% Street Lighting 777,332 927,419 916,850 1,065,393 1,100,077 3.3% Street Tree Maintenance 750,272 816,583 1,075,168 880,235 1,004,763 14.1% Tyler Court Apartments 474,209 915,040 748,339 540,716 604,523 11.8% Total Special Revenue Funds 19,080,316 $ 16,801,537 $ 18,743,607 $ 17,321,198 $ 20,247,304 $ 16.9%
SCHEDULE OF BUDGET EXPENDITURES
B-33
2022-23 Change as % 2020-212021-22 Estimated 2022-232023-24 of 2022-23 Department Actuals Actuals ExpendituresBudget BudgetBudget Enterprise Funds Water Operations 47,685,382 $ 44,316,249 $ 48,000,000 $ 49,715,832 $ 54,759,803 $ 10.1% Recycled Water Operations 7,603,103 8,124,171 9,000,000 11,206,521 11,849,122 5.7% Wastewater Operations 13,053,207 12,909,801 16,900,000 16,999,568 23,068,138 35.7% Solid Waste Management 5,003,349 4,744,618 4,982,227 5,801,402 5,950,634 2.6% Golf Course Operations 6,832,769 8,345,328 8,660,962 9,195,000 10,121,000 10.1% Total Enterprise Funds 80,177,810 $ 78,440,167 $ 87,543,189 $ 92,918,323 $ 105,748,697 $ 13.8% Internal Service Funds Workers' Compensation 3,408,864 $ 6,980,247 $ 6,267,000 $ 4,507,014 $ 5,157,892 $ 14.4% Risk Management 2,675,135 4,519,731 5,155,035 3,780,570 6,718,232 77.7% Self-Insured Benefits 1,834,163 - - - -Vehicle Maintenance 3,239,389 3,523,778 4,017,238 3,506,140 3,696,339 5.4% Vehicle Replacement 2,342,065 2,494,913 7,398,750 5,293,745 1,068,564 -79.8% Information Technology 13,917,753 13,264,070 17,086,055 15,477,967 16,637,475 7.5% Total Internal Service Funds 27,417,369 $ 30,782,739 $ 39,924,078 $ 32,565,436 $ 33,278,502 $ 2.2% Trust Funds Successor Agency Housing Fund 239,902 $ 120,799 $ 1,038,203 $ 1,068,845 $ 1,059,500 $ -0.9% Total Trust Funds 239,902 $ 120,799 $ 1,038,203 $ 1,068,845 $ 1,059,500 $ -0.9% Total Operating Funds 343,328,087 $ 324,836,099 $ 359,741,131 $ 342,318,824 $ 377,263,607 $ 10.2%
B-34
PUBLIC SAFETY
The City of Carlsbad’s public safety services create and maintain a safe community for all who live, work and play in our city. This important work is carried out by the dedicated men and women of the Police and Fire departments. Highly specialized divisions cover all aspects of modern law enforcement and fire services including response and recovery, emergency medical, marine safety, community risk reduction, and emergency management.
We are proud to serve the Carlsbad community, working in partnership to deliver on the city mission at the highest possible level every day.
 Michael Calderwood Fire Chief
442-339-2141
FireMail@carlsbadca.gov
Mickey Williams Chief of Police
442-339-2100
police@carlsbadca.gov
C-1

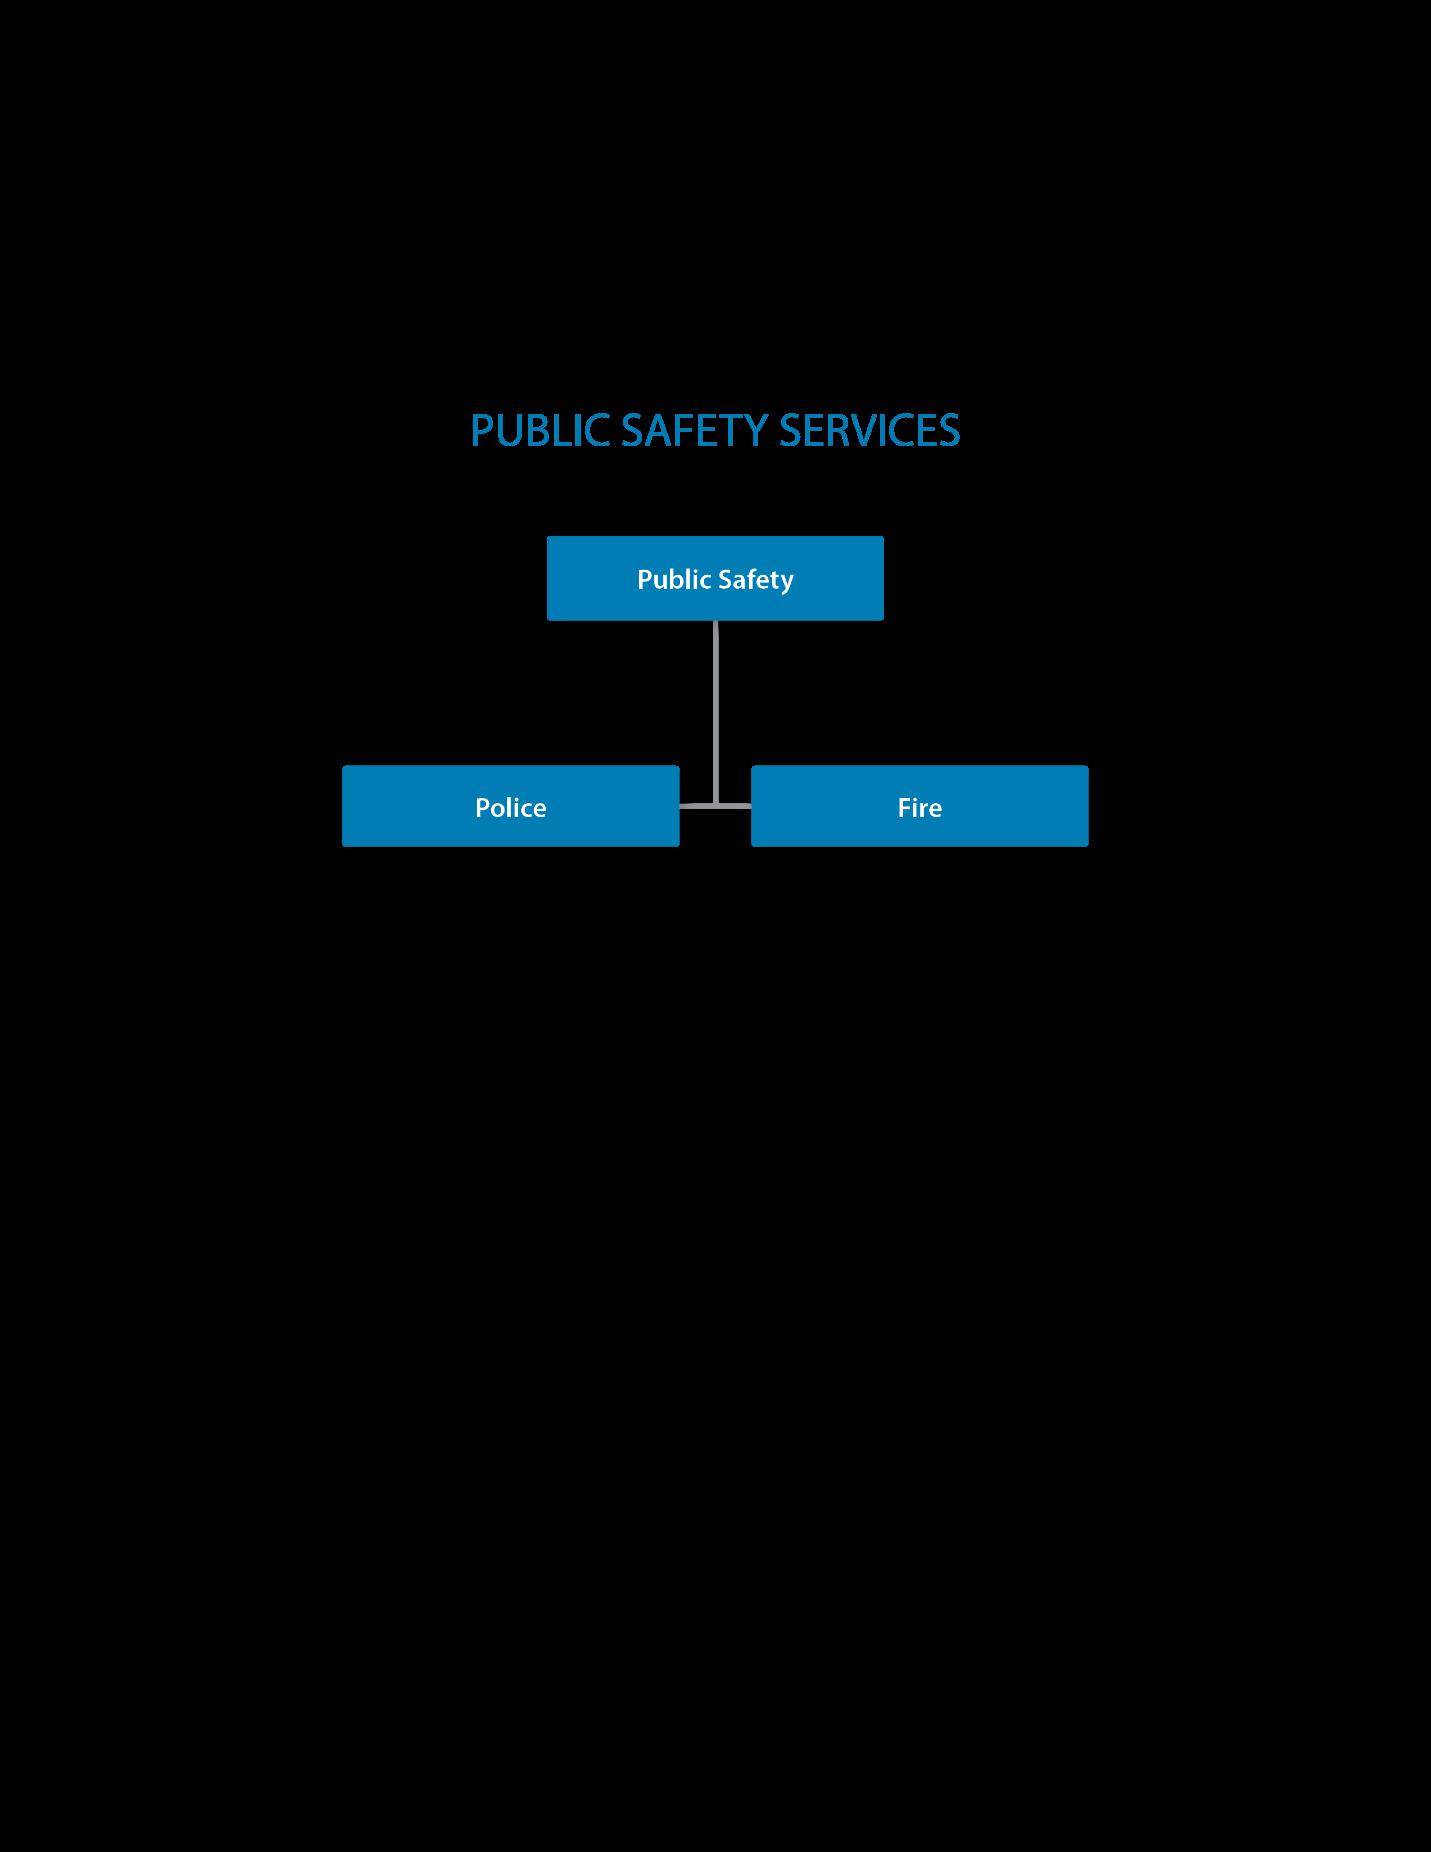
PUBLIC SAFETY |
FIRE DEPARTMENT : SUMMARY
C-3
FIRE • Fire Administration • Emergency Operations • Community Risk Reduction & Resiliency 2020-21 Actual 2021-22 Actual 2022-23 Budget 2023-24 Budget Personnel Services Salaries & Wages 15,933,650 $ 16,749,689 $ 18,570,048 $ 20,003,988 $ Retirement Benefits 5,984,047 5,793,156 5,879,146 5,913,010 Health Insurance 1,675,972 1,881,487 2,296,419 2,353,393 Other Personnel Expenses 846,659 1,614,754 1,789,390 1,921,247 Personnel Services Subtotal 24,440,328 26,039,086 28,535,003 30,191,638 Operating Expenses Professional & Contract Services 1,534,169 1,594,756 1,863,645 1,852,334 Supplies & Materials 720,270 962,942 1,154,382 1,052,766 Repair & Maintenance 95,569 69,368 91,623 74,450 Interdepartmental Charges 3,131,180 3,737,603 4,361,857 4,448,981 Other Operating Expenses 184,161 218,457 281,933 284,183 Capital Outlay 607,194 1,062,410 1,468,500Operating Expenses Subtotal 6,272,543 7,645,536 9,221,940 7,712,714 TOTAL EXPENDITURES 30,712,871 $ 33,684,622 $ 37,756,943 $ 37,904,352 $ Full Time Positions 97.75 111.00 123.00 124.00 Hourly/FTE Positions 5.50 10.00 11.50 10.50
PUBLIC SAFETY |
FIRE DEPARTMENT : ADMINISTRATION
ABOUT
Fire Administration provides leadership, strategic planning and organizational support across all department programs.
SERVICES
• Administer directives, policies and procedures
• Monitor budgets, contracts, procurement and accounting processes
• Oversee mutual aid reimbursement
• Research and support grant programs and opportunities
• Manage records
• Compile data and analyze business intelligence
• Manage webpage and social media content
C-4
Account:
Fund: General
0012200 0012210 0012251 0012253
2020-21 Actual 2021-22 Actual 2022-23 Budget 2023-24 Budget Personnel Services Salaries & Wages $639,039$612,802$594,716$609,142 Retirement Benefits 259,731210,682119,010177,943 Health Insurance 81,704 82,573 70,744 87,273 Other Personnel Expenses 44,937 79,998 76,379 76,155 Personnel Services Subtotal 1,025,411986,055860,849950,513 Operating Expenses Professional & Contract Services 1,112,072.00 1,195,3661,372,1501,396,750 Supplies & Materials 48,304 70,511 83,486 82,299 Repair & Maintenance 23 2,434 475 650 Interdepartmental Charges 2,653,0523,041,5123,615,6053,511,279 Other Operating Expenses 12,704 17,783 1,400 500 Capital Outlay 79,321 - -Operating Expenses Subtotal 3,905,4764,327,6065,073,1164,991,478 TOTAL EXPENDITURES $4,930,887$5,313,661$5,933,965$5,941,991 Full Time Positions 5.00 5.00 4.00 5.00 Hourly/FTE Positions 1.00 0.50 0.50 0.50
RECENT ACCOMPLISHMENTS
• Completed Standards of Cover Work Plan Objective 2 to support City Council goal
• Submitted Ground Emergency Medical Transportation Certified Public Expenditure cost reports for fiscal years 2018-19, 2019-20, 2020-21, 2021-22 and 2022-23
• Created an internal semiannual Operations Activity & Performance Report
• Developed and published flipbook document for the 2022 Fire Department Annual Report
• Organized third-party analysis of administrative resources to identify effectiveness and efficiencies across department
• Presented Ambulance Service Fee Study findings to the City Council
GOALS
• Adopt best practice-based response time policy according to risk type
• Identify and acquire property for permanent Fire Station 7
• Present First Responder Fee Feasibility Study findings to the City Council
• Participate in Medicare Ground Ambulance Data Collection System
• Join Ground Emergency Medical Transportation Intergovernmental Transfer Program
• Revise EMS Memorandum of Understanding with the County of San Diego
• Conclude performance standard recommendations for Carlsbad Tomorrow as an update to the Growth Management Program
C-5
FIRE DEPARTMENT: EMERGENCY OPERATIONS
Account: 0012220 0012229 0012250 0012252
ABOUT
Fund: General
The Emergency Operations Bureau is comprised of Suppression, EMS/Training and Special Operations/Professional Services The divisions provide an all-hazard response safeguarding life, property and the environment through 24-hour fire, rescue, marine safety and emergency medical services.
SERVICES
• Extinguish structure and wildland fires
• Deploy mutual aid assistance across the state
• Organize response and support operations for natural or man-made disasters
• Investigate and mitigate hazardous materials
• Deliver emergency medical and community health services
• Perform high-risk technical search and rescues
• Deploy SWAT Medics to support law enforcement agencies
• Provide lifeguard services at North Beach and Agua Hedionda Lagoon
• Maintain state-mandated professional licenses, certificates and continuing education credits
• Develop and supervise health and wellness programs
• Coordinate Fire Explorer Program for high school and college students
C-6
PUBLIC SAFETY |
2020-21 Actual 2021-22 Actual 2022-23 Budget 2023-24 Budget Personnel Services Salaries & Wages $13,968,465$14,834,351$16,604,025$18,019,888 Retirement Benefits 5,207,2225,100,1715,327,2555,261,781 Health Insurance 1,425,1751,614,9272,017,1622,069,660 Other Personnel Expenses 712,3111,351,3101,536,2071,683,577 Personnel Services Subtotal 21,313,17322,900,75925,484,64927,034,906 Operating Expenses Professional & Contract Services 200,794197,349227,315206,504 Supplies & Materials 637,130850,264999,469911,017 Repair & Maintenance 92,615 66,849 91,148 73,800 Interdepartmental Charges 184,478236,381338,955493,664 Other Operating Expenses 164,002192,849259,033263,183 Capital Outlay 527,8731,062,4101,468,500 0 Operating Expenses Subtotal 1,806,8922,606,1023,384,4201,948,168 TOTAL EXPENDITURES $23,120,065$25,506,861$28,869,069$28,983,074 Full Time Positions 82.00 94.00 107.00 107.90 Hourly/FTE Positions 3.50 8.50 10.50 9.50
RECENT ACCOMPLISHMENTS
• Recruited full-time and part-time EMTs to convert all ambulances to new staffing model
• Operationalized Temporary Fire Station 7
• Promoted three fire captains and three fire engineers to establish new fire station
• Added fourth paramedic firefighter on ladder truck to maintain an Effective Response Force
• Ordered and outfitted new fire engine
• Designed, ordered and outfitted new urban search and rescue apparatus
• Launched automated narcotic tracking system to enhance recordkeeping requirements
• Implemented “Leave Behind Narcan” and overdose recognition and intervention programs
• Provided EMTs for first aid services at TGIF Concerts in the Parks
• Replaced Very High Frequency radios to improve interoperability
• Retrofitted Plymovent exhaust extraction systems with magnetic couplers at all fire stations
• Replaced Self-Contained Breathing Apparatus equipment
• Procured air decontamination and filtration units for all firefighting apparatuses
• Submitted Letter of Intent to Cal OES to request funding for regional rescue training
• Hired second Paramedic Lifeguard Lieutenant to manage day-to-day beach operations
• Relocated lifeguard operations and apparatuses to Temporary Fire Station 7
GOALS
• Refine plan to incorporate EMTs into city special event plans
• Develop EMT-to-paramedic firefighter promotion curriculum to bolster recruitment
• Enhance community health through outreach and education
• Finalize data sharing agreement with County of San Diego for electronic patient care records
• Develop Fire Station Master Plan to identify current and future station needs
• Attain United States Lifeguard Association Accreditation
• Install boat dock at Temporary Fire Station 7 for direct access to Agua Hedionda Lagoon
• Execute quarterly training plan for North Zone Technical Rescue Team
• Collaborate with Police Department to develop Mobile Command Post Training
• Maintain “Turn-Out-Time” of 2 minutes or less for all requests at least 90% of the time
• Maintain EMS satisfaction rating above 95%
C-7
Performance Measure FY 2022 Actual FY 2023 Estimated FY 2024 Projected Time from request to first unit being en-route (90th percentile) 01:50 01:55 01:55 EMS customer survey overall satisfaction rating 94.3% 95 0% 95.0%
FIRE DEPARTMENT : COMMUNITY RISK REDUCTION & RESILIENCY
ABOUT
The Community Risk Reduction Bureau is comprised of Fire & Life Safety and the Office of Emergency Management and Resilience. The divisions mitigate all types of hazardous conditions and ensure incident response readiness.
SERVICES
• Oversee Hazard Reduction Program to identify and abate brush fire hazards
• Respond to inquiries and complaints concerning hazardous conditions
• Investigate cause and origin for suspicious or large loss fires
• Review code compliance on construction plan submittals
• Complete construction inspections for new buildings and remodeling projects
• Conduct annual inspections of schools, care facilities, hotels, motels and apartment complexes
• Coordinate outreach and education programs promoting fire safety tips and prevention
• Install and test smoke alarms in Carlsbad homes
• Direct, conduct and implement city-level emergency plans, programs, training and exercises
• Coordinate multi-department and multi-agency preparedness to prevent, protect against, mitigate, respond to and recover from all threats and hazards
C-8
PUBLIC SAFETY |
Fund: Fund: General Special Revenue – Opioid Settlement
Account: 0012240-0012243 128
2020-21 Actual 2021-22 Actual 2022-23 Budget 2023-24 Budget Personnel Services Salaries & Wages $1,326,146$1,302,536$1,371,307$1,374,958 Retirement Benefits 517,094482,303432,881473,286 Health Insurance 169,093183,987208,513196,460 Other Personnel Expenses 89,411183,446176,804161,515 Personnel Services Subtotal 2,101,7442,152,2722,189,5052,206,219 Operating Expenses Professional & Contract Services 221,303202,041264,180249,080 Supplies & Materials 34,836 42,167 71,427 59,450 Repair & Maintenance 2,931 85 0Interdepartmental Charges 293,650459,710407,297444,038 Other Operating Expenses 7,455 7,825 21,500 20,500 Capital Outlay 0 0 -Operating Expenses Subtotal 560,175711,828764,404773,068 TOTAL EXPENDITURES $2,661,919$2,864,100$2,953,909$2,979,287 Full Time Positions 10.75 12.00 12.00 11.10 Hourly/FTE Positions 1.00 1.00 0.50 0.50
• Support large-scale emergencies through the Emergency Operations Center
• Conduct emergency notifications and direct emergency care and shelter operations
• Manage the Carlsbad Community Emergency Response Team
• Represent the city on the San Diego Unified Disaster Council
• Co-chair Ready Carlsbad Business Alliance Committee of the Carlsbad Chamber of Commerce
RE CENT ACCOMPLISHMENTS
• Adopted 2022 California Fire Code with local amendments
• Audited Knox Box Program and updated Key Issuance Policy
• Developed Wildland Fire Homeowners Association Education Program
• Formatted fuel modification plans for compatibility with infield GIS operations programs
• Extended smoke alarm installation program to all Carlsbad residents
• Activated Emergency Operations Center (EOC) for Safer Streets Emergency and managed city response
• Delivered EOC training to approximately 35 responders
• Delivered Emergency Shelter Worker Training to approximately 100 city employees
• Elected to serve on San Diego Cyber Center of Excellence Board of Advisors
• Elected to serve as president of InfraGard San Diego
• Installed as president of the Southern California Fire Prevention Officers Section of the California Fire Chiefs Association
GOALS
• Adopt Fire Hazard Severity Zone Map by ordinance
• Update City Landscape Manual incorporating new fuel modification guidelines
• Conduct community risk assessments for emergency planning of natural, technological and man-made hazards and threats
• Initiate Restaurant Inspection Program Feasibility Study for extinguishing systems including proper use education for kitchen staff
• Create new program for safe use and operation of lithium-ion battery powered devices
• Convert all paper plans to digital format for ease of access, viewing and storage reduction
• Provide Incident Command System training for overhead deployment assignments
• Collaborate with the IT Department to develop cybersecurity training and exercises
• Train additional EOC responders and emergency shelter workers through scenario-based disaster workshops and exercises
• Design, develop and implement Community Based Risk Reduction and Resilience Program
• Manage EOC Renovation Project to include structural and technological enhancements
• Maintain 100% compliance with mandated inspections under Senate Bill 1205
• Achieve 90% compliance for completing fire investigation reports within 30 days of initial fire incident
C-9
Performance Measure FY 2022 Actual FY 2023 Estimated FY 2024 Projected Compliance with Senate Bill 1205-mandated inspections 100% 100% 100% Complete fire investigation report within 30 days of initial fire incident 90% of the time 87% 75% 90%
PUBLIC SAFETY |
POLICE DEPARTMENT: SUMMARY
C-10
POLICE • Administration • Field Operations • Support Operations • Professional Standards and Services • Police Grants & Asset Forfeiture 2020-21 Actual 2021-22 Actual 2022-23 Budget 2023-24 Budget Personnel Services Salaries & Wages 23,442,173 $ 24,040,885 $ 25,853,833 $ 28,351,946 $ Retirement Benefits 10,176,003 9,216,797 8,353,791 8,815,694 Health Insurance 2,533,373 2,459,113 2,942,943 2,902,722 Other Personnel Expenses 1,494,433 3,022,563 3,593,209 4,198,805 Personnel Services Subtotal 37,645,982 38,739,358 40,743,776 44,269,167 Operating Expenses Professional & Contract Services 2,209,244 1,723,964 1,816,720 1,688,452 Supplies & Materials 454,203 899,446 469,405 444,505 Repair & Maintenance 185,356 208,560 260,425 260,425 Interdepartmental Charges 6,548,607 7,432,859 7,723,463 8,678,004 Other Operating Expenses 319,389 597,502 614,600 644,100 Capital Outlay 601,499 1,491,767 3,200 800 Operating Expenses Subtotal 10,318,298 12,354,098 10,887,813 11,716,286 TOTAL EXPENDITURES 47,964,280 $ 51,093,456 $ 51,631,589 $ 55,985,453 $ General Fund 47,615,546 $ 50,824,125 $ 51,240,884 $ 55,615,155 $ Special Revenue Fund 435,082 272,742 390,705 370,298 TOTAL FUNDING 48,050,628 $ 51,096,867 $ 51,631,589 $ 55,985,453 $ Full Time Positions 184.00 186.00 187.00 187.00 Hourly/FTE Positions 2.00 2.00 3.18 2.18
PUBLIC SAFETY |
POLICE DEPARTMENT: ADMINISTRATION
Account: 0012110 0012122
ABOUT
This division develops and administers programs that support the city’s and the Police Department’s statement of values in a manner responsive to the city and its residents. This division also establishes policies and long-range plans to meet department goals and city needs.
SERVICES
• Develop and manage programs that reduce crime, encourage resident engagement and improve community safety
• Assist staff with individual and team development
• Provide support to divisions to assist with meeting goals
• Respond to residents’ concerns, City Council inquiries and public records requests
RECENT ACCOMPLISHMENTS
• Began Phase 2 of Police & Fire Headquarters remodel
• Conducted two Police Citizens Academy sessions and one city Citizens Academy
• Implemented a monthly Communications Team meeting to increase candid communication within the department
• Increased engagement across all social media platforms
C-11
Fund: General
2020-21 Actual 2021-22 Actual 2022-23 Budget 2023-24 Budget Personnel Services Salaries & Wages 787,934 $ 897,021 $ 882,956 $ 937,426 $ Retirement Benefits 364,243 321,535 229,062 302,034 Health Insurance 75,338 75,429 100,384 80,271 Other Personnel Expenses 44,743 100,314 117,598 154,234 Personnel Services Subtotal 1,272,258 1,394,299 1,330,000 1,473,965 Operating Expenses Professional & Contract Services 975,152 886,315 949,000 856,000 Supplies & Materials 20,810 46,328 38,250 32,050 Repair & Maintenance 7,829 2,285 9,000 9,000 Interdepartmental Charges 3,801,221 3,959,997 4,273,139 4,795,803 Other Operating Expenses 254,782 327,630 360,550 360,050 Capital Outlay 24,651 1,096,499 3,200 800 Operating Expenses Subtotal 5,084,445 6,319,054 5,633,139 6,053,703 TOTAL EXPENDITURES 6,356,703 $ 7,713,353 $ 6,963,139 $ 7,527,668 $ Full Time Positions 5.00 6.00 7.00 7.00 Hourly/FTE Positions 0.00 0.00 0.00 0.00
• Established and adopted the initial terms of the members of the Community-Police Engagement Commission
• Instituted an internal Police Department webpage to streamline how employees access department information, resources and processes
GOALS
• Respond to a growing number of calls for service involving mental crisis in a manner consistent with crisis management and de-escalation best practices
• Use more innovative technology to provide the most efficient and effective service
• Work with the city’s innovation team to increase accuracy, efficiency and transparency in the department’s data
• Review and analyze department response times with a goal of decreasing response times for all priority calls for service
C-12
POL ICE DEPARTMENT: FIELD OPERATIONS
Account: 0012115-2121 0012123-2125
ABOUT
Fund: General
The Field Operations Division includes patrol, traffic, canines, SWAT, lagoon patrol and police rangers. The Department’s goal for average response time for Priority 1 calls is less than six minutes. The average response time for Priority 1 calls in the city is 5.07 minutes.
The FBI Index is used to measure crime in the city. The FBI Index includes homicide, rape, robbery, aggravated assault, burglary, larceny, theft and motor vehicle theft. In 2022, the city’s violent crime rate was 2 per 1,000 population and the property crime rate was 18.48 per 1,000 population. The county average is 3.79 for violent crime and 15.21 for property crime.
SERVICES
• Respond to calls for emergency and non-emergency services
• Utilize new and existing resources to address complaints and quality of life issues
• Provide emergency services, preventative patrol, traffic enforcement and special enforcement in the community
• Utilize de-escalation tactics during criminal and mental health scenarios to safely resolve critical incidents
C-13
PUBLIC SAFETY |
2020-21 Actual 2021-22 Actual 2022-23 Budget 2023-24 Budget Personnel Services Salaries & Wages 12,759,559 $ 12,777,311 $ 13,676,425 $ 15,084,018 $ Retirement Benefits 5,894,379 5,313,526 4,643,888 4,976,823 Health Insurance 1,348,171 1,271,010 1,492,109 1,469,024 Other Personnel Expenses 807,276 1,610,722 1,847,458 2,109,944 Personnel Services Subtotal 20,809,385 20,972,569 21,659,880 23,639,809 Operating Expenses Professional & Contract Services 399,966 494,931 507,620 535,352 Supplies & Materials 200,037 370,066 167,230 167,230 Repair & Maintenance 17,224 30,047 21,400 21,400 Interdepartmental Charges 2,049,500 2,718,299 2,725,205 3,159,009 Other Operating Expenses 24,550 123,269 135,950 135,950 Capital Outlay 504,118 231,323 -Operating Expenses Subtotal 3,195,395 3,967,935 3,557,405 4,018,941 TOTAL EXPENDITURES 24,004,780 $ 24,940,504 $ 25,217,285 $ 27,658,750 $ Full Time Positions 99.50 102.00 96.00 95.00 Hourly/FTE Positions 0.00 0.00 0.00 0.00
• Staff every major public event in the city with Patrol and SWAT team members to respond to immediate, life-threatening emergencies
• Conduct field interviews and take reports at incidents including crimes, arrests, collisions and
• Enforce laws and ordinances, preserve the peace, and provide for the protection of life and property through proactive programs of enforcement and prevention
RECENT ACCOMPLISHMENTS
• Continued to train our de-escalation policy/program including all new employees and conducted training for the Carlsbad Equity Coalition
• Expanded response capacity to schools including access and training personnel in life saving medical aid and equipment
• Implemented new canine unit training and deployment software that improves the quality of documentation of training and the deployment of information making the canine unit more effective and accountable
• Achieved an approval rating of 4.43 out of 5 based on 2,848 responses for 2022
• Completed an evaluation of the department’s response time for emergency calls for service
• Achieved average response times as follows:
o Priority 1: 5.07 minutes
o Priority 2: 10.54 minutes
o Priority 3: 48.45 minutes
GOALS
• Continue to collaborate with schools in the city to improve cooperation and collaboration during critical and routine incidents
• Continue to work on department’s technology foundation to be more effective and efficient, acquire more timely and accurate data, and support a data-driven approach to policing
• Formalize critical incident debriefing protocol and documentation to ensure that the department maximizes the learning potential of unique incidents
*Automated license plate reader technology, also known as License Plate Recognition, is used by the Police Department to convert data associated with vehicle license plates for official law enforcement purposes, including identifying stolen or wanted vehicles, stolen license plates and missing persons. License Plate Recognition may also be used to gather information related to active warrants, homeland security, electronic surveillance, suspect interdiction and stolen property recovery. The statistics above show the number of suspects apprehended and vehicles recovered using license plate readers. Figures cannot be projected or estimated for upcoming fiscal years
C-14
Police Activity CY 2018 CY 2019 CY 2020 CY 2021 CY 2022 Police activities/Calls for service 99,562 112,323 110,448 107, 156 103,192 Number of cases 8,705 8,774 8,222 8,704 8,348 9-1-1 calls 32,509 33,061 31,642 36, 154 34,550 Total phone calls 156,488 157,587 162,055 162,541 148,819
Measure FY 2022 Actual FY 2023 Estimated FY 2024 Projected Suspects arrested with License Plate Recognition* 106 132 Vehicles recovered with License Plate Recognition * 90 111
Performance
PUBLIC SAFETY |
POLICE DEPARTMENT: SUPPORT OPERATIONS
Account: 0012126-2138 0012142-2145 Fund: General
ABOUT
The Support Operations Division includes the Crime Suppression Team, Homeless Outreach Team, Investigations Division, Family Services, Communications, Records, Property and Evidence, and Fleet Operations.
SERVICES
• Provide public safety communication including answering 9-1-1 and other calls and dispatching appropriate emergency personnel
• Conduct follow-up investigations leading to the identification and apprehension of persons responsible for the commission of crimes
• Collect and process evidence collected in the field by police employees
• Provide support to divisions to assist with meeting goals
• Assist in the preservation of all life and ensure a safe resolution to critical incidents
• Investigate and follow up on crime and incident reports as they relate to the family
• Assist in the coordination of diversion, prevention and education activities
• Provide and manage the department’s fleet
• Maintain and provide information and support for all records management, PRA Requests, evidence disbursement and documentation distribution
C-15
2020-21 Actual 2021-22 Actual 2022-23 Budget 2023-24 Budget Personnel Services Salaries & Wages 9,094,750 $ 9,677,739 $ 10,337,845 $ 11,502,713 $ Retirement Benefits 3,649,345 3,341,120 3,203,873 3,306,177 Health Insurance 1,036,172 1,038,882 1,234,254 1,254,585 Other Personnel Expenses 590,381 1,217,342 1,495,059 1,803,517 Personnel Services Subtotal 14,370,648 15,275,083 16,271,031 17,866,992 Operating Expenses Professional & Contract Services 701,550 253,320 158,100 144,600 Supplies & Materials 131,782 394,585 106,225 107,525 Repair & Maintenance 123,598 175,672 184,750 184,750 Interdepartmental Charges 661,781 721,731 688,898 692,643 Other Operating Expenses 24,218 74,290 91,100 121,100 Capital Outlay 44,857 128,213 -Operating Expenses Subtotal 1,687,786 1,747,811 1,229,073 1,250,618 TOTAL EXPENDITURES 16,058,434 $ 17,022,894 $ 17,500,104 $ 19,117,610 $ Full Time Positions 73.50 73.00 78.00 80.00 Hourly/FTE Positions 1.00 1.00 2.18 1.18
RECENT ACCOMPLISHMENTS
• Responded to 9,695 transient-related calls for service last year
• Received a satisfaction rating of 4.12 out of 5, based on 2,396 crime victims surveyed
• Initiated a grant-funded program for several detectives to work directly out of the North County Family Justice Center, which has improved cross-coordination between law enforcement agencies, prosecutors, victim advocacy and criminal justice
• Implemented online mapping and intelligence to maximize effectiveness to address overdose investigation
• Replaced and expanded our License Place Reader program
• Began installation of in-car video into the marked police vehicle fleet
GOALS
• Evaluate and consider reorganization opportunities for the Investigative Bureau with attention towards addressing crime trends, operational efficiency and enhancing community service
• Work alongside high schools to offer voluntary police ride-alongs as a portion of school curriculum
• Finish implementation of the new Computer Aided Dispatch System
• Begin the conversion of NetRMS to Niche for our records management system
• Implement vehicle telematics to increase driving safety
*Performance measures reported last year were removed as they are no longer tracked solely by the Police Department. Housing & Homeless Services and the Police Department work together to present these measures to City Council on a quarterly basis and the Housing & Homeless Services Department reports related performance measures as part of the budget process.
C-16 CY 2018 CY 2019 CY 2020 CY 2021 CY 2022 Violent crime clearance rate 46% 55% 59% 46% 46% Property crime clearance rate 11% 9% 10% 11% 12%
POLICE DEPARTMENT: PROFESSIONAL STANDARDS & SERVICES
ABOUT
The Professional Standards & Services Division supports the Police Department in the form of training, internal affairs, professional standards and personnel recruitment and hiring.
SERVICES
• Recruit new employees, organize testing programs and conduct mandated pre-employment investigations and Peace Officer Standards and Training
• Establish, maintain and enforce department professional standards and coordinate all department training
• Investigate resident complaints
• Provide information to the media to inform the public regarding crime activity in the city
• Help improve the quality of life for city residents through crime prevention awareness and education and help reduce the fear of crime through the dissemination of information
RECENT ACCOMPLISHMENTS
• Received an approval rating of 4.64 out of 5 (a slight increase from last year), based on 2,582 crime victims surveyed when asked if their call was handled in a respectful, attentive and expeditious manner
• Began process to update the department’s Special Assignment and Promotion Policy
C-17
PUBLIC SAFETY |
Fund: General
Account: 0012140
2020-21 Actual 2021-22 Actual 2022-23 Budget 2023-24 Budget Personnel Services Salaries & Wages 630,925 $ 520,695 $ 826,783 $ 681,439 $ Retirement Benefits 217,449 192,657 240,880 186,138 Health Insurance 66,100 62,099 99,534 80,105 Other Personnel Expenses 44,399 78,075 114,163 109,121 Personnel Services Subtotal 958,873 853,526 1,281,360 1,056,803 Operating Expenses Professional & Contract Services 114,576 89,398 142,000 122,500 Supplies & Materials 76,962 76,239 87,700 87,700 Repair & Maintenance 480 556 275 275 Interdepartmental Charges 32,349 28,380 32,021 26,849 Other Operating Expenses 12,389 72,313 17,000 17,000 Capital Outlay - 26,962 -Operating Expenses Subtotal 236,756 293,848 278,996 254,324 TOTAL EXPENDITURES 1,195,629 $ 1,147,374 $ 1,560,356 $ 1,311,127 $ Full Time Positions 5.00 4.00 5.00 4.00 Hourly/FTE Positions 1.00 1.00 1.00 1.00
• Updated the department’s Personal Appearance Standards Policy
• Created a standalone policy for protests, demonstrations and riots providing officers and supervisors with specific direction on how to apply the law in a safe and effective manner while upholding the public’s first amendment protections
• Formalized and standardized unit/shift expectations
• Created new recruitment videos for both officers and dispatchers
• Conducted 36 internal affairs investigations (both internal and external) ensuring good order and discipline within the department
• Hired 36 personnel in the police department including sworn, non-sworn and professional staff
• Created a family police academy offered to employees’ families at least once a year
GOALS
• Eliminate personnel vacancies in the police department
• Create a voluntary community security video registration program
• Formalize the training protocol for employees who are assigned to new positions
• Standardize reporting protocols for new legislative requirements
• Install inventory tracking software for the entire department (Quartermaster)
C-18
PUBLIC SAFETY |
POLICE DEPARTMENT: POLICE GRANTS & ASSET FORFEITURE
ABOUT
Police grants include federal and state asset forfeiture, the Citizens’ Option for Public Safety, the Justice Assistance Grant, the Urban Areas Security Initiatives Program and the Office of Traffic Safety.
SERVICES
• Use grants to purchase police equipment, supplement staffing costs and assist with training
RECENT ACCOMPLISHMENTS
• Used the Citizens’ Option for Public Safety grant to fund one full-time sworn officer position
• Used the Justice Assistance Grant to purchase police radios
• Used the Homeland Security Grant to purchase night vision goggles for the SWAT team
• Used the Office of Traffic Safety Grant to conduct DUI/DL checkpoints, DUI saturation patrols and purchase a Lidar Device
• Received a grant award to contribute to Officer Wellness and Mental Health Programs
C-19
Account: 121-122 123 124 Fund: Special Revenue-Asset Forfeiture Special Revenue-COPS Fund Special Revenue-Public Safety Grants
2020-21 Actual 2021-22 Actual 2022-23 Budget 2023-24 Budget Personnel Services Salaries & Wages 169,005 $ 168,119 $ 129,824 $ 146,350 $ Retirement Benefits 50,587 47,959 36,088 44,522 Health Insurance 7,592 11,693 16,662 18,737 Other Personnel Expenses 7,634 16,110 18,931 21,989 Personnel Services Subtotal 234,818 243,881 201,505 231,598 Operating Expenses Professional & Contract Services 18,000 - 60,000 30,000 Supplies & Materials 110,960 15,639 70,000 50,000 Repair & Maintenance 36,225 - 45,000 45,000 Interdepartmental Charges 3,756 4,452 4,200 3,700 Other Operating Expenses 3,450 - 10,000 10,000 Capital Outlay 27,873 8,770 -Operating Expenses Subtotal 200,264 28,861 189,200 138,700 TOTAL EXPENDITURES 435,082 $ 272,742 $ 390,705 $ 370,298 $ Full Time Positions 1.00 1.00 1.00 1.00 Hourly/FTE Positions 0.00 0.00 0.00 0.00
GOALS
• Continue to seek grant funding for necessary equipment
• Continue to collaborate with the Fire Department on grant management
• Apply for the Alcoholic Beverage Control grant to expand the department’s present efforts in addressing alcohol related problems with licensed establishments
C-20
PUBLIC WORKS
Public Works is responsible for planning, providing and maintaining the infrastructure that supports a high quality of life in the City of Carlsbad. From buildings and vehicles to roads and habitat, to safe, reliable water supplies and more, Public Works oversees responsible and sustainable management practices for a wide variety of city assets.
This includes administration of the Capital Improvement Program, a 15-year plan that encompasses road and traffic improvements; storm drain systems; major facilities maintenance, repairs and renovation; water and wastewater infrastructure; construction of civic buildings and other infrastructure projects. Public Works plays a key role in promoting environmental sustainability, enhancing transportation options and protecting public health and safety.
 Paz Gomez Deputy City Manager, Public Works
442-339-2751
paz.gomez@carlsbadca.gov
D-1
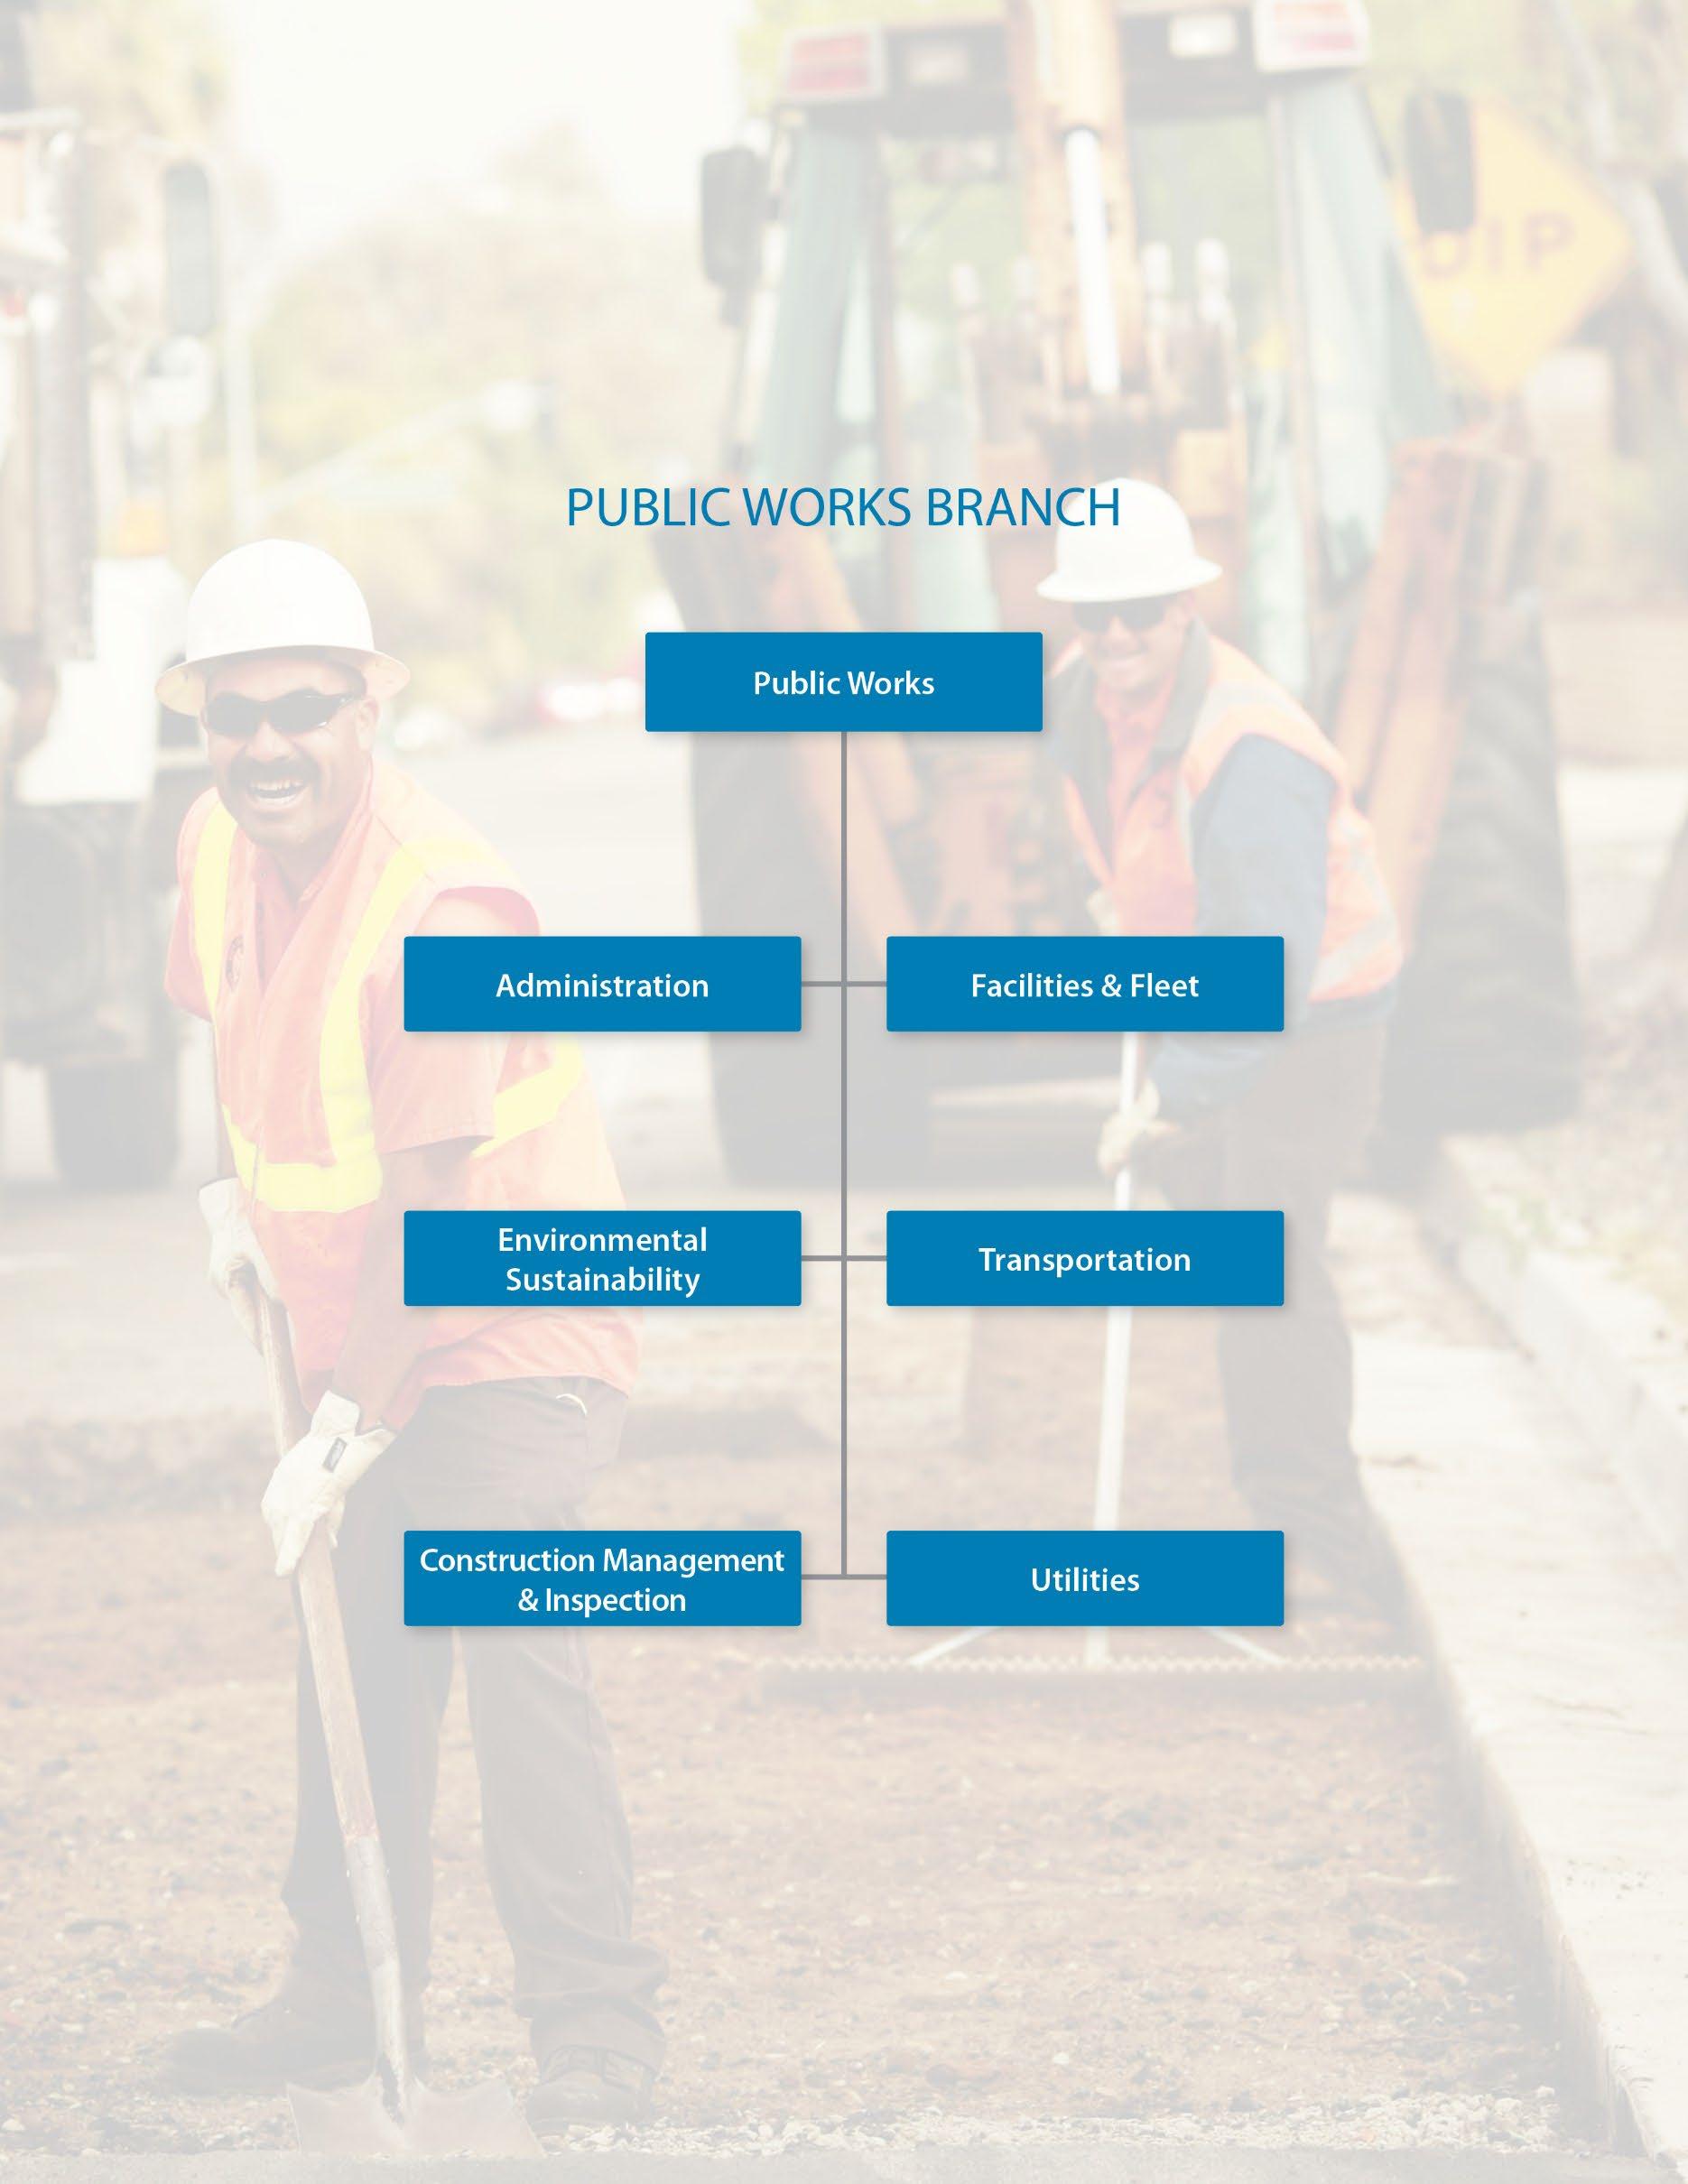
ABOUT
Public Works Administration provides leadership and strategic vision for the entire Public Works Branch, which is comprised of the Construction Management & Inspection, Fleet & Facilities, Environmental Sustainability, Transportation and Utilities departments. It provides administrative support services with a focus on strategic alignment to the Community Vision and City Council goals.
SERVICES
• Provide leadership and management support, operating budget oversight, Capital Improvement Program (CIP) oversight, contract administration and records management
• Support communications and outreach activities for major CIP projects
RECENT ACCOMPLISHMENTS
• Transitioned internal contract status reports to on-demand dashboards
• Expanded functionality of DocuSign to facilitate expedited contract execution
• Updated contract templates to facilitate use of anticipated federal funding
• Partnered with GIS staff to continually improve and update the internal project submittal app, public dashboard and reporting for the CIP
• Facilitated an update of the city’s engineering manual and other relevant engineering standards
• Received the American Public Works Association, San Diego and Imperial Counties Chapter Award of Merit for outstanding public service
D-3
Account: 0018310 Fund: General
PUBLIC WORKS | ADMINISTRATION
2020-21 Actual 2021-22 Actual 2022-23 Budget 2023-24 Budget Personnel Services Salaries & Wages $907,628$957,345$782,418$849,559 Retirement Benefits 294,482261,482182,988182,926 Health Insurance 100,656 98,468 72,660 72,179 Other Personnel Expenses 26,532 33,683 29,465 29,090 Personnel Services Subtotal 1,329,2981,350,9781,067,5311,133,754 Operating Expenses Professional & Contract Services 261,134113,686 94,078 83,078 Supplies & Materials 19,291 18,643 18,301 8,046 Repair & Maintenance 11,916 3,153 2,100 2,100 Interdepartmental Charges 178,004250,908236,729325,400 Other Operating Expenses 9,354 22,958 21,910 9,894 Capital Outlay 0 - -Operating Expenses Subtotal 479,699409,348373,118428,518 TOTAL EXPENDITURES $1,808,997$1,760,326$1,440,649$1,562,272 Full Time Positions 7.85 7.85 5.90 6.00 Hourly/FTE Positions 1.00 1.50 1.60 1.60
GOALS
• Complete an update of the city’s procurement policy and administrative order
• Digitize the processing of bonds related to contracts
• Continue to update and streamline standard contract language and processes
• Continue to develop and operationalize formal consultant and contractor performance evaluation processes
• Engage in the planning, design and implementation of a citywide portfolio project management system, including CIP project management
• Engage in planning, design and implementation of an enterprise asset management system
• Continue implementing a strategy to digitize all Public Works records per the city’s records retention schedule
• Continue to focus on employee coaching, development and training for staff at all levels throughout the department
D-4
CONSTRUCTION MANAGEMENT & INSPECTION
ABOUT
Construction Management & Inspection ensures safe construction of CIP and private development projects in compliance with legal, regulatory and contractual requirements.
SERVICES
• Manage construction of CIP projects and public works contracts for all city asset-managing departments
• Inspect and oversee private development grading
• Inspect and oversee stormwater maintenance and improvements
• Oversee all construction activity in the public right of way
RECENT ACCOMPLISHMENTS
• Developed and implemented a comprehensive inspection tracking and data management system following treatment control best management practices that has received regional and national industry recognition
• Provided construction management and inspection services on significant CIP projects, including water valve replacements and pipelines, El Camino Real and College Boulevard intersection improvements, El Camino Real and Cannon Road bridge, Calavera Hills Community Park Gateway Improvements, Poinsettia Park dog park, and the
D-5 PUBLIC WORKS |
Account:
Fund: General
00185XX
Lighting
2020-21 Actual 2021-22 Actual 2022-23 Budget 2023-24 Budget Personnel Services Salaries & Wages 1,561,351 $ 1,567,875 $ 1,744,289 $ 1,636,110 $ Retirement Benefits 553,180 450,194 430,099 373,801 Health Insurance 215,154 203,152 266,138 233,899 Other Personnel Expenses 46,267 55,815 68,741 59,530 Personnel Services Subtotal 2,375,952 2,277,036 2,509,267 2,303,340 Operating Expenses Professional & Contract Services 21,836 212,748 321,130 242,209 Supplies & Materials 22,538 15,012 13,027 13,027 Repair & Maintenance 54 906 314 314 Interdepartmental Charges 303,752 387,526 404,770 684,756 Other Operating Expenses 4,413 16,027 14,260 14,260 Capital Outlay - - -Operating Expenses Subtotal 352,593 632,219 753,501 954,566 TOTAL EXPENDITURES 2,728,545 $ 2,909,255 $ 3,262,768 $ 3,257,906 $ Full Time Positions 15.20 15.20 16.20 15.00 Hourly/FTE Positions 1.00 0.50 0.50 0.50
Barrio
Project
• Provided construction inspection services for private development projects such as the Carlsbad Village Lofts and the Springhill Suites hotel
• Ensured safe work in the right of way for 5G communications infrastructure installation throughout the city
• Maintained stormwater compliance through training, education, outreach and enforcement actions resulting in zero construction-related notices of violation from the Regional Water Quality Control Board to date
• Developed and implemented a certified in-house Qualified Stormwater Pollution Prevention Plan Developer and Practitioner Program for eligible city staff to achieve cost savings and maintain compliance with state stormwater permit program
GOALS
• Partner with the City Attorney’s Office on development of a contractor performance evaluation process to improve accountability during the course of a public works project
• Leverage project management tools and processes to improve efficiency and effectiveness within the department
• Work with property owners to reduce pollution and improve water quality through the city’s Treatment Control Best Management Practices program
D-6
Performance Measure FY 2022 Actual FY 2023 Estimated FY 2024 Projected Response rate for Treatment Control Best Management Practices Verification of Maintenance 82% 80% 75% Construction stormwater violations on CIP projects 0 0 0
ENVIRONMENTAL SUSTAINABILITY: SUMMARY
ENVIRONMENTAL SUSTAINABILITY
• Climate Action Plan & Habitat Management
• Sustainable Materials Management
• Watershed Protection
ABOUT
The General Fund portion of the Environmental Sustainability Department budget includes the Climate Action Plan & Habitat Management Divisions and coordination of the municipal component of the National Pollutant Discharge Elimination System Municipal Stormwater Permit in the Watershed Protection Division. These divisions integrate components of the Environmental and Sustainability Guiding Principles and support the Strategic Plan Goal of Sustainability and the Natural Environment.
D-7 PUBLIC
WORKS |
2020-21 Actual 2021-22 Actual 2022-23 Budget 2023-24 Budget Personnel Services Salaries & Wages 1,087,903 $ 1,244,051 $ 1,657,905 $ 1,686,858 $ Retirement Benefits 372,361 346,714 400,937 382,291 Health Insurance 163,946 188,234 324,381 319,346 Other Personnel Expenses (28,258) (207,306) 68,964 64,677 Personnel Services Subtotal 1,595,952 1,571,693 2,452,187 2,453,172 Operating Expenses Professional & Contract Services 1,815,862 1,669,874 1,596,311 1,532,356 Supplies & Materials 55,053 77,212 70,161 52,570 Repair & Maintenance 18 305 80 50 Interdepartmental Charges 554,598 710,436 842,129 1,202,311 Other Operating Expenses 21,564 38,229 29,021 23,421 Capital Outlay - 10,265 135,000Operating Expenses Subtotal 2,447,095 2,506,321 2,672,702 2,810,708 TOTAL EXPENDITURES 4,043,047 $ 4,078,014 $ 5,124,889 $ 5,263,880 $ General Fund 1,030,453 1,238,207 1,159,789 1,178,783 Enterprise Fund 3,012,594 2,839,807 3,965,100 4,085,097 TOTAL FUNDING 4,043,047 $ 4,078,014 $ 5,124,889 $ 5,263,880 $ Full Time Positions 11.95 11.95 17.60 17.50 Hourly/FTE Positions 1.50 1.50 1.50 1.50
ENVIRONM ENTAL SUSTAINABILITY : CLIMATE ACTION PLAN & HABITAT MANAGEMENT
Account: 0015110 0015130
SERVICES
Fund: General
• Coordinate with multiple city departments to oversee the Climate Action Plan (CAP) implementation, collect CAP implementation monitoring data and prepare an annual report
• Coordinate preparation of a communitywide greenhouse gas emissions inventory and forecast
• Coordinate updates to the CAP document as directed by City Council
• Perform outreach and education related to CAP activities and respond to public inquiries
• Oversee and coordinate implementation of the Home Energy Score Assessment program and Carlsbad Green Business Program
• Participate in groups such as the SANDAG Sustainable Communities Working Group SANDAG San Diego Management and Monitoring Program and Inter-Agency Working Group, and ReCAP Stakeholder Working Group
• Monitor GHG emissions data from SANDAG and incorporate into the CAP
• Research and monitor upcoming regulations, funding opportunities and activities related to climate mitigation and adaptation
• Monitor regional climate change preparedness activities
D-8 PUBLIC
WORKS |
2020-21 Actual 2021-22 Actual 2022-23 Budget 2023-24 Budget Personnel Services Salaries & Wages 280,637 $ 303,978 $ 309,498 $ 345,990 $ Retirement Benefits 97,879 86,001 72,550 76,399 Health Insurance 33,130 34,082 36,087 37,068 Other Personnel Expenses 8,461 10,597 12,152 12,386 Personnel Services Subtotal 420,107 434,658 430,287 471,843 Operating Expenses Professional & Contract Services 529,967 594,695 299,750 284,362 Supplies & Materials 20,354 41,383 12,607 6,307 Repair & Maintenance 9 18 50 20 Interdepartmental Charges 59,536 86,988 97,342 148,637 Other Operating Expenses 480 4,344 6,668 5,668 Capital Outlay - - -Operating Expenses Subtotal 610,346 727,428 416,417 444,994 TOTAL EXPENDITURES 1,030,453 $ 1,162,086 $ 846,704 $ 916,837 $ Full Time Positions 2.65 2.65 2.55 2.70 Hourly/FTE Positions 0.50 0.50 0.50 0.50
• Provide leadership and citywide coordination to ensure compliance with Habitat Management Plan regulations for private and CIP projects
• Oversee preserve managers to ensure Habitat Management Plan-compliant biological management, monitoring and reporting across citywide preserve system
• Maintain collaborative relationships with the U.S. Fish and Wildlife Service, California Department of Fish and Wildlife and California Coastal Commission staff to ensure solutionsoriented Habitat Management Plan implementation
RECENT ACCOMPLISHMENTS
• Continued serving as a board member for the San Diego Regional Climate Collaborative
• Joined the Alliance for Regional Collaboratives for Climate Adaptation board as the San Diego representative
• Held series of public meetings for South Carlsbad Boulevard Project
• Completed 14 Home Energy Score Assessments and had 78 program sign-ups
• Completed citywide gnatcatcher surveys
• Provided coordination and oversight for Unmanaged Preserve Site Inspection Program and Village H Monitoring Program
• Served on the Technical Advis ory Group for the Connecting Wildlands and Communities Project and SANDAG Regional Habitat Conservation Taskforce
• Provided coordination for Ward’s weed eradication program
• Implemented an inspection program to identify potential threats to native species and habitats
GOALS
• Continue implementation and monitoring of adopted CAP and complete a comprehensive CAP update
• Continue implementation of the Carlsbad Green Business Program and increase number of certifications
• Meet annual goal for acres added to the Habitat Management Plan area
• Coordinate with local and regional stakeholders to monitor, manage and conduct outreach for shot hole borer and Ward’s weed, the highest priority threats to the preserve system
D-9
Performance Measure FY 2022 Actual FY 2023 Estimated FY 2024 Projected New Carlsbad Green Business Program certifications 5 9 8 Greenhouse gas emissions 930,000 MTCO2e 930,000 MTCO2e 930,000 MTCO2e Acreage goal added to Habitat Management Plan area 96% 96% 96%
ENVIRONMENTAL SUSTAINABILITY : SUSTAINABLE MATERIALS MANAGEMENT
Account: 0015120 520XXXX
ABOUT
Fund: General Enterprise
Consistent with the Carlsbad Municipal Code and General Plan, the Sustainable Materials Management division coordinates implementation of a citywide waste reduction and recycling program to maintain compliance with state regulations related to diversion and disposal of solid waste. The Sustainable Materials Management Division staff oversee the franchise agreement for waste hauling and recycling services, Palomar Transfer Station agreement for disposal services, various waste reduction and diversion outreach and education contracts, and proper disposal of household hazardous waste.
SERVICES
• Represent the city at meetings with CalRecycle, businesses, residents and other stakeholders
• Work with city staff to improve the city’s waste reduction, diversion and recycling program
• Prepare state and county grant applications with the City Council’s approval; appropriate funds, implement grant activities, track expenses and submit reports
D-10 PUBLIC WORKS |
2020-21 Actual 2021-22 Actual 2022-23 Budget 2023-24 Budget Personnel Services Salaries & Wages 259,845 $ 398,983 $ 825,400 $ 742,551 $ Retirement Benefits 92,946 93,562 202,509 170,478 Health Insurance 36,237 52,543 193,662 165,175 Other Personnel Expenses 7,920 13,658 35,238 29,470 Personnel Services Subtotal 396,948 558,746 1,256,809 1,107,674 Operating Expenses Professional & Contract Services 894,703 647,235 785,547 736,980 Supplies & Materials 29,339 29,359 39,213 35,163 Repair & Maintenance - - -Interdepartmental Charges 136,392 217,572 322,694 497,769 Other Operating Expenses 15,723 22,892 12,833 9,833 Capital Outlay - 10,265 135,000Operating Expenses Subtotal 1,076,157 927,323 1,295,287 1,279,745 TOTAL EXPENDITURES 1,473,105 $ 1,486,069 $ 2,552,096 $ 2,387,419 $ General Fund - 76,121 313,085 261,946 Enterprise Fund 1,473,105 1,409,948 2,239,011 2,125,473 TOTAL FUNDING 1,473,105 $ 1,486,069 $ 2,552,096 $ 2,387,419 $ Full Time Positions 2.80 2.80 9.65 8.65 Hourly/FTE Positions 0.50 0.50 0.50 0.50
• Coordinate outreach and education targeted at increasing recycling and other diversion programs for residents, businesses, municipal employees and the public
• Coordinate annual Earth Month and Earth Day events promoting recycling, proper disposal of household hazardous waste, composting and beach cleanup
• Conduct annual rate analysis to determine cost-effective practices
• Prepare and submit required annual recycling, composting and disposal reports to CalRecycle as required
• Participate in regional activities with SANDAG Solid Waste Technical Advisory Committee
• Engage businesses and residents to decrease waste and increase recycling
RECENT ACCOMPLISHMENTS
• Implemented new organics recycling program
• Hosted fix-it clinic events in partnership with Library Services
• Created new municipal sustainability program
• Designed new edible food recovery program and visited all Tier 1 organizations in the city
• Began new municipal composting program
• Provided outreach and inspected all businesses in the city
• Participated in food recovery and organics recycling conferences to learn about best practices for successful program implementation
• Used grant money to fund water stations installed throughout the city in support of the single-use plastics ban
• Purchased and installed all compost bins throughout the city
• Expanded Earth Month education and event
• Presented at the Waste Expo on edible food recovery efforts
• Reviewed special event applications for compliance with recycling and trash best practices
GO ALS
• Review, prioritize and implement improvements based on feedback from CalRecycle in the mandatory commercial recycling and construction and demolition recycling programs
• Monitor newly negotiated waste diversion and recycling programs at Palomar Transfer Station
• Increase waste diversion in the commercial sector by focusing outreach to targeted high trash-generating businesses with low diversion rates
• Work with partners to increase outreach to construction companies to improve diversion of construction and demolition material
• Continue tracking per capita disposal rate in pounds per person per day to verify accuracy
• Reduce number of businesses without recycling services to zero
D-11
Performance Measure FY 2022 Actual FY 2023 Estimated FY 2024 Projected Pounds per person sent to landfill 7.8 lbs. 7.9 lbs. 7.5 lbs. Organics diverted from the landfill 20,975 tons 24,120 tons 28,955 tons
ENVIRONMENTAL SUSTAINABILITY : WATERSHED PROTECTION
Account: 5215110
ABOUT
Fund: Enterprise
This budget includes leadership and stewardship of the city’s resources, specifically protecting our creeks, lagoons and ocean. The Environmental Sustainability Department’s Watershed Protection Division coordinates the citywide watershed protection program and helps the city maintain compliance with the National Pollutant Discharge Elimination System Municipal Stormwater Permit issued by the San Diego Regional Water Quality Control Board.
SERVICES
• Participate with neighboring cities in the Carlsbad Watershed as the Principal Co-permittee, serving as a liaison with the Regional Board, ensuring submittal of annual reports and participating in the San Diego County Co-permittees Regional Program Planning Committee
• Represent the city at meetings with the Environmental Protection Agency, Regional Board, San Diego County Co-permittees, Carlsbad Watershed, environmental nonprofit groups and other stakeholders
• Assess businesses to ensure proper best management practices and pollution prevention, prevent discharges into the Municipal Separate Storm Sewer System, or MS4, and protect receiving waters, which may require follow-up visits, targeted education or enforcement
• Conduct illicit discharge detection and elimination into the MS4, as required by the Municipal Stormwater Permit, including responding to and investigating potential illicit discharges in the city, performing field screening at major outfalls, and managing a public hotline
D-12 PUBLIC WORKS |
2020-21 Actual 2021-22 Actual 2022-23 Budget 2023-24 Budget Personnel Services Salaries & Wages 547,421 $ 541,090 $ 523,007 $ 598,317 $ Retirement Benefits 181,536 167,151 125,878 135,414 Health Insurance 94,579 101,609 94,632 117,103 Other Personnel Expenses (44,639) (231,561) 21,574 22,821 Personnel Services Subtotal 778,897 578,289 765,091 873,655 Operating Expenses Professional & Contract Services 391,192 427,944 511,014 511,014 Supplies & Materials 5,360 6,470 18,341 11,100 Repair & Maintenance 9 287 30 30 Interdepartmental Charges 358,670 405,876 422,093 555,905 Other Operating Expenses 5,361 10,993 9,520 7,920 Capital Outlay - - -Operating Expenses Subtotal 760,592 851,570 960,998 1,085,969 TOTAL EXPENDITURES 1,539,489 $ 1,429,859 $ 1,726,089 $ 1,959,624 $ Full Time Positions 6.50 6.50 5.40 6.15 Hourly/FTE Positions 0.50 0.50 0.50 0.50
• Compile the annual Jurisdictional Runoff Management Program report and prepare new program documents at the beginning of each Municipal Stormwater Permit cycle
• Act as the lead division for planning and implementation of the statewide Trash Amendments and incorporate them into the next Municipal Stormwater Permit
RECENT ACCOMPLISHMENTS
• Managed the contract for a watershed coordinator to assist the watershed agencies with updating and implementing the Water Quality Improvement Plan and report to optimize the watershed’s compliance with the Municipal Stormwater Permit
• Submitted the Carlsbad Watershed Management Area Water Quality Improvement Plan and the Jurisdictional Runoff Management Program Annual Reports to the Regional Board
• Worked inter-departmentally to coordinate on National Pollutant Discharge Elimination System MS4 Trash Amendments implementation
• Participated in Creek to Bay Cleanup, Coastal Cleanup Day and other outreach and education activities within the city and regionally
• Implemented new trash encampment clean-up app
• Completed Agua Hedionda Lagoon Special Study as required by the Regional Board
GOALS
• Implement a monitoring program to evaluate MS4 discharges, including receiving water monitoring, MS4 outfall discharge monitoring, sediment quality monitoring and various special studies
• Implement a public outreach program to promote behavior changes that reduce the discharge of pollutants into the MS4 and protect water quality in our receiving waters
• Implement all required strategies and numeric goals of the Water Quality Improvement Plan
• Incorporate innovative methods to implement the city’s Jurisdictional Runoff Management Program in conjunction with the Carlsbad Watershed Water Quality Improvement Plan and submit required reports to the Regional Board
• Plan for implementation of the revised Municipal Stormwater Permit which will include new requirements to control trash
• Conduct all annual inspections of existing development and water quality monitoring required by the Municipal Stormwater Permit
• Respond to at least 90% of illicit discharge emergencies within 45 minutes
• Detect and eliminate 100% of illicit discharges
D-13
Performance Measure FY 2022 Actual FY 2023 Estimated FY 2024 Projected Emergency response times under 45 minutes for illicit discharges 97% 90% 90% Illicit discharges detected and eliminated 100% 100% 100%
FLEET & FACILITIES: SUMMARY F
D-14
PUBLIC WORKS |
• Facilities • Fleet Maintenance & Replacement 2020-21 Actual 2021-22 Actual 2022-23 Budget 2023-24 Budget Personnel Services Salaries & Wages 2,496,346 $ 2,595,221 $ 2,954,275 $ 3,296,372 $ Retirement Benefits 800,794 750,997 644,987 682,059 Health Insurance 447,104 491,384 595,308 621,793 Other Personnel Expenses 24,440 (84,024) 127,194 132,211 Personnel Services Subtotal 3,768,684 3,753,578 4,321,764 4,732,435 Operating Expenses Professional & Contract Services 980,637 1,035,773 887,571 887,371 Supplies & Materials 1,984,228 2,384,764 2,168,528 2,091,292 Repair & Maintenance 988,227 1,396,652 1,510,660 1,453,060 Interdepartmental Charges 545,549 800,736 790,453 1,455,622 Other Operating Expenses 354,678 611,319 645,900 629,674 Capital Outlay 1,737,056 3,642,867 5,296,745 1,068,564 Operating Expenses Subtotal 6,590,375 9,872,111 11,299,857 7,585,583 TOTAL EXPENDITURES 10,359,059 $ 13,625,689 $ 15,621,621 $ 12,318,018 $ General Fund 5,341,736 $ 6,297,998 $ 6,768,736 $ 7,497,115 $ Internal Service Fund 5,581,454 $ 6,018,691 $ 8,799,885 $ 4,764,903 $ Special Revenue Fund 48,244 $ 49,674 $ 53,000 $ 56,000 $ TOTAL FUNDING 10,971,434 $ 12,366,363 $ 15,621,621 $ 12,318,018 $ Full Time Positions 31.90 35.10 34.95 35.95 Hourly/FTE Positions 9.50 7.75 6.90 8.40
LEET & F ACILITIES
FLEET & FACILITIES: FACILITIES
ABOUT
The Facilities Division provides safe and comfortable working spaces at city facilities and maintains quality indoor public spaces. Additionally, this division oversees the design and construction work for new city facilities and building renovation projects and operates the Safety Training Center.
SERVICES
• Maintain city-owned facilities including building exteriors, interiors, cleaning and custodial services, as well as set-up of offices and meeting rooms
• Provide building construction, improvements, renovations, repairs and relocations
• Operate and lease the Safety Training Center for public safety personnel training
D-15
PUBLIC WORKS |
Account: 0015310 0015320 3155110 Fund: General Special Revenue-Parking in Lieu
2020-21 Actual 2021-22 Actual 2022-23 Budget 2023-24 Budget Personnel Services Salaries & Wages 1,707,594 $ 1,823,085 $ 2,108,360 $ 2,383,940 $ Retirement Benefits 534,701 517,714 444,822 483,233 Health Insurance 294,081 325,513 406,963 438,791 Other Personnel Expenses 55,957 76,401 90,811 96,564 Personnel Services Subtotal 2,592,333 2,742,713 3,050,956 3,402,528 Operating Expenses Professional & Contract Services 928,046 1,005,343 848,228 848,028 Supplies & Materials 486,622 658,866 629,735 585,319 Repair & Maintenance 647,211 964,153 1,100,566 1,067,966 Interdepartmental Charges 383,863 599,364 561,904 1,038,153 Other Operating Expenses 324,331 375,914 627,347 611,121 Capital Outlay 27,574 1,319 3,000Operating Expenses Subtotal 2,797,647 3,604,959 3,770,780 4,150,587 TOTAL EXPENDITURES 5,389,980 $ 6,347,672 $ 6,821,736 $ 7,553,115 $ General Fund 5,341,736 $ 6,297,998 $ 6,768,736 $ 7,497,115 $ Special Revenue Fund 48,244 49,674 53,000 56,000 Total Funding 5,389,980 $ 6,347,672 $ 6,821,736 $ 7,553,115 $ Full Time Positions 21.65 24.85 24.85 25.85 Hourly/FTE Positions 8.50 6.75 5.90 7.40
RECENT ACCOMPLISHMENTS
• Completed the Fire Station 6 dorm conversion project
• Replaced lighting fixtures to energy efficient LED fixtures at the Mira Costa Las Palmas Facility, State Street parking lots, City of Carlsbad Faraday Center and the Carlsbad Recycled Water Facility
• Completed 1,539 work orders as of April 2022, including reconfiguration of Faraday Center to accommodate changing space needs
• Began construction of the Police and Fire Headquarters renovation project
• Obtained a conditional use permit for Temporary Fire Station 7
• Awarded revised citywide contracted custodial services contracts that leverage technology to ensure contractor performance
• Provided facilities and support for 152 Fire Department training days and 104 Police Department training days
• Supported 183 training days for 17 outside law enforcement agency leases
• Retrofitted 86 fluorescent can light fixtures to energy efficient LED fixtures and added 68 new LED light fixtures to both indoor shooting ranges, increasing lighting on the range for safety
• Recycled 3,218 pounds of brass shell casings, 5,315 pounds of lead and copper from indoor shooting range activities, and 4,967 pounds of scrap metal
GOALS
• Continue the city facility and parking lot light pole and fixture replacement project
• Perform a facilities conditions assessment throughout the city and continue development of a Facility Asset Management System
• Obtain a conditional use permit for planned new Public Works headquarters
• Complete the Fire Station 2 replacement and Carlsbad City Library fire alarm system replacement
• Begin construction on the Calavera Hills Community Park roof replacement project
• Complete plans and specifications for the Senior Center roof replacement project
• Increase the city’s investment in custodial and building maintenance to meet industry standards for high quality facilities
• Initiate various refurbishment and repair projects at the Safety Training Center
D-16
Performance Measure FY 2022 Actual FY 2023 Estimated FY 2024 Projected Custodial cost ($/square foot) $4.67 $4.12 $4.59 Building maintenance ($/square foot) $4.58 $4.51 $4.72
FLEET & FACILITIES: FLEET MAINTENANCE & REPLACEMENT
ABOUT
The city’s fleet consists of 456 vehicles and equipment necessary to complete the city’s mission of delivering quality and efficient services. The fleet maintenance & replacement programs enable departments to achieve their operational mission in a safe, efficient manner.
The fleet maintenance program funds labor, parts, services, fuel and oil necessary to maintain the city’s fleet of vehicles and equipment. The fleet maintenance program is funded through charges to departments based on vehicle type and utilization.
The fleet vehicle replacement program is funded through a replacement charge to departments for each vehicle or equipment in service, determined by actual costs of vehicle procurement divided by the expected life of the vehicle. This program funds asset replacement and vehicle outfitting. Costeffective vehicle procurement is achieved through cooperative purchasing agreements and bidding processes. Revenue is collected from the sale of retired city fleet assets at auction.
D-17 PUBLIC WORKS |
Account: 6205460 6215461 Fund: Vehicle Maintenance Fund Vehicle Replacement Fund
2020-21 Actual 2021-22 Actual 2022-23 Budget 2023-24 Budget Personnel Services Salaries & Wages 788,752 $ 772,136 $ 845,915 $ 912,432 $ Retirement Benefits 266,093 233,283 200,165 198,826 Health Insurance 153,023 165,871 188,345 183,002 Other Personnel Expenses (31,517) (160,425) 36,383 35,647 Personnel Services Subtotal 1,176,351 1,010,865 1,270,808 1,329,907 Operating Expenses Professional & Contract Services 52,591 30,430 39,343 39,343 Supplies & Materials 1,497,606 1,725,898 1,538,793 1,505,973 Repair & Maintenance 341,016 432,499 410,094 385,094 Interdepartmental Charges 161,686 201,372 228,549 417,469 Other Operating Expenses 30,347 235,405 18,553 18,553 Capital Outlay 1,709,482 3,641,548 5,293,745 1,068,564 Operating Expenses Subtotal 3,792,728 6,267,152 7,529,077 3,434,996 TOTAL EXPENDITURES 4,969,079 $ 7,278,017 $ 8,799,885 $ 4,764,903 $ Full Time Positions 10.25 10.25 10.10 10.10 Hourly/FTE Positions 1.00 1.00 1.00 1.00
S ERVICES
• Provide safe and appropriately maintained vehicles for use by city staff, inspect vehicles per requirements of the biennial inspection of terminals and smog programs, and maintain 24/7 road call services for emergency vehicles
• Provide reliable, cost-effective fuel management by maintaining sufficient fuel supplies for emergencies and monitoring fuel tanks in accordance with state and county regulations
• Maintain records related to fleet asset inventory and work order history through management of the AssetWorks fleet maintenance database
• Evaluate the city fleet on an annual basis to identify units eligible for replacement and calculate estimated acquisition costs
• Manage the Fleet Replacement Committee, made up of city staff from various departments, to make recommendations for unit replacement, retention or disposal
• Advise on specifications for purchase of replacement units that satisfy department performance requirements while optimizing return on investment in alignment with the CAP
• Purchase replacement units through the public bidding process or through cooperative purchasing programs
RECENT ACCOMPLISHMENTS
• Achieved recognition from Government Fleet magazine and the American Public Works Association as one of the Top 50 Leading Fleets in the nation
• Executed an agreement with SDG&E to leverage the Power Your Drive for Fleets MakeReady Infrastructure Program, which is anticipated to install up to 26 level 3 DC fast chargers at the fleet maintenance facility over the next five years
• Activated 42 new vehicles and equipment, including five hybrid compact light duty trucks
GOALS
• Annually assess vehicles for conversion to alternative fuel options in support of the CAP goal to increase the proportion of fleet low and zero-emissions vehicle miles traveled to 25% of all city-related vehicle miles traveled by 2035
• Implement a pilot GPS/vehicle telematics system in the city’s fleet of police vehicles
• Assess and improve fleet database and data management systems and techniques
D-18
Performance Measure FY 2022 Actual FY 2023 Estimated FY 2024 Projected Fleet vehicles ready for active service 98.5% 98.5% 99% Vehicle miles traveled by low/zero emission vehicles 27% 34% 30%
: SUMMARY
D-19
TRANSPORTATION • Storm Drain Maintenance & Engineering • Traffic, Mobility, Transportation Engineering & Streets Maintenance • Lighting & Landscaping Districts 2020-21 Actual 2021-22 Actual 2022-23 Budget 2023-24 Budget Personnel Services Salaries & Wages 3,507,800 $ 3,606,940 $ 4,066,074 $ 4,337,789 $ Retirement Benefits 1,283,466 1,136,512 1,037,649 993,367 Health Insurance 582,340 594,508 671,050 665,807 Other Personnel Expenses 111,136 141,036 170,886 162,686 Personnel Services Subtotal 5,484,742 5,478,996 5,945,659 6,159,649 Operating Expenses Professional & Contract Services 1,052,886 1,257,360 1,970,070 1,417,716 Supplies & Materials 315,273 376,946 488,520 438,816 Repair & Maintenance 1,545,047 1,225,291 1,573,574 1,463,290 Interdepartmental Charges 1,656,409 1,982,950 2,426,231 2,983,971 Other Operating Expenses 597,981 749,114 738,515 717,132 Capital Outlay 37,838 143,200 - 80,000 Operating Expenses Subtotal 5,205,434 5,734,861 7,196,910 7,100,925 TOTAL EXPENDITURES 10,690,176 $ 11,213,857 $ 13,142,569 $ 13,260,574 $ General Fund 7,553,800 8,048,352 9,707,559 9,732,215 Enterprise Fund 1,990,755 1,904,811 1,836,302 1,865,537 Special Revenue Fund 1,145,621 1,260,694 1,598,708 1,662,822 TOTAL FUNDING 10,690,176 $ 11,213,857 $ 13,142,569 $ 13,260,574 $ Full Time Positions 43.90 43.70 43.60 43.80 Hourly/FTE Positions 1.50 1.94 1.50 1.50
PUBLIC WORKS | TRANSPORTATION
TRANSPORTATION: STORM DRAIN MAINTENANCE & ENGINEERING
Account: 0016310 5216310
ABOUT
Fund: General Enterprise-Storm Drain Maintenance
The Transportation Storm Drain Maintenance & Engineering divisions are responsible for maintaining and improving the city’s storm drain infrastructure.
SERVICES
• Address various drainage infrastructure and stormwater maintenance issues citywide
• Develop plans, specifications and estimates, and provide project or design management of projects involving storm drain assets
• Optimize maintenance efforts by monitoring and addressing new and ongoing drainage issues
• Perform inspection and maintenance of the storm drain system
RECENT ACCOMPLISHMENTS
• Inspected 100% of high -priority storm drain inlets, removing an estimated 16.5 tons of sediment and debris
• Completed the Agua Hedionda Creek vegetation removal between the bridges of Cannon Road and El Camino Real
D-20 PUBLIC WORKS |
2020-21 Actual 2021-22 Actual 2022-23 Budget 2023-24 Budget Personnel Services Salaries & Wages $678,142$579,104$632,248$710,238 Retirement Benefits 242,324177,552150,992159,108 Health Insurance 143,182 98,148105,010117,861 Other Personnel Expenses 21,449 23,206 26,398 26,998 Personnel Services Subtotal 1,085,097878,010914,6481,014,205 Operating Expenses Professional & Contract Services 313,103335,548460,165192,507 Supplies & Materials 24,207 26,876 50,321 24,600 Repair & Maintenance 556,986596,171495,293600,900 Interdepartmental Charges 243,104371,657322,228446,694 Other Operating Expenses 114,006 97,729 91,424 85,200 Capital Outlay 5,688 0 0 0 Operating Expenses Subtotal 1,257,0941,427,9811,419,4311,349,901 TOTAL EXPENDITURES $2,342,191$2,305,991$2,334,079$2,364,106 General Fund 351,436 401,180 497,777 498,569 Enterprise Fund 1,990,755 1,904,811 1,836,302 1,865,537 TOTAL FUNDING 2,342,191 $ 2,305,991 $ 2,334,079 $ 2,364,106 $ Full Time Positions 8.60 7.10 7.00 7.35 Hourly/FTE Positions 0.50 0.98 0.50 0.50
• Completed approximately 1,800 lane miles of street sweeping bimonthly on all residential, prime and major streets, removing 1,153.5 tons of debris that otherwise would end up in the city’s storm drain system
• Inspected 34,000 linear feet of storm drain pipeline
• Completed 1,534 maintenance work orders and 39 emergency responses
• Completed construction of the Phase I - Magnolia Avenue Storm Drain Improvements
• Solicited bids and appropriated funding for Trieste Slope Repair project
• Completed geotechnical investigations for the Drainage Master Plan El Camino Real Channel Restoration Project
• Completed vegetation maintenance of the Lake Calavera Dam
GOALS
• Complete update of the city’s Drainage Master Plan
• Clean 100% of the Agua Hedionda Lagoon channels
• Complete Trieste Slope Repair project
D-21
Performance Measure FY 2022 Actual FY 2023 Estimated FY 2024 Projected Linear feet of streets swept to mitigate debris 1,800 (100%) 1,800 (100%) 1,800 (100%) Tons of debris removed from city streets from street sweeping 1069.9 tons 1,153.5 tons 1,200.6 tons % of Agua Hedionda Lagoon channels cleaned 100% 100% 100%
TRANSPORTATION: TRAFFIC , MOBILITY , TRANSPORTATION ENGINEERING & STREETS MAINTENANCE
ABOUT
Traffic, Mobility, Transportation Engineering and Streets Maintenance divisions maintain and improve the road infrastructure and keep people moving. They are responsible for enhancing mobility and safety citywide through ongoing transportation planning, streets and traffic engineering, streets maintenance, and signal operations activities
SERVICES
• Conduct traffic and mobility planning, oversee engineering and signals operations, and serve as liaison with the Traffic and Mobility Commission
• Perform roadside maintenance including street signs, street legends, striping, graffiti and trash removal, pothole and sidewalk repairs
• Develop plans, specifications and estimates, and provide project and design management of projects involving street assets
D-22 PUBLIC WORKS |
Account: 0018410
00187XX Fund: General
00186XX
2020-21 Actual 2021-22 Actual 2022-23 Budget 2023-24 Budget Personnel Services Salaries & Wages $2,691,623$2,878,496$3,275,276$3,462,840 Retirement Benefits 990,832914,632846,719795,441 Health Insurance 421,434479,115548,203530,582 Other Personnel Expenses 84,948111,847137,663129,190 Personnel Services Subtotal 4,188,8374,384,0904,807,8614,918,053 Operating Expenses Professional & Contract Services 643,718828,6561,296,7841,011,158 Supplies & Materials 263,515328,483362,080338,097 Repair & Maintenance 821,915467,117805,309589,418 Interdepartmental Charges 1,078,6811,295,6171,691,4412,065,772 Other Operating Expenses 178,242200,009246,307231,148 Capital Outlay 27,456143,200 0 80,000 Operating Expenses Subtotal 3,013,5273,263,0824,401,9214,315,593 TOTAL EXPENDITURES $7,202,364$7,647,172$9,209,782$9,233,646 Full Time Positions 33.15 34.65 34.65 34.50 Hourly/FTE Positions 1.00 0.97 1.00 1.00
RECENT ACCOMPLISHMENTS
• As part of the Declaration of Emergency, implemented leading pedestrian intervals and countdown pedestrian signal heads at 32 locations, procured and deployed 12 safety message boards, installed green bike lane enhancements in 55 high-conflict zones, procured and deployed 17 speed feedback signs for speeding data collection, refreshed all bicycle and double lane striping in all 24 school zones within the city, and accelerated existing projects related to roadway safety
• Procured and installed 3 permanent bicycle counters to study the city’s bicycle activity
• Replaced approximately 30,000 square feet of sidewalk and asphalt from work orders
• Completed the Growth Management Plan Monitoring Report and updated the Transportation Impact Analysis guidelines and multimodal level of service methodology
• Completed the El Camino Real and College Boulevard Intersection Improvements project, including the installation of a 120-foot steel pedestrian bridge
• Installed and energized 14 streetlights for the Barrio Lighting Phase 1 project
• Completed 470,811 linear feet of striping
• Completed Safe Routes to School Program at Hope Elementary School
GOALS
• Finalize the revision of the Carlsbad Residential Traffic Management Program
• Continue implementation and development of the Coordinated Traffic Signal Program
• Complete Safe Routes to School Programs at Sage Creek High School, Jefferson Elementary School, Aviara Oaks Elementary and Aviara Oaks Middle Schools
• Complete East-West Corridor Emergency Resurfacing and Restriping Project
• Complete Carlsbad Boulevard Pedestrian Improvements Project
• Complete 2021 Sidewalk Construction project
• Complete Parking Lot ADA Compliance Project
• Complete Avenida Encinas Rail trail and Pedestrian Improvements project
• Initiate utility undergrounding for Valley and Magnolia project
• Initiate utility undergrounding for Terramar Area Coastal Improvements
• Complete Phase 2 of the citywide streetlight LED fixture replacement program along collector and industrial streets
1 Metric includes submitted requests from previous fiscal year which were completed in the current fiscal year
2 Residential calming neighborhood meetings resumed in fiscal year 2023; no meetings were held in previous fiscal year due to COVID-19 restrictions
D-23
Performance Measure FY 2022 Actual FY 2023 Estimated FY 2024 Projected Address submitted residential traffic-related requests (# submitted/# completed) 1 81% (174/141) 97% (138/143) 90% Residential traffic calming neighborhood meetings completed based on request N/A 2 100% (11/11) 100%
TRANSPORTATION: BUENA VISTA CHANNEL, LIGHTING & LANDSCAPING DISTRICTS
ABOUT
The Transportation Engineering Division provides oversight of the Buena Vista Creek Channel Maintenance Assessment District, which is the maintenance assessment district that funds the costs of streetlights, street trees and medians within the district boundaries covering newer developments in the city. The Transportation Department also provides maintenance of decorative lighting and oversight of Lighting & Landscaping District 2.
SERVICES
• Ensure adequate funds are collected to administer and maintain the Buena Vista Creek Channel from Jefferson Street east to the South Vista Way bridge
• Maintain and repair streetlamps and decorative lighting
D-24 P UBLIC WORKS |
Account: 162 163 164 Fund: Special Revenue- Street Light Maintenance Special Revenue-Buena Vista Channel Special Revenue-LLD 2
2020-21 Actual 2021-22 Actual 2022-23 Budget 2023-24 Budget Personnel Services Salaries & Wages $138,035$149,340$158,550$164,711 Retirement Benefits 50,310 44,328 39,938 38,818 Health Insurance 17,724 17,245 17,837 17,364 Other Personnel Expenses 4,739 5,983 6,825 6,498 Personnel Services Subtotal 210,808216,896223,150227,391 Operating Expenses Professional & Contract Services 96,065 93,156213,121214,051 Supplies & Materials 27,551 21,587 76,119 76,119 Repair & Maintenance 166,146162,003272,972272,972 Interdepartmental Charges 334,624315,676412,562471,505 Other Operating Expenses 305,733451,376400,784400,784 Capital Outlay 4,694 0 0 0 Operating Expenses Subtotal 934,8131,043,7981,375,5581,435,431 TOTAL EXPENDITURES $1,145,621$1,260,694$1,598,708$1,662,822 Full Time Positions 2.15 1.95 1.95 1.95 Hourly/FTE Positions 0.00 0.00 0.00 0.00
RECENT ACCOMPLISHMENTS
• Completed 327 streetlight and electrical service requests
• Completed installation of 71 LED fixtures on streetlights
• Completed authorization to bid Phase 2 of the citywide light replacement program
• Completed annual vegetation clearing and trash removal from the Buena Vista Creek Channel Maintenance District and submitted to California Department of Fish and Wildlife
• Cleared vegetation from three drainage outfalls entering the Buena Vista channel from the City of Oceanside
• Developed a Program Environmental Impact Report for the Buena Vista Creek Concrete Channel Maintenance Project
GOALS
• Identify and optimize continuing needs for environmental permitting and monitoring
• Monitor and continue program to clear vegetation entering the Buena Vista channel from the City of Oceanside
• Clear 100% of the Buena Vista Creek Channel Maintenance District
• Track and monitor areas for plant and trash removal for flood capacity purposes
• Track and monitor service times to ensure timely service for service requests
• Complete Phase 2 of Citywide Streetlight Replacement Program
D-25
Performance Measure FY 2022 Actual FY 2023 Estimated FY 2024 Projected Citywide Streetlight Replacement Program Phase 2 planning complete Audit and bid of Phase 2 complete Phase 2 program completed % of Buena Vista Channel cleaned and reported for permitting 100% 100% 100%
UTILITIES
• Potable Water Operations
• Recycled Water Operations
•
PUBLIC WORKS |
UTILITIES: SUMMARY
D-26
2020-21 Actual 2021-22 Actual 2022-23 Budget 2023-24 Budget Personnel Services Salaries & Wages 5,025,225 $ 5,538,360 $ 6,423,971 $ 6,883,606 $ Retirement Benefits 1,786,928 1,651,672 1,517,057 1,494,179 Health Insurance 910,027 944,651 982,043 1,210,607 Other Personnel Expenses 753,440 (1,281,540) 303,472 327,775 Personnel Services Subtotal 8,475,620 6,853,143 9,226,543 9,916,167 Operating Expenses Professional & Contract Services 13,077,777 12,700,325 16,567,837 18,382,403 Supplies & Materials 28,380,456 28,976,575 31,665,871 34,826,472 Repair & Maintenance 437,870 437,116 579,693 433,521 Interdepartmental Charges 4,808,776 5,153,827 5,618,106 6,862,721 Other Operating Expenses 12,648,726 11,151,597 14,227,621 19,248,629 Capital Outlay 512,467 77,638 36,250 7,150 Operating Expenses Subtotal 59,866,072 58,497,078 68,695,378 79,760,896 TOTAL EXPENDITURES 68,341,692 $ 65,350,221 $ 77,921,921 $ 89,677,063 $ Full Time Positions 61.95 63.95 64.50 63.50 Hourly/FTE Positions 0.50 0.50 0.50 0.50
Wastewater Operations
ABOUT
UTILITIES: POTABLE WATER OPERATIONS
Account: 5016310
Fund: Enterprise
To ensure safe, high-quality drinking water is available to Carlsbad Municipal Water District customers on-demand, the CMWD provides ongoing operation and maintenance of the following: nine storage reservoirs or tanks, 457 miles of pipeline, 17 pressure zones, 71 pressure regulating stations, three pumping stations, 14,327 valves, 4,481 fire hydrants and 30,446 potable meters. CMWD purchases potable water from its wholesale water provider, San Diego County Water Authority, which includes desalinated water from the Carlsbad Desalination Plant.
SERVICES
• Operate and maintain reservoirs, pressure regulating stations, pump stations, transmission and distribution pipelines, valves, meters and other appurtenances
• Deliver reliable, safe drinking water and fire flow demand
• Comply with all water-related health, safety and environmental regulations including state and federal drinking water standards for water quality sampling and reporting
• Implement effective water conservation and rebate programs, including public education, leak detection studies, leak repair and compliance with conservation laws
• Work with other water agencies and the San Diego County Water Authority on regional water-related projects and budgets
D-27 PUBLIC WORKS
|
2020-21 Actual 2021-22 Actual 2022-23 Budget 2023-24 Budget Personnel Services Salaries & Wages 2,456,258 $ 2,775,502 $ 3,020,543 $ 3,297,868 $ Retirement Benefits 853,829 777,841 707,921 722,595 Health Insurance 532,524 539,133 456,572 603,202 Other Personnel Expenses 932,144 (934,811) 142,351 159,114 Personnel Services Subtotal 4,774,755 3,157,665 4,327,387 4,782,779 Operating Expenses Professional & Contract Services 7,339,768 7,250,138 8,568,654 9,205,538 Supplies & Materials 25,652,887 26,320,138 28,010,084 31,440,899 Repair & Maintenance 299,762 384,355 361,250 290,050 Interdepartmental Charges 2,722,945 2,964,704 3,161,356 3,765,584 Other Operating Expenses 6,479,626 4,222,292 5,267,601 5,271,353 Capital Outlay 415,639 16,957 19,500 3,600 Operating Expenses Subtotal 42,910,627 41,158,584 45,388,445 49,977,024 TOTAL EXPENDITURES 47,685,382 $ 44,316,249 $ 49,715,832 $ 54,759,803 $ Full Time Positions 29.50 30.55 30.95 31.05 Hourly/FTE Positions 0.45 0.20 0.00 0.00
RECENT ACCOMPLISHMENTS
• Developed and established a Utilities Reserve policy for fund stability
• Established new hydraulic modeling fees
• Performed regulation -required Lead and Copper sampling
• Completed construction on the Carrillo Way water main rehabilitation
• Built and calibrated the water distribution system hydraulic model now used to assess system capacity needs
• Completed inspection and cleaning of 10 potable reservoirs
GOALS
• Minimize costs while continuing to provide high levels of service at acceptable risk
• Optimize asset management by increasing the use of technology to improve and manage the infrastructure system more efficiently and effectively
• Work with the State Department of Water Resources and the State Water Resources Control Board on implementation of regulations for Water Use Efficiency Standards
• Create an inventory of lead service lines to comply with the new EPA Lead and Copper regulations
• Complete US Environmental Protection Agency-required sampling under the fifth Unregulated Contaminant Monitoring Rule that requires monitoring polyfluoroalkyl substances
• Update the Potable Water Master Plan
• Stay within the industry benchmark for water main breaks of 3.4 to 19.4 breaks per 100 miles of pipeline, per the American Water Works Association
• Initiate construction of the Palomar Airport waterline replacement project, water main replacements in the downtown and coastal areas, construction of one new pressure regulating station and replacement of two existing pressure regulating stations
• Update the cost of services study and present updated rates to the Carlsbad Municipal Water District Board of Directors for approval
SIGNIFICANT CHANGES IN THIS YEAR’S BUDGET
• Permanent reduction of 1.0 FTE by not filling vacant positions and reorganizing duties
• Reduction of 2 vehicles from the Utilities Department fleet
D-28
Performance Measure FY 2022 Actual FY 2023 Estimated FY 2024 Projected Pipeline breaks per 100 miles of pipe 0 <3.4 <3.4 Meeting State Water Resources Control Board water use efficiency standards Yes Yes Yes
ABOUT
UTILITIES: RECYCLED WATER OPERATIONS
Account: 5026310
Fund: Enterprise
The Carlsbad Municipal Water District owns the Carlsbad Water Recycling Facility located next to the Encina Wastewater Authority treatment plant. CMWD takes treated wastewater from that plant and further treats it to the State of California Title 22 recycled water quality standards and then delivers this water to customers for irrigation and certain industrial uses. This effort reduces the amount of wastewater that would normally be released by the wastewater treatment plant into the ocean outfall, reduces dependence on imported drinking water, and provides customers with a reliable local supply of water for non-potable purposes. Recycled water is not subject to state water conservation requirements.
Delivery of this water includes the operation and maintenance of the recycled water system’s three storage tanks, four pump stations, three pressure-reducing stations, six pressure zones, 97 miles of pipelines, 1,050 valves and 1,011 meters. CMWD’s Cross-Connection Control and Backflow program ensures a safe supply of drinking water by preventing cross-contamination from the recycled system into the potable system in accordance with federal and state regulations. CMWD also purchases and delivers recycled water from the Vallecitos Water District’s Meadowlark Water Reclamation Facility.
D-29 PUBLIC WORKS |
2020-21 Actual 2021-22 Actual 2022-23 Budget 2023-24 Budget Personnel Services Salaries & Wages 1,033,183 $ 1,040,554 $ 1,354,365 $ 1,310,203 $ Retirement Benefits 375,927 350,713 310,948 266,704 Health Insurance 141,496 143,591 189,818 176,778 Other Personnel Expenses 4,712 41,288 63,152 57,615 Personnel Services Subtotal 1,555,318 1,576,146 1,918,283 1,811,300 Operating Expenses Professional & Contract Services 1,339,480 1,425,672 2,008,860 2,373,450 Supplies & Materials 2,397,182 2,361,161 3,034,650 3,023,586 Repair & Maintenance 61,170 19,524 66,743 22,743 Interdepartmental Charges 690,574 818,951 936,905 1,168,003 Other Operating Expenses 1,491,538 1,922,717 3,234,080 3,448,290 Capital Outlay 67,841 - 7,000 1,750 Operating Expenses Subtotal 6,047,785 6,548,025 9,288,238 10,037,822 TOTAL EXPENDITURES 7,603,103 $ 8,124,171 $ 11,206,521 $ 11,849,122 $ Full Time Positions 13.00 13.30 12.75 10.85 Hourly/FTE Positions 0.05 0.10 0.50 0.50
SERVICES
• Deliver recycled water for irrigation and some industrial uses through the recycled water system
• Operate and maintain infrastructure, including the Carlsbad Water Recycling Facility, reservoirs, pressure regulating stations, pump stations, pipelines, valves and meters
• Treat wastewater to meet State of California Title 22 recycled water requirements
• Perform inspections on systems and backflows to prevent cross connections and protect the potable water system
• Convert irrigation sites from potable water to recycled water as service becomes available
RECENT ACCOMPLISHMENTS
• Awarded $3 million in recycled water grants
• Completed the design of Phase 3 Recycled Water Reservoir (D-4) Tank
• Performed annual backflow tests at 285 sites and inspections at 625 recycled use sites
• Developed a Utilities Reserve policy
GOALS
• Complete construction of a 1.5-million-gallon recycled water storage tank
• Complete Segment 5 conversions from potable to recycled water and connect customers to the expanded system
• Stay within the industry benchmark for water main breaks of 3.4 to 19.4 breaks per 100 miles of pipeline, per the American Water Works Association
• Maintain recycled water cost at or below 75% of potable water irrigation cost
• Perform tank inspections and cleaning for three recycled reservoirs
• Update the cost of services study and present updated rates to the CMWD Board
D-30
Performance Measure FY 2022 Actual FY 2023 Estimated FY 2024 Projected Pipeline breaks per 100 miles of pipe 0 <3.4 <3.4 Cost of recycled water as a percent of potable water cost 71% 73% 75%
ABOUT
UTILITIES: WASTEWATER OPERATIONS
Account: 5116310
Fund: Enterprise
The Utilities Department is responsible for providing wastewater services to approximately 85,000 customers within the city’s service area. The Utilities wastewater mission is to prevent sewer spills and convey waste efficiently to the Encina Wastewater Authority’s treatment plant by properly managing, operating and maintaining all parts of the city’s sewer system. A portion of Carlsbad’s treated wastewater is diverted from the ocean outfall and sent to the Carlsbad Water Recycling Facility for further treatment. The Wastewater Division maintains a sanitary sewage collection system that includes 11 wastewater lift stations and wet wells and about 273 miles of gravity mainlines, six miles of pressurized mains, and 6,168 access holes. The department implements a robust wastewater asset management program to minimize the total cost of owning and operating utility assets while continuing to deliver high levels of service at acceptable levels of risk.
SERVICES
• Operate and maintain infrastructure such as lift stations, wet wells, gravity sewer mains, force mains, maintenance access holes and other elements
• Collect wastewater and convey it to the Encina Wastewater Authority treatment plant
• Conduct closed-circuit camera review of pipelines to determine pipeline integrity
• Participate in the activities and budgets of the Encina Wastewater Authority as part of the Encina Joint Powers Authority
D-31 PUBLIC WORKS |
2020-21 Actual 2021-22 Actual 2022-23 Budget 2023-24 Budget Personnel Services Salaries & Wages 1,535,784 $ 1,722,304 $ 2,049,063 $ 2,275,535 $ Retirement Benefits 557,172 523,118 498,188 504,880 Health Insurance 236,007 261,927 335,653 430,627 Other Personnel Expenses (183,416) (388,017) 97,969 111,046 Personnel Services Subtotal 2,145,547 2,119,332 2,980,873 3,322,088 Operating Expenses Professional & Contract Services 4,398,529 4,024,515 5,990,323 6,803,415 Supplies & Materials 330,387 295,276 621,137 361,987 Repair & Maintenance 76,938 33,237 151,700 120,728 Interdepartmental Charges 1,395,257 1,370,172 1,519,845 1,929,134 Other Operating Expenses 4,677,562 5,006,588 5,725,940 10,528,986 Capital Outlay 28,987 60,681 9,750 1,800 Operating Expenses Subtotal 10,907,660 10,790,469 14,018,695 19,746,050 TOTAL EXPENDITURES 13,053,207 $ 12,909,801 $ 16,999,568 $ 23,068,138 $ Full Time Positions 19.45 20.10 20.80 21.60 Hourly/FTE Positions 0.00 0.20 0.00 0.00
• Prevent wastewater spills to protect the environment
• Administer the city’s Fats, Oils and Grease program to prevent pipeline clogs and subsequent wastewater spills
• Conduct public outreach regarding what can go into drains to prevent spills and other issues
RECENT ACCOMPLISHMENTS
• Completed closed-circuit camera inspections of large-diameter interceptor sewers that convey wastewater from collector pipelines to the Encina Wastewater Authority treatment facility to assess their integrity
• Started construction of the Villas Lift Station Replacement project
• Completed analysis of the North Batiquitos Lift Station force main
• Achieved over 80% compliance at Carlsbad’s food service establishments for the 2022 Fats, Oils and Grease program inspections
• Updated the Sewer Spill Response Plan
• Awarded a contract to insert a liner to repair approximately five miles of clay gravity sewer mains throughout the city
• Completed the design of repairs and upgrades for sewer lift stations throughout the city
• Completed the design for rehabilitation efforts of sewer mains and maintenance access hole improvements along Carlsbad Boulevard and Cannon Road
• Completed the design for increasing the size of the sewer pipeline on Kelly Drive
• Developed a Utilities Reserve policy
GOALS
• Initiate an update to the Sewer Master Plan
• Meet or exceed the American Water Works Association benchmark rate for combined utilities for wastewater system reliability of 0.2 to 7.0 overflows per 100 miles of pipeline
• Complete the generator replacement project at Poinsettia and Chinquapin lift stations for system reliability where the existing generators have met the end of their useful life
• Initiate the design of upgrades at Poinsettia and Chinquapin lift stations
• Clean sewer pipe in line with the department’s preventive maintenance schedule
• Update the cost of services study and present updated rates to the City Council
D-32
Performance Measure FY 2022 Actual FY 2023 Estimated FY 2024 Projected Rate of spills per 100 miles of pipe 0 0.358 <0.358 Department goal for amount of sewer pipe cleaned per year 100% 100% 100%
COMMUNITY SERVICES
The Community Services Branch includes programs, services and events that support Carlsbad's excellent quality of life. The branch includes the following key areas of focus:
• Community Service Administration
o Real Estate
• Community Development
• Housing & Homeless Services
• Library & Cultural Arts
• Parks & Recreation
These city service areas ensure the city’s planning and building policies are carried out, foster lifelong learning, support strong neighborhoods, administer affordable housing and homeless response programs, attend to the community’s health and wellness, and promote transparency in government.
Gary Barberio Deputy City Manager, Community Services
442-339-2822
gary.barberio@carlsbadca.gov
E-1
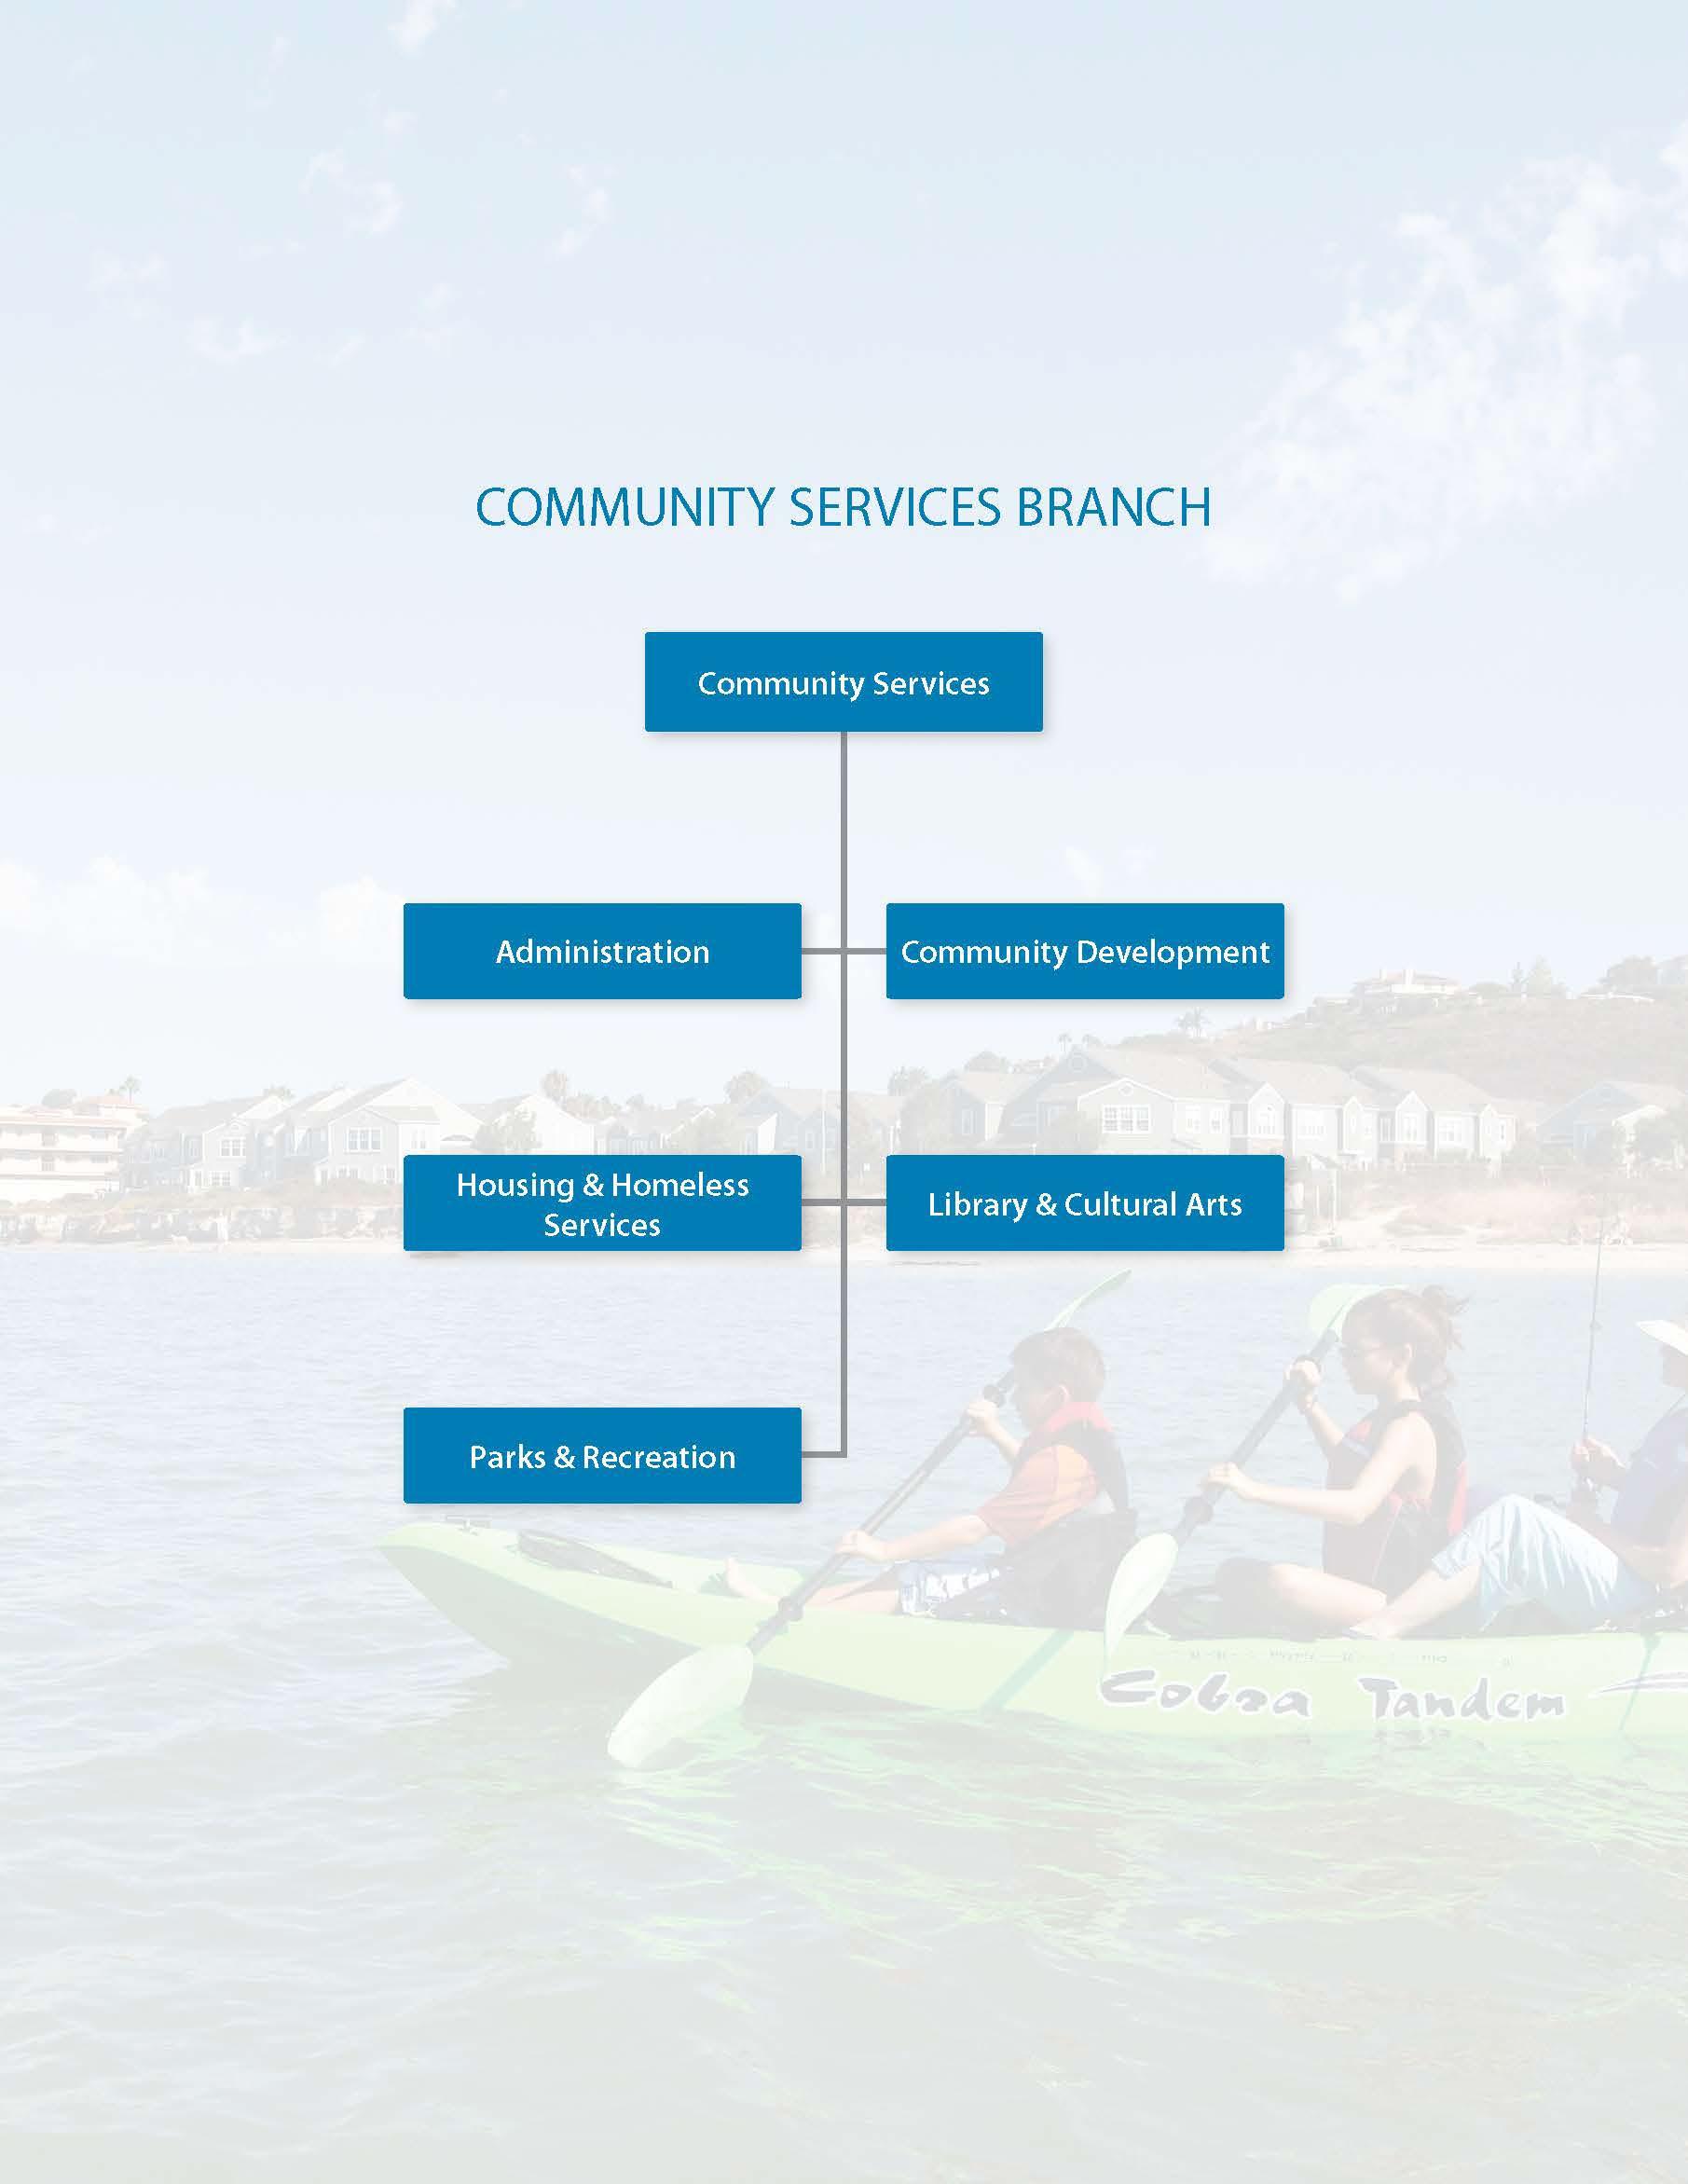
COMMUNITY SERVICES | ADMINISTRATION
ABOUT
The Community Services Branch provides programs and services that promote and support Carlsbad’s excellent quality of life. Community Services Administration provides leadership to the Community Services Branch.
SERVICES
Functional areas include department management, budget oversight and real estate services. The Community Services Branch ensures that the city’s planning, land development engineering, building and code enforcement policies are carried out, that affordable housing and homelessness programs are administered, that lifelong learning is fostered, that library and cultural arts services are delivered, that the city’s health and wellness are advanced through parks, recreation and senior services, and that the city’s real estate assets are well managed.
RECENT ACCOMPLISHMENTS
• Updated the city’s building codes to comply with new state building code
• Implemented self-certification inspection program allowing qualified individuals to selfcertify installation of minor improvements
• Implemented an online case tracking system simplifying the tracking of processing timelines in response to an internal audit recommendation
E-3
Account: 0012410 Fund: General
2020-21 Actual 2021-22 Actual 2022-23 Budget 2023-24 Budget Personnel Services Salaries & Wages 446,413 $ 416,086 $ 421,382 $ 382,197 $ Retirement Benefits 93,183 122,145 104,509 88,542 Health Insurance 58,369 57,361 60,862 37,759 Other Personnel Expenses 10,862 13,731 15,275 11,530 Personnel Services Subtotal 608,827 609,323 602,028 520,028 Operating Expenses Professional & Contract Services 13,319 14,057 19,400 9,000 Supplies & Materials 14 678 4,850 2,200 Repair & Maintenance - - -Interdepartmental Charges 30,900 38,496 43,639 52,433 Other Operating Expenses 941 1,025 6,000 1,750 Capital Outlay - - -Operating Expenses Subtotal 45,174 54,256 73,889 65,383 TOTAL EXPENDITURES 654,001 $ 663,579 $ 675,917 $ 585,411 $ Full Time Positions 3.00 3.00 3.00 2.00 Hourly/FTE Positions 0.00 0.00 0.00 0.00
• Developed a State Mobile Home Park Inspection Program to meet state requirements
• Revised the Vehicle Miles Travelled Guidelines to include updated options for mitigation
• Amended the Grading Ordinance to clarify exemption allowances for smaller projects
• Completed permit -ready accessory dwelling unit plans and updated the municipal code consistent with state law
• Worked with the Growth Management Citizens Committee to develop recommendations to update the Growth Management Plan and presented recommendations to the City Council
• Received new state grant fund totaling $1,162,504 which will be used to support activities outlined in the Homelessness Action Plan
• Updated the Homelessness Action Plan which was approved by the City Council
• Completed an upgrade of the audio-visual technology in the Exploration HUB
• Completed the design phase of the technological upgrade of the Schulman Auditorium, Cannon Art Gallery and the Ann Kulchin Courtyard
• Completed Veterans Memorial Park master plan
• Completed new Civic Center site selection process
GOALS
• Complete the E-plan Review (Bluebeam) Pilot Program, which will allow staff to make corrections and comments directly onto electronically submitted development
• Implement an automated solar permitting platform consistent with SB 379 allowing applicants to apply and receive a building permit for solar systems up to 38.4 kW in real time
• Develop a program to address the removal, storage, and return of unpermitted signs in the public right of way
• Expand the Customer Self Service portal to allow for additional permit types
• Obtain City Council approval of Objective Design Standards (Citywide & Village/Barrio) by summer 2023
• Implement a public facing data dashboard to provide access to homelessness programs and statistics
• Work with local partners to offer a small business community workshop series
• Increase the number of historical documents accessible to the community by 10%
• Re-establish a reading tutoring program for elementary school students
• Initiate public outreach for Veteran’s Memorial Park and Chestnut Underpass public art
• Award construction contract for Veterans Memorial Park
• Complete comprehensive update of the city’s Real Estate Strategic Plan
E-4
COMMUNITY SERVICES |
COMMUNITY DEVELOPMENT: SUMMARY
Summary level figures presented above for 2020-21 actuals include divisions now organized under the department Housing & Homeless Services, formed in 2021-22.
COMMUNITY DEVELOPMENT
• Land
Engineering
E-5
• Administration
Development
• Planning • Building
Enforcement 2020-21 Actual 2021-22 Actual 2022-23 Budget 2023-24 Budget Personnel Services Salaries & Wages 5,777,438 $ 5,010,684 $ 5,603,577 $ 5,644,085 $ Retirement Benefits 1,991,612 1,500,121 1,262,610 1,250,462 Health Insurance 806,470 716,552 873,634 925,126 Other Personnel Expenses 172,001 195,485 228,825 213,684 Personnel Services Subtotal 8,747,521 7,422,842 7,968,646 8,033,357 Operating Expenses Professional & Contract Services 1,927,057 1,637,536 955,683 1,305,683 Supplies & Materials 278,436 96,500 97,114 97,314 Repair & Maintenance 65 777 370 370 Interdepartmental Charges 1,280,325 1,094,448 1,337,437 1,550,984 Other Operating Expenses 9,635,563 38,518 25,450 25,250 Capital Outlay 4,213,749 - -Operating Expenses Subtotal 17,335,195 2,867,779 2,416,054 2,979,601 TOTAL EXPENDITURES 26,082,716 $ 10,290,621 $ 10,384,700 $ 11,012,958 $ General Fund 10,715,350 $ 10,276,086 $ 10,384,700 $ 11,012,958 $ Special Revenue Fund 15,127,464 $ 14,535 $ - $ - $ TOTAL FUNDING 25,842,814 $ 10,290,621 $ 10,384,700 $ 11,012,958 $ Full Time Positions 61.75 53.00 52.00 52.00 Hourly/FTE Positions 12.00 9.00 9.00 7.00
• Code
ABOUT
COMMUNITY DEVELOPMENT: ADMINISTRATION
Account: 0013010
Fund: General
Community Development Administration provides leadership, financial assistance and administrative support for the delivery of land development programs and services; plans for the efficient use of resources and facilities; and provides liaison services, resource assistance and technical guidance to the Planning Commission and City Council. Community Development Administration adds value to organizational processes and procedures to ensure best practices are implemented and that they support the broader goals of the organization.
SERVICES
• Provide organizational leadership and administrative support
• Manage and oversee operating budget
• Manage contract administration and records
• Support the department’s business systems and technology
RECENT ACCOMPLISHMENTS
• Expanded the Customer Self Service Portal allowing customers to view their status on building plan checks and access plan check comments for all building permit applications
E-6
COMMUNITY SERVICES |
2020-21 Actual 2021-22 Actual 2022-23 Budget 2023-24 Budget Personnel Services Salaries & Wages 842,027 $ 919,967 $ 925,334 $ 971,639 $ Retirement Benefits 276,853 253,252 222,690 229,982 Health Insurance 112,639 131,212 140,799 149,355 Other Personnel Expenses 22,528 33,083 35,967 34,396 Personnel Services Subtotal 1,254,047 1,337,514 1,324,790 1,385,372 Operating Expenses Professional & Contract Services 63,921 154,694 35,000 35,000 Supplies & Materials 44,160 31,004 44,387 44,387 Repair & Maintenance - - 20 20 Interdepartmental Charges 211,596 168,132 341,090 244,918 Other Operating Expenses 1,239 3,992 3,700 3,700 Capital Outlay - - -Operating Expenses Subtotal 320,916 357,822 424,197 328,025 TOTAL EXPENDITURES 1,574,963 $ 1,695,336 $ 1,748,987 $ 1,713,397 $ Full Time Positions 6.45 7.00 7.00 7.00 Hourly/FTE Positions 2.50 2.50 1.00 0.50
• Expanded the online appointment system to offer customers a self-help tool to book new submittal appointments online for building, planning and land development engineering
• Posted new bulletins to help the public understand complex and evolving land use issues
• Leveraged EnerGov to send system emails to customers during the building plan check process to keep them better informed
• Successfully executed a significant EnerGov systems upgrade
• Updated the Community Development website with new content and improved organization/resources
GOALS
• Further expanded use of the Customer Self Service Portal to allow the submittal and review of more complex permit types
• Complete the Bluebeam Pilot Program, which will allow staff to make corrections and comments directly onto electronically submitted development plans and studies
• Continue to identify and implement process improvements that help simplify and streamline permit intake, routing, and customer service delivery and interactions
E-7
COMMUNITY DEVELOPMENT: LAND DEVELOPMENT ENGINEERING
0013110 0013120
ABOUT
The Land Development Engineering Division ensures that all grading and public improvements required for new development projects and work in the public right-of-way comply with adopted codes and engineering standards.
SERVICES
• Review and process requests to subdivide land
• Perform plan checking and permitting for grading and public improvements projects
• Provide flood plain administration and residential assistance
• Conduct transportation impact review and analysis for development projects
• Maintain the engineering section of the public counter
• Provide customer service and effective public information
RECENT ACCOMPLISHMENTS
• Revised the Vehicle Miles Travelled Guidelines to include updated options for mitigation and additional information to help applicants
• Amended the Grading Ordinance to clarify exemption allowances for smaller grading projects
E-8
COMMUNITY SERVICES |
Account:
Fund:
General
2020-21 Actual 2021-22 Actual 2022-23 Budget 2023-24 Budget Personnel Services Salaries & Wages 1,144,984 $ 1,170,996 $ 1,222,160 $ 1,244,455 $ Retirement Benefits 389,669 342,375 292,107 277,660 Health Insurance 184,518 200,704 217,650 223,862 Other Personnel Expenses 33,239 43,016 51,404 46,675 Personnel Services Subtotal 1,752,410 1,757,091 1,783,321 1,792,652 Operating Expenses Professional & Contract Services 246,079 253,535 220,183 220,183 Supplies & Materials 3,812 3,081 4,400 4,400 Repair & Maintenance - - -Interdepartmental Charges 147,116 227,256 228,275 308,214 Other Operating Expenses 3,199 3,064 4,700 4,700 Capital Outlay - - -Operating Expenses Subtotal 400,206 486,936 457,558 537,497 TOTAL EXPENDITURES 2,152,616 $ 2,244,027 $ 2,240,879 $ 2,330,149 $ Full Time Positions 11.00 11.00 11.00 11.00 Hourly/FTE Positions 1.00 1.00 1.50 1.50
• Created an interactive VMT map for public use
• Issued 1,102 engineering permits
• Performed 2,817 reviews for ministerial and discretionary permits
GOALS
• Ensure discretionary plan check review is completed within 21 days of submittal, at least 80% of the time
• Ensure building permit plan check review is completed within 14 days of submittal, at least 80% of the time
• Continue to expand implementation of the Customer Self Service Portal to allow processing of additional permit types, such as right-of-way permits
• Update Grading Ordinance to clarify inconsistencies and memorialize current practices
• Continue to refine procedures and adopt new technology to enhance the customer experience
E-9
FY 2022 Actual FY 2023 Estimated FY 2024 Projected Discretionary permit plan check reviews completed within 21 days of submittal 68% 84% 88% Building permit plan check reviews completed within 14 days of submittal 84% 81% 80%
Performance Measure
COMMUNITY SERVICES |
COMMUNITY DEVELOPMENT: PLANNING
Account: 00132XX
ABOUT
Fund: General
The Planning Division is responsible for developing, updating and maintaining the city’s land use regulations (i.e., General Plan, Local Coastal Program and Zoning Ordinance) pursuant to City Council direction and state mandates as well as ensuring new growth and development complies with those established regulations.
SERVICES
• Maintain and modify plans, ordinances and policies for the long-range development and sustainability of the city
• Ensure new development adheres to all applicable land use codes, policies and regulations
• Complete environmental review of all private and public projects for compliance with the California Environmental Quality Act and the city’s Environmental Protection Procedures
• Respond to questions and inquiries related to permit processing and development standards
E-10
2020-21 Actual 2021-22 Actual 2022-23 Budget 2023-24 Budget Personnel Services Salaries & Wages 1,835,246 $ 1,779,631 $ 2,041,387 $ 2,022,884 $ Retirement Benefits 650,335 560,360 493,486 452,321 Health Insurance 219,870 205,721 268,185 289,155 Other Personnel Expenses 54,340 70,115 86,973 75,456 Personnel Services Subtotal 2,759,791 2,615,827 2,890,031 2,839,816 Operating Expenses Professional & Contract Services 552,889 508,709 201,000 551,000 Supplies & Materials 36,511 38,821 32,650 32,650 Repair & Maintenance 5 287 -Interdepartmental Charges 260,976 313,044 360,431 424,868 Other Operating Expenses 21,284 22,460 11,400 11,400 Capital Outlay - - -Operating Expenses Subtotal 871,665 883,321 605,481 1,019,918 TOTAL EXPENDITURES 3,631,456 $ 3,499,148 $ 3,495,512 $ 3,859,734 $ General Fund 3,614,495 $ 3,484,613 $ 3,495,512 $ 3,859,734 $ Special Revenue 16,961 14,535 -TOTAL FUNDING 3,631,456 $ 3,499,148 $ 3,495,512 $ 3,859,734 $ Full Time Positions 20.00 20.00 20.00 19.00 Hourly/FTE Positions 1.00 1.00 1.50 2.00
• Provide technical support to the Planning Commission and the City Council
• Continuously enhance permit review process for efficiencies and implement streamlined permitting processes
RECENT ACCOMPLISHMENTS
• Conducted public engagement activities and gathered input on Housing Element Update Site Selection, from which the City Council endorsed two maps for further environmental review
• Issued a Conditional Use Permit for the Orion Center project
• Completed permit -ready accessory dwelling unit plans and updated the Municipal Code for consistency with state law
• Coordinated with California Coastal Commission staff in their review of the city’s application for a Comprehensive Local Coastal Program Amendment
• Worked with the City Council-appointed Growth Management Citizens Committee to develop recommendations to update the current Growth Management Plan and presented report of these recommendations to the City Council
GOALS
• Ensure discretionary plan check review is completed within 30 days of submittal, at least 90% of the time
• Ensure building permit plan check review is completed within 14 days of submittal, at least 80% of the time
• Complete environmental review and present Housing Element maps for City Council consideration by spring 2024
• Present Objective Design Standards inside and outside Village & Barrio Master Plan for City Council consideration by summer 2024
E-11
Performance Measure FY 2022 Actual FY 2023 Estimated FY 2024 Projected Discretionary permit plan check reviews completed within 30 days of submittal 86.3% 80% 90% Building permit plan check reviews completed within 14 days of submittal 69.6% 54.7% 80%
COMMUNITY SERVICES |
COMMUNITY DEVELOPMENT: BUILDING
Account: 0013610
ABOUT
Fund: General
The Building Division staff are the main point of contact for individuals wanting to build or modify a structure on their property. Building staff provide guidance and review projects for conformance with state and local building standards. Once a permit has been issued to authorize construction, a building inspector is assigned to help the property owner ensure that the contractor’s work is consistent with approved plans.
SERVICES
• Conduct fee assessment, plan review, permit issuance and inspection for compliance with state and local codes including recycling, stormwater, energy generation and conservation
• Respond to questions and inquiries related to permit processing and construction standards
• Provide information related to ongoing construction projects and historical building records
• Maintain records during construction and prepare files for electronic conversion following final approval
E-12
2020-21 Actual 2021-22 Actual 2022-23 Budget 2023-24 Budget Personnel Services Salaries & Wages 760,441 $ 740,058 $ 925,249 $ 833,044 $ Retirement Benefits 267,350 229,988 203,191 180,528 Health Insurance 150,355 127,233 164,413 153,419 Other Personnel Expenses 23,498 30,194 40,944 33,258 Personnel Services Subtotal 1,201,644 1,127,473 1,333,797 1,200,249 Operating Expenses Professional & Contract Services 386,470 664,436 449,000 449,000 Supplies & Materials 3,233 3,971 4,127 4,127 Repair & Maintenance 23 457 250 250 Interdepartmental Charges 214,733 260,016 270,324 361,643 Other Operating Expenses 1,036 5,224 2,700 2,700 Capital Outlay - - -Operating Expenses Subtotal 605,495 934,104 726,401 817,720 TOTAL EXPENDITURES 1,807,139 $ 2,061,577 $ 2,060,198 $ 2,017,969 $ Full Time Positions 10.00 10.00 10.00 9.00 Hourly/FTE Positions 1.00 1.00 1.50 1.00
RECENT ACCOMPLISHMENTS
• Issued over 4,756 building permits valued at over $149 million in 2022
• Conducted over 15,000 building inspections in 2022
• Updated the city’s building code and standards to comply with new state building code that became active January 2023
• Implemented self-certification inspection program that allows qualified individuals to selfcertify installation of minor improvements
GOALS
• Ensure building plan check review is completed within 14 days of submittal, at least 80% of the time
• Ensure building permit inspections occur within 24 hours of request, at least 80% of the time
• Implement an automated solar permitting platform consistent with Senate Bill 379 to allow applicants to apply for and receive an approved residential building permit for solar systems up to 38.4 kW in real time
E-13
Performance Measure FY 2022 Actual FY 2023 Estimated FY 2024 Projected Building permit plan check reviews completed within 14 days of submittal 66% 70% 80% Building inspections completed within 24 hours of request 100% 100% 100%
COMMUNITY DEVELOPMENT: CODE ENFORCEMENT
Account: 0013620
ABOUT
Fund: General
The Code Enforcement Division, working with residents and its partner enforcement agencies, is tasked with enforcing the city’s laws that govern land use and quality of life issues, including public nuisances, safety and welfare. The purpose of these laws and their enforcement is to help maintain safe and healthy living and working conditions for the members of the community. The division’s approach is not to be punitive, but to first attempt to achieve compliance through education before more formal enforcement methods like citations are applied.
SERVICES
• Enforce zoning, building, general property maintenance and other municipal codes
• Conduct inspections of alleged violations received from resident and business complaints
• Assist individuals on how to secure required permits and/or obtain compliance with applicable codes
• Collaborate with partner enforcement agencies on overlapping enforcement cases
• Ensure that residents are aware and follow rules on short-term vacation rentals
E-14
COMMUNITY SERVICES |
2020-21 Actual 2021-22 Actual 2022-23 Budget 2023-24 Budget Personnel Services Salaries & Wages 487,360 $ 400,032 $ 489,447 $ 572,063 $ Retirement Benefits 131,233 114,146 51,136 109,971 Health Insurance 62,771 51,682 82,587 109,335 Other Personnel Expenses 15,270 19,077 13,537 23,899 Personnel Services Subtotal 696,634 584,937 636,707 815,268 Operating Expenses Professional & Contract Services 17,416 56,162 50,500 50,500 Supplies & Materials 7,048 19,623 11,550 11,750 Repair & Maintenance 14 33 100 100 Interdepartmental Charges 23,641 126,000 137,317 211,341 Other Operating Expenses 4,526 3,778 2,950 2,750 Capital Outlay - - -Operating Expenses Subtotal 52,645 205,596 202,417 276,441 TOTAL EXPENDITURES 749,279 $ 790,533 $ 839,124 $ 1,091,709 $ Full Time Positions 5.00 5.00 4.00 6.00 Hourly/FTE Positions 3.50 3.50 3.50 2.00
RECENT ACCOMPLISHMENTS
• Developed a procedural manual to serve as both a training and operations resource guide for staff in response to an internal audit recommendation
• Developed Administrative Order No. 92 – Code Enforcement Officer Safety Standards in accordance with State Senate Bill 296
• Developed specific reports to show key performance indicators that started July 1
• Developed and implemented an online tracking system that simplifies the tracking of case processing timelines, as reflected in the Code Enforcement Case Prioritization and Process Guide in response to an internal audit recommendation
• Developed a State Mobile Home Park Inspection Program for the California Department of Housing and Community Development Mobile Home Park Maintenance inspections
GOALS
• Develop a program that addresses the removal/storage/return of unpermitted signs in the public right-of-way
• Develop and expand enforcement tracking system to improve operations management
• Ensure Category 1 cases unsafe & hazardous conditions are closed within three days of complaint, at least 80% of the time
• Ensure Category 2 cases nuisance & blight-causing conditions are closed within 30 days of complaint, at least 80% of the time
• Ensure Category 3 cases miscellaneous violation conditions are closed within 50 days of complaint, at least 80% of the time
E-15
Performance Measure FY 2022 Actual FY 2023 Estimated FY 2024 Projected Percent of Category 1 cases closed within three businesses days of complaint 100% 100% 100% Percent of Category 2 cases closed within 30 businesses days of complaint 70% 81% 80% Percent of Category 3 cases closed within 50 businesses days of complaint 67% 89% 90%
COMMUNITY SERVICES |
HOUSING & HOMELESS SERVICES: SUMMARY
Summary level figures presented above for 2019-20 and 2020-21 actuals exclude divisions formerly organized under the department Community Development, as Housing & Homeless Services was formed in 2021-22.
E-16
HOUSING & HOMELESS SERVICES • Housing Services • Homeless Services • Affordable Housing Programs • Federally Funded Community Assistance Programs • Successor Agency 2020-21 Actual 2021-22 Actual 2022-23 Budget 2023-24 Budget Personnel Services Salaries & Wages - $ 993,770 $ 1,654,810 $ 1,670,299 $ Retirement Benefits - 280,853 $ 377,017 361,984 Health Insurance - 102,832 $ 264,423 265,173 Other Personnel Expenses - 38,517 68,761 63,325 Personnel Services Subtotal - 1,415,972 2,365,011 2,360,781 Operating Expenses Professional & Contract Services - 1,169,814 1,747,672 1,616,141 Supplies & Materials - 404,995 261,642 291,037 Repair & Maintenance - 24 300 200 Interdepartmental Charges - 379,115 566,690 454,534 Other Operating Expenses - 11,189,525 11,266,663 13,558,886 Capital Outlay - 13,111 4,900 7,300 Operating Expenses Subtotal - 13,156,584 13,847,867 15,928,098 TOTAL EXPENDITURES - $ 14,572,556 $ 16,212,878 $ 18,288,879 $ General Fund - $ 1,788,322 $ 3,134,115 $ 2,765,195 $ Special Revenue Fund - 12,663,435 $ 12,009,918 $ 14,464,184 $ Trust Fund - 120,799 $ 1,068,845 $ 1,059,500 $ TOTAL FUNDING - $ 14,572,556 $ 16,212,878 $ 18,288,879 $ Full Time Positions 0.00 14.00 16.00 16.00 Hourly/FTE Positions 0.00 3.00 1.81 1.53
HOUSING & HOMELESS SERVICES: HOUSING SERVICES
ABOUT
The Housing Services Division provides various programs, activities and services that assist in the effort to sustain an extraordinary Carlsbad community. These include disbursing community grants, delivering community education programs, funding the Carlsbad Service Center and supporting the Carlsbad Housing Commission.
SERVICES
• Provide financial assistance to community organizations, teams and special events that benefit and enrich residents in compliance with City Council policies
• Fund projects that improve agricultural lands for continued agricultural production, protect and enhance the coastal and lagoon environment, improve lagoon nature centers, and restore beaches for public use through the Agricultural Conversion Mitigation Fee program
• Provide community education programs, including the Carlsbad Student Leader Academy for high school students and CityStuff for third grade students
E-17
COMMUNITY SERVICES |
Account: 0012510 0012520 1502810 171 Fund: General General Special Revenue – Community Grants Special Revenue – Agriculture Mitigation Fee
2020-21 Actual 2021-22 Actual 2022-23 Budget 2023-24 Budget Personnel Services Salaries & Wages 225,817 $ 307,167 $ 681,860 $ 553,155 $ Retirement Benefits 145,286 90,825 149,968 112,138 Health Insurance 28,982 27,343 81,024 64,554 Other Personnel Expenses 8,467 13,308 26,578 19,640 Personnel Services Subtotal 408,552 438,643 939,430 749,487 Operating Expenses Professional & Contract Services 267,595 250,995 339,217 270,000 Supplies & Materials 8,454 12,003 13,600 12,400 Repair & Maintenance 14 - -Interdepartmental Charges 131,716 120,900 168,016 94,021 Other Operating Expenses 527 1,715 53,777 54,370 Capital Outlay - - -Operating Expenses Subtotal 408,306 385,613 574,610 430,791 TOTAL EXPENDITURES 816,858 $ 824,256 $ 1,514,040 $ 1,180,278 $ General Fund 816,858 $ 824,256 $ 1,484,040 $ 1,150,278 $ Special Revenue - - 30,000 30,000 TOTAL FUNDING 816,858 $ 824,256 $ 1,514,040 $ 1,180,278 $ Full Time Positions 3.78 4.50 5.17 4.17 Hourly/FTE Positions 2.00 2.00 0.83 0.75
• Provide low income and homeless services support, including funding to the Carlsbad Services Center, which offers temporary day labor employment services, employment training and readiness, access to benefits, basic needs, rental assistance and case management
• Administer the Minor Home Repair Program, which provides forgivable home repair loans to low-income households who own and occupy their home as their primary residence
• Provide technical and administrative support to the Carlsbad Housing Commission
RECENT ACCOMPLISHMENTS
• Commenced the Carlsbad Student Leader Academy in February 2023 with 19 high school student participants
• Oversaw the CityStuff program offered to third grade students in 25 classrooms in partnership with 14 local elementary schools
• Administered the Affordable Housing Resale Program, including the acquisition of 11 units, of which nine have been resold to qualified low-income buyers. The remaining two units of the original 11 are undergoing repairs and anticipated to be sold by the end of 2023 calendar year. An additional four units have been acquired to-date, of which one has been sold, and three are anticipated to be sold by the end of 2023 calendar year.
• Facilitated affordable housing projects: 419 dwelling units affordable to moderate, low, very low and extremely low households are either under construction, approved and pending construction, or are currently moving through the permit approval process
• Received new state grant fund totaling $1,162,504. The Permanent Local Housing Allocation funds will be used to support activities outlined in the Homelessness Action Plan, which was updated in February 2023. Staff will continue to apply for this ongoing funding source each year.
GOALS
• Implement the Community Activity Grant, Special Events Grant, Community Spirit Grant and Winning Teams Grant programs, and process applications for assistance that are consistent with City Council policies
• Provide community education to 54 classrooms
• Continue to support the Agricultural Conversion Mitigation Fee program
• Provide education focused on civic proficiency and leadership to Carlsbad youth
• Provide technical and administrative support to the Carlsbad Housing Commission
• Continue to support the Carlsbad Service Center
E-18
Performance Measure FY 2022 Actual FY 2023 Estimated FY 2024 Projected Community Grants dispersed $6,000 $5,000 $5,000 Classrooms educated 3 25 54
HOUSING & HOMELESS SERVICES: HOMELESS SERVICES
Account: 0012540 1362610
ABOUT
The Homeless Services Division is responsible for leading all strategies, initiatives and actions related to the city’s goal of addressing the complex needs of individuals experiencing or at risk of experiencing homelessness in a compassionate and effective manner and reduce the impacts of homelessness on the community. This division uses best practices, community input and feedback from people with lived experience to implement solutions to prevent and reduce homelessness. The strategies and initiatives surround three main areas of focus: shelter and housing, outreach and access to services and public safety.
SERVICES
• Manage and implement the city’s Homelessness Action Plan
• Provide housing navigation services for persons at-risk of or experiencing homelessness
• Oversee the homeless outreach and case management contract
• Offer short-term emergency boarding for animals of a person experiencing homelessness within the city via contract services with San Diego Humane Society
• Manage a rapid rehousing contract with Community Resource Center that helps individuals and households experiencing homelessness within the city
E-19
COMMUNITY SERVICES |
Fund: General
Special Revenue - PLHA
2020-21 Actual 2021-22 Actual 2022-23 Budget 2023-24 Budget Personnel Services Salaries & Wages - $ 299,810 $ 463,317 $ 479,026 $ Retirement Benefits - 62,181 116,301 111,299 Health Insurance - 32,200 80,283 73,405 Other Personnel Expenses - 7,290 18,757 17,235 Personnel Services Subtotal - 401,481 678,658 680,965 Operating Expenses Professional & Contract Services - 558,126 889,500 863,000 Supplies & Materials - 3,005 16,250 16,000 Repair & Maintenance - - -Interdepartmental Charges - - 62,417 46,449 Other Operating Expenses - 1,454 3,250 1,127,629 Capital Outlay - - -Operating Expenses Subtotal - 562,585 971,417 2,053,078 TOTAL EXPENDITURES - $ 964,066 $ 1,650,075 $ 2,734,043 $ General Fund - $ 964,066 $ 1,650,075 $ 1,614,917 $ Special Revenue - - - 1,119,126 TOTAL FUNDING - $ 964,066 $ 1,650,075 $ 2,734,043 $ Full Time Positions 0.00 3.50 4.00 4.10 Hourly/FTE Positions 0.00 0.00 0.00 0.00
• Oversee a contract with the Catholic Charities Diocese of San Diego to provide two licensed clinicians to provide staff at the La Posada de Guadalupe Emergency Shelter with training, allowing the facility to operate as a low barrier shelter
• Manage a contract with OrgCode Consulting to provide training and technical assistance at the La Posada de Guadalupe shelter
• Implement a contract with Community Resource Center to provide employment and benefits services to people experiencing homelessness
• Oversee the contract with Urban Corps for citywide abandoned items and litter removal services related to homeless encampments
• Oversee a contract with Rocket John’s providing restroom and sanitation services in locations around the city
• Engage with community residents and businesses through regular communication efforts
• Coordinate with neighboring jurisdictions and county resources on regional issues related to homelessness
• Oversee the limited-term motel voucher program
RECENT ACCOMPLISHMENTS
• Updated the Homelessness Action Plan
• Began work on the City Council-approved strategic plan goal addressing the complex needs of individuals experiencing or at risk of experiencing homelessness in a compassionate and effective manner and reduces the impacts of homelessness on the community
• Engaged with 749 unduplicated individuals experiencing homelessness in the city via cityfunded homelessness service programs, assisted with transitioning 62 people into permanent housing, placed 110 people into emergency shelters and cleaned up 50 encampments
• Implemented a contract with Community Resource Center for an employment and benefits specialist to help connect people to disability and social security benefits, CalWORKS, CalFresh, Veteran benefits, employment programs and other aid programs
• Secured a competitive County Emergency Housing Solutions Grant of $2 million from the County of San Diego to support the expansion of the La Posada de Guadalupe shelter
• Assisted 37 households with 95 nights in the short-term motel voucher program
• Hosted a mobile homeless court and resource fair with 58 individuals attending
GOALS
• Enhance the quality of life for everyone in Carlsbad by adopting and implementing an updated Homelessness Action Plan that addresses the complex needs of individuals experiencing or at risk of experiencing homelessness in a compassionate and effective manner and reduces the impacts of homelessness on the community
• Implement a public facing dashboard of data on homelessness programs and statistics
• Start construction on La Posada expansion and new dashboard for measurements of goals
E-20
Performance Measure FY 2022 Actual FY 2023 Estimated FY 2024 Projected Unduplicated homeless persons served 749 700 700 Shelter placements 110 110 120 Persons housed 62 70 70 Encampments cleared 50 30 30
HOUSING & HOMELESS SERVICES: AFFORDABLE HOUSING PROGRAMS
ABOUT
The city is a regional leader in the provision of affordable housing. The Affordable Housing Trust Fund Program is the city’s primary source of affordable housing funding for low-income households. The Affordable Housing Trust Fund collects fees generated from the Inclusionary Housing In-Lieu Fee and the sale of affordable housing credits that satisfy a developer’s inclusionary housing obligation as well as loan repayments from existing developments. With these funds, the city provides affordable housing programs, low income and homeless services support, and financial assistance for residential developments that provide housing opportunities to low-income households. The city also owns Tyler Court Senior Apartments, a 75-unit senior apartment complex. This complex provides for 100% affordable housing to senior households with incomes at 30% and 50% of the San Diego County Area median incomes. The city has an agreement with a third party to manage the day-to-day operations of the apartment complex. The property is intended to remain a senior-only development according to its approved conditional use permit and continues to have income and rent restrictions to be affordable to very low and extremely low-income households
E-21 COMMUNITY SERVICES |
133 134 806
Special Revenue – Affordable Housing Trust Special Revenue – Tyler Court Apartments
Account:
Fund:
2020-21 Actual 2021-22 Actual 2022-23 Budget 2023-24 Budget Personnel Services Salaries & Wages 102,028 $ 20,667 $ 53,332 $ 97,639 $ Retirement Benefits 36,004 14,885 11,645 22,526 Health Insurance 8,095 3,474 15,956 18,963 Other Personnel Expenses 3,287 2,559 2,626 4,012 Personnel Services Subtotal 149,414 41,585 83,559 143,140 Operating Expenses Professional & Contract Services 350,465 322,866 377,955 357,141 Supplies & Materials 158,521 381,112 217,627 253,672 Repair & Maintenance - - -Interdepartmental Charges 127,920 64,224 71,059 58,423 Other Operating Expenses 148,765 329,655 181,001 453,377 Capital Outlay 4,213,749 13,111 2,900 7,300 Operating Expenses Subtotal 4,999,420 1,110,968 850,542 1,129,913 TOTAL EXPENDITURES 5,148,834 $ 1,152,553 $ 934,101 $ 1,273,053 $ Full Time Positions 0.60 0.60 0.80 1.20 Hourly/FTE Positions 1.00 1.00 0.06 0.06
SERVICES
• Provide affordable housing funding for low-income households via the Affordable Housing Trust Fund Program
• Continue to implement the Inclusionary Housing Ordinance by providing information to developers, the public and city staff on the requirements of the ordinance
• Negotiate and prepare affordable housing agreements and density bonus agreements
• Assist with the development of low-income affordable housing developments from concept to construction
• Oversee the third-party managed Tyler Court Senior Apartments
RECENT ACCOMPLISHMENTS
• Broke ground on 206 affordable units across three projects
GOALS
• Administer the Housing Trust Fund in accordance with Council Policy No. 90
• Continue to work with residential developers with inclusionary housing requirements to produce additional homes affordable to lower-income households
• Research and develop other programs and development opportunities to increase the supply of affordable housing for low-income households
• Preserve and improve the quality of the city’s existing housing stock
• Continue to support the low-income senior community by offering affordable housing with income and rent restrictions
E-22
HOUSING & HOMELESS SERVICES: FEDERALLY FUNDED COMMUNITY ASSISTANCE PROGRAMS
ABOUT
The city receives federal grants that benefit the community and low-income households. The federally funded Section 8 Housing Choice Voucher rental assistance program provides monthly rental subsidies to very low-income households and processes new participants into the program as additional funds are available. The Community Development Block Grant program represents federal funds provided to the city to develop viable urban communities through the provision of decent housing, a suitable living environment and expanded economic opportunities for lower -income persons. This program is focused on providing specific benefits to low-income residents, with serving the city’s homeless population and providing affordable housing as the two highest priorities.
SERVICES
• Provide monthly rental subsidies to very low-income households and process new participants as for the federally funded Section 8 Housing Choice Voucher rental assistance program
• Assist low-income households with access to safe and sanitary rental housing
• Ensure the Section 8 Housing Choice Voucher tenant-based rental assistance program is being administered in compliance with federal regulations and guidelines, the Carlsbad Administrative Plan, and the Public Housing Agency Plan
E-23
COMMUNITY SERVICES |
Account: 190 391 Fund: Special Revenue – Section 8 Housing Special Revenue – Community Development Block Grant
2020-21 Actual 2021-22 Actual 2022-23 Budget 2023-24 Budget Personnel Services Salaries & Wages 362,144 $ 366,126 $ 456,301 $ 540,479 $ Retirement Benefits 89,509 112,962 99,103 116,021 Health Insurance 39,219 39,815 87,160 108,251 Other Personnel Expenses 10,790 15,360 20,800 22,438 Personnel Services Subtotal 501,662 534,263 663,364 787,189 Operating Expenses Professional & Contract Services 37,214 37,827 111,000 96,000 Supplies & Materials 12,084 8,875 14,165 8,965 Repair & Maintenance 9 24 300 200 Interdepartmental Charges 116,631 186,707 257,528 255,641 Other Operating Expenses 9,294,069 10,743,186 9,997,460 10,894,010 Capital Outlay - - 2,000Operating Expenses Subtotal 9,460,007 10,976,619 10,382,453 11,254,816 TOTAL EXPENDITURES 9,961,669 $ 11,510,882 $ 11,045,817 $ 12,042,005 $ Full Time Positions 4.00 5.40 6.03 6.53 Hourly/FTE Positions 0.00 0.00 0.93 0.73
• Achieve and maintain a lease rate that fully utilizes Section 8 Housing Choice Voucher program funding allocation
• Enable unemployed, under-employed or under-educated low-income families to achieve economic independence from welfare
• Administer the CDBG program representing federal funds provided to the city
• Prepare and implement a five-year consolidated plan and Annual Action Plan for submittal to U.S. Department of Housing and Urban Development, or HUD
• Provide staff support to the CDBG Funding Advisory Committee and the City Council in the selection process for activities to be included in the CDBG Program
• Ensure that documentation is maintained to meet compliance with HUD established guidelines for continued CDBG funding
• Monitor activities of grant sub-recipients to ensure proper use of funds
• Prepare the Consolidated Annual Performance and Evaluation Report for public review and comment and final submission to HUD
• Partner with a non-profit legal advisor to provide fair housing and tenant-landlord dispute counseling and education program
RECENT ACCOMPLISHMENTS
• Provided monthly rental assistance to 575 very low and extremely low-income households, an increase of 25 households
• Received Section 8 Housing Choice Voucher funding to assist 16 additional households with rental assistance
• Funded four public service organizations and one fair housing provider resulting in supportive services being provided to approximately 1,215 Carlsbad residents in low-income and special needs populations, and assistance in the prevention of homelessness and reduction of the homeless population
• Amended the fiscal year 2022-23 Annual Action Plan for the CDBG Program to allocate $996,112 in additional funds received through Program Income and unspent funds from prior year projects
GOALS
• Continue to operate the Section 8 Housing Choice Voucher program effectively and seek additional funding to serve more clients as opportunities arise
• Complete processing of rental assistance vouchers for 25 non-elderly, disabled participants
• Complete and submit the fiscal year 2022-23 Consolidated Annual Plan Evaluation Report and fiscal year 2023-24 Annual Action Plan
• Update CDBG policies and procedures to allow funding allocations that best support the implementation of the homelessness action plan
E-24
Performance Measure FY 2022 Actual FY 2023 Estimated FY 2024 Projected Clients receiving Rental Assistance 568 575 600 Dollar value of grants awarded to community organizations $501,113 $476,057 $476,057
C OMMUNITY SERVICES |
HOUSING & HOMELESS SERVICES: SUCCESSOR AGENCY
Account: 801, 811
ABOUT
Fund: Trust Fund – Successor Agency
The successor agency is responsible for preparing a recognized obligation payments schedule as detailed by the State of California’s Department of Finance, listing the enforceable obligations of the former redevelopment agency and their source of payment. This payment schedule is subject to approval by the countywide oversight board.
SERVICES
• Administer the successor agency, which is responsible for preparing a recognized obligation payment schedule as detailed by the State of California’s Department of Finance, listing the enforceable obligations of the former redevelopment agency and their source of payment
• Participate in activities associated with the dissolution of the redevelopment agency
• Ensure payment of all debt obligations as approved by the oversight board
RECENT ACCOMPLISHMENTS
• Processed Recognized Obligations Payment Schedule for fiscal year 2022-23 for approval by the countywide oversight board
• Received loan repayment from the successor agency and funding for payment on redevelopment bond
GOALS
• Continue to take actions to dissolve the former redevelopment agency in a timely manner and ensure repayment of all approved debt obligations
E-25
2020-21 Actual 2021-22 Actual 2022-23 Budget 2023-24 Budget Personnel Services Salaries & Wages 17,391 $ - $ - $ - $ Retirement Benefits 5,373 - -Health Insurance 21 - -Other Personnel Expenses 582 - -Personnel Services Subtotal 23,367 - -Operating Expenses Professional & Contract Services 5,008 - 30,000 30,000 Supplies & Materials 4,613 - -Repair & Maintenance - - -Interdepartmental Charges 45,996 7,284 7,670Other Operating Expenses 160,918 113,515 1,031,175 1,029,500 Capital Outlay - - -Operating Expenses Subtotal 216,535 120,799 1,068,845 1,059,500 TOTAL EXPENDITURES 239,902 $ 120,799 $ 1,068,845 $ 1,059,500 $ Full Time Positions 0.35 0.35 0.00 0.00 Hourly/FTE Positions 0.00 0.00 0.00 0.00
LIBRARY & CULTURAL ARTS: SUMMARY
E-26
COMMUNITY SERVICES |
& CULTURAL ARTS • Administration, Digital Initiatives & Special Projects • Circulation Services • Adult & Teen Services, Genealogy & Carlsbad History Services • Children’s Services • Collections & Technical Services • Outreach, Literacy & Bilingual Services • Cultural Arts 2020-21 Actual 2021-22 Actual 2022-23 Budget 2023-24 Budget Personnel Services Salaries & Wages 5,471,768 $ 5,643,950 $ 6,665,560 $ 6,563,356 $ Retirement Benefits 1,509,419 1,275,142 1,140,395 1,101,347 Health Insurance 597,556 567,654 700,556 766,775 Other Personnel Expenses 152,820 211,284 253,406 244,754 Personnel Services Subtotal 7,731,563 7,698,030 8,759,917 8,676,232 Operating Expenses Professional & Contract Services 398,850 561,814 734,375 720,722 Supplies & Materials 1,060,417 1,218,483 1,302,947 1,248,471 Repair & Maintenance 40,419 3,415 6,800 8,800 Interdepartmental Charges 2,852,698 3,191,426 3,362,870 3,127,532 Other Operating Expenses 416,135 518,442 453,733 473,063 Capital Outlay 14,333 8,307 -Operating Expenses Subtotal 4,782,852 5,501,887 5,860,725 5,578,588 TOTAL EXPENDITURES 12,514,415 $ 13,199,917 $ 14,620,642 $ 14,254,820 $ General Fund 12,344,689 $ 13,024,082 $ 14,088,425 $ 13,637,285 $ Special Revenue Fund 169,726 $ 175,835 $ 532,217 $ 617,535 $ TOTAL FUNDING 12,514,415 $ 13,199,917 $ 14,620,642 $ 14,254,820 $ Full Time Positions 52.50 52.50 51.00 53.00 Hourly/FTE Positions 62.06 63.66 61.95 53.42
LIBRARY
LIBRARY & CULTURAL ARTS: ADMINISTRATION, DIGITAL INITIATIVES & SPECIAL PROJECTS
Account: 0014010
ABOUT
Library & Cultural Arts Administration provides management and leadership for the delivery of library and cultural arts programs and services; plans for the efficient use of resources and facilities; coordinates relations with local, state and federal government agencies; and provides liaison services, resource assistance and technical guidance to Library Board of Trustees, Arts Commission, the Friends of the Carlsbad Library, the Carlsbad Library & Arts Foundation, the Carlsbad Friends of the Arts, and the Serra Cooperative Library System.
SERVICES
• Conduct strategic planning, set programs and services, and monitor and respond to industry trends and best practices
• Utilize data to develop meaningful performance metrics that show impact in the community and adjust services based on community needs
• Manage personnel and volunteer recruitment activities, develop and maintain policies and procedures, and provide centralized training services for all staff and volunteers
• Develop, administer and monitor budgets, contracts, grants, purchasing and accounting processes
• Plan, develop and implement technology solutions to effectively deliver services
E-27 COMMUNITY SERVICES |
Fund: General
2020-21 Actual 2021-22 Actual 2022-23 Budget 2023-24 Budget Personnel Services Salaries & Wages 1,033,474 $ 1,151,422 $ 1,120,970 $ 1,162,425 $ Retirement Benefits 378,464 333,065 282,520 249,848 Health Insurance 129,096 129,932 146,018 147,366 Other Personnel Expenses 29,224 40,134 43,950 40,086 Personnel Services Subtotal 1,570,258 1,654,553 1,593,458 1,599,725 Operating Expenses Professional & Contract Services 70,370 76,705 18,000 14,000 Supplies & Materials 105,168 102,997 83,895 73,510 Repair & Maintenance 38,967 1,235 4,155 4,155 Interdepartmental Charges 689,278 763,200 997,493 807,042 Other Operating Expenses 408,610 514,221 452,630 473,063 Capital Outlay 14,333 8,307 -Operating Expenses Subtotal 1,326,726 1,466,665 1,556,173 1,371,770 TOTAL EXPENDITURES 2,896,984 $ 3,121,218 $ 3,149,631 $ 2,971,495 $ Full Time Positions 12.00 12.00 10.00 10.00 Hourly/FTE Positions 3.82 3.82 3.37 2.92
• Work with the Library Board of Trustees and the Arts Commission to ensure the department is responsive to community needs as represented by trustees and commissioners
• Partner with support organizations including the Carlsbad Library & Arts Foundation, the Friends of the Carlsbad Library and Friends of the Arts to ensure endowments, donations and fundraising on behalf of the organization are appropriately used
RECENT ACCOMPLISHMENTS
• Integrated the library’s computer management system with the Parks & Recreation public computer labs so Parks & Recreation can utilize analytics and session management tools
• Eliminated fines for late return of library materials to align with industry best practices
• Completed an upgrade of the audio-visual technology in the Exploration HUB
• Returned volunteer opportunities to the majority of service areas
• Initiated the process of centralizing data collection to improve access to performance metrics
• Updated the library’s patron automated materials handling system allowing for improved functionality and support
• Completed an update to the integrated library computer system that allows for a more diverse and inclusive library catalog
• Evaluated public computer usage resulting in a reduction of 25 computers across three facilities
• Provided direct access to over 4,000 digital magazines via the online catalog
GOALS
• Evaluate staff and community services and resources with an equity lens to improve overall accessibility and inclusion
• Improve use of metrics to determine usage of existing resources and to anticipate future community needs
• Upgrade the library’s patron and materials management system for improved functionality
• Pursue information about patron traffic and usage by installing a new people counting and usage measuring system
• Pursue an upgrade of computer hardware and software in the Exploration HUB and move from a wired to wireless environment
• Pursue library material retrieval lockers to improve services to patrons outside of library hours
• Evaluate the changing patron needs for computers, printing and copying
• Expand patron access to materials beyond the Carlsbad collection with a resource sharing program, Link+, through the Serra Cooperative Library System
• Improve and formalize relationships with support organizations via Memorandums of Understanding
• Move Library Learning Center renovation project forward in the CIP process
E-28
Performance Measure FY 2022 Actual FY 2023 Estimated FY 2024 Projected Number of contracts executed 112 105 110 Patron computer sessions: Mobile and in-house 116,340 143,440 160,000 Library visits 363,803 415,309 450,000
LIBRARY & CULTURAL ARTS: CIRCULATION SERVICES
Account: 0014015
ABOUT
Circulation Services maintains library patrons’ accounts and manages the shelving and circulation of all print and audiovisual materials.
SERVICES
• Respond to in-person, telephone and email account inquiries
• Issue new and replacement library cards to borrowers and internet users
• Circulate print and audiovisual materials and answer collection-related questions
• Track reserved and overdue items and sort, organize and shelve all library materials
• Collect fees, reconcile daily transactions and oversee collection agency accounts
• Coordinate the city’s participation in countywide delivery and return of Serra Cooperative member library materials
• Collect retired flags from deposit boxes and deliver to the city’s Fire Department for proper disposal
• Conduct a regular inventory of the collection
• Maintain accuracy of user records through reports
E-29 COMMUNITY
SERVICES|
Fund: General
2020-21 Actual 2021-22 Actual 2022-23 Budget 2023-24 Budget Personnel Services Salaries & Wages 885,675 $ 876,879 $ 1,006,963 $ 996,633 $ Retirement Benefits 133,425 111,216 99,025 105,755 Health Insurance 53,797 52,396 66,574 69,876 Other Personnel Expenses 24,572 36,227 41,484 40,964 Personnel Services Subtotal 1,097,469 1,076,718 1,214,046 1,213,228 Operating Expenses Professional & Contract Services - - -Supplies & Materials 7,206 5,145 12,500 12,500 Repair & Maintenance - - -Interdepartmental Charges 113,364 143,316 185,231 165,702 Other Operating Expenses - - -Capital Outlay - - -Operating Expenses Subtotal 120,570 148,461 197,731 178,202 TOTAL EXPENDITURES 1,218,039 $ 1,225,179 $ 1,411,777 $ 1,391,430 $ Full Time Positions 4.50 4.50 5.00 5.00 Hourly/FTE Positions 20.68 20.68 20.68 18.30
RECENT ACCOMPLISHMENTS
• Improved the quality of account records by finding and fixing data entry and formatting errors
• Implemented new shelving standards to improve the appearance, accessibility and circulation of the collection
• Improved standards and processes for circulation staff with regular division meetings and new training
• Made processes more flexible and sustainable by adding 4 new mobile circulation units
GOALS
• Cross-train staff in other divisions in circulation processes to reduce the number of account mistakes and to ensure patrons have a universal experience
• Implement the Link+ system that allows users to borrow books from other libraries throughout California
• Update circulation policies and procedures that were changed or suspended during COVID19
E-30
Performance Measure FY 2022 Actual FY 2023 Estimated FY 2024 Projected Circulation of physical items 832,784 898,779 920,681 New library accounts 10,077 12,899 14,000
LIBRARY & CULTURAL ARTS: ADULT & TEEN SERVICES, GENEALOGY & CARLSBAD HISTORY SERVICES
Account: 0014016 0014025
ABOUT
Fund: General
Adult & Teen Services staff assists the public with information needs; locates library materials for patrons; provides instruction on resource use; performs research for the public, local business and government; and provides readers’ advisory assistance.
The Genealogy & Carlsbad History staff provides reference and instructional assistance to patrons researching their ancestry and preserves Carlsbad history materials for public research. The division works closely with the North San Diego County Genealogical Society to provide educational genealogy programs for the community
SERVICES
• Respond to in-person, telephone, email and text reference questions; provide instruction, classes and tours; assist the public with access to digital resources; and administer services to homebound patrons; manage scheduling and use of the study rooms; provide library programs for adults and teens
• Support community outreach activities such as visits to schools, senior centers, farmers’ markets and other community groups
E-31
COMMUNITY SERVICES |
2020-21 Actual 2021-22 Actual 2022-23 Budget 2023-24 Budget Personnel Services Salaries & Wages 1,298,620 $ 1,270,143 $ 1,554,949 $ 1,518,981 $ Retirement Benefits 328,064 269,041 248,689 244,171 Health Insurance 113,439 97,206 117,034 153,298 Other Personnel Expenses 35,963 47,659 57,384 55,616 Personnel Services Subtotal 1,776,086 1,684,049 1,978,056 1,972,066 Operating Expenses Professional & Contract Services - 1,455 3,700 700 Supplies & Materials 7,376 1,754 5,380 5,380 Repair & Maintenance 1,320 1,272 1,345 1,345 Interdepartmental Charges 932,376 1,003,188 1,011,766 1,066,514 Other Operating Expenses - - -Capital Outlay - - -Operating Expenses Subtotal 941,072 1,007,669 1,022,191 1,073,939 TOTAL EXPENDITURES 2,717,158 $ 2,691,718 $ 3,000,247 $ 3,046,005 $ Full Time Positions 11.00 11.00 11.00 12.00 Hourly/FTE Positions 15.35 15.35 14.87 11.90
• Manage the selection and organization of print and digital genealogy and Carlsbad history resources, preserve archival collections and provide instruction and assistance to patrons of all ages researching genealogy or local history
• Coordinate with the North San Diego County Genealogical Society to schedule and provide free educational genealogy programs
• Provide leadership opportunities and community service volunteer hours for teens
RECENT ACCOMPLISHMENTS
• Launched the Job-Readiness Room in partnership with the Innovation & Economic Development Department, the Carlsbad Chamber of Commerce and Bendable, an outside vendor, to connect entry level job seekers to job interviews through a micro-credential online learning platform
• Re-established leadership opportunities for teens by offering volunteer and community service hours during the Summer Reading Adventure
• Hosted six successful author events that focused on local connections and diversity
• Forged and renewed internal and external partnerships in programming and services including the Innovation & Economic Development Department, Carlsbad Unified School District, Senior Center, Carlsbad Community Gardens, Chamber of Commerce, Small Business Development Center and local retirement communities
• Restored pre-COVID-19 programs including the Grow Your Garden series, Books To Go outreach, business workshops, Teen Talent Show and school tours
• Partnered with city departments to host three Fix-it Clinic programs, where community members can bring broken items such as surfboards, bikes, small appliances and clothes and work with local craftspeople for repair
• Expanded the Seed Library with new community partners and seed supplies
• Established a new service to receive and evaluate proposals from the community for programs or services
• Added four new databases for a total of 47 adult and teen eResources
• Worked with partner organization, North San Diego County Genealogical Society, to implement new virtual program hosting software
GOALS
• Work with local partners to offer a small business community workshop series
• Establish a division programming team to give more staff opportunities for professional development
• Develop the architecture to add existing genealogy and Carlsbad history items to the new Digital Asset Management software
• Increase the number of historical documents accessible to the community by 10%
• Create promotional materials to showcase the value of Genealogy & Carlsbad History services to the community
E-32
Performance Measure FY 2022 Actual FY 2023 Estimated FY 2024 Projected Community members reached through outreach N/A 1,200 2,500 Carlsbad genealogy and history research provided to city and community 495 hours 550 hours 595 hours
ABOUT
LIBRARY & CULTURAL ARTS: CHILDREN’S SERVICES
Account: 0014035
Fund: General
The Children’s Services Division supports the educational, literacy, informational, cultural and recreational needs of young patrons from babies through middle school-aged children. Youth-related reference and readers’ advisory services are also offered to parents, caregivers and teachers.
SERVICES
• Develop and present educational programs for children
• Promote literacy and the enjoyment of reading by connecting children with books through personal interactions, programs and development of an age-appropriate collection
• Support digital literacy for children by providing computers with early literacy programs, internet access and educational games as well as remote access to digital databases for homework assistance
• Answer reference questions and assist in using the collection and internet computers for research and homework
• Provide library instruction and tours for children and youth-related groups
• Build community connections through story times, book talks and instructional sessions at local schools and special events throughout the city
E-33
COMMUNITY SERVICES |
2020-21 Actual 2021-22 Actual 2022-23 Budget 2023-24 Budget Personnel Services Salaries & Wages 565,302 $ 525,604 $ 710,926 $ 732,806 $ Retirement Benefits 173,313 144,599 128,812 127,739 Health Insurance 92,324 86,501 129,381 125,418 Other Personnel Expenses 16,692 21,745 27,872 27,857 Personnel Services Subtotal 847,631 778,449 996,991 1,013,820 Operating Expenses Professional & Contract Services - - -Supplies & Materials 770 4,454 2,900 5,223 Repair & Maintenance - - -Interdepartmental Charges 353,532 376,188 339,359 299,294 Other Operating Expenses - - -Capital Outlay - - -Operating Expenses Subtotal 354,302 380,642 342,259 304,517 TOTAL EXPENDITURES 1,201,933 $ 1,159,091 $ 1,339,250 $ 1,318,337 $ Full Time Positions 7.00 7.00 7.00 7.00 Hourly/FTE Positions 5.55 5.55 5.55 5.21
RECENT ACCOMP LISHMENTS
• Expanded the prior pilot program to provide age-appropriate Maker Kits, which cover various STEAM concepts and include a book and activities for patrons to check out and complete at home
• Expanded the amount of in-person programming offered at all three locations
• Improved systemwide story time presentations through staff trainings and story time program standards
• Made the Cole Children’s picture book area more attractive and interactive for children and families by working with the Facilities Department to paint two accent walls, install an art hanging system and install tactile sensory wall tiles
• Increased outreach efforts resulting in a 30% increase in Summer Reading Adventure participation
• Installed a “traveling Story Walk” at four city park locations during the Summer Reading Adventure
GOALS
• Design and implement STEAM exploration and experiences for children and their families in the Leichtag Family Foundation Discovery Room at Dove Library
• Conduct Children’s Services Summits to train all staff on the topics of outreach and collection development
• Reinstate large-scale in-person performances for children and families during the Summer Reading Adventure
• Showcase and promote 1,000 Books Before Kindergarten to weekly program participants
• Promote early literacy services by increasing staff training on Early Literacy Stations
E-34
Performance Measure FY 2022 Actual FY 2023 Estimated FY 2024 Projected 1000 Books Before Kindergarten participants 129 545 650 Summer Reading participants 1,063 1,529 1,900 Early Literacy Station users N/A 8,700 8,900
LIBRARY & CULTURAL ARTS: COLLECTIONS & TECHNICAL SERVICES
Account: 0014040 1454010 1454011
ABOUT
Fund: General Special Revenue-Gifts/Benefits Special Revenue-Friends of the Library
Collections & Technical Services coordinates the selection of physical and electronic materials and manages collection development and maintenance for all library facilities. Staff catalog and prepare library materials for public use, evaluate new content formats, devise new cataloging and processing procedures and evaluate usage patterns for materials.
SERVICES
• Manage the selection of library materials in accordance with collection development policies and industry practices to continue to meet the educational, lifelong learning and entertainment needs of the community
• Source and purchase library materials, in physical and electronic format
• Track the ordering and invoicing of materials, working with department and city staff to ensure timely payment to vendors
• Keep the catalog and collection organized, current, accurate and accessible
• Optimize the location of library materials for the best user experience
E-35
COMMUNITY SERVICES |
2020-21 Actual 2021-22 Actual 2022-23 Budget 2023-24 Budget Personnel Services Salaries & Wages 574,073 $ 591,757 $ 627,402 $ 648,710 $ Retirement Benefits 203,691 157,187 134,592 132,976 Health Insurance 81,715 77,462 81,757 79,887 Other Personnel Expenses 15,183 20,560 24,645 24,372 Personnel Services Subtotal 874,662 846,966 868,396 885,945 Operating Expenses Professional & Contract Services 24,217 35,194 21,825 20,825 Supplies & Materials 816,803 978,176 1,031,564 946,261 Repair & Maintenance - - -Interdepartmental Charges 180,228 191,100 185,284 193,776 Other Operating Expenses 117 - -Capital Outlay - - -Operating Expenses Subtotal 1,021,365 1,204,470 1,238,673 1,160,862 TOTAL EXPENDITURES 1,896,027 $ 2,051,436 $ 2,107,069 $ 2,046,807 $ General Fund 1,833,437 $ 1,980,481 $ 1,933,653 $ 1,878,907 $ Special Revenue Fund 62,590 70,955 173,416 167,900 TOTAL FUNDING 1,896,027 $ 2,051,436 $ 2,107,069 $ 2,046,807 $ Full Time Positions 7.00 7.00 7.00 7.00 Hourly/FTE Positions 2.88 2.88 2.88 2.63
• Broaden access to material outside the city’s collection via Interlibrary loan
• Maintain, track and assess patron use of electronic and physical content to guide purchasing decisions
RECENT ACCOMPLISHMENTS
• Enhanced library collections and metadata in relation to diversity, equity and inclusion to reflect best practices in maintaining a timely, relevant and welcoming collection
• Implemented revisions to the library materials selection process to streamline workflow and staff training
• Supported an increase in community use of eBooks and audiobooks by shifting resources and collections planning
• Improved the purchasing process and library catalog maintenance with newly implemented technology
• Helped patrons find the most relevant materials with new software enhancements that improve search results
• Reassessed and enhanced patrons’ ability to find adult non-fiction materials at the Georgina Cole Library by modifying labeling, shelving locations and database indexing
GOALS
• Perform a scheduled update of the Collection Development Policy to ensure both currency and continuity of high standards in collection management and present it to the Library Board of Trustees
• Create a new distinct graphic novel collection for adults
• Work with Children’s Services staff to better organize children’s materials at each location
• Work with other divisions to finalize changes to the library materials selection structure and process to streamline workflow and staff training
• Implement newly acquired software tools to help patrons find the most relevant materials
E-36
Performance Measure FY 2022 Actual FY 2023 Estimated FY 2024 Projected eBooks and audiobooks selected and added to collection 4,180 4,200 4,300 Physical items selected, cataloged, processed and added to collection 28,686 28,000 29,000
LIBRARY & CULTURAL ARTS: OUTREACH, LITERACY & BILINGUAL SERVICES
ABOUT
The Library Learning Center offers general library programs and services in addition to providing special collections, outreach services and entertaining activities across all ages and stages of language and literacy learning. Bilingual Services, Literacy Services and Outreach & Strategic Partnership personnel collaborate to provide specialized library services and programs focused on language acquisition, learning and community building in English and Spanish.
SERVICES
• Provide access to English, Spanish, bilingual and literacy materials for all ages
• Offer reading and writing help by trained volunteer tutors for English-speaking adults to meet their life goals
• Provide programs, story times, concerts, events and activities for all ages in English, Spanish, and bilingual formats
E-37 COMMUNITY SERVICES |
Account: 001405X, 0014060 145013 145014 145015 145016 Fund: General Special Revenue-Gartner Donation Special Revenue-Benson Donation Special Revenue-Falkenstein Donation Special Revenue-Sutton Donation
2020-21 Actual 2021-22 Actual 2022-23 Budget 2023-24 Budget Personnel Services Salaries & Wages 596,401 $ 670,693 $ 627,418 $ 675,360 $ Retirement Benefits 151,670 135,610 102,926 106,316 Health Insurance 64,202 65,936 51,961 58,436 Other Personnel Expenses 16,865 25,289 23,608 25,734 Personnel Services Subtotal 829,138 897,528 805,913 865,846 Operating Expenses Professional & Contract Services 35,085 37,808 60,960 58,575 Supplies & Materials 104,707 73,611 134,154 177,366 Repair & Maintenance - 908 300 300 Interdepartmental Charges 511,188 573,169 514,681 461,770 Other Operating Expenses 5,824 4,221 -Capital Outlay - - -Operating Expenses Subtotal 656,804 689,717 710,095 698,011 TOTAL EXPENDITURES 1,485,942 $ 1,587,245 $ 1,516,008 $ 1,563,857 $ General Fund 1,404,253 $ 1,520,685 $ 1,294,957 $ 1,268,972 $ Special Revenue Fund 81,689 66,560 221,051 294,885 TOTAL FUNDING 1,485,942 $ 1,587,245 $ 1,516,008 $ 1,563,857 $ Full Time Positions 6.00 6.00 5.00 5.30 Hourly/FTE Positions 9.40 9.00 6.65 6.69
• Facilitate the Homework Zone program, which offers homework assistance to school-age students by volunteers and offer intensive reading help to elementary school-age children
• Manage an accredited Career Online High School diploma program and support students
• Develop partnerships and outreach opportunities to promote community connections and improve services systemwide
RECENT ACCOMPLISHMENTS
• Resumed in-person programs, services and events and continued to offer virtual programs, to be inclusive, equitable and reach the broadest audience possible
• Re-established English as a Second Language classes in partnership with MiraCosta College
• Increased the number of Career Online High School participants
• Renovated the Learning Center’s upstairs public service area for enhanced safety, ergonomics and customer service and procured design for first-floor renovations
• Evaluated the efficacy of digital, virtual and in-person resources for the adult literacy program to rebalance programming to meet adult learners’ needs
• Developed a department-wide outreach and marketing strategy and increased support and partnership with other city departments
• Launched State Parks Pass program in partnership with California State Library and California State Parks, making State Parks passes available to library patrons free of charge
• Distributed over 3,000 free books obtained through community and San Diego Council on Literacy donations at public outreach and Books to Go events
GOALS
• Re-establish a reading tutoring program for elementary students
• Refresh the literacy collection with additional materials emphasizing diverse topics and authors
• Develop new bilingual and Spanish-language family services programs to meet the community’s changing needs
• Collaborate with Cultural Arts to bring public art to the Library Learning Center
• Finalize and adopt a department-wide outreach and marketing strategy
• Increase feedback opportunities for the public through surveys, outreach and input via eNewsletter and website to improve library programs and services
• Increase the number of Career Online High School participants
E-38
Performance Measure FY 2022 Actual FY 2023 Actual FY 2024 Projected Career Online High School enrollments 1 5 6 Bilingual program offerings 32 85 170 Active and current partners N/A 25 28
LIBRARY & CULTURAL ARTS: CULTURAL ARTS
ABOUT
Cultural Arts plans, promotes and carries out visual and performing arts programs, arts education activities, temporary and permanent public art and other cultural offerings to make connections among artists, cultural organizations, community groups, businesses, residents and visitors that sustain and promote a thriving, diverse and creative city, aligned with the Arts & Culture Master Plan.
SERVICES
• Present visual arts exhibitions and performing arts at the Ruby G. Schulman Auditorium, the William D. Cannon Art Gallery and throughout the city
• Create, document and maintain the city’s permanent and temporary public art collection
• Administer the Community Arts Grant program with review by the Arts Commission and participation of community arts stakeholders
• Offer educational programs for all ages and abilities, including Three-Part Art, Pop Up Art and STEAM reaching over 10,000 participants annually
• Host guest artist residencies, spanning all genres, to focus on expanded, interactive arts experiences
E-39
COMMUNITY SERVICES |
Account: 001406X 148 175 Fund: General Special Revenue-Special Events Special Revenue-Schulman Endowment
2020-21 Actual 2021-22 Actual 2022-23 Budget 2023-24 Budget Personnel Services Salaries & Wages 518,223 $ 557,452 $ 1,016,932 $ 828,441 $ Retirement Benefits 140,792 124,424 143,831 134,542 Health Insurance 62,983 58,221 107,831 132,494 Other Personnel Expenses 14,321 19,670 34,463 30,125 Personnel Services Subtotal 736,319 759,767 1,303,057 1,125,602 Operating Expenses Professional & Contract Services 269,178 410,652 629,890 626,622 Supplies & Materials 18,387 52,346 32,554 28,231 Repair & Maintenance 132 - 1,000 3,000 Interdepartmental Charges 72,732 141,265 129,056 133,434 Other Operating Expenses 1,584 - 1,103Capital Outlay - - -Operating Expenses Subtotal 362,013 604,263 793,603 791,287 TOTAL EXPENDITURES 1,098,332 $ 1,364,030 $ 2,096,660 $ 1,916,889 $ General Fund 1,072,885 $ 1,325,710 $ 1,958,910 $ 1,762,139 $ Special Revenue Fund 25,447 38,320 137,750 154,750 TOTAL FUNDING 1,098,332 $ 1,364,030 $ 2,096,660 $ 1,916,889 $ Full Time Positions 5.00 5.00 6.00 6.70 Hourly/FTE Positions 4.38 6.38 7.95 5.78
• Present year-round performing arts series, including TGIF Concerts in the Parks, Showtime at the Schulman and Front Row Saturdays
• Curate a diverse selection of national and international films and documentaries, based on audience feedback, screened in the Schulman Auditorium
• Maintain partnerships with the Carlsbad Friends of the Arts, Carlsbad Library & Arts Foundation and the Chamber of Commerce
RECENT ACCOMPLISHMENTS
• Completed the design phase of the technological upgrade of the Schulman Auditorium, Cannon Art Gallery and the Ann Kulchin Courtyard
• Presented four exhibits in the Cannon Art Gallery, including both local artists and national touring exhibits
• Installed murals at Library Learning Center and the renovated New Village Arts Center
• Curated a new multi-year exhibition in the Carlsbad Sculpture Garden
• Installed the city’s first permanent glass public art at the newly built Fire Station 2
• Maintained partnership with Carlsbad Village Association through temporary art installations pairing local artists with businesses
• Added two new Community Arts Grants categories: two-year grants and emerging artists/organizations, to focus on sustainability and expanded art forms
• Completed inaugural STEAM program with the Batiquitos Lagoon Foundation
• Presented 15 live performances in the Schulman Auditorium with over 3,000 attendees
• Relaunched TGIF Concerts in the Parks series after a two-year hiatus, celebrating its 35th anniversary
• Supported multiple citywide festivals with the mobile stage and Pop-Up Art experiences
• Participated in the national Americans for the Arts Economic Study which documented the impact of arts spending on local, state and national economies
GOALS
• Evaluate progress on Arts & Culture Master Plan initiatives
• Explore launching new Arts & Culture Master Plan initiatives with pilot programs for arts in the workplace and trail art
• Launch new partnership with The Forum and continue the partnership with the Carlsbad Village Association in developing new temporary art experiences
• Finalize plans for public transportation art at the Village & Barrio Traffic Circle and Chestnut Underpass
• Implement technology upgrades for the Schulman Auditorium, Cannon Art Gallery and the Kulchin Courtyard
• Collaborate with Barrio Glassworks to present a glass exhibition in the Cannon Art Gallery
• Initiate public outreach for Veteran’s Memorial Park and Chestnut Underpass public art
• Expand guest artist residencies to include musical theatre for all ages and opera for kids
• Double the number of attendees at STEAM programs in partnership with the Batiquitos Lagoon Foundation
E-40
Performance Measure FY 2022 Actual FY 2023 Estimated FY 2024 Projected Permanent and temporary public art projects completed 6 5 6 Number of Arts & Culture Master Plan Initiatives activated to date (out of 49 total) 15 20 25
PARKS & RECREATION: SUMMARY
E-41
COMMUNITY SERVICES |
PARKS & RECREATION • Administration • Recreation • Parks & Trail Maintenance • Street Tree Maintenance & Median Maintenance • The Crossings Golf Course 2020-21 Actual 2021-22 Actual 2022-23 Budget 2023-24 Budget Personnel Services Salaries & Wages 5,897,102 $ 6,089,417 $ 7,447,323 $ 7,718,770 $ Retirement Benefits 1,572,592 1,352,430 1,273,007 1,264,817 Health Insurance 559,345 570,125 861,278 884,968 Other Personnel Expenses 293,094 447,709 473,268 416,708 Personnel Services Subtotal 8,322,133 8,459,681 10,054,876 10,285,263 Operating Expenses Professional & Contract Services 6,202,333 8,083,942 8,329,905 7,898,331 Supplies & Materials 872,007 972,957 1,166,558 1,055,818 Repair & Maintenance 7,916 3,690 5,020 1,934 Interdepartmental Charges 1,574,949 2,001,854 1,992,582 2,381,739 Other Operating Expenses 8,186,933 9,922,915 10,467,217 11,059,523 Capital Outlay 157,054 112,526 687,500 1,010,000 Operating Expenses Subtotal 17,001,192 21,097,884 22,648,782 23,407,345 TOTAL EXPENDITURES 25,323,325 $ 29,557,565 $ 32,703,658 $ 33,692,608 $ General Fund 16,786,632 $ 19,251,458 $ 21,167,014 $ 21,055,565 $ Enterprise Fund 6,718,515 $ 8,345,328 $ 9,195,000 $ 10,121,000 $ Special Revenue Fund 1,818,178 $ 1,960,779 $ 2,341,644 $ 2,516,043 $ TOTAL FUNDING 25,323,325 $ 29,557,565 $ 32,703,658 $ 33,692,608 $ Full Time Positions 55.00 55.00 59.00 59.00 Hourly/FTE Positions 77.83 80.26 71.56 70.32
PARKS & RECREATION: ADMINISTRATION
Account: 0014510, 0014511
ABOUT
Parks & Recreation Administration provides department leadership, planning and administrative services to help develop and sustain high-quality parks and recreation programs.
SERVICES
• Evaluate and monitor business processes to improve operations, efficiency and performance
• Develop and monitor operating budget and annual CIP budget
• Process and issue citywide special event permits
• Enhance city-owned or controlled natural open space and trails system through land acquisition, planning, trails construction, monitoring and maintenance
• Oversee management agreement for The Crossings at Carlsbad Municipal Golf Course
• Perform parks planning, design, administration and construction monitoring services
• Monitor recreation programs with participant surveys and community outreach
• Administer recreation program scholarships for low-income residents
E-42
COMMUNITY SERVICES |
140 149 Fund: General Special Revenue-Scholarships Special Revenue-Donations
2020-21 Actual 2021-22 Actual 2022-23 Budget 2023-24 Budget Personnel Services Salaries & Wages 1,211,204 $ 1,182,066 $ 1,243,160 $ 1,362,257 $ Retirement Benefits 418,881 345,543 301,822 298,003 Health Insurance 111,366 97,123 141,218 136,778 Other Personnel Expenses 44,584 57,948 57,782 55,203 Personnel Services Subtotal 1,786,035 1,682,680 1,743,982 1,852,241 Operating Expenses Professional & Contract Services 96,004 152,040 251,440 237,997 Supplies & Materials 74,509 35,647 83,877 59,465 Repair & Maintenance 6,430 2,646 300 200 Interdepartmental Charges 206,443 273,804 398,987 302,034 Other Operating Expenses 38,212 50,295 129,583 113,294 Capital Outlay 6,314 - 2,500Operating Expenses Subtotal 427,912 514,432 866,687 712,990 TOTAL EXPENDITURES 2,213,947 $ 2,197,112 $ 2,610,669 $ 2,565,231 $ General Fund 2,187,782 $ 2,158,357 $ 2,529,660 $ 2,484,031 $ Special Revenue Fund 26,165 38,755 81,009 81,200 Total Funding 2,213,947 $ 2,197,112 $ 2,610,669 $ 2,565,231 $ Full Time Positions 11.45 11.30 10.30 10.45 Hourly/FTE Positions 1.36 1.34 0.49 0.98
• Develop, monitor and support the department’s information technology
• Liaise with Parks & Recreation Commission, Senior Commission and Beach Preservation Commission
• Conduct department master and strategic planning
• Address Commission for the Accreditation of Parks and Recreation Agencies accreditation application and training processes
RECENT ACCOMPLISHMENTS
• Completed environmental permitting/entitlements phase for master planning of Veterans Memorial Park
• Received City Council adoption of the final master plan for Veterans Memorial Park
• Received City Council approval to award a design services agreement for master planning Robertson Ranch Community Park
• Checked plans and specifications of new private development projects that include trail construction, street trees and rights of way improvements
• Resumed community engagement workshops and stakeholder meetings, public survey distribution and collection, agency programs and services benchmarking, and fee comparison studies related to the Parks & Recreation Department Master Plan Update
• Field verified park inventories for the Parks & Recreation Department Master Plan Update
• Completed Parks & Recreation Department master plan update statistically reliable survey and presented draft findings to Commissions and City Council
• Supported the Fleet & Facilities Department in pursuing the development of plans and specifications for the Monroe Street Pool Renovation and Replacement Project, including presentations to the Parks & Recreation Commission and the City Council
• Assisted in administering a mobile application to enhance citywide trails use
• Permitted successful return of the Carlsbad Marathon, Half Marathon & 5K
GOALS
• Obtain City Council approval to formally bid panned improvements for Veterans Memorial Park
• Obtain City Council approval to award a contract to construct Veterans Memorial Park improvements
• Support Library and Cultural Services staff with the selection of an artist for the public art component at Veterans Memorial Park
• Support three commissions in accomplishing the goals and tasks within each work plan
• Continue to provide support to the Monroe Street Pool Renovation/Replacement Project
E-43
PARKS & RECREATION: RECREATION
Account: 0014520-44, 0014546-73 143
Fund: General Special Revenue-Senior Program Donations
ABOUT
The Parks & Recreation Department offers a wide range of virtual and in-person programming, including youth and adult sports, instructional classes, camps, aquatics, preschool and teen services, and special events. The department operates 339 acres of developed community parks and special use areas, featuring multi-use fields, tennis courts, dog parks, skate parks, playgrounds, two historic parks, a senior center, four multigenerational community centers and two aquatic centers.
SERVICES
• Provide information, enrollment and registration services for parks, programs and facilities
• Collect and account for revenue to ensure efficient and cost-effective programming
• Plan, conduct and supervise recreation operations and programs at community centers, parks and other city facilities
• Process applications and issue park and facility use permits
• Coordinate and oversee fair and efficient use of athletic facilities for resident nonprofit sports organizations
• Conduct cultural and historic park educational and interpretive programming
E-44
COMMUNITY SERVICES |
2020-21 Actual 2021-22 Actual 2022-23 Budget 2023-24 Budget Personnel Services Salaries & Wages 2,967,030 $ 3,300,657 $ 4,174,164 $ 4,213,335 $ Retirement Benefits 550,229 506,958 499,474 505,714 Health Insurance 187,990 234,414 360,427 380,054 Other Personnel Expenses 172,287 282,861 296,721 254,252 Personnel Services Subtotal 3,877,536 4,324,890 5,330,786 5,353,355 Operating Expenses Professional & Contract Services 527,056 986,954 1,080,852 1,018,937 Supplies & Materials 565,230 612,621 655,625 633,709 Repair & Maintenance 1,007 433 4,220 1,354 Interdepartmental Charges 972,541 1,119,399 1,091,629 1,405,334 Other Operating Expenses 437,488 605,327 506,528 513,076 Capital Outlay 927 28,974 -Operating Expenses Subtotal 2,504,249 3,353,708 3,338,854 3,572,410 TOTAL EXPENDITURES 6,381,785 $ 7,678,598 $ 8,669,640 $ 8,925,765 $ General Fund 6,376,418 $ 7,640,802 $ 8,619,140 $ 8,892,265 $ Special Revenue Fund 5,367 37,796 50,500 33,500 Total Funding 6,381,785 $ 7,678,598 $ 8,669,640 $ 8,925,765 $ Full Time Positions 19.25 19.40 24.40 24.30 Hourly/FTE Positions 71.84 74.28 66.44 64.71
• Serve as a certification site for aquatics training programs through the American Red Cross
• Provide programs that promote health and wellness and essential childhood development
• Arrange classes, seminars, transportation and professional services for seniors
• Arrange intergenerational programs that increase cooperation and interaction
• Provide congregate and home meals to seniors at little or no cost
• Recruit and manage volunteers supporting the Senior Center, Leo Carrillo Ranch, trails and special events
RECENT ACCOMPLISHMENTS
• Began the design and fabrication process of a new interpretive exhibit at Leo Carrillo Ranch Historic Park focusing on the Carrillo family life
• Co-administered the Leo Carrillo Ranch Historic Park preservation and maintenance reroofing project
• Returned the Monroe Street Pool to regular weekday operating hours based on sustained lifeguard staffing levels
• Held 11 lifeguard academies with a total of 70 participants and hired 40+ lifeguard staff
• Added year around youth basketball leagues for grades K-12
• Implemented partnership with Teri, Inc. to provide inclusion services for persons with disabilities
• Implemented municipal sustainability rollout related to a ban on single use utensils and organics/food scrap recycling
• Returned teen programming to the Pine Avenue Community Park Community Center with the Youth Enrichment Services Community Resources Fair, Masked Night Out Event, Amped Music and Arts Throwdown Event, and Teen Masterminds Club
• Received Green Certification for Pine Avenue Community Park Community Center from the City of Carlsbad Green Business Program and became a member of the California Green Business Network
GOALS
• Accommodate demand for the Senior Nutrition Meal Program due to COVID-19 impacts
• Expand adult 50+ opportunities and collaborations beyond the Senior Center
• Offer programs that promote health and wellness and essential childhood development
• Augment staff with volunteers to build community and enhance fiscal stewardship
• Collaborate with the Friends of Carrillo Ranch to plan, design and implement a new interpretive exhibit at Leo Carrillo Ranch
• Begin implementation of the department’s master plan actions related to services, programs, events and fees
• Utilize 10,000 hours of volunteer service to support recreation programs
• Execute 85% of advertised recreation programs
E-45
Performance Measure FY 2022 Actual FY 2023 Estimated FY 2024 Projected Hours of Volunteer Services u sed 21,009 23,000 25,000 Advertised programs executed 80% 85% 85%
ABOUT
PARKS & RECREATION: PARKS & TRAIL MAINTENANCE
Account: 00146XX
Fund: General
The Parks & Recreation Department maintains approximately 432 acres of developed or scheduled to be constructed community parks and special use areas, 51 miles of trails, 612 acres of habitat preserves, urban forests and undeveloped lands, and landscaping for 58 acres of facilities.
SERVICES
• Manage turf, irrigation, drainage and landscaping at parks, civic facilities, beach accesses, and school athletic fields
• Inspect and maintain restroom facilities and picnic areas
• Inspect and maintain playgrounds, tennis and basketball courts, soccer, softball, baseball, and multi-purpose fields
• Repair park structures, athletic field lighting, play equipment and other park fixtures
• Inspect and prune all city trees on a 4 to 4.5-year cycle and a 2 to 2.25-year supplemental cycle for high-maintenance trees in accordance with Community Forest Management Plan
• Maintain existing citywide trails and coordinate development of new trails
• Manage the trails volunteers’ program
• Oversee maintenance and monitoring of preserves, urban forests and undeveloped lands
• Coordinate coastal activities with the California Department of Parks & Recreation, California Coastal Commission and lagoon foundations
E-46
COMMUNITY SERVICES |
2020-21 Actual 2021-22 Actual 2022-23 Budget 2023-24 Budget Personnel Services Salaries & Wages 1,338,219 $ 1,319,697 $ 1,677,798 $ 1,660,400 $ Retirement Benefits 469,644 393,130 388,440 358,885 Health Insurance 219,414 206,498 315,806 303,804 Other Personnel Expenses 59,681 84,245 98,784 83,384 Personnel Services Subtotal 2,086,958 2,003,570 2,480,828 2,406,473 Operating Expenses Professional & Contract Services 4,413,623 5,334,510 5,386,863 5,024,647 Supplies & Materials 211,169 313,206 381,834 317,422 Repair & Maintenance 479 607 500 380 Interdepartmental Charges 417,762 533,581 508,083 663,194 Other Operating Expenses 1,086,771 1,257,498 1,260,106 1,267,153 Capital Outlay 5,670 9,327 -Operating Expenses Subtotal 6,135,474 7,448,729 7,537,386 7,272,796 TOTAL EXPENDITURES 8,222,432 $ 9,452,299 $ 10,018,214 $ 9,679,269 $ Full Time Positions 19.45 19.45 20.40 19.40 Hourly/FTE Positions 3.10 3.10 3.85 3.10
RECENT ACCOMPLISHMENTS
• Resurfaced outdoor basketball courts at Stagecoach and Calavera Hills Community Park
• Resurfaced outdoor tennis courts at La Costa Canyon Community Park
• Resurfaced blockhouse restrooms floors at Aviara, Hidden Canyon, La Costa Canyon and Laguna Riviera Community Parks
• Applied clear coat on playground surfacing at select parks to enhance UV protection
• Inspected and pruned city parks, facilities and trails trees on a 4-4.5-year cycle, and a 2-to2.25-year supplemental cycle for high maintenance trees
• Planted parks and trails trees within vacancies created by prior removals and planted new parks and trails trees in accordance with the Community Forest Management Plan
• Performed sports lighting maintenance and enhancements at several community parks
• Retrofitted light fixtures on pathway lights at Holiday Park to energy efficient LED fixtures
• Repaired segments of Lake Calavera Trails with heavy equipment and erosion control measures
• Executed a North Beach clean -up event with the Beach Preservation Commission
• Reused mulch generated at city parks and city facilities on city landscape
• Commenced administration of new maintenance services agreement for Work Category F, Undeveloped Park Site, Urban Forests and Trailheads/Planters
• Assumed ongoing maintenance and operations of the Poinsettia Community Park Phase IV Improvements, including a new Dog Park, parking lot and restroom facility
GOALS
• Inspect and prune city parks, facilities and trails trees on a 4 to 4.5-year cycle, and a 2 to 2.25-year supplemental cycle for high maintenance trees
• Add 500 total trees to the city’s inventory, including trees within parks, facilities and trails, in accordance with City Council-adopted Community Forest Management Plan
• Plant parks and trails trees within vacancies created by prior removals in accordance with the Community Forest Management Plan
• Execute two North Beach clean-up events with the Beach Preservation Commission
• Reuse 95% of mulch generated at city parks at city facilities
• Increase number of recycling receptacles at park and trail facilities by 10%
E-47
Performance Measure FY 2022 Actual FY 2023 Estimated FY 2024 Projected Mulch generated in parks reused 95% 95% 95% Increase in number of recycling receptacles at parks and trails 9% 10% 10%
PARKS & RECREATION: STREET TREE & MEDIAN MAINTENANCE
ABOUT
The Street Tree Maintenance Assessment District provides maintenance to all city-accepted street trees within the public right-of-way, including specialized maintenance for street trees in the Downtown Carlsbad Village area.
The Median Maintenance Assessment District provides landscape and irrigation maintenance for approximately 68 acres of median planters and nine acres of developed parkways and streetscapes, including the Downtown Carlsbad Village area.
SERVICES
• Inspect and prune all city trees on a 4 to 4.5-year cycle and a 2 to 2.25-year supplemental cycle for high maintenance trees
• Respond to street tree service requests and provide storm and emergency assistance as necessary
• Refine, support, administer and inspect the tree maintenance block pruning program
• Plant street trees and median trees within vacancies created by prior removals in accordance with the Community Forest Management Plan
E-48
COMMUNITY SERVICES |
Special Revenue Special Revenue
Account: 160 161 Fund:
2020-21 Actual 2021-22 Actual 2022-23 Budget 2023-24 Budget Personnel Services Salaries & Wages 380,649 $ 286,997 $ 352,201 $ 482,778 $ Retirement Benefits 133,838 106,799 83,271 102,215 Health Insurance 40,575 32,090 43,827 64,332 Other Personnel Expenses 16,542 22,655 19,981 23,869 Personnel Services Subtotal 571,604 448,541 499,280 673,194 Operating Expenses Professional & Contract Services 870,627 1,033,880 1,299,750 1,299,750 Supplies & Materials 21,099 11,483 45,222 45,222 Repair & Maintenance - 4 -Interdepartmental Charges (21,797) 75,070 (6,117) 11,177 Other Operating Expenses 345,113 315,250 372,000 372,000 Capital Outlay - - -Operating Expenses Subtotal 1,215,042 1,435,687 1,710,855 1,728,149 TOTAL EXPENDITURES 1,786,646 $ 1,884,228 $ 2,210,135 $ 2,401,343 $ Full Time Positions 4.45 4.85 3.90 4.85 Hourly/FTE Positions 1.53 1.53 0.78 1.53
• Perform plan checks, conduct inspections and assume maintenance responsibility for street trees of development projects or ensure a street tree maintenance agreement is executed and recorded by the developer
• Administer and oversee landscape and irrigation maintenance for all city median planters and developed parkways and streetscapes, including litter control, weed abatement, pruning, shrub and tree refurbishment and irrigation repairs
• Perform plan checks, conduct inspections and assume maintenance responsibility for medians and parkways constructed from city capital improvement projects and private development, or ensure a median and parkway maintenance agreement is executed and recorded by the developer
RECENT ACCOMPLISHMENTS
• Inspected and pruned city street trees and median trees on a 4 to 4.5-year cycle and a 2 to 2.25-year supplemental cycle for high maintenance trees
• Responded to approximately 600 street tree service requests and provided storm and emergency assistance as necessary
• Plan checked, inspected and assumed maintenance responsibility of street trees of development projects or ensured a street tree maintenance agreement was executed and recorded by developer
• Administered and oversaw landscape and irrigation maintenance for all city median planters and developed parkways and streetscapes
GOALS
• Respond to tree service requests and provide storm and emergency assistance as necessary
• Refine, support, administer and inspect tree maintenance block pruning program
• Inspect and prune streets and medians trees on a 4 to 4.5-year cycle and a 2 to 2.25-year supplemental cycle for high maintenance trees
• Add 500 total trees to the city’s inventory, including those within street rights-of-way and medians, in accordance with City Council-adopted Community Forest Management Plan
• Administer and oversee landscape and irrigation maintenance for all city median planters and developed parkways
• Inspect 5,000 trees for pruning
• Increase number of recycling receptacles within the Downtown Village and Northern Beach Streetscapes by 10% to support waste diversion objectives
E-49
Performance Measure FY 2022 Actual FY 2023 Estimated FY 2024 Projected Street trees inspected for pruning 5,060 5,587 5,000 Increase in number of recycling receptacles within Downtown Village and Northern Beach Streetscapes 8% 12% 10%
PARKS & RECREATION: THE CROSSINGS AT CARLSBAD MUNICIPAL GOLF COURSE
Account: 572
ABOUT
Fund: Enterprise
The Crossings at Carlsbad Municipal Golf Course is an 18-hole municipal golf course and event facility. Amenities for public use include a 6,835-yard championship golf course, a clubhouse complete with a golf shop, players’ lounge, sunset patio, banquet facilities, fireplace lit dining room, full-service kitchen, outdoor deck with ocean views, and three miles of hiking trails that connect to Veterans Memorial Park. JC Management, Inc. manages this facility via an agreement with the Carlsbad Public Financing Authority.
SERVICES
• Administer management and operations agreement with JC Management, Inc.
• Maintain and renovate golf and non-golf turf, landscaping, drainage and irrigation systems
• Maintain and repair clubhouse, snack bar, restrooms and picnic areas available for patrons
• Oversee food and beverage services at the players’ lounge, sunset patio, Canyons Restaurant and snack bar
• Manage sales and marketing for golf and non-golf activities, special events, banquets, weddings and other gatherings
• Train and oversee marshals, greeters and assistants servicing the course and clubhouse
RECENT ACCOMPLISHMENTS
• Enhanced wedding offerings by completing the conversion of an existing storage room into a groom preparation suite
• Enhanced wedding and banquet opportunities with the design and construction of an event patio outside the front entrance to the clubhouse and adjacent to the new bridal suite
• Performed planned replacement of duplex sewer tank and pump station at the snack bar restrooms
E-50 COMMUNITY
SERVICES |
2020-21 Actual 2021-22 Actual 2022-23 Budget 2023-24 Budget Operating Expenses Professional & Contract Services 295,023 $ 576,558 $ 311,000 $ 317,000 $ Supplies & Materials - - -Repair & Maintenance - - -Interdepartmental Charges - - -Other Operating Expenses 6,279,349 7,694,545 8,199,000 8,794,000 Capital Outlay 144,143 74,225 685,000 1,010,000 Operating Expenses Subtotal 6,718,515 8,345,328 9,195,000 10,121,000 TOTAL EXPENDITURES 6,718,515 $ 8,345,328 $ 9,195,000 $ 10,121,000 $ Full Time Positions 0.00 0.00 0.00 0.00 Hourly/FTE Positions 0.00 0.00 0.00 0.00
• Completed planned maintenance of the golf course parking lot including slurry and striping which maintains the parking lot and enhances the overall experience at the facility
• Completed planned cart path maintenance to remove deviations at multiple areas of the property
• Replaced multiple pieces of kitchen equipment to ensure staff provide guests consistent/fresh products
• Arranged for permitting, fabrication and installation of wayfinding banners on street light poles at The Crossings Drive and Palomar Airport Road to improve visibility of the course and restaurant
• Continued implementation of water conservation and turf replacement plan for areas out of play along Palomar Airport Road
• Tilled and replenished sand and improved drainage in selective green -side bunkers
• Improved drainage on select fairways and greens
• Ordered, received and deployed the scheduled replacement of the lithium battery operated golf cart fleet and ancillary cart fleet
• Ordered, received and replaced designated maintenance vehicles, carts and riding equipment
GOALS
• Ensure the pace of play is under five hours per round of golf, via staff educating and expediting patrons, and meet pace of play goal on at least 90% of rounds played
• Execute a Capital Improvement Plan with projects that have an anticipated return on investment or are needed for maintenance effectiveness or safety considerations
• Enhance wedding and banquet opportunities with the design and construction of upgrades to the westside patio
• Initiate design and permitting of entertainment bays at the driving range for an elevated experience of patrons
• Improve guest experience and facility appearance by replacing original patio furniture on the Canyon’s Restaurant Patio
• Upgrade multiple pieces of kitchen equipment to improve restaurant efficiency, increase employee enjoyment and contribute to enticing menu items
• Order and replace designated maintenance vehicles, carts and riding equipment
• Till, replenish sand and improve drainage in selective green -side bunkers
• Replace carpeting within the clubhouse golf shop and offices
• Design a permanent structure at the Starter area to improve overall employee/guest experience and property aesthetics
• Renovate and replenish planter areas around the clubhouse and other areas of the golf course
• Increase number of banquets and receptions by 2% over fiscal year 2022-23, after substantial increases in such events during the past two fiscal years as a rebound from the effects of COVID-19
E-51
Performance Measure FY 2022 Actual FY 2023 Estimated FY 2024 Projected Golf rounds that met pacing goal 91% 91% 90% Increase in number of banquets and receptions hosted -23% 20% 2%
E-52
ADMINISTRATIVE SERVICES
Administrative Services is a transparent, innovative and efficient support services branch that is accountable for the assets entrusted to it. The branch, comprised of finance, human resources and risk management, innovation & economic development, information technology, and internal audit provides related services to city staff and the public as well as promotes a strong local economy.

Our employees work together to add value to organizational processes, provide timely and reliable service to our community and business partners, and find creative solutions to problems while protecting our assets. Key roles also include attracting and retaining a talented and engaged city workforce and ensuring the economic vitality of the city.
Laura Rocha Deputy City Manager, Administrative Services
442-339-2430
laura.rocha@carlsbadca.gov
F-1
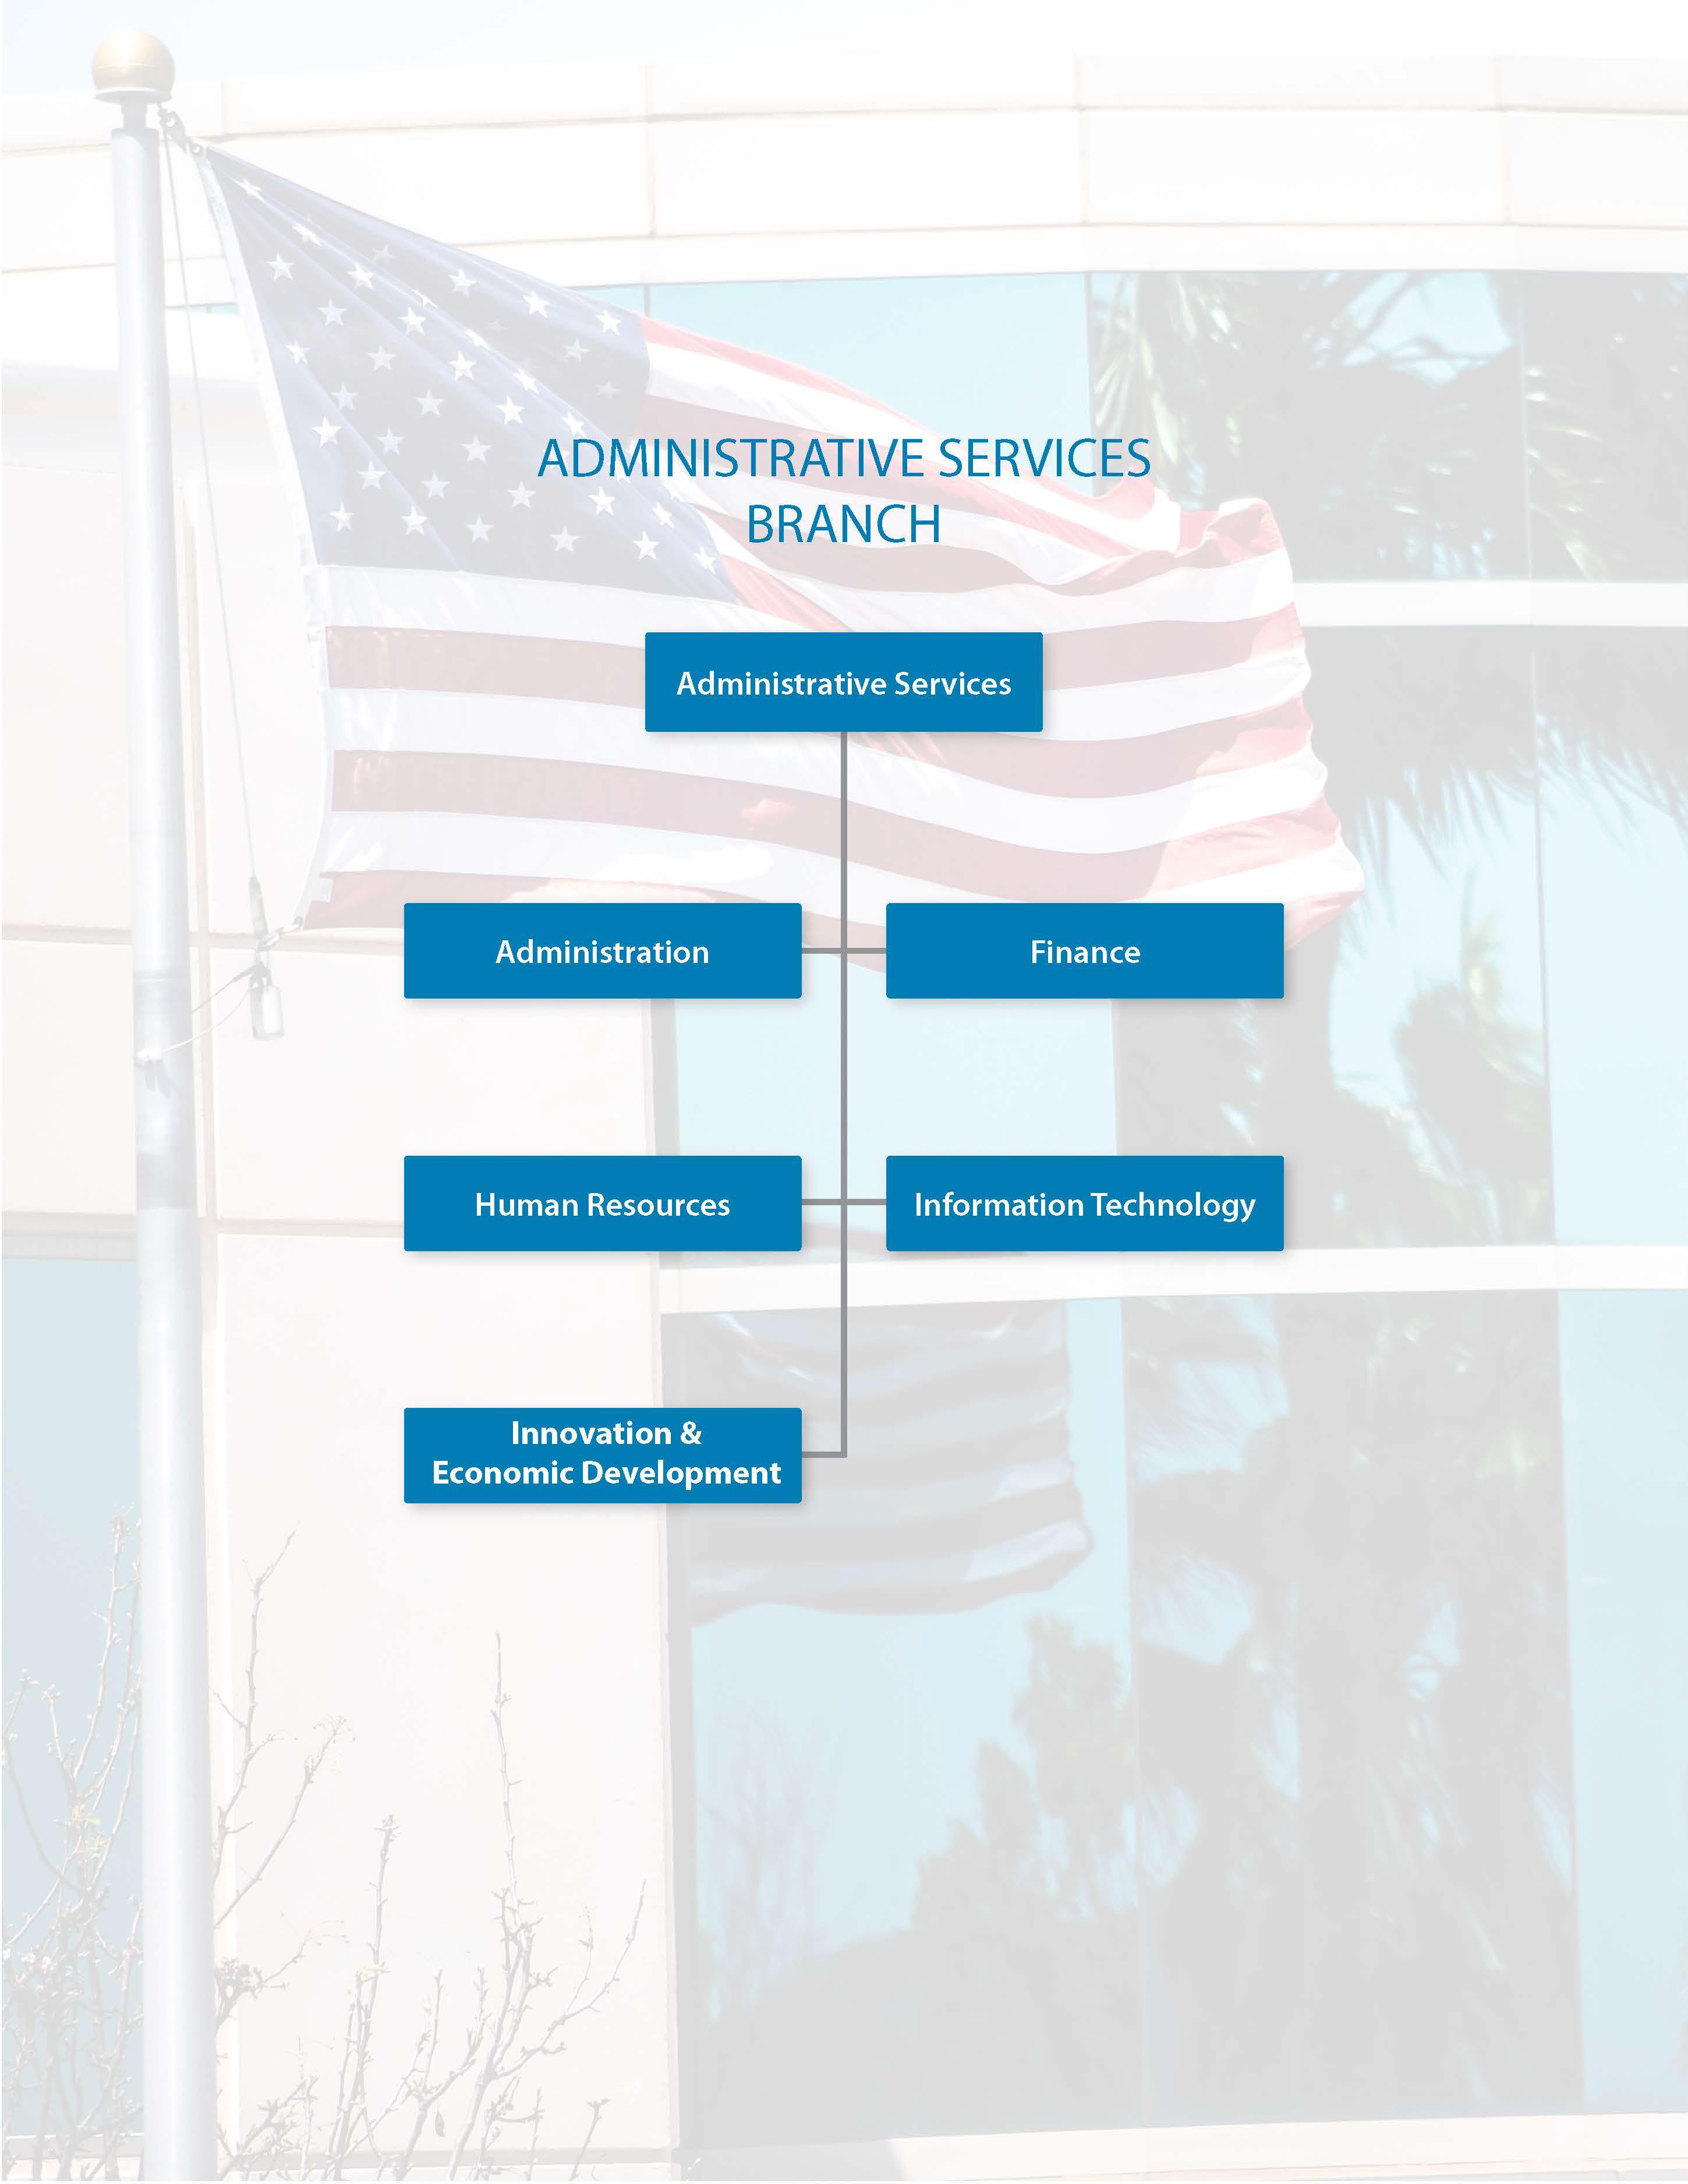
ADMINISTRATIVE SERVICES | ADMINISTRATION
Account: 0011110
ABOUT
Fund: General
Administrative Services Administration provides financial, analytical, budget, strategic and administrative support to the Administrative Services Branch and organization.
SERVICES
• Provide branch leadership and strategic support, long-range financial management and budget oversight, internal audit, contract administration, and records management
RECENT ACCOMPLISHMENTS
• Recommended a strategically balanced budget, maintaining City Council approved reserve levels
• Developed internal audit plan for fiscal year 2022-23 comprised of value-add audit engagements including an audit of the city’s transient occupancy tax revenues and an evaluation of the city’s management of employee access to its business enterprise systems
• Implemented a fraud and ethics hotline for use by city employees which serves as a tool that enables employees to report concerns regarding possible cases of fraud, waste or abuse of city resources
F-3
2020-21 Actual 2021-22 Actual 2022-23 Budget 2023-24 Budget Personnel Services Salaries & Wages - $ 450,490 $ 475,970 $ 503,810 $ Retirement Benefits - 118,051 114,312 113,580 Health Insurance - 44,414 48,747 47,717 Other Personnel Expenses - 12,215 14,411 14,256 Personnel Services Subtotal - 625,170 653,440 679,363 Operating Expenses Professional & Contract Services - 21,450 30,000 30,000 Supplies & Materials - 7,448 9,790 6,550 Repair & Maintenance - - 100 50 Interdepartmental Charges - 45,444 45,407 62,794 Other Operating Expenses - 7,044 9,060 5,350 Capital Outlay - - -Operating Expenses Subtotal - 81,386 94,357 104,744 TOTAL EXPENDITURES - $ 706,556 $ 747,797 $ 784,107 $ Full Time Positions 0.00 3.00 3.00 3.00 Hourly/FTE Positions 0.00 0.50 0.70 0.70
GOALS
• Ensure the city’s short and long-term financial status is healthy and sound
• Work with city leadership and City Council to develop plans for addressing any forecast shortfalls in funding for operations and infrastructure
• Evaluate opportunities for bond refinancing that will result in savings
• Enhance transparency, accountability and integrity in operational areas using innovation and technology to streamline procedures and processes
F-4
Performance Measure FY 2022 Actual FY 2023 Estimated FY 2024 Projected Delivery of value-added internal audit engagements 2 4 4
ADMINISTRATIVE SERVICES | FINANCE
Account: 0011310
ABOUT
Fund: General
As a steward of the city’s assets and liabilities, the Finance Department sets and implements a strategic financial management plan and provides information in an effective and timely manner, ensuring the city makes sound financial decisions.
SERVICES
• Oversee the city budget and long-range financial planning
• Monitor the economy closely and continuously update the city’s Ten-Year Financial Forecast to ensure the General Fund remains in balance throughout the year
• Present quarterly financial updates to the City Council
• Provide general accounting and reporting
• Support treasury administration
• Manage debt, cashiering, purchasing, utility billing and business licensing
• Process payroll and payments
• Manage receiving, messenger and mail services
RECENT ACCOMPLISHMENTS
• Completed the mid-year budget review process, which identified budget savings and allowed the City Council to direct these funds to support its goals
• Upgraded the city’s current financial information system to the latest platform
F-5
2020-21 Actual 2021-22 Actual 2022-23 Budget 2023-24 Budget Personnel Services Salaries & Wages 2,813,045 $ 2,426,807 $ 2,381,968 $ 2,502,791 $ Retirement Benefits 952,788 716,699 595,494 557,662 Health Insurance 390,664 365,511 412,860 439,855 Other Personnel Expenses 74,318 77,450 83,476 80,739 Personnel Services Subtotal 4,230,815 3,586,467 3,473,798 3,581,047 Operating Expenses Professional & Contract Services 757,573 1,086,675 910,940 781,180 Supplies & Materials 217,738 216,122 294,320 288,405 Repair & Maintenance 7,678 8,858 13,975 33,850 Interdepartmental Charges 421,112 480,121 706,753 588,661 Other Operating Expenses 175,947 244,851 72,390 50,225 Capital Outlay - - -Operating Expenses Subtotal 1,580,048 2,036,627 1,998,378 1,742,321 TOTAL EXPENDITURES 5,810,863 $ 5,623,094 $ 5,472,176 $ 5,323,368 $ Full Time Positions 31.00 28.00 26.00 26.00 Hourly/FTE Positions 3.50 3.00 3.00 3.00
• Completed the Master Fee Schedule update
• Completed FEMA reimbursement submission and required reporting for various COVID-19related grants, including the American Rescue Plan Act State and Local Fiscal Recovery Funds
• Completed implementation of new accounting guidance for lease accounting under GASB 87
• Started implementation of new accounting guidance for subscription-based information technology agreements under GASB 96 which is scheduled for completion in July 2023
• Maintained a balanced operating budget and submitted a balanced budget to City Council for fiscal year 2023-24
• Assisted in the negotiation process for three of the city’s bargaining units, the Carlsbad City Employees Association, the Carlsbad Firefighters Association and the Carlsbad Police Officers Association
• Assisted with program-specific external audits including Utilities, Public Works and Police
• Adopted a cost recovery policy
• Adopted an updated travel policy and implemented a new digital reimbursement form and process
GOALS
• Continue to monitor the economy and its impact to the Ten-Year Forecast to ensure the General Fund remains in balance
• Continue to improve procedures to mitigate risk through additional controls in payables process
• Complete an updated cost allocation plan
• Establish a Section 115 Pension Trust
• Implement several modules in the city’s financial information system to increase efficiency and enhance internal controls, including budgeting and contract management
• Continue supporting program-specific audit requests for funding the city receives
• Complete implementation and maintenance and GASB 96
• Expand the use of electronic bidding to increase efficiencies in the procurement process
• Continue working with IT and Human Resources to develop a strategic plan for future technology system consolidations
F-6
Performance Measure FY2022 Actual FY 2023 Estimated FY 2024 Projected General Fund Reserve Ratio 61% 59% 59% Credit rating AAA AAA AAA
ADMINISTRATIVE SERVICES |
HUMAN RESOURCES: SUMMARY HUMAN
F-7
RESOURCES • Human Resources • Risk Management • Workers’ Compensation 2020-21 Actual 2021-22 Actual 2022-23 Budget 2023-24 Budget Personnel Services Salaries & Wages 1,859,530 $ 2,022,816 $ 2,226,427 $ 2,377,979 $ Retirement Benefits 598,304 526,140 522,408 508,803 Health Insurance 174,905 177,829 218,572 214,590 Other Personnel Expenses 27,662 (26,365) 71,844 69,943 Personnel Services Subtotal 2,660,401 2,700,420 3,039,251 3,171,315 Operating Expenses Professional & Contract Services 3,594,989 4,636,313 5,009,864 6,634,670 Supplies & Materials 105,691 86,264 100,174 87,605 Repair & Maintenance - - -Interdepartmental Charges 249,648 355,416 351,220 428,749 Other Operating Expenses 5,666,592 8,109,713 5,051,850 6,583,780 Capital Outlay - - -Operating Expenses Subtotal 9,616,920 13,187,706 10,513,108 13,734,804 TOTAL EXPENDITURES 12,277,321 $ 15,888,126 $ 13,552,359 $ 16,906,119 $ General Fund 4,359,159 $ 4,388,148 $ 5,264,775 $ 5,029,995 $ Internal Service Fund 7,918,162 $ 11,499,978 $ 8,287,584 $ 11,876,124 $ TOTAL FUNDING 12,277,321 $ 15,888,126 $ 13,552,359 $ 16,906,119 $ Full Time Positions 17.00 17.00 18.00 18.00 Hourly/FTE Positions 2.20 2.20 2.20 2.20
ADMINISTRATIVE SERVICES |
HUMAN RESOURCES: HUMAN RESOURCES
Account: 00115XX
ABOUT
Fund: General
The Human Resources Department provides services for the employees of the city so they can provide the highest level of service to the public. The responsibilities of the department serve to support the creation of a high-performance work culture that can carry out the vision for the organization as defined by the City Council and the City Manager. The primary objectives are achieving compliance with federal and state mandates, making process improvements to increase efficiency and effectiveness and helping the city remain resilient while delivering exceptional service.
SERVICES
• Monitor and maintain employment compliance
• Manage recruitment, retention and onboarding, including the diversity outreach, internship and Department of Defense SkillBridge programs
• Provide citywide support to departments regarding workforce planning
• Manage employee engagement, learning and development programs
• Manage employee relations, investigations and labor relations
• Conduct classification studies
• Maintain competitive and equitable compensation structures
• Manage employee benefits and personnel actions
• Administer leaves of absence and workplace accommodations
• Develop and maintain diversity, equity and inclusion program to include training, cultural and educational engagement opportunities for staff
F-8
2020-21 Actual 2021-22 Actual 2022-23 Budget 2023-24 Budget Personnel Services Salaries & Wages 1,537,269 $ 1,731,710 $ 1,924,419 $ 1,886,363 $ Retirement Benefits 492,744 440,024 446,332 400,483 Health Insurance 131,789 133,880 163,101 139,356 Other Personnel Expenses 38,766 49,124 61,483 55,623 Personnel Services Subtotal 2,200,568 2,354,738 2,595,335 2,481,825 Operating Expenses Professional & Contract Services 1,385,821 1,301,387 1,707,864 1,550,170 Supplies & Materials 101,202 82,280 95,174 82,605 Repair & Maintenance - - -Interdepartmental Charges 238,056 331,512 315,252 379,315 Other Operating Expenses 433,512 318,231 551,150 536,080 Capital Outlay - - -Operating Expenses Subtotal 2,158,591 2,033,410 2,669,440 2,548,170 TOTAL EXPENDITURES 4,359,159 $ 4,388,148 $ 5,264,775 $ 5,029,995 $ Full Time Positions 14.00 14.00 15.00 14.00 Hourly/FTE Positions 2.20 2.20 2.20 2.20
RECENT ACCOMPLISHMENTS
• Provided all mandated training to employees to remain compliant with state and federal law
• Offered classes and leadership academies to support the organization’s learning needs and professional growth
• Processed over 5,500 job applications in fiscal year 2022-23
• Filled over 354 vacant full-time and part-time positions in fiscal year 2022-23
• Completed 83 full-time promotions in fiscal year 2022-23
• Conducted multiple executive recruitments without the use of independent contractors, resulting in estimated $140,000 cost avoidance
• Conducted negotiations for new labor contracts with the Carlsbad Firefighters’ Association and Carlsbad City Employees’ Association
• Partnered with over 30 San Diego organizations for City of Carlsbad job postings to support the diversity outreach program
• Updated the Peer Advisor Liaison program for new employees
• Met and conferred with bargaining units on multiple HR related policies and laws
• Implemented Catastrophic Leave Donation and Equal Employment Opportunity programs
• Negotiated with vendors to provide lower-cost and enhanced-no-cost employee benefits
• Collaborated with North Zone Fire agencies to share cost of job analyses for Fire Engineer, Captain and Battalion Chief positions to validate promotional assessment process
• Worked with Fire Department to create a program designed to prepare part time EMTs to be eligible to apply for full time EMT and then, as a career path, an opportunity to compete for vacant Paramedic Firefighter positions
GOALS
• Maintain 100% compliance for legally mandated employee training
• Maintain a voluntary turnover rate of 10% or less
• Develop new Let’s Connect program for performance management
• Enhance the Diversity, Equity & Inclusion program; expand professional development and enrichment opportunities
• Use SkillBridge program in partnership with the Department of Defense to provide career transition opportunities for those transitioning out of military service
• Implement new or updated employment and labor compliance policies
• Negotiate MOU re-opener with Carlsbad Police Officers’ Association
• Review employee benefits to maintain compliance and industry standards
• Establish an employee wellness program
• Review compensation structure to maintain market competitiveness and increase retention
• Use data analytics in all program areas
• Expand social media outreach for recruitments
• Collaborate with other North Zone fire agencies annually to conduct joint promotional assessments to save time and money and improve processes
F-9
Performance Measure FY 2022 Actual FY 2023 Actual FY 2024 Estimated Voluntary turnover rate 4% 8% 6% Legally mandated employee training compliance rate 100% 100% 100%
ADMINISTRATIVE SERVICES |
HUMAN RESOURCES: RISK MANAGEMENT
Account: 6121930
ABOUT
Fund: Internal Service
Risk Management administers funding of the self-insured and insured portions of the city’s liability insurance program which helps protect the city’s financial interests. Risk Management works closely with the City Attorney’s Office and outside legal counsel to monitor, control and resolve litigated claims. Risk Management also works to recover monetary losses to city property caused by the negligence of third parties. The risk manager serves as the city’s Americans with Disabilities Act Coordinator and assists with ongoing efforts of the city to comply with Title II of the ADA. Additionally, Risk Management oversees the city’s safety compliance program.
SERVICES
• Manage all liability claims received by the city
• Collaborate and resolve all risk management-related litigation with the City Attorney’s Office
• Pursue loss recovery and manage loss prevention program for employee-related losses
• Evaluate and provide advice regarding insurance purchases
• Manage subrogation of third-party damage to city assets
• Monitor compliance related to insurance requirements for all citywide independent contractors
• Manage the citywide Safety Program (injury prevention and Cal-OSHA compliance)
F-10
2020-21 Actual 2021-22 Actual 2022-23 Budget 2023-24 Budget Personnel Services Salaries & Wages 208,192 $ 214,241 $ 211,880 $ 309,197 $ Retirement Benefits 72,127 62,233 53,373 69,806 Health Insurance 31,011 31,313 33,442 43,245 Other Personnel Expenses 6,980 (46,401) 7,208 9,165 Personnel Services Subtotal 318,310 261,386 305,903 431,413 Operating Expenses Professional & Contract Services 1,672,661 2,647,783 2,516,000 4,199,500 Supplies & Materials 4,489 3,984 5,000 5,000 Repair & Maintenance - - -Interdepartmental Charges 10,632 23,196 23,967 32,619 Other Operating Expenses 669,043 1,583,382 929,700 2,049,700 Capital Outlay - - -Operating Expenses Subtotal 2,356,825 4,258,345 3,474,667 6,286,819 TOTAL EXPENDITURES 2,675,135 $ 4,519,731 $ 3,780,570 $ 6,718,232 $ Full Time Positions 2.00 2.00 2.00 2.50 Hourly/FTE Positions 0.00 0.00 0.00 0.00
RECENT ACCOMPLISHMENTS
• Established safety compliance officer role and reduced reliance on outside consultants
• Updated the Injury & Illness Prevention Program and led implementation of department specific safety programs as outlined by CalOSHA regulations
• Passed a CalOSHA inspection resulting in no fines and no discrepancies
• Conducted a Job Hazard Analysis for all major maintenance activities in Public Works and trained staff on required procedures that limit staff and contractor exposure to hazardous materials as well as limit damage to city facilities
• Worked with departments to conduct Safety Surveys to enhance safety compliance
• Developed in-house city staff safety training for forklift training, confined space and lockout tagout
• Conducted work site safety audits and developed a plan to continue these at city facilities and work sites
GOALS
• Enhance the safety program to ensure better training of employees and fewer accidents
• Close at least 80% of open and pending claims
• Obtain city property loss recoveries at 75% or higher
• Enhance safety committee meetings for each department
• Conduct Job Hazard Analyses of high-risk job activities in Police and Fire departments
• Develop Standard Operating Procedures to maintain compliance with CalOSHA regulations
• Expand employee training and decrease use of outside safety vendors
SIGNIFICANT CHANGES IN THIS YEAR’S BUDGET
• Increased budget for insurance premiums and legal expenses to cover anticipated higher liability and property insurance premiums and legal fees for the coming year
F-11
Performance Measure FY 2022 Actual FY 2023 Actual FY 2024 Estimated New claims that are closed 88% 85% 80% Recovered damages to city property 78% 76% 75%
ADMINISTRATIVE SERVICES |
HUMAN RESOURCES: WORKERS’ COMPENSATION
Account: 6111520 Fund:
ABOUT
This internal service fund is used to support the work-related injury and illness program.
SERVICES
• Work with injured employees and physicians to ensure timely medical treatment
• Coordinate employees’ return to work, including light duty assignments
• Work directly with injured employees to settle outstanding claims without litigation
• Provide information and recommendations to department supervisors to prevent workrelated injuries
RECENT ACCOMPLISHMENTS
• Implemented new policies and practices to comply with new legal mandates
• Resolved and closed 273 claims in fiscal year 2021-22 and 233 claims in fiscal year 2022-23
• Enhanced the workers’ compensation claims auditing process and trend analysis to identify patterns and implement additional safety measures to prevent claims
F-12
Internal Service
2020-21 Actual 2021-22 Actual 2022-23 Budget 2023-24 Budget Personnel Services Salaries & Wages 114,069 $ 76,865 $ 90,128 $ 182,419 $ Retirement Benefits 33,433 23,883 22,703 38,514 Health Insurance 12,105 12,636 22,029 31,989 Other Personnel Expenses (18,084) (29,088) 3,153 5,155 Personnel Services Subtotal 141,523 84,296 138,013 258,077 Operating Expenses Professional & Contract Services 536,507 687,143 786,000 885,000 Supplies & Materials - - -Repair & Maintenance - - -Interdepartmental Charges 960 708 12,001 16,815 Other Operating Expenses 4,564,037 6,208,100 3,571,000 3,998,000 Capital Outlay - - -Operating Expenses Subtotal 5,101,504 6,895,951 4,369,001 4,899,815 TOTAL EXPENDITURES 5,243,027 $ 6,980,247 $ 4,507,014 $ 5,157,892 $ Full Time Positions 1.00 1.00 1.00 1.50 Hourly/FTE Positions 0.00 0.00 0.00 0.00
GOALS
• Improve process to monitor lost days of work
• Ensure workers’ compensation data is shared with management regularly to effect change
• Make recommendations to reduce the number of days an employee is out of the workplace due to a work-related cause
• Ensure employees receive timely treatment to reach maximum medical improvement
• Work directly with injured employees to settle claims without litigation
• Enhance workers’ compensation strategic plan and use of data analytics
• Minimize the number of lost days of work due to work-related injuries and illnesses
SIGNIFICANT CHANGES IN THIS YEAR’S BUDGET
• Increased budget to cover anticipated higher costs for excess insurance, the State of California Office of Self Insurance Plans (OSIP) annual fee, and medical-related expenses for the coming year.
F-13
Performance Measure FY 2022 Actual FY 2023 Actual FY 2024 Estimated Average lost days of work per claim 56 35 55 Litigated claims as percent of open claims 2% 2% 2%
ADMINISTRATIVE SERVICES | INFORMATION TECHNOLOGY
Account: 640, 641
ABOUT
Fund: Internal Service
The Information Technology Department supports and continuously improves essential technology solutions and infrastructure for enabling the day-to-day operations of the city. IT provides leadership to deliver secure, reliable and cost-effective solutions aligned with City Council priorities and city initiatives.
SERVICES
• Administer and oversee the department’s use of resources and formation of priorities
• Support operations through implementation and support of technology infrastructure
• Implement and support enterprise software applications and systems
• Provide project management services to ensure all technology implementations and system upgrades are performed in a standardized methodology
• Provide business system specialist support to help ensure technology is meeting business needs
• Provide client services through a service desk, PC support and strategic initiatives
• Support public safety through technology implementation and support specifically designed for the unique requirements of the Police and Fire departments
• Oversee information technology security policies and practices as well as threat investigation
F-14
2020-21 Actual 2021-22 Actual 2022-23 Budget 2023-24 Budget Personnel Services Salaries & Wages 4,115,428 $ 3,992,390 $ 5,105,721 $ 5,179,271 $ Retirement Benefits 1,390,694 1,212,662 1,115,814 1,198,324 Health Insurance 524,700 490,649 713,650 693,969 Other Personnel Expenses (265,758) (610,349) 161,902 158,923 Personnel Services Subtotal 5,765,064 5,085,352 7,097,087 7,230,487 Operating Expenses Professional & Contract Services 1,868,980 835,433 1,331,000 1,236,659 Supplies & Materials 184,712 214,385 134,497 131,197 Repair & Maintenance 2,948,269 3,532,515 4,295,130 5,239,978 Interdepartmental Charges 25,608 32,724 35,668 73,864 Other Operating Expenses 2,043,554 1,811,075 1,793,150 1,703,550 Capital Outlay 1,460,141 896,160 791,435 1,021,740 Operating Expenses Subtotal 8,531,264 7,322,292 8,380,880 9,406,988 TOTAL EXPENDITURES 14,296,328 $ 12,407,644 $ 15,477,967 $ 16,637,475 $ Full Time Positions 37.00 37.00 43.00 43.00 Hourly/FTE Positions 1.00 1.00 0.99 0.50
RECENT ACCOMPLISHMENTS
• Launched the ServiceNow Service Portal in October of 2022 simplifying engagement with IT by providing a user-friendly interface for reporting issues and requesting equipment/services
• Enhanced the staff identity management solution, technology infrastructure, audio-visual capabilities, supported data analytics initiatives and numerous cyber security programs
• Upgraded enterprise applications including the Community Development permitting and licensing system, staff timekeeping, and city record management system along with an update to the library catalog system that allows for a more diverse and inclusive library catalog
• Began implementation of a new enterprise asset management solution, construction project management solution, enterprise digital asset management system, electronic plan reviews for community development, staff report/agenda management system, Facility Security Master Plan assessment and Police computer-aided dispatch and mobile system
• Completed over 10,000 service desk tickets, deployed more than 200 mobile devices and 400 computers, and supported numerous building construction and remodel projects including Police and Fire headquarters, Fire Station 2 and Temporary Fire Station 7
• Updated the library’s hardware platforms including materials handling system and audiovisual upgrades in the Exploration HUB and integrated the computer management system with the Parks & Recreation’s public computer labs, so patrons have the same uniform experience at both departments’ facilities
GOALS
• Consolidate and upgrade enterprise applications such as the utility billing customer portal, finance management system and the museum collection management system
• Implement facility monitoring solution, fleet telematics and a project portfolio management system
• Continue implementation of enterprise asset management, construction project management, enterprise digital asset management solutions, electronic plan reviews for Community Development, staff report/agenda management system, and Police computeraided dispatch and mobile system
• Expand software platform for affordable housing management, records management system forms, business process automation and citywide analytics
• Develop resource management tools/action plan for projects and IT service improvements
• Support phases two and three of the Police and Fire Headquarters remodel
• Continue modernization of IT infrastructure for projects supporting improved security and data analytics, such as extending the Carlsbad Digital Information Network, deploying applications in support of the city's data science efforts, developing a cyber security program, installing closed-circuit video cameras at various city locations, and consolidating disparate endpoint management systems
• Execute significant upgrades to the library’s materials management system functionality
• Reduce critical incidents to under industry standards of 2.5%
F-15
Performance Measure FY 2022 Actual FY 2023 Actual FY 2024 Estimated Critical ticket incidents 2.42% 2.12% 0.50%
ADMINISTRATIVE SERVICES |
INNOVATION & ECONOMIC DEVELOPMENT
Account: 0011033 0011035
ABOUT
Fund: General
Innovation & Economic Development supports a vibrant and diverse economy by cultivating a culture of innovation and collaboration among city departments and regular engagement with the business community. I&ED also provides citywide data services including managing the Data Governance Committee, implementing the Citywide Data Governance and Management policy and providing training for citywide data initiatives to power data-driven decision making with analytics and data visualization.
SERVICES
• Conduct business expansion, attraction and retention activities
• Serve all industry sectors through innovative efforts in talent attraction, traded economies and fostering of business clusters that provide for an inclusive economy
• Develop and maintain innovative business support programs and act as the city’s liaison to the business community to remove barriers to economic growth and vitality
• Provide governance and training for citywide data initiatives to power data-driven decision making with advanced analytics and data visualization
F-16
2020-21 Actual 2021-22 Actual 2022-23 Budget 2023-24 Budget Personnel Services Salaries & Wages 662,249 $ 656,268 $ 1,247,953 $ 1,267,824 $ Retirement Benefits 175,812 178,995 $ 285,472 290,160 $ Health Insurance 55,344 53,963 $ 153,691 149,353 $ Other Personnel Expenses 15,622 18,111 $ 39,591 37,555 $ Personnel Services Subtotal 909,027 907,337 1,726,707 1,744,892 Operating Expenses Professional & Contract Services 392,923 217,259 411,400 384,000 Supplies & Materials 65,200 86,165 72,259 67,760 Repair & Maintenance - - 105,400 105,400 Interdepartmental Charges 53,820 104,280 227,128 261,937 Other Operating Expenses 6,498 19,122 43,057 44,500 Capital Outlay 135 - -Operating Expenses Subtotal 518,576 426,826 859,244 863,597 TOTAL EXPENDITURES 1,427,603 $ 1,334,163 $ 2,585,951 $ 2,608,489 $ Full Time Positions 4.00 4.00 9.00 9.00 Hourly/FTE Positions 1.00 1.00 0.00 0.00
• Provide cartography and mapping services to city departments and maintain parcel, address and zonings records with interactive public access to city land use maps
• Provide citywide training in design thinking, strategic planning, innovation thinking, process improvement and re-engineering, data management, data analytics and data visualization
• Provide data systems consultation, evaluation, migration and data system upgrades to ensure business continuity while replacing legacy systems
• Identify key performance indicators with departments in connection to the City Council strategic plan to gauge progress, and insights to make better informed data-driven decisions
RECENT ACCOMPLISHMENTS
• Developed and adopted the city’s first Economic Development Strategic Plan, which will guide economic development efforts for the next five years
• Expanded Economic Insights and Intelligence program to deliver various data products including quarterly economic scans
• Launched the Job-Readiness Room pilot to connect disadvantaged workers with job opportunities in Carlsbad and across North County
• Expanded Life in Action Recruiter platform to connect more than 400 job-seekers to Carlsbad companies
• Implemented the Age-Friendly Carlsbad initiative, a cross-departmental project supported by AARP to support intergenerational activities and older adults
• Spurred the creation of innovative data visualization tools to support city goals
• Implemented a council approved data governance and management policy
GOALS
• Expand and optimize support services for city businesses and city departments engaging with businesses, including reaching more companies through business expansion, attraction and retention, also known as BEAR activities
• Convene industry advisory groups to ensure the city is aware of current and anticipated challenges for our diverse business community
• Create and deploy new and innovative programs to support business resiliency
• Provide more hours of data training to city staff
• Develop a coordinated approach to citywide data-driven decisions
• Develop training for performance management, data and continuous improvement
• Establish Carlsbad Works to develop a performance management system that highlights data management and data governance citywide
F-17
Performance Measure FY 2022 Actual FY 2023 Estimated FY 2024 Projected Companies reached through BEAR activities 40 45 50 Hours of data training conducted 28 20 30
ADMINISTRATIVE SERVICES |
MISCELLANEOUS NON - DEPARTMENTAL
ABOUT
The miscellaneous non-departmental budget accounts for all General Fund transfers to other funds, City Council contingencies and other miscellaneous General Fund expenses, such as outside legal counsel, personnel vacancy savings, citywide final vacation pay, and citywide dues and subscriptions. COVID-19 related expenditures in fiscal years 2020-21 and 2021-22 are associated with the COVID-19 Economic Recovery and Revitalization Initiative and COVID-19 specific expenditures that the city believes are recoverable through various reimbursements. Vacancy savings, or anticipated personnel savings over the course of the fiscal year, were first added to the budget in fiscal year 2022-23. Accounting for $2 million in vacancy savings will allow for budgeted personnel costs to align with actual personnel costs more closely in the General Fund.
The Carlsbad Strategic Plan includes a strategic objective to work with the San Diego Association of Governments and the North County Transit District to prioritize, determine costs, and work with state and federal representatives to seek funding for preliminary design and technical studies for lowering the railroad tracks in the Village. At budget adoption, the City Council appropriated $5.22 million from the General Fund Reserve and directed staff to request that the San Diego Association of Governments, or SANDAG, submit a FY 2023 Railroad Crossing Elimination Grant Program application for the project as the lead agency.
F-18
00190XX Fund: General
Account:
2020-21 Actual 2021-22 Actual 2022-23 Budget 2023-24 Budget Miscellaneous Non-Departmental Expenditures Legal Services 755,312 519,683 $ 1,000,000 $ 750,000 $ Community Contributions & Railroad Trenching 2,595 - $ - 5,220,000 Personnel Related 184,337 155,595 $ 1,050,000 1,637,000 Professional Services 34,194 33,980 $ 41,658 39,700 Property Tax and Other Administration 759,165 725,588 $ 750,000 750,000 Dues and Subscriptions 72,714 75,069 $ 80,000 80,000 COVID-19 Related 245,579 177,677 $ -Vacancy Savings - - (2,000,000) (2,000,000) Other Miscellaneous Expenditures 1,055,650 50,787 $ 100,000 100,000 Miscellaneous Non-Departmental Subtotal 3,109,546 1,738,379 1,021,658 6,576,700 General Fund Transfers Transfer to General Capital Construction Fund 4,500,000 13,283,056 3,956,000 11,600,000 Transfer to Infrastructure Replacement Fund 4,500,000 283,000 3,956,000 4,200,000 Transfer from Infrastructure Replacement Fund - - -Transfer to Strategic Digital Transformation Investment Program - 10,656,000 3,956,000 4,200,000 Transfer to LLD #1 (Medians & Trees) 700,000 1,390,000 1,400,000 1,570,000 Transfer to Storm Water Program 281,040 322,000 332,000 340,000 Miscellaneous Transfers Out 47,031,506 993,748 -General Fund Transfers Subtotal 57,012,546 26,927,804 13,600,000 21,910,000 City Council Contingencies Contingencies - - 500,000 500,000 TOTAL EXPENDITURES 60,122,092 $ 28,666,183 $ 15,121,658 $ 28,986,700 $
POLICY & LEADERSHIP
The City of Carlsbad follows a council-manager form of government, where elected City Council members provide direction on the policies and regulations that govern the operations of the city. The Policy & Leadership branch includes the following areas:

• Office of the City Council
• Office of the City Treasurer (elected)
• Office of the City Manager
• Office of the City Attorney
• Office of the City Clerk (elected)
• Communication & Engagement
The City Council appoints the City Manager, City Attorney and members of the city’s boards, commissions and committees. The Office of the City Manager handles administration and oversight of the city organization, including hiring the city workforce, supervising city departments and ensuring the City Council’s policy priorities are met.
Scott Chadwick City Manager
442-339-2820
manager@carlsbadca.gov
G-1
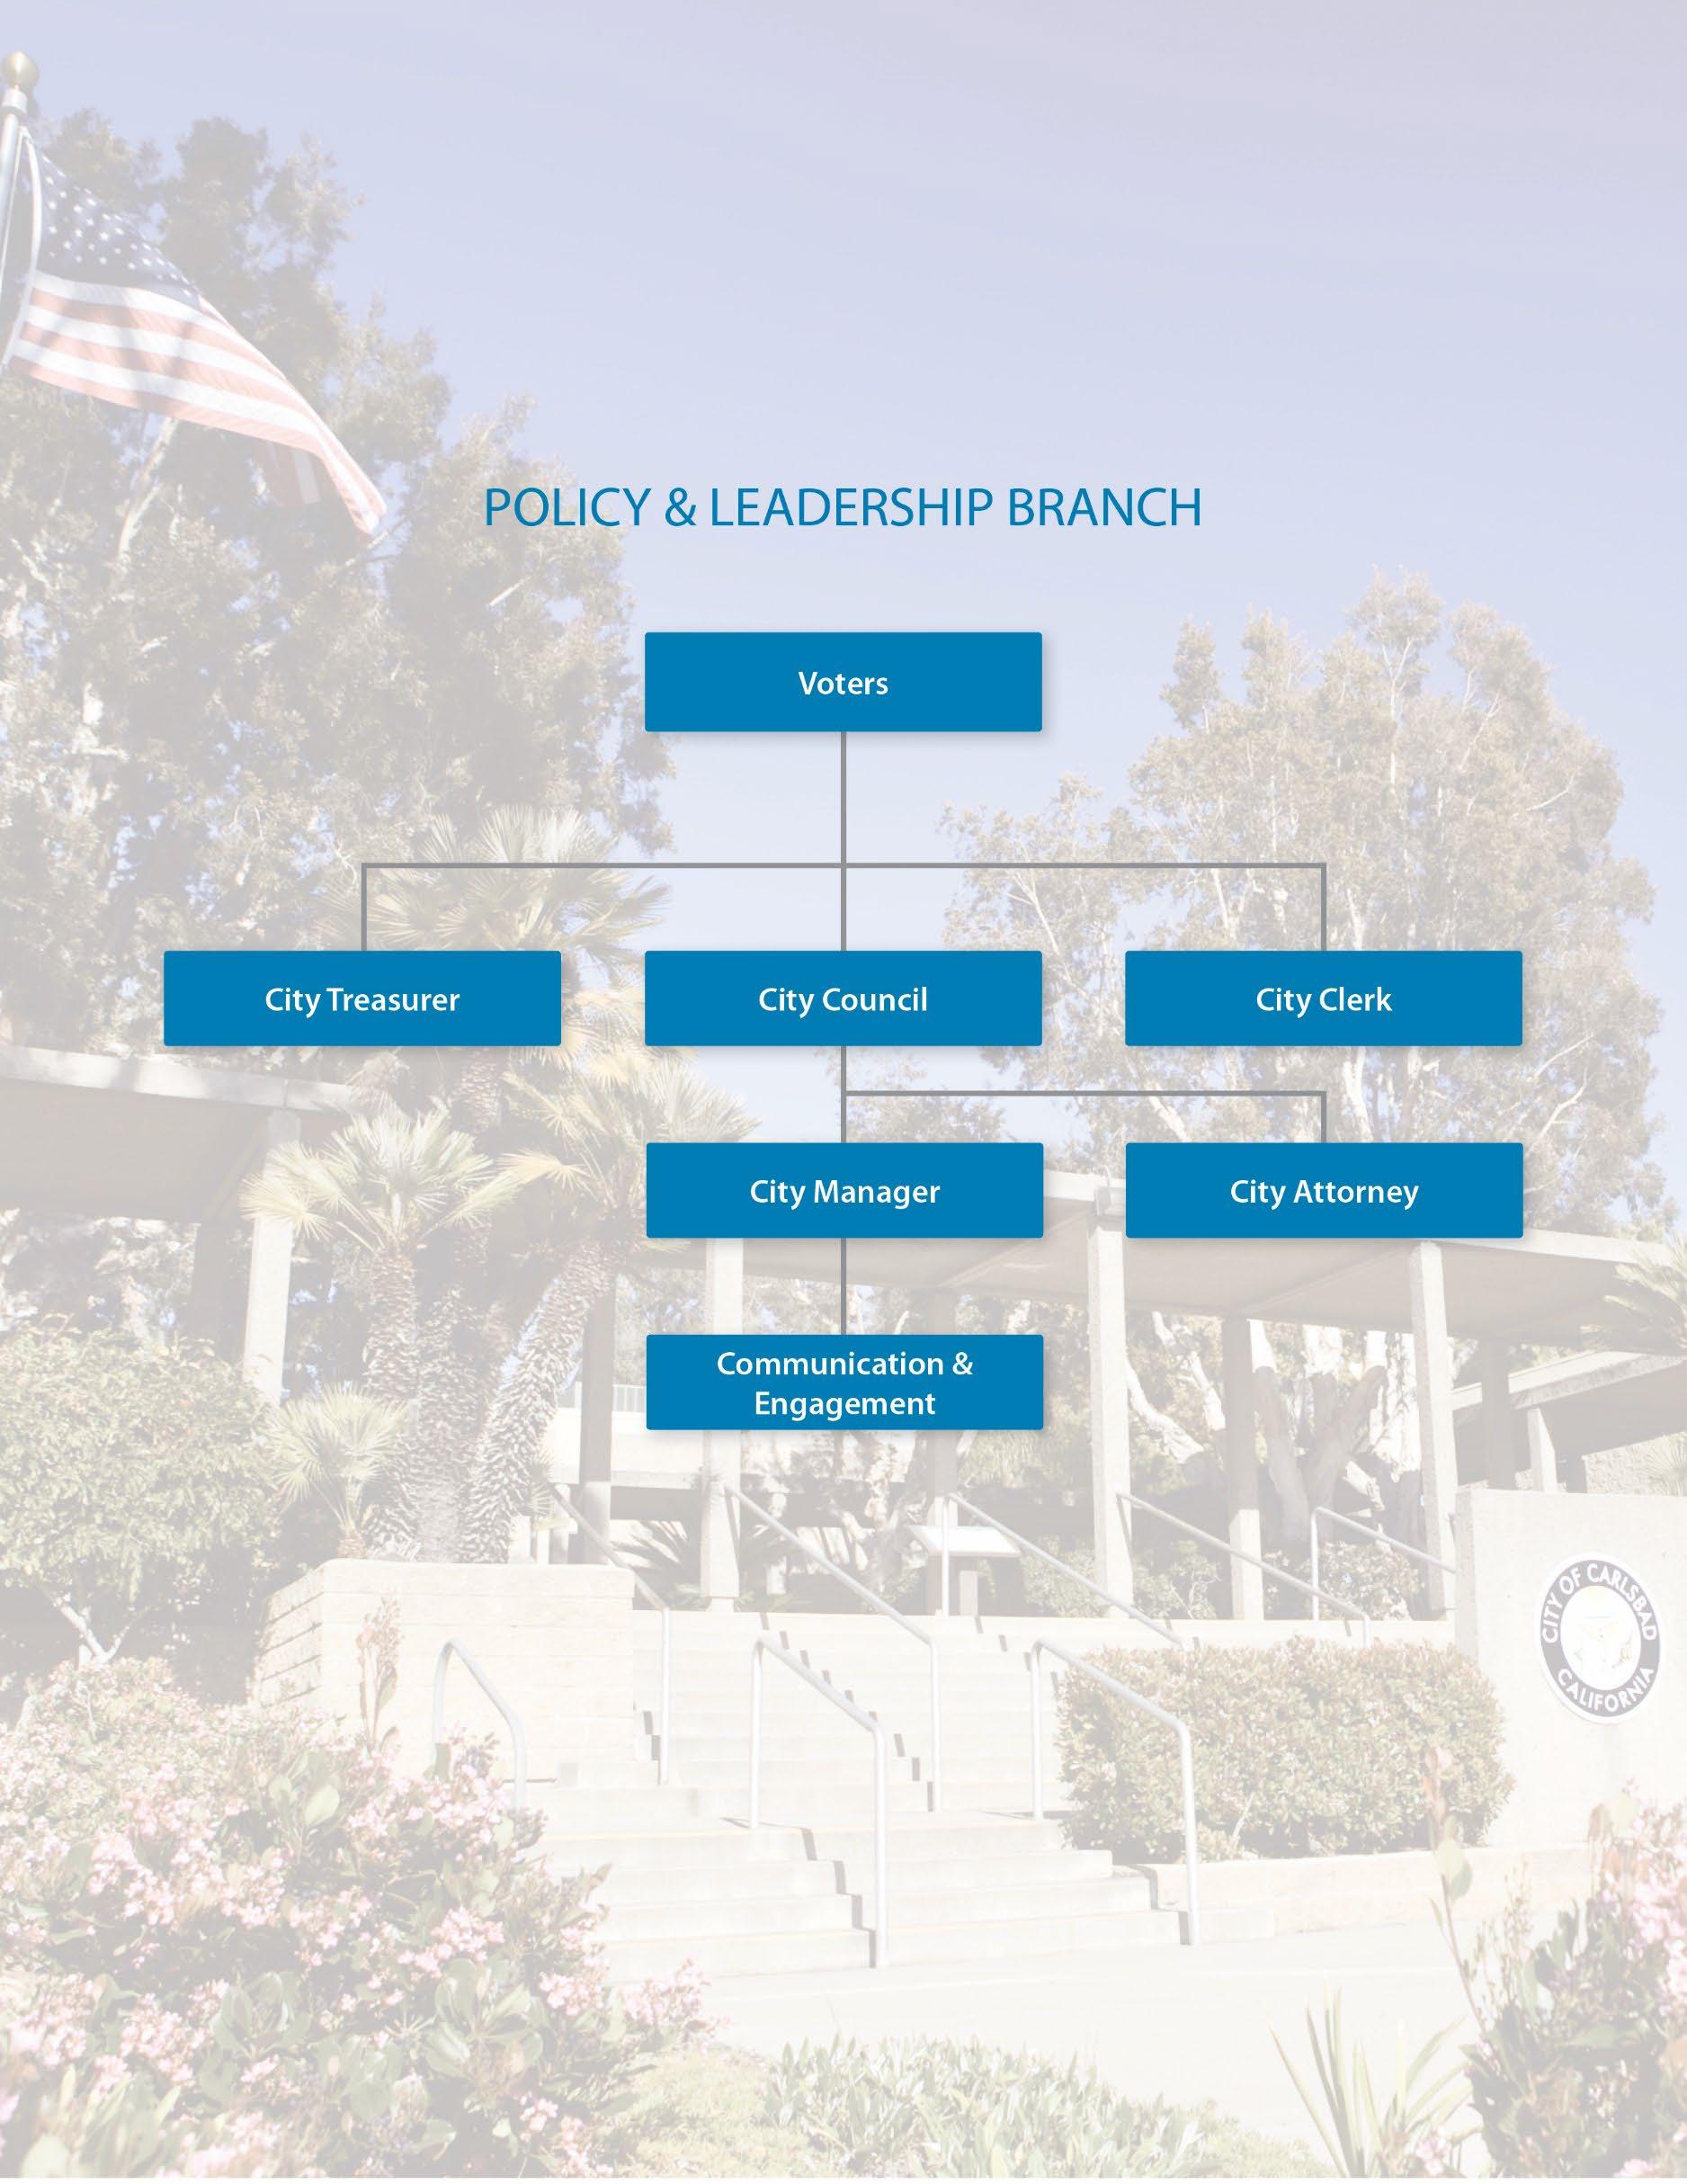
POLICY & LEADERSHIP |
OFFICE OF THE CITY COUNCIL
ABOUT
As the legislative body of the city, the Office of the City Council establishes the policies and regulations under which the city operates.
SERVICES
The City Council, as a legislative body, approves direction, policies and regulations that govern the operations of the city. The City Council appoints residents to serve on various boards and commissions and may serve as city representatives on regional boards such as SANDAG, North County Transit District and the San Diego County Water Authority.
RECENT ACCOMPLISHMENTS
• Established a Growth Management Citizens Committee to provide the City Council with a balanced consideration of a range of perspectives on key elements that should be addressed in a new plan to manage growth, while maintaining an excellent quality of life and complying with state law
G-3
Account: 0011010 Fund: General
2020-21 Actual 2021-22 Actual 2022-23 Budget 2023-24 Budget Personnel Services Salaries & Wages 274,624 $ 278,071 $ 295,280 $ 308,869 $ Retirement Benefits 84,102 73,340 62,121 47,173 Health Insurance 85,962 79,678 85,148 42,729 Other Personnel Expenses 6,390 7,319 6,478 6,539 Personnel Services Subtotal 451,078 438,408 449,027 405,310 Operating Expenses Professional & Contract Services 5,453 201 46,500 25,300 Supplies & Materials 6,211 5,450 25,310 24,422 Repair & Maintenance - - -Interdepartmental Charges 25,020 79,800 88,478 102,968 Other Operating Expenses 215 10,285 42,905 49,078 Capital Outlay - - -Operating Expenses Subtotal 36,899 95,736 203,193 201,768 TOTAL EXPENDITURES 487,977 $ 534,144 $ 652,220 $ 607,078 $ Full Time Positions 2.00 2.00 2.00 2.00 Hourly/FTE Positions 0.00 0.00 0.00 0.00
• Allocated $2 million in funding for traffic safety efforts related to the Declaration of Local Emergency to address an over 200% increase in collisions involving bikes and e-bikes since 2019, to increase attention and resources on a range of solutions including infrastructure, safety, enforcement and a focus on safe driving behavior education
• Adopted the city’s 5-Year Strategic Plan, a plan with policy goals to reflect the most important priorities of the community
• Approved the creation of a Community-Police Engagement Commission to help strengthen and maintain an excellent relationship between the Carlsbad Police Department and the community
• Adopted the Economic Development Strategic Plan, a roadmap that will guide the city’s economic development activities for the next five years, providing resources, support and opportunities for the diverse businesses that support Carlsbad’s community and contribute to the city’s unique character
• Adopted the Carlsbad Homelessness Action Plan, a long-term strategic initiative aimed at reducing homelessness and its impacts on the community
GOALS
The City Council is focused on advancing the goals identified in the city’s 5-Year Strategic Plan. Work is centered around the following five goal themes:
• Economic vitality
• Sustainability and the environment
• Community character
• Quality of life and safety
• Organizational excellence and fiscal health
G-4
POLICY & LEADERSHIP |
OFFICE OF THE CITY TREASURER
Account: 0010310
ABOUT
The Office of the City Treasurer provides cash and investment management services which adhere to the city’s Investment Policy and meet the changing investment needs of the city to optimize investment returns, consistent with maintaining safety of principal, ensuring sufficient liquidity and return on investment.
SERVICES
• Manage reporting and oversight of the city’s cash and investments
RECENT ACCOMPLISHMENTS
• Ensured that all city departments are fluent in cash handling and banking best practices
• Assisted with planning and implementation of the new payment portals for permitting
• Maintained a competitive yet prudent investment yield
GOALS
• Anticipate and meet the changing investment needs of the city to optimize investment returns, consistent with maintaining safety of principal while ensuring sufficient liquidity and return on investment
• Maintain a maximum modified duration of less than 2.2%
G-5
Fund: General
2020-21 Actual 2021-22 Actual 2022-23 Budget 2023-24 Budget Personnel Services Salaries & Wages 87,323 $ 90,849 $ 93,617 $ 122,253 $ Retirement Benefits 32,101 26,286 22,729 26,546 Health Insurance 25,958 25,530 26,346 21,348 Other Personnel Expenses 2,368 2,820 2,906 3,473 Personnel Services Subtotal 147,750 145,485 145,598 173,620 Operating Expenses Professional & Contract Services 57,086 63,348 74,229 70,210 Supplies & Materials 1,488 1,780 1,810 850 Repair & Maintenance - - -Interdepartmental Charges 29,076 32,676 21,908 29,569 Other Operating Expenses - - 6,400 4,900 Capital Outlay - - -Operating Expenses Subtotal 87,650 97,804 104,347 105,529 TOTAL EXPENDITURES 235,400 $ 243,289 $ 249,945 $ 279,149 $ Full Time Positions 1.00 1.00 1.00 1.00 Hourly/FTE Positions 0.00 0.00 0.00 0.00
• Further develop the City Treasurer webpage on the city’s website, informing the community of the mission of the City Treasurer, the city’s Investment Policy and investment activities
• Continue to participate in the city’s Citizens Academy
• Use innovative solutions to fund modern and secure cash handling solutions even in uncertain times
G-6
Performance Measure FY 2022 Actual FY 2023 Estimated FY 2024 Projected Modified Duration 1.95% 2.14% <2.2% Average Yield 1.35% 1.16% 1.25%
POLICY & LEADERSHIP |
OFFICE OF THE CITY MANAGER
Account: 0011010
ABOUT
Fund: General
The Office of the City Manager is dedicated to continuous improvement and organizational excellence that fosters the well-being of a high performing organization that delivers impactful results to further the public good.
SERVICES
The City Manager’s Office provides City Council support, administrative leadership of city operations, policy development management, monitors and manages legislative affairs and provides general management of public communication and engagement.
RECENT ACCOMPLISHMENTS
• Issued a Declaration of Local Emergency in response to an increase of over 200% since 2019 in injury collisions involving bikes and e-bikes called the Safer Streets Together campaign, which focuses on increasing public education, re-engineering city streets and increasing enforcement of the rules of the road
• Facilitated adoption of a 5-Year Strategic Plan to prioritize the goals and objectives of the City Council and community, focusing on long term fiscal sustainability and CIP prioritization
• Reduced and restructured the city budget in response to financial forecasts
• Ensured timely follow up of all City Council and constituent services requests
• Managed a robust local, state and federal intergovernmental affairs program
G-7
2020-21 Actual 2021-22 Actual 2022-23 Budget 2023-24 Budget Personnel Services Salaries & Wages 1,061,278 $ 1,151,593 $ 1,167,148 $ 1,230,586 $ Retirement Benefits 475,362 364,616 316,038 313,890 Health Insurance 133,336 135,066 143,953 139,462 Other Personnel Expenses 28,167 32,560 34,078 33,053 Personnel Services Subtotal 1,698,143 1,683,835 1,661,217 1,716,991 Operating Expenses Professional & Contract Services 115,652 180,414 305,240 244,350 Supplies & Materials 22,318 26,669 55,179 46,161 Repair & Maintenance - - -Interdepartmental Charges 98,460 104,904 95,891 125,966 Other Operating Expenses 4,423 17,300 38,618 51,355 Capital Outlay 541 - -Operating Expenses Subtotal 241,394 329,287 494,928 467,832 TOTAL EXPENDITURES 1,939,537 $ 2,013,122 $ 2,156,145 $ 2,184,823 $ Full Time Positions 7.00 7.00 7.00 7.00 Hourly/FTE Positions 0.00 0.00 0.00 0.00
• Supported Clean Energy Alliance expansion and operations
• Extensive collaboration with neighboring cities and regional organizations to better share best practices for improved cooperation and efficiencies in government
GOALS
• Ensure the most efficient and effective provision of city services while adapting to changing financial conditions
• Enhance community engagement and transparency efforts to foster authentic civic engagement with residents, organizations and businesses
• Increase intergovernmental collaboration and legislative advocacy with local, state and federal governments to further the City Council adopted legislative platform and advance priority projects
G-8
POLICY & LEADERSHIP |
OFFICE OF THE CITY ATTORNEY
Account: 0011210
ABOUT
Fund: General
The City Attorney is appointed by the Mayor and City Council. The City Attorney’s Office consists of six attorneys and two legal support staff members The office primarily practices preventive law, which seeks to minimize the risk of litigation or regulatory violations by anticipating and preventing legal problems. Preventive law focuses on the attorney’s role as adviser and negotiator and emphasizes planning, counseling, collaboration, and problem-solving The office also prosecutes criminal violations of the Carlsbad Municipal Code.
SERVICES
• Advise the City Council and city staff on legal matters affecting the city
• Attend City Council meetings and, when necessary, meetings of other boards and commissions
• Prepare and review ordinances and resolutions
• Negotiate, prepare and approve the form of contracts and legal instruments
• Represent the city in court proceedings and before regulatory and legislative agencies
• Manage the city’s litigation and provide periodic reports to the City Council
• Enforce city laws and regulations
G-9
2020-21 Actual 2021-22 Actual 2022-23 Budget 2023-24 Budget Personnel Services Salaries & Wages 1,266,674 $ 1,327,586 $ 1,332,053 $ 1,400,190 $ Retirement Benefits 472,390 421,473 354,851 352,121 Health Insurance 129,650 123,418 145,714 141,643 Other Personnel Expenses 31,924 37,257 39,341 38,365 Personnel Services Subtotal 1,900,638 1,909,734 1,871,959 1,932,319 Operating Expenses Professional & Contract Services 3,063 2,569 2,700 2,700 Supplies & Materials 31,209 31,707 35,757 23,257 Repair & Maintenance - - -Interdepartmental Charges 97,332 129,444 106,780 141,008 Other Operating Expenses 4,224 8,429 16,312 16,312 Capital Outlay - - -Operating Expenses Subtotal 135,828 172,149 161,549 183,277 TOTAL EXPENDITURES 2,036,466 $ 2,081,883 $ 2,033,508 $ 2,115,596 $ Full Time Positions 8.00 8.00 8.00 8.00 Hourly/FTE Positions 0.00 0.00 0.00 0.00
RECENT ACCOMPLISHMENTS
• Advised the City Council and city staff on legal matters, including filling the City Council vacancy in District 2, the declaration of the bicycle safety emergency and the development and implementation of the Safer Streets Together program, compliance with new legislation, and compliance with state and county health orders
• Managed the city’s defense of civil litigation, including achieving favorable verdicts in two jury trials
• Prepared or assisted with additions and revisions to the Carlsbad Municipal Code, including provisions related to the Community-Police Engagement Commission, Arts Commission, use of military equipment, fire and building standards codes, elected officials’ compensation and benefits, disqualification for conflict of interest, environmental sustainability, the Mills Act and historic preservation, and administrative code enforcement remedies
• Assisted with revisions to Carlsbad Municipal Water District Ordinance No. 48 to mirror the San Diego County Water Authority’s 2020 model drought ordinance
• Assisted with the refunding of outstanding bonds for Reassessment District No. 2022-1
• Assisted with negotiations to reconfigure the SDG&E North Coast Service Center site to free up coastal property for eventual transfer to the city
• Assisted with efforts to reestablish the Carlsbad Tourism Business Improvement District under the Property and Business Improvement District Law of 1994
• Worked with the Legislative Subcommittee, the Intergovernmental Affairs Director, and the city’s legislative consultant to have the state legislature pass two bills to improve the city’s ability to provide pool and ocean water lifeguard services
• Assisted the Human Resources Department with updating the city’s benefit plan documents and other policy documents
• Assisted the City Clerk’s Office with the biennial update to the city’s Conflict of Interest Code
• Worked with Police Department to obtain Gun Violence Restraining Orders as appropriate for domestic violence and mental health incidents
• Assisted staff in implementing programs designed to address issues of homelessness
• Assisted with the preparation of ballot materials and the preparation of an impartial analysis for a ballot measure to obtain voter expenditure authorization for the Monroe Street Pool project
• Reviewed and advised on contracts, public records requests and City Council inquiries
• Provided as needed legal support and advice to all city boards, commissions and subcommittees
GOALS
• Provide quality and timely legal advice to all elected and appointed city officials and all branches to assist in minimizing litigation and regulatory risk and in making sound decisions to carry out the city’s mission, vision, values, and strategic plan
• Support the City Manager in strategic operations related to ongoing and significant capital projects
• Continue efforts to update the Carlsbad Municipal Code, City Council policies and administrative orders and to codify the Carlsbad Municipal Water District ordinances
G-10
POLICY AND LEADERSHIP|
OFFICE OF THE CITY CLERK
ABOUT
The Office of the City Clerk serves as a vital link between city government and those it serves, providing access to public records, publishing City Council agendas, preparing minutes and serving as the city’s election official.
SERVICES
• Prepare City Council agendas
• Prepare minutes
• Complete legal noticing and publishing
• Maintain Fair Political Practices Commission filings
• Maintain Carlsbad Municipal Code
• Maintain, preserve and provide access to all legislative documents
• Administer elections
• Notarize documents
• Provide proof of life certifications
• Assist City Attorney’s Office with citywide ethics training
• Ensure public records are archived, preserved and accessible to the public
• Respond to Public Records Act Requests
G-11
Account: 0010210, 0011610 Fund: General
2020-21 Actual 2021-22 Actual 2022-23 Budget 2023-24 Budget Personnel Services Salaries & Wages 593,961 $ 610,376 $ 659,421 $ 675,023 $ Retirement Benefits 192,490 167,776 142,961 142,285 Health Insurance 96,418 86,549 109,601 86,625 Other Personnel Expenses 15,723 18,665 21,990 21,431 Personnel Services Subtotal 898,592 883,366 933,973 925,364 Operating Expenses Professional & Contract Services 30,415 89,424 70,500 70,500 Supplies & Materials 45,894 42,990 42,456 42,220 Repair & Maintenance - 863 4,196 4,115 Interdepartmental Charges 120,648 156,372 143,237 182,459 Other Operating Expenses 111,486 123,297 199,800 49,797 Capital Outlay - - -Operating Expenses Subtotal 308,443 412,946 460,189 349,091 TOTAL EXPENDITURES 1,207,035 $ 1,296,312 $ 1,394,162 $ 1,274,455 $ Full Time Positions 7.00 7.00 7.00 7.00 Hourly/FTE Positions 1.00 1.00 1.00 1.00
• Process subpoenas, summons and claims
• Develop and implement records management and document management programs
• Process recorded documents and bond releases
• Provide document research assistance to staff and the public
• Provide training and support to various department personnel designated to scan documents into the city’s records repository
• Manage and coordinate destruction of records past retention
RECENT ACCOMPLISHMENTS
• Conducted process to fill the City Council District 2 vacancy
• Conducted the November 2022 General Election
• Updated the Carlsbad Municipal Code relating to the Campaign Contributions Limit
• Finalized the agenda management workflow process through Laserfiche
• Assisted Community Development in creating a Quick Fields Laserfiche workflow for E-Review of Building permits
• Standardized agendas, minutes and staff reports for all board and commission meetings
GOALS
• Obtain a digital posting board to push out all agendas electronically throughout the city for greater accessibility in conformance with the Brown Act
• Automate the conforming process as a workflow in Laserfiche
• Implement the county’s electronic system for document recordation
• Evaluate feasibility of offering passport application acceptance services
• Continue to systematically update the Carlsbad Municipal Code and City Council Policies
• Provide greater access to public records on the city website
• Maintain and update the Records Retention Schedule and provide city staff with training
• Continue to collaborate with various departments on digitizing their documents
• Continue to conduct departmental records audits
G-12
POLICY & LEADERSHIP | COMMUNICATION & ENGAGEMENT
Account: 0011012, 0011016 1381010
Fund: General Special Revenue – Local Cable Infrastructure
ABOUT
The city’s communication and engagement program fosters open, two-way communication with the community about city issues, programs and services, leading to a more responsive and transparent government This department is also responsible for communicating within the city organization so employees are not only informed but can see how their day-to-day work supports the larger city mission.
SERVICES
• Develop community engagement programs that facilitate early and meaningful public input in city government decision making
• Promote awareness of city issues, programs, services and initiatives
• Write and edit staff reports and responses to constituent inquiries to ensure information presented is clear, complete and accurate
• Produce video recordings and livestream all City Council meetings and meetings of boards, commissions and committees
• Manage a dedicated 24/7 government cable TV channel
G-13
2020-21 Actual 2021-22 Actual 2022-23 Budget 2023-24 Budget Personnel Services Salaries & Wages 756,371 $ 918,417 $ 1,073,526 $ 1,082,901 $ Retirement Benefits 230,127 219,496 239,499 232,944 Health Insurance 112,283 122,180 174,135 181,807 Other Personnel Expenses 19,566 26,741 34,715 32,984 Personnel Services Subtotal 1,118,347 1,286,834 1,521,875 1,530,636 Operating Expenses Professional & Contract Services 323,325 826,454 516,201 454,200 Supplies & Materials 73,442 102,950 107,686 81,620 Repair & Maintenance - 9,541 -Interdepartmental Charges 134,940 172,368 194,963 208,342 Other Operating Expenses 17,401 18,322 33,467 217,256 Capital Outlay 162,484 24,925 -Operating Expenses Subtotal 711,592 1,154,560 852,317 961,418 TOTAL EXPENDITURES 1,829,939 $ 2,441,394 $ 2,374,192 $ 2,492,054 $ General Fund 1,493,938 $ 2,037,551 $ 1,979,186 $ 1,953,098 $ Special Revenue Fund 336,001 403,843 395,006 538,956 Total Funding 1,829,939 $ 2,441,394 $ 2,374,192 $ 2,492,054 $ Full Time Positions 7.00 7.00 9.00 9.00 Hourly/FTE Positions 3.50 3.50 1.50 1.50
• Provide communication skills training to city staff
• Provide employee communication that supports an informed and engaged workforce
• Maintain a trained team of city staff ready to perform public information duties 24/7 in case of an emergency
RECENT ACCOMPLISHMENTS
• Successfully engaged community members on issues including the City Council strategic plan, the future of south Carlsbad’s coastline, sites for new housing, the CAP update, Veterans Memorial Park, the Parks & Recreation Department Master Plan, traffic safety, neighborhood traffic calming programs, public art and more
• Developed and distributed 51 editions of the city’s e-newsletter
• Grew email database to 96,300, an increase of 15% over the previous year
• Sent 712 targeted emails regarding city issues, programs and events, with an average open rate of 60%, more than double the industry standard and 5% higher than last year’s open rate
• Produced and distributed 292 news releases and articles about city services and programs, a 13% increase over last year
• Increased net new followers on Twitter by 20% over the past year
• Increased net new YouTube subscribers by 18% over last year
• Increased net new followers on Instagram by 9%
• Produced over 200 informational videos watched by 170,419 people for a total of 4,621 hours
• More than doubled the engagement rate across all social media platforms
• Achieved a post engagement rate across all social media platforms higher than the industry average
GOALS
• Complete a minimum of three community engagement programs with at least 500 participants each for citywide programs and 150 participants each for neighborhood-specific programs
• Produce an average of three news releases per week highlighting city news and programs
• Communicate directly with community members through a combination of social media and email an average of five times a week
G-14
FY 2022 Actual FY 2023 Estimated FY 2024 Projected Number of community engagement programs annually 4 3 3 Average number of news updates prepared per week 4 5 4 Average number of direct communications with community members per week 5 6 5
Performance Measure
STRATEGIC DIGITAL TRANSFORMATION INVESTMENT PROGRAM
The Strategic Digital Transformation Investment Program, or SDTIP, is a comprehensive approach to planning for and funding digital transformation efforts throughout the city. Several documents inform this program, including the City Council-approved Connected Carlsbad: An Inclusive City Innovation Roadmap, the Internal Digital Information Network Action Plan, and the Information Technology Strategy, which are complemented by a five-year projected roadmap of digital transformation investments The SDTIP is the strategic plan for technology and digital transformation combined with project descriptions, costs, funding sources and timelines. The purpose of this program is to provide for an annual investment strategy, not a commitment for spending, that outlines a five-year expenditure plan for future digital transformation and technology projects and the corresponding revenues necessary to pay for them.
Connected Carlsbad: An Inclusive City Innovation Roadmap
In January 2019, city staff presented Connected Carlsbad: An Inclusive City Innovation Roadmap, designed to provide a high-level, organized guide outlining the principles that matter to the city in creating a more connected community. This roadmap and its associated action plan were based on a combination of items, including:
• City Council approved projects,
• existing city documents,
• previous Information Technology assessments and interviews with departments, and
• a global scan of other cities and best practices that have emerged from leading smart city thinkers and Carlsbad-specific community engagement.
The SDTIP expands on the Connected Carlsbad Roadmap to include a strategy for evaluating and prioritizing projects and a five-year investment roadmap that includes estimated costs and timelines. This new investment program continues to be organized into the five primary goal areas approved by City Council in Connected Carlsbad, listed below.
• Pursue Communitywide Digital Transformation focuses on the foundational elements, including connectivity, up-to-date hardware and software, and a robust security strategy while providing an aspirational vision for the future.
• Build Capacity for Data-Driven Government focuses on the policies, procedures and staffing necessary for the city to fully capture the value of emerging models of data analytics.
• Foster a Vibrant Civic Engagement Culture builds upon the first two goals with a humancentered perspective that an engaged city that uses data and technology in a way that respects people and their privacy will support a vibrant culture where residents, organizations and businesses are invested in their community and its future.
• Enhance Accessibility and Transparency recognizes that open government and approaching problem-solving from an accessibility perspective leads to better outcomes for all.
• Promote Safety and Sustainability through Connectivity leads to understanding the interconnected nature of our communities that can achieve environmental, mobility and sustainability goals when approached in a cross-departmental and community informed manner.
H-1
Once City Council adopts the proposed SDTIP, projects receive an appropriation that authorizes spending in the amount specified for the adopted fiscal year only. Estimated budget information is shown for a five-year period to provide the most comprehensive information about known future projects. Spending authority in future years is not granted until adoption of the annual proposed SDTIP budget associated with each year.
INVESTING IN DIGITAL TRANSFORMATION
As the city continues to grow and develop, the use of technology has also grown exponentially over the last two decades. The SDTIP outlines the financial resources needed to ensure that the technology infrastructure is in place to enable the city to provide services to the community Prudent financial planning will ensure that ongoing funding for investment in technology is available.
PROJECT EVALUATION
Making decisions on technology implementations is a challenging and complex task. The challenging nature of these decisions is exacerbated by the expanding reach of technology and the increasingly interdisciplinary nature of emerging technologies. A major component of the SDTIP is the establishment of a cross-departmental approach to technology leadership to evaluate, prioritize, budget for and adopt digital transformation efforts A new administrative order has been developed that provides a collaborative forum for key staff to validate and prioritize technology implementations. This approach also provides a structured venue to explore how particular configurations of a technology implementation may positively or negatively affect others within the organization. The process to evaluate digital transformation initiatives is ongoing and meetings may be held on a monthly, bimonthly or quarterly basis depending on the need
A number of factors are considered when putting together projects for the five-year program. All digital transformation and technology projects shall be consistent with:
H-2
Strategic Digital Transformation Investment Program Public Health and Safety City Mission, Vision and Organizational Values Community Values City Council Goals Governing and Policy Documents Funding Availability Environmental Review Technology Standards and Strategic Plans
Criteria
Proposed projects are evaluated and prioritized by a set of criteria that include:
Alignment with City Council goals and IT strategic plans, architecture, security and technology standards, including legislative and regulatory mandates, and administrative goals
Coordination of IT investments across the enterprise to avoid duplication, maximizing the return on investment and increasing efficiency
Effective articulation of the business case including valid operational benefits of the project
Accuracy and reasonableness of cost and benefit estimates
Consideration of potential project risks and identification of appropriate means to manage those risks
Adherence to standard project management practices
Capacity of staffing resources to implement the project
As the SDTIP is implemented throughout the year, staff continually re-evaluate projects’ scopes, costs and schedules to responsibly and cost-effectively manage city resources.
H-3
STRATEGIC DIGITAL TRANSFORMATION INVESTMENT PROGRAM PROJECTS
The following contains information about the projects in the SDTIP. Full project pages are provided for the major new projects being requested for fiscal year 2023-24 and prior approved major projects that have changes in funding needs or project requirements. The estimated annual operational and replacement cost increases shown on each project page represent a departmental budgetary increase generally to the Information Technology Department and its internal service citywide chargeback separate from Capital Technology Fund activity. Projects for fiscal year 2024-25 and beyond are included in the graphs and tables provided but will not have full project pages until the first year of funding. Projects with no changes and projects that have been completed or cancelled going into fiscal year 2023-24 are listed below. Full details for these projects can be found in the appropriate prior fiscal year budget documents based on when they were new or had changes
Fiscal Year 2021-22 Continuing Projects – No Changes
The following projects were approved during the fiscal year 2021-22 SDTIP and have no changes to their funding needs or project requirements and are still in process. These projects are included in the totals of the various graphs and charts shown in the SDTIP.
• Outdoor Wireless Study
• Online Permitting/Electronic Reviews, also known as E-Reviews
• Project Portfolio Management Tool & Consulting
Fiscal Year 2022-23 Continuing Projects – No Changes
The following projects were approved during the fiscal year 2022-23 SDTIP and have no changes to their funding needs or project requirements and are still in process. These projects are included in the totals of the various graphs and charts shown in the SDTIP.
• Computer Aided Dispatch
• Enterprise Asset Management (EAM)
• Enterprise Digital Asset Management (EDAM)
• Live 9-1-1
• Utility Billing Portal
Completed or Cancelled Projects
The following projects were completed or cancelled during fiscal year 2022-23. The completed projects are not part of the totals of the various graphs and charts, while the cancelled projects are included if the project was previously funded.
Completed
• Business Process Documentation
• Digital Engagement & Analytics Consultant
• Exploration Hub Audio Visual Upgrade
• ServiceNow Service Portal
• Timekeeping System Upgrade
Cancelled
• Next Generation Online Catalog
• Electronic Patient Care Reporting
H-4
ESTIMATED TOTAL APPROPRIATIONS BY GOAL
Going into fiscal year 2023-24, there are 44 continuing and new projects planned over the next five years at an estimated total cost of $33 7 million Included in the $33 7 million is approximately $19.5 million in estimated new costs over the course of the same time frame to provide additional funding for the continuation of existing projects as well as funding for new projects. Within the $19.5 million is approximately $4 6 million of estimated new appropriations for fiscal year 2023-24 for these same projects.
Estimated Total Projects Costs by Goal
FY 2023-24 to FY 2027-28
$33.7 million
Build Capacity for Data-driven Decision Making, $2.7M, 8%
Pursue Communitywide Digital Transformation, $15,1M, 45%
Enhance Accessibility and Transparency, $1.7M, 5%
Foster a Vibrant Civic Engagement Culture, $1.3M, 4%
Promote Security and Sustainability through Connectivity, $12.9, 38%
H-5
Fiscal year 2023-24 appropriations by project goal
Pursue Communitywide Digital Transformation
$15.1 million
This goal includes updating connectivity, up-to-date hardware and software, and a robust security strategy
Build Capacity for Data-Driven Decision Making
$2.7 million
This goal’s projects include the policies, procedures and staffing necessary for the city to fully capture the value of emerging models of data analytics It builds a comprehensive approach to citywide data management to enable data-rich key performance metrics and effective operation of city departments. A data policy and resources will be created to align departments with standards of data cataloging for compliance ease of data sharing
Foster a Vibrant Civic Engagement Culture
$1.3 million
The city’s civic engagement culture builds upon the first two goals with a human-centered perspective to use data and technology in a way that respects people and their privacy Projects in this category will support a vibrant culture where residents, organizations and businesses are invested in their community and its future.
Enhance Accessibility and Transparency
$1.7 million
This goal recognizes that open government and approaching problem-solving from an accessibility perspective leads to better outcomes for all. Projects in this category include Civic Engagement with Open Data, Online Permitting/Electronic Reviews, Patron Print/Copy Management and a Virtual Permitting Counter.
Promote Security and Sustainability through Connectivity
$12.9 million
Projects in this goal include the annual replacement of hardware and technology infrastructure, a Facility Security Master Plan, the replacement of the Police Computer Aided Dispatch System, and an enhancement to the 9-1-1 emergency system
H-6
P URSUE COMMUNITYWIDE DIGITAL TRANSFORMATION
Consolidation & Replacement of Core Systems
Project Benefits
Without systems that can talk to each other, the city wastes time and resources manually compiling and integrating data. This greatly affects the city’s ability to make data-driven decisions, which are needed to ensure the highest and best use of taxpayer resources. Having fewer systems that consolidate the city’s core business functions will enable streamlined business processes and provide more timely access to data and information. It will also enhance operations and reduce inefficiencies of employees having to learn and operate multiple systems. undetermined
About This Project
This project provides for the consolidation and replacement of the city’s core systems. There are approximately 20 core systems including the city’s financial, human resources, payroll, budget, asset and work order management, licensing and permitting, utilities operations, computer-aided dispatch, land management, and program-event management. Rather than operate many systems with narrow applicability, the city is evaluating ways to consolidate its core systems as legacy applications are replaced. This may mean accelerated replacement for certain systems. The goal is to reduce redundancy and inefficiency associated with operating many different systems with different vendors.
Consolidating down to a few systems that seamlessly integrate data and provides a more uniform interface will improve the experience of city employees and the public. The scope of this multi-year initiative includes the analysis, selection, purchase and implementation of the software and hardware necessary to consolidate, replace and integrate these systems with as few systems as possible while maintaining or enhancing existing capabilities.

H-7
PROJECTS
Project Funding Source: Technology Investment 4,400,000 $ Managing Department: Information Technology Estimated Annual Costs Increase/(Decrease): Operational Not known Replacement Not known Prior Year Req FY23-24 Est FY24-25 Est FY25-26 Est FY27-28 Total Funding Source Budget Budget Budget Budget Budget Budget Tech. Investment 900,000 $ 1,500,000 $ 2,000,000 $ - $ - $ 4,400,000 $ Est FY26-27 Budget - $
The city completed an in-depth process to evaluate functional requirements and business processes and, the city’s consultant provided a comprehensive report outlining the city’s requirements for a new consolidated system. The report also outlined the options and costs associated with system consolidation and replacement based on an evaluation of the city’s needs. The next step will involve the development and issuance of a request for proposal for a new consolidated system which is currently in progress. City staff are currently requesting funding of $1.5 million in fiscal year 2023-24 for acquisition and initial implementation and will request an estimated $2.0 million in funding for the continued implementation of a new system as part of the fiscal year 2024-25 SDTIP
It is not currently feasible to determine any operational or replacement costs because they depend on the recommendations of the request for proposal process; staff will identify more definitive costs during the request for proposal process.
Connected Carlsbad Goal
Pursue Communitywide Digital Transformation
H-8
Digital Information Network

Project Benefits
This network will carry the information needed for data processing, email, internet access, public safety applications and a wide range of services that are crucial to city operations.
In 2017, Crown Castle reached a licensing agreement with the city allowing it to install wireless data transmitters on municipal facilities. The agreement with Crown Castle gives the city access to existing fiber-optic cable assets owned by Crown Castle for city use. These cables are made up of multiple fibers which cannot be physically separated from the rest of Crown Castle’s cable infrastructure. The city must make special arrangements with Crown Castle to use this asset.
About This Project
The city has an opportunity to work with a private company called Crown Castle to build a more robust digital information network for its employees and facilities. Beginning in 2019, the city took full advantage of this opportunity and replaced a leased network from a third-party vendor.
As the initial phase of this project has been completed, staff are looking ahead to the second and third phases as originally approved by the City Council. These include leveraging the network to expand services to the Transportation and Utilities departments to replace the aging network infrastructure supporting their key systems. The additional funding request for fiscal year 2023-24 includes elements required for this expansion as well as some feature and functionality enhancements to the services already in place.
Assuming no changes to current funding levels, it is estimated the initial fiscal year operational and replacement requirements will be $50,000 and $100,000 respectively, and $100,000 and $200,000 annually thereafter The cost associated with the prior year funding have previously been included in the Information Technology Department’s Operating or Replacement budget requests.
Connected Carlsbad Goal
Pursue Communitywide Digital Transformation
H-9
Project Funding Source: Technology Investment 6,025,584 $ Managing Department: Information Technology Estimated Annual Costs Increase/(Decrease): Operational 100,000 $ Replacement 200,000 $ Prior Year Req FY23-24 Est FY24-25 Est FY25-26 Est FY27-28 Total Funding Source Budget Budget Budget Budget Budget Budget Tech. Investment 5,025,584 $ 500,000 $ 500,000 $ - $ - $ 6,025,584 $ Est FY26-27 Budget - $
Exploration Hub Computer Upgrade
Project Funding Source:
IT Replacement Fund 43,600 $
Managing Department: Library & Cultural Arts
Estimated Annual Costs
Increase/(Decrease):
Operational None Replacement None
Project Benefits
The Apple Macintosh computers in the exploration hub are due to be replaced. A review of the services provided in the exploration hub revealed that windows-based computers are more consistent with the types of programming offered in the exploration hub.
About This Project
Replace the existing computers in the library exploration hub with windows-based laptops. Migrating to windows-based computers is more consistent with the types of programs offered in the exploration hub and staff have more expertise with the use of windows-based computers and software programs. Transitioning from desktops to laptops provides more flexibility in changing the layout of the exploration hub to match different types of program offerings.
There are no annual operational or replacement costs associated with this project.
Connected Carlsbad Goal
Pursue Communitywide Digital Transformation

H-10
Prior Year Req FY23-24 Est FY24-25 Est FY25-26 Est FY27-28 Total Funding Source Budget Budget Budget Budget Budget Budget IT Replacement - $ 43,600 $ - $ - $ - $ 43,600 $ Est FY26-27 Budget - $
Project Funding Source: Technology Investment 175,916 $
Managing Department: Fleet & Facilities
Project Benefits
Estimated Annual Costs
Increase/(Decrease):
Operational Not known
Replacement Not known
Installing special software and hardware in city fleet vehicles will provide real-time information about how they are being operated to ensure safety, track vehicle health and improve security Tracking city vehicles will also help city departments make better decisions based on routing, staffing and overall operational readiness.
About This Project
Issue a Request for Proposal to Identify, procure and implement an enterprise solution that provides for fleet telematics. This solution is critical for the effective management of the city’s fleet Additionally, the solution will provide data that gives departments active vehicle location for routing, assignment, staffing, and operational readiness evaluations It is not currently feasible to determine any operational or replacement costs because they depend on the recommendations of the request for proposal process; staff will identify more definitive costs during the request for proposal process.
Connected Carlsbad Goal
Pursue Communitywide Digital Transformation
H-11
Fleet Telematics
Prior Year Req FY23-24 Est FY24-25 Est FY25-26 Est FY27-28 Total Funding Source Budget Budget Budget Budget Budget Budget Tech. Investment 45,916 $ 130,000 $ - $ - $ - $ 175,916 $ - $ Est FY26-27 Budget
Staff Managed Print
Project Funding Source: Technology Investment 1,500,000 $
Managing Department: Information Technology
Project Benefits
The increasing use of technology as well as the city’s sustainability goals have reduced the city’s printing needs. By replacing out of date, leased printers, which are approaching end of life, with a smaller number of purchased printers, the city will save an estimated $80,000 a year in electricity, printing supplies and monthly maintenance charges starting in fiscal year 2024-25 Over a five-year period, the city will save approximately $400,000 in operational costs overall.
About This Project
The existing printers deployed throughout the city were leased in 2015. Due to their age, they are becoming unreliable and costly to repair. In many instances, replacement parts are no longer available.
* The new printing fleet will be replaced on a five-year running basis requiring approximately $800,000 in funding expected to come from the Technology Investment Capital Fund each fifth year
Connected Carlsbad Goal
Pursue Communitywide Digital Transformation
H-12
Estimated
Costs Increase/(Decrease): Operational (80,000) $ Replacement None
Prior Year Req FY23-24 Est FY24-25 Est FY25-26 Est FY27-28 Total Funding Source Budget Budget Budget Budget Budget Budget Tech. Investment - $ 700,000 $ - $ - $ 800,000 $ 1,500,000 $ Est FY26-27 Budget - $
Annual
*
BUILD CAPACITY FOR DATA - DRIVEN DECISION MAKING
Business Process Automation
Project Funding Source:
Technology Investment 300,000 $
Managing Department:
Information Technology
Project Benefits
Estimated Annual Costs
Increase/(Decrease):
Operational Not known
Replacement None
Automating manual processes will improve staff productivity, efficiency and service delivery. Business process automation also provides the opportunity to eliminate paper forms and processes, which supports the city’s sustainability goals
About This Project
This project facilitates the ongoing expansion of business process automation by adding licenses to existing city applications that support process automation, such as Laserfiche, ServiceNow and DocuSign, and by engaging vendor support and external consultants to assist with the development of complex workflows.
There is a potential for operational costs to increase if additional licenses are required to support identified automation initiatives There are no replacement costs associated with project.
Connected Carlsbad Goal
Build Capacity for Data-Driven Decision Making
H-13
Prior Year Req FY23-24 Est FY24-25 Est FY25-26 Est FY27-28 Total Funding Source Budget Budget Budget Budget Budget Budget Tech. Investment 150,000 $ 150,000 $ - $ - $ - $ 300,000 $ Est FY26-27 Budget - $
Facility Monitoring and Analytics
Project Funding Source:
Technology Investment 250,000 $
Managing Department:
Innovation & Economic Development
Fleet & Facilities
Library & Cultural Arts
Estimated Annual Costs
Increase/(Decrease): Operational Not known
Replacement Not known
Project Benefits
Automated facility monitoring will provide city staff with the ability to remotely monitor the condition, temperature and power at over 100 city facilities as well as track foot traffic and space utilization within the city’s public spaces such as library facilities and parks. Alerting to conditions in city facilities will allow staff to respond reducing or limiting any potential damage that may occur from these conditions.
The city maintains over 100 facilities that currently have limited monitoring capability to detect conditions such as flooding, power issues or power loss, or abnormal temperatures. Additionally, the existing people counters located at the library are over 11 years and due to be replaced.
About This Project
This project will identify, procure and implement a citywide facility monitoring and traffic analysis solution for city facilities.

It is not currently feasible to determine any operational or replacement costs because they depend on the recommendations of the request for proposal process; staff will identify more definitive costs during the request for proposal process.
Connected Carlsbad Goal
Build Capacity for Data-Driven Decision Making
H-14
Prior Year Req FY23-24 Est FY24-25 Est FY25-26 Est FY27-28 Total Funding Source Budget Budget Budget Budget Budget Budget Tech. Investment - $ 100,000 $ 50,000 $ 50,000 $ - $ 250,000 $ Est FY26-27 Budget 50,000 $
Professional Technical Services for Data Project Delivery
Project Funding Source: Technology Investment 420,000 $
Managing Department: Innovation & Economic Development Information Technology Estimated Annual Costs

Project Benefits
Leverage the expertise of the Esri Advantage program to assist city staff in the development of data visualization tools and dashboards. Combining city data with spatial information allows data to be transformed into graphical or interactive forms that can reveal patterns, trends and insights, presents data in a format that communicates complex information in a clear and engaging way, and enables data-driven decision making.
About This Project
The Esri Advantage Program provides technical consulting to assist staff on projects that combine data from city systems with the spatial data from the city’s geographic information system (GIS) application to provide robust data visualization tools. The program is currently being used to complete the first phase of the Fire Department Standards of Cover project. This funding will allow for staff to be agile in starting and executing new projects that use GIS and Esri. The credits are also flexible so as city needs change, the city can adapt its use of the technical assistance. It is estimated that the city will use at least $70,000 worth of credits in fiscal year 2023-24.
At this time, city staff do not expect this project to result in an increase to operating or replacement costs.
Connected Carlsbad Goal
Build Capacity for Data-Driven Decision Making
H-15
Operational
Replacement
Prior Year Req FY23-24 Est FY24-25Est FY25-26 Est FY27-28 Total Funding Source BudgetBudget BudgetBudget BudgetBudget Tech. Investment 70,000 $ 70,000 $ 70,000 $ 70,000 $ 70,000 $ 420,000 $ Est FY26-27 Budget 70,000 $
Increase/(Decrease):
None
None
Project Benefits
The State of California has established water efficiency and allocation requirements as part of water conservation legislation, Senate Bill 606 and Assembly Bill 1668. These bills require urban water retail suppliers to develop annual urban water use objectives for their service areas that represent the total amount of efficiently used water that can be delivered to the service area. The District needs an application that analyzes data by the components of the water allocation and calculates water use efficiency to help meet the new water efficiency and allocation requirements and to provide the data needed for the annual reporting requirements which began in November 2023.

About This Project
In fiscal year 2022-23, staff implement ed the Waterview Water Efficiency portal to assist the city in meeting legislatively established water conservation goals and reporting requirements for residential parcels. Additional funding is being requested to expand the use of Waterview for commercial and industrial parcels
After initial implementation, city staff estimate operational costs to increase by $42,000 starting in fiscal year 2024-25 There is no replacement cost associated with this project.
Connected
Carlsbad Goal
Build Capacity for Data-Driven Decision Making
H-16
Regulator Water Usage Analytics
Project Funding Source: Utility Operating 65,353 $ Managing Department: Utilities Estimated Annual Costs Increase/(Decrease): Operational 42,000 $ Replacement None Prior Year Req FY23-24 Est FY24-25 Est FY25-26 Est FY27-28 Total Funding Source Budget Budget Budget Budget Budget Budget Utility Operating 50,000 $ 15,353 $ - $ - $ - $ 65,353 $ Est FY26-27 Budget - $
FOSTER A VIBRANT CIVIC ENGAGEMENT CULTURE
Audiovisual Upgrades
Project Funding Source: Technology Investment 1,225,000 $
Managing Department: Information Technology

Estimated Annual Costs
Increase/(Decrease):
Operational None
Replacement Unknown
Project Benefits
This project allows for the standardization of audiovisual equipment within the city’s work facilities so personnel can conduct business with internal and external resources virtually without the need to move between facilities for meetings.
About This Project
This project provides for upgrades and growth of the city’s audiovisual equipment The work landscape has changed audiovisual equipment that previously supported in-person meetings in a room are now supporting meetings held virtually. The IT Department will update and maintain audiovisual equipment to meet this new work environment and other necessary enhancements to legacy technology.
There are no annual operational cost changes associated with this project. City staff cannot feasibly estimate replacement costs if any until after the new equipment is purchased
Connected Carlsbad Goal
Foster a Vibrant Civic Engagement Culture
H-17
Prior Year Req FY23-24 Est FY24-25 Est FY25-26 Est FY27-28 Total Funding Source Budget Budget Budget Budget Budget Budget Tech. Investment 725,000 $ 100,000 $ 100,000 $ 100,000 $ 100,000 $ 1,225,000 $ Est FY26-27 Budget 100,000 $
ENHANCE ACCESSIBILITY AND TRANSPARENCY
Patron Print/Copy/PC Management

Project Funding Source: Technology Investment 88,000 $
Managing Department: Information Technology
Estimated Annual Costs
Increase/(Decrease): Operational None Replacement None
Project Benefits
The existing system is due to be replaced and the Library & Cultural Arts Department is looking to enhance the system.
About This Project
This project replaces the existing print/copy/PC management system used at the various library locations within the city In fiscal year 2022-23, computers and servers associated with the system were replaced. In fiscal year 2024-25, the library will be completing a request for proposal to identify and implement a new management solution.
At this time, city staff do not expect this project to result in an increase to operating or replacement costs.
Connected Carlsbad Goal
Enhance Accessibility and Transparency
H-18
Prior Year Req FY23-24 Est FY24-25 Est FY25-26 Est FY27-28 Total Funding Source Budget Budget Budget Budget Budget Budget Tech. Investment 18,000 $ 70,000 $ - $ - $ - $ 88,000 $ - $ Est FY26-27 Budget
Records Digitization
Project Funding Source: Technology Investment 200,000 $
Managing Department: Information Technology
Project Benefits
None
None
There are multiple departments that have a large volume of physical records. These records take up office space and are not easily accessible or searchable.
About This Project
This project involves issuing a request for qualifications, selecting one or more vendors, and establishing master agreements for firms that can assist departments in scanning and digitizing paper documents. These digitized documents will then be loaded into the city’s Laserfiche records management system making them more accessible to staff and the public.
At this time, city staff do not expect this project to result in an increase to operating or replacement costs
Connected Carlsbad Goal
Enhance Accessibility and Transparency
H-19
Estimated
Costs Increase/(Decrease): Operational
Replacement
Prior Year Req FY23-24 Est FY24-25 Est FY25-26 Est FY27-28 Total Funding Source Budget Budget Budget Budget Budget Budget Tech. Investment - $ 100,000 $ 100,000 $ - $ - $ 200,000 $ Est FY26-27 Budget - $
Annual
PROMOTE SECURITY AND SUSTAINABILITY THROUGH CONNECTIVITY
Annual Hardware and Infrastructure Replacement
Project Funding Source: IT Replacement Fund 6,903,142 $
Managing Department: Information Technology
Estimated Annual Costs
Increase/(Decrease): Operational None Replacement None
Project Benefits
Citywide hardware and infrastructure changes are necessary and ongoing. Replacement equipment is needed to support the city's technology infrastructure and department-specific needs.
About This Project
This project provides for replacement equipment funding for scheduled replacement of laptops, desktops, internal servers, routers, switches, and other network and data center requirements.

There is no increase or decrease in operational costs associated with the annual replacement program. Due to the circular nature of the replacement program, replacement costs fluctuate annually depending on the hardware life cycles which can range from three years to 20 years.
Connected Carlsbad Goal
Promote Security and Sustainability through Connectivity
H-20
Prior Year Req FY23-24 Est FY24-25 Est FY25-26 Est FY27-28 Total Funding Source Budget Budget Budget Budget Budget Budget IT Replacement 790,000 $ 978,142 $ 1,485,000 $ 1,100,000 $ 1,500,000 $ 6,903,142 $ Est FY26-27 Budget 1,050,000 $
Cyber Security Program Development
Investment 950,000 $
Project Benefits
As a result of internal assessments and evaluations by external parties, city staff have identified certain initiatives within the five functions of the cybersecurity framework to translate into projects. Implementation of these projects will incur costs and require funding. The funding will cover assessment and evaluation, implementation, and staff training. Once the security infrastructure is in place, operational costs will move to the operation budget. City staff identified and planned the following projects for implementation:
• Disaster Recovery program assessment and development,
• Detection capability with security incident and event management technology,
• Cybersecurity governance program,
• Data classification tools, and
• Incident response procedure development and training.
About This Project
The cybersecurity program provides support and protection to the City of Carlsbad so it can successfully accomplish its mission. As the threat landscape is changing and getting more sophisticated in lockstep with advances in technology, we need to ensure the city’s cybersecurity program is robust enough to keep threat actors from causing harm to the city.
To ensure we address the different areas and aspects of cybersecurity, city staff have developed and adopted an approach based on the National Institute of Standards and Technology Cybersecurity Framework to cybersecurity defense program which covers five functions:
• Identify – Develop the organizational understanding to manage cybersecurity risk to systems, assets, data and capabilities. The activities in the Identify function are foundational for effective use of the Framework. Understanding the business context, the resources that support critical functions, and the related cybersecurity risks enables an organization to focus and prioritize its efforts, consistent with its risk management strategy and business needs. Examples of outcome categories within this function include Asset Management, Business Environment, Governance, Risk Assessment and Risk Management Strategy.

H-21
Technology
Managing
Information
Estimated Annual Costs Increase/(Decrease): Operational Unknown Replacement
Prior Year Req FY23-24 Est FY24-25 Est FY25-26 Est FY27-28 Total Funding Source Budget Budget Budget Budget Budget Budget Tech. Investment 450,000 $ 100,000 $ 100,000 $ 100,000 $ 100,000 $ 950,000 $ 100,000 $ Est FY26-27 Budget
Project Funding Source:
Department:
Technology
Unknown
• Protect – Develop and implement the appropriate safeguards to ensure delivery of critical infrastructure services. The Protect function supports the ability to limit or contain the impact of a potential cybersecurity event. Examples of outcome categories within this function include Access Control, Awareness and Training, Data Security, Information Protection Processes and Procedures, Maintenance, and Protective Technology.
• Detect – Develop and implement the appropriate activities to identify the occurrence of a cybersecurity event. The Detect function enables timely discovery of cybersecurity events. Examples of outcome categories within this function include Anomalies and Events, Security Continuous Monitoring, and Detection Processes.
• Respond – Develop and implement the appropriate activities to act regarding a detected cybersecurity event. The Respond function supports the ability to contain the impact of a potential cybersecurity event. Examples of outcome categories within this function include Response Planning, Communications, Analysis, Mitigation and Improvements.
• Recover – Develop and implement the appropriate activities to maintain plans for resilience and to restore any capabilities or services that were impaired due to a cybersecurity event. The Recover function supports timely recovery to normal operations to reduce the impact from a cybersecurity event. Examples of outcome categories within this function include Recovery Planning, Improvements and Communications.
At this time and depending on the types of programs implemented over the course of the project, city staff cannot feasibly determine any operational or replacement costs for fiscal year 2024-25 and beyond. For fiscal year 2023-24 an additional $132,000 has been request as part of the budget process for on-going Varonis security services.
Connected Carlsbad Goal
Promote Security and Sustainability through Connectivity
H-22
Payment Works
Project Benefits
The current process for enrolling a vendor to receive electronic payments involves the completion of a paper form. Staff must then manually validate the information and enter the vendor’s information into the city’s financial application. Additionally, if the city receives a request to change a vendor’s banking information, there is not an automated process to validate the accuracy and legitimacy of the information which puts the city at risk for attempted fraud.
About This Project
This project involves the implementation of the Payment Works solution to digitally onboard vendors, validate that vendor information is valid and legitimate and provides a mechanism for vendors to request updates to their payment information that is secure and verified. This will eliminate paper forms which supports the city’s sustainability goals, significantly improves business processes, and reduces the risk of fraud

After initial implementation, staff estimate operational costs to increase by $54,000 starting in fiscal year 2024-25. There is no replacement cost associated with this project.
Connected Carlsbad Goal
Promote Security and Sustainability through Connectivity
H-23
Project Funding Source: Technology Investment 68,600 $ Managing Department: Finance Estimated Annual Costs Increase/(Decrease): Operational 54,000 $ Replacement None Prior Year Req FY23-24 Est FY24-25Est FY25-26 Est FY27-28 Total Funding Source BudgetBudget BudgetBudget BudgetBudget Tech. Investment - $ 68,600 $ - $ - $ - $ 68,600 $ Budget - $ Est FY26-27
MINOR PROJECTS
Pursue Communitywide Digital Transformation Projects and Strategic Initiatives
Past Perfect Upgrade/Migration
This project involves upgrading the application used by recreation for tracking items in the Leo Carrillo Collection and migrating from on-premises to the vendor’s cloud offering. Moving to the cloud will allow for broader staff access as well as introduce accessibility to the public.
Enhance Accessibility and Transparency
Expansion of Yardi
Expand the use of the existing Yardi Voyager application used in Housing and Homeless Services by conducting a business process review, hosting staff training, and implementing an online applicant portal.
FUTURE PROJECTS
Estimated Fiscal Year 2023-24 through 2027-28 Appropriations by Goal
The City of Carlsbad’s SDTIP for fiscal year 2023-24 to fiscal year 2027-28 outlines 44 projects at an estimated total cost of $33.7 million. Of the $33.7 million, $19.5 million is for new or increased funding for projects over the next five years. The information provided for future years reflects the most comprehensive snapshot of known or anticipated future projects as well as associated estimated costs.
Estimated Future Projects Costs by Goal
FY 2023-24 to FY 2027-28
$19.5 million
Build Capacity for Datadriven Decision Making, $1.9M, 10%
Pursue Communitywide Digital Transformation, $6.9M, 35%
Enhance Accessibility and Transparency, $0.4M, 2%
Foster a Vibrant Civic Engagement Culture, $0.5, 3%
Promote Security and Sustainability through Connectivity, $9.8M, 50%
H-24
Estimated Fiscal Year 2023-24 Appropriations by Goal
The fiscal year 2023-24 SDTIP outlines $4.6 million in new appropriations for fiscal year 2023-24 to provide additional funding for the continuation of existing projects as well as funding for new projects.
Requested
FY 2023-24 Appropriations by Goal
$4.6 million
Build Capacity for Data-driven Decision Making, $0.3M, 7%
Pursue Communitywide Digital Transformation, $2.9M, 63%
Enhance Accessibility and Transparency, $0.2M, 4%
Foster a Vibrant Civic Engagement Culture, $0.1M, 2%
Promote Security and Sustainability through Connectivity, $1.1M, 24%
H-25
Estimated Fiscal Year 2024-25 through 2027-28 Pending Current or New Projects with Future Funding Requests
The projects listed in the table below represent projects that have been presented to the SDTIP Committee but are not requesting funding or have been delayed for the fiscal year 2023-24 budget year. These projects will be reevaluated for the fiscal year 2024-25 budget year and if approved for funding in fiscal year 2024-25 will then have a project page included as part of the SDTIP in fiscal year 2024-25 or as appropriate. These projects have been included in the estimated five-year tables and funding projections.
H-26
Connected Requested EstimatedEstimatedEstimatedEstimatedEstimated Carlsbad Funding Prior Year 1Year 2Year 3Year 4Year 5 Total Goal Source Appropriation 2023-242024-252025-262026-272027-28 Funding RFID Replacement PCDT TICF - $ - $ 600,000 $ - $ - $ - $ 600,000 $ Utility Billing Automation PCDT UEF - - 75,000 - - - 75,000 Tightrope PCDT TICF - - 35,000 - - - 35,000 Data Governance and Operational Analytics BCDDM TICF 405,000 - 50,000 50,000 - - 505,000 Discovery Management Assessment BCDDM TICF 30,000 - 140,000 - - - 170,000 Meter Data Management/Utility Analytics BCDDM UEF - - 550,000 - - - 550,000 Permit Process Automation BCDDM TICF - - 200,000 200,000 - - 400,000 Civic Engagement with Open Data EAT TICF 198,000 - 50,000 - - - 248,000 Virtual Permitting Counter (OpenCounter) EAT TICF 61,000 - 23,000 - - - 84,000 Remote Hold Pickup Locker EAT TICF - - 40,000 - - - 40,000 Command Central A/V Infrastucture PSSC TICF - - 200,000 - - - 200,000 Facility Security Master Plan PSSC TICF 200,000 - 721,000 311,000 438,000 222,000 1,892,000 Police Body Camera Replacement PSSC TICF - - 500,000 - - - 500,000 Police In-car Video Replacement PSSC TICF - - - - - 550,000 550,000 Police Records Management Migration PSSC TICF - - 200,000 - - - 200,000 Major Incident/Special Event Management System PSSC TICF - - 20,000 - - - 20,000 Police Mobile Device IOS Transition PSSC TICF - - 5,000 - - - 5,000 894,000 $ - $ 3,409,000 $ 561,000 $ 438,000 $ 772,000 $ 6,074,000 $ Connected Carlsbad Goal Abbreviations Build Capacity for Data-driven Decision Making = BCDDM Enhance Accessibility and Transparency = EAT Foster a Vibrant Civic Engagement Culture = FVCEC Promote Security and Sustainability through Connectivity
PSSC Pursue Communitywide Digital Transformation
PCDT Funding Source Abbreviations Information Technology Replacement Fund = ITRF Technology Investment Capital Fund = TICF Utilities Enterprise Funds (Operating or Capital) = UEF Project Name
=
=
FIVE-YEAR SCHEDULE OF PROJECTS BY CONNECTED CARLSBAD GOAL
H-27
Requested EstimatedEstimatedEstimatedEstimatedEstimated Funding Prior Year 1Year 2Year 3Year 4Year 5 Total Project Name Source Appropriation 2023-242024-252025-262026-272027-28 Funding Consolidation & Replacement of Core Systems TICF 900,000 $ 1,500,000 $ 2,000,000 $ - $ - $ - $ 4,400,000 $ Digital Information Network TICF 5,025,584 500,000 500,000 - - - 6,025,584 Enterprise Asset Management System TICF 1,600,000 - - - - - 1,600,000 Exploration Hub Upgrade ITRF - 43,600 - - - - 43,600 Fleet Telematics TICF 45,916 130,000 - - - - 175,916 Project Portfolio Management Tool & Consulting TICF 500,000 - - - - - 500,000 RFID Replacement TICF - - 600,000 - - - 600,000 Staff Managed Print TICF - 700,000 - - - 800,000 1,500,000 Utility Billing Automation UEF - - 75,000 - - - 75,000 Utility Billing Portal UEF 90,000 - - - - - 90,000 Past Perfect Upgrade/Migration TICF - 5,000 - - - - 5,000 Tightrope TICF - - 35,000 - - - 35,000 8,161,500 2,878,600 3,210,000 - - 800,000 15,050,100 Business Process Automation TICF 150,000 150,000 - - - - 300,000 Data Governance and Operational Analytics TICF 405,000 - 50,000 50,000 - - 505,000 Discovery Management Assessment TICF 30,000 - 140,000 - - - 170,000 Facility Monitoring and Analytics TICF - 100,000 50,000 50,000 50,000 250,000 Meter Data Management/Utility Analytics UEF - - 550,000 - - - 550,000 Permit Process Automation TICF - - 200,000 200,000 - - 400,000 Professional Technical Services for Data Project Delivery TICF 70,000 70,000 70,000 70,000 70,000 70,000 420,000 Regulatory Water Usage Analytics (Operating Funds) UEF 50,000 15,353 - - - - 65,353 705,000 335,353 1,060,000 370,000 120,000 70,000 2,660,353 Audio Visual Upgrades TICF 725,000 100,000 100,000 100,000 100,000 100,000 1,225,000 Outdoor Wireless Study TICF 100,000 - - - - - 100,000 825,000 100,000 100,000 100,000 100,000 100,000 1,325,000 Civic Engagement with Open Data TICF 198,000 - 50,000 - - - 248,000 Enterprise Digital Asset Management TICF 400,000 - - - - - 400,000 Online Permitting/Electronic Reviews (E-Reviews) TICF 645,000 - - - - - 645,000 Patron Print/Copy/PC Management TICF 18,000 70,000 - - - - 88,000 Record Digitization TICF - 100,000 100,000 - - - 200,000 Virtual Permitting Counter (OpenCounter) TICF 61,000 - 23,000 - - - 84,000 Expansion of Yardi TICF - 30,000 - - - - 30,000 Next Generation Online Catalog TICF 40,000 (40,000) - - - -Remote Hold Pickup Locker TICF - - 40,000 - - - 40,000 1,362,000 160,000 213,000 - - - 1,735,000 Annual Hardware and Infrastructure Replacement ITRF 790,000 978,142 1,485,000 1,100,000 1,050,000 1,500,000 6,903,142 Command Central A/V Infrastucture TICF - - 200,000 - - - 200,000 Computer Aided Dispatch (CAD) TICF 1,580,000 - - - - - 1,580,000 Cyber Security Program Development TICF 450,000 100,000 100,000 100,000 100,000 100,000 950,000 Electronic Patient Care Reporting TICF 50,000 (50,000) - - - -Facility Security Master Plan TICF 200,000 - 721,000 311,000 438,000 222,000 1,892,000 Live 911 TICF 66,380 - - - - - 66,380 Payment Works TICF - 68,600 - - - - 68,600 Police Body Camera Replacement TICF - - 500,000 - - - 500,000 Police In-car Video Replacement TICF - - - - - 550,000 550,000 Police Records Management Migration TICF - - 200,000 - - - 200,000 Major Incident/Special Event Management System TICF - - 20,000 - - - 20,000 Police Mobile Device IOS Transition TICF - - 5,000 - - - 5,000 3,136,380 1,096,742 3,231,000 1,511,000 1,588,000 2,372,000 12,935,122 14,189,880 $ 4,570,695 $ 7,814,000 $ 1,981,000 $ 1,808,000 $ 3,342,000 $ 33,705,575 $ Information Technology Replacement Fund = ITRF Technology Investment Capital Fund = TICF Utilities Enterprise Funds (Operating or Capital) = UEF Foster a Vibrant Civic Engagement Culture Projects Total Funding Source Abbreviations Promote Security and Sustainability through Connectivity Total Foster a Vibrant Civic Engagement Culture Total Enhance Accessibility and Transparency Enhance Accessibility and Transparency Total Promote Security and Sustainability through Connectivity Connected Carlsbad Goal Pursue Communitywide Digital Transformation Build Capacity for Data-driven Decision Making Build Capacity for Data-driven Decision Making Total Pursue Communitywide Digital Transformation Total
FIVE-YEAR SCHEDULE OF PROJECTS BY FUND
Build Capacity
Enhance Accessibility and Transparency = EAT
= BCDDM
Foster a Vibrant Civic Engagement Culture = FVCEC
Promote Security and Sustainability through Connectivity = PSSC
Pursue Communitywide Digital Transformation = PCDT
H-28
Connected EstimatedEstimatedEstimatedEstimatedEstimatedEstimated Carlsbad Prior Year 2Year 3Year 4Year 5Year 5 Total Project Name Goal Appropriation 2023-242024-252025-262026-272027-28 Funding Technology Investment Capital Fund Audio Visual Upgrades FVCEC 725,000 $ 100,000 $ 100,000 $ 100,000 $ 100,000 $ 100,000 $ 1,225,000 $ Business Process Automation BCDDM 150,000 150,000 - - - - 300,000 Civic Engagement with Open Data EAT 198,000 - 50,000 - - - 248,000 Command Central A/V Infrastucture PSSC - - 200,000 - - - 200,000 Computer Aided Dispatch (CAD) PSSC 1,580,000 - - - - - 1,580,000 Consolidation & Replacement of Core Systems PCDT 900,000 1,500,000 2,000,000 - - - 4,400,000 Cyber Security Program Development PSSC 450,000 100,000 100,000 100,000 100,000 100,000 950,000 Data Governance and Operational Analytics BCDDM 405,000 - 50,000 50,000 - - 505,000 Digital Information Network PCDT 5,025,584 500,000 500,000 - - - 6,025,584 Discovery Management Assessment BCDDM 30,000 - 140,000 - - - 170,000 Electronic Patient Care Reporting PSSC 50,000 (50,000) - - - -Enterprise Asset Management System PCDT 1,600,000 - - - - - 1,600,000 Enterprise Digital Asset Management EAT 400,000 - - - - - 400,000 Facility Monitoring and Analytics BCDDM - 100,000 50,000 50,000 50,000 - 250,000 Facility Security Master Plan PSSC 200,000 - 721,000 311,000 438,000 222,000 1,892,000 Fleet Telematics PCDT 45,916 130,000 - - - - 175,916 Live 911 PSSC 66,380 - - - - - 66,380 Online Permitting/Electronic Reviews (E-Reviews) EAT 645,000 - - - - - 645,000 Outdoor Wireless Study FVCEC 100,000 - - - - - 100,000 Patron Print/Copy/PC Management EAT 18,000 70,000 - - - - 88,000 Payment Works PSSC - 68,600 - - - - 68,600 Permit Process Automation BCDDM - - 200,000 200,000 - - 400,000 Police Records Management Migration PSSC - - 200,000 - - - 200,000 Police Body Camera Replacement PSSC - - 500,000 - - - 500,000 Police In-car Video Replacement PSSC - - - - - 550,000 550,000 Professional Technical Services for Data Project Delivery BCDDM 70,000 70,000 70,000 70,000 70,000 70,000 420,000 Project Portfolio Management Tool & Consulting PCDT 500,000 - - - - - 500,000 Record Digitization EAT - 100,000 100,000 - - - 200,000 RFID Replacement PCDT - - 600,000 - - - 600,000 Staff Managed Print PCDT - 700,000 - - - 800,000 1,500,000 Virtual Permitting Counter (OpenCounter) EAT 61,000 - 23,000 - - - 84,000 Expansion of Yardi EAT - 30,000 - - - - 30,000 Major Incident/Special Event Management System PSSC - - 20,000 - - - 20,000 Next Generation Online Catalog EAT 40,000 (40,000) - - - -Past Perfect Upgrade/Migration PCDT - 5,000 - - - - 5,000 Police Mobile Device IOS Transition PSSC - - 5,000 - - - 5,000 Remote Hold Pickup Locker EAT - - 40,000 - - - 40,000 Tightrope PCDT - - 35,000 - - - 35,000 Technology Investment Capital Fund Total 13,259,880 3,533,600 5,704,000 881,000 758,000 1,842,000 25,978,480 Information Technology Replacement Fund Annual Hardware and Infrastructure Replacement PSSC 790,000 978,142 1,485,000 1,100,000 1,050,000 1,500,000 6,903,142 Exploration Hub Upgrade PCDT - 43,600 - - - - 43,600 Information Technology Replacement Fund Total 790,000 1,021,742 1,485,000 1,100,000 1,050,000 1,500,000 6,946,742 Utilities Enterprise Funds (Operating or Capital) Meter Data Management/Utility Analytics BCDDM - - 550,000 - - - 550,000 Regulatory Water Usage Analytics (Operating Funds) BCDDM 50,000 15,353 - - - - 65,353 Utility Billing Automation PCDT - - 75,000 - - - 75,000 Utility Billing Portal PCDT 90,000 - - - - - 90,000 Total Utilities Enterprise Funds (Operating or Capital) 140,000 15,353 625,000 - - - 780,353 14,189,880 $ 4,570,695 $ 7,814,000 $ 1,981,000 $ 1,808,000 $ 3,342,000 $ 33,705,575 $ Connected Carlsbad Goal Abbreviations
for Data-driven Decision Making
Funding Source ProjectsTotal
PROJECT FUNDING SOURCES
Technology Investment Capital Fund – Funds set aside on a yearly basis to fund ongoing SDTIP digital transformation and technology projects Revenue is mostly comprised of an annual General Fund transfer, estimated based on a portion of the transfer of 6% of General Fund revenues, in accordance with Council Policy No. 91 – Long Term General Fund Capital Funding Policy.
Information Technology Replacement Fund – Funds are collected annually from the city’s operating departments as part of the IT Department internal service fund chargeback; charges are based on an asset’s lifecycle and original cost. These funds are used to replace assets at the end of their useful lives
Utilities Enterprise Funds (Operating or Capital) – For information regarding the Utilities Enterprise Funds, please see the Public Works Section of the Fiscal Year 2023-24 Operating Budget and for the Capital Funds please see the CIP Section of the Fiscal Year 2023-24 Operating Budget.
PROJECTED FUND BALANCES
H-29
TECHNOLOGY INVESTMENT CAPITAL FUND FUNDS AVAILABILITY PROJECTION Estimated Requested EstimatedEstimatedEstimatedEstimated Balance Year 1Year 2Year 3Year 4Year 5 2022-232023-242024-252025-262026-272027-28 2,762,560 $ 3,414,960 $ 2,010,960 $ 5,541,960 $ 9,340,960 $ Transfers In 4,096,000 4,187,000 4,271,000 4,381,000 4,600,050 Interest Revenue 90,000 113,000 141,000 176,000 184,000 Project Appropriations 3,533,600 5,704,000 881,000 758,000 1,842,000 3,414,960 $ 2,010,960 $ 5,541,960 $ 9,340,960 $ 12,283,010 $ 2,762,560 $ Beginning Available Balance Ending Available Balance Balance Available for Future Projects INFORMATION TECHNOLOGY DEPARTMENT REPLACEMENT FUND FUNDS AVAILABILITY PROJECTION Requested EstimatedEstimatedEstimatedEstimated Balance Year 1Year 2Year 3Year 4Year 5 2022-232023-242024-252025-262026-272027-28 2,349,929 $ 2,896,227 $ 2,761,227 $ 3,011,227 $ 3,311,227 $ Replacement Cost Revenue 1,568,040 1,350,000 1,350,000 1,350,000 1,350,000 Replacement Appropriations 1,021,742 1,485,000 1,100,000 1,050,000 1,500,000 2,896,227 $ 2,761,227 $ 3,011,227 $ 3,311,227 $ 3,161,227 $ 2,349,929 $ Estimated Available Funds Ending Available Balance Beginning Available Balance
REVENUE PROJECTIONS SCHEDULE
BUDGET EXPENDITURE SCHEDULE
H-30
2019-202020-212021-222022-23 2023-24 ActualActualActual Projected Estimated RevenueRevenueRevenueRevenueRevenue Technology Investment Capital NA NA 10,747,619 $ 4,076,004 $ 4,186,000 $ Information Technology Department Replacement 810,400 1,221,363 1,491,070 1,555,005 1,568,040 Total 810,400 $ 1,221,363 $ 12,238,689 $ 5,631,009 $ 5,754,040 $ Fund 2020-212021-222022-232023-242023-242023-24 ActualActual Estimated Continuing New Total ExpenseExpenseExpense Appropriations Appropriations Appropriations Technology Investment Capital NA 1,615,320 $ 2,100,000 $ 7,076,551 $ 3,533,600 $ 10,610,151 $ Information Technology Department Replacement 1,822,434 935,994 1,396,948 554,580 1,021,742 1,576,322 Total 1,822,434 $ 2,551,314 $ 3,496,948 $ 7,631,131 $ 4,555,342 $ 12,186,473 $ Fund
PROJECT ESTIMATED OPERATIONAL REQUIREMENTS
The projects listed on the table below represent projects that have been determined will have or may have operating budget impacts in the fiscal year identified. Projects that have a zero listed for each fiscal year are pending an estimate due to the possible solution having to many pending variables. Once a more exact solution is identified the operational estimate will be updated. As the fiscal years identified on the table become the next budgeting year, the Information Technology Department will include a request for the additional operating budget in the department’s annual operating budget request.
* Listing only includes projects with expected changes in operational budget requirements. If listed with a zero amount, staff have not been able to determine that amount with the current information.
H-31
Total Year 1Year 2Year 3Year 4Year 5 Project Name Funding 2023-242024-252025-262026-272027-28 Totals Business Process Automation 300,000 $ - $ - $ - $ - $ - $ - $ Civic Engagement with Open Data 248,000 - 100,000 50,000 25,000 - 175,000 Command Central A/V Infrastucture 200,000 - - - - -Computer Aided Dispatch (CAD) 1,580,000 150,000 20,000 - - - 170,000 Cyber Security Program Development 950,000 132,500 - - - - 132,500 Data Governance and Operational Analytics 505,000 125,000 75,000 60,000 50,000 50,000 360,000 Digital Information Network 6,025,584 - 150,000 150,000 - - 300,000 Discovery Management Assessment 170,000 - - - - -Enterprise Asset Management System 1,600,000 20,000 - - - - 20,000 Enterprise Digital Asset Management 400,000 - - 75,000 - - 75,000 Expansion of Yardi 30,000 1,500 - - - - 1,500 Facility Monitoring and Analytics 250,000 - - - - -Facility Security Master Plan 1,892,000 - - 150,000 150,000 150,000 450,000 Fleet Telematics 175,916 - - - - -Live 911 66,380 - 60,000 - - - 60,000 Major Incident/Special Event Management System 20,000 - - - - -Meter Data Management/Utility Analytics 550,000 - - 175,000 - - 175,000 Online Permitting/Electronic Reviews (E-Reviews) 645,000 - 27,300 - - - 27,300 Past Perfect Upgrade/Migration 5,000 2,000 - - - - 2,000 Payment Works 68,600 - 54,000 - - - 54,000 Permit Process Automation 400,000 - - - - -Police Records Management Migration 200,000 - - 54,000 - - 54,000 Project Portfolio Management Tool & Consulting 500,000 165,000 - - - - 165,000 Regulatory Water Usage Analytics (Operating Funds) 65,353 - 42,000 - - - 42,000 Remote Hold Pickup Locker 40,000 - - 4,000 - - 4,000 RFID Replacement 600,000 - - - - -Staff Managed Print 1,500,000 - (80,000) - - - (80,000) Tightrope 35,000 - - - - -Utility Billing Automation 75,000 - - 7,500 - - 7,500 Virtual Permitting Counter (OpenCounter) 84,000 - - 34,500 - - 34,500 19,180,833$ 596,000 $ 448,300 $ 760,000 $ 225,000 $ 200,000 $ 2,229,300 $
FISCAL YEAR 2023-24 ROADMAP Strategic Digital Transformation Investment Program FY 2023-24 Schedule
H-32
Legend: Project Ongoing GOAL INITIATIVES Consolidation & Replacement of Core Systems Digital Information Network Enterprise Asset Management Exploration Hub Computer Upgrade Fleet Telematics Staff Managed Print Past Perfect Upgrade/Migration GOAL INITIATIVES Business Process Automation Data Governance and Operational Analytics Professional Technical Services for Data Project Delivery Facility Monitoring and Analytics Regulatory Water Usage Analytics GOAL INITIATIVES Audio Visual Upgrades Outdoor Wireless Study GOAL INITIATIVES Civic Engagement with Open Data Patron Print/Copy/PC Management Enterprise Digital Asset Management Records Digitization Online Permitting/Electronic Reviews (E-Review) Expansion of Yardi Virtual Permitting Counter (OpenCounter) GOAL INITIATIVES Annual Hardware and Infrastructure Replacement Computer Aided Dispatch (CAD) Cyber Security Program Development Ensure Adoption of Relevant New Technologies are Mirrored into EOC Facility Security Master Plan Payment Works Traffic Management Functionality Enhancement NOV DEC DEC DEC DEC DEC NOV NOV NOV NOV AUG JUL OCT SEP SEP Pursue Community Wide Digital Transformation JUL AUG JUL AUG Foster a Vibrant Civic Engagement Culture Build Capacity for Datadriven Decision Making SEP OCT OCT Promote Safety and Sustainability through Connectivity OCT OCT JUL AUG SEP Enhance Accessibility and Transparency JUL AUG SEP JAN JAN JAN JAN JAN FEB FEB FEB FEB FEB MAR MAR MAR MAR MAR APR APR APR APR APR MAY MAY MAY MAY MAY JUN JUN JUN JUN JUN RFP Selection ContractCouncil Kick off Ongoing Ongoing Ongoing Ongoing Implementation Implementation Pilot Roll Out Ongoing RFP Selection Implementation Requirements RFP Selection Implementation Ongoing Ongoing Roll Out Implementation Implementation Implementation Implementation TBD Ongoing TBD Ongoing Implementation Ongoing Acquire Hardware Implementation Implementation RFQ Ongoing BPR TrainingImplementation TBD
H-33
Strategic Digital Transformation Investment Program5-Year Roadmap Legend: In progress Approved Evaluating Ongoing Q1Q2Q3Q4Q1Q2Q3Q4Q1Q2Q3Q4Q1Q2Q3Q4Q1Q2Q3Q4Q1Q2Q3Q4 Civic Engagement with Open Data Enterprise Digital Asset Management Online Permitting/Electronic Reviews (E-Review) Expansion of Yardi Patron Print/Copy/PC Management Records Digitization Remote Hold Pickup Locker Virtual Permitting Counter (OpenCounter) Q1Q2Q3Q4Q1Q2Q3Q4Q1Q2Q3Q4Q1Q2Q3Q4Q1Q2Q3Q4Q1Q2Q3Q4 Annual Hardware and Infrastructure Replacement Computer Aided Dispatch (CAD) Cyber Security Program Development Facility Security Master Plan Payment Works Traffic Management Functionality Enhancement Ensure Adoption of Relevant New Technologies are Mirrored into EOC Major Incident/Special Event Management Command Central A/V Infrastructure Police Records Management Migration Police Body Camera Replacement Police In-car Video Replacement Prior Years In progresshas been fully approved and work has started Approvedhas been fully approved but work has not started Evaluatingstaff is currently studying merit and cost of initiative/project Enhance Accessibility and Transparency GOAL INITIATIVES FY 2023-24 FY 2024-25 FY2025-26 FY2026-27 FY2027-28 FY2026-27 FY2027-28 Promote Safety and Sustainability through Connectivity GOAL INITIATIVES Prior Years FY 2023-24 FY 2024-25 FY2025-26 Ongoingannual process
FIVE-YEAR ROADMAP
H-34
Strategic Digital Transformation Investment Program5-Year Roadmap Legend: In progress Approved Evaluating Ongoing Q1 Q2 Q3 Q4 Q1 Q2 Q3 Q4 Q1 Q2 Q3 Q4 Q1 Q2 Q3 Q4 Q1 Q2 Q3 Q4 Q1 Q2 Q3 Q4 Consolidation & Replacement of Core Systems Digital Information Network Enterprise Asset Management System Exploration Hub Computer Upgrade Utility Billing Automation Utility Billing Portal Fleet Telematics PastPerfect Upgrade/Migration Staff Managed Print RFID Replacement Tightrope Transition to a Single Identity for Users of City Services Q1 Q2 Q3 Q4 Q1 Q2 Q3 Q4 Q1 Q2 Q3 Q4 Q1 Q2 Q3 Q4 Q1 Q2 Q3 Q4 Q1 Q2 Q3 Q4 Business Process Automation Data Governance and Operational Analytics Discovery Management Meter Data Management/Utility Analytics Professional Technical Services for Data Project Delivery Regulatory Water Usage Analytics Facility Monitoring and Analytics Permit Process Automation Q1 Q2 Q3 Q4 Q1 Q2 Q3 Q4 Q1 Q2 Q3 Q4 Q1 Q2 Q3 Q4 Q1 Q2 Q3 Q4 Q1 Q2 Q3 Q4 Audio Visual Upgrades Outdoor Wireless Study FY2027-28 FY2027-28 FY2027-28 In progresshas been fully approved and work has started Approvedhas been fully approved but work has not started FY2026-27 FY2026-27 FY2026-27 Prior Years FY 2023-24 FY 2023-24 Prior Years Prior Years FY 2024-25 FY2025-26 FY 2024-25 FY 2024-25 FY2025-26 FY2025-26 FY 2023-24 INITIATIVES GOAL GOAL Build Capacity for Datadriven Decision Making GOAL Pursue Community Wide Digital Transformation INITIATIVES INITIATIVES Foster a Vibrant Civic Engagement Culture Evaluatingstaff is currently studying merit and cost of initiative/project Ongoingannual process
FIVE-YEAR ROADMAP – CONTINUED
CAPITAL IMPROVEMENT PROGRAM
The City of Carlsbad Capital Improvement Program reflects the city’s ongoing commitment to maintaining the highest standards of quality facilities for our community today and in the future. It is a planning document, not a commitment for spending. The 15-year program outlines the expenditure plan for future capital projects and the corresponding revenues to pay for those expenditures.
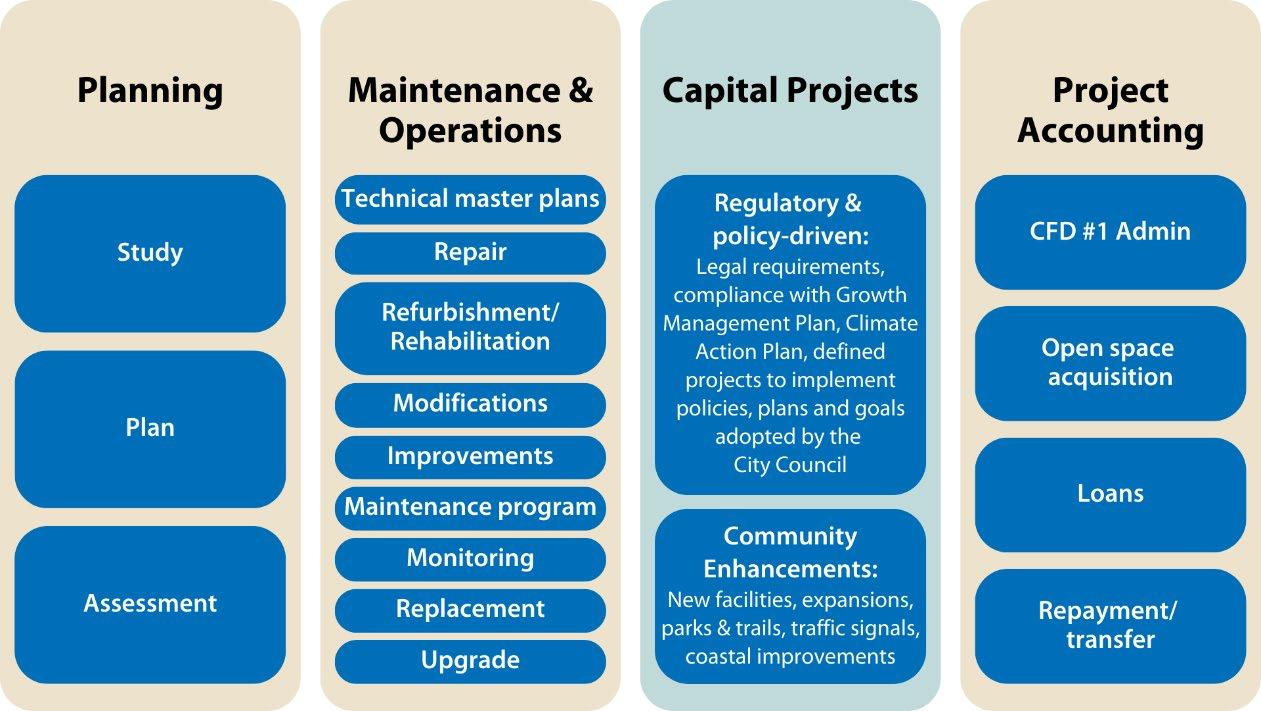
Projects that are shown in the CIP are generally defined as any construction, rehabilitation or replacement of major infrastructure such as streets, libraries, parks, fire stations and administrative facilities, water, sewer and drainage facilities, and other facilities that are located on or in the ground. In most cases, the total construction cost of each of these assets is recorded and tracked as part of the city’s inventory of capital infrastructure assets and other city-owned property.
Once the City Council adopts the proposed annual CIP budget, projects receive an appropriation that authorizes spending in the amount specified for the adopted fiscal year only. Estimated budget information is shown for a 15-year period to provide the most comprehensive information about known future projects. Spending authority in future years is not granted until adoption of the annual proposed CIP budget associated with each year.
The CIP is organized by the following project classifications:
Investing in our quality of life
The City of Carlsbad’s philosophy is to take a proactive, long-range planning approach to building high quality facilities and infrastructure that support the needs and priorities of the community. Prudent financial planning has ensured ongoing funding to modernize, repair, and replace existing infrastructure projects through numerous asset management programs. Since the city applies a comprehensive asset management approach to infrastructure planning and budgeting it is able to
I-1
avoid more costly unexpected repairs or operational needs and minimize the burden on emergency expenditures.
As the city continues to grow and develop, there is a corresponding increase in the demand for developmentrelated services and new facilities. To ensure that the necessary infrastructure and facilities are built on a schedule that meets or exceeds this demand, the citizens of Carlsbad adopted a Growth Management Plan in 1986. The plan was established to manage development within the city by linking residential, commercial, and industrial development directly to standards for availability of public services and facilities.
The Growth Management Plan states that unless a standard level of facilities is available to meet new demands resulting from the city’s growth, development cannot proceed. Recently, certain actions, such as imposing a moratorium, have been determined to be impermissible by the California Housing and Community Development Department, per Senate Bill 330, Housing Crisis Act of 2019, which became effective on Jan. 1, 2020.
The detailed level of planning required by Growth Management has allowed the city’s CIP to anticipate the funding needed for capital improvements in the next 15 years. Facilities such as community centers, parks and fire stations have been constructed and opened to the public under this program.
The CIP has been designed to specifically address areas where new or expanded facilities will be needed to maintain compliance with the adopted performance standards. With the adoption of the fiscal year 2023-24 CIP, compliance with the Growth Management Plan is continued.
In October 2022, City Council approved a five-year strategic plan with policy goals to reflect the most important priorities of the community. The CIP budget includes the priority construction projects identified the strategic plan.
Project evaluation
Development of the CIP is a team effort involving all operational departments, the City Manager’s Office, the City Council, and the community. Community feedback on infrastructure needs is considered and incorporated as appropriate. The CIP is fully vetted at multiple levels of the city organization by appropriate staff using an inclusive and transparent process and reviewed on a quarterly basis.
I-2
Projects were evaluated for the ability to deliver realistic outcomes considering anticipated revenue decreases in some capital funding sources. The city remains focused on matching existing resources with reasonable and achievable project schedules while continuing to work on projects that are already underway. Existing project balances were evaluated to determine whether additional funding was needed or if the existing balances were adequate. Funding recommendations were matched against project timing and balanced against available funding sources.
As the CIP is implemented throughout the year, staff continually re-evaluate projects’ scopes, costs and schedules to responsibly and cost-effectively manage infrastructure assets at the required levels of service throughout their lifecycle. Recommendations for project funding consider current project status, project scheduling and sequencing requirements, project constraints, and current staff capacity. Project charters are updated to include project description, location, summary of need, justification including any legislative or policy citations, cost estimates, and project scores.
Fiscal year 2023-24 appropriations by category
In the fiscal year 2023-24 CIP, there are approximately 227 continuing and new projects planned over the next 15 years. The fiscal year 2023-24 CIP outlines $97.7 million in new appropriations to provide additional funding for the continuation of existing projects as well as funding for 5 new projects. Projected revenues during the same fiscal year are estimated at $95.9 million.
FY
Appropriations by Category
million
I-3
Planning, 1% Project Accounting, 7% Maintenance & Operations, 28% Capital Projects, 64%
2023-24
vision
organizatio nal values Community values Environmental review Governing and policy documents Funding availability City Council goals
$97.7
Capital Improvement Program Public health and safety City mission,
and
Fiscal year 2023-24 appropriations by project type
Civic Buildings and Facility Maintenance
$11.7 million
This category includes a variety of facilities such as fire stations, libraries and community centers. Costs include repair, maintenance and replacement of civic buildings and other operational facilities. (Note: due to changes in estimated construction dates for the Orion Center project the net expenditures for this category in fiscal year 2023-24 are -$758,509)
Parks
$46.2 million
Projects include improvements and enhancements to existing parks, such as playground resurfacing, picnic areas and other needs identified by the community and in recently updated parks master plans.
Drainage
$2.7 million
The city’s drainage infrastructure plays an important role in handling storm water runoff flows, as well as maintaining the water quality of the city’s creeks, lagoons and ocean. As the city continues to age, it is increasingly necessary to balance repairing and replacing the existing lines with enhancing the current infrastructure to accommodate future needs.
Sewer
$13.4 million
The city’s sewer, or wastewater, projects include numerous pipeline construction and rehabilitation projects, as well as improvements to the Encina Wastewater Treatment facility. Most new lines are built and paid for with impact fees collected with new development.
Water and Recycled Water
$9.4 million
Future water and recycled water projects include construction of new pipelines, replacement of existing waterlines and reservoir improvements. The Carlsbad Municipal Water District has been producing and delivering recycled water for over 30 years.
Transportation
$26.7 million
People of all ages and abilities want to go places safely and conveniently in Carlsbad, whether they drive, walk, bike, or ride a bus or train. The city continues to invest in modernizing roads, leveraging technology to improve traffic systems, and making timely repairs and rehabilitation of the roadways, bridges, sidewalks and other assets in public rights of way throughout the city.
I-4
NEW CAPITAL IMPROVEMENT PROJECTS
Carlsbad Boulevard Roadway Configuration
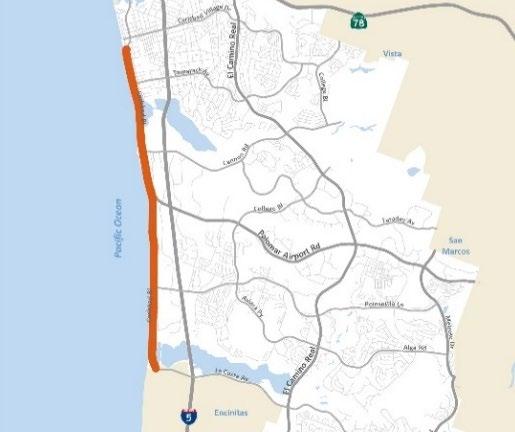
Managing Department: Transportation
Classification: Capital Project
Funding Source:
Infrastructure Replacement Fund
Budget
FY24
$ 2,000,000
TOTAL $ 2,000,000
About This Project
This project will reconfigure Carlsbad Boulevard from Pine Avenue to the southern city border to enhance safe transportation options for biking, walking and driving. The project will include vehicular lane reductions and seal the roadways to improve pavement condition for all users of the road. Reconfiguring roadways also reduces the long-term pavement maintenance costs and improves the line of sight for side street users approaching the arterial.
Project Need
In August 2022 the City of Carlsbad declared a local state of emergency, citing a 233% increase in collisions involving bikes and e-bikes since 2019. This project was identified as a recommended midterm strategy to improve traffic safety as part of the city’s Safer Streets Together Plan
General Plan Consistency
Policy 3-P.15 of the Mobility Element: Evaluate methods and transportation facility improvements to promote biking, walking, safer street crossings, and attractive streetscapes. The City Council shall have the sole discretion to approve any such road diet or vehicle traffic calming improvements that would reduce vehicle capacity to or below a LOS D.
Climate Action Plan Consistency
Not applicable.
Anticipated Environmental Review
The project is exempt from environmental review per CEQA Guidelines Section 15301(c) – Existing Facilities. Exempted are existing highways and streets, sidewalks, gutters, bicycle and pedestrian trails, and similar facilities (this includes road grading for the purpose of public safety), and other alterations such as the addition of bicycle facilities, including but not limited to bicycle parking, bicycle-share facilities and bicycle lanes, transit improvements such as bus lanes, pedestrian crossings, street trees, and similar alterations that do not create additional automobile lanes.
I-5
Carlsbad Village Drive Reconfiguration
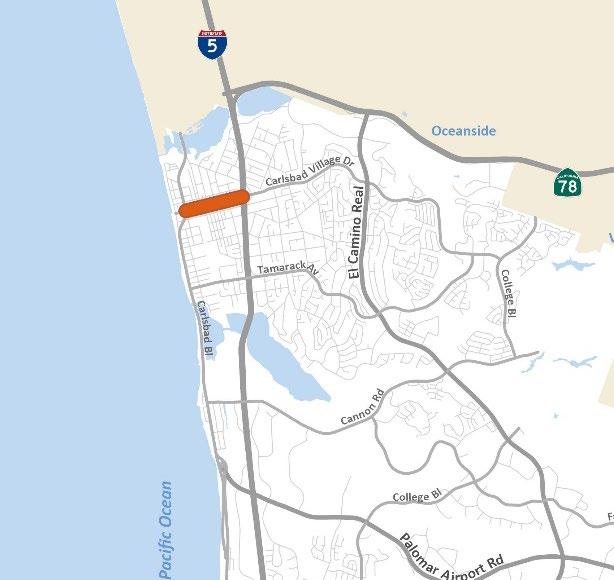
Managing Department: Transportation
Classification: Capital Project
Funding Source: General Capital Construction
Budget
FY24 $ 350,000
FY25 $ 1,500,000
TOTAL $ 1,850,000
About This Project
The project will trim medians and move vehicular lanes inward to bring existing bicycle lanes to modern roadway standards along Carlsbad Village Drive between Interstate 5 and Carlsbad Boulevard. The existing bicycle lanes in some areas are only meet minimum modern roadway standards. With significant bicycle traffic in this area, several collisions and near misses with vehicles have been reported. This project will improve conditions for all the users on the road and reduce the long-term maintenance costs.
Project Need
In August 2022 the City of Carlsbad declared a local state of emergency, citing a 233% increase in collisions involving bikes and e-bikes since 2019. This project was identified as a recommended midterm strategy to improve traffic safety as part of the city’s Safer Streets Together Plan.
General Plan Consistency
Policy 3-P.15 of the Mobility Element: Evaluate methods and transportation facility improvements to promote biking, walking, safer street crossings, and attractive streetscapes. The City Council Shall have the sole discretion to approve any such road diet or vehicle traffic calming improvements that would reduce vehicle capacity to or below a LOS D.
Climate Action Plan Consistency
Not applicable.
Anticipated Environmental Review
The project is exempt from environmental review per CEQA Guidelines Section 15301(c) – Existing Facilities. Exempted are existing highways and streets, sidewalks, gutters, bicycle and pedestrian trails, and similar facilities (this includes road grading for the purpose of public safety), and other alterations such as the addition of bicycle facilities, including but not limited to bicycle parking, bicycle-share facilities and bicycle lanes, transit improvements such as bus lanes, pedestrian crossings, street trees, and similar alterations that do not create additional automobile lanes.
I-6
Fire Station 7
Managing Department: Facilities
Classification: Capital Project
Funding Source: General Capital Construction
Budget
FY24 $ 100,000
FY25 $ 200,000
TOTAL $ 300,000
About This Project
This project will identity a site and initiate the preliminary design process for a new Fire Station 7 in the vicinity of Cannon Road and Carlsbad Boulevard. Future funding requests may include potential acquisition of property and construction costs.
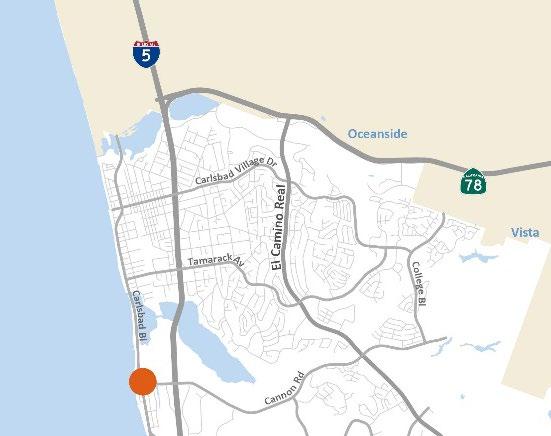
Project Need
Carlsbad remains one of the safest cities in the region due to new investments in fire and emergency medical services. This project is identified in the city’s 5-Year Strategic Plan as a priority project in the area, Quality of Life and Safety. It addresses the specific Strategic Objective to “bring Fire Department up to Standards of Cover to ensure the city is prepared to meet the community’s changing fire and emergency medical needs.”
General Plan Consistency
Goal 2-G.21 of the Land Use & Community Design Element: Ensure that adequate public facilities and services are provided in a timely manner to preserve the quality of life of residents.
Climate Action Plan Consistency
Not applicable.
Anticipated Environmental Review
The level of environmental review and any potential environmental impacts will be determined upon further analysis. It is likely environmental review could range from a CEQA exemption (project is exempt from environmental review) to a Mitigated Negative Declaration (project has environmental impacts that can be mitigated).
I-7
Public Works Storage Facility
Managing Department: Facilities
Classification: Capital Project
Funding Source: General Capital Construction
Budget
FY24 $ 99,000
TOTAL $ 99,000
About This Project
This project will identify the site location and initiate the preliminary design process for a public works storage facility to contain items currently stored at the Farmers Property and other city facilities. Future funding requests will consider construction costs.
Project Need
In August 2022 City Council approved the sale of the Farmers Property in a fiduciarily responsible time frame, since it was not selected as the future City Hall/Civic Center site. Currently the Farmers Property is used to store various equipment and supplies for Public Works and other city departments. In preparation for selling the property, the building will need to be emptied and other storage sites used. This project is also identified in the city’s 5-Year Strategic Plan as a priority project in the area of Organizational Excellence and Fiscal Health, which aims to make Carlsbad a model for effective and efficient local government.
General Plan Consistency
Goal 2-G.21 of the Land Use & Community Design Element: Ensure that adequate public facilities and services are provided in a timely manner to preserve the quality of life of residents.
Climate Action Plan Consistency
Not applicable.
Anticipated Environmental Review
The level of environmental review and any potential environmental impacts will be determined upon further analysis. It is likely environmental review could range from a CEQA exemption (project is exempt from environmental review) to a Mitigated Negative Declaration (project has environmental impacts that can be mitigated).
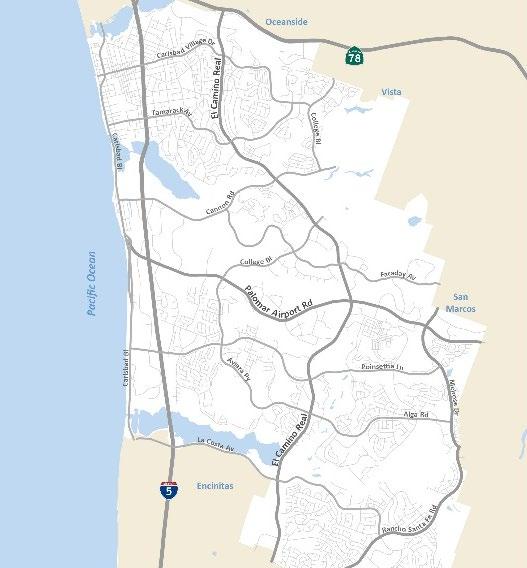
I-8
Traffic Signal Cabinet Upgrades
Managing Department: Transportation
Classification: Capital Project
Funding Source: General Capital Construction
Budget
FY24
$ 180,000
TOTAL $ 180,000
About This Project
Traffic signal cabinets, located along city roads, are used to store the equipment used to operate traffic signals. This project will make necessary improvements to traffic signal cabinets to ensure safe and reliable operations in several locations. At El Camino Real and Dove Lane, the cabinet will be lowered to road grade height to facilitate routine maintenance and repairs and improve access to components on higher level racks. At El Camino Real and Hosp Way, the service pedal will be relocated to remove an obstruction preventing proper access to the pedestrian push buttons. At Carlsbad Village Drive and Concord Street the cabinet will be upgraded from a small, 334 style with no battery backup to the city’s standard 332 style with battery backup.
Project Need
Proper maintenance of traffic signal cabinets helps enable quick, timely repairs as needed and ensure the smooth flow of traffic throughout Carlsbad.
General Plan Consistency
Goal 2-G.21 of the Land Use & Community Design Element: Ensure that adequate public facilities and services are provided in a timely manner to preserve the quality of life of residents.
Climate Action Plan Consistency
Not applicable.
Anticipated Environmental Review
The project is exempt from environmental review per CEQA Guidelines Section 15301(b) – repair, maintenance, and minor alteration of existing facilities, including those of public utilities, involving negligible or no expansion of use.
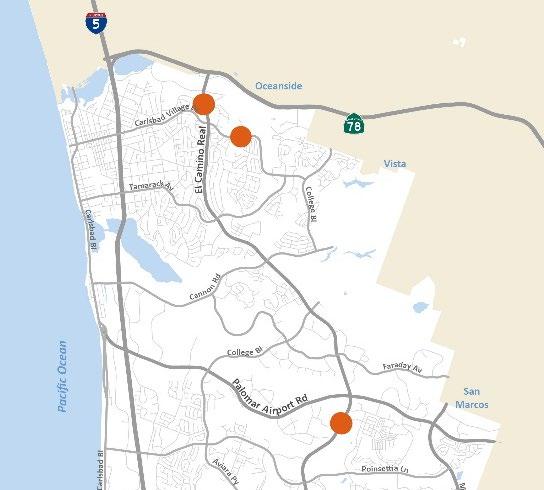
I-9
CAPITAL IMPROVEMENT PROGRAM REVENUES
Over the next 15 years, revenues for capital projects are estimated at $818.8 million and are segregated into six major funding sources: (1) fees generated by development in the City of Carlsbad, (2) special district fees and taxes from the community facilities districts and bridge and thoroughfare benefit districts, (3) water and wastewater replacement funds, (4) infrastructure replacement funds other than wastewater and water, (5) general capital construction funds, and (6) other sources, including grants, sales taxes and contributions from other agencies.
Capital Improvement Program
Projected Revenues FY 2023-24 to FY 2037-38
$818.8 million
Approximately 14.4% of all capital revenue is received as a result of development, including developer fees and financing districts in the chart above, and is dependent upon assumptions made about the city's annual growth in dwelling units and commercial and industrial square feet. These revenues include Public Facilities Fees, Traffic Impact Fees, Park-In-Lieu Fees, Planned Local Drainage Fees, water connection fees, sewer connection charges, and community facilities districts and bridge and thoroughfare benefit districts fees.
Water and wastewater replacement revenues generated by user fees equal approximately 36.2% of total revenues and are used to pay for replacement of existing water and sewer facilities. Infrastructure Replacement and General Capital Construction revenues, equal to 18.2%, are transfers from the city’s General Fund, which are being set aside to pay for replacement of major capital facilities other than wastewater and water facilities and the construction of various municipal projects. The remaining 28.1% consists of revenues from other agencies and include federal and state grants, the county sales tax program TransNet, gas taxes, and contributions or reimbursements from cities, developers, and other agencies.
I-10
Financing Districts 3.1% General Capital Construction 9.6% Infrastructure Replacement Fund 8.6% Other agencies 28.1% Developer fees 14.4% Utility Replacement transfers 36.2%
FUTURE GROWTH AND DEVELOPMENT
As shown on the graph on the previous page, there are a variety of revenues that are used to fund the capital projects. In order to estimate revenues to be received from development, several assumptions about the rate and type of future development are made. These assumptions can change from year to year and tend to correlate with the current economic climate.
Every year, city staff evaluates all existing and future private development projects and compares this information to the capacity of the city using the most current adopted general plans. Information about existing development activity combined with estimates of how remaining net developable land might develop is then summarized to prepare future projections about when and where residential and non-residential development may occur. The following table shows the number of residential units and non-residential square feet of development that was used in calculating estimated revenues for fiscal year 2023-24 and subsequent years to build out.
Projected Future Development
Financial forecasting schedules are prepared to ensure that funding will be sufficient and available for construction of capital projects as planned in the CIP. In addition to evaluating whether or not capital funds are sufficient, significant operating cost impacts and availability of staff resources are also considered in evaluating the timing of projects. Where funding discrepancies occur, alternative financing methods and project timing are evaluated, and recommendations are made to resolve the discrepancies.
Conservatively, about 3,087 residential units are anticipated for future development, and it is currently estimated that the city is more than 90% built out. Residential development for fiscal year 2023-24 is projected at 616 units, and, over the next five years, should average 262 units per year. The amount of non-residential development is projected at about 409,000 square feet over the next five years.
Projects include several multi-family residential developments, commercial industrial, office and other mixed -use projects. Development estimates provide data for estimating future fee revenues, which are calculated by multiplying each applicable development fee by the estimated number of dwelling units and/or square feet of construction expected during each year.
I-11
Fiscal Year Residential Units Non-Residential Square Feet 2023-24 616 298,961 2024-25 310 89,341 2025-26 184 8,655 2026-27 101 8,655 2027-28 101 2,953 2029-33 1,014 2,131,926 2034-build out 761 2,000,458 Totals 3,087 4,540,949
FUTURE PROJECTS
The CIP for fiscal year 2023-24 to fiscal year 2037-38 outlines approximately 245 projects at a cost of $798 million. Long-range planning and responsible asset management play key roles in the development of future capital projects. Using data from various infrastructure master plans, ongoing asset condition assessments, technical modelling, field inspections as well as community feedback, the information provided for future years reflects the most comprehensive snapshot of known or anticipated future projects as well as associated estimated costs.
Future Project Costs By Type
FY 2023-24 to FY 2037-38
$798 million
I-12
Civic facilities
Parks 10% Drainage
Wastewater
Water/Recycled Water 24% Transportation
11%
7%
26%
22%
CALCULATION OF FUTURE FEES
The revenue projections in the CIP reflect the growth assumptions identified in the previous section. The following information delineates how those assumptions were applied to estimate future development revenues. The mix of future multi-family and single-family residential units is assumed to be 80% and 20%, respectively, and reflects the anticipated mix of residential development for each Local Facilities Management Zone.
To calculate estimated revenues for Traffic Impact Fees, the number of average daily trips was computed for each type of development use. An attached multi-family residential dwelling unit is assigned either eight or six trips and a detached single-family unit is assigned 10 trips per day. The trips-per-day value for commercial and industrial buildings are 40 and eight trips per 1,000 square feet of development, respectively, although the actual volume of trips generated by commercial and industrial buildings can vary widely depending on the ultimate land use.
CFD No. 1 is a citywide district established to finance various civic facilities required under the city’s Growth Management Plan. Park-in-Lieu Fees are collected for the purchase and development of parkland within each quadrant of the city, and the fees are based on the acquisition cost of parkland. Projects in the CIP funded with Park-in-Lieu Fees include future park site acquisition, development and restoration. Bridge and thoroughfare fee districts or BTDs are formed by property owners to finance specific road construction projects located within the district boundaries. BTD No. 2 Poinsettia Lane/Aviara Parkway was formed to finance the construction of Poinsettia Lane between Aviara Parkway and El Camino Real and Aviara Parkway between Palomar Airport Road and Poinsettia Lane.
UNFUNDED PROJECTS
The CIP includes several projects for which there is no identifiable funding source for future construction and, in some cases, where only partial funding has been identified. The city will investigate obtaining possible external funding, such as federal and state grants, loans, or other financing sources. Once funding is identified for these projects, the project costs will be reviewed and updated to reflect actual cost estimates. Projects on this list are part of the City Council’s Five Year Strategic Plan or were identified by Council direction. Two projects are partially funded by the Traffic Impact Fee program. The program was planned to generate enough revenue to pay for 20% of the total costs of these projects, leaving the remaining 80% unfunded.
I-13
Business Park Recreational Facility (Partial funding / Park Fee Zones 5, 13, 16, 17, 18) $16,500,000 Cannon Lake Park (6.7 acres) 2,243,000 Carlsbad Boulevard Realignment – Manzano Drive to Island Way (Partial funding / TIF) 21,015,200 Chestnut Complete Street I-5 to Railroad 2,500,000 College Boulevard Extension 30,000,000 Fire Station 7 19,000,000 Grand Avenue Promenade 9,000,000 Maerkle Solar Project 50,000,000 Monroe Street Pool 25,500,000 Orion Complex Energy Storage 10,000,000 South Carlsbad Boulevard Realignment (Partial funding / TIF) 5,000,000
PROJECTED
FUND
BALANCES
FOR FISCAL YEAR 2022 - 23
I-14
July 1, 2022 Projected June 30, 2023 UnreservedProjectedProjected Debt Service Projected Fund Balance Revenues Expenditures Loans & Other Balance BTD#2 - Poinsettia Lane/Aviara Pkwy 587,724 $ 1,881,644 $ 38,730 $ - 2,430,638 $ BTD#3 - Cannon Road West 526,327 7,063 - - 533,390 CFD #1 - Citywide 96,751,249 3,504,178 774,991 15,984 $ 99,464,452 Gas Tax 13,538,020 3,558,726 3,029,688 500,000 13,567,058 Gas Tax (Road Maint. & Rehab Acct.) 6,546,359 2,709,681 5,606,349 - 3,649,691 General Capital Const. 42,532,124 4,113,577 13,540,796 - 33,104,906 Grants - Federal 3,181 - 1,442 - 1,739 Grants - State - - - -Infrastructure Replacement 118,511,911 5,557,667 11,027,079 - 113,042,499 Other 1,932,611 25,934 959,647 - 998,898 Park Fee Zones 5,13,16, 17, 18 4,798,572 166,666 - - 4,965,237 Park-In-Lieu NE 4,770,998 64,022 - - 4,835,020 Park-In-Lieu NW 2,580,013 484,137 106,743 - 2,957,406 Park-In-Lieu SE 1,783,139 422,162 62,000 - 2,143,301 Park-In-Lieu SW 809,275 40,561 - - 849,836 Planned Local Drainage Area A 1,002,649 13,444 51,586 - 964,507 Planned Local Drainage Area B 1,534,791 231,285 65,760 - 1,700,315 Planned Local Drainage Area C 1,590,152 21,333 31,827 - 1,579,658 Planned Local Drainage Area D 666,282 321,892 39,943 - 948,230 Public Facilities Fee 29,139,633 1,680,368 1,399,148 - 29,420,853 Sewer Connection 7,474,469 544,416 3,261,830 - 4,757,055 Sewer Replacement 19,137,934 5,538,049 8,119,066 - 16,556,916 Traffic Impact Fee 21,072,655 2,623,889 3,607,435 - 20,089,110 Transnet/Local 32,297,901 5,376,349 4,458,222 - 33,216,028 Water - Potable 36,615,366 1 ,228,365 151,270 - 37,692,461 Water - Recycled (10,898,586) - 1,817,501 - (12,716,086) Water Replacement - Potable 60,406,854 5,828,758 7,943,220 - 58,292,392 Water Replacement - Recycled 17,792,436 1,221,177 575,782 - 18,437,831 Total 513,504,037 $ 47,165,341 $ 66,670,055 $ 515,984 $ 493,483,340 $
PROJECTED FUND BALANCES FOR FISCAL YEAR 2023 - 24
I-15
July 1, 2023 June 30, 2023July 01, 2023 2023-24 June 30, 2024 Projected Estimated Continuing New Total Projected Fund Balance Revenues AppropriationsAppropriationsAppropriations Balance BTD#2 - Poinsettia Lane/Aviara Pkwy 2,430,638 $ - 401,346 $ - 401,346 $ 2,029,292 $ BTD#3 - Cannon Road West 533,390 - - - - 533,390 CFD #1 - Citywide 99,464,452 3,345,149 $ 33,545,577 37,452,000 $ 70,997,577 31,812,024 Gas Tax 13,567,058 2,985,297 14,937,402 1,479,123 16,416,525 135,830 Gas Tax (Road Maint. & Rehab Acct.) 3,649,691 2,857,289 3,256,447 3,070,000 6,326,447 180,533 General Capital Const. 33,104,906 11,600,000 21,173,902 7,897,000 29,070,902 15,634,004 Grants - Federal 1,739 9,774,840 2,885,895 8,000,000 10,885,895 (1,109,316) Grants - State - 5,000,000 - 5,000,000 5,000,000Infrastructure Replacement 113,042,499 4,200,000 32,378,582 11,107,000 43,485,582 73,756,917 Other 998,898 - 323,489 - 323,489 675,409 Park Fee Zones 5,13,16, 17, 18 4,965,237 113,019 - - - 5,078,256 Park-In-Lieu NE 4,835,020 - 614,000 424,000 1,038,000 3,797,020 Park-In-Lieu NW 2,957,406 3,013,278 2,575,063 1,922,000 4,497,063 1,473,621 Park-In-Lieu SE 2,143,301 449,289 161,805 212,000 373,805 2,218,785 Park-In-Lieu SW 849,836 439,078 219,562 - 219,562 1,069,352 Planned Local Drainage Area A 964,507 30,974 46,208 - 46,208 949,274 Planned Local Drainage Area B 1,700,315 357,095 7,828 - 7,828 2,049,582 Planned Local Drainage Area C 1,579,658 283,664 31,335 75,000 106,335 1,756,986 Planned Local Drainage Area D 948,230 108,453 23,251 - 23,251 1,033,433 Public Facilities Fee 29,420,853 2,947,263 4,331,467 (47,000) 4,284,467 28,083,648 Sewer Connection 4,757,055 7 77,098 4,019,732 1,195,000 5,214,732 319,421 Sewer Replacement 16,556,916 10,445,506 28,077,191 6,152,500 34,229,691 (7,227,269) Traffic Impact Fee 20,089,110 4,743,682 17,505,669 3,590,000 21,095,669 3,737,122 Transnet/Local 33,216,028 5,886,000 27,489,757 5,640,000 33,129,757 5,972,270 Water - Potable 37,692,461 2,637,428 11,264,751 811,000 12,075,751 28,254,138 Water - Recycled (12,716,086) 15,998,990 2,957,903 - 2,957,903 325,000 Water Replacement - Potable 58,292,392 6,348,536 43,207,235 4,192,680 47,399,915 17,241,013 Water Replacement - Recycled 18,437,831 1,600,000 6,114,770 (494,600) 5,620,170 14,417,661 Total 493,483,340 $ 95,941,926 $ 257,550,167 $ 97,677,703 $ 355,227,870 $ 234,197,396 $
REVENUE PROJECTIONS SCHEDULE
I-16
2019-202020-212 021-222022-232023-24 ActualActualActual Projected Estimated Fund RevenueRevenueRevenueRevenueRevenue BTD#2 - Poinsettia Lane/Aviara Pkwy 217,466 $ 22,020 $ (497,154) $ 1,881,644 $BTD#3 - Cannon Road West 17,696 949 (21,419) 7,063CFD #1 - Citywide 5,736,415 2,286,479 (2,303,139) 3,504,178 3,345,149 $ Gas Tax 3,118,353 2,733,074 2,195,851 3,558,726 2,985,297 Gas Tax (Road Maint. & Rehab Acct.) 2,067,614 2,149,734 2,080,454 2,709,681 2,857,289 General Capital Const. 5,111,500 4,654,470 13,296,442 4,113,577 11,600,000 Grants - Federal 41,175 256,529 34,140 - 9,774,840 Grants - State - - - - 5,000,000 Infrastructure Replacement 9,369,345 4,704,670 (4,498,884) 5,557,667 4,200,000 Other 65,369 3,384 (78,654) 25,934Park Fee Zones 5,13,16, 17, 18 255,028 78,182 (195,275) 166,666 113,019 Park-In-Lieu NE 347,407 451,497 (92,752) 64,022Park-In-Lieu NW 260,256 429,037 267,635 484,137 3,013,278 Park-In-Lieu SE 326,671 3,205 (55,340) 422,162 449,289 Park-In-Lieu SW 271,373 319,862 13,108 40,561 439,078 Planned Local Drainage Area A 48,111 27,489 (20,032) 13,444 30,974 Planned Local Drainage Area B 174,328 635,853 54,137 231,285 357,095 Planned Local Drainage Area C 53,875 2,779 (36,025) 21,333 283,664 Planned Local Drainage Area D 31,433 2,877 (12,992) 321,892 108,453 Public Facilities Fee 3,439,781 1,751,477 (556,423) 1,680,368 2,947,263 Sewer Connection 749,326 332,049 (159,776) 544,416 777,098 Sewer Replacement 5,682,839 4,390,568 3,959,756 5,538,049 10,445,506 Traffic Impact Fee 1,924,738 1,084,181 (399,069) 2,623,889 4,743,682 Transnet/Local 4,546,554 3,347,237 2,215,348 5,376,349 5,886,000 Water - Potable 2 ,188,356 713,234 (1,309,185) 1,228,365 2,637,428 Water - Recycled 2,815,693 59,190 - - 15,998,990 Water Replacement - Potable 7,885,252 6,378,189 1,734,930 5,828,758 6,348,536 Water Replacement - Recycled 1,995,701 1,083,332 726,017 1,221,177 1,600,000 Total 58,741,652 $ 37,901,545 $ 16,341,701 $ 47,165,341 $ 95,941,926 $
BUDGET EXPENDITURE SCHEDULE
I-17
2020-212021-222022-232023-24 2023-24 2023-24 ActualActual Estimated Continuing New Total FUND ExpenseExpenseExpenseAppropriations Appropriations Appropriations BTD#2 - Poinsettia Lane/Aviara Pkwy - 13,059,041 $ 38,730 $ 401,346 $ - 401,346 $ BTD#3 - Cannon Road West - - - - -CFD #1 - Citywide 582,179 $ 583,318 790,975 33,545,577 37,452,000 $ 70,997,577 Gas Tax 2,911,799 2,605,882 3,529,688 14,937,402 1,479,123 16,416,525 Gas Tax (Road Maint. & Rehab Acct.) 170,381 307,543 5,606,349 3,256,447 3,070,000 6,326,447 General Capital Const. 5,086,290 12,606,427 13,540,796 21,173,902 7,897,000 29,070,902 Grants - Federal 260,820 26,669 1,442 2,885,895 8,000,000 10,885,895 Grants - State - - - - 5,000,000 5,000,000 Infrastructure Replacement 3,333,331 6,701,080 11,027,079 32,378,582 11,107,000 43,485,582 Other 8,868 2,587 959,647 323,489 - 323,489 Park Fee Zones 5,13,16, 17, 18 - - - - -Park-In-Lieu NE - - - 614,000 424,000 1,038,000 Park-In-Lieu NW - - 106,743 2,575,063 1,922,000 4,497,063 Park-In-Lieu SE - 1,196 62,000 161,805 212,000 373,805 Park-In-Lieu SW 1,118 - - 219,562 - 219,562 Planned Local Drainage Area A 6,131 1,149 51,586 46,208 - 46,208 Planned Local Drainage Area B 1,510,279 77,250 65,760 7,828 - 7,828 Planned Local Drainage Area C 4,174 2,913 31,827 31,335 75,000 106,335 Planned Local Drainage Area D 49,311 12,358 39,943 23,251 - 23,251 Public Facilities Fee 164,847 2,635,240 1,399,148 4,331,467 (47,000) 4,284,467 Sewer Connection 810,372 611,405 3,261,830 4,019,732 1,195,000 5,214,732 Sewer Replacement 8,206,747 6,944,820 8,119,066 28,077,191 6,152,500 34,229,691 Traffic Impact Fee 1,196,826 2,806,082 3,607,435 17,505,669 3,590,000 21,095,669 Transnet/Local 2,152,292 1,922,954 4,458,222 27,489,757 5,640,000 33,129,757 Water - Potable 17,507 432,625 151,270 11,264,751 811,000 12,075,751 Water - Recycled 3,235,638 127,177 1,817,501 2,957,903 - 2,957,903 Water Replacement - Potable 5,224,472 1,467,222 7,943,220 43,207,235 4,192,680 47,399,915 Water Replacement - Recycled 792,286 2,531,036 575,782 6,114,770 (494,600) 5,620,170 Total 35,725,667 $ 55,465,974 $ 67,186,038 $ 257,550,167 $ 97,677,703 $ 355,227,870 $
PROJECT ESTIMATED OPERATIONAL REQUIREMENTS
The projects listed in the table below represent projects that have been determined will have or may have operating budget impacts within the next five fiscal years. Estimated impacts to operating budget are based on industry standards. Projects that have an estimated zero-dollar impact on the city’s operating budget are not listed below. As the fiscal years identified in the table become the next budgeting year, the associated appropriate department will make a request for additional operating budget.
I-18
Project Department Operating fiscal year Estimated annual cost State Street Parking Lot electric vehicle charging stations Facilities 2023-24 $3,800 Public Works storage facility Facilities 2024-25 79,600 Veteran’s Memorial Park (all quadrants) Parks 2024-25 800,000 Barrio Street Lighting Transportation 2026-27 19,300 Orion Center Facilities 2026-27 595,200 Carlsbad Boulevard pedestrian lighting Transportation 2027-28 31,500 Village decorative lighting – State Street, Madison, Roosevelt and Washington Transportation 2027-28 13,500 Village decorative lighting – train station area Transportation 2027-28 5,400
15-YEAR CAPITAL IMPROVEMENT PROGRAM
ProjectName New Project DistrictScore Funding ID Funding Source Current Appropriaon LastYear (2022-23) Appropriated Year1 (2023-24) Year2 (2024-25) Year3 (2025-26) Year4 (2026-27) Year5 (2027-28) Year6-10 (2029-33) Year11-15 (2034-38) TotalFunding Source AbandonPotableServices(New RecycledServices) NOCitywideMedium52051 WATER REPL ADABeachAccess-PinetoTamarackNO1Medium60651 GCC ADAImprovementProgramNOCitywideHigh60491 TRANSNET -LOC AguaHediondaCreekMaintenanceNO2High 33381 PLDB 66291IRF AguaHediondaLiStaonBiological MonitoringandMaintenance NO2Crical55451 SEWER REPL AlgaNorteParkModificaonsNO2Medium47331GCC AlgaNorteSelementAgreementYES2NullPA071 GCC AssessmentDistrict97-1MaintenanceNO3Medium60841GCC AvenidaEncinasCoastalRailTrailand PedestrianImprovements NO2,3Crical 60041 TIF 60042 FED GRANT AviaraandHiddenCanyonParks PlaygroundSafetyResurfacing NOCitywideLow47451 IRF AviaraReimbursementAgreementNO2Low36491PIL-SW BarrioStreetLighng NO1High 40131 GCC 40133GASTAX 40134 TRANSNET -LOC 40135 FED GRANT BeachAccessRepairandUpgradesPineAvenuetoTamarack NO1Crical 38961 IRF 38962GCC BridgePreventaveMaintenance Program NOCitywideMedium60661 IRF BuenaInterceptorSewerAccessRoad Improvements NO3High55371 SEWER REPL BuenaInterceptorSewer Improvements NO2,3High 55011 SEWER REPL 55012 SEWER CONN BuenaInterceptorSewerRealignment -EastSegment NO2High55441 SEWER REPL BuenaVistaCreekConcreteChannel MaintenanceatElCaminoReal NO1Crical 66191GCC 66192 IRF BusinessParkRecreaonalFacility (ParalFunding)(Zone5Park) NO2Low19041ZONE5 CTankAccessRoadandElectrical Improvements NO2Medium 52151 RECLREPL 52152 RECL CONN CalaveraHillsCommunityCenter Refurbishment NO2Medium47461 IRF CalaveraHillsCommunityPark GatewayImprovements NO2High46011GCC CaminoDeLosCochesandLaCosta AvenueInterseconControl NO4Crical63251 GASTAX CaminoHillsandJacksparDriveSlope Stabilizaon NO2Medium60301GCC CannonParkRestroom NO2Low47261 GCC 1,675,825 - - - - - 500,000 250,000 50,000 925,825 2,875,000 - - - - - 2,500,000 - - 375,000 9,560,000 2,225,000 2,225,000 175,000 715,000 175,000 715,000 175,000 715,000 3,155,000 3,545,249 - - - - - - - -14,645 3,545,249 1,768,000 585,000 520,000 100,000 95,000 90,000 85,000 80,000 80,000 213,000 225,000 - - - - - - - - 225,000 1,024,000 - - - - - - 710,000 - 314,000 60,000 - - - - - - 60,000 -420,000 - - - - - - - - 420,000 7,677,903 - - - - - 2,500,000 - 3,177,000 5,177,903 1,776,000 - - - - - - - - 1,776,000 600,000 - - - - - - - - 600,000 238,000 - - - - - - - - 238,000 760,000 - - - - - - - - 760,000 150,000 - - - - - - -550,000 - 700,000 3,590,000 - - - - - 1,030,000 1,280,000 1,280,000 1,280,000 1,000,000 - - - - - - 1,000,000 -6,612,750 - - - - - - 700,000 1,800,000 5,912,750 6,899,000 - - - - - - 700,000 - 6,199,000 6,427,511 - - 950,000 900,000 900,000 700,000 500,000 250,000 2,477,511 1,150,000 - - - - - 650,000 -650,000 - 1,150,000 14,188,686 - 3,540,000 3,540,000 2,950,000 2,950,000 - - 250,000 1,208,686 550,000 - - - - - - - - 550,000 7,107,000 - - 1,800,000 2,400,000 1,200,000 1,200,000 - - 507,000 2,330,000 546,000 324,000 150,000 30,000 30,000 - - - 1,250,000 3,320,000 - - - - - 500,000 - - 2,820,000 18,000,000 - 16,500,000 - - - 1,500,000 - -1,250,000 - - - - - 1,000,000 - 250,000 250,000 375,000 - - - - - 325,000 - 50,000 50,000 1,985,000 - - - - - - - 1,300,000 1,985,000 1,407,850 - - - - - - - - 1,407,850 1,850,000 - - - - 1,500,000 - - - 350,000 859,400 - - - - - - - - 859,400
I-19
ProjectName New Project DistrictScore Funding ID Funding Source Current Appropriaon LastYear (2022-23) Appropriated Year1 (2023-24) Year2 (2024-25) Year3 (2025-26) Year4 (2026-27) Year5 (2027-28) Year6-10 (2029-33) Year11-15 (2034-38) TotalFunding Source CaminoHillsandJacksparDriveSlope Stabilizaon NO2Medium60301GCC CannonParkRestroom NO2Low47261 GCC CannonRoadLiStaon Improvements NO2High55521 SEWER REPL CarlsbadBoulevardandTamarack AvenueInterseconImprovement NO1Crical 60581 GASTAX 60583 TRANSNET -LOC CarlsbadBoulevardEmergencyRepairNO3Crical60631 GASTAX CarlsbadBoulevardLaneReducon andEdgeStriping NO2,3High60961GASTAX CarlsbadBoulevardMedian-Tamarack AvenuetoPineAvenue NO1Low19071 GASTAX CarlsbadBoulevardPedestrian ImprovementProject NO1High 60971GASTAX 60972 FED GRANT 60973 STATE GRANT CarlsbadBoulevardPedestrianLighngNO1High60681 TRANSNET -LOC CarlsbadBoulevardRealignmentManzanoDrivetoIslandWay NO2Low19081TIF CarlsbadBoulevardRealignmentManzanoDrivetoIslandWay(RTCIP) NO2Low19091 TIF CarlsbadBoulevardRoadway Configuraon YES1,2,3High24121IRF CarlsbadBoulevardWaterline ReplacementatTerramar NO2Crical50481 WATER REPL CarlsbadVillageDriveandGrand AvenuePedestrianandCrossing Improvements NO1Medium19121 TRANSNET -LOC CarlsbadVillageDriveReconfiguraonYES1High24031 GCC CarlsbadVillageDriveWideningPonacDrivetoVictoriaAvenue NOCitywideHigh 19131TIF 19132 GASTAX 19133 TRANSNET -LOC CarlsbadWaterRecyclingFacility (EncinaCapitalProjects) NO3High 52031 WATER REPL 52032RECLREPL CarlsbadWaterRecyclingFacility IrrigaonandLandscape NO3High52131 RECLREPL CarlsbadWaterRecyclingFacilityRoof Replacement NO3Low47491RECLREPL CathodicProteconProgramNOCitywideCrical 50071 WATER REPL 50072RECLREPL CFD#1Administraon NO2,3Low19151 CFD#1 ChestnutAvenueCompleteStreet Improvements-ValleytoPioPico NO1Medium19161 TRANSNET -LOC ChestnutCompleteStreetI-5to RailroadProjectStudy NO1Medium60691 TRANSNET -LOC ChestnutUnderpassPublicArtProjectNO1Medium60981GCC ChinquapinLiStaonImprovementsNO1High55541 SEWER REPL ChrisansenWayImprovementsNO1Medium19171 TRANSNET -LOC CityFacilityAccessibilityUpgradesNOCitywideMedium47271 GCC 60741IRF 45,765 - - - - - - - - 45,765 765,000 - - - - - - 50,000 565,000 715,000 4,216,000 - - - - 2,000,000 445,000 195,000 - 1,576,000 1,054,000 - - - - - - - - 1,054,000 841,000 - - - - - - - - 841,000 300,000 - - - - - - - - 300,000 2,763,000 2,763,000 - - - - - - -1,055,888 - - - - - - - - 1,055,888 - - - - - - - - -591,600 - - - - - - - 591,600 591,600 1,325,000 - - - - - - - - 1,325,000 932,000 932,000 - - - - - - -3,681,000 3,681,000 - - - - - - -2,000,000 - - - - - - 2,000,000 -4,730,000 - - - - - - - 1,300,000 4,730,000 1,320,000 - - - 1,320,000 - - - -1,850,000 - - - - - 1,500,000 350,000 -- - - - - - - - -3,200,000 - - - 2,500,000 700,000 - - -- - - - - - - - -599,944 - - - - - - - - 599,944 10,920,710 1,325,000 1,325,000 268,000 237,000 1,992,000 949,000 767,000 366,000 4,057,710 35,000 - - - - - - -140,000 - 175,000 381,000 - - - - - - 156,000 - 225,000 3,286,700 280,000 260,000 190,000 190,000 190,000 190,000 190,000 190,000 1,796,700 200,000 - - - - - 100,000 100,000 -440,000 - - - 110,000 110,000 110,000 110,000 110,0001,080,000 - - - - - 1,080,000 - -85,000 - - - - - - 85,000 -400,000 - - - - - - - 150,000 400,000 1,220,000 - - - - - - 920,000 300,000 300,000 310,000 - - - - 310,000 - - -500,000 - - - - - - - - 500,000 I-20
DMPFacilityBFB-LandBFB-1 (TamarackandElCaminoRealPlda "B")
NO1Low19291 PLDB
ProjectName New Project DistrictScore Funding ID Funding Source Current Appropriaon LastYear (2022-23) Appropriated Year1 (2023-24) Year2 (2024-25) Year3 (2025-26) Year4 (2026-27) Year5 (2027-28) Year6-10 (2029-33) Year11-15 (2034-38) TotalFunding Source CityFacilityAccessibilityUpgradesNOCitywideMedium47271 GCC CityFacilitySafetyandParkingLot LighngAssessment NOCitywideHigh 60741IRF 60742 PIL-NW CityFireStaonsWashWaterBMPsNOCitywideMedium66161GCC CityHallComplex NOCitywideCrical40081 CFD#1 CityHallComplexRefurbishmentNO1Medium47181IRF CityHallExteriorRefurbishmentNO1Crical47251 GCC CitywideDrainageImprovement Program NO1High 66082GASTAX 66083 IRF CitywideStreetLighngProgramNOCitywideMedium60921GASTAX CitywideThermoplascPavement Markings NOCitywideCrical60931 GASTAX ColeLibraryExpansion NO1Low 19211CFD#1 19212 PFF 19213GCC ColeLibrarySecurityFencingNO1Low47501 IRF CollegeBoulevard-CannonRoadTo BadgerLane(375Zone) NO2Low50131 WATER CONN CollegeBoulevard-CannonRoadTo BadgerLane(490Zone) NO2Low50121 WATER CONN CollegeBoulevardExtensionNO2Low 36362OTHER 36363 PLDB 36364 TRANSNET -LOC ConcreteRepair/Replacement Program NOCitywideHigh 60132 GASTAX 60133RMRA CoordinatedTrafficSignalProgramNOCitywideHigh 63261 TRANSNET -LOC 63264 TRANSNET -LOC 63265 IRF CrestviewDriveTransmissionMainNO1Medium50331 WATER REPL DesalinatedWaterFlowControl FacilityNo.5 NO2High50381 WATER CONN DMPFacilityAAA(JeffersonStreet)NO1Low19231PLDA DMPFacility
PLDA DMPFacilityAC
DrainageProject) NO1Medium66091PLDA DMPFacility
DrainageRestoraonand EnhancementProject) NO2Low19251 PLDA DMPFacility
DrainageRestora
and EnhancementProject) NO2Low19261PLDA DMPFacilityBB1and2(Washington Street) NO1Low19271 PLDB DMPFacilityBCB
AAAA(MadisonStreet)NO1Medium19241
(HighlandDrive
AFA(HiddenValley
AFB(CalaveraHills
on
(MagnoliaAvenue)NO1Medium19281PLDB
1,910,000 - - - - - - - - 1,910,000 200,000 - - - - - - 200,000 -280,000 - - - - - - - - 280,000 51,028,105 - 48,500,000 1,500,000 - - - - - 1,028,105 1,144,000 - - - - - - - - 1,144,000 2,250,000 - - - - - - - - 2,250,000 6,090,594 - - - - - - - - 6,090,594 12,931,500 2,500,000 2,500,000 300,000 500,000 300,000 950,000 300,000 900,000 5,581,500 150,000 - - - - - - - - 150,000 50,000 - - - - - - - - 50,000 5,988,000 5,488,000 - 500,000 - - - - -11,936,000 11,936,000 - - - - - - -1,000,000 1,000,000 - - - - - - -170,000 - - - - - - - 130,000 170,000 1,528,383 - - - - - 1,250,000 - 28,200 278,383 1,562,600 - - - - - 1,250,000 - 12,600 312,600 1,713,002 - - - - - - - - 1,713,002 - - - - - - - - -1,205,000 - - - - - - - - 1,205,000 7,933,000 1,850,000 1,850,000 340,000 290,000 250,000 220,000 200,000 - 2,933,000 10,647,000 3,100,000 3,100,000 620,000 620,000 620,000 620,000 620,000 620,000 1,347,000 2,583,979 - - - - - - - - 2,583,979 1,000,000 - - - - - - - - 1,000,000 800,000 - - - - - - - - 800,000 605,000 - - - - - - 284,000 21,000 321,000 11,569,601 - - - - - - 758,000 707,301 10,811,601 290,000 290,000 - - - - - - -417,000 417,000 - - - - - - -922,000 922,000 - - - - - - -92,000 92,000 - - - - - - -164,000 164,000 - - - - - - -1,087,000 1,087,000 - - - - - - -469,000 469,000 - - - - - - -I-21
DMPFacilityBCB(MagnoliaAvenue)NO1Medium19281PLDB
DMPFacilityBFB-LandBFB-1 (TamarackandElCaminoRealPlda "B") NO1Low19291 PLDB
DMPFacilityBFB-U(ElCaminoReal)NO1High 66221PLDB
66222 IRF
DMPFacilityBL-L(CollegeBoulevard BridgeReimbursementPlda"B") NO2Low19301PLDB
DMPFacilityBL-U(CollegeBoulevard)NO2Low19311 PLDB
DMPFacilityBM(Cantarini/College BoulevardBoxCulvert) NO2Low19321PLDB
DMPFacilityBQ(SunnyCreek)NO2Low19331 PLDB
DMPFacilityBR(Cantarini/College BoulevardPipeDrainage) NO2Low19341PLDB
DMPFacilityC2(PaseoDelNorte)NO3Low19351 PLDC
DMPFacilityCA(AvenidaEncinas)NO3Low19361PLDC
DMPFacilityDBA(Poinse aVillage)NO4Low19371 PLDD
DMPFacilityDBB(AvenidaEncinas)NO4Low19381PLDD
DMPFacilityDFA(BaquitosLagoon StormwaterTreatment) NO4Low19391 PLDD
DMPFacilityDH(AlvePlaceCanyon Restoraon) NO3Low19401PLDD
DMPFacilityDQB(LaCostaTown Center) NO4Medium19411 PLDD
DMPFacilityDZ(Poinse aLane)NO3High19421PLDD
ProjectName New Project DistrictScore Funding ID Funding Source Current Appropriaon LastYear (2022-23) Appropriated Year1 (2023-24) Year2 (2024-25) Year3 (2025-26) Year4 (2026-27) Year5 (2027-28) Year6-10 (2029-33) Year11-15 (2034-38) TotalFunding Source
Library
ImprovementsNO3Low40811
DrainageMasterPlanUpdateNOCitywideHigh 66231PLDA 66232 PLDB 66233PLDC 66234 PLDD ElCaminoRealandAguaHedionda CreekBridgeRailingandSidewalk NO2Crical60561IRF ElCaminoRealandCannonRoad InterseconImprovements NO2Crical 60421 TIF 60422GASTAX ElCaminoRealMedians NOCitywideLow 36431 PFF 36432GASTAX ElCaminoRealRightTurnLanetoEast BoundAlgaRoad NO3Low19441 TIF ElCaminoRealWidening-ArenalRoad toLaCostaAvenue NO4High 39043 WATER REPL 60511 TIF 60512GASTAX ElCaminoRealWidening-Poinse a LanetoCaminoVidaRoble NO2Crical 60721 TRANSNET -LOC 60722 FED GRANT ElCaminoRealWidening-Sunny CreektoJackspar NO2Crical60941 TRANSNET -LOC ElFuerteLiStaonPumpAddionNO2Medium55531SEWER CONN 905,000 905,000 - - - - - - -153,489 - - - - - - - - 153,489 7,330,000 450,000 350,000 70,000 60,000 50,000 5,500,000 - 100,000 850,000 1,817,000 - 1,817,000 - - - - - -385,000 385,000 - - - - - - -205,000 205,000 - - - - - - -132,000 132,000 - - - - - - -181,000 181,000 - - - - - - -728,000 728,000 - - - - - - -530,000 530,000 - - - - - - -168,000 168,000 - - - - - - -430,000 430,000 - - - - - - -257,000 257,000 - - - - - - -233,000 233,000 - - - - - - -746,000 746,000 - - - - - - -643,000 643,000 - - - - - - -225,000 - - - - - - - - 225,000 216,512 - - - - - - - 25,000 216,512 583,000 - - - - - - - 25,000 583,000 246,890 - - - - - - 75,000 25,000 171,890 234,598 - - - - - - - - 234,598 210,000 - - - - - - - - 210,000 3,536,000 - - - - - - - - 3,536,000 661,123 - - - - - - -175,877 - 837,000 695,780 - - - - - - - - 695,780 904,530 - - - - - - - - 904,530 438,000 - 438,000 - - - - - -1,000,000 - - - - - - 1,000,000 -7,250,000 - - - - - - 4,000,000 - 3,250,000 1,450,000 - - - - - - 1,450,000 -3,155,000 - - - - - - - 50,000 3,155,000 1,440,000 - - - - - - - - 1,440,000 5,010,000 - - - - - - - 1,010,000 5,010,000 I-22
Dove
Lighng
GCC
ProjectName New Project DistrictScore Funding ID Funding Source Current Appropriaon LastYear (2022-23) Appropriated Year1 (2023-24) Year2 (2024-25) Year3 (2025-26) Year4 (2026-27) Year5 (2027-28) Year6-10 (2029-33) Year11-15 (2034-38) TotalFunding Source ElCaminoRealWidening-Sunny CreektoJackspar NO2Crical60941 TRANSNET -LOC ElFuerteLiStaonPumpAddionNO2Medium55531 SEWER CONN EncinaCapitalProjects(EWPCF)NOCitywideCrical58011 SEWER REPL FaradayandElCaminoRealSewer Replacement-OriontoPalomar AirportRoad NO2High55391 SEWER CONN FaradayAvenueImprovementsNO2High60991 GCC FaradayCenterRefurbishmentNO2Medium47201IRF FireFlowCapacitySystem Improvements NO1Medium50431 WATER REPL FireStaon2ReplacementNO4High 40601GCC 40602 IRF FireStaon7 YES2Medium24131GCC FleetFuelIslandUpgrade NO2High47471 IRF FleetMaintenanceRefurbishmentNO2High 47141IRF 47142 GCC FoxesLandingLiStaonWetwelland PumpReplacement NO1Crical55261 SEWER REPL GrandAvenuePromenade NO1Medium40612 GCC GuardrailReplacementand ImprovementProgram NOCitywideMedium60871GASTAX HardingCenterRefurbishmentNO1Low47081 IRF HeadwallReplacementProgramNO1Medium66241IRF HospGroveParkImprovementsNO1Low 47281 IRF 47282PIL-NW HydroelectricGeneraonatWater Facilies NO2Low50591 WATER CONN IntelligentTrafficControlDevicesNOCitywideLow66341GASTAX KellyDriveandParkDriveComplete StreetImprovements NO1High 60751 TRANSNET -LOC 60753GASTAX 60754 PFF KellyDriveChannelRepairNO1Medium66061IRF LaCostaAvenueTrafficImprovementsNO4Medium60761 GASTAX LagunaDriveStormDrain NO1Medium66281GASTAX LakeCalaveraOutletImprovementsNO2Crical50541 GCC LakeCalaveraReservoirMaintenanceNO2High50492GCC LasPalmasRoofReplacementNO2Medium47521 IRF LasPalmasTrunkSewer NO2High55401 SEWER CONN LeoCarrilloRanchParkPhase3StablesRestoraonandRestroom Construcon NO3Low 46021 PFF 46022PIL-SE 46023 PFF 830,000 - - - - - 450,000 200,000 - 180,000 175,450,601 39,175,000 42,644,000 7,952,000 7,758,000 8,002,500 8,450,000 6,278,000 6,368,000 55,191,101 2,840,000 - - - - - - 1,100,000 1,600,000 1,740,000 775,000 - - - - - 500,000 175,000 - 100,000 3,154,380 - - - - - - - - 3,154,380 8,125,000 - - - 3,000,000 2,500,000 2,000,000 415,000 -1,500,000 210,000 13,000,000 - - - - - - - - 13,000,000 1,433,882 - - - - - - - - 1,433,882 300,000 - - - - - 200,000 100,000 -4,963,800 - - - 100,000 400,000 400,000 1,800,000 500,000 2,263,800 4,074,000 - - - - - 1,500,000 - 500,000 2,574,000 1,596,100 - - - - - 700,000 - - 896,100 6,392,000 - - - - - - - 700,000 6,392,000 800,000 - - - - 500,000 - 100,000 200,000 200,000 150,000 - - - - - - -150,000 - 300,000 305,000 - - - - - - 140,000 - 165,000 510,000 - - - - - - - - 510,000 1,562,000 - - - - - - - - 1,562,000 2,745,000 - - - - - 1,403,000 222,000 1,000,000 1,120,000 2,071,000 - - - 1,225,000 - 385,000 33,000 28,000 428,000 200,000 - - - - - - - - 200,000 4,675,000 - - - - - - - 500,000 4,675,000 130,000 - - - - - - - - 130,000 998,000 - - - - - - -87,000 - 1,085,000 3,641,000 - - - - - 2,100,000 - 500,000 1,541,000 862,300 - - - 500,000 141,000 100,000 - - 121,300 2,750,000 - 1,494,000 - - 1,000,000 - - - 256,000 1,436,001 - - - - - - - - 1,436,001 1,391,001 250,000 250,000 50,000 50,000 50,000 160,000 - 50,000 581,001 500,000 - - - - - - - - 500,000 3,196,000 - - - 1,320,000 1,320,000 255,000 -255,000 - 556,000 1,631,500 - - - - - - - - 1,631,500 1,329,989 - - - - - - - -4,111 1,329,989 I-23
ProjectName New Project DistrictScore Funding ID Funding Source Current Appropriaon LastYear (2022-23) Appropriated Year1 (2023-24) Year2 (2024-25) Year3 (2025-26) Year4 (2026-27) Year5 (2027-28) Year6-10 (2029-33) Year11-15 (2034-38) TotalFunding Source LeoCarrilloRanchParkPhase3StablesRestoraonandRestroom Construcon NO3Low 46022PIL-SE 46023 PFF LeoCarrilloRanchParkPhase3BNO3Medium23071PIL-SE LeoCarrilloRanchRoofRepairsNO3High47481 IRF LibraryFireAlarmPanelUpgradesNO1,3Low47411IRF LimitedAccessPipelineRelocaon Program NO1,3Crical50351 WATER REPL LoanRepay-Park-in-LieuNEtoPublic FacilityFeeFund NONullNullPA041PIL-NE LoanRepay-Park-in-LieuSWtoPublic FacilityFeeFund NONullNullPA021 PIL-SW LoanRepay-SewerConntoSewer Repl NONullHighPA031 SEWER CONN MaerkleFacilityImprovementsNO2Crical50091 WATER REPL MaerkleReservoirSolarProjectNO2Medium47222 WATER REPL MaerkleReservoirTransmissionMainNO2Medium 50011 WATER REPL 50012 WATER CONN MarcaPlaceDrainageImprovementsNO4Medium66141 GASTAX MelroseDriveRightTurnLanetoWest BoundPalomarAirportRoad NO2High60341TIF MiscellaneousCityBuilding Improvements NOCitywideMedium47231 IRF MonroeStreetPoolReplacementNO1High 47241IRF 47242 GCC 47243PIL-NW NewVillageArtsBuildingRoofand ExteriorRefurbishment NO1Low47391 IRF NewVillageArtsTenantImprovementsNO1Medium47551GCC NormallyClosedValve(Install MotorizedValve) NO3High50501 WATER REPL NorthBaquitosAccessRoad Improvement NO4High55471 SEWER REPL NorthBaquitosLiStaonForcemain Rehabilitaon NO4High55361 SEWER REPL OceanStreetReconfiguraon ConceptsStudy NO1Medium60781GCC OceanStreetRestroomFacilityNO1Medium47291 GCC OdorandCorrosionPrevenon Program NOCitywideMedium55201 SEWER REPL OpenSpaceandTrailAcquision(Prop C) NOCitywideHigh40831 GCC OrionCenter NO2High 35721CFD#1 35722 WATER REPL 35723 SEWER REPL 35724 CFD#1 35725RECLREPL OrionComplexEnergyStorageNO2Medium23101 GCC PalomarAirportRoadandAvenida EncinasGrowthManagementPlan Improvements NO2,3High61021GASTAX 288 - - - - - - - -29,367 288 2,564,000 - - - 1,484,000 540,000 540,000 - -1,450,000 - - - - - - - - 1,450,000 180,000 - - - - - - - - 180,000 11,924,000 - - - 2,875,000 6,348,000 - 761,000 - 1,940,000 4,550,000 4,550,000 - - - - - - -1,100,000 1,100,000 - - - - - - -- - - - - - - - -3,591,200 - - - - - - 800,000 500,000 2,791,200 249,170 - - - - - - - 249,170 249,170 4,592,000 - - - 2,023,000 2,130,000 244,000 -578,000 - 773,000 3,463,000 - - - 1,567,000 1,660,000 236,000 - -65,000 - - - - - - - - 65,000 911,000 - - - - - - - - 911,000 3,665,000 750,000 750,000 - - - 150,000 150,000 150,000 1,865,000 1,748,764 - - - - - - - -4,438,236 1,748,764 236 - - - - - - - -61,764 236 3,061,764 - - - - - - 1,500,000 1,561,764 1,561,764 313,626 - - - - - - - - 313,626 613,000 - - - - - - - - 613,000 1,966,000 - - - - - - 300,000 500,000 1,666,000 389,800 - - - - - - 26,000 113,800 363,800 75,000 - - - - - - -125,000 -750,000 200,000 200,000 - - - - - 200,000 - -838,000 - - - - 63,000 - - - 775,000 320,000 - - - - - - - - 320,000 4,015,000 - - - - - - - - 4,015,000 35,257,727 - - - - - - - - 35,257,727 6,790,000 - - - - - 6,290,000 -6,289,409 - 6,789,409 4,079,000 - - - - - 3,779,000 -3,778,500 - 4,078,500 429 - - - - - - - - 429 2,716,000 - - - - - 2,516,000 -2,515,600 - 2,715,600 250,000 - - - 250,000 - - - -I-24
ProjectName New Project DistrictScore Funding ID Funding Source Current Appropriaon LastYear (2022-23) Appropriated Year1 (2023-24) Year2 (2024-25) Year3 (2025-26) Year4 (2026-27) Year5 (2027-28) Year6-10 (2029-33) Year11-15 (2034-38) TotalFunding Source OrionComplexEnergyStorageNO2Medium23101 GCC PalomarAirportRoadandAvenida EncinasGrowthManagementPlan Improvements NO2,3High61021GASTAX PalomarAirportRoadandCollege BoulevardImprovements NO2High60281 TIF PalomarAirportWaterline Realignment NO2Crical50551 WATER REPL ParkDriveStreetandDrainage Improvement NO1Crical 66111 GCC 66112GASTAX ParkingLotMaintenanceProgramNO1Medium60521 IRF PavementManagementProgramNOCitywideHigh 60011 TRANSNET -LOC 60012 GASTAX 60013 TRANSNET -LOC 60016 RMRA PineAvenuePark-PhaseII (CommunityBuilding) NO1Medium 46031PIL-NW 46032 PFF 46033PFF Poinse aCommunityPark-Phase4DogPark NO3High 46081 PFF 46082PFF Poinse aLane-CassiaRoadto SkimmerCourt(Reimbursement Agreement) NO3High50451 WATER CONN Poinse aLiStaonRehabilitaonNO2High55561 PoliceandFireHeadquarters Renovaon NO2High 47151 IRF 47152GCC PressureReducingStaonProgramNOCitywideCrical50201 WATER REPL PublicBeachAccessImprovements (OceanStreet) NO1Low 60571GCC 60572 IRF PublicWorksStorageFacilityYESCitywideHigh24011GCC RanchoCarlsbadGroundwaterSupplyNO2Low 50611 WATER CONN 50612 WATER REPL RanchoSantaFeTrailSlope Improvements NO4Medium60881 GCC RecycledWaterCondionAssessment Program NOCitywideHigh52111RECLREPL RecycledWaterPhase3-ReservoirNO3High 52101 WATER REPL 52102 RECL CONN RecycledWaterPipelineReplacementNO2Medium52161 RECLREPL RecycledWaterValveand AppurtenanceReplacementProgram NOCitywideHigh52121RECLREPL ReservoirCondionAssessmentand RepairProgram NOCitywideHigh 50241 WATER REPL 50242RECLREPL Program 230,000 - - - - - - - - 230,000 1,295,500 - - - - - - - - 1,295,500 2,333,000 - - - - - - - 560,000 2,333,000 717,439 - - - - - - - - 717,439 3,965,000 - - - - - - - 1,030,000 3,965,000 8,165,000 2,110,000 2,750,000 175,000 700,000 160,000 550,000 130,000 60,000 1,590,000 43,436,563 8,250,000 8,250,000 1,650,000 1,650,000 1,650,000 1,650,000 1,150,000 - 19,186,563 7,930,850 - - - - - - - - 7,930,850 30,596,476 4,750,000 4,750,000 950,000 950,000 950,000 950,000 950,000 2,200,000 16,346,476 50,086,000 13,500,000 13,500,000 2,700,000 2,700,000 2,450,000 2,450,000 2,450,000 2,300,000 10,336,000 2,197,000 - - - - - - - - 2,197,000 9,328,418 - - - - - - - -687,622 9,328,418 123,300 - - - - - - - -1 123,300 2,838,140 - - - - - - - - 2,838,140 - - - - - - - - -600,000 - - - - - - - - 600,000 12,549,342 - - - - - - 2,427,000 129,292 10,122,342 13,096,500 - - - - - - 1,723,000 400,000 11,373,500 14,831,040 3,000,000 3,000,000 600,000 600,000 600,000 600,000 600,000 600,000 5,831,040 3,610,336 - - - - - - - - 3,610,336 573,431 - - - - - - - -153,252 573,431 99,000 - - - - - - 99,000 -1,750,000 - 1,425,000 - - 125,000 - - - 200,000 1,750,000 - 1,425,000 - - 125,000 - - - 200,000 350,000 - - - - - - - - 350,000 1,590,000 310,000 280,000 50,000 50,000 50,000 50,000 50,000 50,000 750,000 180,000 - - - - - - -800,000 - 980,000 6,053,000 - - - - - - 200,000 200,000 5,853,000 6,810,000 2,910,000 2,150,000 350,000 350,000 350,000 350,000 350,000 -2,205,000 700,000 630,000 125,000 125,000 125,000 120,000 - 120,000 380,000 14,570,000 3,610,000 3,070,000 - - - - 2,040,000 - 5,850,000 200,000 - - - - - - 200,000 -39221 BTD#2 14,081 - - - - - - - - 14,081 8,900,000 - - - - -8,250,000 650,000 -REPL SEWER I-25
ProjectName New Project DistrictScore Funding ID Funding Source Current Appropriaon LastYear (2022-23) Appropriated Year1 (2023-24) Year2 (2024-25) Year3 (2025-26) Year4 (2026-27) Year5 (2027-28) Year6-10 (2029-33) Year11-15 (2034-38) TotalFunding Source ReservoirCondionAssessmentand RepairProgram NOCitywideHigh50242RECLREPL RetroreflecvitySignReplacement Program NOCitywideMedium60371 GASTAX RoadwayImprovements-CoastalArea AnalysisandImplementaon NOCitywideMedium60791GCC RoadwaySlopeStabilizaonNOCitywideMedium60811 GASTAX RobertsonRanchParkDevelopment (ParalFunding) NO2High 38011PIL-NE 38012 PFF RomeriaDrainageImprovementsNO4High 66041GCC 66042 GASTAX SafetyTrainingCenterSelementNO2Low47431GCC SanLuisReyMissionBasin GroundwaterSupply NOCitywideLow 50441 WATER CONN 50442 WATER REPL SantaFeIIInletPipeline NONullHigh50571 WATER REPL SantaFeIIReservoirSiteElectrical Improvements NO3Medium50461 WATER REPL SCADAImprovements NOCitywideCrical 55421 SEWER REPL 55422 WATER REPL 55423 RECLREPL SchulmanAuditoriumandCannonArt Gallery NO3Medium47531IRF SeniorCenterRepairsandRoof Replacement NO1Medium47381 IRF SeniorCenterSecurityFencingNO1Low47541IRF SewerCondionAssessmentNOCitywideCrical55131 SEWER REPL SewerLiStaonRepairsand Upgrades NO2Crical38401 SEWER REPL SewerLineCapacityImprovementsNO1High55481 SEWER REPL SewerModeling NOCitywideMedium55461 SEWER CONN SewerMonitoringProgram(Capacity)NOCitywideHigh55041 SEWER CONN SewerSystemRehabilitaonand Replacement NO1,2,3High55031 SEWER REPL Sidewalk/StreetConstruconProgramNOCitywideHigh 60021 TIF 60022GASTAX SouthCarlsbadCoastline NO2,3,4Medium60311 TRANSNET -LOC SouthShoreAguaHediondaLagoon Trail NO2High40851GCC StagecoachCommunityPark CommunityGardens NO4High46111 PIL-SE StagecoachParkSynthecTurf Replacement NO4Low47421IRF StateStreetandGrandAvenueRoad Improvements NO1Medium60821 TRANSNET -LOC StateStreetParkingLotElectric VehicleChargingStaons NO1Medium40901PFF StormDrainCondionAssessmentNOCitywideMedium66201 IRF StormDrainSystemRehabandRepair Program NOCitywideMedium66071IRF 1,000,000 - - - - - - - - 1,000,000 200,000 - - - - - - - - 200,000 1,280,000 - - - - - 500,000 - 200,000 780,000 1,038,000 - - - - - - 424,000 214,000 614,000 - - - - - - - - -410,000 - - - - - - - - 410,000 347,940 - - - - - - - - 347,940 1,156,995 - - - - - - - - 1,156,995 31,420,000 15,200,000 15,700,000 500,000 - - - 20,000 -277,500- - - - - - - - -77,5002,770,650 - - - 1,920,000 115,000 206,000 - 34,650 529,650 293,581 - - - - - - 110,000 150,000 183,581 4,684,898 - - - - - - 381,000 175,165 4,303,898 10,156,600 - - - - - 611,000 2,413,000 3,209,200 7,132,600 2,394,400 - - - - - 398,000 338,000 632,000 1,658,400 1,650,000 - - - - - - 1,300,000 150,000 350,000 3,158,000 - - - - - - 1,310,000 600,000 1,848,000 78,000 - - - - - - - 58,000 78,000 2,958,000 500,000 500,000 100,000 - 100,000 100,000 100,000 100,000 1,558,000 6,635,380 750,000 750,000 150,000 150,000 150,000 150,000 150,000 150,000 4,385,380 2,964,000 - - - - 944,000 620,000 200,000 1,000,000 1,200,000 200,000 - - - - - - -100,000 - 300,000 950,000 110,000 154,000 - - - 44,000 - - 642,000 45,426,475 14,050,000 13,350,000 1,850,000 1,850,000 1,850,000 1,850,000 1,200,000 1,200,000 9,426,475 3,300,000 - - - - - - -500,000 - 3,800,000 7,704,000 2,835,000 2,390,000 750,000 108,000 633,000 988,000 - -2,779,026 - - - - - - 1,000,000 - 1,779,026 789,940 - - - - - - - 34,440 789,940 437,000 - - - - - - 212,000 225,000 225,000 2,200,000 - - - - - - - - 2,200,000 325,000 - - - - 325,000 - - -340,000 - - - - - - 40,000 - 300,000 7,565,000 3,000,000 2,375,000 400,000 350,000 300,000 270,000 - 270,000 870,000 I-26
ProjectName New Project DistrictScore Funding ID Funding Source Current Appropriaon LastYear (2022-23) Appropriated Year1 (2023-24) Year2 (2024-25) Year3 (2025-26) Year4 (2026-27) Year5 (2027-28) Year6-10 (2029-33) Year11-15 (2034-38) TotalFunding Source StormDrainCondionAssessmentNOCitywideMedium66201 IRF StormDrainSystemRehabandRepair Program NOCitywideMedium66071IRF StreetLighngReplacementProgramNOCitywideHigh 60621 GCC 60622 TRANSNET -LOC SustainableMobilityPlan ImplementaonProgram NOCitywideHigh61041 GASTAX TemporaryFireStaon7 NO2High 40911GCC 40912 PFF TerramarAreaCoastalImprovementsNO2High 60541TIF 60542 GCC 60543 TRANSNET -LOC 60544 SEWER REPL 60545PFF TheCrossingsGolfCourseLakeLiner Replacement NO2High 40841 GCC 40842GCC TrafficImpactFeeFundstoCFD#1NONullNullPA051 TIF TrafficImpactFeeUpdate NOCitywideHigh60401TIF TrafficImprovementProgramNOCitywideCrical 60701 GASTAX 60702GCC TrafficMonitoringProgram NOCitywideHigh 60031 TIF 60032GASTAX TrafficSignal-MaverickWayand CaminoDeLosCoches NO4Crical63322 GASTAX TrafficSignal-TamarackAvenueand ValleyStreet NO1Medium63351GASTAX TrafficSignalCabinetUpgradesYESCitywideLow24141 GCC TrafficSignalRightTurnOverlapsNO2,3,4Low66361GASTAX TrailConnecvitytoTamarackState Beach(PropC) NO1Low40631 GCC TrashAmendmentCompliance Program NOCitywideMedium66261IRF Tri-AgencyWaterTransmission PipelineReplacement NO2High50081 WATER REPL TriesteSlopeRepairProjectNO2High61071GCC TylerStreetTrafficCirculaonNO1Medium61031 GCC UlityUndergroundingProgramStudyNOCitywideMedium60831GCC VallecitosInterceptorSewerCleaning andCCTV NO2,3High55491 SEWER REPL ValleyandMagnoliaCompleteStreetsNO1High 60191TIF 60192 WATER REPL 60193 TRANSNET -LOC 60194 PFF 10,841,360 2,200,000 1,900,000 350,000 330,000 310,000 290,000 270,000 200,000 5,191,360 319,269 - - - - - - - - 319,269 3,325,000 - - - - - - - - 3,325,000 710,566 - - - - - - 200,000 510,566 510,566 900,000 - - - - - - - - 900,000 1,122,000 - - - - - - - - 1,122,000 9,450,001 - - - - - 2,800,000 - - 6,650,001 999,999 - - - - - - - - 999,999 2,000,000 - - - - - - 1,000,000 - 1,000,000 - - - - - - - - -2,450,000 - - - - - - - - 2,450,000 835,500 - - - - - - - - 835,500 200,000 - - - - - - - - 200,000 1,350,000 450,000 450,000 90,000 90,000 90,000 90,000 90,000 90,000270,000 - - - - - - - 30,000 270,000 2,388,000 - - - - - - - - 2,388,000 1,400,000 - - - - - 400,000 600,000 400,000 400,000 1,745,415 - - - - - - - 122,516 1,745,415 370,000 - - - - - 170,000 200,000 -490,000 - - - - - - 110,000 240,000 380,000 502,370 - - - - - - - - 502,370 180,000 - - - - - - 180,000 -150,000 - - - - - - - 150,000 150,000 3,544,000 - - - - 3,544,000 - - -13,005,000 3,300,000 3,000,000 2,000,000 175,000 2,700,000 1,200,000 - 100,000 630,000 10,974,970 - - - 4,630,000 3,585,000 431,000 -1,290,000 - 3,618,970 2,362,600 - - - - - - 2,000,000 362,600 362,600 970,000 - - - - - - 900,000 70,000 70,000 100,000 - - - - - 100,000 - -350,000 - - - - - - - 100,000 350,000 3,536,206 - - - - - - - - 3,536,206 721,000 - - - - - 650,000 - - 71,000 1,200,000 - - - - - - - 1,200,000 1,200,000 I-27
Lighngat VillageOutskirts
VillageLighng-StateStreet, Madison,Roosevelt,andWashington
ProjectName New Project DistrictScore Funding ID Funding Source Current Appropriaon LastYear (2022-23) Appropriated Year1 (2023-24) Year2 (2024-25) Year3 (2025-26) Year4 (2026-27) Year5 (2027-28) Year6-10 (2029-33) Year11-15 (2034-38) TotalFunding Source ValleyandMagnoliaCompleteStreetsNO1High 60193 TRANSNET -LOC 60194 PFF ValleyStreetTrafficCalmingNO1Medium19741 TRANSNET -LOC Veteran'sMemorialPark(All Quadrants) NOCitywideCrical 46091 CFD#1 46092 FED GRANT 46093 STATE GRANT VillageandBarrioTrafficCirclesNO1Crical 40151GCC 40152 TRANSNET -LOC 40153 SEWER REPL 40154 GASTAX 40155 FED GRANT VillageHSouthOffLeashDogAreaand TrailSegment5B NO2Medium46101 PFF VillageIntelligentParking Implementaon NO1Low60891GCC VillageLighng-CarlsbadVillageDrive fromHardingStreettoOceanStreet NO1High61051 GCC VillageLighng-GatewayLighngNO1High61081GCC VillageLighng-HospitalityDistrictNO1High24101 GCC VillageLighng-PedestrianLampposts OakAvenue NO1High61091GCC VillageLighng-Pedestrian
GCC
NO1High61101
NO1High40161GCC
GCC
Sta
ReplacementNO2Crical55501 SEWER REPL
CarlsbadInterceptor
HediondaLS
Forcemain
NO2Crical 34921 SEWER CONN 34922 SEWER REPL VistaCarlsbadInterceptor
Buena Vista
StaonImprovements NO1High 55351 SEWER CONN 55352 SEWER REPL VistaCarlsbadInterceptor-Lagoon BridgeReplacement(VC11B) NOCitywideCrical38861 SEWER CONN VistaCarlsbadInterceptor-ReachVC3NO1High 39501 SEWER CONN 39502 SEWER REPL VistaCarlsbadInterceptor-Reach VC14ToVC15 NOCitywideHigh39491 SEWER CONN VistaCarlsbadInterceptorRehabilitaon(VC1andVC2) NO2Crical55511 SEWER REPL Vista/CarlsbadInterceptor-Point RepairReaches(VC13&VC14) NO2,3High55551 SEWER REPL WaterInfrastructureCondion AssessmentProgram NOCitywideCrical50511 WATER REPL WaterLossMonitoringProgramNOCitywideLow50521 WATER REPL WaterModeling NOCitywideCrical50581 WATER CONN WaterSystemRehabilitaonand Replacement NOCitywideCrical39041WATER REPL 1,000,000 - - - - 1,000,000 - - -1,645,000 - - - - 1,645,000 - - -41,711,450 - - - - - - 37,342,000 1,257,250 4,369,450 3,000,000 - - - - - - 3,000,000 -5,000,000 - - - - - - 5,000,000 -415,000 - - - - - - - - 415,000 1,025,000 - - - - - - - - 1,025,000 660,000 - - - - - - 500,000 - 160,000 4,159,000 - - - - - - - 1,400,000 4,159,000 4,000,000 - - - - - - 4,000,000 -2,082,500 - - 1,400,000 - - - - 160,500 682,500 300,000 - - - - 300,000 - - -600,000 - - - - - - 200,000 400,000 400,000 950,000 - - 950,000 - - - - -700,000 - - - 700,000 - - - -600,000 - - - - 600,000 - - -950,000 - - 950,000 - - - - -1,103,853 - - - - - - - 400,000 1,103,853 650,000 - - - - - 150,000 - 500,000 500,000 1,329,000 - - - - - - 75,000 100,000 1,254,000 33,410,973 - - - - - - 220,000 - 33,190,973 329,000 - - 75,000 75,000 75,000 104,000 - -430,000 - - - 67,000 67,000 - - -100,000 296,000 1,635,000 150,000 150,000 22,000 598,000 598,000 31,000 86,000 -9,464,833 - - - - - - - - 9,464,833 922,000 - - - - 405,000 387,000 30,000 -497,000 100,000 - - - - - - - - -21,362,390 - - - - - - - - 21,362,390 421,000 - - - - 120,000 70,000 90,000 - 141,000 1,400,000 - - - - - 1,200,000 - 200,000 200,000 9,070,000 2,480,000 2,250,000 450,000 450,000 420,000 420,000 410,000 410,000 2,190,000 167,089 - - - - - - -182,911 - 350,000 375,000 - - - - - - - 25,000 375,000 I-28
VillageLighng-TrainStaonAreaNO1High61061
VillasSewerLi
on
Vista
-Agua
and
(VC12-VC13)
-
Li
ProjectName New Project DistrictScore Funding ID Funding Source Current Appropriaon LastYear (2022-23) Appropriated Year1 (2023-24) Year2 (2024-25) Year3 (2025-26) Year4 (2026-27) Year5 (2027-28) Year6-10 (2029-33) Year11-15 (2034-38) TotalFunding Source WaterModeling NOCitywideCrical50581 WATER CONN WaterSystemRehabilitaonand Replacement NOCitywideCrical39041 WATER REPL WaterValveRepair/Replacement Program NOCitywideCrical50191 WATER REPL 68,028,366 21,080,000 19,890,000 3,000,000 3,000,000 3,000,000 3,000,000 2,800,000 2,690,000 12,258,366 23,500,000 5,650,000 5,110,000 1,000,000 1,000,000 960,000 960,000 960,000 940,000 7,860,000 I-29

I-30
CAPITAL IMPROVEMENT PROGRAM SUMMARY BY FUND
I-31
Prior Year 1 Year 2 Year 3 Year 4 Year 5Year 6-15 Years 2023-242024-252025-262026-272027-282029-38 BEGINNING FUND BALANCE N/A 2,029,292 $ 2,029,292 $ 2,545,412 $ 3,058,404 $ 3,058,404 $ 3,058,404 $ REVENUES Developer Fees - 516,120 512,992 - - 2,143,409 Total Revenues N/A - 516,120 512,992 - - 2,143,409 CAPITAL PROJECTS Poinsettia Lane - Reach E Cassia Road To Skimmer Court 14,081,199 $ - - - - -Total Project Expenditures - - - - - -ENDING FUND BALANCE N/A 2,029,292 $ 2,545,412 $ 3,058,404 $ 3,058,404 $ 3,058,404 $ 5,201,813 $ PRIOR YEAR 1YEAR 2YEAR 3YEAR 4 YEAR 5 YEAR 6-15 YEARS 2023-242024-252025-262026-272027-282029-38 BEGINNING FUND BALANCE N/A 65,918,875 $ 31,812,024 $ 33,165,805 $ 33,867,612 $ 34,217,668 $ 32,665,529 $ REVENUES Developer Special Taxes 3,345,149 1,463,781 811,807 460,056 447,861 15,630,823 Total Revenues N/A 3,345,149 1,463,781 811,807 460,056 447,861 15,630,823 CAPITAL PROJECTS CFD#1 Administration - $ 110,000 110,000 110,000 110,000 -City Hall Complex 1,028,105 - - - - 1,500,000 48,500,000 Cole Library Expansion - - - - - 500,000 5,488,000 Orion Center 35,257,728 - - - - -Veteran's Memorial Park (All Quadrants) 4,369,453 37,342,000 - - - -Total Project Expenditures 40,655,286 37,452,000 110,000 110,000 110,000 2,000,000 53,988,000 ENDING FUND BALANCE N/A 31,812,024 $ 33,165,805 $ 33,867,612 $ 34,217,668 $ 32,665,529 $ (5,691,648) $ COMMUNITY FACILITIES DISTRICT NO. 1 (CFD 1) BTD NO. 2 AVIARA PARKWAY - POINSETTIA LANE
I-32 PRIOR YEAR 1YEAR 2YEAR 3YEAR 4 YEAR 5 YEAR 6-15 YEARS 2023-242024-252025-262026-272027-282029-38 BEGINNING FUND BALANCE N/A (1,370,343) $ 135,830 $ 762,059 $ (2,391,158) $ (2,705,709) $ (682,453) $ REVENUES Gas Tax and Prop 42 Funds 2,985,297 3,049,229 3,070,783 3,083,449 3,113,256 31,638,119 Total Revenues N/A 2,985,297 3,049,229 3,070,783 3,083,449 3,113,256 31,638,119 CAPITAL PROJECTS Barrio Street Lighting 700,001 $ (550,000) - - - -Camino De Los Coches and La Costa Avenue Intersection Control 350,000 - - 1,500,000 - -Carlsbad Village Drive Widening - Pontiac Drive to Victoria Avenue - - - 700,000 2,500,000 -Carlsbad Blvd And Tamarack Avenue Pedestrian Improvements 1,576,001 195,000 445,000 2,000,000 - -Carlsbad Boulevard Emergency Repair 841,002 - - - - -Carlsbad Boulevard Lane Reduction and Edge Striping 300,000 - - - - -Carlsbad Blvd Median-Tamarack Avenue To Pine Avenue - - - - - - 2,763,000 Carlsbad Blvd Pedestrian Improvement Project 1,055,887 - - - - -Citywide Drainage Improvement Program 6,090,594 - - - - -Citywide Street Lighting Program 150,000 - - - - -Citywide Thermoplastic Pavement Markings 50,000 - - - - -Concrete Repair/Replacement Program 2,933,001 200,000 220,000 250,000 290,000 340,000 3,700,000 El Camino Real And Cannon Road Intersection Improvements 837,002 (175,877) - - - -El Camino Real Medians 904,530 - - - - -El Camino Real Widening - Arenal Road to La Costa Avenue - 1,450,000 - - - -Guardrail Replacement And Improvement Program 300,000 (150,000) - - - -Intelligent Traffic Control Devices 199,999 - - - - -Kelly Drive And Park Drive Road Diet And Multiuse Trail 130,000 - - - - -La Costa Avenue Traffic Improvements 121,300 - 100,000 141,000 500,000 -Laguna Drive Storm Drain 256,000 - - 1,000,000 - - 1,494,000 Marca Place Drainage Improvements 65,000 - - - - -Palomar Airport Rd and Avenida Encinas GMP Improvements 230,000 - - - - -Park Drive Drainage And Street Improvements 3,965,001 - - - - -Pavement Management Program 7,930,849 - - - - -Retroreflectivity Sign Replacement Program 1,000,000 - - - - -Roadway Slope Stabilization 779,998 - 500,000 - - -Romeria Drainage Improvements 347,937 - - - - -Sidewalk/Street Construction Program - - 988,000 633,000 108,000 750,000 5,225,000 Sustainable Mobility Plan Implementation Program 510,567 200,000 - - - -Traffic Improvement Program 2,388,003 - - - - -Traffic Monitoring Program - 200,000 170,000 - - -Traffic Signal - Maverick Way & Camino De Los Coches 380,000 110,000 - - - -Traffic Signal - Tamarack Avenue And Valley Street 502,370 - - - - -Traffic Signal Right Turn Overlaps 150,000 - - - - -Village And Barrio Traffic Circles 4,159,001 - - - - -Total Project Expenditures 39,204,041 1,479,123 2,423,000 6,224,000 3,398,000 1,090,000 13,182,000 ENDING FUND BALANCE N/A 135,830 $ 762,059 $ (2,391,158) $ (2,705,709) $ (682,453) $ 17,773,666 $ PRIOR YEAR 1YEAR 2YEAR 3YEAR 4 YEAR 5 YEAR 6-15 YEARS 2023-242024-252025-262026-272027-282029-38 BEGINNING FUND BALANCE N/A 393,244 $ 180,533 $ 164,975 $ 338,792 $ 479,945 $ 849,534 $ REVENUES Gas Tax (RMRA) Revenues 2,857,289 3,054,442 3,243,817 3,461,153 3,689,589 53,325,580 Total Revenues N/A 2,857,289 3,054,442 3,243,817 3,461,153 3,689,589 53,325,580 CAPITAL PROJECTS Concrete Repair/Replacement Program 1,346,999 $ 620,000 620,000 620,000 620,000 620,000 6,200,000 Pavement Management Program 10,336,002 2,450,000 2,450,000 2,450,000 2,700,000 2,700,000 27,000,000 Total Project Expenditures 11,683,001 3,070,000 3,070,000 3,070,000 3,320,000 3,320,000 33,200,000 ENDING FUND BALANCE N/A 180,533 $ 164,975 $ 338,792 $ 479,945 $ 849,534 $ 20,975,114 $ GAS TAX (ROAD MAINTENANCE AND REHABILITATION ACCOUNT) GAS TAX FUND
GENERAL CAPITAL CONSTRUCTION (GCC)
I-33 PRIOR YEAR 1YEAR 2YEAR 3YEAR 4 YEAR 5 YEAR 6-15 YEARS 2023-242024-252025-262026-272027-282029-38 BEGINNING FUND BALANCE N/A 11,931,004 $ 15,634,004 $ 13,534,558 $ 12,857,016 $ 16,331,492 $ 18,827,921 $ REVENUES Transfer from General Fund 11,600,000 4,310,554 4,409,458 4,504,476 4,596,429 48,724,804 Total Revenues N/A 11,600,000 4,310,554 4,409,458 4,504,476 4,596,429 48,724,804 CAPITAL PROJECTS ADA Beach Access - Pine to Tamarack 375,001 $ - 2,500,000 - - -Alga Norte Park Modifications 314,000 710,000 - - - -Alga Norte Settlement Agreement - 60,000 - - - -Assessment District 97-1 Maintenance 420,001 - - - - -Barrio Street Lighting 760,000 - - - - -Beach Access Repair and Upgrades - Pine Avenue to Tamarack 6,199,002 700,000 - - - -Buena Vista Creek Concrete Channel Maintenance at El Camino Real 1,249,999 - - 30,000 30,000 150,000 870,000 Calavera Hills Community Park Gateway Improvements 1,407,852 - - - - -Camino Hills and Jackspar Drive Slope Stabilization 859,399 - - - - -Cannon Park Restroom 45,765 - - - - -Carlsbad Village Drive - I5 to Carlsbad Blvd. - Reconfigure Arterial - 350,000 1,500,000 - - -Chestnut Underpass Public Art Project 400,000 - - - - -City Facility Accessibility Upgrades 500,000 - - - - -City Fire Stations Wash Water BMPs 279,999 - - - - -City Hall Exterior Refurbishment 2,250,001 - - - - -Cole Library Expansion - - - - - - 1,000,000 Dove Library Lighting Improvements 225,001 - - - - -Faraday Avenue Improvements 100,000 175,000 500,000 - - -Fire Station No. 2 Replacement 13,000,003 - - - - -Fire Station No. 7 - 100,000 200,000 - - -Fleet Maintenance Refurbishment 896,100 - 700,000 - - -Grand Avenue Promenade 200,000 100,000 - 500,000 - -Lake Calavera Outlet Improvements 1,436,001 - - - - -Lake Calavera Reservoir Maintenance 581,004 - 160,000 50,000 50,000 50,000 500,000 Monroe Street Pool Replacement 236 - - - - -New Village Arts Tenant Improvements 612,999 - - - - -Ocean Street Reconfiguration Concepts Study - - 200,000 - - -Ocean Street Restroom Facility 775,000 - - 63,000 - -Open Space and Trail Acquisition (Prop C) 4,015,000 - - - - -Orion Complex Energy Storage - - - - 250,000 -Park Drive Street and Drainage Improvement 717,440 - - - - -Police and Fire Headquarters Renovation 11,373,502 1,723,000 - - - -Public Beach Access Improvements (Ocean Street) 3,610,340 - - - - -Public Works Storage Facility - 99,000 - - - -Rancho Santa Fe Trail Slope Improvements 350,000 - - - - -Roadway Improvements - Coastal Area Analysis and Implementation 200,000 - - - - -Romeria Drainage Improvements 410,001 - - - - -Safety Training Center Settlement 1,156,995 - - - - -South Shore Agua Hedionda Lagoon Trail 789,941 - - - - -Street Lighting Replacement Program 319,270 - - - - -Temporary Fire Station No. 7 900,000 - - - - -Terramar Area Coastal Improvements 1,000,000 - - - - -The Crossings Golf Course Lake Liner Replacement 835,499 - - - - -The Crossings Golf Course Lake Liner Replacement 200,000 - - - - -Traffic Improvement Program 399,999 600,000 400,000 - - -Traffic Signal Cabinet Upgrades - 180,000 - - - -Trail Connectivity to Tamarack State Beach (Prop C) 152,156 - - 3,544,000 - -Trieste Slope Repair Project 362,600 2,000,000 - - - -Tyler Street Traffic Circulation 70,000 900,000 - - - -Utility Undergrounding Program Study - - 100,000 - - -Village and Barrio Traffic Circles 415,000 - - - - -Village Intelligent Parking Implementation - - - 300,000 - -Village Lighting - Carlsbad Village Drive from Harding Street to Ocean Street 400,000 200,000 - - - -Village Lighting - Gateway Lighting - - - - - 950,000Village Lighting - Hospitality District - - - - 700,000 -Village Lighting - Pedestrian Lampposts Oak Avenue - - - 600,000 - -Village Lighting - Pedestrian Lighting at Village Outskirts - - - - - 950,000Village Lighting - State Street, Madison, Roosevelt, and Washington 1,103,853 - - - - -Village Lighting - Train Station Area 500,000 - 150,000 - - -Total Project Expenditures 62,168,960 7,897,000 6,410,000 5,087,000 1,030,000 2,100,000 2,370,000 N/A 15,634,004 $ 13,534,558 $ 12,857,016 $ 16,331,492 $ 18,827,921 $ 65,182,725 $
I-34 PRIOR YEAR 1YEAR 2YEAR 3YEAR 4 YEAR 5 YEAR 6-15 YEARS 2023-242024-252025-262026-272027-282029-38 BEGINNING FUND BALANCE N/A (2,884,155) $ (1,109,316) $ 0 $ 0 $ 0 $ 0 $ REVENUES Grant Revenue 9,774,840 1,109,316 - - -Total Revenues N/A 9,774,840 1,109,316 - - -CAPITAL PROJECTS Avenida Encinas Coastal Rail Trail and Pedestrian Improvements 1,776,000 $ - - - - -Barrio Street Lighting - 1,000,000 - - - -El Camino Real Widening - Poinsettia Lane to Camino Vida Roble 1,440,000 - - - - -Veteran's Memorial Park (All Quadrants) - 3,000,000 - - - -Village and Barrio Traffic Circles - 4,000,000 - - - -Total Project Expenditures 3,216,000 8,000,000 - - - -ENDING FUND BALANCE N/A (1,109,316) $ 0 $ 0 $ 0 $ 0 $ 0 $ PRIOR YEAR 1YEAR 2YEAR 3YEAR 4 YEAR 5 YEAR 6-15 YEARS 2023-242024-252025-262026-272027-282029-38 BEGINNING FUND BALANCE N/A - $ - $ - $ - $ - $ - $ REVENUES Grant Revenue 5,000,000 - - - -Total Revenues N/A 5,000,000 - - - -CAPITAL PROJECTS Carlsbad Boulevard Pedestrian Improvement Project 591,600 $ - - - - -Veteran's Memorial Park (All Quadrants) - 5,000,000 - - - -Total Project Expenditures 591,600 5,000,000 - - - -ENDING FUND BALANCE N/A - $ - $ - $ - $ - $ - $ GRANTS - STATE GRANTS - FEDERAL
I-35 PRIOR YEAR 1YEAR 2YEAR 3YEAR 4 YEAR 5 YEAR 6-15 YEARS 2023-242024-252025-262026-272027-282029-38 BEGINNING FUND BALANCE N/A 80,663,917 $ 73,756,917 $ 63,872,471 $ 63,071,929 $ 64,366,405 $ 64,617,834 $ REVENUES Transfer from General Fund 4,200,000 4,310,554 4,409,458 4,504,476 4,596,429 48,724,804 Total Revenues N/A 4,200,000 4,310,554 4,409,458 4,504,476 4,596,429 48,724,804 CAPITAL PROJECTS Agua Hedionda Creek Maintenance 213,002 $ 80,000 85,000 90,000 95,000 100,000 1,105,000 Aviara and Hidden Canyon Parks Playground Safety Resurfacing 600,001 - - - - -Beach Access Repair and Upgrades - Pine Avenue to Tamarack 5,912,751 700,000 - - - -Bridge Preventative Maintenance Program 2,477,511 500,000 700,000 900,000 900,000 950,000Buena Vista Creek Concrete Channel Maintenance at El Camino Real 2,820,001 - 500,000 - - -Calavera Hills Community Center Refurbishment 1,985,002 - - - - -Carlsbad Boulevard Roadway Configuration - 2,000,000 - - - -City Facility Safety and Parking Lot Lighting Assessment 1,910,001 - - - - -City Hall Complex Refurbishment 1,144,000 - - - - -Citywide Drainage Improvement Program 5,581,501 300,000 950,000 300,000 500,000 300,000 5,000,000 Cole Library Security Fencing 170,001 - - - - -Coordinated Traffic Signal Program 800,000 - - - - -DMP Facility BFB-U (El Camino Real) 850,000 - 5,500,000 50,000 60,000 70,000 800,000 El Camino Real and Agua Hedionda Creek Bridge Railing and Sidewalk 209,999 - - - - -Faraday Center Refurbishment 3,154,381 - - - - -Fire Station No. 2 Replacement 1,433,880 - - - - -Fleet Fuel Island Upgrade 2,263,799 1,800,000 400,000 400,000 100,000 -Fleet Maintenance Refurbishment 2,574,003 - 1,500,000 - - -Harding Center Refurbishment 165,000 140,000 - - - -Headwall Replacement Program 510,001 - - - - -Hosp Grove Park Improvements 1,562,000 - - - - -Kelly Drive Channel Repair 1,541,006 - 2,100,000 - - -Las Palmas Roof Replacement 500,000 - - - - -Leo Carrillo Ranch Roof Repairs 1,449,998 - - - - -Library Fire Alarm Panel Upgrades 180,000 - - - - -Miscellaneous City Building Improvements 1,865,000 150,000 150,000 - - - 1,500,000 Monroe Street Pool Replacement 1,748,766 - - - - -New Village Arts Building Roof and Exterior Refurbishment 313,626 - - - - -Parking Lot Maintenance Program 1,590,000 130,000 550,000 160,000 700,000 175,000 4,860,000 Police and Fire Headquarters Renovation 10,122,340 2,427,000 - - - -Public Beach Access Improvements (Ocean Street) 573,431 - - - - -Schulman Auditorium and Cannon Art Gallery 350,000 1,300,000 - - - -Senior Center Repairs and Roof Replacement 1,848,000 1,310,000 - - - -Senior Center Security Fencing 77,999 - - - - -Stagecoach Park Synthetic Turf Replacement 2,200,001 - - - - -Storm Drain Condition Assessment 870,001 - 270,000 300,000 350,000 400,000 5,375,000 Storm Drain System Rehab and Repair Program 5,191,362 270,000 290,000 310,000 330,000 350,000 4,100,000 Trash Amendment Compliance Program 630,001 - 1,200,000 2,700,000 175,000 2,000,000 6,300,000 Total Project Expenditures 67,388,364 11,107,000 14,195,000 5,210,000 3,210,000 4,345,000 29,040,000 ENDING FUND BALANCE N/A 73,756,917 $ 63,872,471 $ 63,071,929 $ 64,366,405 $ 64,617,834 $ 84,302,638 $ PRIOR YEAR 1YEAR 2YEAR 3YEAR 4 YEAR 5 YEAR 6-15 YEARS 2023-242024-252025-262026-272027-282029-38 BEGINNING FUND BALANCE N/A 675,409 $ 675,409 $ 675,409 $ 675,409 $ 675,409 $ 675,409 $ REVENUES Other Financing Sources - - - - -Total Revenues N/A - - - - -CAPITAL PROJECTS College Blvd Reach A And Cannon Road Reach 4A 1,712,999 $ - - - - -Total Project Expenditures 1,712,999 - - - - -ENDING FUND BALANCE N/A 675,409 $ 675,409 $ 675,409 $ 675,409 $ 675,409 $ 675,409 $ INFRASTRUCTURE MAINTENANCE & REPLACEMENT OTHER
I-36 PRIOR YEAR 1YEAR 2YEAR 3YEAR 4 YEAR 5 YEAR 6-15 YEARS 2023-242024-252025-262026-272027-282029-38 BEGINNING FUND BALANCE (1) N/A 4,221,020 $ 3,797,020 $ 3,797,020 $ 3,817,442 $ 3,817,442 $ 3,817,442 $ REVENUES Developer Fees - - 20,422 - - 3,584,103 Total Revenues N/A - - 20,422 - - 3,584,103 CAPITAL PROJECTS Loan - Park-in-Lieu NE to Public Facility Fee Fund for Park Site Acquisition - $ - - - - - 4,550,000 Robertson Ranch Park Development 614,000 424,000 - - - -Total Project Expenditures 614,000 424,000 - - - - 4,550,000 ENDING FUND BALANCE N/A 3,797,020 $ 3,797,020 $ 3,817,442 $ 3,817,442 $ 3,817,442 $ 2,851,545 $ PRIOR YEAR 1YEAR 2YEAR 3YEAR 4 YEAR 5 YEAR 6-15 YEARS 2023-242024-252025-262026-272027-282029-38 BEGINNING FUND BALANCE N/A 382,344 $ 1,473,621 $ 2,061,293 $ 2,743,030 $ 3,431,585 $ 4,120,139 $ REVENUES Developer Fees 3,013,278 1,990,672 681,737 688,554 688,554 5,440,261 Total Revenues N/A 3,013,278 1,990,672 681,737 688,554 688,554 5,440,261 CAPITAL PROJECTS City Facility Safety and Parking Lot Lighting Assessment - $ 200,000 - - - -Hosp Grove Park Improvements 1,120,000 222,000 1,403,000 - - -Monroe Street Pool Replacement 1,561,764 1,500,000 - - - -Pine Avenue Park - Phase II (Community Building) 2,197,002 - - - - -Total Project Expenditures 4,878,766 1,922,000 1,403,000 - - -ENDING FUND BALANCE N/A 1,473,621 $ 2,061,293 $ 2,743,030 $ 3,431,585 $ 4,120,139 $ 9,560,400 $ PRIOR YEAR 1YEAR 2YEAR 3YEAR 4 YEAR 5 YEAR 6-15 YEARS 2023-242024-252025-262026-272027-282029-38 BEGINNING FUND BALANCE N/A 1,981,496 $ 2,218,785 $ 1,770,685 $ 1,639,130 $ 155,130 $ 155,130 $ REVENUES Developer Fees 449,289 91,900 408,445 - - 5,106 Total Revenues N/A 449,289 91,900 408,445 - - 5,106 CAPITAL PROJECTS Leo Carrillo Ranch Park Phase 3 - Stables Restoration and Restroom Construc 1,329,989 $ - - - - -Leo Carrillo Ranch Park Phase 3B - - 540,000 540,000 1,484,000 -Stagecoach Community Park Community Gardens 225,000 212,000 - - - -Total Project Expenditures 1,554,989 212,000 540,000 540,000 1,484,000 -ENDING FUND BALANCE N/A 2,218,785 $ 1,770,685 $ 1,639,130 $ 155,130 $ 155,130 $ 160,235 $ PRIOR YEAR 1YEAR 2YEAR 3YEAR 4 YEAR 5 YEAR 6-15 YEARS 2023-242024-252025-262026-272027-282029-38 BEGINNING FUND BALANCE N/A 630,273 $ 1,069,352 $ 1,069,352 $ 1,069,352 $ 1,069,352 $ 1,069,352 $ REVENUES Developer Fees/Loans 439,078 - - - - 357,389 Total Revenues N/A 439,078 - - - - 357,389 CAPITAL PROJECTS Aviara Reimbursement Agreement 238,001 $ - - - - -Loan Repay - Park-in-Lieu SW to Public Facility Fee Fund - - - - - - 1,100,000 Total Project Expenditures 238,001 - - - - - 1,100,000 N/A 1,069,352 $ 1,069,352 $ 1,069,352 $ 1,069,352 $ 1,069,352 $ 326,741 $ PARK-IN-LIEU NE PARK-IN-LIEU NW PARK-IN-LIEU SE PARK-IN-LIEU SW
I-37 PRIOR YEAR 1YEAR 2YEAR 3YEAR 4 YEAR 5 YEAR 6-15 YEARS 2023-242024-252025-262026-272027-282029-38 BEGINNING FUND BALANCE N/A 4,965,237 $ 5,078,256 $ 3,611,211 $ 3,613,492 $ 3,615,773 $ 3,615,773 $ REVENUES Developer Fees 113,019 32,955 2,281 2,281 - 972,947 Total Revenues N/A 113,019 32,955 2,281 2,281 - 972,947 CAPITAL PROJECTS Business Park Recreational Facility (Partial Funding) - $ - 1,500,000 - - - 16,500,000 Total Project Expenditures - - 1,500,000 - - - 16,500,000 ENDING FUND BALANCE N/A 5,078,256 $ 3,611,211 $ 3,613,492 $ 3,615,773 $ 3,615,773 $ (11,911,280) $ PRIOR YEAR 1YEAR 2YEAR 3YEAR 4 YEAR 5 YEAR 6-15 YEARS 2023-242024-252025-262026-272027-28 2029-38 BEGINNING FUND BALANCE N/A 918,300 $ 949,274 $ 949,274 $ 957,709 $ 957,709 $ 957,709 $ REVENUES Developer Fees 30,974 - 8,435 - - 42,314 Total Revenues N/A 30,974 - 8,435 - - 42,314 CAPITAL PROJECTS DMP Facility AAA (Jefferson Street) - $ - - - - - 290,000 DMP Facility AAAA (Madison Street) - - - - - - 417,000 DMP Facility AC (Highland Drive Drainage Project) - - - - - - 922,000 DMP Facility AFA (Hidden Valley Drainage Restoration and Enhancement Pro - - - - - - 92,000 DMP Facility AFB (Calavera Hills Drainage Restoration and Enhancement Proj - - - - - - 164,000 Drainage Master Plan Update 216,512 - - - - -Total Project Expenditures 216,512 - - - - - 1,885,000 ENDING FUND BALANCE N/A 949,274 $ 949,274 $ 957,709 $ 957,709 $ 957,709 $ (884,977) $ PRIOR YEAR 1YEAR 2YEAR 3YEAR 4 YEAR 5 YEAR 6-15 YEARS 2023-242024-252025-262026-272027-282029-38 BEGINNING FUND BALANCE N/A 1,692,487 $ 2,049,582 $ 2,138,841 $ 2,228,100 $ 2,318,220 $ 2,408,339 $ REVENUES Developer Fees 357,095 89,259 89,259 90,119 90,119 2,525,641 Total Revenues N/A 357,095 89,259 89,259 90,119 90,119 2,525,641 CAPITAL PROJECTS Agua Hedionda Creek Maintenance 3,545,245 $ - - - - -College Boulevard Extension - - - - - -DMP Facility BB 1 and 2 (Washington Street) - - - - - - 1,087,000 DMP Facility BCB (Magnolia Avenue) - - - - - - 469,000 DMP Facility BFB-L and BFB-1 (Tamarack and El Camino Real Plda "B") - - - - - - 905,000 DMP Facility BFB-U (El Camino Real) 153,489 - - - - -DMP Facility BL-L (College Boulevard Bridge Reimbursement Plda "B") - - - - - - 1,817,000 DMP Facility BL-U (College Boulevard) - - - - - - 385,000 DMP Facility BM (Cantarini/College Boulevard Box Culvert) - - - - - - 205,000 DMP Facility BQ (Sunny Creek) - - - - - - 132,000 DMP Facility BR (Cantarini/College Boulevard Pipe Drainage) - - - - - - 181,000 Drainage Master Plan Update 583,000 - - - - -Total Project Expenditures 4,281,735 - - - - - 5,181,000 ENDING FUND BALANCE N/A 2,049,582 $ 2,138,841 $ 2,228,100 $ 2,318,220 $ 2,408,339 $ (247,020) $ PRIOR YEAR 1YEAR 2YEAR 3YEAR 4 YEAR 5 YEAR 6-15 YEARS 2023-242024-252025-262026-272027-282029-38 BEGINNING FUND BALANCE N/A 1,548,322 $ 1,756,986 $ 1,922,169 $ 1,928,279 $ 1,934,389 $ 1,934,389 $ REVENUES Developer Fees 283,664 165,183 6,110 6,110 - 1,993,400 Total Revenues N/A 283,664 165,183 6,110 6,110 - 1,993,400 CAPITAL PROJECTS DMP Facility C2 (Paseo Del Norte) - $ - - - - - 728,000 DMP Facility CA (Avenida Encinas) - - - - - - 530,000 Drainage Master Plan Update 171,890 75,000 - - - -Total Project Expenditures 171,890 75,000 - - - - 1,258,000 ENDING FUND BALANCE N/A 1,756,986 $ 1,922,169 $ 1,928,279 $ 1,934,389 $ 1,934,389 $ 2,669,789 $ PLANNED LOCAL DRAINAGE AREA B FEES (PLD B) PLANNED LOCAL DRAINAGE AREA C FEES (PLD C) PARK FEE ZONES 5,13,16,17,18 PLANNED LOCAL DRAINAGE AREA A FEES (PLD A)
I-38 PRIOR YEAR 1YEAR 2YEAR 3YEAR 4 YEAR 5 YEAR 6-15 YEARS 2023-242024-252025-262026-272027-282029-38 BEGINNING FUND BALANCE N/A 924,980 $ 1,033,433 $ 1,100,092 $ 1,152,501 $ 1,152,501 $ 1,152,501 $ REVENUES Developer Fees 108,453 66,660 52,409 - - 1,333,883 Total Revenues N/A 108,453 66,660 52,409 - - 1,333,883 CAPITAL PROJECTS DMP Facility DBA (Poinsettia Village) - $ - - - - - 168,000 DMP Facility DBB (Avenida Encinas) - - - - - - 430,000 DMP Facility DFA (Batiquitos Lagoon Stormwater Treatment) - - - - - - 257,000 DMP Facility DH (Altive Place Canyon Restoration) - - - - - - 233,000 DMP Facility DQB (La Costa Town Center) - - - - - - 746,000 DMP Facility DZ (Poinsettia Lane) - - - - - - 643,000 Drainage Master Plan Update 234,599 - - - - -Total Project Expenditures 234,599 - - - - - 2,477,000 ENDING FUND BALANCE N/A 1,033,433 $ 1,100,092 $ 1,152,501 $ 1,152,501 $ 1,152,501 $ 9,384 $ PRIOR YEAR 1YEAR 2YEAR 3YEAR 4 YEAR 5 YEAR 6-15 YEARS 2023-242024-252025-262026-272027-282029-38 BEGINNING FUND BALANCE N/A 25,089,385 $ 28,083,648 $ 29,543,842 $ 29,396,937 $ 29,899,452 $ 28,996,675 $ REVENUES Developer Fees 2,947,263 1,460,194 853,095 502,515 497,222 16,983,023 Total Revenues N/A 2,947,263 1,460,194 853,095 502,515 497,222 16,983,023 CAPITAL PROJECTS Cole Library Expansion - $ - - - - - 11,936,000 El Camino Real Medians 695,781 - - - - -Kelly Drive and Park Drive Complete Street Improvements 1,085,001 (87,000) - - - -Leo Carrillo Ranch Park Phase 3 - Stables Restoration and Restroom Construc 1,631,500 - - - - -Leo Carrillo Ranch Park Phase 3 - Stables Restoration and Restroom Construc 287 - - - - -Pine Avenue Park - Phase II (Community Building) 9,328,416 - - - - -Pine Avenue Park - Phase II (Community Building) 123,300 - - - - -Poinsettia Community Park - Phase 4 - Dog Park 2,838,139 - - - - -Poinsettia Community Park - Phase 4 - Dog Park - - - - - -Robertson Ranch Park Development (Partial Funding) - - - - - -State Street Parking Lot Electric Vehicle Charging Stations 300,001 40,000 - - - -Temporary Fire Station No. 7 1,122,001 - - - - -Terramar Area Coastal Improvements 2,450,000 - - - - -Valley and Magnolia Complete Streets - - - 1,000,000 - -Village H South Off Leash Dog Area and Trail Segment 5B 682,500 - - - - 1,400,000Total Project Expenditures 20,256,925 (47,000) - 1,000,000 - 1,400,000 11,936,000 ENDING FUND BALANCE N/A 28,083,648 $ 29,543,842 $ 29,396,937 $ 29,899,452 $ 28,996,675 $ 34,043,698 $ PRIOR YEAR 1YEAR 2YEAR 3YEAR 4 YEAR 5 YEAR 6-15 YEARS 2023-242024-252025-262026-272027-282029-38 BEGINNING FUND BALANCE N/A 737,323 $ 319,421 $ (114,575) $ (1,324,388) $ (2,505,829) $ (2,342,950) $ REVENUES Developer Fees and Miscellaneous 757,598 450,455 275,386 162,009 162,879 3,666,458 Other Agency Contributions (City of Vista) 19,500 251,550 306,800 43,550 -Total Revenues N/A 777,098 702,005 582,186 205,559 162,879 3,666,458 CAPITAL PROJECTS Buena Interceptor Sewer Improvements 550,000 $ - - - - -El Fuerte Lift Station Pump Addition 180,000 200,000 450,000 - - -Faraday and El Camino Real Sewer Replacement - Orion to Palomar Airport R 1,740,001 1,100,000 - - - -Las Palmas Trunk Sewer 556,000 (255,000) 255,000 1,320,000 1,320,000 -Loan Repay - Sewer Conn to Sewer Repl - - - - - -Sewer Modeling 299,999 (100,000) - - - -Sewer Monitoring Program (Capacity) 642,000 - 44,000 - - - 264,000 Vista Carlsbad Interceptor - Agua Hedionda LS and Forcemain (VC12-VC13) 33,190,974 220,000 - - - -Vista Carlsbad Interceptor - Buena Vista Lift Station Improvements 296,001 - - 67,000 67,000 -Vista Carlsbad Interceptor - Lagoon Bridge Replacement (VC11B) 9,464,834 - - - - -Vista Carlsbad Interceptor - Reach VC14 To VC15 21,362,391 - - - - -Vista Carlsbad Interceptor - Reach VC3 100,000 30,000 387,000 405,000 - -Total Project Expenditures 68,382,201 1,195,000 1,136,000 1,792,000 1,387,000 - 264,000 ENDING FUND BALANCE N/A 319,421 $ (114,575) $ (1,324,388) $ (2,505,829) $ (2,342,950) $ 1,059,507 $ PLANNED LOCAL DRAINAGE AREA D FEES (PLD D) PUBLIC FACILITY FEE FUND (PFF) SEWER CONNECTION FEE FUND
I-39 PRIOR YEAR 1YEAR 2YEAR 3YEAR 4 YEAR 5 YEAR 6-15 YEARS 2023-242024-252025-262026-272027-282029-38 BEGINNING FUND BALANCE N/A (11,520,275) $ (7,227,269) $ (8,896,698) $ (16,111,377) $ (15,955,334) $ (15,934,954) $ REVENUES Transfer from Sewer Operating Fund 10,445,506 16,534,571 17,024,822 15,937,043 15,509,381 98,468,049 Total Revenues N/A 10,445,506 16,534,571 17,024,822 15,937,043 15,509,381 98,468,049 CAPITAL PROJECTS Agua Hedionda Lift Station Biological Monitoring and Maintenance 225,001 $ - - - - -Buena Interceptor Sewer Access Road Improvements 1,150,000 (650,000) 650,000 - - -Buena Interceptor Sewer Improvements 1,208,691 - - 2,950,000 2,950,000 3,540,000 3,540,000 Buena Interceptor Sewer Realignment - East Segment 507,000 - 1,200,000 1,200,000 2,400,000 1,800,000Cannon Road Lift Station Improvements 715,000 50,000 - - - -Chinquapin Lift Station Improvements 300,000 920,000 - - - -Encina Capital Projects 55,191,098 6,278,000 8,450,000 8,002,500 7,758,000 7,952,000 81,819,000 Foxes Landing Lift Station Wetwell and Pump Replacement 6,392,000 - - - - -North Batiquitos Access Road Improvement 363,800 26,000 - - - -North Batiquitos Lift Station Forcemain Rehabilitation 200,000 (125,000) - - - -Odor and Corrosion Prevention Assessment 320,000 - - - - -Orion Center 4,078,499 (3,778,500) 3,779,000 - - -Poinsettia Lift Station Rehabilitation - 650,000 - 8,250,000 - -SCADA Improvements 4,303,898 381,000 - - - -Sewer Condition Assessment 1,557,998 100,000 100,000 100,000 - 100,000 1,000,000 Sewer Lift Station Repairs and Upgrades 4,385,384 150,000 150,000 150,000 150,000 150,000 1,500,000 Sewer Line Capacity Improvements 1,200,000 200,000 620,000 944,000 - -Sewer System Rehabilitation and Replacement 9,426,478 1,200,000 1,850,000 1,850,000 1,850,000 1,850,000 27,400,000 Terramar Area Coastal Improvements - - - - - -Vallecitos Interceptor Sewer Cleaning and CCTV 350,000 - - - - -Village and Barrio Traffic Circles 160,001 500,000 - - - -Villas Sewer Lift Station Replacement 1,254,002 75,000 - - - -Vista Carlsbad Interceptor - Agua Hedionda LS and Forcemain (VC12-VC13) - - 104,000 75,000 75,000 75,000Vista Carlsbad Interceptor - Buena Vista Lift Station Improvements - 86,000 31,000 598,000 598,000 22,000 300,000 Vista Carlsbad Interceptor - Reach VC3 - - - - - -Vista Carlsbad Interceptor - Rehabilitation (VC1 and VC2) 141,001 90,000 70,000 120,000 - -Vista/Carlsbad Interceptor - Point Repair Reaches (VC13 & VC14) 200,000 - 1,200,000 - - -Total Project Expenditures 93,629,850 6,152,500 18,204,000 24,239,500 15,781,000 15,489,000 115,559,000 ENDING FUND BALANCE N/A (7,227,269) $ (8,896,698) $ (16,111,377) $ (15,955,334) $ (15,934,954) $ (33,025,904) $ PRIOR YEAR 1YEAR 2YEAR 3YEAR 4 YEAR 5 YEAR 6-15 YEARS 2023-242024-252025-262026-272027-282029-38 BEGINNING FUND BALANCE N/A 2,583,440 $ 3,737,122 $ (375,373) $ 124,224 $ 349,654 $ 555,555 $ REVENUES Developer Fees 4,743,682 1,277,505 589,597 315,430 295,901 19,675,140 Total Revenues N/A 4,743,682 1,277,505 589,597 315,430 295,901 19,675,140 CAPITAL PROJECTS Avenida Encinas Coastal Rail Trail and Pedestrian Improvements 5,177,904 $ - 2,500,000 - - -Carlsbad Boulevard Realignment - Manzano Drive to Island Way - - - - - - 932,000 Carlsbad Boulevard Realignment - Manzano Drive to Island Way - - - - - - 3,681,000 Carlsbad Village Drive Widening - Pontiac Drive to Victoria Avenue - - - - - -El Camino Real and Cannon Road Intersection Improvements 3,536,001 - - - - -El Camino Real Right Turn Lane to East Bound Alga Road - - - - - - 438,000 El Camino Real Widening - Arenal Road to La Costa Avenue 3,250,001 4,000,000 - - - -Melrose Drive Right Turn Lane to West Bound Palomar Airport Road 911,002 - - - - -Palomar Airport Road and College Boulevard Improvements 1,295,500 - - - - -Sidewalk/Street Construction Program 3,800,000 (500,000) - - - -Terramar Area Coastal Improvements 6,650,003 - 2,800,000 - - -Traffic Impact Fee Funds to CFD #1 - 90,000 90,000 90,000 90,000 90,000 900,000 Traffic Impact Fee Update 270,000 - - - - -Traffic Monitoring Program 1,745,415 - - - - -Valley and Magnolia Complete Streets 3,536,208 - - - - -Total Project Expenditures 30,172,033 3,590,000 5,390,000 90,000 90,000 90,000 5,951,000 ENDING FUND BALANCE N/A 3,737,122 $ (375,373) $ 124,224 $ 349,654 $ 555,555 $ 14,279,694 $ SEWER REPLACEMENT FUND TRAFFIC IMPACT FEES (TIF)
I-40 PRIOR YEAR 1YEAR 2YEAR 3YEAR 4 YEAR 5 YEAR 6-15 YEARS 2023-242024-252025-262026-272027-282029-38 BEGINNING FUND BALANCE N/A 5,726,270 $ 5,972,270 $ 6,612,470 $ 7,801,254 $ 9,579,014 $ 13,381,149 $ REVENUES Transportation Taxes 5,886,000 6,065,200 6,243,784 6,412,760 6,577,135 66,360,356 Total Revenues N/A 5,886,000 6,065,200 6,243,784 6,412,760 6,577,135 66,360,356 CAPITAL PROJECTS ADA Improvement Program 3,155,000 $ 175,000 715,000 175,000 715,000 175,000 4,450,000 Barrio Street Lighting 1,280,000 1,280,000 1,030,000 - - -Carlsbad Boulevard and Tamarack Avenue Pedestrian Improvements 1,054,000 - - - - -Carlsbad Boulevard Pedestrian Lighting 1,325,000 - - - - -Carlsbad Village Drive and Grand Avenue Pedestrian and Crossing Improvem - - - - 1,320,000 -Carlsbad Village Drive Widening - Pontiac Drive to Victoria Avenue - - - - - -Chestnut Avenue Complete Street Improvements - Valley to Pio Pico - - 1,080,000 - - -Chestnut Complete Street I-5 to Railroad Project Study - 85,000 - - - -Christiansen Way Improvements - - - 310,000 - -College Boulevard Extension 1,205,000 - - - - -Coordinated Traffic Signal Program 2,583,980 - - - - -Coordinated Traffic Signal Program 1,000,000 - - - - -El Camino Real Widening - Poinsettia Lane to Camino Vida Roble 3,155,001 - - - - -El Camino Real Widening - Sunny Creek to Jackspar 5,009,999 - - - - -Kelly Drive and Park Drive Complete Street Improvements 4,675,001 - - - - -Pavement Management Program 19,186,565 1,150,000 1,650,000 1,650,000 1,650,000 1,650,000 16,500,000 Pavement Management Program 16,346,475 950,000 950,000 950,000 950,000 950,000 9,500,000 South Carlsbad Coastline 1,779,027 1,000,000 - - - -State Street and Grand Avenue Road Improvements - - - 325,000 - -Street Lighting Replacement Program 3,325,002 - - - - -Terramar Area Coastal Improvements 1,000,000 1,000,000 - - - -Valley and Magnolia Complete Streets 1,200,000 - - - - -Valley Street Traffic Calming - - - 1,645,000 - -Village and Barrio Traffic Circles 1,024,999 - - - - -Total Project Expenditures 68,305,048 5,640,000 5,425,000 5,055,000 4,635,000 2,775,000 30,450,000 ENDING FUND BALANCE N/A 5,972,270 $ 6,612,470 $ 7,801,254 $ 9,579,014 $ 13,381,149 $ 49,291,505 $ PRIOR YEAR 1YEAR 2YEAR 3YEAR 4 YEAR 5 YEAR 6-15 YEARS 2023-242024-252025-262026-272027-282029-38 BEGINNING FUND BALANCE N/A 26,427,710 $ 28,254,138 $ 26,190,474 $ 25,672,006 $ 23,193,381 $ 23,703,925 $ REVENUES Developer Fees 2,637,428 1,057,336 1,266,532 313,376 1,010,544 12,914,170 Total Revenues N/A 2,637,428 1,057,336 1,266,532 313,376 1,010,544 12,914,170 CAPITAL PROJECTS College Boulevard - Cannon Road To Badger Lane (375 Zone) 278,383 $ - 1,250,000 - - -College Boulevard - Cannon Road To Badger Lane (490 Zone) 312,600 - 1,250,000 - - -Desalinated Water Flow Control Facility No. 5 10,811,601 758,000 - - - -Hydroelectric Generation at Water Facilities 428,000 33,000 385,000 - 1,225,000 -Maerkle Reservoir Transmission Main - - 236,000 1,660,000 1,567,000 -Poinsettia Lane - Cassia Road to Skimmer Court (Reimbursement Agreement 600,000 - - - - -Rancho Carlsbad Groundwater Supply 200,000 - - 125,000 - - 1,425,000 San Luis Rey Mission Basin Groundwater Supply - 20,000 - - - 500,000 30,900,000 Water Modeling 375,001 - - - - -Total Project Expenditures 13,005,585 811,000 3,121,000 1,785,000 2,792,000 500,000 32,325,000 ENDING FUND BALANCE N/A 28,254,138 $ 26,190,474 $ 25,672,006 $ 23,193,381 $ 23,703,925 $ 4,293,095 $ PRIOR YEAR 1YEAR 2YEAR 3YEAR 4 YEAR 5 YEAR 6-15 YEARS 2023-242024-252025-262026-272027-282029-38 BEGINNING FUND BALANCE N/A (15,673,990) $ 325,000 $ 0 $ 0 $ 0 $ 0 $ REVENUES Recycled Water Loans and Grants 15,998,990 - - - -Total Revenues N/A 15,998,990 - - - -CAPITAL PROJECTS C-Tank Access Road Repair and Electrical Improvements 50,000 $ - 325,000 - - -Total Project Expenditures 50,000 - 325,000 - - -ENDING FUND BALANCE N/A 325,000 $ 0 $ 0 $ 0 $ 0 $ 0 $ TRANSNET - LOCAL WATER CONNECTION - POTABLE WATER CONNECTION - RECYCLED
I-41 PRIOR YEAR 1YEAR 2YEAR 3YEAR 4 YEAR 5 YEAR 6-15 YEARS 2023-242024-252025-262026-272027-282029-38 BEGINNING FUND BALANCE N/A 15,085,158 $ 17,241,013 $ 6,701,400 $ (7,305,234) $ (21,240,652) $ (20,665,498) $ REVENUES Transfer from Water Operating Fund 6,348,536 6,187,387 5,966,366 5,752,582 5,815,154 59,595,595 Total Revenues N/A 6,348,536 6,187,387 5,966,366 5,752,582 5,815,154 59,595,595 CAPITAL PROJECTS Abandon Potable Services (New Recycled Services) 925,826 $ 250,000 500,000 - - -Carlsbad Boulevard Waterline Replacement at Terramar 4,730,001 - - - - -Carlsbad Water Recycling Facility (Encina Capital Projects) 599,943 - - - - -Cathodic Protection Program 1,796,702 190,000 190,000 190,000 190,000 190,000 540,000 Crestview Drive Transmission Main 321,000 284,000 - - - -El Camino Real Widening - Arenal Road to La Costa Avenue - 1,000,000 - - - -Fire Flow Capacity System Improvements 210,000 415,000 2,000,000 2,500,000 3,000,000 -Limited Access Pipeline Relocation Program 1,940,000 761,000 - 6,348,000 2,875,000 -Maerkle Facility Improvements 2,735,200 800,000 - - - -Maerkle Reservoir Solar Project 249,170 - - - - -Maerkle Reservoir Transmission Main 773,001 (578,000) 244,000 2,130,000 2,023,000 -Normally Closed Valve (Install Motorized Valve) 984,999 300,000 - - - -Orion Center 6,789,410 (6,289,409) 6,290,000 - - -Palomar Airport Waterline Realignment 2,332,999 - - - - -Pressure Reducing Station Program 5,831,037 600,000 600,000 600,000 600,000 600,000 6,000,000 Rancho Carlsbad Groundwater Supply 200,000 - - 125,000 - - 1,425,000 Recycled Water Phase 3 - Reservoir 980,001 (800,000) - - - -Reservoir Repair and Maintenance Program 5,850,000 2,040,000 - - - - 6,680,000 San Luis Rey Mission Basin Groundwater Supply - - - - - -Santa Fe II Inlet Pipeline 529,650 - 206,000 115,000 1,920,000 -Santa Fe II Reservoir Site Electrical Improvements 183,581 110,000 - - - -SCADA Improvements 7,132,599 2,413,000 611,000 - - -Tri-Agency Water Transmission Pipeline Replacement 3,618,973 (1,290,000) 431,000 3,585,000 4,630,000 -Valley and Magnolia Complete Streets 71,000 - 650,000 - - -Water Infrastructure Condition Assessment Program 2,190,001 410,000 420,000 420,000 450,000 450,000 4,730,000 Water Loss Monitoring Program 349,999 (182,911) - - - -Water System Rehabilitation and Replacement 12,258,370 2,800,000 3,000,000 3,000,000 3,000,000 3,000,000 40,970,000 Water Valve Repair/Replacement Program 7,859,998 960,000 960,000 960,000 1,000,000 1,000,000 10,760,000 Technology Investment Projects Meter Data Management/Utility Analytics - - 550,000 - - -Utility Billing Automation - - 75,000 - - -Utility Billing Portal 90,000 - - - - -Total Project Expenditures 71,533,459 4,192,680 16,727,000 19,973,000 19,688,000 5,240,000 71,105,000 ENDING FUND BALANCE N/A 17,241,013 $ 6,701,400 $ (7,305,234) $ (21,240,652) $ (20,665,498) $ (32,174,903) $ PRIOR YEAR 1YEAR 2YEAR 3YEAR 4 YEAR 5 YEAR 6-15 YEARS 2023-242024-252025-262026-272027-282029-38 BEGINNING FUND BALANCE N/A 12,323,061 $ 14,417,661 $ 10,694,661 $ 10,113,661 $ 11,481,261 $ 13,030,821 $ REVENUES Transfer from Recycled Water Operating Fund 1,600,000 1,760,000 1,936,000 2,129,600 2,342,560 23,425,600 Total Revenues N/A 1,600,000 1,760,000 1,936,000 2,129,600 2,342,560 23,425,600 CAPITAL PROJECTS C-Tank Access Road Repair and Electrical Improvements 250,000 $ - 1,000,000 - - -Carlsbad Water Recycling Facility (Encina Capital Projects) 4,057,710 767,000 949,000 1,992,000 237,000 268,000 2,650,000 Carlsbad Water Recycling Facility Irrigation and Landscape 175,000 (140,000) - - - -Carlsbad Water Recycling Facility Roof Replacement 225,000 156,000 - - - -Cathodic Protection Program - 100,000 100,000 - - -Orion Center 2,715,599 (2,515,600) 2,516,000 - - -Recycled Water Condition Assessment Program 750,001 50,000 50,000 50,000 50,000 50,000 590,000 Recycled Water Phase 3 - Reservoir 3,319,997 200,000 - - - -Recycled Water Pipeline Replacement - 350,000 350,000 350,000 350,000 350,000 5,060,000 Recycled Water Valve and Appurtenance Replacement Program 380,000 - 120,000 125,000 125,000 125,000 1,330,000 Reservoir Condition Assessment and Repair Program - 200,000 - - - -SCADA Improvements 1,658,400 338,000 398,000 - - -Total Project Expenditures 13,531,708 (494,600) 5,483,000 2,517,000 762,000 793,000 9,630,000 ENDING FUND BALANCE N/A 14,417,661 $ 10,694,661 $ 10,113,661 $ 11,481,261 $ 13,030,821 $ 26,826,421 $ WATER REPLACEMENT - RECYCLED WATER REPLACEMENT - POTABLE
I-42
GLOSSARY OF CAPITAL PROJECT FUNDING SOURCES
BTD#2 – Bridge and Thoroughfare District No. 2 developer fees are paid to partially fund the Poinsettia Lane and Aviara Parkway street construction project.
BTD#3 – Bridge and Thoroughfare District No. 3 developer fees are paid to partially fund Cannon Road improvements.
CFD #1 – The City of Carlsbad Community Facilities District No. 1 (Mello-Roos) funds civic projects, I-5 interchange projects, and road segments.
Federal Grants (FED GRANT) – Federal Grants such as funding for Village and Barrio traffic circles.
Gas Tax – Gas Tax revenues for street projects are received under the Streets & Highways Code of the State of California.
Gas Tax 1B – Gas Tax revenues for street projects specifically for road maintenance and rehabilitation are received under the Streets & Highways Code of the State of California.
General Capital Construction (GCC) – General Capital Construction funds, created through fund transfers from the city's General Fund, are used to fund various municipal and other capital projects.
Infrastructure Replacement Fund (IRF) – Annual transfers from the General fund pay for major maintenance and replacement of the city’s infrastructure.
Other – Sources include revenues related to pending financing districts, property owner contributions and contributions from other agencies.
Park-in-Lieu (PIL) – Park-in -Lieu Fees are charged to developers for park acquisition and development. PIL fees are segregated by quadrant to fund park projects in those quadrants.
Planned Local Drainage (PLD A, B, C, D) – Drainage facilities necessitated by growth are paid from developer Planned Local Drainage Fees. PLD fees are segregated by drainage area.
Public Facilities Fees (PFF) – Public Facilities Fees are charged to developers to fund civic facilities, park development, streets, traffic signals, and other facilities.
Sewer Connection (SEWER CONN) – Development fees include Sewer Connection charges for expansion of sewer lines and facilities.
Sewer Replacement (SEWER REPL) – Sewer Replacement is part of sewer user fees and pays for repair and replacement of the city's existing sewer system.
I-43
State Grants (STATE GRANT) – State grants such as Veteran’s Memorial Park funding.
Transportation Development Act (TDA) – City street and bicycle projects can receive funding from Transportation Development Act sales tax receipts.
Traffic Impact Fees (TIF) – Developer Traffic Impact Fees are used for various street construction and improvement projects.
TransNet (TRNSNT-LOC) – Receipts of county sales taxes allocated by the San Diego Regional Transportation Commission finance various local road improvement projects.
Water Connection (WATER CONN) – Development fees include Major Facility Fees used to fund expansion of water lines and ancillary water facilities.
Water Replacement (WATER REPL) – Water Replacement funds are included in water utility rates and pay for the repair and replacement of existing potable water lines and facilities.
Water Recycled (RECL WATER) – Revenues used to fund new Recycled Water projects; revenues for Phase III expansion includes grant and loan funds.
Water Recycled Replacement (RECL REPL) – Recycled Water Replacement funds are included in utility rates and pay for the repair and replacement of existing recycled water lines and facilities.
Zone 5, 13, 16, 17, 18 Park Fee (ZONE 5) – Fees paid by development in Local Facilities Management Zones 5, 13, 16, 17 and 18 to fund a Business Park Recreational Facility in the city's industrial corridor.
I-44
PLANNED MAJOR CAPITAL OUTLAY ITEMS FISCAL YEAR
2023 - 24
*Major Capital Outlay only includes items of $10,000 or greater.
J-1
Department Item Description Quantity One-Time Cost Golf Course Driving Range Entertainment Project Planning 1 60,000 Kitchen & Banquet Equipment Package 1 50,000 Rough Mower 1 80,000 Utility Carts 4 40,000 Bunker Renovation Phase 5 of 5 1 60,000 Canyons Patio Furniture Replacement 1 77,000 Cart Path Repairs (6-8 panels) 1 60,000 Clubhouse and Surrounding Area Landscaping 1 60,000 Fencing Replacement 1 60,000 Range Improvements/Supplies 1 60,000 Replace Artificial Turf on Driving Range Tee 1 60,000 Concrete Slab and Covers for #6 & #14 F&B Stations 1 39,960 Replacement Swinging Kitchen Door in Fireside Room 1 15,000 Starter Structure 1 60,000 Add Bunker on Hole #18 1 60,000 Waterfall Plant Material Improvements 1 30,000 Driving Range Netting 1 40,540 Monument Sign 1 25,000 Carpeting for Offices and Golf Shop 1 42,500 AirWall System for Fireside Room 1 30,000 Golf Course Subtotal 23$1,010,000 Fleet Replacement Fleet & Facilities: Pickup Truck 1 80,000 Fire: Pickup Truck 1 52,020 Parks & Recreation: Pickup Truck 1 48,725 Parks & Recreation: Tractor 1 55,784 Parks & Recreation: Trailers 4 60,345 Police: Utility Vehicles 6 466,270 Police: Motorcycle 1 46,420 Police: Sedan 2 104,000 Public Works: Compactor 1 80,000 Public Works: Loader 1 75,000 Fleet Replacement Subtotal 19$1,068,564 Information Technology Replacement Servers 5 84,966 Switches 19324,642 Information Technology Subtotal 24$409,608 Major Capital Outlay Grand Total 66$2,488,172
(Greater than $10,000)
J-2
FUND CLASSIFICATION S AND DESCRIPTIONS
The financial operations of the city are organized into funds for which budgets are prepared. These funds are grouped into three major categories: Governmental, Proprietary, and Fiduciary.
Governmental Funds
Governmental funds are made up of the General Fund, Special Revenue Funds and Capital Project Funds.
The General Fund (001) is used to account for all financial resources necessary to carry out basic governmental activities of the city that are not accounted for in another fund. The General Fund supports essential city services such as police and fire protection, street maintenance, libraries, parks and open space management.
Special Revenue Funds are used to account for specific revenues that are legally restricted to expenditures for specified purposes.
Affordable Housing (133) – Collects fees generated from the Inclusionary Housing In-Lieu Fee and the sale of affordable housing credits that satisfy a developer’s inclusionary housing obligation as well as loan repayments from existing developments. With these funds, the city provides affordable housing programs and low income and homeless services support and financial assistance for residential developments that provide housing opportunities to low income households.
Agricultural Mitigation Fee (171) – The Agricultural Conversion Mitigation Fee program funds projects that improve agricultural lands for continued agricultural production, protect and enhance the coastal and lagoon environment, improve lagoon nature centers and restore beaches for public use.
Buena Vista Channel Maintenance District (163) – Ensures adequate funds are collected from property owners within the district to administer and maintain the Buena Vista Creek Channel from Jefferson Street east to the South Vista Way bridge.
Citizens’ Option for Public Safety (COPS) (123) – Supplemental Law Enforcement Services Funds to be spent providing “front line police services” such as anti-gang efforts, crime prevention and juvenile justice programs
Community Activity Grants (150) – Provides city-funded grants to community service groups.
Community Development Block Grant (391) – Federal funds provided to the city to develop viable urban communities through the provision of decent housing, a suitable living environment and by expanding economic opportunities for lower income persons.
Cultural Arts Donations (148) – Funds used to promote and support the programs and activities of the city’s Cultural Arts Office.
Habitat Mitigation Fee (172) – Funding for conservation of certain parcels totaling approximately 300 acres which lie in the unincorporated area to the southeast of Carlsbad, and which are essential to the biological viability of the Habitat Management Plan.
Library and Arts Endowments (175) – Donations are used to support Library programming and activities.
J-3
Library Gifts & Bequests (145) – Includes Friends of the Library annual donations and Library Gifts and Bequests. Donations are used to support Library programming and activities.
Lighting and Landscaping District 2 (164) – This maintenance and assessment district funds the costs of streetlights, street trees and medians within the district boundaries covering newer developments in the city.
Local Cable Infrastructure (138) – Funds used for the associated capital costs of the city’s own cable channel and other city outreach and communications programs Franchise fees from cable and internet providers make up the revenue for this fund.
Local Housing Allocation Fund (136) – Funds from California’s Permanent Local Housing Allocation Program established in 2017 to provide funding for affordable housing, funded by a fee levied on certain real-estate transactions.
Median Maintenance District (161) – Provides landscape and irrigation maintenance for approximately 68 acres of median planters and nine acres of developed parkways, including the Downtown Carlsbad Village area.
Opioid Settlement Fund (128) – Funds from the California Opioid Settlements utilized for opioid remediation activities.
Police Asset Forfeiture (122) – Funds received from the police department’s drug enforcement activities which are restricted for use in supporting police activities to include the acquisition of equipment, supplies or services.
Public Safety Grants (124) – Used to purchase equipment, supplement staffing costs and assist with training.
Recreation Donations (149) – These donations provide supplemental funding for Parks & Recreation events, programs and facilities.
Rental Assistance/Section 8 Program (190) – Federal funding to provide vouchers to help low income residents pay rent.
Senior Program Donations (143) – These donations provide funding for nutrition, transportation, activities, events and other programs benefiting Carlsbad's senior population.
Street Lighting Maintenance District (162) – The street lighting maintenance assessment district provides funding for the operation and maintenance of all city-accepted streetlights within the public right-of-way.
Street Tree Maintenance District (160) – The street tree maintenance assessment district provides partial funding for the operation and maintenance of all city-accepted street trees within the public right-of-way, including specialized maintenance for street trees in the Downtown Carlsbad Village area.
Tyler Court Apartments (806) – Provides affordable housing to senior households with incomes at 30% and 50% of the San Diego County Area median incomes.
J-4
Capital Project Funds are used to account for specific revenues that are restricted to expenditures for capital project purposes.
Bridge and Thoroughfare District 2 (BTD 2) (362) – Developer fees are paid to partially fund the Poinsettia Lane and Aviara Parkway street construction project.
Bridge and Thoroughfare District 3 (BTD 3) (363) – Developer fees are paid to partially fund Cannon Road improvements.
Community Facilities District 1 (CFD 1) (430) – Mello-Roos funds specific civic projects, I-5 interchange projects and road segments.
Gas Tax (152) – Gas Tax revenues for street projects received under the Streets & Highways Code of the State of California.
Gas Tax Road Maintenance and Rehabilitation (153) – Gas Tax revenues for street projects, which can only be used for road maintenance and rehabilitation, received under the Streets & Highways Code of the State of California.
General Capital Construction (GCC) (300) – General Capital Construction funds, created through annual fund transfers from the city's General Fund, are used to fund various municipal and other capital projects.
Grants-Federal (392) – Federal Grants such as funding for Village and Barrio traffic circles.
Grants-State (389) – State grants such as Veteran’s Memorial Park funding.
Industrial Corridor Park Fees (334) – Fees paid by development in Local Facilities Management Zones 5, 13, 16, 17 and 18 to fund a Business Park Recreational Facility in the city's industrial corridor.
Infrastructure Replacement (IRF) (370) – Annual transfers from the General Fund to pay for major maintenance and replacement of the city’s infrastructure.
Park in-Lieu Fees (PIL) (330-333) – Park-in -Lieu fees are charged to developers for park acquisition and development. PIL fees are segregated by quadrant to fund park projects in those quadrants.
Parking in-Lieu Fees (315) – Funding collected from new developments in Carlsbad Village that do not provide adequate parking facilities for use in construction of future parking facilities and improvements.
Planned Local Drainage Area Fees (PLD) (350-353) – Drainage facilities necessitated by growth are paid from developer Planned Local Drainage Fees. PLD fees are segregated by drainage area.
Public Facilities Fees (PFF) (320) – Public Facilities Fees are charged to developers to fund civic facilities, park development, streets, traffic signals, and other facilities.
Technology Investment Capital (375) – Technology Investment Capital funds, created through annual fund transfers from the city's General Fund, are used to fund various technology projects.
Transportation Development Act (TDA) (380) – City street and bicycle projects can receive funding from Transportation Development Act sales tax receipts.
J-5
Traffic Impact Fees (TIF) (310) – Developer Traffic Impact Fees are used for various street construction and improvement projects.
TransNet (342) – Receipts of county sales taxes allocated by the San Diego Regional Transportation Commission to finance various bicycle, freeway interchange and local road improvement projects.
Proprietary Funds
Proprietary funds are Internal Service Funds and Enterprise Funds.
Internal Service Funds are used to account for operations internal to the city where the intent is that the cost of providing services to the city department is financed primarily through department user charges.
Workers’ Compensation (611) – Management of workers’ compensation insurance and claims.
Risk Management (612) – Management of vehicle and city liability insurance.
Vehicle Maintenance (620) – Vehicle maintenance and operations of citywide fleet, including gas and oil charges.
Vehicle Replacement (621) – Funding for the replacement of vehicles currently in operation, based on the expected replacement cost at the end of vehicles useful life.
Information Technology Operations (640) – Maintenance and operations of citywide technology assets.
Information Technology Replacement (641) – Funding for the replacement of current technology assets based on the expected replacement cost at the end of the anticipated useful life.
Enterprise Funds are used to account for operations that are financed and operated similar to a private business where the intent is that the cost of providing services to the public is financed primarily through user charges.
Potable Water Operations (501) – Carlsbad Municipal Water District (CMWD), a subsidiary of the city, provides potable water service to approximately 85% of the city.
Potable Water Connection (506) – Development fees include Major Facility Fees used to fund expansion of potable water lines and ancillary water facilities.
Potable Water Replacement (505) – Water replacement charges are included in water utility rates and pay for the repair and replacement of existing potable water lines and facilities.
Recycled Water Operations (502) – Funds used to operate and maintain critical infrastructure systems and to provide the safe delivery of conservation outreach and treated irrigation water.
Recycled Water Connection (507) – Revenues used to fund new Recycled Water projects; revenues for Phase III expansion includes grant and loan funds.
Recycled Water Replacement (508) – Recycled Water Replacement funds are included in utility rates and pay for the repair and replacement of existing recycled water lines and facilities.
Wastewater Operations (511) – The city operates and maintains a sanitary wastewater collection system, which covers approximately 65% of the geographic area of the city.
J-6
Wastewater Connection (512) – Development fees include Sewer Connection charges for expansion of sewer lines and facilities.
Wastewater Replacement (515) – Sewer replacement charges are part of sewer user fees and pay for repair and replacement of the city's existing sewer system.
Solid Waste Management (520) – Administers and monitors the solid waste contract and the Palomar Transfer Station agreement and is responsible for ensuring the waste reduction and recycling components of the Source Reduction and Recycling Element and Household Hazardous Waste Element comply with state mandated diversion and disposal requirements.
Watershed Protection (521) – Fund dedicated to providing programs which enable stewardship of the city’s resources protecting our beaches, creeks, and lagoons.
The Crossings Golf Course (572) – Funds used to cover the operations of the city’s municipal golf course.
Fiduciary Fund
Fiduciary funds are private purpose trust funds used to account for situations where the city’s role is purely custodial, such as the receipt, temporary investment, and remittance of fiduciary resources to individuals, private organizations, or other governments.
Successor Agency to the Redevelopment Agency (801) – Responsible for administering enforceable obligations of the former Carlsbad Redevelopment Agency (RDA) including administration of housing loans and other debt obligations, completing existing projects and ultimately to wind down RDA operations over time.
J-7
J-8
DEPARTMENT/FUND RELATIONSHIP
J-9
Police Department Fire Department Public Works Community Services Administrative Services Policy & Leadership Capital Projects General XXXXXX Capital Project Bridge & Thoroughfare District No. 2 X Bridge & Thoroughfare District No. 3 X Community Facilities District No. 1 X Infrastructure Replacement X Enterprise Potable Water Operations X Potable Water Connection X Potable Water Replacement X Recycled Water Operations X Recycled Water Connection X Recycled Water Replacement X Wastewater Operations X Wastewater Connection X Wastewater Replacement X Special Revenue Affordable Housing X Agricultural Mitigation Fees X Buena Vista Channel Maintenance District X Citizens Option for Public Safety X Community Activity Grants X Community Development Block Grant X Cultural Arts Donations X Habitat Mitigation Fee X Library & Arts Endowments X Library Gifts & Bequests X Lighting & Landscaping District No. 2 XX Local Cable Infrastructure X Median Maintenance District X Opioid Settlement X Permanent Local Housing Allocation X Fund Budget Program Major Funds Non-Major Funds Major and non-major classifications as of June 30, 2022
J-10 Police Department Fire Department Public Works Community Services Administrative Services Policy & Leadership Capital Projects Special Revenue (continued) Police Asset Forfeiture X Public Safety Grants XX Recreation Donations X Rental Assistance/Section 8 Program X Senior Program Donations X Street Lighting Maintenance District X Street Tree Maintenance District X Tyler Court Apartments X Capital Project Gas Tax X Gas Tax Road Maintenance and Rehabilitation X General Capital Construction X Grants-Federal X Industrial Corridor Park Fees X Park-in-Lieu Fees/Park Development Fund X Parking-in-Lieu Fees X Planned Local Drainage Area Fees (PLD) X Public Facilities Fees X Technology Investment Capital X Transportation Development Act (TDA) X Traffic Impact Fees (TIF) X TransNet X Internal Service Workers' Compensation X Risk Management X Vehicle Maintenance X Vehicle Replacement X Information Technology Operations X Information Technology Replacement X Enterprise The Crossings Golf Course X Solid Waste Management X Watershed Protection X Fiduciary Successor Agency to the Redevelopment Agency XX Fund Budget Program
GLOSSARY
Appropriation – A specific amount of money authorized by the City Council for an approved work program or individual project.
Assessed Valuation – A dollar value placed on real estate or other property by the County of San Diego as a basis for levying property taxes.
Balanced Budget – A budget in which planned expenditures do not exceed planned funds available.
Beginning/Ending Fund Balance – Unencumbered resources available in a fund from the prior/current year after payment of the prior/current year expenses.
Bond – A certificate of debt issued by an entity, guaranteeing payment of the original investment, plus interest, by a specified future date.
Branch – An organizational unit comprised of departments. Examples include the Administrative Services Branch and Community Services Branch.
Budget – An annual financial plan that identifies revenues, types and levels of services to be provided and the amount of funds that can be spent.
Capital Improvement Program – A multi-year financial plan containing proposed construction of physical assets such as park, street, sewage and recreation facilities. The 15-year program outlines the expenditure plan for future capital projects and the corresponding revenues to pay for those expenditures.
Capital Outlay – Equipment (fixed assets) with a value $1,000 or more and an estimated useful life of more than one year, such as automobiles and office furniture, which appear in the operating budget.
Carlsbad Community Vision – A set of nine core values and vision statements developed through consultation with the community in 2010 that serve as a guide for city leaders as they serve the city.
Cost Allocation – A method used to charge General Fund overhead costs to other funds, such as Enterprise Funds and Internal Service Funds.
Debt Service – The payment of principal and interest on borrowed funds such as bonds.
Department – An organizational unit comprised of programs or divisions. Examples include the Finance and Human Resources departments.
Encumbrance – A legal obligation to pay funds, an expenditure of which has not yet occurred.
Enterprise Fund – A fund type established to account for the total costs of selected governmental facilities and services that are operated similar to private enterprises.
Expenditure – The actual spending of funds set aside by appropriation for identified goods and services.
Fee – A general term used for any charge levied by government for providing a service or permitting an activity.
Fiscal Year – 12-month period designated as the budget year. Carlsbad's fiscal year is July 1 to June 30.
Full-time Equivalent (FTE) – The hours worked by one employee on a full-time basis, used to convert the hours worked by several part-time employees into the hours worked by full-time employees. Two employees each working 1,000 hours equals 1.0 full-time equivalent employee.
Fund – A set of interrelated accounts to record revenues and expenditures associated with a specific purpose.
J-11
Fund Balance – The amount of financial resources available for use.
General Fund – The primary fund used by the city for which revenues and expenditures are not legally restricted for use. Examples of departments operating within the General Fund include Fire, Library, and the City Manager's Office.
Grant – Contributions of cash or other assets from another governmental agency to be used or expended for a specified purpose, activity, or facility.
Growth Management Plan – A comprehensive approach to land-use planning ensuring controlled and managed growth within the city, while providing designated public facilities.
Growth Management Standards – Acceptable service levels that have been established for 11 public facility categories.
Interfund Transfers – Payments from one fund to another fund, primarily for work or services provided.
Internal Service Fund – A fund that provides services to all city departments and bills the various other funds for services rendered. Examples are Fleet Maintenance, Information Systems and Workers’ Compensation.
Maintenance and Operations – A general category used for classifying expenditures for materials, supplies and services that are normally used within the fiscal year.
Operating Budget – The annual appropriation of funds for ongoing program costs, which include salaries, benefits, maintenance and operations and capital outlay items. Carlsbad's Operating Budget encompasses one fiscal year.
Operating Costs – Estimated expenses that can be expected to occur following the construction of a Capital Improvement Project.
Personnel Costs – Expenditures associated with providing the staff necessary to provide the desired levels of services, including both salary and benefit costs.
Revenues – Amount of funds received from the collection of taxes, fees, permits, licenses, interest and grants during the fiscal year.
Special Revenue Funds – A fund that collects revenues that are restricted by the city, state or federal government as the manner in which they may be spent.
Strategic Digital Transformation Investment Program – A strategic plan for technology and digital transformation combined with project descriptions, costs, funding sources and timelines. It outlines a fiveyear expenditure plan for future digital transformation and technology projects and the corresponding revenues necessary to pay for them.
J-12
ACRONYMS
AARP – Am erican Association of Retired Persons
ADA – Americans with Disabilities Act
ADC – Actuarial Determined Contributions
AED – Automated External Defibrillator
AB – Assembly Bill
ALA – American Library Association
BCDDM – Build Capacity for Data- driven Decision Making
BEAR – Business expansion, attraction and retention
BTD – Bridge and Thoroughfare Benefit District
CAD – Computer Aided Dispatch
CalPERS – California Public Employees Retirement System
CalTrans – California Department of Transportation
CalWORKs – California Work Opportunities and Responsibility to Kids
CAD – Computer- aided Dispatch
CAP – Climate Action Plan
CCEA – Carlsbad City Employees' Association
CCTV – Closed-circuit Television
CDBG – Community Development Block Grant
CEQA – California Environmental Quality Act
CFA – Carlsbad Firefighters' Association
CFD – Community Facilities District
CIP – Capital Improvement Program
CM&I – Construction Management & Inspection
CMWD – Carlsbad Municipal Water District
COPS – Citizens' Option for Public Safety Grant
CPMA – Carlsbad Police Management Association
CPOA – Carlsbad Police Officers' Association
CPR – Cardiopulmonary Resuscitation
CSMFO – California Society of Municipal Finance Officers
CSS
Customer Self Service Portal
CST – Crime Suppression Team
CTBID – Carlsbad Tourism Business Improvement District
CWEA – California Water Environment Association
CWRF – Carlsbad Water Reclamation Facility
DEI – Diversity, Equity and Inclusion
DOJ – Department of Justice
EAT – Enhance Accessibility and Transparency
EIR – Environmental Impact Report
EKG – Electrocardiogram
EMS – Emergency Medical Services
EMT – Emergency Medical Technician
EOC – Emergency Operations Center
EPA – Environmental Protection Agency
ERP – Enterprise Resource Planning
ESL – English as a Second Language
EWA
FBI
Encina Wastewater Authority
Federal Bureau of Investigation
FE – Finance Enterprise
FEMA – Federal Emergency Management Agency
FPPC – Fair Political Practices Commission
FTE – Full-Time Equivalent
FVCEC – Foster a Vibrant Civic Engagement Culture
FY – Fiscal Year
GAAP – Generally Accepted Accounting Principles
GASB – Governmental Accounting Standards Board
GCC – General Capital Construction
GDP – Gross Domestic Product
GFOA – Government Finance Officers Association
J-13
–
–
–
GHG – Greenhouse Gas Emissions
GIS – Geographic Information System
GPS – Global Positioning System
HA – Hydrologic Area
HELP – Homeless Engagement Leading to Progress
HMP – Habitat Management Plan
HOT – Homeless Outreach Team
HPRM – HP Records Manager
HR – Human Resources
HUD – Department of Housing and Urban Development
I&ED – Innovation & Economic Development
ICC – International Code Council
ICMA – International City/County Management Association
IRF – Infrastructure Replacement Fund
ISF – Internal Service Fund
IT – Information Technology
JPA – Joint Powers Authority
LEAP – Local Early Action Planning
LED – Light- emitting diode
LCP – Local Coastal Program
LMS – Learning Management System
M&O – Maintenance and Operations
MFF – Major Facility Fee
MS4 – Municipal Separate Storm Sewer System
NFPA – National Fire Protection Association
NIST – National Institute of Standards and Technology
PC – personal computer
PCDC – Pursue Communitywide Digital Transformation
PCI – Payment card industry
PERS – Public Employees Retirement System
PFF – Public Facilities Fees
PHA – Public Housing Agency
PIL – Park- In-Lieu Fees
PLA – Public Library Association
PLD – Planned Local Drainage
POST – Police Officer Standards and Training
PSSC – Promote Security and Sustainability through Connectivity
PW – Public Works
RFP – Request for Proposal
ROPS – Recognized Obligation Payment Schedule
ROW – Right-of- Way
SANDAG – San Diego Association of Governments
SB – Senate Bill
SCADA – Supervisory Control and Data Acquisition System
SDCWA – San Diego County Water Authority
SDG&E – San Diego Gas & Electric
SDTIP – Strategic Digital T ransformation Investment Program
STEAM – Science, Technology, Engineering, the Arts, and Mathematics Program
SWAT – Special Weapons Attack Team
SWPPP – Storm Water Pollution Prevention Plan
SWQMP – Storm Water Quality Management Program
TCBMP – Treatment Control Best Management Practices
TCMP – Traffic Control Management Plan
TDA – Transportation Development Act
TDM – Transportation Demand Management
TIF – Traffic Impact Fee
TMDL – Total Maximum Daily Load
TOT – Transient Occupancy Tax, or hotel tax
UASI – Urban Areas Security Initiatives Program
UDC – Unified Disaster Council (of San Diego)
USLA – Unified States Lifesaving Association
WQIP – Water Quality Improvement Plan
J-14
BUDGET COMMUNICATIONS
Workshops
Community Budget Workshop on June 1, 2023https://www.carlsbadca.gov/home/showpublisheddocument/13998/638218451990070000#page=666
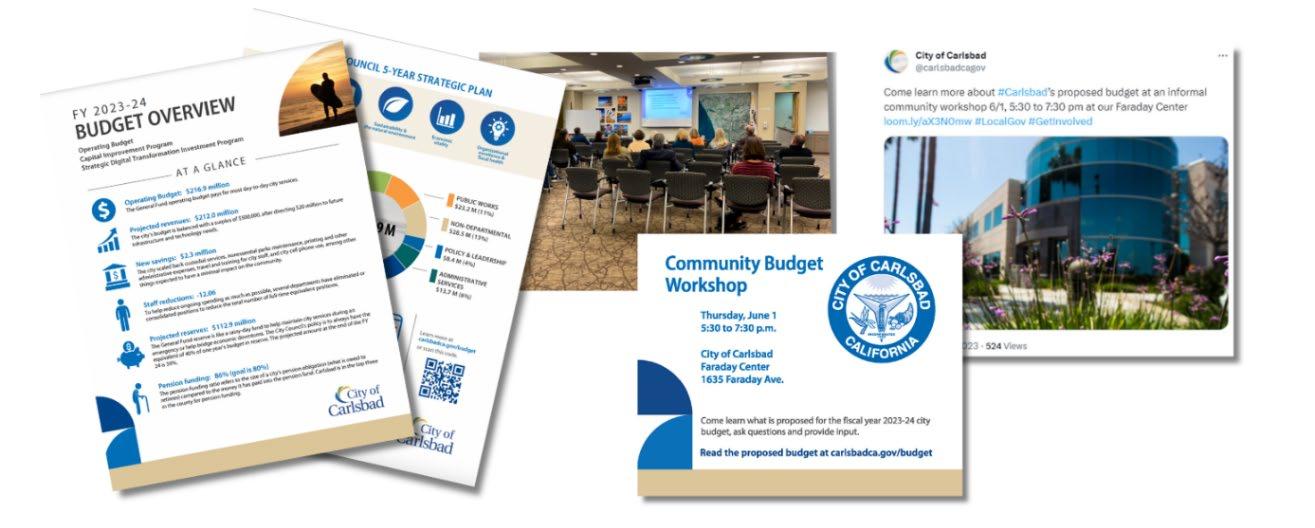
City Council Budget Meetings
Fiscal Year 2023-24 Preliminary Operating Budget, Strategic Digital Transformation Investment Program and Capital Improvement Program on May 23, 2023 – https://carlsbadca.new.swagit.com/videos/230923
Fiscal Year 2023-24 Operating Budget, Strategic Digital Transformation Investment Program and Capital Improvement Program, the Fiscal Year 2023-24 Appropriation Limit and Revisions of Fees and Charges of Services on June 13, 2023 – https://carlsbadca.new.swagit.com/videos/237391
Social Media Communications
Facebook Posts
Balanced budget adopted, June 15, 2023https://www.facebook.com/100064540458559/posts/pfbid0CkCsLBdFWUHcPMMPhkyeWZB38BSFLRAxS5Lysu Sc45VFQKmApEshCsPhSGnDkFiZl/?mibextid=cr9u03
City Council meeting agenda, June 9, 2023 -
https://www.facebook.com/100064540458559/posts/pfbid02ypUasfDDEEtJQeVkJ9pMvpSjejWEWHYViqJXHuv 6kpieGNBZPfFxXtoA9PsMkWGGl/?mibextid=cr9u03
Community budget workshop, May 31, 2023https://www.facebook.com/100064540458559/posts/pfbid0NwFWWFtdgf6patT364Y7Qig6ikQ3dpLp8RzwcfT6 GTxCntYhRLdMFiLgad54bZ2fl/?mibextid=cr9u03
City Manager’s update, May 25, 2023https://www.facebook.com/100064540458559/posts/pfbid02rqxjXk2thvR9dD8FtXfJmDtsLeRF6DKsoA64qKT6xx Z5Rer151EKe47v1ZkAuFoql/?mibextid=cr9u03
City Council meeting agenda, May 19, 2023 -
https://www.facebook.com/100064540458559/posts/pfbid07R2p3fcP8smcpFQCio8ZZoi5PowcKeFcYLm7Vigr7z Ssg8RiqXHgLxZZHXRpmQ1rl/?mibextid=cr9u03
City Manager’s update, May 18, 2023 -
https://www.facebook.com/100064540458559/posts/pfbid02nKRMGXegudNzq8zBkemwTK557Ue9YrRLJtWA8J 1kp9UBQ1summxiH6aTDD48Yo61l/?mibextid=cr9u03
J-15
Community budget workshop, May 18, 2023https://www.facebook.com/100064540458559/posts/pfbid0VwjMJb1o5NYbsVZFso556CNct4sa15T21yz6znneH kuBm6dHwKi7AWsY8KmAMA6kl/?mibextid=cr9u03
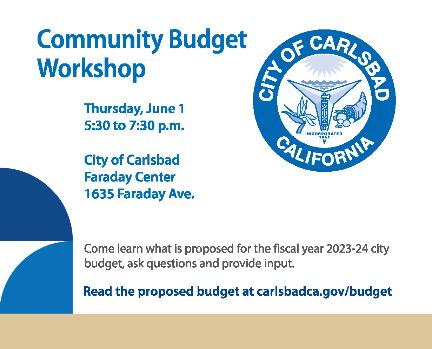
Twitter Posts
https://twitter.com/carlsbadcagov/status/1659390003728859137
https://twitter.com/carlsbadcagov/status/1659307182087610368
https://twitter.com/carlsbadcagov/status/1658648282753830913
https://twitter.com/carlsbadcagov/status/1669501435375919104
https://twitter.com/carlsbadcagov/status/1667252227470250004
https://twitter.com/carlsbadcagov/status/1663985603493658625
https://twitter.com/carlsbadcagov/status/1661895463719641093
https://twitter.com/carlsbadcagov/status/1661190272795934720
https://twitter.com/carlsbadcagov/status/1659638813541511174
Instagram Posts
https://www.instagram.com/p/CsZnv_ESHAP/ https://www.instagram.com/p/Cs6y6d5tQez/
Nextdoor Posts
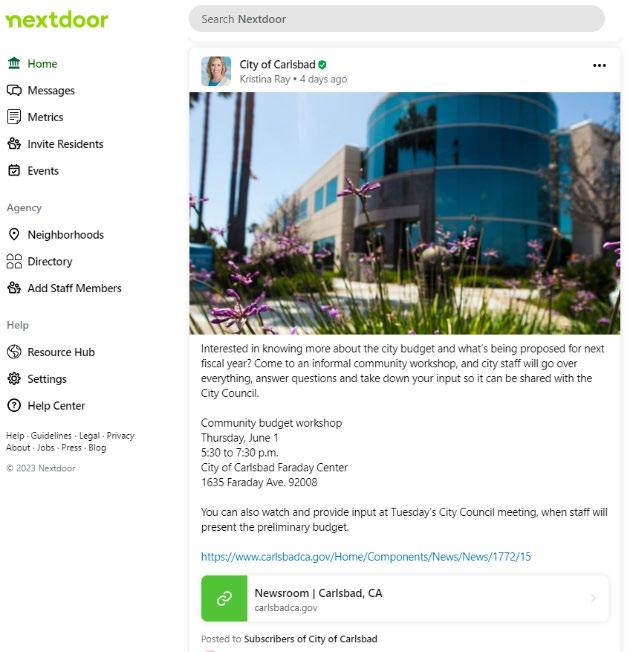
May 18, 2023
City Manager’s Update E-Newsletters
City Manager’s Update for May 18, 2022 – https://conta.cc/42Ofdrr
City Manager’s Update for May 25, 2022 – https://conta.cc/3Nhy8pW
City Manager’s Update for June 1, 2022 – https://conta.cc/42PmCa3
City Manager’s Update for June 15, 2022 – https://conta.cc/3CCmm3q
Advertising
The Coast News (print ad) on May 26, 2023
J-16
GENERAL FUND FORECAST
Overview
City staff develops medium-term (5-year) and long-term (10-year) forecasts as part of the budget process. While long-term projections are inherently less reliable than short-term projections, they can help detect structural budget issues early. As shown in the following chart, revenues will start to fall short of expenditures in fiscal year 2025-26 because revenues are growing at a slower rate than expenditures. Assumptions for both revenues and expenditures are detailed further in this forecast section.
General Fund 10-Year Forecast
Forecast Methodology
A financial forecast is a planning tool that helps identify trends and anticipate the long-term consequences of budget decisions. The forecast is instrumental in modeling the effects of retirement costs, employee compensation, on-going maintenance and operations, as well as revenues for the city’s budget.
The forecast is not a budget nor a plan but rather a model based on cost and revenue assumptions updated regularly as new information becomes available. Of these components, cost projections which are based on known costs are relatively reliable. However, revenue forecasts are based on assumptions related to future economic conditions, which are inherently more uncertain. Economic forecasts change frequently and demonstrate the difficulties of committing to a particular prediction of the future. For this reason, the city’s forecast is updated regularly.
While economic conditions are the primary drivers for economically sensitive revenues such as property tax, sales tax and transient occupancy tax, other factors drive non-economically sensitive categories such as franchise, ambulance, and departmental fee revenues. These revenue categories are more heavily impacted by rate changes, energy prices, and consumption levels. Collections from local, state, and federal agencies are primarily driven by grant and reimbursement funding available from these agencies. As a result, these revenues experience no significant net gain or loss during economic expansions or slowdowns. All revenue projections are based upon a careful examination of the collection history and patterns related to seasonality and the economic environment the city is most likely to encounter in the future.
J-17
$$50,000 $100,000 $150,000 $200,000 $250,000 $300,000 $350,000 FY24 FY25 FY26 FY27 FY28 FY29 FY30 FY31 FY32 FY33 $ (in htousands)
Expenditures
Revenues
A discussion of both the national and local economic outlooks used to develop the revenue estimates for the fiscal year 2023-24 forecast is included below. To create the revenue forecasts, the city reviewed national, state, and regional economic forecasts from multiple sources, including the Congressional Budget Office, California’s Legislative Analyst’s Office (LAO), and the Center for Continuing Study of the California Economic (CCSCE). The city also relies on third-party consultants to provide revenue estimates in their respective field of expertise. For sales tax, the city contracts with Avenu.
The city’s Consumer Price Index (CPI) forecasts are derived from the UCLA Anderson Forecast for the Nation and California.
National Economic Outlook
Real gross domestic product (GDP) increased at an annual rate of 1.3% in the first quarter of 2023, following an increase of 2.6% in the fourth quarter of 2022. This reflects increases in consumer spending, exports, federal government spending, state and local government spending, and nonresidential fixed investment that were partly offset by decreases in private inventory investment and residential fixed investment. Compared to the fourth quarter of 2022, the deceleration in real GDP in the first quarter primarily reflected a downturn in private inventory investment and a slowdown in nonresidential fixed investment. These movements were partly offset by an acceleration in consumer spending, an upturn in exports and a smaller decrease in residential fixed investment.
Economic trends have been decelerating along with tighter financial conditions and restrictive monetary policy. Recent data suggests positive but below-trend growth this year. Although the pace of job growth is moderating, labor markets remain tight, and the U.S. consumer has demonstrated resiliency.
At the end of March 2023, the 2-year Treasury yield was 169 basis point higher, and the 10-year Treasury yield was about 113 basis point higher, year-over-year. The inversion between the 2-year and 10-year Treasury yield narrowed to -56 basis points over the previous month-end. The average historical spread since 2003 is about +130 basis points. The inversion of the yield curve indicates that the probability of recession is increasing.
Carlsbad Economic Outlook
As of 2022, Carlsbad had the second largest gross regional product (GRP) in San Diego County at nearly $15.8 billion, only trailing the City of San Diego. In 2019, Carlsbad’s economy grew by $800 million to nearly $13.6 billion. In 2020, as a result of the pandemic, the city’s GRP remained flat. In 2021, its economy grew by approximately $1 billion, to nearly $14.6 billion. From 2021 to 2022, Carlsbad’s GRP grew by $10.7 billion. This growth was seen across almost all industry categories, and was led by manufacturing, wholesale trade, hospitality and professional, scientific, and technical services.
Unemployment has continued to steadily improve since an initial spike to 13.8% at the onset of the COVID-19 pandemic. The March 2023 unemployment rate of 3.5% in Carlsbad only lags pre-pandemic unemployment levels by 0.6 percentage points. The unemployment rate for the County of San Diego was 3.7% in March 2023 and the State of California was 4.8%. Currently, many employers are citing difficulty in finding and retaining workers. Macro-trends in the tech industry have been pushing unemployment up nationally, but the labor market is still considered to be very tight.
There were 12,258 unique job postings in Carlsbad between January and March representing a decrease of about 1,1000 from the previous quarter and the third consecutive quarterly decrease. The median advertised salary for these postings was $51,100, which is on average $5,000 more than jobs posted in the previous quarter, an indicator of wage inflation. Of jobs posted, 70% indicated an education requirement of high school/GED or no required listed. 65% of posting indicated no experience was required, indicating that entrylevel positions are difficult to fill and retain.
J-18
Carlsbad has established itself as having the right workforce to fuel innovation in tech and life sciences fields. Carlsbad businesses can access talent from San Diego County, Orange County, and even southwest Riverside County. More than 60% of working-age residents hold a bachelor’s degree, with nearly 25% attaining an advanced degree. Outside of some communities in central San Diego, Carlsbad has the heaviest concentration of households with degrees in science, technology, engineering, and mathematics (STEM degrees). This local talent mix is among the leading reasons that firms choose Carlsbad.
Commercial vacancy rates remain relatively steady across all categories. The industrial vacancy rate ended the quarter at 3.6%. The office vacancy rate is currently 12.6%, compared to 15.3% pre-pandemic and retail vacancy rates were 5.8%.
With 42 hotels in Carlsbad, tourism is a major industry in terms of employment and economic impact. It is also a major contributor to city revenue, through transient occupancy and sales tax generation. Occupancy levels averaged 65.3% in the third quarter of fiscal year 2022-23 which exceeded the same quarter in the previous fiscal year (63.3%). The impacts of inflation and a potential recession could hamper tourism globally, but Carlsbad is well-positioned as a destination that could see strong tourism even through a recession. Carlsbad’s average daily room rate (ADR) continues to exceed historic norms. ADR averaged $195.63 as of March 2023, compared to $179.98 over the same period last year. While disposable income, personal savings, pent-up demand, and inflation have boosted revenue generation for the city, as inflationary levels linger, the economic outlook for tourism remains moderately conservative.
Median household income in Carlsbad continues to exceed county income levels. The median income for a household in Carlsbad in 2021 was $124,669, which was $33,666 higher than the county median income. The continued rise in interest rates has impacted property values in Carlsbad. The median home price fell $98,000 over the previous quarter. Median home prices rose consistently in Carlsbad between March 2019 and July 2022 and have since been falling. The current median home price is $1,338,506, which is roughly equivalent to the median home price in December 2021.
There was a total of 2,940 business licenses issued in the third quarter of fiscal year 2022-23, including 1,165 non-residential, 817 residential, and 958 outside-the-city licenses. This represents the strongest quarter for business licenses issued since the pandemic. The number of licenses issued does not reflect the number of businesses in Carlsbad as a business may carry multiple licenses, short-term vacation rentals are required to get a license, and businesses outside of Carlsbad that do business in the city or with the city are required to get a license. It is estimated that there are approximately 6,747 businesses in Carlsbad.
Between October and December of 2022, residential building permits increased while commercial building permits continued to slow. The number of residential permits issued was 1,349 and the number of commercial permits issued was 83. The number of residential building permits issued has been generally increasing over the past three years. While permit activity is improving year-over-year, residential builders continue to cite labor shortages and increased building costs as challenges to new housing starts.
General Fund Revenues
The city’s top three revenue sources continue to be property tax, sales tax, and transient occupancy tax. Given the level of inflation coupled with lingering pent-up demand, personal savings, and disposable income, the city expects revenues to be slightly above the historic highs estimated in fiscal year 2022-23.
As shown in the chart below, General Fund revenues are expected to be $212.0 million in fiscal year 2023-24 and increase through the forecast. Sales tax revenues are conservatively projected to decrease from the record highs in fiscal year 2022-23. Property tax revenues are expected to increase moderately, and transient
J-19
occupancy tax revenues are projected to increase conservatively from the record highs in fiscal year 2022-23. Other revenue sources consider assumptions ranging from no growth to conservative growth.
General Fund revenue performance, particularly in the three main categories discussed above, has experienced tremendous recovery and growth following the pandemic in March 2020. Shelter-in -place mandates, travel restrictions, and federal stimulus have had significant impacts on the economy. Resulting in pent-up demand, increased personal savings and disposable income levels, consumer demand has remained resilient over the last year given the high spike in inflation. With the Fed’s efforts to combat inflationary increases by increasing interest rate targets, currently at 5%-5.25%, we have seen inflation decrease. This is one indication that consumer demand may be diminishing which, among other factors, warrants concern about the economy moving forward and continues to drive the need for conservative assumptions for economically sensitive revenue sources like sales and transient occupancy taxes.
The National Bureau of Economic Research (NBER), an American private nonprofit research organization, defines the beginning and ending dates of recessions. The NBER defines a recession as “a significant decline in economic activity spread across the economy, lasting more than two quarters which is 6 months, normally visible in real gross domestic product (GDP), real income, employment, industrial production, and wholesale retail sales.” Since World War II, recessions have lasted an average of 11.1 months and have occurred, on average, about every 58.4 months (4.8 years).
10-Year General Fund Revenue Forecast
J-20
$212,012 $222,194 $231,574 $240,814 $250,071 $$50,000 $100,000 $150,000 $200,000 $250,000 $300,000 2023-24 2024-25 2025-26 2026-27 2027-28 2028-29 2029-30 2030-31 2031-32 2032-33 $ (in thousands)
5-Year General Fund Revenue Forecast (in thousands)
Sales Tax
Sales tax is one of the city’s largest revenues sources. Sales taxes are collected at the point-ofsale and remitted to the California Department of Tax and Fee Administration (CDTFA), formerly the Board of Equalization. The CDTFA allocates tax revenue owed to the city in monthly payments.
Sales tax revenues were adversely impacted in fiscal year 2019-20 with the onset of the pandemic. The restrictions resulting from the COVID-19 pandemic have led to increases in segments like auto sales, construction, drug store sales, chemical product, food markets and recreational products, while others like restaurants and general retail took a major hit. The city has also been benefitting from sales tax revenues on internet sales generated as a result of the Wayfair or AB147 law that went into effect in October 2019.
Until fiscal year 2019-20, sales tax revenues had improved markedly, peaking in fiscal year 2018-19 at $40.8 million. The onset of the pandemic in March 2020 resulted in swift reductions in sales tax revenues and the city ended the year with $38 million in sales tax revenues. During fiscal year 2020-21, impacts of COVID-19 on sales tax generally correlated with shelter-in-place mandates and as restrictions were lifted, recovery was realized as fiscal year 2020-21 ended with $44 million in sales tax revenues. Fiscal year 2021-22 experienced the most accelerated recovery and ended the year at $51.2 million in sales tax revenues, a historic high for the city. The easing of restrictions and the presence of pent-up demand drove much of this recovery. Fiscal year 2022-23 began with much uncertainty surrounding market and economic conditions like inflation and impacts to disposable income. However, consumer demand remained relatively resilient and sales tax revenues are estimated to end the year at approximately $51.4 million. Looking ahead to fiscal year 2023-24, much uncertainty remains surrounding inflation and diminishing pent-up demand, personal savings, disposable income and recessionary risk. As a result, a conservative estimate of $51.1 million is budgeted for fiscal year 2023-24 which represents a decrease of $0.3 million, or 1%, over fiscal year 2022-23 estimations. With high levels inflation and pent-up demand likely to decrease, conservative estimates have been applied for sales tax in the out-years of the forecasted period.
The city’s sales tax base is heavily weighted in the transportation (comprised heavily of new auto sales) and general retail sectors, both of which account for over half of taxable sales in Carlsbad. New auto sales are highly elastic in comparison to economic trends, and tax revenues from new auto sales fell precipitously during the recession, from $6.7 million in 2007 to $4.4 million in 2009. Since that dip, auto sales tax revenues hit a high of
J-21
$$10,000 $20,000 $30,000 $40,000 $50,000 $60,000 FY 22-23 FY 23-24 FY 24-25 FY 25-26 FY 26-27 FY 27-28 $ (in thousands)
Estimated ProjectedProjectedProjectedProjectedProjected Revenue Category 2022-232023-242024-252025-262026-272027-28 Sales Tax 51,379 $ 51,065 $ 52,686 $ 53,752 $ 54,681 $ 55,476 $ Property Tax 81,508 84,247 86,956 89,638 92,293 94,923 Transient Occupancy Tax 32,500 32,861 33,218 33,572 33,922 34,268 Franchise Tax 6,971 7,085 7,198 7,312 7,426 7,540 Business License Tax 6,242 6,436 6,682 6,899 7,123 7,355 Development Related 5,074 4,178 4,212 4,237 4,213 4,178 Interdepartmental Charges 5,375 5,746 5,890 6,037 6,188 6,343 Income from Investments and Property 5,998 5,948 5,978 6,008 6,038 6,068 Ambulance Fee 4,430 6,338 6,121 6,274 6,431 6,592 Transfer Tax 1,570 1,625 1,687 1,742 1,799 1,857 Intergovernmental 1,174 1,011 1,016 1,021 1,026 1,031 Other Revenues 5,594 5,474 5,586 5,702 5,822 5,944 Total 207,816 $ 212,012 $ 217,231 $ 222,194 $ 226,961 $ 231,574 $
5-Year Sales Tax Forecast
$13.4 million for the four quarters ended December 31, 2022. Following the accelerated recovery from the pandemic, sales tax revenues across nearly all industry groups have continued to increase as a result of the rise in inflation. As of December 31, 2022, and compared to the previous calendar year, general retail sales tax increased $1 million, food products sales tax increased $1.5 million and business-to-business increased $900,000. While the recent experience has been positive, as inflationary levels continued to sustain and as personal savings, disposable income and pent-up demand diminishes, the future outlook remains conservative.
Revenues received under Proposition 72, a 0.5 cent increase in California sales tax for the funding of local public safety services, is included in sales tax revenues.
Sales taxes are expected to increase over the next 10 years by annual average rate of 1.4%.
Property Tax
Property tax is the largest source of General Fund revenues, is expected to grow by $2.7 million or 3% over the fiscal year 2022-23 estimated amount. While the residential real estate market in Carlsbad has seen significant increases in values, commercial property assessed values are still expected to remain more flat. Since the beginning of calendar year 2023, the median home price has fallen, representing a slight decrease in demand with the significant rise in interest rates. Proposition 8 allows owners to have their property temporarily revalued if market value is lower than the factored base year value, posing a risk that property values could temporarily decrease. Until interest rates sustain or decline, prices are not anticipated to increase significantly on an annual basis.
Assessed values on the residential real estate are expected to grow modestly, capped by California’s Proposition 13. Proposition 13, adopted in 1978, limits the annual increase in assessed values for property. Under this proposition, assessed values (and the related property tax) can grow by no more than 2% per year. The value upon which the tax is based is only increased to the full market value upon the sale of a property. The maximum increase of assessed values, when not sold, is by the change in California’s Consumer Price Index, which was 1.036% for 2021-22 – below the 2% cap for the first time since 2016-17. Residential activity has been driven by low interest rates on mortgages, pent up demand that built during the shutdown and an increase in the ability to work remotely. With the rise in interest rates over the last year, that has shifted swiftly. The median price of a single family residence in Carlsbad, based on resale data from Zillow, is $1.3 million, down 5% year over year as of March 2023. Estimates for the upcoming 2023-24 assessment year provided by the County of San Diego’s Assessor’s Office project moderate growth; however, the city’s forecast assumes a more conservative outlook after taking into account current economic conditions and the related risks posed upon the housing market. Sustained levels of high inflation and the Federal Reserve’s continued interest rates hikes are likely to impact property values as well as the volume of transactions.
Changes in property tax revenues lag behind changes in the housing market, as the tax revenue for the upcoming fiscal year is based on assessed values from January 2023. Thus, the taxes to be received for fiscal year 2023-24 are based on assessed values as of January 1, 2023.
Property taxes tend to grow slowly unless there is a significant amount of development-related activity. In past decades, the city has seen robust growth in property tax revenue due to new development, high turnover of existing homes, and double-digit growth in housing prices. However, as the city approaches buildout,
J-22
$$10,000 $20,000 $30,000 $40,000 $50,000 $60,000 $70,000 $80,000 $90,000 $100,000 FY 22-23 FY 23-24 FY 24-25 FY 25-26 FY 26-27 FY 27-28 $ (inthousands)
5-Year Property Tax Forecast
development has slowed. In addition to recent interest rate increases, slower development combined with minimal commercial property transactions and tax reform has caused a slowing in property tax growth in the city.
Property taxes are expected to increase over the next 10 years by annual average rate of 2.8%.
Transient Occupancy Tax
5-Year Transient Occupancy Tax Forecast
Transient Occupancy Tax is the third highest revenue source for the General Fund also known as TOT or hotel tax. TOT was the revenue category most adversely impacted by COVID-19. From historic highs of $26 million in fiscal year 2018-19, year-over-year decreases of 27% and 16% were experienced. As of last year, TOT was expected to increase approximately 47%, marking the beginning of an anticipated 3-year recovery. However, this recovery was accelerated with the easing of restrictions and pent-up demand which resulted in TOT revenues reaching new historic highs and ending fiscal year 2021-22 at $32.4 million. Anticipated rising inflation was expected to adversely impact travel and tourism levels in fiscal year 2022-23 However, the rise in average daily rates did not appear to influence occupancy levels and as a result, it is estimated that fiscal year 2022-23 will end with another historic high of $32.5 million. While group business travel still has yet to fully return to pre-pandemic levels, continued uncertainty around current inflation levels and diminishing pent up demand result in conservative estimates applied to the forecast.
According to a report from Tourism Economics, San Diego County tourism will see healthy growth in visitation demand of around 10% in calendar year 2023. The continued growth is driven by personal savings levels that accumulated during the pandemic coupled with the perception shift of tourism and travel becoming more of a necessity than a luxury as it was prior to the pandemic. The City of Carlsbad currently has approximately 4,776 hotel rooms and 343 registered vacation rentals.
Transient occupancy taxes are expected to increase over the next 10 years by annual average rate of 1.1%.
Franchise Tax
5-Year Franchise Tax Forecast
The city currently has franchise agreements for cable TV service, solid waste services, cell sites, fiber optic antenna systems and gas and electric services. The solid waste franchise experienced minor revenue increases that mirror growth in population and changes in rate structures. Cable TV franchise revenue is expected to remain relatively consistent from $1.39 million in the previous fiscal year to $1.41 million in fiscal year 2023-24. This revenue source will most likely remain stable or decline in future years as more subscribers cut cable services and move to online streaming services.
In April 2021, a new agreement was approved with Republic Services of San Diego. The city receives 7.5% of revenues collected as well as an annual payment of $0.8 million in support of AB 939 and $1.3 million storm water fee. The increase in fiscal year 2023-24 is relatively modest compared to the increase experienced in the
J-23
$$5,000 $10,000 $15,000 $20,000 $25,000 $30,000 $35,000 $40,000 FY 22-23 FY 23-24 FY 24-25 FY 25-26 FY 26-27 FY 27-28 $ (in thousands)
$$1,000 $2,000 $3,000 $4,000 $5,000 $6,000 $7,000 $8,000 FY 22-23 FY 23-24 FY 24-25 FY 25-26 FY 26-27 FY 27-28 $ (in thousands)
prior year that was driven by the $0.8 million payment to assist with AB 939. Increases in the forecast are driven by estimated population growth which drives consumption.
San Diego Gas & Electric pays franchise taxes for the use of the public land over which they transport gas and electricity. The city also receives an “in-lieu” franchise tax based on the value of gas and electricity transported on SDG&E lines but purchased from another source. The “in-lieu” tax captures the franchise taxes on gas and electricity that is transported using public lands, which would not otherwise be included in the calculations for franchise taxes, due to deregulation of the power industry. This revenue source experienced a significant increase in fiscal year 2022-23 of $919,000 due to price increases but is expected to remain relatively flat out over the next several years.
Franchise taxes are expected to increase over the next 10 years by an annual average rate of 1.5%.
Business License Tax
Business licenses taxes are closely tied to the health of the local economy and are projected to increase to $6.4 million in fiscal year 2023-24, a growth of $0.2 million, or 3%, when compared to last year’s adopted budget. This is somewhat in line with projected sales tax revenue increase as businesses either pay taxes based on the amount of their gross receipts or based on set fees. There are currently about 9,514 licensed businesses in the City of Carlsbad, 77 less than in the prior year with 6,375 of them located in the city. Over the next 10 years, business license tax revenues are forecasted to increase annually, on average, by approximately 3.3%.
Development-Related
Development-related revenues are derived from fees for planning, engineering and building permits, and fees paid by developers to cover the cost of reviewing and monitoring development activities, such as plan checks and inspections. These revenues are difficult to predict, as many of the planning and engineering activities occur months or years before any actual development.
5-Year Development-Related Forecast
During fiscal year 2009-10, development-related revenues began to turn around from historic lows experienced in fiscal year 2008-09. Since then, developmentrelated revenues have fluctuated in line with increases and decreases in residential, commercial and industrial development. In fiscal year 2023-24, the city expects a 21% decrease in development related revenues, to approximately $3.3 million, following higher than anticipated development activity occurring in fiscal year 2022-23. The projected decrease in development-related revenues is tied to the volume and type of development projected to be permitted, multi-family versus single-family, and a drop in the revenues derived from building fees which occur in the early stages of development.
It is difficult to forecast development-related revenues as they fluctuate significantly from one year to the next. The city works with consultants to identify and estimate future development based on capacity. While development-related revenues have been trending downward based on capacity, the forecast attempts to normalize highs and lows experienced by applying conservative to moderate historical trendline assumptions.
J-24
$$1,000 $2,000 $3,000 $4,000 $5,000 $6,000 $7,000 $8,000 FY 22-23 FY 23-24 FY 24-25 FY 25-26 FY 26-27 FY 27-28 $ (in thousands)
$$1,000 $2,000 $3,000 $4,000 $5,000 $6,000 FY 22-23 FY 23-24 FY 24-25 FY 25-26 FY 26-27 FY 27-28 $ (in thousands)
5-Year Business License Tax Forecast
Over the next 10 years, development-related revenues are expected in increase approximately 1.2% annually on average.
Interdepartmental Charges
Interdepartmental charges are generated through engineering services charged to capital projects, reimbursed work from other funds and miscellaneous interdepartmental expenses charged to funds outside the General Fund for services performed by departments within the General Fund. Miscellaneous interdepartmental charges correlate with consumer price index (CPI) and are expected to increase annually and onaverage by 2.9%.
Income from Investments and Property
This category includes interest earnings as well as rental income from city-owned land and facilities. The city is expected to earn about $3.2 million in interest on its General Fund investments for fiscal year 2023-24, and another $2.7 million in rental and lease income. The yield on the city’s portfolio is forecasted to average 1.5% and cash balances are expected to remain flat as increases in receipts are projected to be offset by increases in expenditures as the City Council’s goals are operationalized.
Ambulance Fees
The city receives ambulance fee revenues based on gross revenue generated by the ambulance transport service provider. These revenues are estimated to increase $3.3 million over last year’s adopted budget, from $3.9 million to $6.3 million. This increase is due to the Fire Department’s addition of two medical transports. The increase is also driven by the Ground Emergency Medical Transportation Certified Public Expenditure program, which helps cover uncompensated costs for Medi-Cal fee-for-service transports. Lastly, the Fire Department recently completed an ambulance fee study and is proposing to increase the fees to better align cost recovery levels in comparison with jurisdictions in the region. The additional revenue will amount to approximately $2 million annually. Over the next 10 years, ambulance fees are anticipated to increase over the forecast period by 2.5% annually on average.
J-25
$$1,000 $2,000 $3,000 $4,000 $5,000 $6,000 $7,000 FY 22-23 FY 23-24 FY 24-25 FY 25-26 FY 26-27 FY 27-28 $ (in thousands)
$$1,000 $2,000 $3,000 $4,000 $5,000 $6,000 $7,000 FY 22-23 FY 23-24 FY 24-25 FY 25-26 FY 26-27 FY 27-28 $ (in thousands) 5-Year
Property
$$1,000 $2,000 $3,000 $4,000 $5,000 $6,000 $7,000 FY 22-23 FY 23-24 FY 24-25 FY 25-26 FY 26-27 FY 27-28 $ (in thousands)
5-year Interdepartmental Charges Forecast
Income from Investments and
Forecast
5-Year Ambulance Fees Forecast
Transfer Taxes
Transfer taxes are those taxes paid to the county upon the transfer of interests in real estate. The tax is $1.10 per $1,000 of property value, split equally between the county and the city. Carlsbad expects to receive approximately $1.6 million in transfer taxes for fiscal year 2023-24, which is a 3% increase from fiscal year 2022-23 adopted budget and relatively consistent with current year estimates. The residential real estate market remains strong; however, this will likely be influenced by rising and sustained interest rates. Although housing prices in Carlsbad have dropped in 2023, buyer-demand remains high and inventories remain low. Over the forecasted period, transfer taxes are expected to annually increase on average by 3.3% in alignment with housing industry projections.
Intergovernmental Revenues
These revenues represent funds received from other governmental entities. In recent years, this revenue category has experienced a great deal of activity with the American Rescue Plan Act of 2021 in which the city received $12.6 million over a two-year span. Over the forecasted period, intergovernmental revenues are anticipated to remain flat.
Other Revenues
All other revenues include recreation fees, other licenses and fees, fines and forfeitures, transfers in, and other charges and fees. Over the forecasted period, these revenues are anticipated to increase conservatively by 0.5% annually, on average.
General Fund Expenditures
Each year, the city updates the budget by considering historical, present, and future costs and trends. In recent years, the city has added new rigor to the budget process including the following measures and strategies:
• Automatic consumer price index (CPI) increases were no longer added to base budgets. Instead, budget requests are required to substantiate the specific increase each year.
• The process for carrying forward appropriations and encumbrances was formalized whereby requests exceeding $100,000 require City Council approval.
• The process for requesting new staff was also enhanced whereby new requests must meet one of the following criteria:
o Needed to comply with legal and regulatory requirements
o Address a critical public safety need
o Meet City Council priorities or goals
• In fiscal year 2022-23, departments were directed to identify budgetary savings which resulted in a decrease in General Fund maintenance and operation expenditures of approximately 1.8% over the previous year’s adopted budget.
J-26
$$200 $400 $600 $800 $1,000 $1,200 $1,400 $1,600 $1,800 $2,000 FY 22-23 FY 23-24 FY 24-25 FY 25-26 FY 26-27 FY 27-28 $ (in thousands) 5-Year Transfer Taxes Forecast $$200 $400 $600 $800 $1,000 $1,200 $1,400 FY 22-23 FY 23-24 FY 24-25 FY 25-26 FY 26-27 FY 27-28 $ (in thousands) 5-Year Intergovernmental Revenues Forecast $$1,000 $2,000 $3,000 $4,000 $5,000 $6,000 $7,000 FY 22-23 FY 23-24 FY 24-25 FY 25-26 FY 26-27 FY 27-28 $ (in thousands) 5-Year Other Revenues Forecast
As shown in the chart below, General Fund expenditures are expected to increase from $216.8 million in fiscal year 2023-24 to $298.5 million over the 10-year forecast period, representing an increase of $82 million or 38%.
10-Year General Fund Expenditure Forecast
5-Year General Fund Expenditure Forecast (in thousands)
Personnel Expenditures
Salaries
Full-time salaries are projected to grow at a rate of 4.2% per year, based on negotiated and step increases. Part-time salaries are forecasted to grow at a rate of 2.0% as they generally grow slower than full-time salaries.
In fiscal year 2022-23 the city’ s budget began accounting for vacancy savings. Vacancy savings represents the amounts of savings achieved through attrition. The forecast assumes $2 million in vacancy savings on an annual basis.
Health Benefits
In fiscal year 2023-24 health benefits account for about 8% of all personnel costs in the General Fund. The city pays employees a fixed amount for health and dental insurance costs instead of covering a percentage of premiums. Health benefit costs are forecasted to increase annually on average by approximately 4.8%.
J-27
$216,769 $223,273 $242,261 $264,132 $286,585 $$50,000 $100,000 $150,000 $200,000 $250,000 $300,000 $350,000 $ (in thousands)
Estimated ProjectedProjectedProjectedProjectedProjected Expenditure Category 2022-232023-242024-252025-262026-272027-28 Salaries 81,932 $ 86,601 $ 89,663 $ 93,124 $ 96,879 $ 100,795 $ Benefits 42,127 43,277 46,621 50,070 53,337 56,471 Maintenance and Operations 63,293 64,361 61,422 63,434 65,512 67,657 Capital Outlay - - 803 829 856 884 Council Contingency 500 500 500 500 500 500 Transfers 24,190 22,031 14,982 15,316 15,639 15,953 Total 212,042$ 216,769$ 213, 990$ 223,273$ 232,723$ 242,261$
Retirement
Rising retirement costs are driving the increase in employee benefits. Carlsbad provides retirement benefits for its employees through CalPERS. Poor investment returns during the Great Recession significantly decreased the plan’s assets. In addition, enhanced benefits and actuarial assumption changes due to increased life expectancies increased the plan’s liabilities. As a result, the city’s pension costs have increased significantly and are one of the city’s largest financial obligations.
In December 2016, the CalPERS Board of Administration lowered the discount rate from 7.5% to 7.0% with a three-year phase-in beginning in fiscal year 2018-19 to improve the financial stability of the pension system. This resulted in significant increases in retirement costs. In fiscal year 2021-22, the CalPERS Board lowered the discount rate from 7.0% to 6.8% because the fiscal year 2020-21 investment gain of 21.3% triggered the Funding Risk Mitigation Policy.
With CalPERS achieving an investment return of 21.3% in fiscal year 2020-21, the city’s required contributions over the next 5 years are projected to decrease. However, in fiscal year 2021-22, CalPERS experienced an investment loss of -6.1% which nearly negates the positive performance from the previous year. The city expects its required contributions to increase significantly once the investment loss from fiscal year 2021-22 is factored into the projections.
The city’s retirement rates are based on a blend of all three miscellaneous tiers (2.7% @ 55, 2% @ 60, and 2% @ 62). Although employees pay a different rate depending on their respective tier, the city’s costs are the same for all three tiers. The table below shows the current breakdown of city employees amongst the three retirement tiers the majority of employees in the city are currently covered under Tier 3. Savings from the lower-cost Tier 2 and Tier 3 plans are not expected to be substantial for several years.
J-28
FY 2023-24FY 2024-25FY 2025-26FY 2026-27FY 2027-28FY 2028-29 Projected Payroll 46,895,969 $ 48,209,057 $ 49,558,910 $ 50,946,559 $ 52,373,063 $ 53,839,509 $ Normal Cost (%) 12.5% 12.2% 11.9% 11.6% 11.4% 11.1% Normal Cost ($) 5,866,686 $ 5,881,505 $ 5,897,510 $ 5,909,801 $ 5,970,529 $ 5,976,185 $ UAL Payment 6,360,246 $ 6,000,000 $ 5,399,000 $ 4,882,000 $ 4,099,000 $ 4,319,000 $ Total Contribution 12,226,932 $ 11,881,505 $ 11,296,510 $ 10,791,801 $ 10,069,529 $ 10,295,185 $ Total Contribution (%) 26.1% 24.6% 22.8% 21.2% 19.2% 19.1% FY 2023-24FY 2024-25FY 2025-26FY 2026-27FY 2027-28FY 2028-29 Projected Payroll 28,065,401 $ 28,851,232 $ 29,659,067 $ 30,489,521 $ 31,343,227 $ 32,220,838 $ Normal Cost (%) 21.6% 21.3% 21.0% 20.6% 20.3% 20.0% Normal Cost ($) 6,048,094 $ 6,145,312 $ 6,228,404 $ 6,280,841 $ 6,362,675 $ 6,444,168 $ UAL Payment 5,935,778 $ 5,712,000 $ 5,779,000 $ 5,436,000 $ 4,886,000 $ 5,066,000 $ Total Contribution 11,983,872 $ 11,857,312 $ 12,007,404 $ 11,716,841 $ 11,248,675 $ 11,510,168 $ Total Contribution (%) 42.7% 41.1% 40.5% 38.4% 35.9% 35.7% Projected CalPERS Contributions (Safety) Projected CalPERS Contributions (Miscellaneous) Misc. Classic 205 24.7% 17,670,051 $ Misc. Tier 2 56 20.8% 6,036,807 $ Misc. PEPRA 267 17.0% 19,460,570 $ CalPERS Plan Breakdown by Tier (Miscellaneous) Tier Number of Employees Total Normal Cost FY 2023-24 Payroll on 6/30/2021
CalPERS Plan Breakdown by Tier (Safety)
A retiree’s highest monthly pension benefits are calculated by multiplying:
• Service credit: the number of years of CalPERS service.
• Benefit Factor: percentage of pay based on age.
• Compensation Basis: the highest monthly average salary for a defined period.
Other Benefits
The forecast assumes health insurance, dental insurance, and vision insurance increase by CPI.
Maintenance and Operations
General Fund departments budget for costs to support the ongoing maintenance and operations of the city. These costs comprise materials and supplies, professional services, and one-time special projects. One-time costs are budgeted for in year one of the forecasted period so naturally the increase over the forecasted period remains relatively low. On average, maintenance and operations costs are expected to increase approximately 1% annually.
Capital Outlay
Capital outlay costs are typically not budgeted for in the city’s General Fund; however, from time to time, departments may experience the need to purchase an item that is classified as a capital asset. Because the annual capital outlay amounts are relatively minimal, they have not been included in the city’s General Fund forecast.
Council Contingency
The city maintains a Council Contingency budget at a level of $500,000.
Transfers
The General Fund is responsible for transferring funds for the following purposes:
• Lighting and Landscaping District #1 (LLD #1) – the city established LLD #1 in 1986 and during its formation, no annual inflator was applied. As a result, the assessment paid by property owners in the district have become insufficient to cover the costs of lighting and landscaping. As a result, the General Fund is responsible for making up the difference. The transfer amount is expected to increase 7% over the next five years at an annual average rate of 1.5%.
• Future Capital Funding – the General Fund is responsible for a significant portion of the city’s capital project funding. On an annual basis, the General Fund transfers an equivalent of 6% of estimated General Fund revenues to the Strategic Digital Transformation Investment Program, the Infrastructure Replacement Fund, and the General Capital Construction Fund. The fiscal year 2023-24 preliminary budget projected an initial surplus of approximately $8 million and prudently determined a significant portion of this projected surplus be transferred to the General Capital Construction Fund in order to fund future capital projects. This one-time transfer amounts to $7.4 million. These transfer amounts increase throughout the forecast based on increases in forecasted General Fund revenues.
J-29
Fire Classic 41 33.6% 5,461,887 $ Fire Tier 2 17 29.8% 1,922,198 $ Fire PEPRA 29 25.3% 2,840,337 $ Police Classic 42 38.3% 6,313,939 $ Police Tier 2 16 35.0% 1,928,406 $ Police PEPRA 67 29.5% 7,367,248 $
Tier Number of Employees Total Normal Cost FY 2023-24 Payroll on 6/30/2021
CalPERS
The city provides a defined benefit pension to its employees through CalPERS. Retirement benefits are calculated using a formula based on an employee’s age, earnings, and years of service. The retirement benefits are funded by:
• Investment earnings (60%)
• Employer contributions (29%)
• Employee contributions (11%)
Each year, CalPERS determines an employer’s contributions based on actual investment returns and actuarial assumptions including:
• Expected investment returns (discount rates)
• Inflation rates
• Salaries
• Retirement ages
• Life expectancies
Contributions to fund the pension plan are comprised of two components:
• The normal cost (the cost of the benefits earned in a respective year).
• The amortization of the unfunded accrued liability (UAL).
CalPERS Discount Rate
Defined benefit plans are highly sensitive to the discount rate assumption. The discount rate is the expected rate of return of the plan’s assets over the long term. The discount rate will depend on the plan’s size, asset allocation, time horizon, and other considerations.
From the city’s perspective, the discount rate is important as it is used to determine the city’s annual contributions to the plan, the plan’s unfunded liability, and the plan’s funded status. In other words, the discount rate is used to determine whether a plan has enough assets to meet its future obligations. The discount rate must be realistic to allow the city to foresee funding issues that may impact future operating budgets and future generations of retirees and plan members. If the discount rate assumption is too high and investments earn less than expected, a funding shortfall may result, requiring the city or CalPERS members to make greater contributions than expected.
CalPERS Investment Earnings
Since investment earnings fund nearly 60% of retirement benefits, the city’s pension plan is sensitive to the investment returns of CalPERS. Investment returns affect how much of the retirement benefits can be funded by investment earnings rather than contributions. If investment returns are lower than the discount rate, contributions must increase to make up the difference. As a result, pension plans need accurate return assumptions to ensure fiscal sustainability.
Currently CalPERS assumes it will earn investment returns of 6.8% each year. As illustrated in the following chart, over the last 20 years, CalPERS has earned investment returns below the discount rate assumption approximately half of the time. Individual fiscal year investment returns have ranged between -24.0% and +21.7%. Specifically, CalPERS earned negative investment returns in 2001 and 2002 due to the dot-com crash and 2008 and 2009 due to the Great Recession.
J-30
For fiscal year 2021-22, CalPERS reported an investment loss of -6.1%, 12.7 percentage points lower than the 6.8% discount rate. The average investment return is 7% for a 5-year period, 8% for a 10-year period, and 7.5% for a 20-year period. As returns in a given year are volatile, it can be more instructive to look at returns over longer time horizons.
CalPERS Update
Funding Risk Mitigation Policy
Under the Funding Risk Mitigation Policy, the 21.3% return in fiscal year 2020-21 triggered a reduction in the discount rate from 7% to 6.8%. The Funding Risk Mitigation Policy, approved by the CalPERS Board in 2005, lowers the discount rate in years of good investment returns to reduce risk in the portfolio. The Risk Mitigation Policy will affect contributions starting in fiscal year 2023-24.
Asset Liability Management Process
In November 2021, CalPERS completed its quadrennial Asset Liability Management (ALM) process, which reviewed investment strategies and actuarial assumptions. At the November 15-17, 2021, meetings, the CalPERS Board approved a 6.8% discount rate, selected a new asset allocation for the fund’s investment portfolio, and adopted new actuarial assumptions.
*Includes a 5% allocation to leverage.
J-31
-30.0% -25.0% -20.0% -15.0% -10.0% -5.0% 0.0% 5.0% 10.0% 15.0% 20.0% 25.0% FY03 FY04 FY05 FY06 FY07 FY08 FY09 FY10 FY11 FY12 FY13 FY14 FY15 FY16 FY17 FY18 FY19 FY20 FY21 FY22 Annual Investment Returns CalPERS Historical Investment Returns Annual Investment Return Discount Rate 1 Year -6.1% 5 Year 7.0% 10 Year 8.0% 20 Year 7.5% Time Period Total Investment Return Asset Class Global Equity 50%42% Fixed Income 28%30% Real Assets 13%15% Private Equity 8%13% Private Debt 0% 5% Liquidity 1% 0% Total 100%105% Current Allocation New Allocation
CalPERS Plan Status
As of the most recent actuarial valuation on June 30, 2021, the city’s miscellaneous pension plan had assets of $404.5 million, liabilities of $456.8 million and a funded ratio of 88.6%. The city’s safety pension plan has assets of $308.3 million, liabilities of $372.0 million and a funded ratio of 82.9%. The unfunded liability is the difference between assets and liabilities, while the funded ratio is the ratio of assets to liabilities.
Impact of CalPERS Investments Returns
CalPERS assumes it will earn investment returns of 6.8% each year. If investment returns are higher than 6.8%, the city’s contributions decrease. Conversely, if investment returns are lower than 6.8%, the city’s contributions increase.
In fiscal year 2020-21, CalPERS earned 21.3% and as a result, the city’s required pension contributions will decrease. In fiscal year 2021-22, CalPERS experienced an investment loss of -6.1% and as a result, the city’s required pension contributions will increase effective in fiscal year 2024-25.
Impact of CalPERS Discount Rate Changes
Due to lower-than-historical interest rates and economic growth, market experts project lower returns for the next several decades. The Pew Research Center forecasts a long-term investment return of 6.5% for typical pension fund portfolios.
During its Asset Management Liability Process, CalPERS considered discount rates between 6.25% and 7%. Ultimately, CalPERS approved a discount rate of 6.8%, a decrease from the previous discount rate of 7%.
The discount rate has a significant effect on the city’s CalPERS contributions. If the discount rate is reduced, the city’s CalPERS contributions will increase.
City Strategies
In recent years, unfunded liabilities, or pension debt, have caused cities in California to cut back on public services. Three cities have declared bankruptcy. Pension debt is the difference between how much money is available to pay for the pensions city employees receive when they retire, and the money needed to pay for the actual benefits. Pension debt is an estimate because it’s not possible to know exactly how well the pension fund investments will perform nor how many employees will retire, at what age they will retire and how long they will live.
J-32
June 30, 2020June 30, 2021 Present Value of Projected Benefits 493,021,289 $ 530,619,478 $ Entry Age Normal Accrued Liability 430,502,885 $ 456,814,169 $ Market Value of Assets 330,903,112 $ 404,515,911 $ Unfunded Accrued Liability 99,599,773 $ 52,298,258 $ Funded Ratio 76.9% 88.6% June 30, 2020June 30, 2021 Present Value of Projected Benefits 420,888,640 $ 458,282,303 $ Entry Age Normal Accrued Liability 343,243,950 $ 372,017,358 $ Market Value of Assets 251,416,320 $ 308,342,667 $ Unfunded Accrued Liability 91,827,630 $ 63,674,691 $ Funded Ratio 73.2% 82.9%
CalPERS Miscellaneous Plan Status
CalPERS Safety Plan Status
The City of Carlsbad has long recognized the financial uncertainty caused by the state’s pension system. That’s why Carlsbad was one of the first cities in the region to enact pension reform, pre-dating state reforms in 2013. This and other strategies have reduced the city’s pension debt considerably compared to most other cities in the state.
In 2019, the City Council adopted a Pension Funding Policy (City Council Policy Statement No. 86). This policy states that the city will strive to maintain an 80% funded status. Said another way, the goal of this policy is to keep Carlsbad’s pension debt at no more than 20%.
Since fiscal year 2016-17, the city has contributed $56.4 million to CalPERS to reduce the city’s unfunded liability and thereby achieve interest savings. These contributions were in addition to the annual required contributions set by CalPERS.
Even though CalPERS is continuing to take prudent measures to manage the pension liability for its participants, the annual costs paid by participating members will continue to increase. And, while CalPERS has outperformed its assumed rate of return on investments over the last 10-years, future economic uncertainty is likely to have a profound impact on its investment performance, which will impact the city’s annual required contributions.
J-33
J-34
RESOLUTION NO. 2023-161
A RESOLUTION OF THE CITY COUNCIL OF THE CITY OF CARLSBAD, CALIFORNIA, ADOPTING THE FINAL OPERATING BUDGET, STRATEGIC DIGITAL TRANSFORMATION INVESTMENT PROGRAM AND CAPITAL IMPROVEMENT PROGRAM FOR FISCAL YEAR 2023-24 FOR THE CITY OF CARLSBAD AND ESTABLISHING CONTROLS ON CHANGES IN APPROPRIATIONS FOR BUDGET FUNDS
WHEREAS, the City Council of the City of Carlsbad, California, has reviewed the proposed final Operating Budget, Strategic Digital Transformation Investment Program and Capital Improvement Program for fiscal year (FY) 2023-24 and has held such public hearings as are necessary prior to adoption of the final budgets.
NOW, THEREFORE, BE IT RESOLVED by the City Council of the City of Carlsbad, California, as follows:
1. That the above recitations are true and correct.
2. That certain documents now on file in the Office of the City Clerk of the City of Carlsbad, entitled "Fiscal Year 2023-24 Preliminary Operating Budget, Strategic Digital Transformation Investment Program and Capital Improvement Program" presented at the Joint Special Meeting on May 23, 2023 as Exhibit 1 to Item No. 9, as amended, if necessary, in accordance with Attachments A-A3, 8-82, C and D to this Exhibit 4 are adopted as the final Operating Budget, Strategic Digital Transformation Investment Programand Capital Improvement Program for the City of Carlsbad for FY2023-24along with the programoptions and adjustments, if any, determined by the City Council as set forth in the minutes of this Joint Special Meeting on June 13, 2023.

3. That the amounts reflected as estimated revenues for FY 2023-24 as shown in Attachments A-A2 and B are adopted as the budgeted revenuesfor FY 2023-24.
4. That the amounts as designated as the FY 2023-24 Budget request in Attachments A-A3, 8-82 and D are appropriated to the department or fund for which they are designated, and such appropriation shall not be increased except as provided in this resolution.
5. That the items and amounts as shown in Attachment E are adopted as major capital outlay items for FY 2023-24.
J-35
6. That total appropriations for each fund may only be increased or decreased by the City Council by passage of a resolution amending the budget except as provided in this resolution.
7. That thefollowing controls are placed on the useandtransfer of budget funds:
A. No expenditure of funds shall be authorized unless sufficient funds have been appropriatedby the City Councilor City Manageras describedbelow.
i. The City Manager may authorize all transfers of funds from account to account withinany department.
ii. The City Managermayauthorizetransfersoffundsbetweendepartmentswithin the same fund inanamount up to $100,000pertransfer.
iii. The City Manager mayauthorize transfersof funds from the HousingTrust Fund to the Section 8 Housing Fund program administrationto supporttheprogram's fund balance and aid in the expansion of the program if costs exceed budget related toadministration, payroll, vouchers, and related costs.
iv. The City Manager may authorize budget adjustments involving offsetting revenues and expenditures; the City Manager may authorize increases in an appropriation for a specific purpose where the appropriation is offset by unbudgeted revenue designated for the specific purpose.
v. The City Manager may authorize budget adjustments to increase the appropriation for the Workers' Compensation and Risk Management Funds' operating budgets in an amount equal to the increases in costs of claims expensesorestimated lossesand liabilities.
vi. The City Manager mayauthorizeincreasesof 15%orlessto purchasingauthority forcapitaloutlayitemsrequiringtheCityCounciltoactastheawardingauthority approved in thebudget process.
vii. The City Manager may authorize budget adjustments to increase the appropriation for earned leave accrual expenses and liabilities.
viii. The City Manager may authorize budget adjustments to increase the appropriationfor unforeseenlegal expensesand liabilities.

J-36
ix. The City Manager may authorize budget adjustments to increase the appropriation for Mutual Aid expenses in an amount equal to the increases in amounts to be reimbursed by other agencies.
x. The City Council must authorize all transfers of funds from the City Council's Contingency Account.
xi. The City Manager may delegate any of the authority given to the City Manager under this resolution.
B. The City Council must authorize any increase in the number of authorized permanent personnel positions above the level identified in Attachment C.
C. The City Manager may authorize the hiring of temporary or part-time staff as necessary within the limits imposed by the controls listed above.
8. That the legal level of budgetary control is the fund level. Budgets may not legally be exceeded at the fund level without appropriate authorization by the City Council.
9. That interest earned on grants may be appropriated during the year for the purpose for which the grant was received.
10. That all appropriations in the Capital Improvement Program remaining unexpended at June 30, 2023, are appropriated to FY 2023-24 in their respective project budgets.
11. That all appropriations in the Strategic Digital Transformation Investment Program remaining unexpended at June 30, 2023, are appropriated to FY 2023-24 in their respective project budgets.
12. That.all appropriationsin the Operating Budget remaining unexpended at June 30, 2023 related to developer deposits received for developer-funded studies not yet completed or grant awards received or expected for projects that are continuing into the next fiscal year are appropriated to FY 2023-24.
13. That all appropriationsfor outstandingencumbrancesas ofJune 30, 2023, are continued into FY 2023-24 for such contracts or obligations.
J-37
PASSED, APPROVEDAND ADOPTED at aJointSpecial Meeting of the City Council of the City of Carlsbad, theBoardofDirectorsoftheCarlsbad Municipal WaterDistrict, theBoardofDirectorsofthe CarlsbadPublic FinancingAuthority, theCommunityDevelopmentCommission,andtheCityCouncilas Successor Agency to theCarlsbadRedevelopmentAgency held on the 13th day ofJune, 2023, by the followingvote, towit:
AYES:


NAYS:
ABSTAIN:
ABSENT:
Blackburn, Bhat-Patel, Acosta, Burkholder, Luna.
None.
None.
None.
t•-
J-38
KEITHBLACKBURN, Mayor
LsHERRY
FREISINGER, City Clerk
(SEAL)
RESOLUTION NO. 1710

A RESOLUTION OF THE BOARD OF DIRECTORS OF THE CARLSBAD MUNICIPAL WATER DISTRICT OF THE CITY OF CARLSBAD, CALIFORNIA, ADOPTING THE WATER DISTRICT'S FINAL OPERATING BUDGET, STRATEGIC DIGITAL TRANSFORMATION INVESTMENT PROGRAM AND CAPITAL IMPROVEMENT PROGRAM FOR FISCAL YEAR 2023-24 AND ESTABLISHING CONTROLSON CHANGESIN APPROPRIATIONSFOR BUDGET FUNDS
WHEREAS, the Board of Directors of the Carlsbad Municipal Water District of the City of Carlsbad, California, has reviewed the proposed final Operating Budget, Strategic Digital Transformation Investment Program and Capital Improvement Program for Fiscal Year (FY) 2023-24 andhasheldsuch publichearingsasarenecessarypriortotheadoptionofthefinalbudgets.
NOW, THEREFORE, BE IT RESOLVEDbytheBoardof Directors of the CarlsbadMunicipal Water DistrictoftheCityofCarlsbad, California, asfollows:
1. Thattheaboverecitationsaretrue andcorrect.
2. ThatcertaindocumentsnowonfileintheOfficeoftheCityClerkoftheCityofCarlsbad, entitled "Fiscal Year 2023-24 Preliminary Operating Budget, Strategic Digital Transformation Investment Program and Capital Improvement Program" presented at the Joint Special Meeting on May 23, 2023 as Exhibit 1 to Item No. 9, as amended, if necessary, inaccordancewithAttachmentsAand BtothisExhibit 5 areadoptedasthe final Operating Budget, Strategic Digital Transformation Investment Program and CapitalImprovement ProgramfortheCarlsbadMunicipalWater District forFY2023-24 along with the program options and adjustments, if any, determined by the Board of Directorsassetforthinthe minutes ofthisJoint SpecialMeetingonJune 13, 2023.
3. That the amounts reflected as estimated revenues for FY 2023-24 as shown in Attachment AareadoptedasthebudgetedrevenuesforFY2023-24.
4. ThattheamountsdesignatedasFY 2023-24 BudgetsinAttachmentsA, BandtheCityof Carlsbad's estimated share of the FY 2023-24 Operating and Capital Budget of Encina WastewaterAuthorityattributabletotheCarlsbadWaterRecyclingFacilityaspresented in Attachment C to this Exhibit 5 are appropriated to the fund for which they are designated, and such appropriation shall not be increased except as provided in this resolution.
J-39
5. That total appropriations may only be increased or decreased by the Board of Directors by passage of a resolution amending thebudget except as provided in this resolution.
6. That the following controls are placed on the use and transfer of budget funds:
A. No expenditure of funds shall be authorized unless sufficient funds have been appropriated by the Board of Directors or Executive Manager as described below.
i. The Executive Manager may authorize all transfers of funds from account to account within the same fund.
ii. The Executive Manager may authorize budget adjustments involving offsetting revenues and expenditures; the Executive Manager may authorize increases in an appropriation for a specific purpose where the appropriation is offset by unbudgeted revenue designated for the specific purpose.
iii. The Executive Manager may authorize increases in purchased water appropriations in an amount equal to the same percent that water sales exceed the amount of the original revenue estimate.
iv. The Executive Manager may authorize budget adjustments to increase the appropriationfor unforeseen legal expenses and liabilities.
v. The Executive Manager may delegate the authority given to the Executive Manager under this resolution.
B. The Board of Directors must authorize any increase in the number of authorized permanent personnel positions chargeable to the water and recycled water enterprise funds above the level identified in the final Budget. The Executive Manager may authorize the hiring of temporary or part time staff chargeable to the water and recycle water enterprise funds as necessary within the limits imposed by the controls listed above.

7. That all appropriations for outstanding encumbrances asofJune 30, 2023are continued into FY 2023-24 for such contracts and obligations.
8. That interest earned on grants may be appropriated during the year for the purpose for which the grant was received.
9. That all appropriations for Capital Improvement Projects remaining unexpended at June 30, 2023, are appropriated to FY 2023-24 in their respective project budgets.
J-40
10. That all appropriations in the Strategic Digital Transformation Investment Program remaining unexpended at June 30, 2023, are appropriated to FY 2023-24 in their respective project budgets.
11. That all appropriations in the Operating Budget remaining unexpended at June 30, 2023 related to grant awards received or expected for projects that are continuing into the next fiscal year are appropriated to FY 2023-24.

PASSED, APPROVED AND ADOPTED at a Joint Special Meeting of the Board of Directors of the Carlsbad Municipal Water District, the City Council of the City of Carlsbad, the Board of Directors of the Carlsbad Public Financing Authority, the Community Development Commission, and the City Council as Successor Agency to the Carlsbad Redevelopment Agency held on the 13th day of June, 2023, by the following vote, to wit:
AYES: NAYS: ABSTAIN: ABSENT:
Blackburn, Bhat-Patel, Acosta, Burkholder, Luna. None. None. None.
KEITH BLACKBURN, President
SHERRY FREISINGER, Secretary {SEAL)
� f
J-41
RESOLUTION NO. 562
A RESOLUTION OF THE COMMUNITY DEVELOPMENT COMMISSION OF THE CITY OFCARLSBAD, CALIFORNIA,ADOPTING THEFINALOPERATINGBUDGET OF THE CARLSBAD HOUSING AUTHORITY FOR FISCAL YEAR 2023-24 AND ESTABLISHING CONTROLS ON CHANGES IN APPROPRIATIONS FOR BUDGET FUNDS
WHEREAS, the Community Development Commission of the City of Carlsbad, California (Commission), has reviewed the Operating Budget for the Carlsbad Housing Authority for fiscal year (FY) 2023-24 and has held such public hearings as are necessary prior to the adoption of the final budget.
NOW, THEREFORE, BE IT RESOLVED by the Community Development Commission of the City of Carlsbad, California, as follows:
1. That the above recitations are true and correct.
2. That certain documents now on file in the Officeof the City Clerk of the City of Carlsbad, entitled "Fiscal Year 2023-24 Preliminary Operating Budget, Strategic Digital Transformation Investment Program and Capital Improvement Program," presented at the Joint Special Meeting on May 23, 2023 as Exhibit 1 to Item No. 9, as amended, if necessary, in accordance with Attachments A of this Exhibit 6 are adopted as the final Operating Budget for the Carlsbad Housing Authority for FY 2023-24, along with the program options and adjustments, if any, determined by the Commission as set forth in the minutes of this Joint Special Meeting on June 13, 2023.
3. That all funding for planning and administrative expenses have been determined to be necessary and appropriate for implementation of the Carlsbad Housing Authority's activities in FY 2023-24.
4. That the amounts reflected as estimated revenues for FY 2023-24 as shown in Attachment A are adopted as the budgeted revenues for FY 2023-24.
5. That the amount designated as FY 2023-24 Budget request in Attachment A to this Exhibit 6 is appropriated to the fund for which it is designated, and such appropriation shall not be increased except as provided in this resolution.
6. That the following controls are placed on the use and transfer of budget funds:

J-42
A. No expenditure of funds shall be authorized unless sufficient funds have been appropriated by the Commission or Executive Director as described below.
i. The Executive Director may authorize all transfers of funds from account to account within the same fund.
ii. The Executive Director may delegate any of the authority given to the Executive Manager under this resolution.
iii. The Executive Director may authorize budget adjustments involving offsetting revenuesandexpenditures; the Executive Director may authorizeincreases in an appropriation for a specific purpose where the appropriation is offset by unbudgetedrevenue designated for the specificpurpose.
B. The Commission must authorize any increase in the number of authorized permanent personnel positions chargeable to the Carlsbad Housing Authority above the level identified in the final budget. The Executive Director may authorize the hiring of temporary or part time staff chargeable to the Carlsbad Housing Authority as necessary within the limits imposed by the controls listed above.
7. That all appropriations for any state or federal grant funds in the Operating Budget remaining unexpended at June 30, 2023, are appropriated to FY 2023-24.
8. That all outstandingencumbrances as of June 30, 2023, are continued into FY 2023-24 for such contracts and obligations.
J-43
PASSED, APPROVED AND ADOPTED at a Joint Special Meeting of the Community Development Commission, the City Council of the City of Carlsbad, the Board of Directors of the Carlsbad Municipal Water District, the Board of Directors of the Carlsbad Public Financing Authority, and the City Council as Successor Agency to the CarlsbadRedevelopment Agency held onthe 13th day of June, 2023, bythe following vote, to wit:
AYES:
NAYS:
ABSTAIN:

ABSENT:
Blackburn, Bhat-Patel, Acosta, Burkholder, Luna.
None.
None. None.
J-44
RESOLUTION NO. 2023-162
A RESOLUTION OF THE CITY COUNCIL OF THE CITY OF CARLSBAD, CALIFORNIA, ACTING AS THE SUCCESSOR AGENCY FOR THE CARLSBAD REDEVELOPMENT AGENCY, ADOPTING THE FINAL OPERATING BUDGET OF THE SUCCESSOR AGENCY AND THE ENFORCEABLE DEBT OBLIGATIONS OF THE CITY OF CARLSBAD'S REDEVELOPMENT OBLIGATION RETIREMENT FUND FOR FISCAL YEAR 2023-24 AND ESTABLISHING CONTROLS ON CHANGES IN APPROPRIATIONS FOR BUDGET FUNDS
WHEREAS, the City Council of the City of Carlsbad, California has been designated as the Successor Agency for the Carlsbad Redevelopment Agency (Successor Agency) and, as such, is responsible for the administrative responsibilities required to complete the work of the former Carlsbad Redevelopment Agency and repay all enforceable debt obligations; and
WHEREAS, the Successor Agency and the appointed Oversight Board have reviewed the proposed Operating Budget for the Successor Agency and previously approved the enforceable debt obligations to be repaid from the Redevelopment Obligation Retirement Fund for fiscal year (FY) 202324; and
WHEREAS, the Successor Agency finds that the proposed Operating Budget for the Agency and the Oversight Board approved enforceable debt obligations of the Redevelopment Obligation Retirement Fund are consistent with the Recognized Obligation Payment Schedule prepared by the Successor Agency and approved by the Oversight Board; and
WHEREAS, public hearings have been held as necessary prior to the adoption of the final operating budget.
NOW, THEREFORE, BE IT RESOLVED by the City Council of the City of Carlsbad, acting as Successor Agency for the Carlsbad Redevelopment Agency, as follows:
1. That the above recitations are true and correct.
2. That certain documents now on filein the Officeof theCity Clerk of theCity of Carlsbad, entitled "Fiscal Year 2023-24 Preliminary Operating Budget," presented at the Joint Special Meeting on May 23, 2023 as Exhibit 1 to Item No. 9, as amended, if necessary, in accordance with Attachment A to this Exhibit 8 are adopted as the final Operating Budget for the Successor Agency and the enforceable debt obligations of the City of Carlsbad's Redevelopment Obligation Retirement Fund for FY 2023-24, along with the
J-45
program options and adjustments, if any, determined by the Successor Agency as set forth in the minutes of thisJoint Special Meeting of June 13, 2023.
3. That the amounts reflected as estimated revenues for FY 2023-24 as shown in Attachment A are adopted as the budgeted revenues for FY 2023-24.
4. That the amount designated as FY 2023-24 Budget request in Attachment A to this Exhibit 8 is appropriated to the fund for which it is designated, and such appropriation shall not be increased except as provided in this resolution.
5. That the following controls are placed on the use and transfer of budget funds:
A. No expenditure of funds shall be authorized unless sufficient funds have been appropriated by the Successor Agency or City Manager, as described below.
i. The City Manager may authorize all transfers of funds from account to account within the same fund.
ii. The City Manager may delegate any authority given to the City Manager under this resolution.

iii. The City Manager may authorize budget adjustments involving offsetting revenues and expenditures; the City Manager may authorize increases in an appropriation for a specific purpose where the appropriation is offset by unbudgeted revenue designated for the specific purpose and is approved in advance by the Oversight Board.
6. That all outstanding encumbrances as of June 30, 2023, are continued into FY 2023-24 for such contracts and obligations, as approved by the Oversight Board.
J-46
PASSED, APPROVED AND ADOPTED at a Joint Special Meeting of the City Council as Successor Agency to the Carlsbad Redevelopment Agency, the City Council of the City of Carlsbad, the Board of Directors of the Carlsbad Municipal Water District, the Board of Directors of the Carlsbad Public Financing Authority and the Community Development Commission held on the 13th day of June, 2023, by the following vote, to wit:
AYES:


NAYS:
ABSTAIN:
ABSENT:
Blackburn, Bhat-Patel, Acosta, Burkholder, Luna.
None.
None.
None.
KEITH BLACKBURN, Mayor
J-47
SHERRY FREISINGER, City Clerk (SEAL)
RESOLUTION NO. 2023-163
A RESOLUTION OF THE CITY COUNCIL OF THE CITY OF CARLSBAD, CALIFORNIA, ESTABLISHING THE FISCAL YEAR 2023-24 APPROPRIATION LIMIT AS REQUIRED BY ARTICLE XIIIB OF THE CALIFORNIA STATE CONSTITUTION AND STATE LAW

WHEREAS, Article XIIIB of the California State Constitution requires that governments annually establish a limit on the appropriation of proceeds of taxes commonly known as the "Gann Limit"; and
WHEREAS, state law requires that this limit be presented to the governing body of each entity each fiscal year; and
WHEREAS, the Gann Limit is based on a combination of a population factor and an inflation factor as outlined in Attachment A; and
WHEREAS, the City Council desires at this time and deems it to be in the best public interest to adopt the annual Gann Limit for fiscal year (FY) 2023-24 as listed in Attachment A.
NOW, THEREFORE, BE IT RESOLVED by the City Council of the City of Carlsbad, California, as follows:
1. That the above recitations are true and correct.
2. That the City Council of the City of Carlsbad, California, establishes and adopts the FY 2023-24 appropriation limit of $607,584,374 as computed in Attachment A.
J-48
PASSED, APPROVED AND ADOPTED at a Joint Special Meeting of the City Council of the City of Carlsbad, the Board of Directors of the Carlsbad Municipal Water District, the Board of Directors of the Carlsbad Public Financing Authority, the Community Development Commission, and the City Council as Successor Agency to the Carlsbad Redevelopment Agency held on the 13th day of June, 2023, by the following vote, to wit:
AYES:


NAYS:
ABSTAIN:
ABSENT:
Blackburn, Bhat-Patel, Acosta, Burkholder, Luna.
None.
None.
None.
_L
f-
J-49
KEITH BLACKBURN, Mayor
✓SHERRY FREISINGER, City Clerk
(SEAL)
RESOLUTION NO. 2023-164

A RESOLUTION OF THE CITY COUNCIL OF THE CITY OF CARLSBAD, CALIFORNIA, ADOPTING CHANGES TO THE MASTER FEE SCHEDULE
WHEREAS, the City Council of the City of Carlsbad, California has the authority to establish fees for city services; and
WHEREAS, from time-to-time the fees are reviewed and evaluatedto maintain an adequate fee structure recovering costs for city services; and
WHEREAS, the City Council has determined the cost of providing general and developmentrelated services; and
WHEREAS, the City Council believes it is necessary for the City Manager to have the authority to adjust the parks and recreation and library and arts program and classes fees from time to time to remain competitive and within the market pricing for like programs and classes; and
WHEREAS, the City Council finds it necessary to recover the costs for city services; and
WHEREAS, the City Council has held the necessary public hearing and allowed for public comment on the establishment of the fees.
NOW, THEREFORE, BE IT RESOLVED by the City Council of the City of Carlsbad, California, as follows:
1. That the above recitations are true and correct.
2. That the changes to the Master Fee Schedule as shown in Attachment A are adopted.
3. The City Council authorizes the City Manager or a designee to set parks and recreation and library and cultural arts program, rental, and class fees that are included in the Community Services Guide. The fees shall not exceed the fully burdened, including direct and indirect, costs ofproviding the program, rental, and class but shall be no less (except in the case ofintroductory, discountor promotional pricing) than the lowest fee charged for like kind programs or classes in similarly benchmarked Southern California cities.
4. The City Council authorizes the City Manager or a designee to change vehicle and traffic violation fees at the time, and by the same amount, as the state changes its portion of the fine. Any changes to these fees will be made to the current Master Fee Schedule.
J-50
5. This resolution shall become effective on Sept. 1, 2023; not sooner than 60 days after adoption in accordance with California Government Code Section 66017 for development-related service fees and development impact fees.

6. Perthe contract withRepublic Services, changes tothe recycling and trashfees as shown in Attachment A shall become effective on July 1, 2023.
PASSED, APPROVED AND ADOPTED at a Joint Special Meeting of the City Council of the City of Carlsbad, the Boardof Directors of the Carlsbad Municipal Water District, the Board of Directors of the Carlsbad Public Financing Authority, the Community Development Commission, and the City Council as Successor Agency to the Carlsbad Redevelopment Agency held on the 13th day of June, 2023, by the following vote, to wit:
AYES: NAYS: ABSTAIN:
Blackburn, Bhat-Patel, Acosta, Burkholder, Luna. None. None. None.
� L
-
r•
ABSENT: V
KEITH BLACKBURN, Mayor
J-51
- SHERRY FREISINGER, City Clerk
(SEAL)
RESOLUTION NO. 1711
A RESOLUTION OF THE BOARD OF DIRECTORS OF THE CARLSBAD MUNICIPAL WATER DISTRICT OF THE CITY OF CARLSBAD, CALIFORNIA, ADOPTING CHANGES TO THE MASTER FEE SCHEDULE
WHEREAS, the Board of Directors of the Carlsbad Municipal Water District of the City of Carlsbad, California, has the authority to establish feesfor district services; and
WHEREAS, from time-to-time the fees are reviewed and evaluated to maintain an adequate fee structure recovering costs for district services; and

WHEREAS, the Board of Directors has determined the cost of providing water services; and
WHEREAS, the Board of Directors finds it necessary to recover the costs for water services; and
WHEREAS, the Board of Directors has held the necessary public hearing and allowed for public comment on the establishment of the fees.
NOW, THEREFORE, BE IT RESOLVED by the Board of Directors of the Carlsbad Municipal Water District of the City of Carlsbad, California, as follows:
l. That the above recitations are true and correct.
2. That the changes to the Master Fee Schedule as shown in Attachment A are adopted.
3. This resolution shall become effective on Sept. 1, 2023; not sooner than 60 days after adoption in accordance with California Government Code Section 66017 for water fees.
J-52
PASSED, APPROVED AND ADOPTED at a Joint Special Meeting of the Board of Directors of the Carlsbad Municipal Water District, the City Council of the City of Carlsbad, the Board of Directors of the Carlsbad Public Financing Authority, the Community Development Commission, and the City Council as Successor Agency to the Carlsbad Redevelopment Agency held on the 13th day of June, 2023, by the following vote, to wit:
AYES:


NAYS:
ABSTAIN:
ABSENT:

Blackburn, Bhat-Patel, Acosta, Burkholder, Luna.
None.
None.
None.
KEITH BLACKBURN, President
J-53
SHERRY FREISINGER, Secretary (SEAL)
RESOLUTION NO. 563
A RESOLUTION OF THE COMMUNITY DEVELOPMENT COMMISSION OF THE CITY OF CARLSBAD, CALIFORNIA, ADOPTING CHANGES TO THE MASTER FEE SCHEDULE
WHEREAS, the Community Development Commission of the City of Carlsbad, California (Commission) has the authority to establish fees for housing services; and
WHEREAS, from time-to-time the fees are reviewed and evaluated to maintain an adequate fee structure recovering costs for housing services; and

WHEREAS, the Community Development Commission has determined the cost of providing housing services; and
WHEREAS, the Community Development Commission finds it necessary to recover the costs for housing services; and
WHEREAS, the Community Development Commission has held the necessary public hearing and allowed for public comment on the establishment of the fees.
NOW, THEREFORE, BE IT RESOLVED by the Community Development Commission of the City of Carlsbad, California, as follows:
1. That the above recitations are true and correct.
2. That the changes to the Master Fee Schedule as shown in Attachment A are adopted.
3. This resolution shall become effective on Sept. 1, 2023; not sooner than 60 days after adoption in accordance with California Government Code Section 66017 for housing fees.
J-54
PASSED, APPROVED AND ADOPTED at a Joint Special Meeting of the Community Development Commission, the City Council of the City of Carlsbad, the Board of Directors of the Carlsbad Municipal Water District, the Board of Directors of the Carlsbad Public Financing Authority, and the City Council as Successor Agency to the CarlsbadRedevelopment Agency held onthe 13thday ofJune, 2023, by the followingvote, to wit:
AYES:
NAYS:
ABSTAIN:
ABSENT:
Blackburn, Bhat-Patel, Acosta, Burkholder, Luna.

None.
None. None.
(SEAL)
J-55
SCO CHADWICK,Secretary
RESOLUTION NO. 2023-165
A RESOLUTION OF THE CITY COUNCIL OF THE CITY OF CARLSBAD, CALIFORNIA, APPROVING THE CITY OF CARLSBAD'S SHARE OF THE FISCAL YEAR 2023-24 OPERATING AND CAPITAL BUDGETS OF THE ENCINA WASTEWATER AUTHORITY
WHEREAS, the City of Carlsbad is a Member Agency to the Encina Joint Powers Agreement (the Encina Agreement) entered into on July 13, 1961, for the acquisition, construction, ownership, operation and maintenance of the Encina Joint Sewer System; and

WHEREAS, the Encina Agreement requires approval for the budget of the Encina Wastewater Authority, or EWA, by the Member Agencies following the recommendation of the Joint Advisory Committee, or JAC; and
WHEREAS, the City Council of the City of Carlsbad desires to approve the EWA's budget and provide for the payment of the city's share of the EWA's expenses in accordance with the allocation provided in the Encina Agreement; and
WHEREAS, the Wastewater Fund is projected to have sufficient funds for the payments as they become due.
NOW, THEREFORE, BE IT RESOLVED by the City Council of the City of Carlsbad, California, as follows:
1. That the above recitations are true and correct.
2. That the City of Carlsbad's estimated share of the FY 2023-24 Operating Budget of the EWA as approved by the JAC on April 26, 2023, in the amount of $5,414,426 for Wastewater Plant Operations and $1,829,848 for the Carlsbad Water Recycling Facility Operations, as described in Attachment A, is approved.
3. That the City of Carlsbad's estimatedshare of the FY 2023-24 Capital Budget of the EWA as approved by the JAC on April 26, 2023 in the amount of $5,924,064 for Wastewater Plant Capital and $465,000 for Carlsbad Water Recycling Facility Capital, as described in Attachment A, is approved.
4. That the City Manager, or a designee, is authorized to approve appropriations to the EWA estimated budgets listed above based on the City of Carlsbad's actual share of the EWA budget.
J-56
5. That all outstanding operating encumbrances as of June 30, 2023 are continued into FY 2023-24 for such contractsand obligations.
6. That all Capital Improvement Program budget appropriations and outstanding encumbrancesas of June 30, 2023 are continuedinto FY 2023-24 for such contracts and obligations.
7. That the City Manager, or a designee, is authorized to make payments on behalf of the City of Carlsbad to the EWA in accordance with the budget as approved by the JAC pursuant to the Encina Agreement.


PASSED, APPROVED AND ADOPTED at a Joint Special Meeting of the City Council of the City of Carlsbad, the Board of Directors of the Carlsbad Municipal Water District, the Board of Directors of the Carlsbad Public Financing Authority, the CommunityDevelopment Commission, and the City Council as Successor Agency to the Carlsbad Redevelopment Agency held on the 13th day of June, 2023, by the following vote, to wit:
AYES:
NAYS:
ABSTAIN:
ABSENT:
Blackburn, Bhat-Patel, Acosta, Burkholder, Luna. None. None. None.
KEITH BLACKBURN, Mayor
SHERRY FREISINGER, City Clerk
� LJ
l''-
J-57
(SEAL)
RESOLUTION NO. 2023-166

A RESOLUTION OF THE CITY COUNCIL OF THE CITY OF CARLSBAD, CALIFORNIA, DETERMINING THAT THE FISCAL YEAR 2023-24 CAPITAL IMPROVEMENT PROGRAM IS CONSISTENT WITH THE GENERAL PLAN AND APPLICABLE CLIMATE ACTION PLAN MEASURES AND ACTIONS
WHEREAS, the City Council of the City of Carlsbad, California has reviewed the Capital Improvement Program for FY 2023-24 and has held such public hearings as are necessary prior to adoption of the Capital Improvement Program; and
WHEREAS, on June 13, 2023, the City Council reviewed for consistency with the General Plan goals and policies all Capital projects receiving an allocation of funds for FY 2023-24 pursuant to Carlsbad Municipal Code Section 2.24.040{8); and
WHEREAS, the City Council also reviewed the FY 2023-24 Capital Improvement Program projects for consistency with applicable Climate Action Plan measures and actions; and
WHEREAS, upon hearing and considering all testimony and arguments, if any, of all persons desiring to be heard, the City Council considered all factors relating to the City Council determination.
NOW, THEREFORE, BE IT RESOLVED by the City Council of the City of Carlsbad, California, as follows:
1. That the above recitations are true and correct.
2. That based on the evidence presented at the hearing, the City Council determines that the Capital Improvement Program for FY 2023-24 is consistent with the General Plan based on the following findings:
a) The projects are consistent with the goals and policies of the city's General Plan in that the projects are required to ensure the provision of adequate public facilities and services concurrent with or prior to need.
J-58
b) The projects are consistent with applicable goals and policies of the Land Use and Community Design and Mobility Elements, as described in Attachment A.
c) Specific projects are consistent with, and support Climate Action Plan greenhouse gas reduction measures and actions, if applicable, as described in Attachment A.
d) As required by the General Plan, the proposed improvements are consistent with the city's Growth Management Plan in that the projects ensure that the necessary improvements are provided for facilities maintenance, park development, sewer projects, and circulation systems, in accordance with the performance standards contained in the city's Growth Management regulations.
3. This action is final as of the date this resolution is adopted by the City Council. The Provisions of Chapter 1.16 of the Carlsbad Municipal Code, "Time Limits for Judicial Review" shall apply:

"NOTICE"
The time within which judicial review of this decision must be sought is governed by Code of Civil Procedure, Section 1094.6, which has been made applicable in the City of Carlsbad by Carlsbad Municipal Code Chapter 1.16. Any petition or other action seeking review must be filed in the appropriate court not later than the ninetieth day following the date on which this decision becomes final; however, if within ten days after the decision becomes final a request for the record is filed with a deposit in an amount sufficient to cover the estimated cost or preparation of such record, the time within which such petition may be filed in court is extended to not later than the thirtieth day following the date on which the record is either personally delivered or mailed to the party, or his attorney of record, if he has one. A written request for the preparation of the record of the proceedings shall be filed with the City Clerk, City of Carlsbad, 1200 Carlsbad Village Drive, Carlsbad, CA 92008.
J-59
PASSED, APPROVED ANDADOPTED at aJoint Special Meetingof theCityCouncil of theCityof Carlsbad,theBoardofDirectorsof theCarlsbadMunicipalWaterDistrict, theBoardofDirectorsofthe CarlsbadPublic FinancingAuthority, theCommunityDevelopmentCommission,andtheCityCouncilas SuccessorAgency to theCarlsbad RedevelopmentAgencyheld onthe 13thdayofJune, 2023, by the followingvote, towit:
AYES:
NAYS:
ABSTAIN:

ABSENT:
Blackburn, Bhat-Patel, Acosta, Burkholder, Luna.
None.
None.
None.
KEITHBLACKBURN, Mayor
�
�
T�
J-60
.J..v.SHERRY FREISINGER, CityClerk
(SEAL)
RESOLUTION NO. 2023-167

A RESOLUTION OF THE CITY COUNCIL OF THE CITY OF CARLSBAD, CALIFORNIA, ADOPTING A LIST OF PROJECTS AND AUTHORIZING THE ALLOCATION OF ROAD MAINTENANCE AND REHABILITATION ACCOUNT FUNDS TO THE PAVEMENT MANAGEMENT AND CONCRETE REPLACEMENT PROGRAMS FOR FISCAL YEAR 2023-24
WHEREAS, the state Legislature enacted Senate Bill 1 {SB 1}, referred to as the Road Repair and Accountability Act of 2017, in April 2017 to address the significant multi-modal transportation funding shortfalls statewide; and
WHEREAS, SB 1 includes accountability and transparency provisions that will ensure the city residents are aware of projects proposed for funding as well as those projects that have been completed each fiscal year; and
WHEREAS, the city must adopt by resolution a list of projects proposed to receive fiscal year funding from the Road Maintenance and Rehabilitation Account created by SB 1, which must include a description and the location of each proposed project, a proposed schedule for the project's completion and the estimated useful life of the improvement; and
WHEREAS, staff estimate the city will receive approximately $2,857,000 in Road Maintenance and Rehabilitation Account funding during FY 2023-24; and
WHEREAS, a fund balance of $251,000 exists, which when added with the FY 2023-24 estimated revenue projection of $2,857,000 results in total Road Maintenance and Rehabilitation Account funding of $3,108,000, which includes $38,000 of unallocated funding; and
WHEREAS, this will be the seventh year in which the city will receive Road Maintenance and Rehabilitation Account funding, which will enable the city to continue essential road maintenance and rehabilitation projects thereby increasing access and mobility options for the traveling public; and
WHEREAS, the city has undergone a process to solicit public input into the community's transportation priorities as part of the Capital Improvement Program approval process; and
WHEREAS, the city utilizes a pavement management system to ensure that Road Maintenance and Rehabilitation Account revenues are being used in a prioritized and cost-effective manner; and
WHEREAS, the funding from the Road Maintenance and Rehabilitation Account will help the city maintain and rehabilitate its network of roads and provide concrete improvements and similar projects in the future; and
J-61
WHEREAS, the 2018 California Statewide Local Streets and Roads Needs Assessment found that the city's streets and roads are in a good condition and this revenue will help the city increase the overall quality of its road system; and

WHEREAS, the Road Maintenance and Rehabilitation Account project list and overall investment in our local streets and roads infrastructure with a focus on basic maintenance and safety will have a significant benefit to the community.
NOW, THEREFORE, BE IT RESOLVED by the City Council of the City of Carlsbad, California, as follows:
1. That the above recitations are trueand correct.
2. That the Pavement Management Program, CIP Project No. 6001, as further described here, will be funded in part with FY 2023-24 Road Maintenance and Rehabilitation
Account revenues:
a. Project Title: Pavement Overlay and Slurry Projects
b. Descrip�ion: resurface and rehabilitate a selection of publicly maintained streets on an annual basis
c. Location: various streets throughout the city based on pavement condition, including:
i. Carlsbad Village Drive - between Interstate 5 and College Boulevard
ii. Tamarack Avenue - between Carlsbad Boulevard and Carlsbad Village Drive
iii. Cannon Road - between Avenida Encinas and Faraday Avenue
iv. Poinsettia Lane - between Carlsbad Boulevard and Melrose Drive
v. La Costa Avenue - between Interstate 5 and Fairway Lane
vi. Olivenhain Road - between Encinitas city limits and Rancho Santa Fe Road
d. Estimated Project Schedule: July 2023 -June 2024
e. Estimated Useful Life: slurry seal has a useful life of approximately five years, and asphalt concrete overlay has a useful life of approximately 20 years
3. That the Concrete Replacement Program, CIP Project No. 6013, as further described here, will be funded in part with FY 2023-24 Road Maintenance and Rehabilitation
Account revenues:
a. Project Title: Concrete Replacement Program
J-62
b. Description: repair and replace broken and uplifted concrete in the public right of way
c. Location: various locations throughout the city based on concrete condition, including:
i. Carlsbad Village Drive - between Interstate 5 and College Boulevard
ii. Tamarack Avenue - between Carlsbad Boulevard and Carlsbad Village Drive
iii. Cannon Road - between Avenida Encinas and Faraday Avenue
iv. Poinsettia Lane - between Carlsbad Boulevard and Melrose Drive
v. La Costa Avenue - between Interstate 5 and Fairway Lane
vi. Olivenhain Road - between Encinitas city limits and Rancho Santa Fe Road
d. EstimatedProjectSchedule: July 2023 - June 2024
e. Estimated Useful Life: concrete improvements typically have a useful life of approximately 50 years
4. That funding to allocate Road Maintenance and Rehabilitation Account funding in the amount of $2,450,000 to the Pavement Management Program, CIP Project No. 6001, and $620,000 to the Concrete Replacement Program, CIP Project No. 6013, was incorporated into the in the FY 2023-24 CIP budget.
J-63
PASSED, APPROVED AND ADOPTED at a Joint Special Meeting of the City Council of the City of Carlsbad, the Board of Directors of the Carlsbad Municipal Water District, the Board of Directors of the Carlsbad Public Financing Authority, the Community Development Commission, and the City Council as Successor Agency to the Carlsbad Redevelopment Agency held on the 13th day of June, 2023, by the following vote, to wit:
AYES:


NAYS:
ABSTAIN:
ABSENT:

Blackburn, Bhat-Patel, Acosta, Burkholder, Luna.
None.
None.
None.
KEITH BLACKBURN, Mayor
J-64
SHERRY FREISINGER, City Clerk {SEAL)
