4 minute read
The Top Ten The Who, What, and Where in lumber production


By Dwight Curran Contributing Editor The MERCHANT MAGAZINE
qSIT HAS so often in the past, this eighth annual compilation of lumber statistics makes very interesting reading. It can certainly provide insights, particularly if a buyer feels that he was not getting as much wood as normal from one of his suppliers. It must be pointed out, though, that changes in species mix, or the Quality of logs, can greatly affect what a mill has for sale even though the production stays constant from year to year.
What could be even more interesting, though not within the scope of this article, would be an analysis of how each company got to its present position of leadership in the industry.
But large size does not, of itself, guarantee profits. In some firms, the desire for bigness has outstripped its ability to be profitable, and there is nothing more important than the bottom line on the profit & loss statement.
For any lumberman, however, the study of these large production units is interesting in itself. And for that reason the figures are presented once again without any reference to sales or profits.
This article is based on information obtained ftomForest Industries' Annual Lumber Review & Buyer's Guide, 1978 edition. It does an excellent job of covering nearly 8O% of all the lumber produced yearly in North America. The smallest producer, for example, is listed as the Paul T. Tkalac Sawmill at Brown City, Mi. Production in1977 was 500 board feet.
Number One
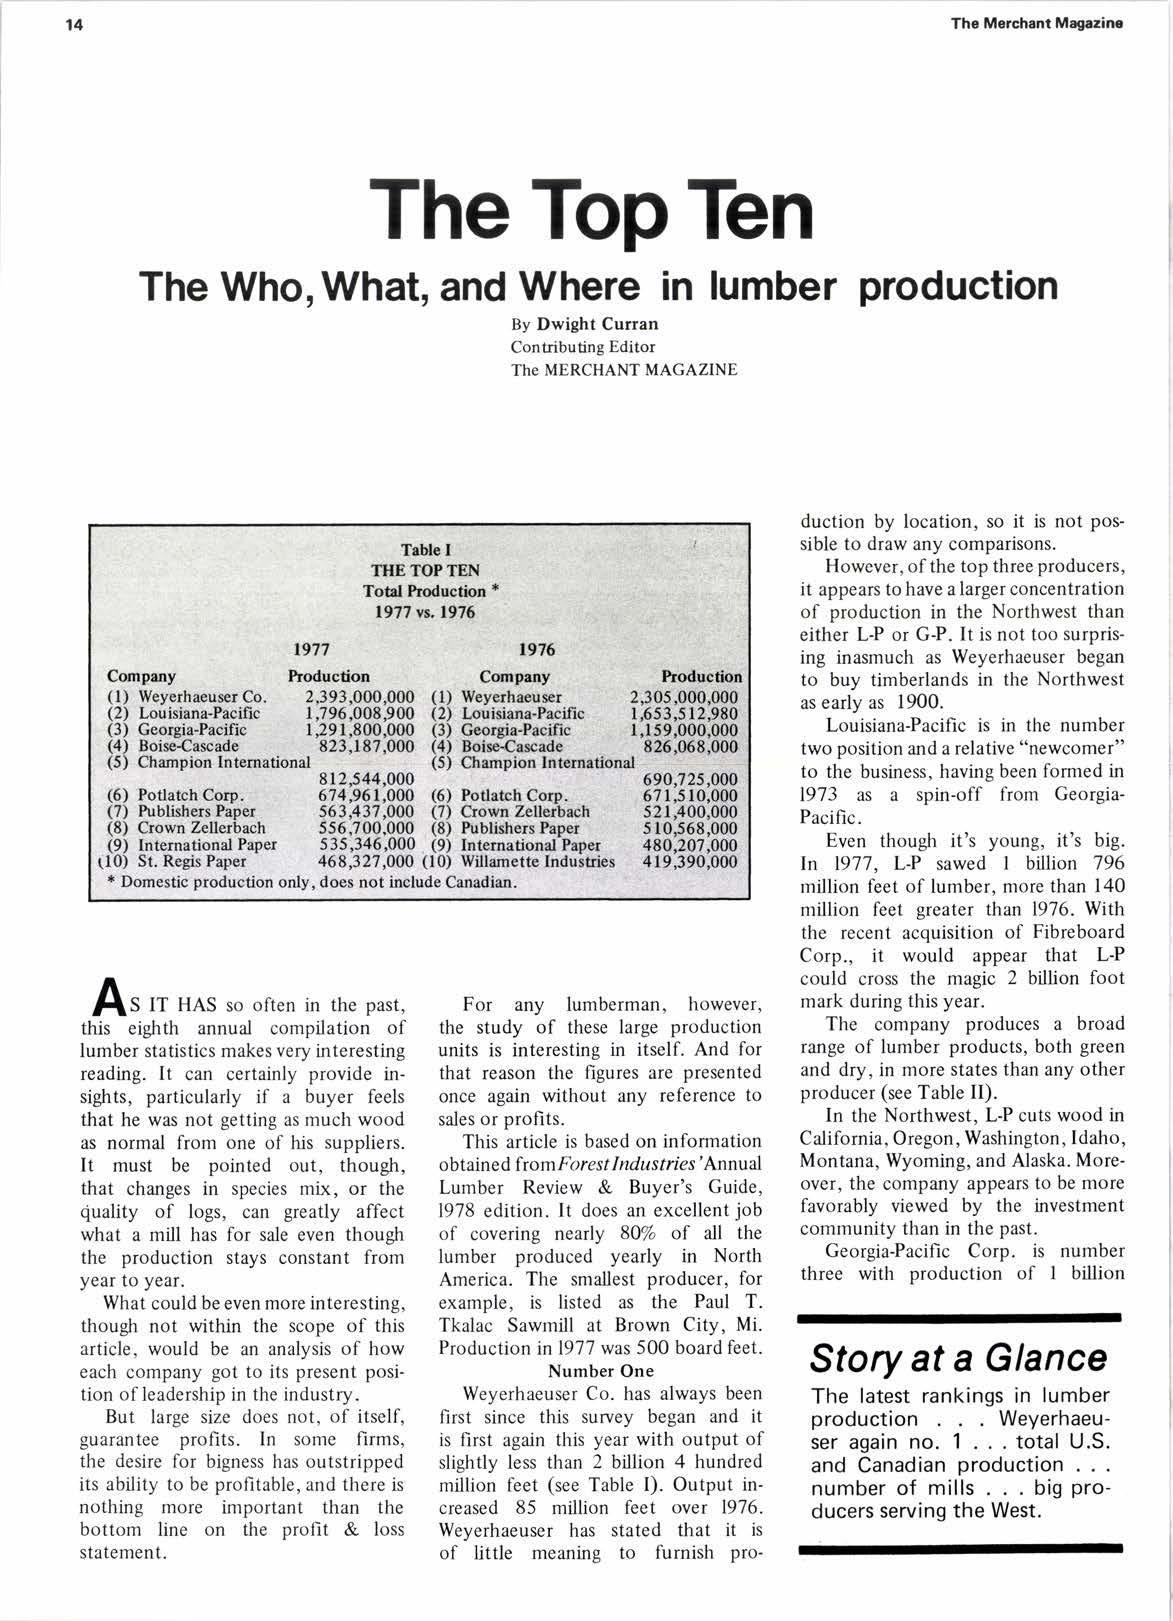
Weyerhaeuser Co. has always been first since this survey began and it is first again this year with output of slightly less than 2 billion 4 hundred million feet (see Table I). Output increased 85 million feet over 1976. Weyerhaeuser has stated that it is of little meaning to furnish pro- duction by location, so it is not possible to draw any comparisons.
However, of the top three producers, it appears to have a larger concentration of production in the Northwest than either L-P or G-P. It is not too surprising inasmuch as Weyerhaeuser began to buy timberlands in the Northwest as early as 1900.
Louisiana-Pacific is in the number two position and a relative "newcomer" to the business, having been formed in L973 as a spin-off from GeorgiaPacific.
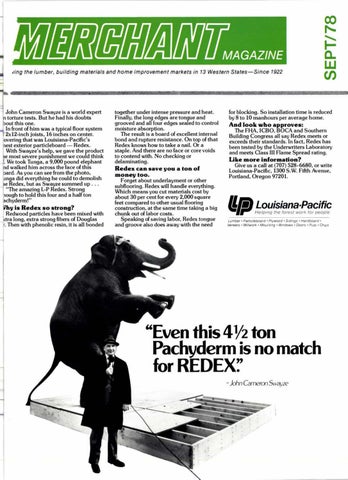
Even though it's young, it's big. In 1977. L-P sawed I billion 796 million feet of lumber, more than 140 million feet greater than 1976. With the recent acquisition of Fibreboard Corp., it would appear that L-P could cross the magic 2 billion foot mark during this year.
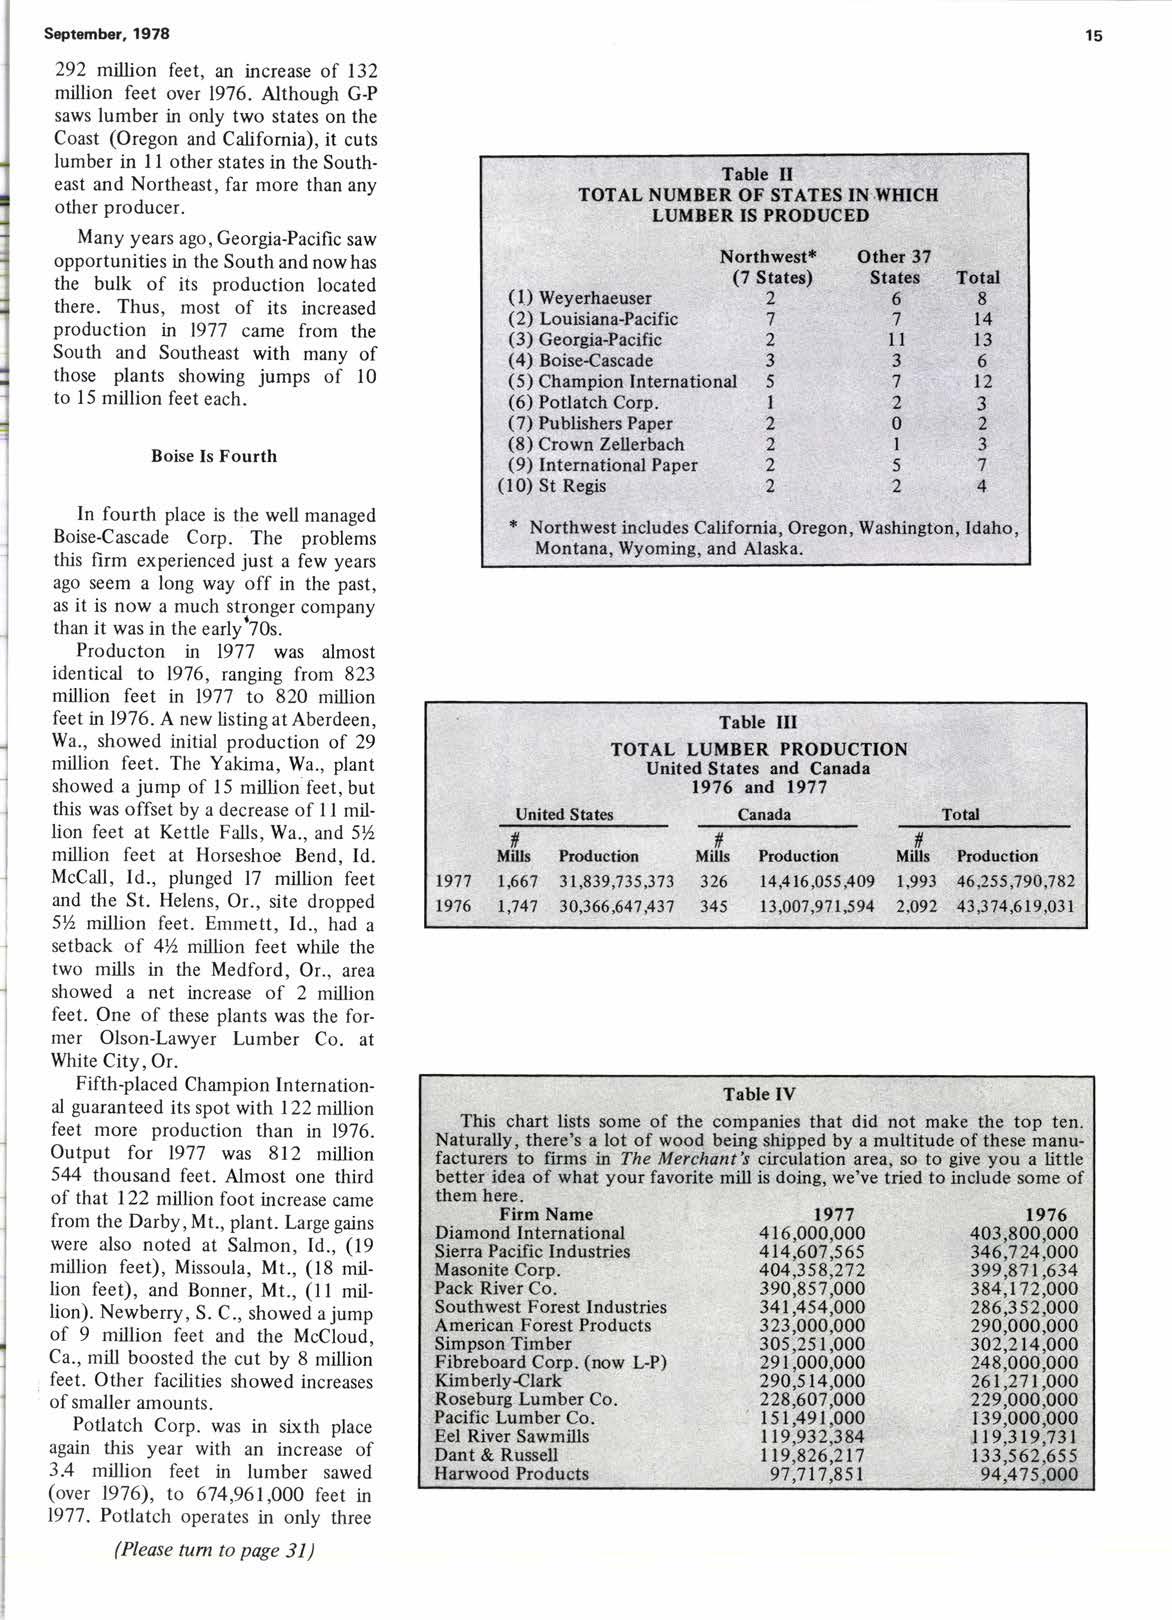
The company produces a broad range of lumber products, both green and dry, in more states than any other producer (see Table II).
In the Northwest, L-P cuts wood in California, Oregon, Washington, Idaho, Montana, Wyoming, and Alaska. Moreover, the company appears to be more favorably viewed by the investment community than in the past.
Georgia-Pacific Corp. is number three with production of I billion
Story at a Glance
The latest rankings in lumber production Weyerhaeuser again no. 1 . . . total U.S. and Canadian production number of mills . . . big producers serving the West.
September,1978
292 million feet, an increase of 132 million feet over 1976. Although G-P saws lumber in only two states on the Coast (Oregon and California), it cuts lumber in I I other states in the Southeast and Northeast, far more than any other producer.
Many years ago, Georgia-Pacific saw opportunities in the South and now has the bulk of its production located there. Thus, most of its increased production n l9ll came from the South and Southeast with many of those plants showing jumps of 10 to l5 million feet each.
Boise Is Fourth
In fourth place is the well managed Boise-Cascade Corp. The problems this firm experienced just a few years ago seem a long way off in the past, as it is now a much stronger company than it was in the early'70i.
Producton in 1917 was almost identical to 1916, ranging from 823 million feet in I97l to 820 rnillion feet n 1916. A new listing at Aberdeen, Wa., showed initial production of 29 million feet. Thc Yakima, Wa., plant showed a jump of 15 million f'eet, but this was offset by a decrease of I I million feet at Kettle Falls. Wa.. and 51/z million feet at Horseshoe Bend, Id. McCall, Id., plunged 17 million feet and the St. Helens, Or., site dropped 5% million feet. Enrrnett, Id.. had a setback of 4/z mllion feet while the two mills in the Medford. Or.. area showed a net increase of 2 ntillion feet. One of these plants was the former Olson-Lawyer Lurnber Co. at White City, Or.
Fifth-placed Champion International guaranteed its spot with 122 million feet more production than in 1976. Output for l9lJ was 812 million 544 thousand feet. Almost one third of that 122 mtllion foot incre ase came from the Darby, Mt., plant. Large gains were also noted at Salmon, Id., (19 million feet), Missoula, Mt., (18 million feet), and Bonner, Mt., (1 1 million). Newberry, S. C., showed a jump of 9 nrillion feet and the McCloud, Ca., mill boosted the cut by 8 nrillion feet. Other facilities showed increases of smaller amounts.
Potlatch Corp. was in slxth place again this year with an increase of 3.4 million feet in lumber sawed (over 1976), to 674,961,000 feet in l97l . PotlaIch operates in only three
(Please tum to page 3l )
*
LUMBER IS PRODUCEI}
Table III
TOTAL
Table IV
This chart lists some of the companies that did not make the top ten. Naturally, there's a lot of wood being shipped by a multitude of these manufacturers to firms in The Merchant\ circulation area, so to give you a little better idea of what your favorite mill is doing, we've tried to include some of them here.