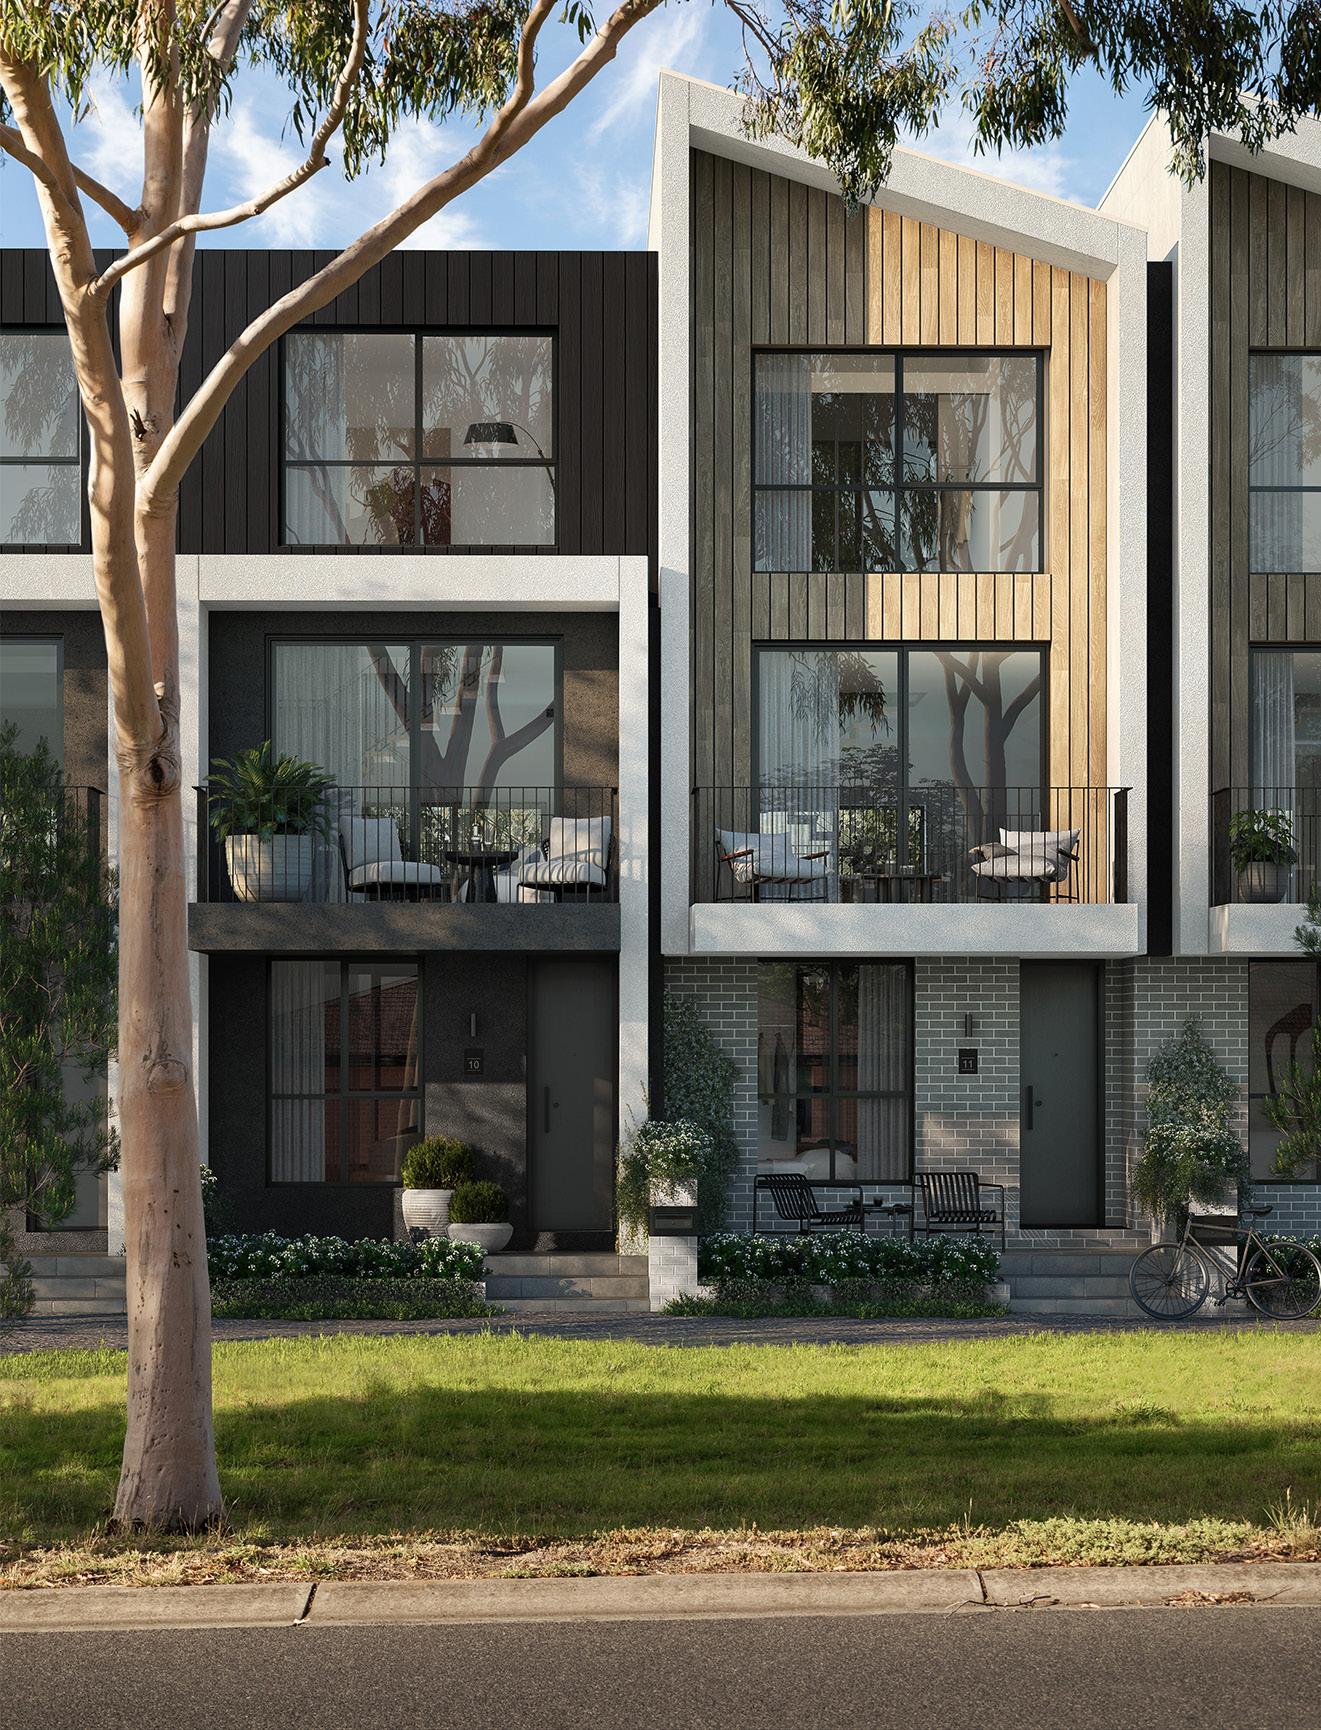
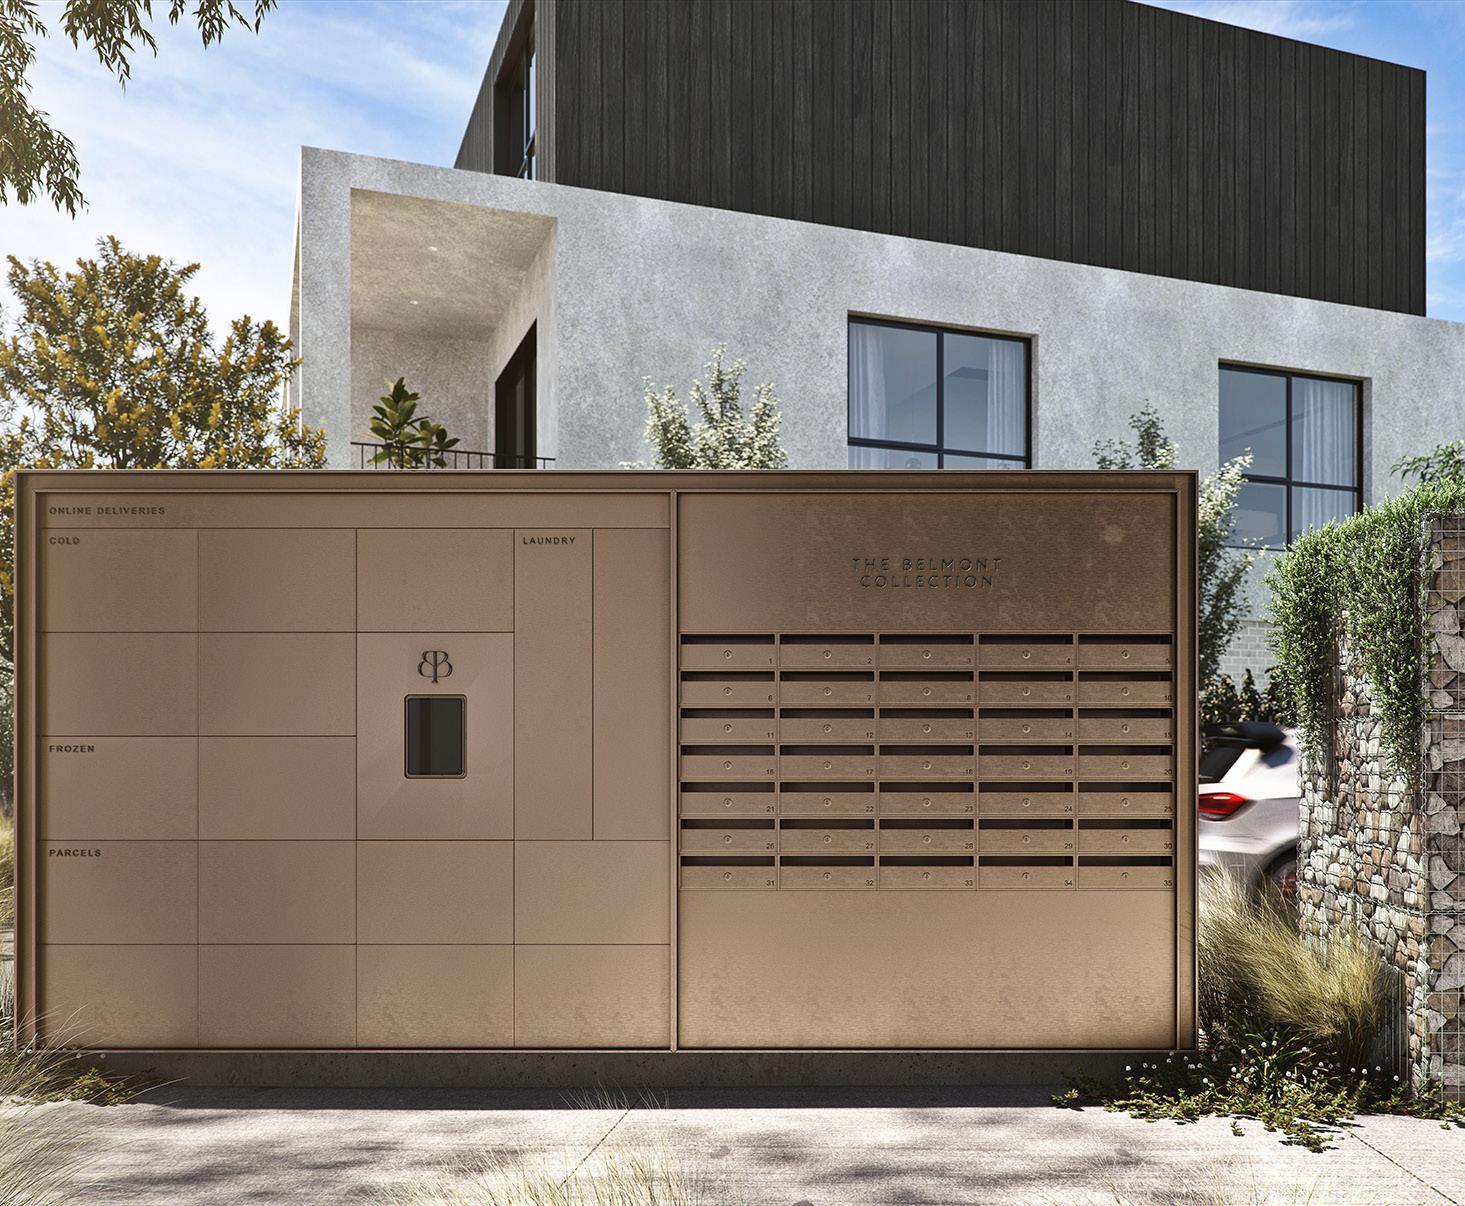
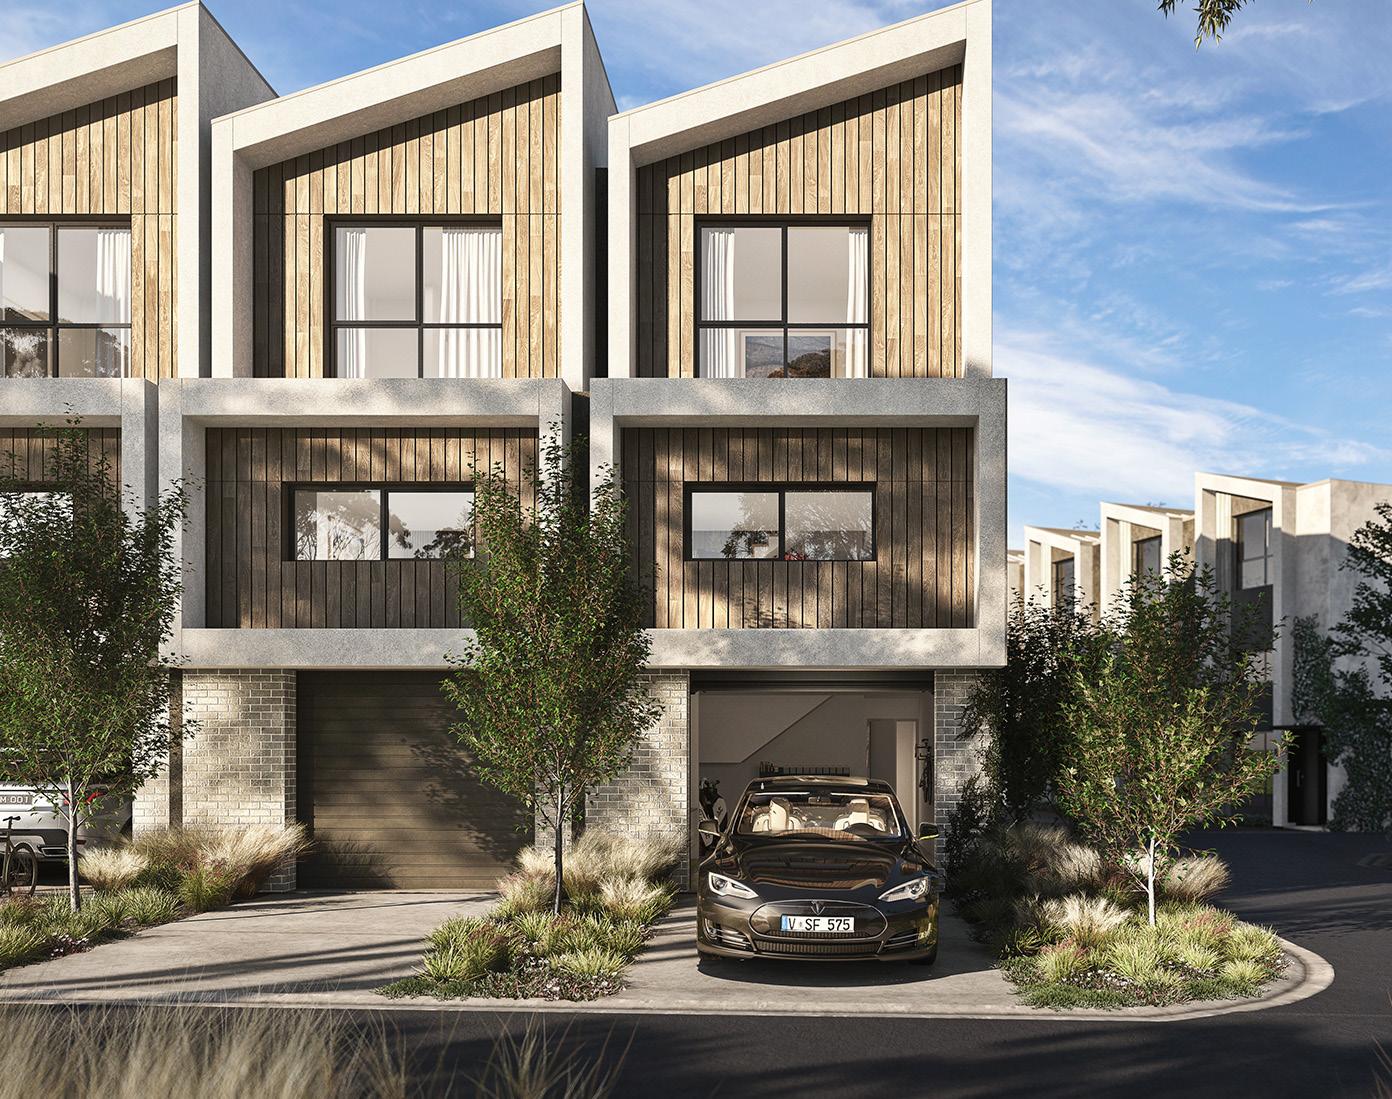
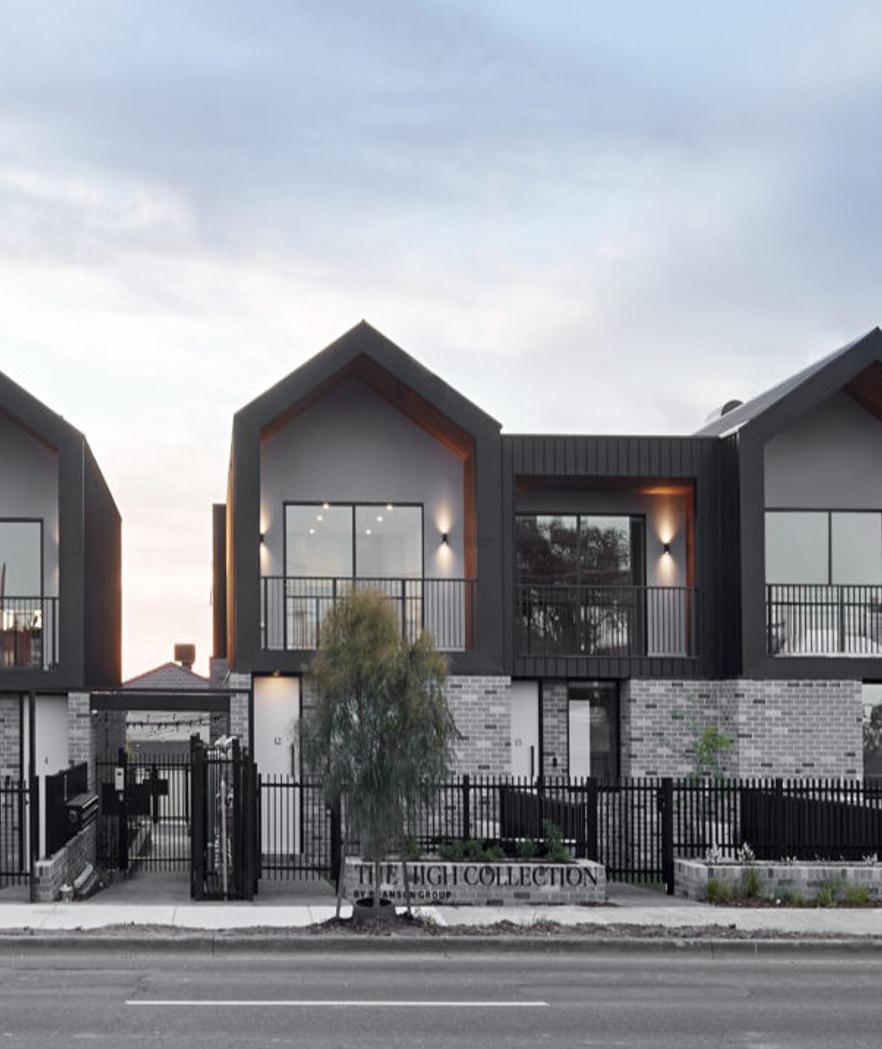
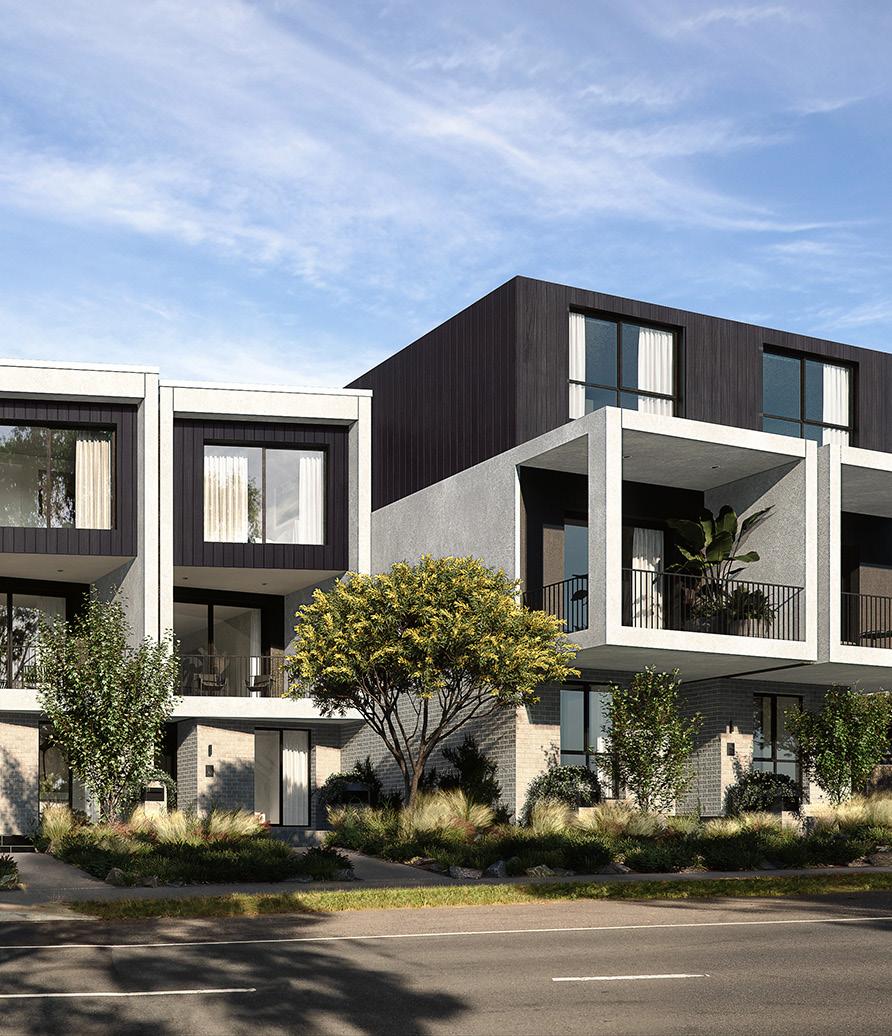
THE BELMONT COLLECTION
Project Details
• Located 18 kilometres from the Melbourne CBD
• A tight rental market with huge growth potential, offering strong yields and low vacancies
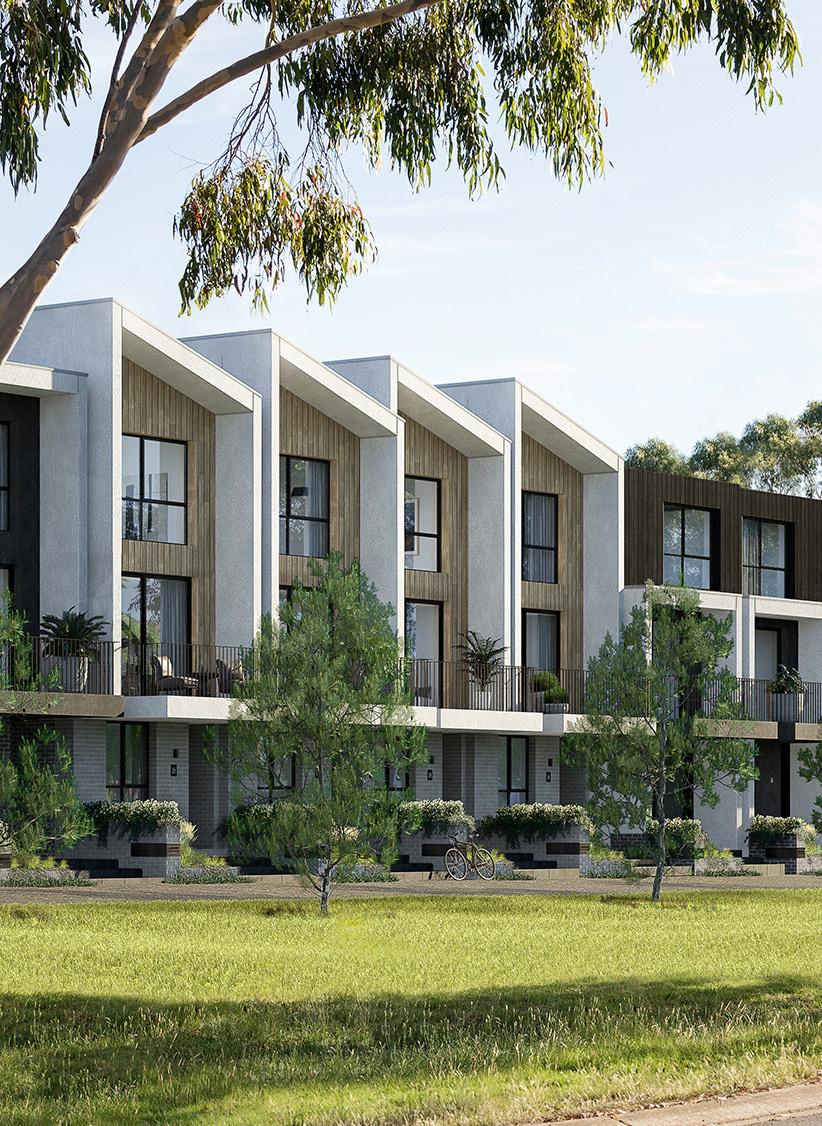
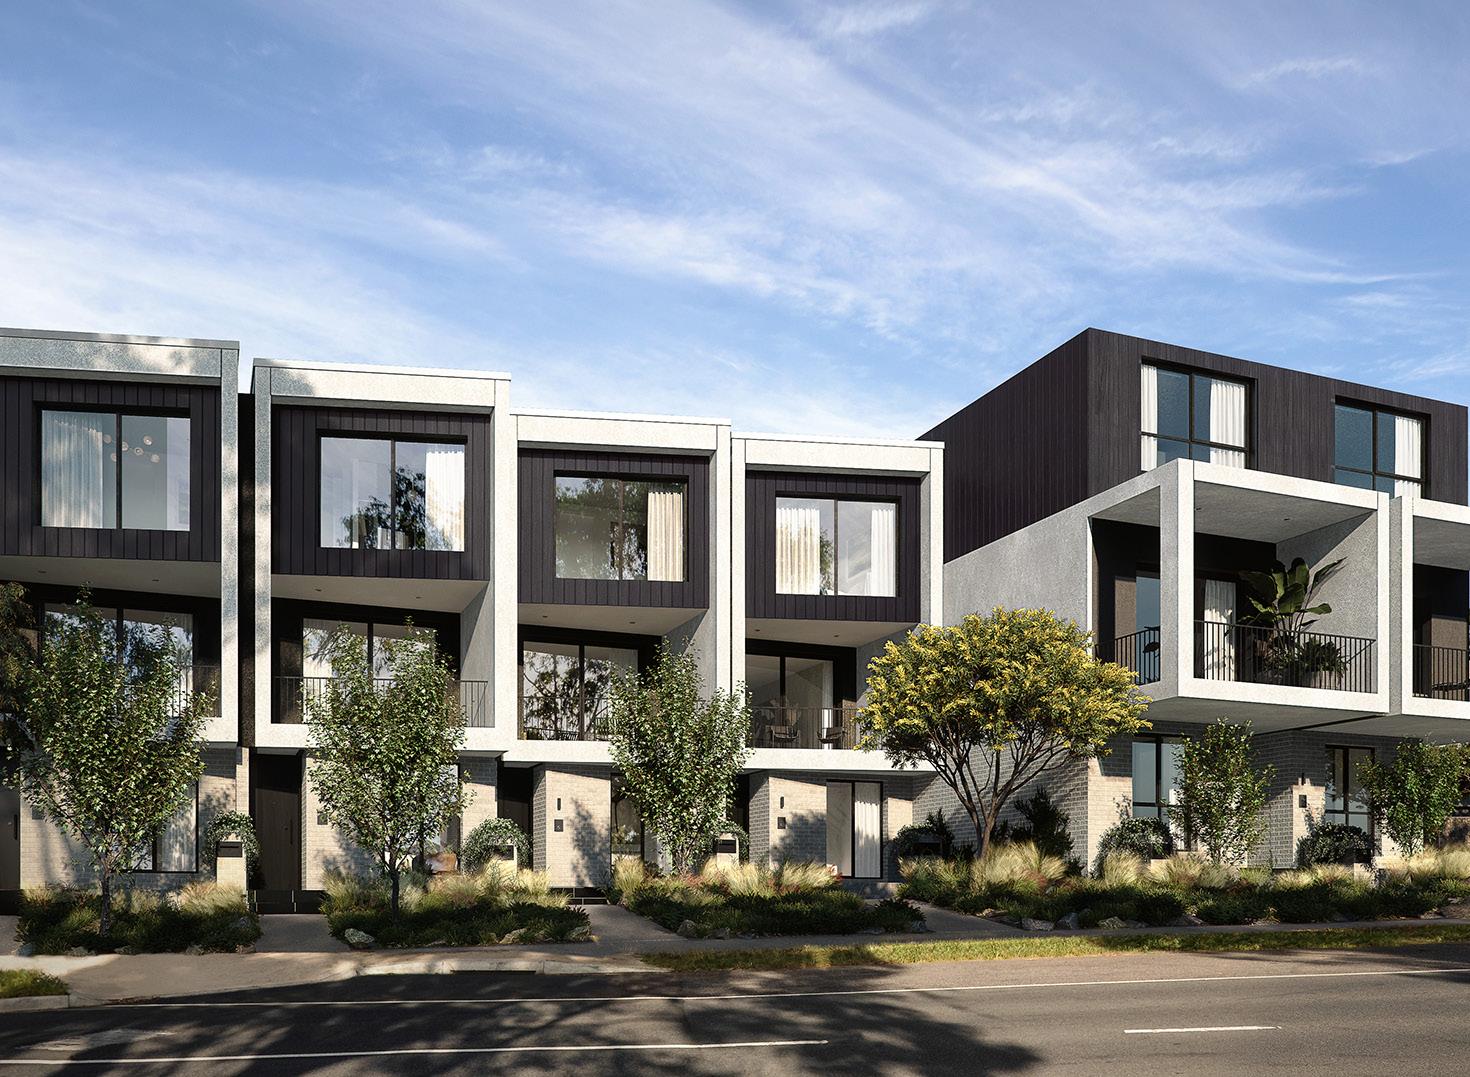
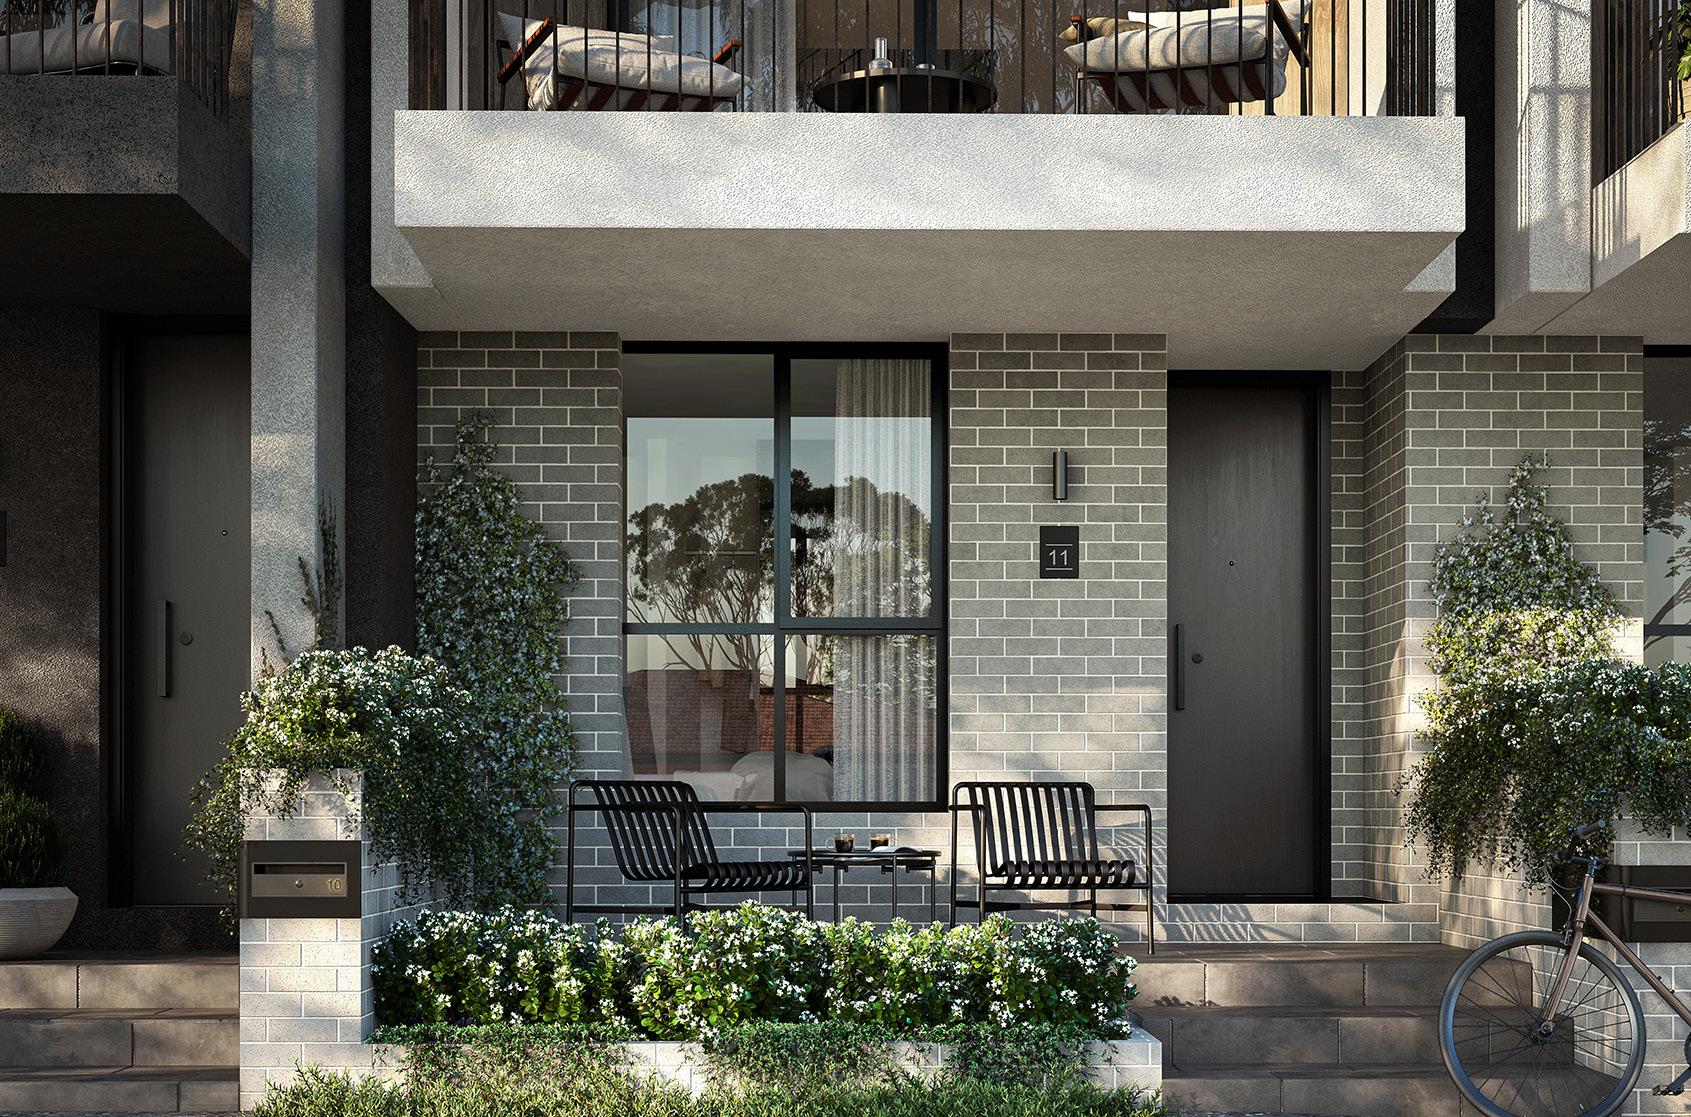
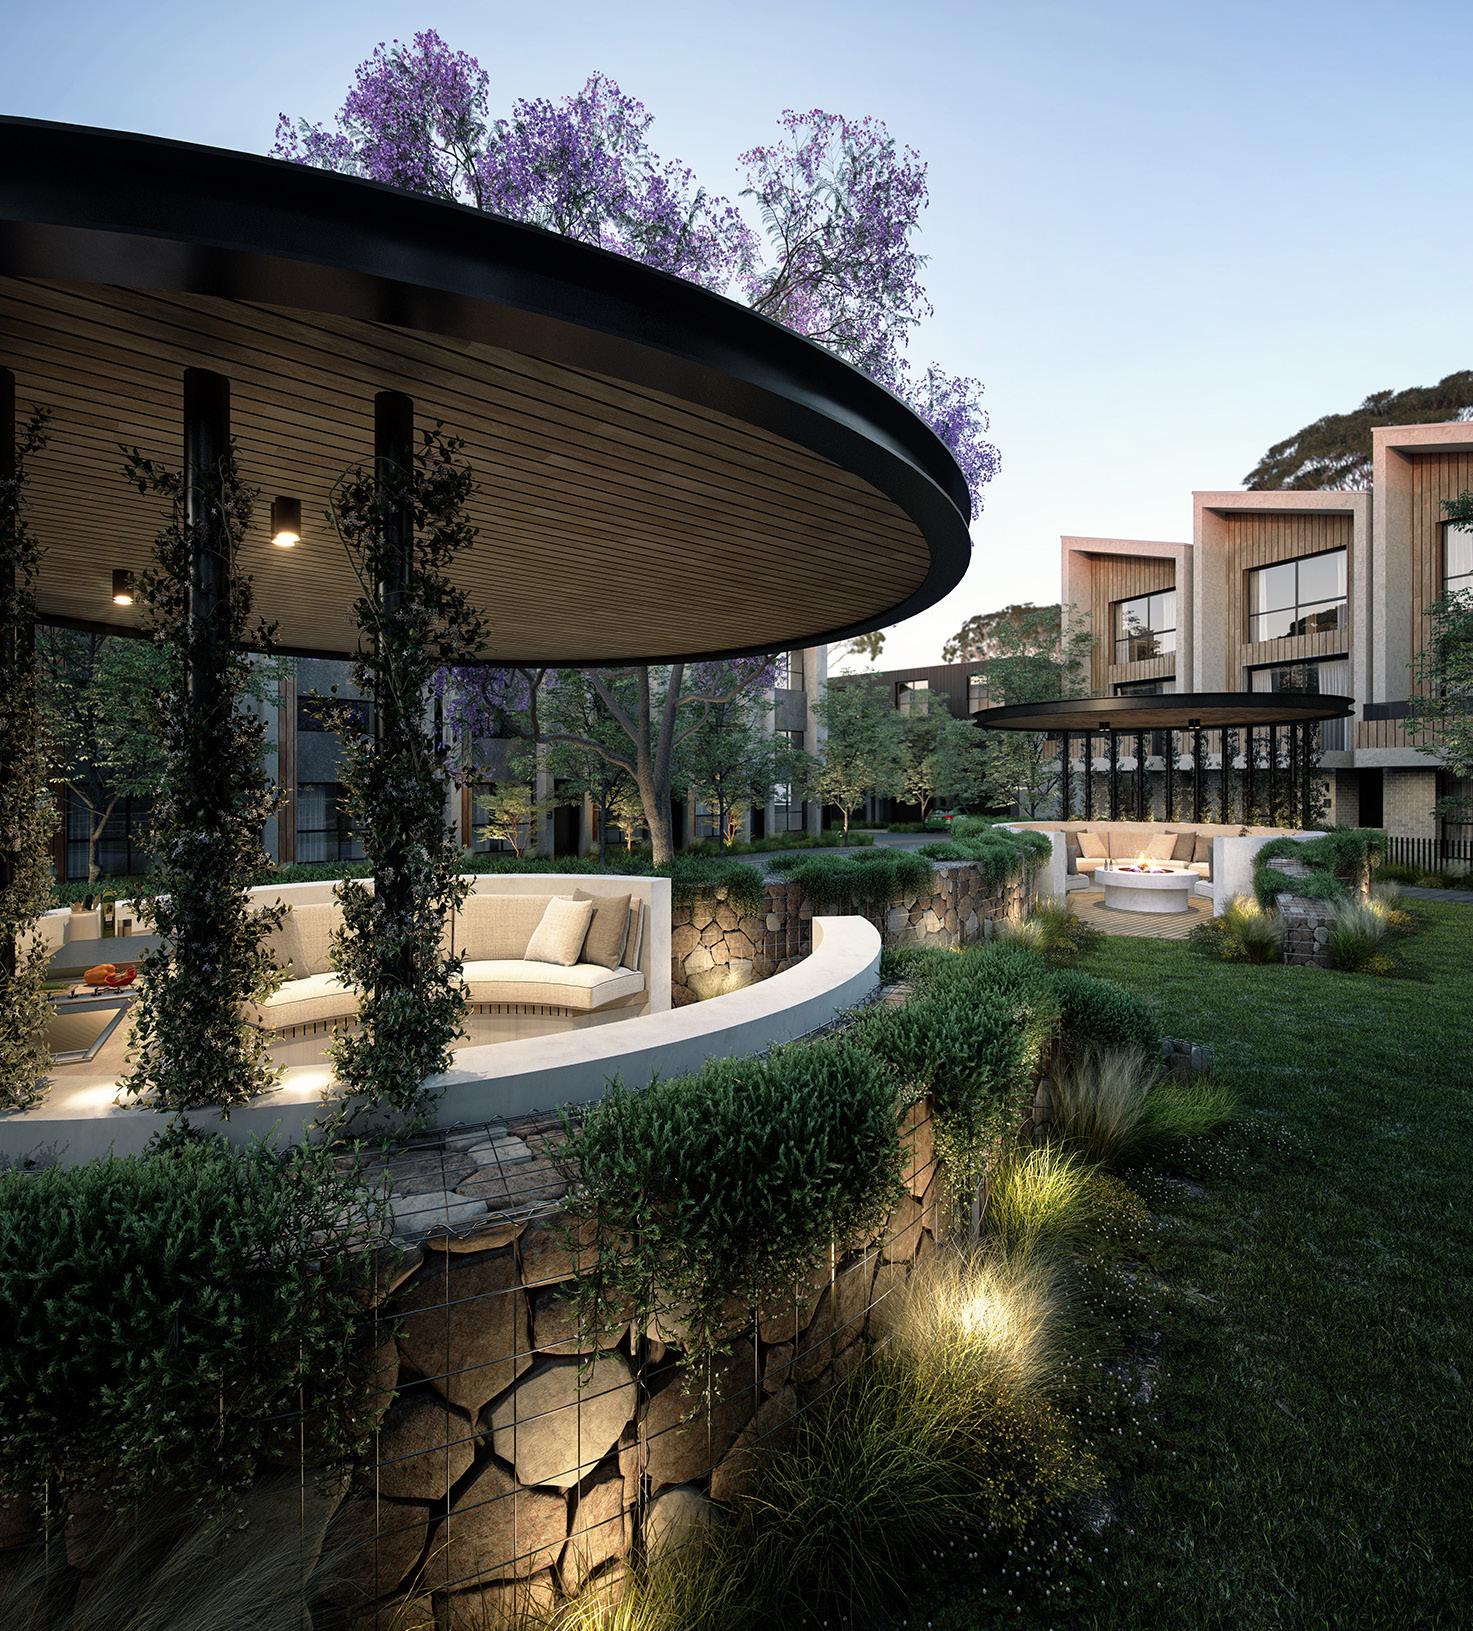
• An aesthetically appealing and well-designed project
• Experienced local developer who consistently delivers high quality offerings

Number of dwellings
107 townhouses
Price ranges
3-bedroom, 2-bathroom, 1 car space: $719,800
3-bedroom, 2-bathroom, 2 car space: from $749,800
Size ranges
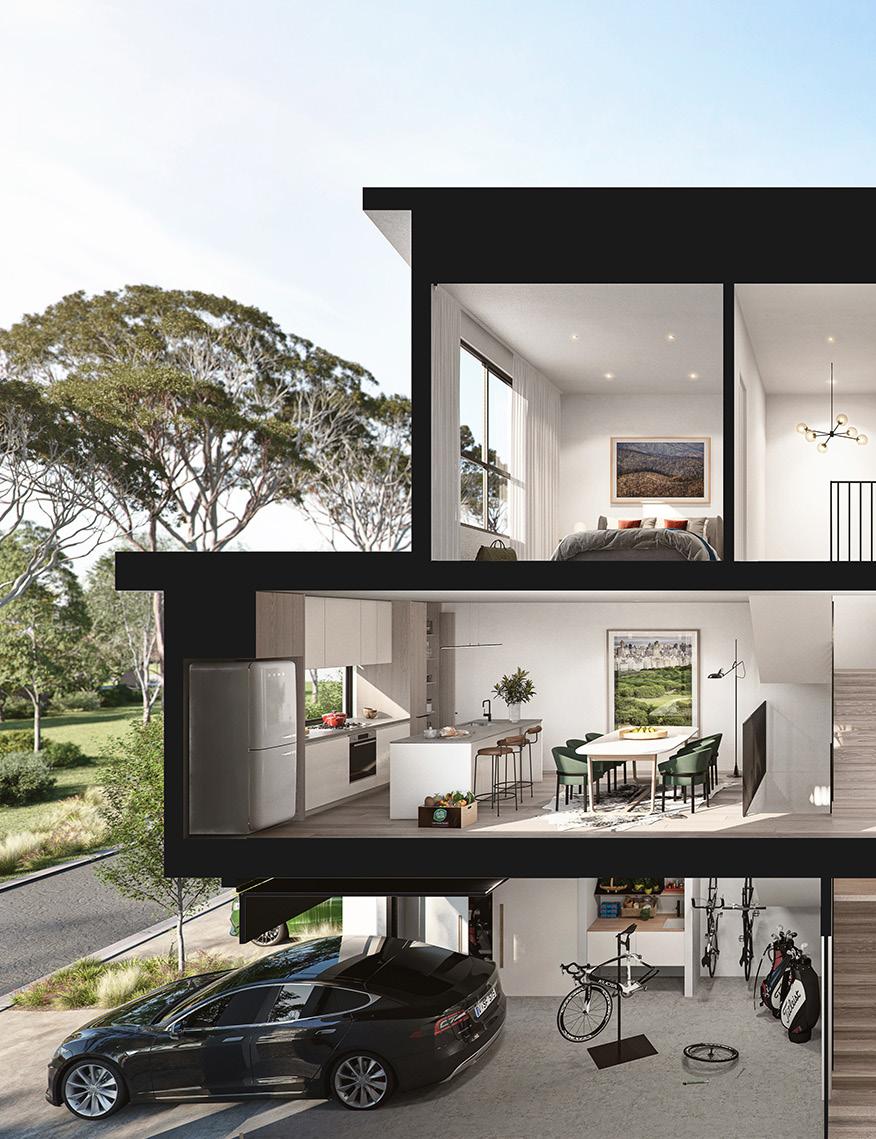
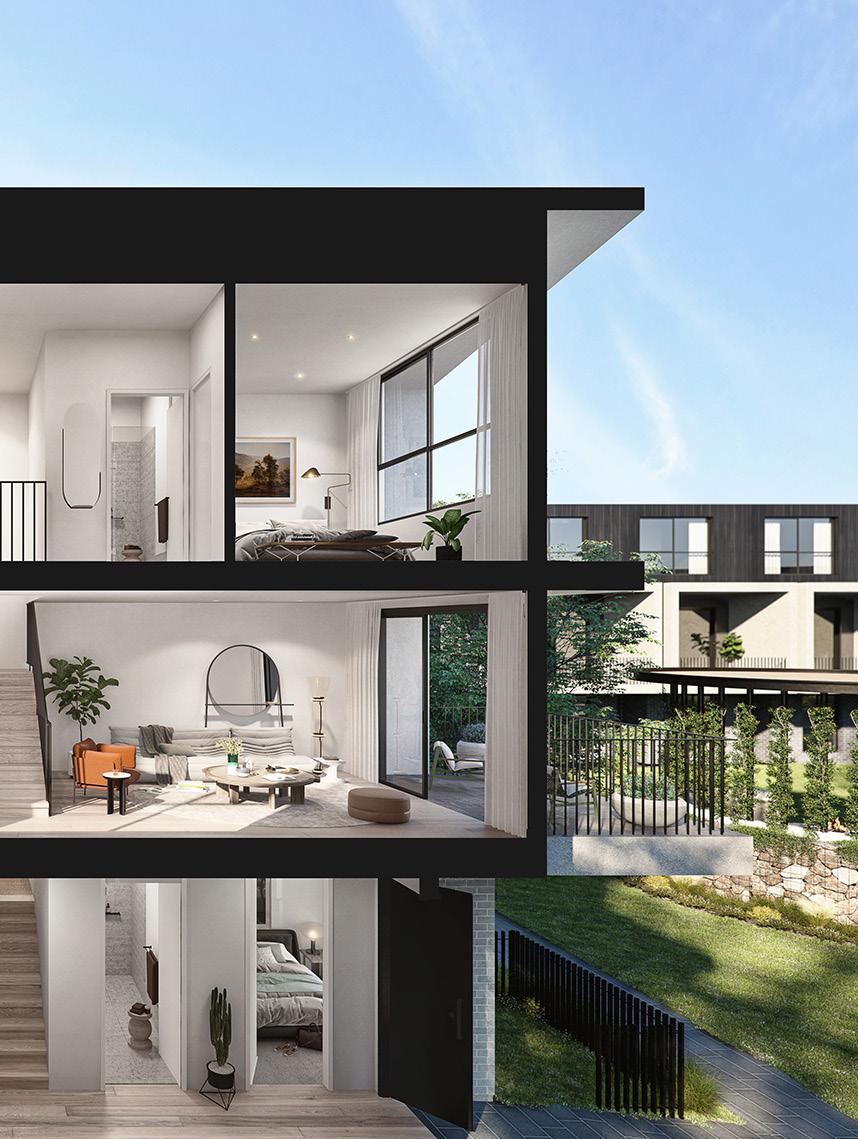
3-bedroom, 2-bathroom, 1 car space: 141.80sqm
3-bedroom, 2-bathroom, 2 car space: 161 -162.80sqm
Estimated completion
Q3 2024 – Q2 2025
Estimated outgoings
Council & Water Rates:
$2,000 - $2,500 approx
Body Corps: $1,400 - $1,800 approx
Conditions of purchase
Deposit on Exchange: 10% on exchange of contracts
1
1.0
1.0 THE BELMONT COLLECTION


2 1.0 THE BELMONT COLLECTION
The Belmont Collection Mill Park
2.0
MELBOURNE
Victoria
In 2022, Melbourne was ranked the tenth most liveable city in the world by The Economist Intelligence Unit. This follows seven consecutive years as number one. This performance can be attributed to world class healthcare, education and infrastructure, along with the city’s cultural diversity, environment and of course Australia’s political stability.

The Melbourne property market has been one of the strongest and most consistent performers over the last four decades. House price growth has ebbed and flowed over the course of the property cycle but the long-term performance has been outstanding with median house prices increasing by 8.9% per annum and apartment prices increasing by 6.7% per annum.
Although the Covid related lockdowns endured by Melbourne have proven challenging, the market has turned the corner with the return of both buyers and sellers. Consumer confidence and auction clearance rates have both improved and this is beginning to be reflected in price with houses increasing by 17.4% in the 12 months to June 2021. Uncertainty around inflation and rising interest rates has since slowed the rate of price increases. Nevertheless, we remain in the early stages of a macro bull run in property on the East Coast.
3
2.0 MELBOURNE
'An average of over 120,000 new residents per year are moving to Melbourne'
2.1
Population & Demographics
The population of Greater Melbourne was 5,150,766 as at 2022. The population growth rate has been near the top of any Australian state or territory with a pre-pandemic growth rate of 1.6%. This translates to an average of 120,000 residents added per year.
The growing population requires an additional 45,000 new dwellings per year. With a growth rate outstripping Sydney over the past decade and it is set to become Australia’s most populous city by 2026.
Assessing the population structure and how this may change in the future is critical to understanding where property demand will come from. The current household size is 2.7 people. However, the fastest growing cohort is lone person households. This suggests that future demand will most likely skew towards medium and high-density property types.
As of June 30th, 2022, lone person households and coupled families
without children make up 49% of Greater Melbourne’s population. By 2031 these household types are expected to increase to 59%.
Rising prices for detached dwellings have strained affordability with a resultant spill over of demand into medium and high density dwellings.
4
2.0 MELBOURNE
'Melbourneisexpected toovertakeSydneyasthe nation'slargestcityin2030, withjustover5.9million peopleinthatyear'
Economics & Employment Growth
Victoriarepresents3%ofAustralia's totallandmass, yetaccountsfor 23.3% ofnationalGDPand competeswiththelargest economiesinSoutheastAsia.It currentlyboaststhehighest contributiontoGDPofanystateor territory.
Victoriaistheleaderinpremium foodandfibreproductsexports accountingfor27%ofAustralia’s foodandfibreexportsin201819.Inaddition,77%ofAustralia’s dairyexports,50%ofAustralia’s horticulturalexportsand32%of Australia’spreparedfoodexports comefromVictoria.
The largest service sector export is the international education sector. In 2018-19, education exports enjoyed 17% year on year growth. Tourism increased by 12% over the same period, indicative of a significant rise in international tourists and students choosing Melbourne as their chosen place to live, study and work.
Victoria is one of two Australian states to receive a triple-A credit rating from Standard & Poors and Moodys – a rating it has managed to retain for 18 years and a reflection of the economic performance that delivered 27 years of continuous economic growth.
One of the structural features of Western economies has been the decline of the manufacturing sector. Melbourne has been able to replace the job losses from this sector with faster growing knowledge-based service sector jobs. This has been a significant theme in the economy since at least the mid 1980’s and one of the success stories of Melbourne with 523,000 new jobs created between November 2014 and March 2020.
5
2.2 Victoria
$454.5 billion
Gross state product
23.3% 2.0 MELBOURNE
Percentage of Australian gross domestic product
'Lone person households are the fastest-growing household type'
Victoriarepresents3%ofAustralia'stotalland mass,yetaccountsfor23.3%ofnationalGDP
6
2.0 MELBOURNE
2.3
InfrastructureSpending
ThemostsignificantinfrastructurespendinginMelbourneisthePlan Melbourne2017-2050strategy Thisisametropolitanplanningstrategyto managethegrowthinthecityoverthenext29years.Itintegratesover112 actionplanstoaccommodateforpopulation,housing,andemploymentneeds.
MajorgrowthcorridorsintheSouthwest(Wyndham-Geelong),North(Hume) andSoutheast(Dandenong)willultimatelybeconnectedasaplannedeconomic triangle.
Majorinvestmentsinclude:
WestGateTunnelProject
Constructionontheprojectbeganin2018andcompletionisanticipatedfor 2025.ItinvolveswideningtheWestGateTunnelenhancingconnectivityfrom thesouth-westofMelbourneintotheCBD Theprojectisexpectedtocreate 6,000jobs.
MetroTunnelRailLink
The$11billionprojectconsistsoftwo9kilometretraintunnels,includingfive undergroundstationsfromSouthKensingtontoSouthYarra.Theconstruction periodwillresultintheemploymentof3,500people.Constructionbeganin 2018andisforecasttobecompletedby2025.Oncompletiontheprojectwill serviceanextra504,000commutersduringpeakhour

SkyRailProject
Thismulti-billiondollarprojectis aimedateasingtrafficcongestion throughoutthewholeofGreater Melbourne.75differingleveltrain crossingsarebeingremovedand liftedovera5-yearconstruction timeframe.Completionisexpectedto befinishedby2029
FishermansBendUrbanRenewal
Thelargesturbanrenewalproject inAustralia,theprecinctislocated 1kilometresouthwestoftheCBD. Over480hectareshasbeenrezoned forresidential,commercial,and retailspacestoexpandthecapital cityzone.Theareahaspotential toaccommodate80,000jobsand 80,000residentsby2050
7
2.0 MELBOURNE
2.4
Supply & Demand
The Melbourne property market can be best described as segmented. The result is, significant variation in property market gauges (supply, vacancy rates, time on market, yields and the like) when a suburb-bysuburb approach is taken.
The strong performance in Melbourne’s housing market and strain on affordability is driving demand for townhomes and apartments. This coupled with strong population growth in Metro Melbourne has seen medium and high-density dwellings tenanted and occupied quickly.
Melbourne had a vacancy rate pre COVID-19 of 2.8% as of April 2020, this spiked to 9.4% during the height of the pandemic in October 2020 but has since fallen back to 1.7%, indicating that Melbourne is undersupplied. With projected population increases exceeding those of other capital cities, Melbourne is challenged with the task of ensuring long term strategies are applied that will allow supply to match demand sustainably. Projections suggest that 1.6 million dwellings are required to keep up with population forecasts to 2031 - this will continue to drive demand.

8
2.0 MELBOURNE
9
3.0 MILL PARK
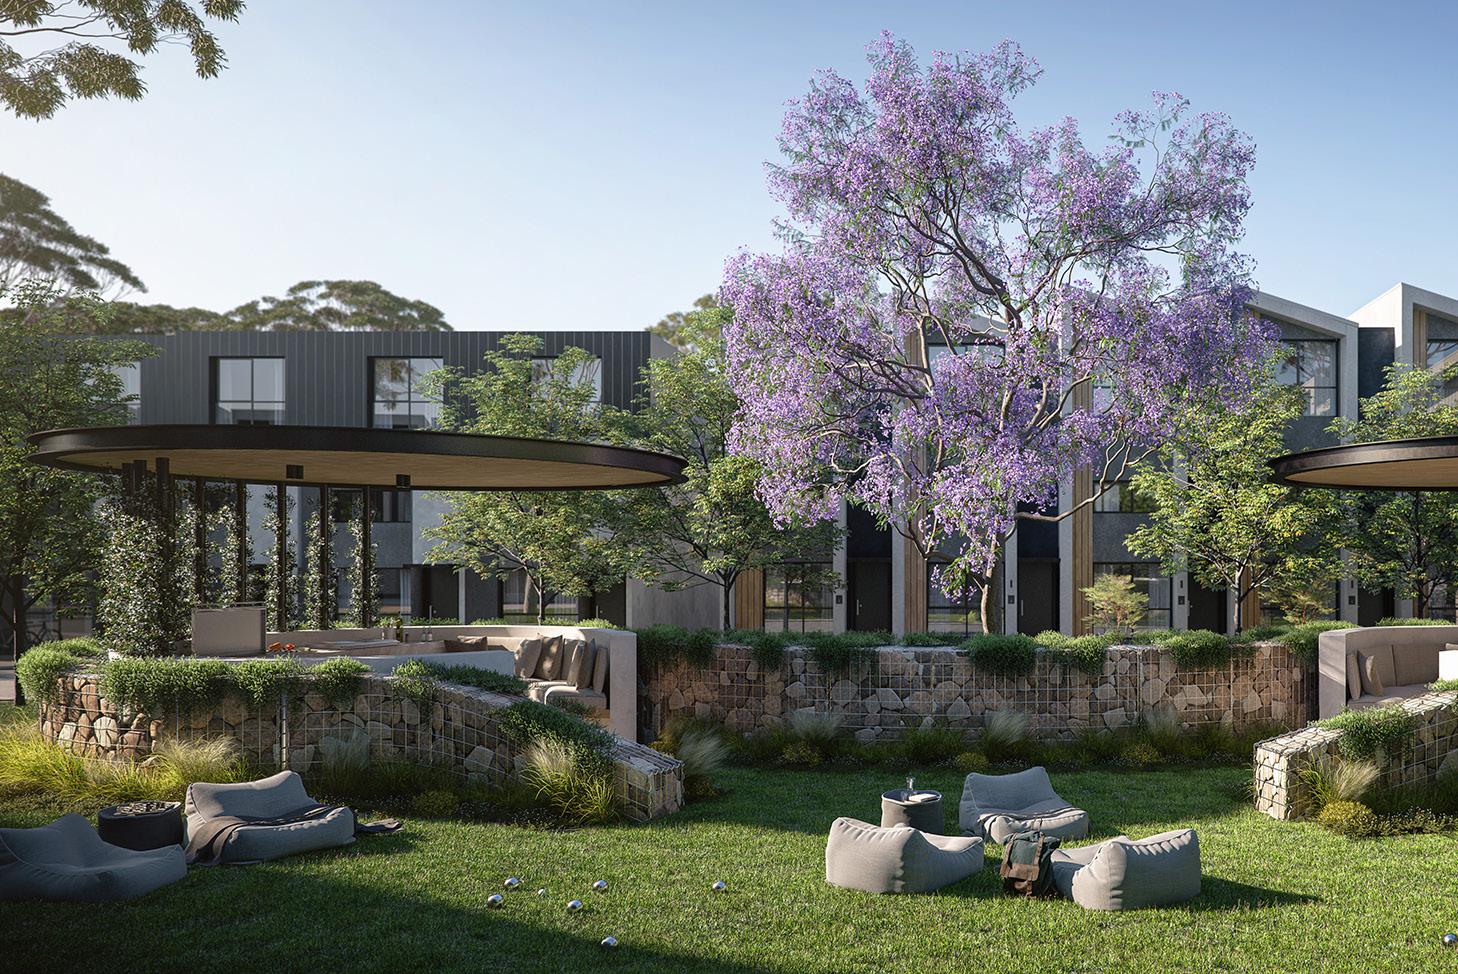
The Belmont Collection, Mill Park Central Park
MILL PARK 3.0
3.1
Population & Demographics
Located 18 kilometres northeast of Melbourne's CBD, with access to public transport, close proximity to a range of public and private schools. The City of Whittlesea population forecast for 2023 is 244,124 and is forecast to grow to 360,692 by 2041.
Mill Park had a population of 28,712 people, according to the 2021 census. It is forecasted to grow by 5.8% to have an estimated population of 30,391 by 2041. With the projected population growth dwellings are expected to increase by 4.8% as well over that period.
There is an over representation of couples without children (over 33.0 percent of local families), indicating a specific need for medium and highdensity dwellings. This is exacerbated by the fact that median house price growth has outpaced wage growth over the last four years.
The median house price is currently 54 percent higher than the median unit price. The price difference between houses and apartments will be a significant driver of apartment demand.
10
Population 28,712 Median age 40 Average household size 2.7 3.0 MILL PARK
Economics & Employment
Data presented by forecast.id displays that the Whittlesea City region currently supports a labour force of over 72,000 residents. The largest supporting industry currently being hospital (except psychiatric hospitals). A key driver for the regional health sector is the NorthPark hospital, located two kilometres south of Mill Park.
Mill Park’s local economy presents a healthy balance between white collar and trade services workers. The unemployment rate in Mill Park is 5.9%. This non-industry specific labour force enhances the stability of the local economy. The even spread of employment provides a
micro economy less volatile and susceptible to risks that would more heavily impact those reliant on manufacturing and mining.
The size of Mill Park’s labour force during the census period was 13,298, of which 31.8% were employed part-time and 56.0% were full time workers. Within Mill Park’s workforce, the hospital industry is the largest employer accounting for 4.8% of total employment followed by Supermarket and Grocery Stores (2.6%), Other Social Assistance Services (2.1%) and Primary Education (2.1%). The diversity of the
market’s employment base makes it less susceptible to unemployment risks.
Household structure in the suburb is well suited to apartment/ semidetached housing. As at the 2021 census, 51.8% of the Mill Park population were categorised as a lone person household or a couple family without children. Younger professionals increasingly tend to be time poor and generally require dwelling types with two or three bedrooms to accommodate their lifestyle. Matching the type of property to a particular market segment is critical to ensure continued rental demand in the future.
11
3.0 MILL PARK Gross
Product $9.90 billion Labour Force 13,298 Industry Profile White Collar
3.2
Regional
3.3
The Victorian Governments numerous public and private infrastructure plans encompass Melbourne’s north, and Whittlesea City Region. These initiatives include:
• Epping Central – Epping Central plays a major role in providing services, health, justice and education for the community, as well as retail and commercial opportunities. This includes the Northern Hospital, Pacific Epping Shopping Centre, Melbourne Polytechnic and the Epping Services Hub
• Plenty valley Structure Plan –The Plenty Valley Town Centre contains several important business, retail, community and transport activities including Westfield Plenty Valley and the South Morang Train Station. Large areas of undeveloped land within the centre provide developmental potential
• Thomastown Industrial Area –To build upon the Thomastown Industrial Area successes as a sought-after business hub and to facilitate employment growth through innovation and collaboration with stakeholders
• North East Link – The North East Link will run from the M80 through Banyule, join the Eastern Freeway at Bulleen, meet the East Link at Ringwood, and bring dramatic changes to Banyule. North East Link is the biggest ever investment in Melbourne’s north-east – changing the way people move around Melbourne. Victoria’s longest road tunnels will fix the missing link in our city’s freeway network, take 15,000 trucks off local roads a day and slash travel times by up to 35 minutes. They will also complete the Ring Road in Greensborough, overhaul the Eastern Freeway, build Melbourne’s first dedicated busway and the North East Trail –more than 34km of walking and cycling paths
12
Infrastructure Spending 3.0 MILL PARK
3.4
Supply & Demand
Vacancy Rates 0.8% Gross Rental Yield 4.25% Estimated time on market 30 days
The evolving demography of Mill Park has had direct impacts on the local rental market. The professional demographic that dominates the suburb’s landscape has inflated Mill Park’s tenant pool. According to ABS data, 22.8% of dwellings within Mill Park are rented.
Vacancy Rates
Yields
Implied gross rental yields for apartments were 5.2% and houses were 3.3% as of February 2023 according to data for SQM research. Townhouse rental yields can be deprived for an average between apartment and houses which sees yields for townhouses at 4.25%.
Time on Market
13
As of January 2023, the vacancy rate in Mill Park was 0.8%, well below the equilibrium level of 3%. Importantly, vacancy increase is fleeting indication that demand reacts quickly to new supply. This phenomenon has the effect of limiting rental market volatility by stabilising vacancy rates and smoothing rental cash flow (property that is vacant for less time and vacancy is minimised due to reactive demand). 3.0 MILL PARK
The uptake of residential supply in the suburb has been robust with an average day on market figure of 30 days, indicating the strong market sentiment in Mill Park.
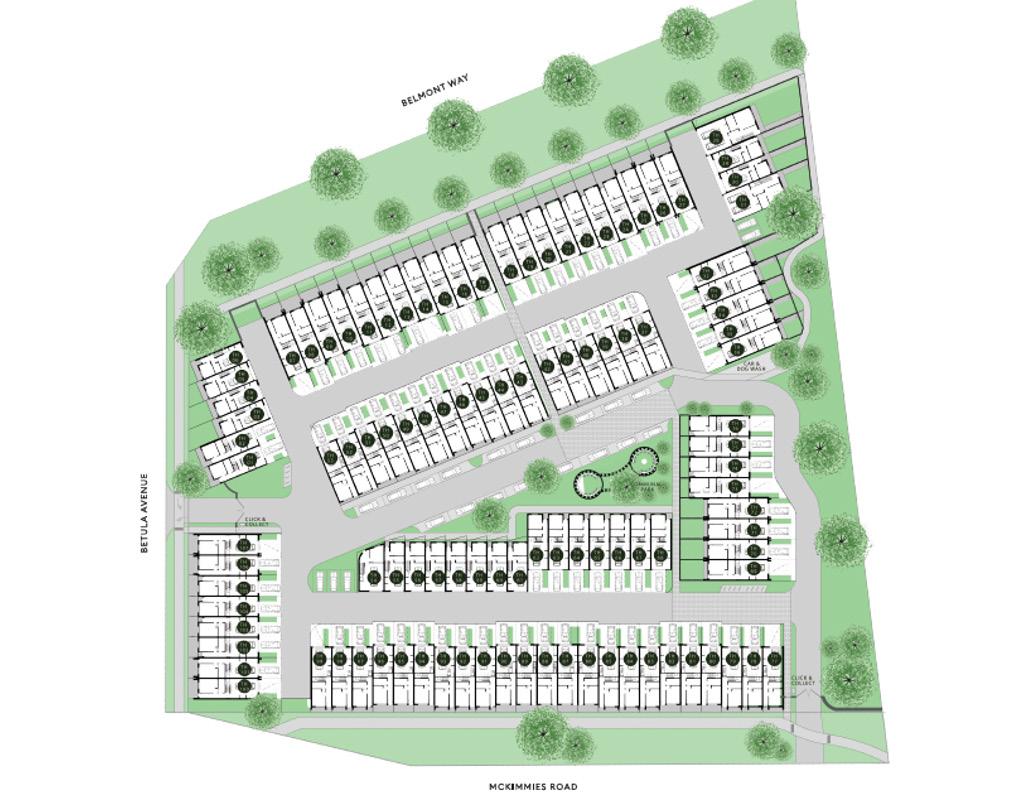
14 4.0 FLOORPLATE N
4.0 FLOORPLATE