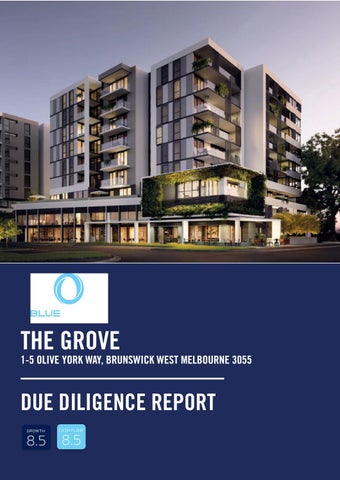
THE GROVE
1-5 OLIVE YORK WAY, BRUNSWICK WEST MELBOURNE 3055
DUE DILIGENCE REPORT GROWTH
8.5
CASH FLOW
8.5
DISCLAIMER
The information in this document is not investment advice. The information in this document has been published as an information service. The information contains general information and does not take into account any investor’s particular circumstances and needs. Each investor should consider whether the information is appropriate for his or her particular needs, financial situation and investment objectives. While the information provided by Blue Wealth Property is believed to be accurate, Blue Wealth Property does not accept responsibility for any inaccuracy or any actions taken upon reliance of the information in this report. No returns or performance is guaranteed. Any forecasts are dependent on the current market conditions and knowledge available at the time of producing this document.
Important Notices This information is subject to change without notice. Updated information can be obtained by contacting Blue Wealth Property on (02) 9743 0077 or their authorised Business Partner.
www.bluewealth.com.au Š Blue Wealth Property 2017 l 2
CONTENTS 04 05 06 07 12 14 15 16 20 21
PROJECT SUMMARY WHO IS BLUE WEALTH PROPERTY RESEARCH METHODOLOGY CITY OVERVIEW LOCATION OVERVIEW DEVELOPER PROFILE PROJECT DETAILS FINANCIAL ANALYSIS RISKS VISUALS
www.bluewealth.com.au © Blue Wealth Property 2017 l 3
PROJECT SUMMARY
• 323 Apartments Across 3 seperate buildings • One bedroom apartments priced from $469,000 • Two bedroom apartments priced from $595,000 • Developer has a strong track record of delivering high quality projects • Priced excellently for a high quality, superior product • Located 6km from the growing Melbourne CBD • Central to Mlebourne’s major transport nodes, Tertiary Education facilities and Employment hubs.
www.bluewealth.com.au © Blue Wealth Property 2017 l 4
WHO IS BLUE WEALTH PROPERTY?
Blue Wealth Property is a specialist research house that studies the Australian property market and identifies growth areas and investment opportunities. We are leaders in the industry. Our research methodology is the result of over a decade of experience and years of refinement. Our team has a proven track record in identifying investment properties that outperform the market, and by doing this we have helped thousands of Australians create wealth. Blue Wealth does not work directly with the public; instead we distribute our research and approved properties through a national network of business partners. This Due Diligence Report has been produced to provide our business partners and their clients with information to assist them in making their investment decisions.
www.bluewealth.com.au Š Blue Wealth Property 2017 l 5
RESEARCH METHODOLOGY
GROWTH CASH FLOW
Blue Wealth’s research methodology has been developed by a team of industry professionals and combines years of experience, study and analysis. It is the country’s most comprehensive, up-to-date research methodology. Our methodology adopts a ‘macro to micro’ approach and has three steps:
GROWTH
8.5
CASH FLOW
8.5
RATING: The Grove, Brunswick West Blue Wealth recommends the property based on the strong Growth and Cashflow potential
STEP 1 - MACRO RESEARCH This step uses marco economic analysis to identify geographical regions that are likely to experience strong capital growth. Our research indicates that the following factors impact the property market. • Employment and Economic Growth • Population and Demographic Changes • Infrastructure and Government Spending • Supply and Demand
STEP 2 - MICRO RESEARCH Once a region has been identified as having strong growth potential, Blue Wealth’s process of micro research is then conducted. Our micro research analysis includes: • Value • Transport • Quality • Design • Amenities • Rent
STEP 3 - BLUE WEALTH INDEX Every property is then rated on a scale of 1-10 for its potential • Growth • Rent Growth is the key for creating long term wealth, however, we recognise that many clients are sensitive to cash flow and as a result Blue Wealth only approves properties that have scored at seven or above for both these categories. The Blue Wealth Index provides investors with a simple way to compare investments and ensure they acquire properties most suitable for their portfolio.
www.bluewealth.com.au © Blue Wealth Property 2017 l 6
CITY OVERVIEW INTRODUCTION
POPULATION AND DEMOGRAPHICS
Australia’s second largest city and the capital of the state of Victoria, Melbourne is a leading financial centre in Australia as well as the AsiaPacific region. It is one of only two Australian cities, the other being Sydney, to feature on the Global Financial Centres Index of top rated centres of finance. It has been ranked the world’s most liveable city since 2011 (and has been in the top three since 2002), according to the Economist Intelligence Unit. If current trends prevail, Melbourne is projected to overtake Sydney as Australia’s largest capital city by 2051.
As of June 2013 Greater Melbourne had a population of 4.35 million, living in 1,660,305 dwellings with an average household size of 2.62. The rate of growth in Melbourne was larger than in any other capital city, with numbers swelling by 95,500, or 2.2 per cent, on the previous year. In the year to June 2013, Victoria addedthe largest number of people – 106,800 – followed by New South Wales (103,200) and Queensland (88,600).
Melbourne is an international cultural, sports and entertainment centre. The Southbank precinct is home to the Arts Centre, the Melbourne Theatre Company, Malthouse Theatre, Recital Centre and the National Gallery of Victoria. Federation Square, home to major cultural attractions, worldclass events, tourism experiences and an array of restaurants, bars and specialty stores, has become the city’s meeting place and cultural hub. In 2008, Melbourne became the second city after Edinburgh to be declared a UNESCO (United Nations Educational, Scientific and Cultural Organisation) City of Literature. The cities in that network promote the local creativity scene and foster UNESCO’s goal of cultural diversity. The city hosts major local and international sporting events, including the Australian Tennis Open, the BoxingDay test at the MCG, the Melbourne Cup, the Australian Formula One Grand Prix and the AFL Final Series.
Greater Melbourne accounted for 76 per cent of Victoria’s population, with regional Victoria experiencing a slight 0.8 per cent increase and some areas, including the north-west of the state, declining. Melbourne has been growing faster than Sydney over the past decade, according to the Australian Bureau of Statistics (ABS), and is set to become Australia’s most populous city in 2051, with 8 million people. To accommodate this growth, the city will require approximately 1.6 million additional dwellings than that currently available. Greater Melbourne is projected to account for more than 80 per cent of the state’s growth in the years to 2051. Population growth cannot be analysed in isolation. Equally important is an analysis of how the makeup of the population is changing and how it is likely to change in the future. Much government policy is based on the evolution of a population’s age structure, gender or living arrangements. The way we live provides policy makers with the information they need to plan for future demands for housing, land and infrastructure. An increasingly dominant proportion of Greater Melbourne households are occupied by one person (as of the 2011 census, 23.3 per cent) or occupied by couples without children (25.3 per cent). Between 2006 and 2011, households with either of these compositions witnessed a proportional increase in size at the expense of households made up of couples with children. From a practical perspective, this means that 48.6 per cent of Greater Melbourne households require only one bedroom.
www.bluewealth.com.au © Blue Wealth Property 2017 l 7
CITY OVERVIEW Australian Bureau of Statistics projections indicate that the proportion of lone person households will increase to 28 per cent by 2031, eventually making this component the second most common household structure in Greater Melbourne. In addition, couples without children households are projected to increase to 27 per cent. The trend toward smaller households of one or two people is driven by the ageing population, which contributes to an increased proportion of one and two person households, as well as the growing tendency for women to delay bearing children, instead focusing on career advancement. This is evidenced by the 18,000 person increase in young couples (15-44 years) without children between 2006 and 2011.
ECONOMICS AND EMPLOYMENT Greater Melbourne contributes the second largest proportion of share to Gross Domestic Product (GDP) (after Sydney) to Australia. With output in excess of $260 billion (2012-13), the region contributes 17.3 per cent of total Australian output and accounts for over 78 per cent of the $330 billion Victorian Gross State Product (GSP).
The growth in the ‘Professional’ and the ‘Financial Services’ industries can be attributed to investments made by the state government over the past two decades. Development of Southbank and Docklands provided the central business district with ‘Greenfield developments’ (Greenfield land is undeveloped land in a city or rural area either used for agriculture, landscape design, or left to evolve naturally) to accommodate significant levels of new employment, while road projects, such as the Western Ring Road, CityLink and EastLink, helped to improve connectivity across the city. In 2011, 1,927,927 people living in Greater Melbourne were employed, of which 66 per cent worked full time and 34 per cent part time. If recent trends continue, over 1.7 million new jobs will be created in Melbourne by 2051, with a large share based in the central city and adjacent inner suburbs. Melbourne’s evolution toward a professional and financial services centric economy resulted in there being more professionals in Greater Melbourne in 2011 than in any other occupation. At the same time, 13 per cent of the population earned an income of $1,500 or more per week in 2011, compared to 11.6 per cent of Victorian census respondents.
The most significant change to the Melbourne economic landscape in terms of magnitude of contribution to GSP has been the shift from an inwardly focused manufacturing economy to a globally focused, knowledge-based service economy. This evolution has allowed for a more diversified base of employment-generating industries, which has strengthened the resilience of the city’s labour market to external shocks and structural adjustment pressures. The figure below depicts the change in Greater Melbourne GDP contribution by industry between June 1992 and June 2012. Over this period, Melbourne slowly closed the gap on Sydney in terms of the income generated as the main hub for Professional and Financial Services in Australia. A decade ago the value of these two industries was $50 billion higher in Sydney than it was in Melbourne. In 2012-13 the gap was $25 billion.
Melbourne is home to the headquarters of many of Australia’s largest corporations, including five top ten firms in terms of revenue and four of the largest six in the country based on market capitalisation (ANZ, BHP, NAB and Telstra). The city is also home to Australia’s largest and busiest seaport, which handles more than $75 billion in trade every year
www.bluewealth.com.au © Blue Wealth Property 2017 l 8
CITY OVERVIEW (more than Adelaide, Brisbane and Fremantle ports combined, and around 50 per cent more than Sydney), and 39 per cent of the nation’s container trade.
INFRASTRUCTURE INVESTMENT The Victorian government has recognised infrastructure as the key to maintaining Melbourne’s status as the world’s most liveable city, now and in years to come. As a result, the ‘Plan Melbourne’ vision was conceived. Plan Melbourne is a policy adopted by the government that was designed to guide Melbourne’s housing, commercial and industrial development through to 2050. It seeks to integrate long-term land use, infrastructure and transport planning to meet the population, housing and employment needs of the future.
Some major Melbourne projects follow listed below. Approved
Plan Melbourne is an integrated land use and transport plan that will recognise the evolution of an Integrated Economic Triangle to be delivered by 2050. The Integrated Economic Triangle will connect the Hastings–Dandenong corridor with the Hume corridor to the north and the Wyndham– Geelong corridor to the south-west. It includes: • • • • •
An expanded central city East West Link and the North East Link Melbourne Rail Link (including the Airport Rail Link) CityLink-Tullamarine widening Outer Metropolitan Ring Road (which will connect Geelong and Avalon with the Hume Freight Corridor).
This dedicated approach to infrastructure is the result of intelligent and efficient planning policies that will cater for Melbourne’s sustained population and economic growth. The construction and implementation of these projects will in turn lead to more employment and population growth.
Melbourne Rail Link The $10 billion Melbourne Rail Link project is a planned rail project forecast to increase the capacity of Melbourne’s rail network by 30 per cent. The project will deliver a rail link to Melbourne Airport. It will also enable the delivery of 30 additional peak hour services across the network, moving 35,000 extra passengers. The project will deliver: •
• • •
•
Tunnels from Southern Cross Station to South Yarra as part of a new Frankston to Lilydale/ Belgrave line New underground stations at Fishermans Bend (Montague) and Domain New underground platforms at Southern Cross and South Yarra stations The Melbourne Airport Rail Link, connecting Melbourne Airport to Southern Cross Station and the Cranbourne-Pakenham corridor A package of tram and bus improvements to the Parkville precinct.
CityLink-Tullamarine Widening Upgrading CityLink from the West Gate Freeway to north of English Street on the Tullamarine Freeway will increase the road’s capacity by up to 30 per cent during peak periods.
www.bluewealth.com.au © Blue Wealth Property 2017 l 9
CITY OVERVIEW The $850 million project will add extra lanes in each direction between the Bolte Bridge and the Tullamarine Freeway just north of English Street, Essendon Fields as well as extra lanes on the Bolte Bridge and a section of the West Gate Freeway (eastbound) between Bolte Bridge and Power Street. The upgrade will save road users up to 16 minutes per trip between Melbourne Airport and the West Gate Freeway during peak periods. Construction of the extra traffic lanes commenced two years ago and is expected to be completed in quarter 4, 2018. The upgrade will be integrated with the East West Link. Fishermans Bend Urban Renewal Area The largest urban renewal area in Australia, located approximately one kilometre south-west of Melbourne’s Central Business District (CBD), sitting within the City of Melbourne and City of Port Phillip’s boundaries. The 250 hectare Fishermans Bend Urban Renewal Area has been declared a site of state significance and rezoned as part of an expanded capital city zone. This rezoning expands the capital city zone by more than 50 per cent and is expected to accommodate around 40,000 jobs and 80,000 residents. The Victorian government released the Fishermans Bend Urban Renewal Area Draft Vision and Interim Design Guidelines for community consultation. E-Gate Redevelopment Major Projects Victoria is undertaking feasibility and development delivery work of the 20 hectare E-Gate site. Located in West Melbourne, just 2 kilometres from the CBD, E-Gate will help support Melbourne’s projected growth by providing housing for up to 10,000 residents and 50,000 square metres of commercial and associated retail space. The potential inclusion of public facilities such as sports fields, a library and possibly a school will help to attract families, as well as the young and the old, to create a vibrant mixed community.
Current Projects Regional Rail link The $4.8 billion Regional Rail Link project (90 kilometres of new track) is a vital piece of infrastructure for the booming western suburbs and regional Victoria, and for passengers across Melbourne’s rail network. Dedicated regional tracks will be built from West Werribee Junction to Deer Park, then along the existing rail corridor from Sunshine to Southern Cross Station. When complete, passengers on the Geelong, Bendigo and Ballarat lines will have a streamlined journey through the metropolitan system. Regional Rail Link will create capacity for an extra 23 metropolitan and 10 regional services during each morning and evening peak period. This means capacity for an additional 54,000 passenger trips each day. Construction started in 2009 and is expected to be completed by 2016, with an estimated investment of $4 billion. Port Melbourne – Capacity Expansion A $1.6 billion project will expand Melbourne’s port capacity through the redevelopment of the operational areas of the port and establishment of a new container terminal and a world class automotive terminal at Webb Dock. The project will create 1,100 new direct jobs and 1,900 indirect jobs in the export, import and freight sectors. Completion is anticipated by late 2018. Melbourne Park Redevelopment The two-stage development with an expected cost of $750 million will completely overhaul Melbourne Park, transforming it into a world-class sporting venue. The redevelopment will contain more open space, increased seating capacity, better connections to public transport and the city, and easier movement into and within Melbourne and Olympic Parks. Stage one was completed as of 31st December 2016, with second stage works commencing in early 2017.
www.bluewealth.com.au © Blue Wealth Property 2017 l 10
CITY OVERVIEW SUPPLY AND DEMAND
area. It is estimated that the international student population of the Parkville campus of Melbourne University alone will reach 20,000 by 2020.
The Melbourne property market can be best described as segmented, with discontinuity on a suburb by suburb basis. The result is significant variation in property market gauges (supply, vacancy rates, time on market, yields and the like) when a granular (suburb by suburb) approach of analysis is taken. The size of Melbourne apartments have been shrinking, making them unsuitable for most local buyers. According to recent reports in the Australian Financial Review, the average size of a one bedroom apartment in 2009 was 60 square metres, whereas today it is between 42 and 45 square metres and falling. In addition, research by Oliver Hume shows that among fifty-eight apartment buildings being marketed across the City of Melbourne, one bedroom apartments are starting at 44 square metres (in floor space), dropping from 52 square metres in 2008. This represents a decrease of 11.5 per cent. One of the drivers of the declining apartment size is the magnitude of the student population in the
From an investor’s perspective, the declining size of the typical Melbourne apartment presents two problems if purchasing on the lower echelons of size. First, an investor’s exit strategy is limited by holding an asset that appeals to a single component of the market (other investors). Second, the majority of new supply conforms to the current expectations of sizing, meaning that there will likely be a scarcity component, and subsequent demandside pressure for new larger stock. In terms of rental supply, the Greater Melbourne Market remains balanced. Vacancy rates in the city as of June 2014 were 2.5 per cent, indicating an undersupply of rental stock. With projected population increases exceeding those of the other capital cities, Melbourne is challenged with the task of ensuring that long-term strategies are applied that will allow supply to match demand sustainably. This will include a range of urban consolidation projects within the inner city, as evidenced by those planned for Fishermans Bend and the E-Gate development.
www.bluewealth.com.au Š Blue Wealth Property 2017 l 11
LOCATION OVERVIEW - BRUNSWICK WEST INTRODUCTION
market, helping insulate it from localised economic volatility.
Brunswick West is located six kilometres and 20 minutes north from Melbourne CBD. Brunswick West enjoys the best aspects of inner-city living: walkability, cultural diversity, varied and interesting architecture and outstanding access to jobs, amenities and public transport. An appealing Bohemian lifestyle, within a close proximity to transport, markets and retail outlets have put Brunswick West in high demand for renters and owner occupiers alike. As of October 2017, the median price of a house in Brunswick West is $1,090,000 equating to 163 per cent premium to the median apartment price of $420,000. This disparity is at a ten-year high with the pre GFC premium having hovered around 77 per cent. As affordability becomes strained, demand for relatively more affordable accommodation, such as high density dwellings is likely to increase, placing price pressure in this segment of the property market.
The average Brunswick East resident is a 34 year old white collar professional with a median income that’s 10.1 per cent above the Greater Melbourne figure, living in an apartment or terrace with one other person. Per 2016 census data 34.6 per cent of Brunswick West residents were in the ‘young workforce’ category (aged between 20 and 34), compared to 30.4 per cent for Greater Melbourne. These young white collar workers contribute to Brunswick West’s economic and demographic diversity, as they provide a broader base in the local populations industries of employment.
ECONOMICS AND EMPLOYMENT Projections from the ABS indicate that over 1.7 million new jobs will be created in Melbourne by 2051, with a large share based in the centre of the city and surrounding inner suburbs. The City of Moreland generates employment for more than 42,672 Melbourne city residents and, as of 30th of 2016, has a Gross Regional Product of $5.303 billion. The Moreland has shifted away from Melbourne like manufacturing based economy to a service based one, as can be seen in the figure below (source: profile.id City of Moreland, what do we do, industries).
POPULATION AND DEMOGRAPHICS The City of Moreland population forecast for 2017 is 178,609; with projections the population will surpass 228,807 by 2036, an increase of 28 per cent over the next 21 years. Brunswick West is projected to be a strong population growth performer within the City of Moreland with the population forecast to increase a total of 25 per cent in the next 9 years (source: forecast.id population forecasts). The population of Brunswick West in 2016 was 14,159, living in 6,960 dwellings with an average household size of 2.2. As of 2016, 37.3 per cent of Brunswick West residents were attending a tertiary or technical institution, many of whom are enrolled in the nearby institutions of the University of Melbourne and RMIT. Per research provided by HSBC, 40 per cent of international mortgages have been located within five kilometres of a major university. This adds another dimension of diversification to the Brunswick West property
The workforce within Brunswick West shows wide variety with professionals and managers making up 45.6 per cent of the employed population. This ‘non industry specific’ profile is less susceptible to structural economic shifts that have a greater bearing on sectors such as manufacturing and industrial. This proportion has trended upward since the 2006 census, indicating the growing appeal driven by gentrification, proximity to the CBD, and increasingly favourable lifestyle amenity of Brunswick East to this demographic. Brunswick West benefits largely off its proximity to the Parkville employment cluster. The cluster, which employs over 32,000 people, has strengths in education, research, health, professional and technical industries, and significant parkland. This
www.bluewealth.com.au © Blue Wealth Property 2017 l 12
LOCATION OVERVIEW - BRUNSWICK WEST employment zone includes a number of leading institutions and organisations including the University of Melbourne, Victoria’s second-largest university (RMIT University), Monash University’s Pharmacy Faculty, global biotherapy industry leader CSL Limited, Royal Melbourne Hospital, Royal Children’s Hospital, Royal Women’s Hospital, the Australian Medical Association and the Bio21 Institute.
INFRASTRUCTURE INVESTMENT The Victorian government has recognised infrastructure as the key to maintaining Melbourne’s status as the world’s most livable city, now and in years to come. The Victorian Government detailed plans to spend $22 billion on infrastructure over a four-year period (2014-2018) and create 100,000 new jobs. The city received a perfect score of 100 for its infrastructure in the 2016 Economist Intelligence Unit Livability Report, where ongoing investment in Melbourne’s infrastructure was shown to be the key to keeping it one of the most leviable cities in the world and topping the index.
Brunswick West has been has been recognised as a place of dense cultural make up and an area of commercial appeal to the local residents. The area’s demographic has helped it develop into a social hub, containing impressive amenity within Melbourne’s northern belt. The directives of Brunswick West include: • Encouraging the consolidation of new and established retail and commercial structures throughout the area. • Providing a focus on growth within the health sector and rejuvenation in education and civic functions. • Improving access by walking, cycling and public transport to services and facilities for local and regional populations
networks and a train station in neighboring Brunswick. Lygon Street, which runs the length of the suburbs eastern boundary, contains more than 30 restaurants, bars and cafes and contributes to Melbourne’s reputation as a cultural hub.
SUPPLY AND DEMAND Building approvals in Moreland City hit a five year high as of the close of the 2015/16 financial year, driven by the demand for high density dwellings and rental accommodation. With projections by the Moreland City indicating the local population will increase by 46,000 by 2036, an additional 20,000 dwellings are required. With the population of Brunswick West projected to double by 2036, an additional 4,500 dwellings are required in the suburb alone over the next two decades. Yield Suburbs progressively north of Melbourne CBD enjoy higher rental yields. This is driven primarily by the fact that outer suburbs are yet to experience the price growth that inner suburbs have achieved (price growth has outpaced rental growth in the inner suburbs resulting in diminished yield). As of October 2017, the median rental yield for a two-bedroom apartment in Brunswick West is 4.5 per cent. All though this does not account for the premium that is achieved by new developments.The Gross weekly rental for 2 bed room units in Brunswick West as of quarter 4 2017, was $390. While 1 bed units were expected to acheive an implied $370 per week. Vacancy rate The rental market is highly supply responsive (absorbs supply quickly), indicating a high degree of demand elasticity. Supply induced vacancy rate spikes are generally short lived (approximately 3 months), allowing for relatively smooth cash flow (rental income). As of Ocotber 2017, the vacancy rate in Brunswick was 1 per cent, indicating a tightly held and demand heavy rental market.
Transport infrastructure in and around Brunswick West is well established with extensive tram
www.bluewealth.com.au © Blue Wealth Property 2017 l 13
DEVELOPER PROFILE
BLUE EARTH GROUP • Blue Earth Group is a property development group specialising in apartment projects • Local expert in the Melbourne market • Blue Earth have an exceptionally long track record of outstanding projects • Melbournes largest privately owned residential developement sales and marketing agaency • 2,000 apartment portfolio
www.bluewealth.com.au © Blue Wealth Property 2017 l 14
PROJECT DETAILS
THE GROVE, BRUNSWICK WEST
SIZE RANGE (INTERNAL)
1 bedroom apt
51 - 55sqm
2 bedroom apt
72sqm
PARKING & STORAGE
All apartments have a car space
ESTIMATED OUTGOINGS
Council & Water Rates
$2,500 p.a approx
Indicative Strata Levie
$1,700 - $2,200 p.a approx
Holding Deposit
$1,000
Deposit on Exchange
10% on exchange of contracts
Deposit Type
Bank Guarantee Cash (balance on completion)
CONDITIONS OF PURCHASE
www.bluewealth.com.au © Blue Wealth Property 2017 l 15
FINANCIAL ANALYSIS
The following Property Investment Analysis was undertaken by Blue Wealth Property and is provided as an estimate of the return and investment performance that can be expected given the following assumptions: • • • •
10 per cent deposit + costs (Stamp duty, legals & loan costs including LMI calculated at 2.5% of loan amount) 4.6 per cent interest only loan (conservative current fixed rate) 4 per cent annual vacancy rate 4 per cent capital growth rate
DEPRECIATION Depreciation is a powerful tool that can make a significant difference to an investors cash flow. When you invest in a property, each year there are certain items which will undergo ‘wear and tear’. For example the carpet in a brand new apartment may initially be worth $5,000, but the following year, due to wear and tear it may only be worth $4,500. This is a very simplistic way of explaining the concept of ‘depreciation’. In Australia we have a taxation system that allows investors to claim depreciation as a tax loss which has a significant impact on an investors cash flow. All types of income producing properties have substantial depreciation benefits available to be claimed as a tax credit. To explain depreciation in simple terms, consider a new apartment. Initially, the carpet in this apartment is worth $5,000 but the following year it is worth only $4,500, and so on. The reduction in this ‘value’ is regarded as an investment expense and is therefore currently able to be offset against the investors taxable income. This will have a significant effect on the Australian investor’s cash flow. The depreciation benefit to every investor will vary. Blue Wealth Property recommends that clients use professional Quantity Surveyors to produce a depreciation schedule. They will produce a report which outlines the depreciation that can be claimed each year. The following are indicative depreciation schedules that have been provided by BMT for this project.
www.bluewealth.com.au © Blue Wealth Property 2017 l 16
FINANCIAL ANALYSIS Property Investment Cash Flow Analysis - One bedroom apartment - Purchase $469,000 - First Year Investment Cost Purchase Price
$469,000
Purchase Costs
$25,710
Loan Costs
$550
Total Investment Cost (A)
$495,260
Loan Details Initial Cash Invested (B)
$46,900
Initial Loan Amount (A) - (B)
$448,360
Loan Type
(Int. Only) 4.6%
Interest Payments
$20,625
Total Loan Payments
$20,625
Closing Loan Balance
$448,360
Property Income and Expenditure Rental Income (C)
$20,261
Rental Expenses (D)
$5,983
Net Rental Income (C) - (D)
$14,278
Pre-Tax Cashflow Loan Interest (E)
$20,625
Pre-Tax Cashflow (C) - (D) - (E)
($6,347)
Tax Deductions Cash Deductions Loan Interest (F)
$20,625
Rental Expenses (G)
$5,983
Non-Cash Deductions Depreciation - Building ($234,500 at 2.5%) (H)
$5,863
Depreciation - Furniture, Fixtures & Fittings (I)
$6,524
Loan Cost write-off ($550 over 5 yrs) (J)
$110
Total Credit Calculation Present Taxable Income (K)
$50,000
$75,000
$100,000
Rental Income (C)
$20,261
$20,261
$20,261
Total Income (C) + (K)
$70,261
$95,261
$120,261
Rental Deductions (F) + (G) + (H) + (I) + (J)
$39,104
$39,129
$39,129
New Taxable Income
$31,157
$56,132
$81,132
Present Tax
$8,547
$17,422
$26,632
New Tax
$2,640
$10,755
$19,538
Tax Credit Or Rebate (L)
$5,907
$6,667
$7,094
Annual After-Tax (Investment) or Surplus (C) - (D) - (E) + (L)
$(440)
$316
$743
Weekly After-Tax (Investment) or Surplus
$(8)
$6
$14
www.bluewealth.com.au © Blue Wealth Property 2017 l 17
FINANCIAL ANALYSIS TAX DEPRECIATION SCHEDULE
www.bluewealth.com.au © Blue Wealth Property 2017 l 18
FINANCIAL ANALYSIS TAX DEPRECIATION SCHEDULE
www.bluewealth.com.au © Blue Wealth Property 2017 l 19
RISKS All investments involve risk. While drivers of growth and other attributes that have a positive effect on an investment have been analysed in depth, it is equally important to be aware of and understand the risks that could have an adverse impact on the investment’s performance. Following are some of the risks that investors should consider prior to investing in property:
5. Personal Risk Investment strategies will often depend on the income of the investor. Should there be a reduction or loss in the flow of income from the investor it may present a risk in the future ability to hold the investment. These risks may be managed through the appropriate use of income protection insurance, life insurance and trauma insurance.
1. Market Value Risks This risk relates to the risk of the investment failing to achieve the expected growth. Much of the information we have used in our analysis is predictive and the rate of return may be affected by known and unknown risks and uncertainties. This in turn could result in the re-sale value of the investment not achieving what is expected if the vendor chooses to sell during or following depressed market activity.
6. Interest Rate Risk Movements in interest rates can have a number of effects on an individual property investment. Specifically, an increase in interest rates may have an immediate effect on the costs of holding an investment property. Additionally, sustained interest rate rises may have a lagging effect in the form of reduced sales activity and property growth.
2. Construction Risks This is applied to properties purchased off the plan. Throughout such projects the developer may arrange finance facilities related to the land acquisition, development and construction of the project. This may result in issues arising in the delivery of the product on time and as specified on the contracted terms. Delays in the delivery period would result in opportunity costs as investors funds may not be able to be redirected to alternative investments. 3. Rental Yields Rental yields fluctuate and are affected by other market factors. They may go up or down depending on factors such as supply, demand, employment, investment in the area and the state of the overall residential market. 4. General Risks In addition to the risk factors specific to investment in property development projects, there are more general risks that can affect the value of an investment in the development, including: • • • •
The state of Australia’s and the world economies Movements in inflation and employment Changes in socio-economic factors Natural or man-made disasters.
7. Policy Risk Changes in government policy may affect both holding costs and the expected growth performance of specific property investments. This may result in additional expenditure in order to finance your portfolio and the expected returns. 8. Oversupply An oversupply in property will have effects on both achievable rents and growth performance. Due to the length of time typically required to construct medium and high density developments, the short term supply curve is inelastic. This means that property supply has an inherent inability to adjust quickly enough to meet demand. A sudden reduction in demand or an unexpected increase in supply may result in oversupply. Typically this risk is most acute towards the end of the property cycle. We do not foresee any short term risk of oversupply in the current market. 9. Settlement Risk Settlement risks may prevent the purchaser’s ability to settle on the property. Typically, these are related to difficulties in obtaining finance either through valuation shortfalls at the time of settlement or changes in the purchaser’s personal circumstances that result in the refusal of the purchaser’s credit application. This may result in the loss of the deposit or any monies owed to the developer. This risk may be managed by obtaining pre-approval of finance (for completed property) prior to exchange of contracts.
www.bluewealth.com.au © Blue Wealth Property 2017 l 20
VISUALS
www.bluewealth.com.au © Blue Wealth Property 2017 l 21
VISUALS
www.bluewealth.com.au © Blue Wealth Property 2017 l 22
VISUALS
www.bluewealth.com.au © Blue Wealth Property 2015 l 23