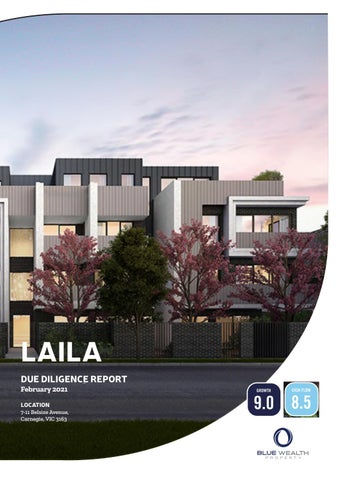
LAILA DUE DILIGENCE REPORT February 2021 LOCATION 7-11 Belsize Avenue, Carnegie, VIC 3163
Disclaimer The information in this document is not investment advice. The information in this document has been published as an information service. The information contains general information and does not take into account any investor’s particular circumstances and needs. Each investor should consider whether the information is appropriate for his or her particular needs, financial situation and investment objectives. While the information provided by Blue Wealth Property is believed to be accurate, Blue Wealth Property does not accept responsibility for any inaccuracy or any actions taken upon reliance of the information in this report. No returns or performance is guaranteed. Any forecasts are dependent on the current market conditions and knowledge available at the time of producing this document. Important Notices This information is subject to change without notice. Updated information can be obtained by contacting Blue Wealth Property on (02) 9743 0077 or their authorised Business Partners.
CONTENTS
CONTENTS Carnegie
01
1.0 Laila
10
3.0 Carnegie
10
3.1 Population & Demographics
03
2.0 Melbourne
11
3.2 Economics & Employment
04
2.1 Population & Demographics
12
3.3 Infrastructure Spending
05
2.2 Economics & Employment
13
3.4 Supply & Demand
07
2.3 Infrastructure Spending
08
2.4 Supply & Demand
14
4.0 Floorplate
15
5.0 Renders
19
6.0 Pitard Group
1.0 LAILA
1.0 LAILA Project Details • Located 15 kilometres from the
Number of dwellings
CBD, Carnegie is situated in
35 apartments
Melbourne's highly sought after
Price ranges
south-eastern suburbs • Carnegie is a vibrant hub in Melbourne’s south east, home to several award winning eateries • Suburb represents great access
1 bedroom, 1 bathroom, 1 car space: from $560,000
Size ranges 1 bedroom, 1 bathroom, 1 car space: 54 - 70sqm
Project Status
to public transport nodes, major
Completed
arterial roads, variety of major
Estimated outgoings
health and educational facilities
Council & Water Rates: $2000 p.a approx
• Great restaurant & Café culture
Indicative Strata Levies: $1300-$2400 p.a approx
throughout suburb, particularly on Koornang Street, home to some of Melbourne’s top eateries
Conditions of purchase Holding Deposit: $1,000 Deposit on Exchange: 10% on exchange of contracts Deposit Type: Cash and Bank Guarantee (balance on completion)
1
1.0 LAILA
Laila Carnegie, Victoria
2
2.0 MELBOURNE
2.0 MELBOURNE Victoria
‘Melbourne was voted the world's most liveable city for seven years running' Melbourne is Australia’s second largest city and voted the world’s most liveable city for seven consecutive years by the Economist Intelligence Unit. This comes down to a unique combination of diverse demographics, strong sports, entertainment and café culture and well-planned transport systems and infrastructure. The Melbourne property market has a rare structure, with varying growth rates on product type (houses and apartments) and location making it difficult to place the city on the property clock. Broadly speaking, Melbourne’s housing market performed strongly between 2012 and 2017 – with only Sydney recording a higher growth rate. The markets segmented nature means each region must be assessed on its individual merit. The division in the market exposes opportunities and the sub-markets best representing growth potential.
3
2.0 MELBOURNE
‘By 2031 Melbourne is
2.1
projected to overtake Sydney as Australia’s most populous city’
Population & Demographics As of August 2018, ABS reported
is based on the evolution of a
that the population of Greater
population’s age structure, gender
Melbourne reached 5 million
or living arrangements. The way we
residents. Melbourne has added
live provides policy makers with the
over 120,000 new residents each
information they need to plan for
year for the past three years – the
future demands for housing, land and
highest of any Australian city.
infrastructure.
With population growth like this, Melbourne needs to add 45,000 new dwellings per year, or nearly 1,000 per week. A record 18,000 Australians migrated to Victoria in 2017, largely because of housing affordability and job creation. Melbourne has been growing faster than Sydney over the past decade, according to the Australian Bureau of Statistics (ABS), and is set to become Australia’s most populous city by 2031. To accommodate for this growth, the city will require an additional 1.6 million dwellings.
The current household size of 2.7 people and the growing proportion of lone person households suggest that the dwellings required could be provided through apartment development. As at June 30th 2018, the lone person household and coupled families without children make up 49% of Greater Melbourne’s population. This means that half of Greater Melbourne’s households are well suited to apartment living. The number of lone person households is projected to grow 59% by 2031, the fastest of the varying household
Assessing the population structure
types. Strong house price growth in
and how this may change in the
Melbourne’s metropolitan areas is
future is critical to understanding
likely to strain affordability and result
where the demand for property
in an increase in demand for more
will come from. Government policy
affordable apartment dwellings.
4
2.0 MELBOURNE
2.2
Economics & Employment
Victoria
Gross state product
Percentage of Australian gross domestic product
$385.9 billion
23.6%
Melbourne has solidified its position
The Melbourne economy is
Over the last 5 years, Victoria has
as Australia’s strongest economic
continually shifting away from the
added more jobs than any other state.
performer, now boasting the
manufacturing based industries into
According to data from the federal
country’s highest contribution to
the less volatile professional services.
government, Victoria’s employment
the GDP. According to Commsec’s
This has been the most significant
base increased by 100,200 jobs in
quarter 4, 2018 State of States
change to Melbourne's economy.
the 12 months to 2018. This job
report it also recorded 3.3% annual
The evolution has allowed for a more
creation was dominated by full
GSP growth making it the nation’s
diversified base of employment-
time employment signifying the
top performer. A solid indicator
generating industries, which has
strength of the diversified economy.
for the strength of state economy
strengthened the resilience of the
In the five years between 2017 to
is the acceleration in retail trade.
city’s labour market to external
2022, federal statistics forecast
Over the past 12 months, retail
shocks and structural adjustment
Victorian employment to increase
trade has grown by almost 5%, in
pressures.
8.8% - outpacing that of the national
a performance outpacing all other states.
5
average.
2.0 MELBOURNE
Victoria’s gross state product grew by 3.3% over 2018, making it the country's top perfromer
6
2.0 MELBOURNE
2.3
Infrastructure Spending Melbourne has been nominated as the world’s most liveable city seven out of the last eight years. The Victorian Government maintains that the key to upholding this status rests upon infrastructural investment as a driver. To proactively plan for future needs, while implementing innovative visions the ‘Plan Melbourne’ vison was conceived. The plan that extends its vision through to 2050, is structured to design Melbourne’s housing, commercial and industrial development for future levels of need.
Sky Rail Project This multi billion project is aimed at easing traffic congestion throughout the whole of Greater Melbourne. 75 differing level train crossings are being removed and lifted over a 5 year construction timeframe.
The plan integrates over 112 future action plans to accommodate for future
Completion is expected to be finished
population, housing and employment needs. Major growth corridors in the
by 2022.
Southwest (Wyndham-Geelong), North (Hume) and Southeast (Dandenong) will ultimately be connected as a planned economic triangle. Major investments
Fishermans Bend Urban Renewal
include:
The largest urban renewal project in Australia, the precinct is located
West Gate Tunnel Project Construction on the project begins in 2018 and completion is anticipated for 2022. It involves widening the West Gate Tunnel enhancing connectivity from the south west of Melbourne into the CBD. The project is expected to create 6,000 jobs. Metro Tunnel Rail Link The $10 billion project consists of two 9 kilometre train tunnels, including five underground stations from South Kensington to South Yarra. The construction will result in the employment of 3,500 people. Construction will began in 2018 and is forecast to be completed by 2020. On completion the project will service an extra 35,000 commuters during peak hour.
7
1 kilometre south west of the CBD. Over 250 hectares has been rezoned for residential, commercial and retail spaces in an attempt to expand the capital city zone. The area has potential to accommodate 40,000 jobs and 80,000 residents.
2.0 MELBOURNE
2.4
Supply & Demand The Melbourne property market
high-density dwellings tenanted
can be best described as segmented,
and occupied quickly. Melbourne
with discontinuity on a suburb by
had a vacancy rate of 2.9% as of
suburb basis. The result is, significant
August 2019, with 3% indicating a
variation in property market gauges
balanced market, as a result Greater
(supply, vacancy rates, time on
Melbourne is heavily undersupplied.
market, yields and the like) when a
With projected population increases
granular (suburb by suburb) approach
exceeding those of other capital
of analysis is taken.
cities, Melbourne is challenged
The strong performance in Melbourne’s housing market and strain on affordability is driving demand for townhomes and apartments. This coupled with strong population growth in Metro
with the task of ensuring long term strategies are applied that will allow supply to match demand sustainably. Projections suggest that 1.6 million dwellings are required to keep up with population forecasts to 2031.
Melbourne has seen medium and
8
3.0 CARNEGIE
Carnegie, Victoria
9
3.0 CARNEGIE
3.0 CARNEGIE 3.1 Population & Demographics Population growth
Median age
Average household size
21,000 new residents by 2036
34
2.3
City of Glen Eira is forecast to
34 years old an employed in white
There is a strong presence of couples
experience population growth of
collar occupation. Over 40% of the
without children (making up over
13.49% per cent to 180,626 by 2036,
local workforce are employed in
41.4% of local families) indicating the
equating to approximately 801 new
either a professional, or managerial
specific need for apartment supply,
dwellings per year. The LGA
role - indicating the strength of
particularly in an area where median
development guidelines restrict the
the local tenant pool. The average
house prices have performance
density of future development. This
household size of 2.3 indicates that
strongly over the last 5 year period.
will ensure demand is high for the
both one and two bedrooms are
The significant disparity between
existing homes and new dwellings
suited to the market demographic.
house and apartment prices will be a
which offer an affordable option for a down sizers demographic.
According to ABS data, over 44.4% of dwellings within Carnegie are rented
According to the Australian Bureau
(a statistic higher than the Australian
of Statistics census data, Carnegie
and Victorian state average)
has a population of 20,050 living in
highlighting the suitability of rental
8,907 dwellings with an average
tenure within the suburb.
household size of 2.3. The average resident is a
major driver for apartment demand. Currently, median house prices are on average 118% more expensive than median unit prices. Continued strain on housing affordability will likely transition demand from housing stock, to apartment dwellings over the long term.
10
3.0 CARNEGIE
‘Median personal incomes in Carnegie are 12.9% higher than the Victorian state average’
3.2
Economics & Employment
11
Gross Regional Product
Industry Profile
Income Growth
$5.55 billion
White Collar
12.9%
The employment profile of Carnegie
The size of Carnegie’s labour force
is dominated by affluent white
during the census period was 9,338,
collar workers. The average weekly
of which 2,809 were employed
personal income is $727, a figure
part-time and 5,470 were full
12.9% higher than the Victorian
time workers. Within Carnegie’s
median household income. The most
workforce, no industry makes up
common occupations in Carnegie
more than 5% of total employment.
are reflective of a prosperous high
With the Computer System Design
earning demographic. The most
and Related Services
common occupations in the suburb
largest portion of residents (4.8%)
include Professionals, Managers and
followed by Hospitals (3.7%) and
Administrative workers – over 40%
Cafes and Restaurants (3.7%). The
of the local workforce identified as
diversity of the market’s employment
holding these occupation types as of
base makes it less susceptible to
the 2016 census.
unemployment risks.
employs the
3.0 CARNEGIE
3.3
Infrastructure Spending The Victorian Government continue to invest in strengthening the state’s infrastructure. Understanding the extent of the population growth that Melbourne is experiencing, it is critical that sufficient infrastructure is in place to accommodate for the demand of future residents. Numerous public and private infrastructure initiatives are being implemented throughout the Melbourne, particularly within City of Glen Eira. These initiatives include:
•
Monash Freeway – The second
•
Swim Centre redevelopment –
•
Monash Masterplan – Like cities
stage of construction on the
The $51 million redevelopment
and towns, our campuses need
Monash Freeway upgrade has
of Carnegie Swim Centre is an
to be planned. The Monash
begun, with the centre median of
important project that will boost
Masterplan provides a vision and
the corridor transformed into a
the local economy and provide
framework to guide the physical
work site. The $1.4 billion project
many jobs.
development of our campuses
received an additional $367.5
over the next twenty years.
million in September 2020.
12
3.0 CARNEGIE
3.4
Supply & Demand
Vacancy Rate
Forecasted Dwellings
Estimated time on market
5.9%
10,787 by 2036
27 days
Vacancy rates are an excellent
Carnegie’s housing market has
The suburb possesses an even spread
measure of rental demand within
performed consistently over the
of dwelling tenure, 44.4% are rented,
property markets. A balanced market
last 5 years, with current median
26.2% are owned outright and 26.2%
is likely to present a vacancy rate of
house price of $1.354million. This has
are occupied with a mortgage. With
3% this allows for the natural vacation
been credited to strong population
housing affordability increasing in
and uptake of rental properties.
growth and significant levels of
Carnegie (median house price has
Generally, the north – western region
infrastructure spending creating
risen above $1.354million), there lies
of Melbourne has maintained low
demand for property. The strain
an opportunity in the market for high
vacancy rates and is tightly held by
of affordability and rapidly rising
– end rental tenure.
local residents. As of December 2020,
house prices has created a unique
Carnegie possesses a vacancy rate
investment opportunity for the
of 5.9 % which is due to COVID 19
apartment market, as residents
creating an oversupply in the area,
continually opt for more affordable
in early January 2020 vacancy rates
housing options.
where at 1.4%.
13
4.0 FLOORPLATE
4.0 FLOORPLATE N
14
5.0 RENDERS
5.0 RENDERS Laila
Building Exterior Leila, Carnegie
15
5.0 RENDERS
Bedroom Leila, Carnegie
Bathroom Leila, Carnegie
16
5.0 RENDERS
Living and Kitchen Area Leila, Carnegie
17
5.0 RENDERS
18
6.0 PITARD GROUP
6.0 PITARD GROUP Pitard Group has been built on our commitment to quality and innovation, and our team brings unmatched skill, vision and dedication to everything we do. By collaborating as one unit, we seek to create unique places that foster a greater sense of health and wellbeing for those who inhabit them. Our expertise extends to all areas of acquisition, feasibility, design and development, construction, sales and property management. We specialise in all facets of development, from land acquisition to construction, sales and property management. With a history spanning more than two decades, we have garnered a trusted reputation for our fastidious attention to detail, exceptional quality of products and deep community focus.
19
6.0 PITARD GROUP
Matilda on Maude Pitard Group
20
Level 2, 8 Australia Avenue, Sydney Olympic Park, NSW 2127 P: +61 (0)2 9743 0077 | E: enquiries@bluewealth.com.au | W: www.bluewealth.com.au