
MARKET UPDATE IN THE CAROLINAS
From extreme escalation and variable lead times to rising interest rates and an economic slowdown, we continually monitor the ever-changing conditions and leverage our trusted industry partner relationships. Our goal is to be a resource to provide clarity to our partners during these uncertain times.
KEYS TO SUCCESS
Over the past six months, government-funded infrastructure upgrades and stateside manufacturing projects fueled overall construction spending. Significant investments in infrastructure will remain as many organizations focus on security and reliability after recent attacks on the electrical grid. At the same time, rising Federal interest rates and a tight lending environment have led many developers to press pause and companies to hold capital, resulting in a private spending slowdown that is anticipated to continue through the next Presidential election.
Our market insight report incorporates information from industry partners, historical cost data, and numerous reliable local and national publications and sources. Trends across the country indicate that escalation is starting to level off and go down for many trades, material lead times are improving, and raw material shortages are continuing to impact the supply chain for mechanical and electrical infrastructure.
US CONSTRUCTION SPENDING
$1,809.8 B
US CONSTRUCTION SPENDING BY TYPE
NOVEMBER 2022 VS. NOVEMBER 2021
$1,681.0 B
Construction spending during December 2022 was estimated at $1,809.8 billion, 1% above the June 2022 estimate. Substantial increases in lodging, manufacturing, and public spending over the past six months have driven construction spending up overall.
US Census Bureau
DRIVERS FOR HEADLINE SECTORS
SECTOR SHORT-TERM DRIVERS LONG-TERM DRIVERS
» Borrowing costs
» Output trends in relevant sector
US CONSTRUCTION SPENDING BY SUB-TYPE
DECEMBER 2022 VS. DECEMBER 2021
NONRESIDENTIAL
» Population trends
» Capacity utilization
» Employment in relevant sector
» Disposable income
» Unemployment rate
» Household liabilities
RESIDENTIAL
» Output trends in relevant sector
» Employment in relevant sector
» Next presidential election
» Infrastructure upgrades
» House prices
» Incomes
» Mortgage interest rates
» House prices
» Population trends
In the past six months, building costs, material costs, and skilled and common labor costs have declined, driving total construction costs down by 2.7%. Labor costs will likely remain steady in 2023, with continued low construction unemployment and high demand.
JANUARY 2023 VS. JANUARY 2022

CONSTRUCTION UNEMPLOYMENT
The 4.4% unemployment rate for the month of December 2022 was the lowest rate on record for the industry dating back to 2000.
US Bureau of Labor Statistics (BLS)
December 2022
4.4% CONSTRUCTION UNEMPLOYMENT
The unemployment rate represents the number of unemployed as a percentage of the labor force. 5% is considered full employment for the construction industry. Any percentage less than this represents a strong need for labor.
ARCHITECTURE BILLINGS INDEX
An index value > 50 represents that architects have reported more activity for that particular metric than the prior month. These metrics are leading indicators as the Architecture Billing Index (ABI) reflects projects in design that will enter the construction phase in 9 to 12 months and the New Project Inquiry Index (NPII) reflects new project demand from owners to potentially enter the design phase.

Activity in December 2022 was lower than the prior month in all regions across the country. While actual design activity has waned versus previous levels, it is interesting to note that demand remains healthy, which indicates elevated interest rates negatively impacting demand.
(ABI)
December 2022
Activity has decreased for 3 months in a row, after 20 consecutive months of growth, indicating construction starts in the next 6-9 months may slow, however, with the New Project Inquiry index at 52.3, a rebound is likely to come.
47.5 ARCHITECTURE BILLINGS INDEX (ABI)
45.2
Commercial/ Industrial
47.3 Institutional
48.8 South Region
52.3 New Project Inquiry
With higher interest rates, private funding for large projects is slowing, but on the contrary, government funding for large projects has increased significantly. Current backlogs are driven by greater than 20% year-over-year increases in healthcare, water supply, sewage and waste disposal, and conservation projects.
Associated Builders and Contractors, Inc. (ABC) Backlog Indicator
December 2022
US Census Bureau
February 2023
BACKLOG BY REGION
7.2 MONTHS
11.5 MONTHS
BACKLOG BY COMPANY
The South region represents the strongest backlog and the highest growth over the past six months and has held the top spot since Q2 2017 (23 straight quarters)
BACKLOG BY INDUSTRY
9.4 MONTHS (0.0)
Commercial/ Institutional
8.2 MONTHS (+0.5) Heavy Industrial
10.0 MONTHS (+2.1) Infrastructure
The growth in backlog for heavy industrial and infrastructure is being driven by public funding to improve infrastructure and the increase in state-side manufacturing
INDUSTRY TRENDS & INSIGHTS
INDUSTRY TRENDS & INSIGHTS
In the Carolinas as of February 2023
COMMON THEMES
» The decrease in residential construction is anticipated to help improve workforce and material availability for the commercial market
» Cost of living inflation, wage compensation, and competition for skilled labor continues to escalate labor costs across all trades
» Owners and developers have started to plan in advance in anticipation of long lead times, which has allowed projects to stabilize
» Many manufacturers are still catching up on lengthy backlogs, causing lead times to remain higher than typical pre-pandemic lead times
» Metal costs are directly impacting several scopes of work, including sitework, structure, and MEP
» Most material escalations and lead times are returning to pre-pandemic trends
EARTHWORK & DEMOLITION
» Sitework materials are stabilizing overall, with some material prices increasing at slower rates than experienced in 2022
» Owners and developers have gained a better understanding of schedule and lead time challenges, which has led to improved early planning on projects
» Workforce availability for sitework continues to be a challenge
» With increased development, it is prudent to schedule earthwork early to ensure equipment and crews are available
» The current decrease in residential site development may positively impact workforce availability and material supply
CONCRETE
» Over the past six months, rebar prices are stabilizing and are even trending down slowly
» Rebar suppliers continue to hold pricing for only 10-15 days
» Concrete is now readily available, eliminating the need to order in advance
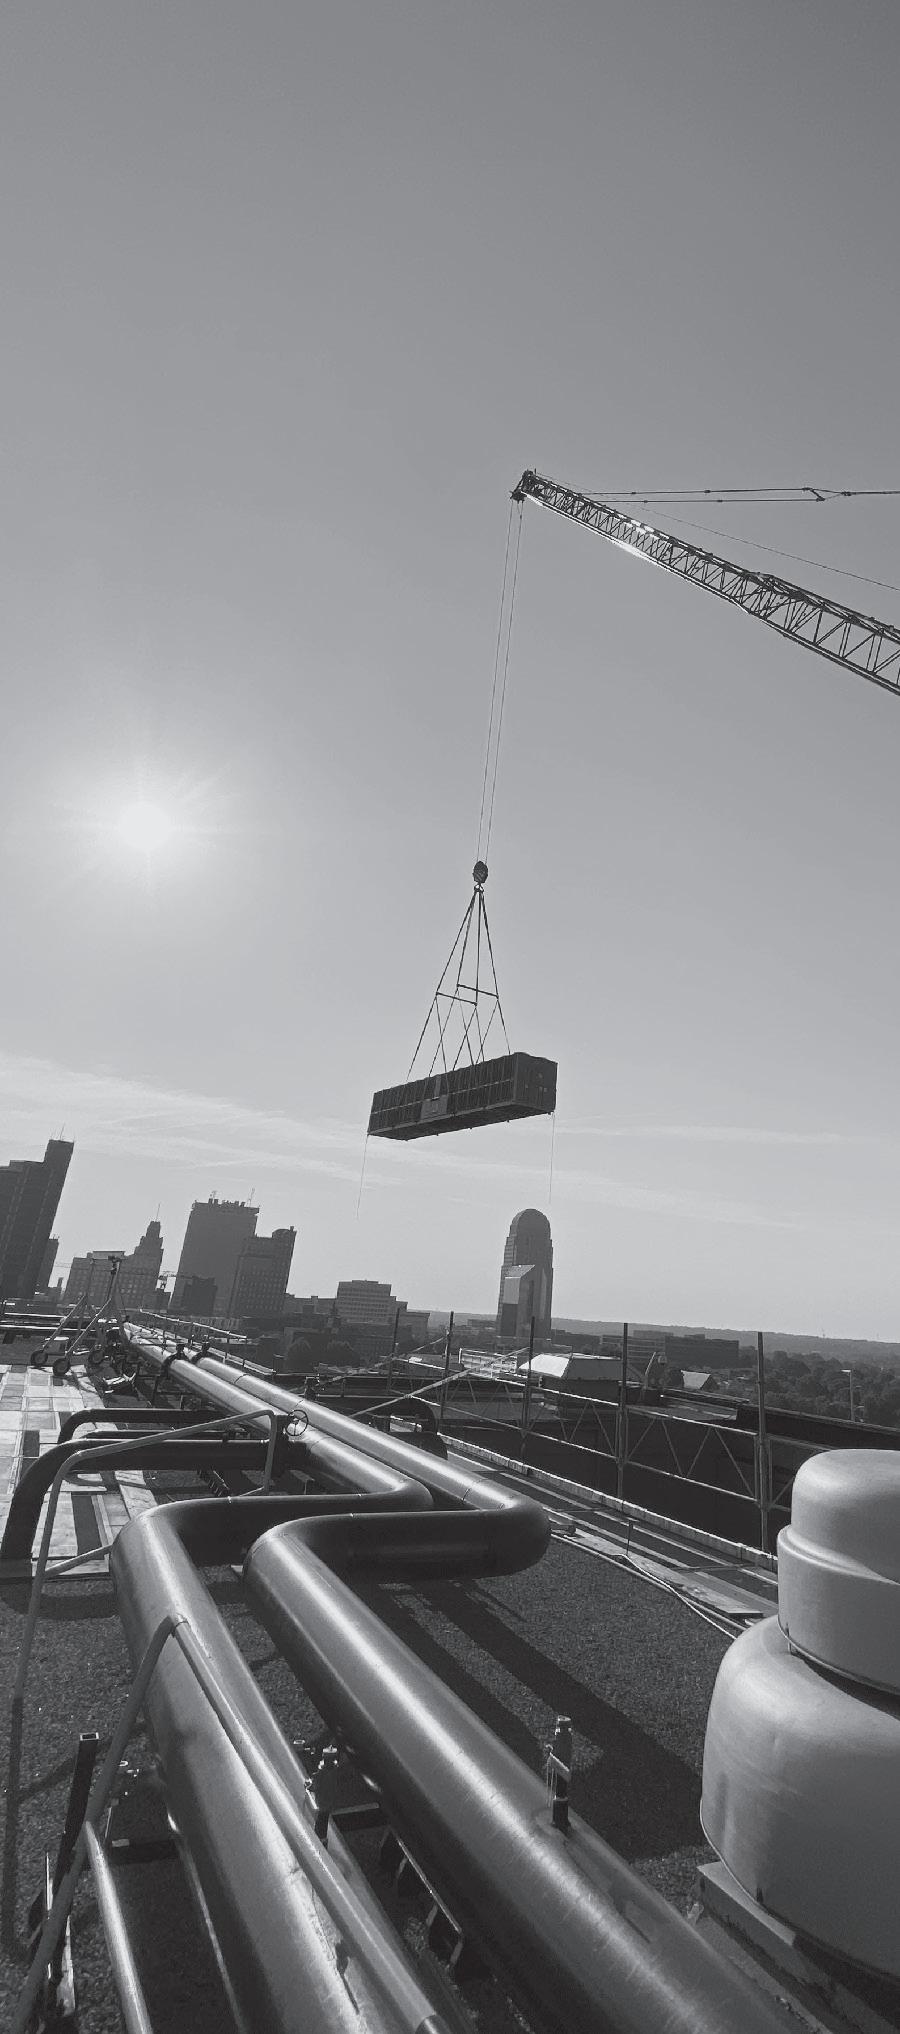
» Concrete pricing is still escalating slowly, and trends indicate prices will continue to increase in 2023
» Transportation costs have risen slightly, but at a much slower pace than experienced six months ago
INDUSTRY TRENDS & INSIGHTS
In the Carolinas as of February 2023
STEEL & MISCELLANEOUS METALS
» After unprecedented highs, steel prices have started to come down slowly over the last four months and have been stable for a while, but some costs are creeping back up
» Lead times on steel, joists, and decking are back to pre-pandemic norms, with smaller projects at 16-18 weeks and more extensive projects at 24 weeks
MILLWORK & LAB CASEWORK
» Plywoods, laminates, and hardware costs have continued to increase, with Wilsonart laminates and solid surface products experiencing the latest increase in December 2022
» Typical 2-3% increases in material prices are expected to occur periodically in 2023
» Domestic sheet goods and lumber prices have not decreased, and there are no signs indicating that prices will come down in 2023
» Nationally, cabinet hardware manufacturers have increased prices the most, especially for higher-end hardware
FRAMING, WALL BOARD & ACOUSTICAL PRODUCTS
» Price increases on gypsum board, joint compound, insulation products, and glass/specialty products have been experienced over the past six months and are anticipated to keep trending up in 2023
» Cost impacts on gypsum board due to the shortage of synthetic gypsum used for sustainable building initiatives have caused coal-fired plants east of the Mississippi to shut down and for more expensive alternatives to be imported from Nova Scotia, Canada
MASONRY
» Labor rates have increased 4-5% in the past year but appear to have leveled out for the time being
» Brick prices increased 5-10% over the past year and are expected to rise another 5% in 2023
» Getting manufacturers to make the brick products needed has become challenging, resulting in increased lead times
» Cement-based products (CMU, grout, and mortar) have increased ~5% over the past year and have gone up another 10-14% in Q1 2023
» Cement-based products are readily available
» Along with high demand, competitors are competing to attract and retain talent, causing price impacts on labor costs
» Product lead times have increased but seem to be stabilizing since most manufacturing facilities are back at full capacity
» The slowdown in residential construction has benefited the gypsum board supply for the commercial market, thus combating continued price increases
» Labor costs have experienced incremental increases
» Metal framing prices are anticipated to remain stable or possibly decrease but will not return to pre-pandemic levels
» Insulation costs are expected to remain steady in 2023
» Lead times have declined but are still longer than lead times proceeding the pandemic; however, they remain volatile and random at times tracing back to supply chain issues and labor shortages
ROOFING
» In the past six months, labor prices have increased, but material prices overall are stabilizing
» Lead times have greatly improved compared to Q1 of last year, with ISO and TPO currently at four months, depending on the quantity
» Price increases will return to the typical ~3-5% each quarter
DOORS, FRAMES & HARDWARE
» Except for wood door price increases, pricing for materials and labor have remained steady for the past six months
» Door hardware prices have escalated on average ~8% over the past six months, and prices are expected to continue to climb in 2023
» Lead times are still increasing but are expected to improve in 2023 slowly
» Lead times for electrified hardware currently range from 6-8 weeks up to 20+ weeks, depending on specifications, which is a vast improvement from 25-28 week lead times experienced six months ago
» Although offset by increased labor costs, ACT tile and grid pricing has stabilized, and material increases are expected to be within the typical 3-5% range per quarter in 2023
INDUSTRY TRENDS & INSIGHTS
In the Carolinas as of February 2023
GLASS/GLAZING
» Over the course of two years, there has been a 50% increase in the cost of aluminum materials, certain types of door hardware, and glass due to energy surcharges from manufacturers in direct correlation to propane and fuel cost increases for production and transportation of products
» Glass prices have generally remained steady with no significant increases instated; however, caulking and miscellaneous goods have risen slightly in the past few months
» Lead times for glass have remained long, and there are no signs of improvement in the near future
» Lead times are stabilizing for aluminum storefronts at ~10-12 weeks for standard finishes and ~18-22 weeks for custom finishes
» Lead times for thermal doors have increased to 18-22 weeks, while lead times for hardware have improved
FLOORING & TILE
» Over the past six months, flooring has escalated anywhere from 5-75%; however, overall material prices have recently leveled out with a typical increase of 5-10% expected mid-year
» The focus has shifted to specifying domestic goods due to continued logistical challenges and overseas shipping delays
» Lead times for resinous and terrazzo flooring are improving back to pre-pandemic times
» Epoxy and resinous flooring products from several manufacturers have experienced a 10% increase
» Hard tile prices are stable, and no significant increases are anticipated for the next six months
» Lead times for hard tile are expected to improve as production returns to pre-pandemic levels
» Workforce shortages have continued, leading to possible project delays
HVAC
» Over the past six months, labor costs have increased ~5-6% due to inflation and cost of living increases
» Material and equipment prices have increased ~515% and are believed to trend the same as they did in 2022, though possibly slower and steadier
» Manufacturers are still working on backlogs and continue to be challenged by nationwide supply chain issues, therefore, attempts to purchase materials and equipment in other regions of the country have not been successful
» Some lead times have started to trend down, but overall, lead times are still well above average for most equipment manufacturers
» Lead times for air distribution, VAV boxes, spiral duct, round pipe, and fittings have improved compared to last year
» Lead times for semi-custom AHUs and chillers are currently the longest, depending on size
» Lead times for unitary equipment are improving or holding steady with dedicated outdoor air systems (DOAS) at 12 weeks and large direct expansion (DX) systems at 20-30 weeks
PAINT
» Material costs nationwide increased by 10% in the early fall of 2022
» Another material cost increase is expected to be ~8-10% around 3Q 2023
» Challenges with finding qualified and reliable labor are still present
» Lead times for typical architectural finishes have improved
» Lead times and availability of specialty epoxy coatings are unpredictable and inconsistent
» Paint products with sanitizing technology have gained popularity in schools, senior living environments, and medical care facilities, but it’s important to note that reapplication is required every five years
CONSTRUCTION MARKET INSIGHT
PLUMBING
» Plumbing material prices are stabilizing and even decreasing for some items
» Lead times over the last six months have slightly improved and are anticipated to keep improving in 2023
» Residential laborers are anticipated to migrate to commercial work due to the slowing in the residential market because of rising interest rates
» PVC material prices have been trending down since June 2022 as supply catches up with demand
» Copper material prices rose in January 2023 due to increased production costs and decreased demand; however, prices are still much more favorable than in early 2022
» Electrical for ECM fans, VFDs, and circuit breakers are experiencing long lead times due to supply chain constraints
» The new hybrid VRF system by Mitsubishi, a twopipe heat recovery system that replaces refrigerant between indoor units and the hybrid branch circuit controller, is being introduced to commercial buildings in the United States, providing decreased noise, increased energy efficiencies, and reduced maintenance costs from leak detection sensors
INDUSTRY TRENDS & INSIGHTS
In the Carolinas as of February 2023
ELECTRICAL
» Labor costs continue to increase as rates catch up with the cost of living inflation
» Material costs have increased slightly and are anticipated to keep rising in 2023
» Basic electrical materials and commodities are beginning to stabilize
» Over the past six months, electrical gear (panels, switchboards, disconnects, etc.) and generators have experienced the greatest cost increases at ~5% and are expected to continue increasing 7-12% each quarter through 2023 unless lead times improve
» Lead times for electrical gear continue to be lengthy and unpredictable at 40-120 days for panels over 200A and several months for larger gear and switchboards as manufacturers struggle to procure raw materials and catchup with backlogs
» Steel and copper costs have risen, adversely impacting feeder prices; however, increases have only been 2-5% as opposed to 10-30% in 2022
» Fixture lead times have been holding steady
» Lead times for basic ‘off-the-shelf’ electrical components are improving
» Simple parts, like panel covers, can still be challenging to procure
LATENT ESCALATION DELAYS
SUPPLIERS
DISTRIBUTION
INSTALLER ~50% cost value multiple supply chains
natural resource shortages power grid security disruptions post-pandemic normalization
CONSTRUCTION
MARKET INSIGHT
international trade disruptions
international conflict workforce shortages
federal interest rate hikes
lending decreases
barringerconstruction.com
CHARLOTTE
Nathaniel Smith
T 704.337.2881
M 919.696.8665 nathaniel.smith@barringerconstruction.com
RALEIGH Kevin Mertens T 919.307.2880
M 919.648.5070 kevin.mertens@barringerconstruction.com
ASHEVILLE Chase Beattie T 828.579.3715 M 980.240.3392 chase.beattie@barringerconstruction.com
Please contact us if you have questions or would like to use Barringer as a resource
