

KEYS TO SUCCESS
As economists debate what’s to come in the next year, companies and individuals are struggling to strategize and plan for the future. While single- and multi-family residential construction continues to boom to meet the demand of the growing population in the Carolinas, new commercial developments have nearly halted due to rising interest rates and inflation. And, with most new core and shell office space nearing completion, it is likely that very few commercial buildings will come on line in 2024 or even 2025.
Our market insight report incorporates information from industry partners, historical cost data, and numerous reliable local and national publications and sources. Although the latest data and trends are fueling differing opinions about what 2024 holds, one thing is clear: the upcoming presidential election will continue to contribute to a slight slowdown in the release of new private construction projects.
Whether through market research or our extensive network of trade partners in the Carolinas, we are committed to staying ahead of the curve and providing our customers and industry partners with the insights they need to succeed.
$1,938.4 B
MAY 2023 VS. MAY 2022
$1,762.3 B
With residential construction seeing a dip, construction spending is being heavily carried by manufacturing, lodging and government infrastructure work. These three construction types account for 60% of non-residential construction spending.
MAY 2023 VS. MAY 2022
SHORT-TERM DRIVERS LONG-TERM DRIVERS
» Borrowing costs due to rising interest rates
» Home prices and affordable housing availability
» Shortage of labor and skilled workers
» Consumer disposable income spending
» Land/property availability and costs
» Consumer confidence in the economy
» Population trends
» Use of technology and improved efficiencies
» Mergers and acquisitions
» Infrastructure investing by the government
» Upcoming presidential election
» International debt
(6-month net change from January 2023 to July 2023)
Recent flattening of and slight decreases in material costs has made it more appealing to some companies to invest money now, despite higher interest rates

A shortage of construction labor continues to push labor pricing up and will not be resolved in the near term
The pace of material cost increase has decelerated markedly, thereby significantly cooling inflationary pressures on overall construction input costs.
BARRINGER INSIGHT BASED ON Engineering News-Record (ENR) July 2023
The national construction unemployment rate was 0.1% lower in June 2023 from a year ago, down from 3.7% to 3.6%.
BARRINGER INSIGHT BASED ON US Bureau of Labor Statistics (BLS)
June 2023
According to the Associated Builders and Contractors (ABC), North Carolina construction unemployment is at 2.6% signaling a higher need in our region than most other states.
The labor database for the US Bureau of Labor Statistics goes back to 2000. 3.6% is the lowest unemployment rate on record.
An index value > 50 represents that architects have reported more activity for that particular metric than the prior month. These metrics are leading indicators as the Architecture Billing Index (ABI) reflects projects in design that will enter the construction phase in 9 to 12 months and the New Project Inquiry Index (NPII) reflects new project demand from owners to potentially enter the design phase.

Activity from August 2022 to August 2023 has been on an upward trend. This is the first yearlong upward trend since early 2021. This could signal a strengthening of the construction market to come.
BARRINGER INSIGHT BASED ON The American Institute of Architects (AIA) Architecture Billings Index (ABI) June 2023
50.1 ARCHITECTURE BILLINGS INDEX (ABI)
47.8
Commercial/ Industrial
55.4 Institutional
50.5 South Region
56.7 New Project Inquiry
Backlog once again remained stable in June despite tight credit conditions and high interest rates. While those risk factors drove a decline in all three Construction Confidence Index series, contractors continue to signal an expectation that sales, profit margins, and staffing will expand over the second half of 2023.
BARRINGER INSIGHT BASED ON Associated Builders and Contractors, Inc. (ABC) Backlog Indicator
June 2023
US Census Bureau
June 2023
8.9 MONTHS
8.4 MONTHS
South 9.5 MONTHS
The backlog in the South region remains the strongest – a position it has held since Q2 2017 marking 25 consecutive quarters
9.0 MONTHS (-0.4)
Institutional
6.4 MONTHS (-1.8) Heavy Industrial 11.2 MONTHS (+1.2)
The growth in backlog for heavy industrial and infrastructure is being driven by public funding to improve infrastructure and the increase in state-side manufacturing
In the Carolinas as of July 2023
» With supply chains back on track, more companies have focused on employee development programs to attract and retain talent, improve their business processes, and create efficiencies.
» The labor market continues to be challenged by professionals leaving the construction industry, which has caused some subcontractors to adjust their labor rates, disrupting the wage market for certain trades. Cost of living inflation, wage compensation, and competition for skilled labor continue to impact labor costs across all trades.
» Multi-family, industrial, healthcare, and hospitality markets continue to see an increase in the volume of projects. Publicly funded projects are also seeing an increase.
» Local jurisdictions having authority (JHA) within metropolitan areas are addressing updated codes and procedures and being more diligent about enforcing them. These adjustments have impacted project schedules as owners, general contractors, and subcontractors have had to work with officials to understand these changes.
» Life science construction has slowed across the Carolinas mainly due to increases in interest rates, but with the continued growth of manufacturing and warehouse, gray box construction remains strong and competitive for leasing. This trend is expected to continue throughout the year.
» With new commercial developments on hold, very few commercial buildings will likely come online in 2024 or even 2025. Mixing that with the “flight to quality,” any tenants facing a lease end date in this time frame will have limited competitive options. They will likely have to retain their current location, sublet, or move to Class B-type space.
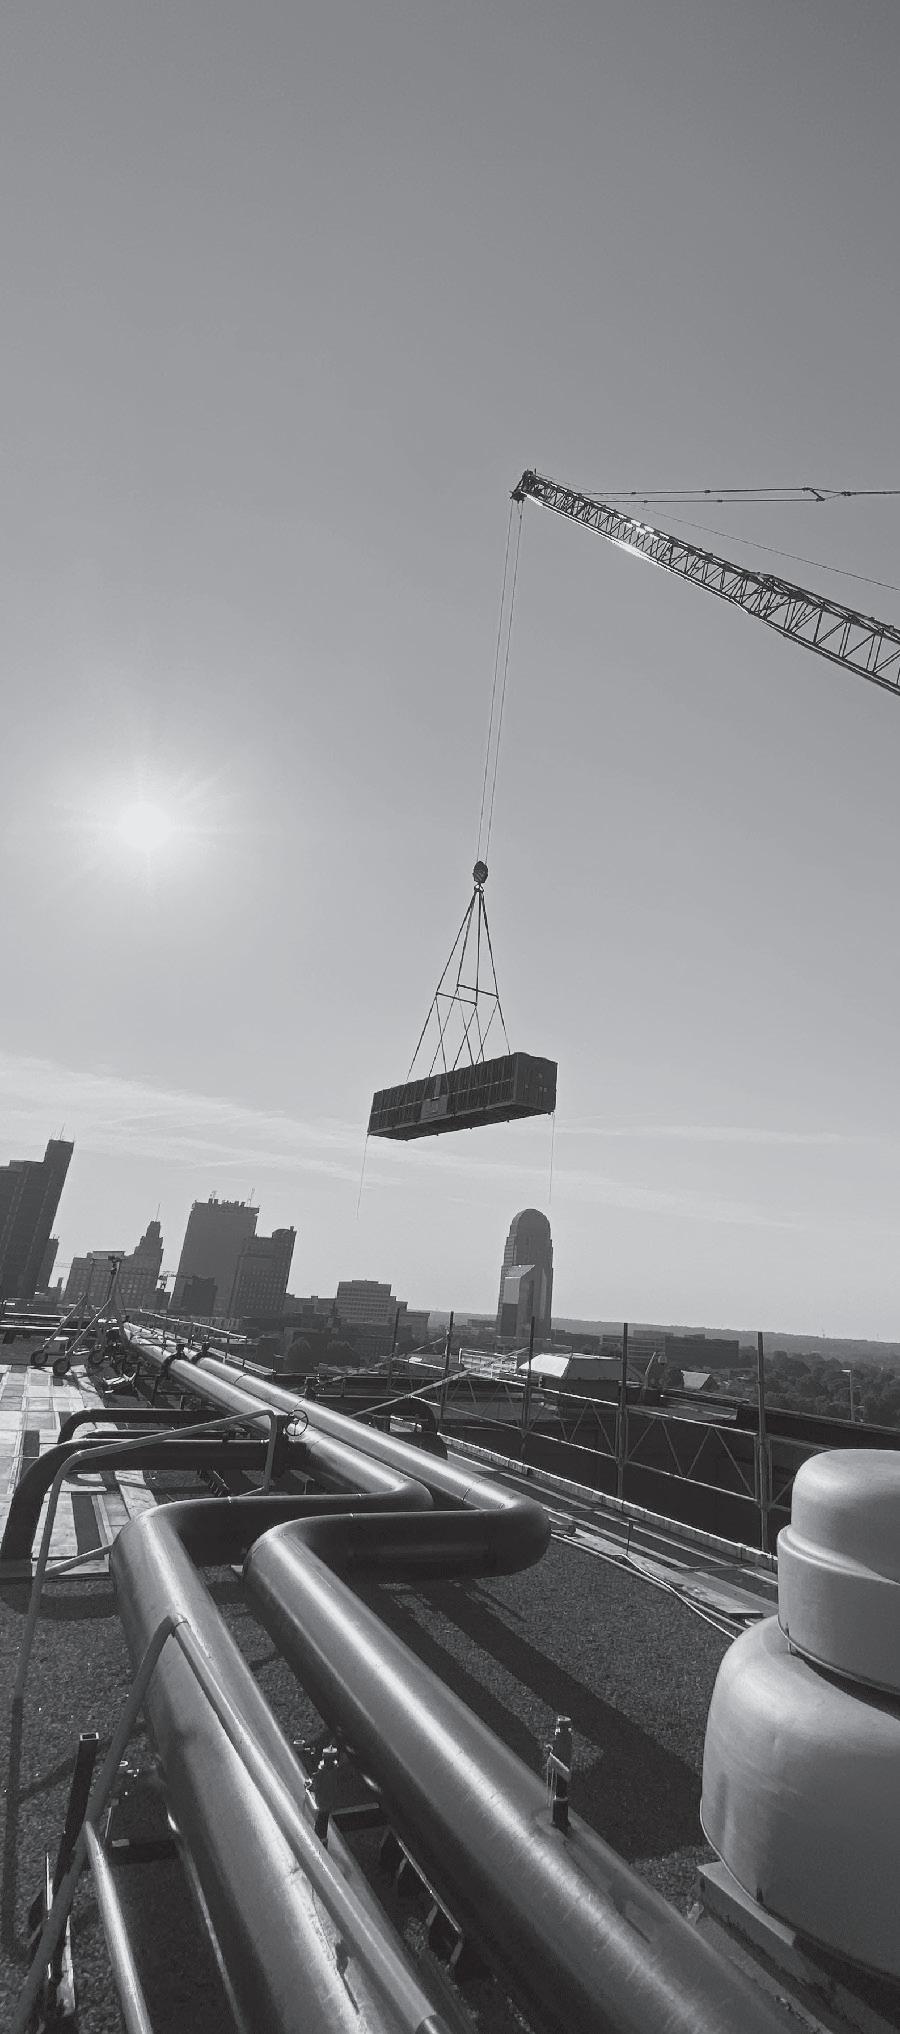
In the Carolinas as of July 2023
» Although long lead times are slowly improving, reinforced concrete pipe (RCP), precast boxes, and other specialty precast items (i.e. detention system) are still difficult to procure
» Class IV RCP remains very difficult to procure
» Ductile iron pipe (DIP) has been a challenging to get in recent years but is beginning to see signs of improvement
» Pump station equipment is experiencing exceptionally long lead times
» Water meter assemblies, particularly 2”, are a scarce commodity
» Inspections and approvals by JHAs continue to take longer than expected
» Costs for site fencing are currently steady or slowing down and lead times have resumed to a normal level (3-4 weeks for most items)
» Over the past six months, rebar prices have been stabilizing and are even trending down slowly
» Rebar suppliers continue to hold pricing for only 1015 days as demand remains high
» Concrete is more readily available, eliminating the need to order in advance
» Concrete pricing is still escalating slowly, and trends indicate prices will continue to rise with cost increases expected in August/September 2023 and in January 2024
» Regulatory issues with South American mines are causing aggregate shortages in the lower Southeast
» Global demand for cement is having an impact on concrete costs
» Technology continues to improve the accuracy and speed of layouts and is expected to improve more as newer technologies, such as AI, are implemented
» Hiring a labor force for manual, low-skill tasks is becoming more difficult to overcome
MASONRY
» Labor rates have increased 4-5% in the past year but appear to have leveled out for the time being
» Brick prices are anticipated to rise another 5% this year
» Cement-based products (CMU, grout, and mortar) have increased by ~5% over the past year
» Cement-based products are readily available
» Landscape plantings are available, but unusual/new varieties of plants and trees are currently in short supply, specifically with large caliper trees
» The conversion of fields that grow landscape products (bushes, sod, etc.) to crop fields has had a negative effect on costs as suppliers adjust to these market changes
» Overall landscape costs will see increases from 5-12% over the next 6-8 months, depending on products
» After unprecedented highs, steel prices have started to come down slowly over the past year and have been stable for a while
» Lead times on steel, joists, and decking are back to pre-pandemic norms, with smaller projects at 16-18 weeks and more extensive projects up to 24 weeks
» A backlog of work in manufacturing plants has increased, which could extend lead times
» Metal panel material has remained stagnant; however, costs related to manpower and equipment have continued to rise
ROOFING
» Pricing has stabilized and lead times have improved, allowing for tighter, more accurate pricing
» Thermoplastic polyolefin (TPO) and Fibertite on heavy roof traffic retail facilities remains in high demand
» Price increases will return to the typical ~3-5% each quarter
» Lead times for laminates can be difficult to predict with some being as few as 1-2 weeks, while others are up to 6-8 weeks
» Typical 2-3% price increases are expected to occur periodically through the end of 2023
» Demand for Fenix laminates, slat paneling, and paneling at stairs have increased due to current design trends
» Product lead times are stabilizing since most manufacturing facilities are back at full capacity
In the Carolinas as of July 2023
» Raw material prices have been increasing, impacting product costs
» Door hardware prices continue to creep up with 60% increases for materials and 55% increases for labor over the past six months
» Wood doors, hollow metal, and electronic hardware continue to have longer lead times, with fluctuations occurring weekly
» Lead times for premium/non-standard hardware can be up to 18 weeks, and electrified hardware, like card locks, can be up to 20 weeks (dormitory/ military-type)
» Most supply chain issues have been resolved, and material prices have been adjusted
» Gypsum board prices are going up mainly due to the continued closure of coal-fired power plants, causing suppliers to resort back to non-synthetic gypsum, which is more expensive
» Labor costs for framing and drywall have been volatile the last few years but are beginning to settle
» Wood ceilings are experiencing increases in long lead times as they are challenged with keeping up with the demand; however, a focus on locally manufactured custom wood ceilings has relieved some of this problem
» Specialty ceilings, like wood and felt baffles, still have long lead times as they are typically made-toorder for each job
» Most flooring materials are available quickly, with a few exceptions being 6-8 weeks out
» The focus has shifted to specifying domestic goods due to continued logistical challenges and overseas shipping delays
» Sealed and polished concrete flooring finishes are trending and in demand
» Flooring is back to pre-pandemic increases of about 3-5% annually
» Some suppliers are developing quick ship programs that help popular products ship faster
» Global trade of raw aluminum material can be affected; most raw aluminum material is sourced outside the U.S.
» Most recent variants in lead times are related to an influx of orders for manufacturers as opposed to supply chain issues
» With glass office fronts in high demand, glass door pricing and lead times for demountable wall systems are still more favorable than wood options
» Lead times for glass have remained long, and there are no signs of improvement
» Door hardware retains the longest lead time at upwards of 12-18 weeks, depending on the specific piece of hardware required
» Laminated glass is in low supply
» Overall cost for materials has started to stabilize; however, labor and equipment are continuing to see cost increases
» ACT tile and grid pricing has stabilized and typical pre-pandemic material cost adjustments will become more standard
» With the overall demand for fewer office space build-outs, manufacturers have been able to improve their lead times
» Most overhead door products are readily available
» Dock equipment still has a longer lead time at 5-6 months but is slowly improving
» Annual cost increases are expected by the end of the year
» Paint price increases are anticipated to be ~8% in Q3 2023
» Specialty paints like solvent-based epoxies are experiencing price increases
» Lead times for wallcoverings vary from readily available to 6+ weeks
» Finding installers for wallcoverings continues to be a challenge
» Plumbing material prices are stabilizing and even decreasing for some items
» Lead times over the last six months have slightly improved and are anticipated to keep improving through the end of the year
» Residential laborers are anticipated to migrate to commercial work due to slowing in the market
» Most plumbing fixtures are readily available and piping lead times are 3-4 weeks
In the Carolinas as of July 2023
HVAC
» Over the past six months, labor costs have increased ~5-6% due to inflation and cost of living increases
» Some lead times have started to trend down, but overall, lead times are still well above average for equipment manufacturers
» Lead times for air distribution, VAV boxes, spiral duct, round pipe, and fittings have improved compared to last year
» On average, most AHU/RTU units run 36-40+ weeks and chillers are 48-54 weeks
» Lead times for semi-custom AHUs and chillers are currently the longest, depending on size
» Lead times for cooling towers are ~26 weeks and generators are 30-52 weeks

ELECTRICAL
» Copper is currently 8-10% less than in January of 2023, and there have been normal increases and decreases in copper this year
» Electrical metallic tubing (EMT), rigid, and PVC conduit is about 10-15% higher than January 2023 and has been steadily creeping up
» Light fixture prices have leveled
» Specialty fixtures are always a wild card, and there has been a larger demand for specialty pendants
» Gear pricing has been up 3-5% over the last six months
» Lighting lead times on white goods (2x4s lay-ins and can lights) are about 3-4 weeks; linear fixtures are about 6-8 weeks; and specialty fixtures are unpredictable, with a wide range in lead times
» Typical 200A panels are in stock but 400A panels have a 6–8-week lead time
» Switchgear with custom features can take anywhere from 40-60 weeks
SUPPLIERS DISTRIBUTION INSTALLER ~50% cost value multiple supply chains
Wildfires in Canada are starting to cause a slight increase in lumber prices. Quebec and Alberta have been hit the hardest and they account for 45% of softwood lumber production.
BARRINGER INSIGHT BASED ON Construction Dive Article: Canadian wildfires raised air pollution. Lumber prices could be next. July 17, 2023
natural resource shortages workforce shortages federal interest rate hikes natural disasters international trade disruptions lending decreases energy compliance requirements carrier capacity constraints & delays
barringerconstruction.com

CHARLOTTE
Nathaniel Smith
T 704.337.2881
M 919.696.8665 nathaniel.smith@barringerconstruction.com
RALEIGH
Kevin Mertens T 919.307.2880
M 919.648.5070 kevin.mertens@barringerconstruction.com
ASHEVILLE Chase Beattie T 828.579.3715
M 828.333.3642 chase.beattie@barringerconstruction.com
Please contact us if you have questions or would like to use Barringer as a resource