aww-uk.com
Carbon Footprint Report 2022-23
Contents aww-uk.com AWW Carbon Footprint Report Introduction 1 Executive Summary ....................................................... 2 About Us .......................................................................................... 4 Carbon Footprint 6 Circular Economy .............................................................. 7 Carbon Balance ................................................................... 8 Action Plan 9
Carbon Footprint Report
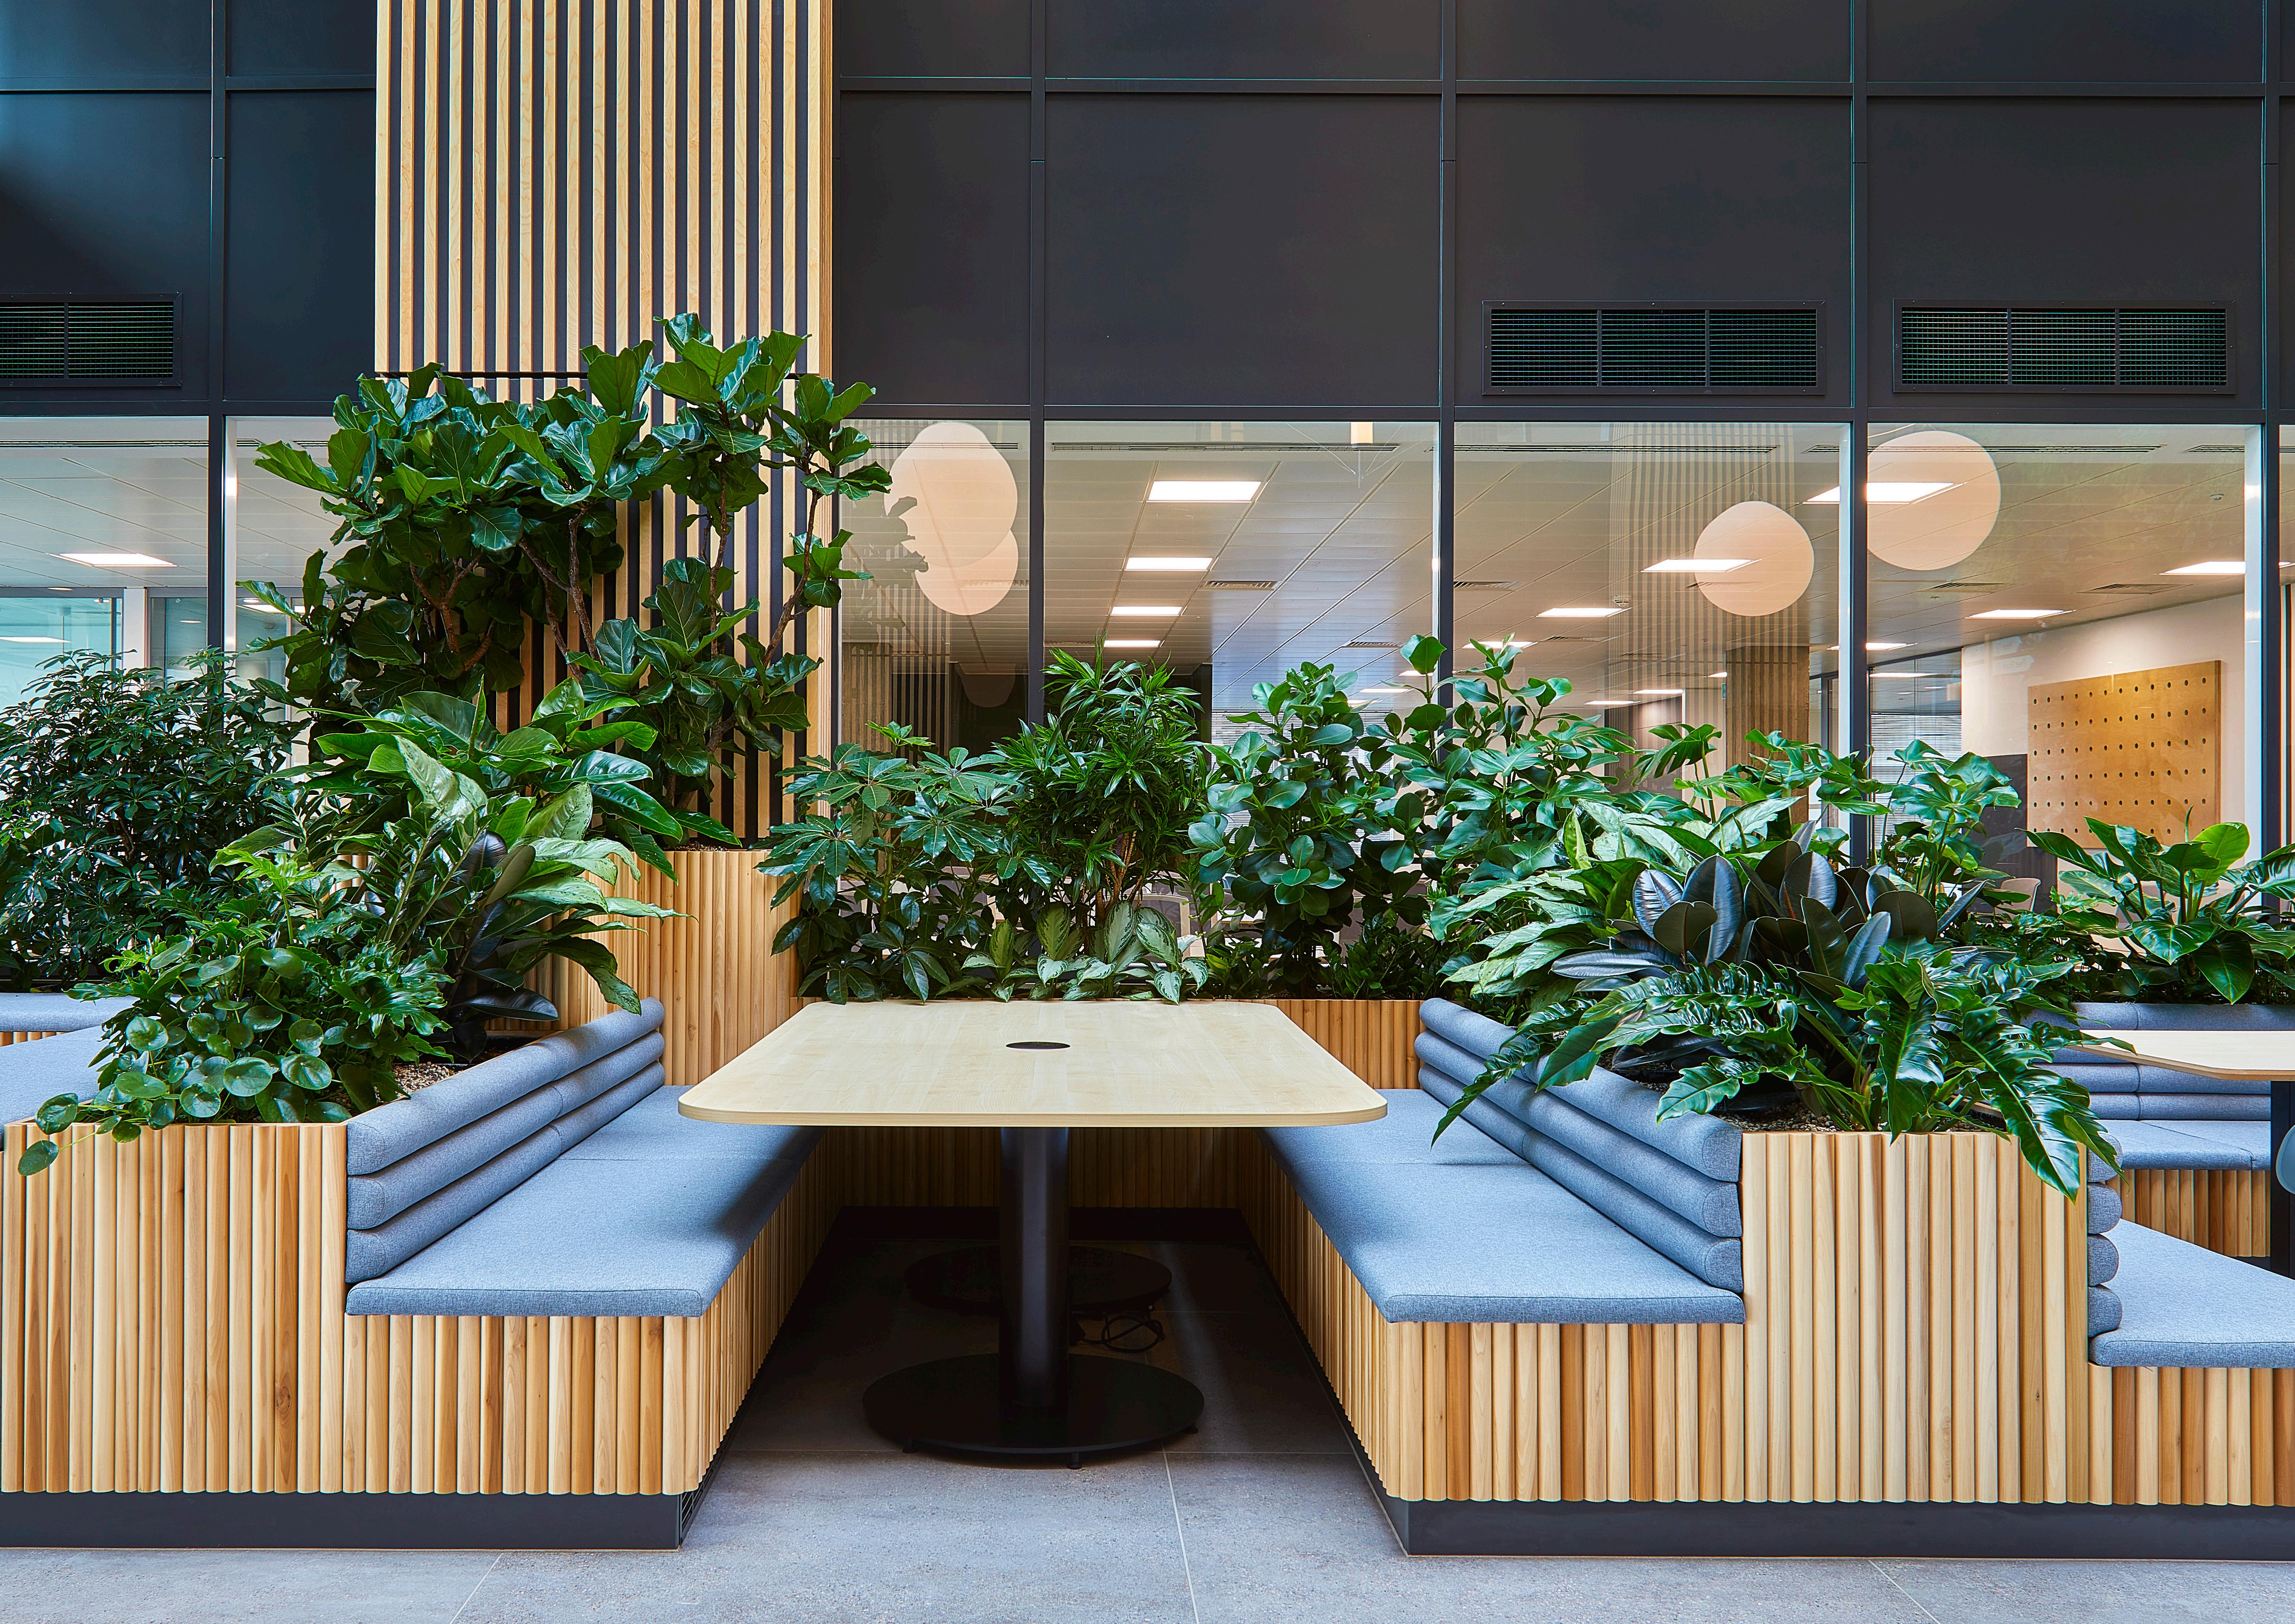
“AWW are committed to making a positive impact. Sustainable design is inseparable from good design, and our goal is to create beautiful places that enhance people’s lives and give back to the environment.”
AWW’s goal is to become net zero carbon in everything that we do by 2025.
As an architectural practice, the buildings that we design account for the vast majority of our carbon impact, but we must also lead by example in continuing to improve upon our own business carbon footprint and delivering on our design pledge.
The scope of this report is to review AWW’s business carbon footprint and provide recommendations for further actions.
AWW have committed to a science based target carbon reduction through the SME Climate Hub, and are signatories of RIBA 2030 Challenge & Architects Declare
Introduction
AWW
Executive Summary
Commitment Practice + Projects
AWW has been forward-thinking and proactive with regards to environmental and social impact management, and has an ISO 14001 environmental system in place to audit business operations. This document is the third AWW carbon footprint for business energy use, and is in place to help improve upon our existing systems and enact on our 2021 pledge to target net zero by 2025.
Although there is no legal responsibility to report, we see that by robustly monitoring the business against a science-based target, and by reporting against this, we can take the next critical step to becoming net zero.
We also recognise potential business advantages:
• Risk Management
• Reputation
• Resilience
To acknowledge our commitment, and to gain a better understanding into how we monitor, reduce and report our carbon footprint, AWW has joined the SME Climate Hub and made the SME Climate Commitment.
This is recognised by the United Nations Race to Zero campaign, and thus aligns with the relevant United Nations Sustainable Development Goals (UNSDG).
As an architectural practice, the buildings that we design account for an estimated 1000 times that of our business carbon Impact, and, although outside the scope of this document, our 2025 ‘net zero ready’ pledge extends to our projects, and also aligns with the UNSDG through the RIBA 2030 Challenge and LETI.
We recognise the importance of accounting for our business GHG because our people define the outcome of the projects that we design and deliver, and they do this within our business framework; therefore the way we conduct our business and the environment we make for projects to develop, is of key importance.

“Recognising that climate change poses a threat to the economy, nature and society-at-large, AWW commits to take action immediately in order to (as a minimum):
1. Halve our greenhouse gas emissions before 2025
2. Achieve net zero emissions before 2030
3. Disclose our progress on a yearly basis
In doing so, we are proud to be recognised by the United Nations Race to Zero campaign, and join governments, businesses, cities, regions, and universities around the world with the same mission.”
AWW Pledge 2021 SME Climate Hub. Tim Forster Sustainability Director, AWW
AWW Carbon Footprint Report Page 2
Executive Summary
AWW Carbon Footprint
AWW’s calculated carbon footprint for 2022/2023 financial year, including business premises energy use, and business travel, was 42.87 tonnes CO2e, or approximately 0.67 tonnes CO2e / person.
Data 2022-2023
This report relates to our 3 offices, Bristol, London, Plymouth, over our financial reporting period between 05.04.22 - 04.04.23
The data available is limited to our business energy use, and business travel, as this is data is in a usable format for equating CO2e.
We do collect additional data for our environmental costing, including waste collection and supplies costs, however we don’t yet have enough data to calculate these Scope 3 emissions.
Carbon Reduction 2022-2023
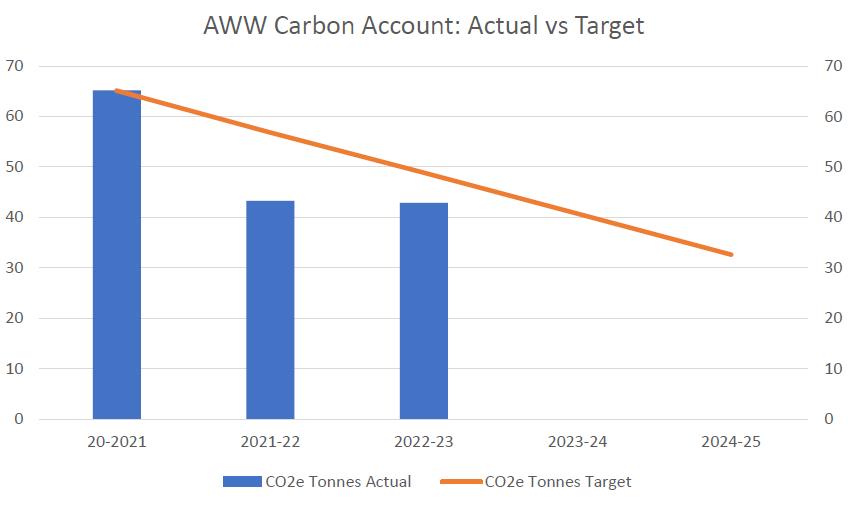
Our target is to halve our 2020-21 greenhouse gas emissions by 2025, and pledge to offset atleast 100% of our carbon balance annually.
20-21 emissions were 65.15 CO2e tonnes, so in 24-25 we have targetted 32.58 CO2e tonnes. This year, 2223, marks the half-way point of our target, and we are ahead of our tragectory, achieving a 34.2% reduction to date.
This includes additional (Scope 3 business travel) emissions that were excluded in the 20-21 report.
Like last year, we are still unable to get accurate KWh data from the landlord of our Bristol office which has meant we’ve needed to make approximations for this office. We continue to try to get more granular data so that we can better measure and improve our impact.
Interestingly, with no further Covid restrictions this year, we’re able to notice a change in our pre-covid travel habits. Except for taxis (marginal increase) all travel is substantially reduced from pre-pandemic figures.
42.87
Annual Emissions AWW 2021-22 CO2e tonnes - total (limited scope)
0.67
Annual Emissions AWW 2020-21 CO2e tonnes - per employee
0.5%
390
Annual Emissions Typical Large project CO2e tonnes (data from AWW 2021)
9450
Typical Embodied Carbon Large project CO2e tonnes (2020 benchmark)
Annual Emissions of AWW business operations 2022-23 as a %, compared with the embodied carbon of 1 typical large (13,500m2) project completed in 2020. This highlights why building designers and stakeholders need to use their influence and expertise to mitigate the carbon impact of the built environment.
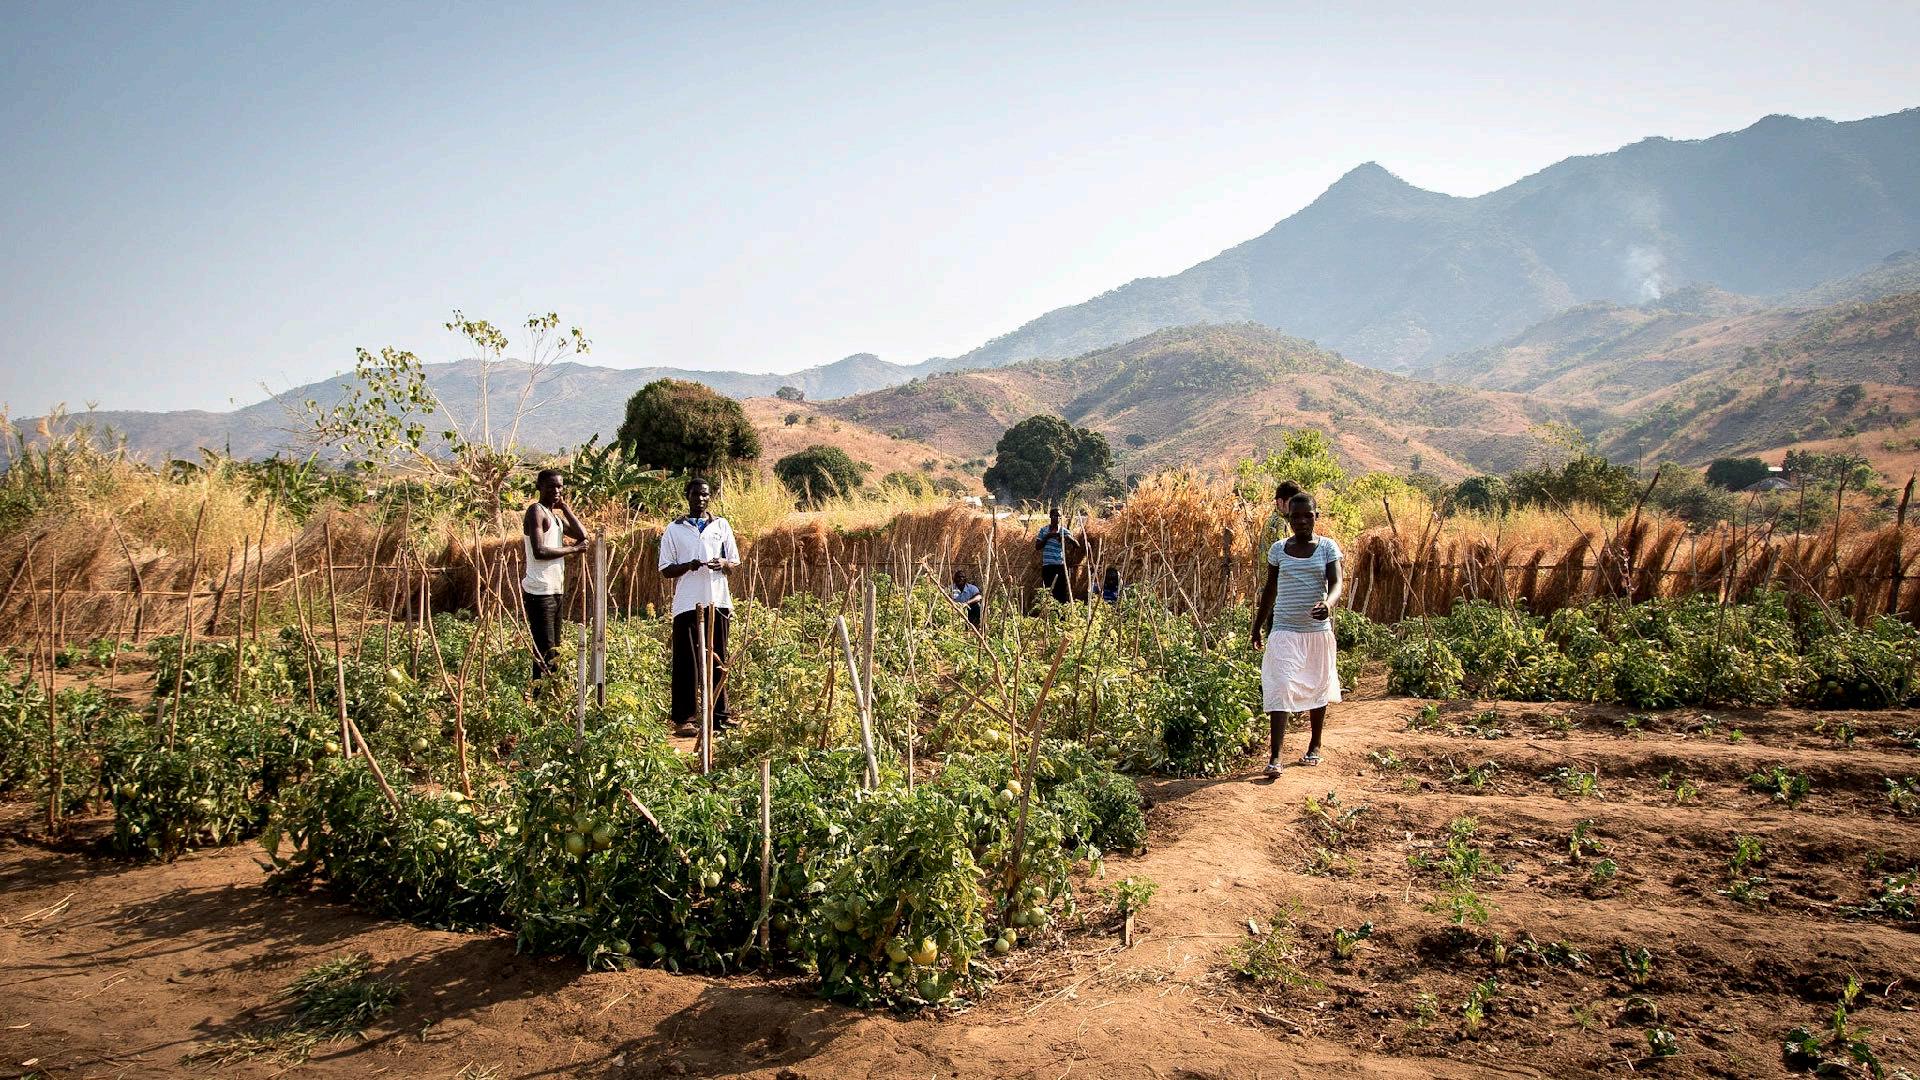
There are 3 strands to the TEMWA carbon offsetting scheme
1. Community-led tree planting
2. Supporting farmers and households to plant fruit producing trees
3. Working with traditional governance structures to protect existing forests
34%
Reduction in AWW emissions from 20/21. All of the remaining AWW Scope 1 and 2 emissions have been offset through the Temwa scheme. AWW target is 50% reduction by 2025
Travel in 2022-23 compared to 2019-20 pre-pandemic figures was reduced to: Pool car use (46% reduction) Train travel (52% reduction) Taxi travel (3% increase) Air travel (100% reduction)
54%
48% +3%
0%
AWW Carbon Footprint Report Page 3
About us
AWW Premises & Staff
We have offices in London, Bristol and Plymouth. Across these offices, the total number of staff was 64 (yearly average).
All offices are similar in that:
• AWW are the tenant - leased short term (5-10 years)
• They use electricity only (no mains gas)
• Rates are paid to the landlord for energy use and water
With a flexible working policy in place a portion of staff time was spent working from home, and these emissions are not accounted for. In the future this will need to be brought into the Scope 3 emissions, with the methodology reviewed for how we monitor and reduce with any accuracy.
AWW Partners
AWW works with supply chain partners for office and project support. These emissions are not accounted for, but again will need to be understood and brought into the Scope 3 emissions for accuracy in future accounts.
AWW Travel
The majority of our business travel this year was by car but travel is still substantially reduced from pre-pandemic levels.
This is a result of virtual meetings replacing face-to-face meetings, which has reduced
the need to travel, and we expect this trend will continue in following years.
Train travel increased from the previous year as expected but is still only 48% of that in pre-pandemic years. We expect this number is stabilising and is good therefore to see reduced travel dependency.
Cycling is rarely used for business travel and although incentives have been in place historically, and cycling to work is popular, it is rarely practical for meetings and the like.
The electric pool car purchased January ‘22 has helped to reduce carbon emissions. Usage of the electric car has doubled since last year, but usage of the car remains low compared to the diesel pool car due to the limited range. An alternative to the diesel car needs to be sought.
AWW Environmental Social and Governance
Our business energy use is one element of our environmental and social impact. The commitment table below, and the diagram overleaf show the wider context of our practice governance and decisions making when it comes to our carbon emissions and our social responsibilities.
AWW is the first architectural practice to have achieved the Social Value Quality Mark (SVQM). AWW are currently at Bronze award, and aspire to Silver award by end of 2023.
Commitment Covers Practice Covers Projects Metrics
Declare ✓ ✓
Bristol Plymouth London AWW
Architects
✓ ✓
RIBA 2030 Challenge (Alignment with LETI guidance & relevant UNSDG)
✓ ✓
Value
✓ ✓ ✓ AWW Carbon Footprint Report Page 4
UN Race to Net Zero (Via SME Climate Hub & relevant UNSDG)
Social
Quality Mark
Inform/Learn/ Align values
External Advisors
Inform/Learn/ Align values
Practice Director
The Board of Directors, including
Finance and HR Director
AWW Practice framework: Environmental Social & Governance Sustainability Director [ESG lead]
ESG Policy
ESG Team
Practice and project support team
“Policy is the guiding principle, that helps the organisation to take logical decisions.
Inform
Projects
The projects that we design and deliver
Affects: All stakeholders and the wider community
Key roles: All Directors, All project teams
Support roles: Office support team
• The whole-life carbon impact of our projects, including embodied and operational. Natural resource impact
• The social value impact of our projects during design, construction, and use
• The policies and practices pertaining to our projects, our reporting and disclosure on their performance
ISO 14001, SVQM, ARB Carbon Footprint Report Social Value Impact Report
“Strategy is a comprehensive plan, made to accomplish the organisational goals.
ESG Strategy
Measure and report
ESG Report
By ESG coordinator/s ESG lead
Inform/Learn/ Align values
External Stakeholders
Clients, Consultants, Community
Inform/Learn/ Align values
Practice
Our offices, employees, and supply chain partners
Affects: All AWW Staff and suppliers
Key roles: Practice Director, office support team, AWW design team
Support roles: All AWW Staff
• Office operations including energy consumption, travel, waste management, regenerative practices
RIBA 2030 Report
• Employee health & well-being, equality, education and training, contribution to our local communities
• Policies and practices pertaining to our mission, ethics, accountability and transparency.
B C
Direct Support Guidance Support/ Guidance Direct Govern
to improve
updates
end /start reporting
Appended A
Annual report aligned with financial year
Feedback
Quarterly
Year
AWW Carbon Footprint Report Page 5
Carbon Footprint
AWW Carbon Footprint
AWW carbon footprint has been calculated using the collected annual data and the Greenhouse gas reporting: conversion factors 2023 (https://www.gov.uk/ government/publications/greenhouse-gasreporting-conversion-factors-2023)
There are a number of Scope 3 categories for which we don’t have data, although we are now collecting data from Scope 3 transport which is an improvement on the first accounting year (‘20-’21).
appears largely unchanged since last year however there is a lack of metering clarity from the landlord of our largest office in Bristol. This makes it difficult to monitor and target reduction in energy usage.
Having an energy representative for each office, tasked with reviewing how we can reduce office energy use has therefore not been possible this year, but should be implemented when possible.
This year we have also been able to sublet some of our office space which has been accounted for in the calculations using a % reduction according to desk space usage.
We have made good headway in accounting for our Scope 3 (other indirect) emissions, in line with our action plan.
Our intention must be to continue to build on this, and review our data collection and methodology in line with emerging best practice, aiming for full Scope 3 accountability.

We should continue to collect more Scope 3 data to improve our ability to make a positive environmental impact.
AWW Scope 1, 2,3
Our Scope 1 (direct) emissions are limited to our vehicles as we have no other fuel combustion appliances.
Scope 2 (energy indirect emissions from purchased energy) account for the vast majority of our emissions. This is the energy we use to heat, ventilate, and power our offices and equipment. Office energy use
Scope Category Item Unit Total All Offices Carbon Factor (kg CO2e) Carbon Footprint (CO2e tonnes) Approx % weighting / not measured Scope 1 Utilities AWW office - Gas KWh - 0.18 0 0% Scope 1 Project related travel Personal car Litre 2006.24 2.1 CO2e / L 4.213 9.83% Scope 1 Pool car (Electric) Mile 2756 0.07799 0.215 0.50% Scope 1 Pool car (Diesel) Litre 1444 2.45 CO2e / L 3.033 7.08% Scope 2 Utilities AWW office - Electric KWh 115,083 0.207 23.831 55.59% Scope 3 AWW office - Water m3 - - not measured Scope 3 Home Working Home office - Electricity KWh - -not measured Scope 3 Home Office - Gas KWh - -Scope 3 Supply chain offices Other Office - Utilities KWh - - not measured Scope 3 Project related travel Taxi km 3813.9 0.2081 0.794 1.85% Scope 3 Train km 82,121 0.0354 2.912 6.79% Scope 3 Flights km 0 0.1535 0 0% Scope 3 Staff commuting All forms km - varies - not measured Scope 3 Supplies Deliveries km - - - not measured Scope 3 Well - Tank (WTT) Electricity (generation) KWh 115,083 0.04625 5.323 12.42% Scope 3 Well - Tank (WTT) Electricity (T&D) KWh 115,083 0.00423 0.487 1.14% Scope 3 Transmission & Dist Losses Electricity KWh 115,083 0.01769 2.062 4.81% Scope 3 Waste Collection £ 582.44 - - not measured Total tonnes CO2e 42.87 100%
Electric
AWW Carbon Footprint Report Page 6
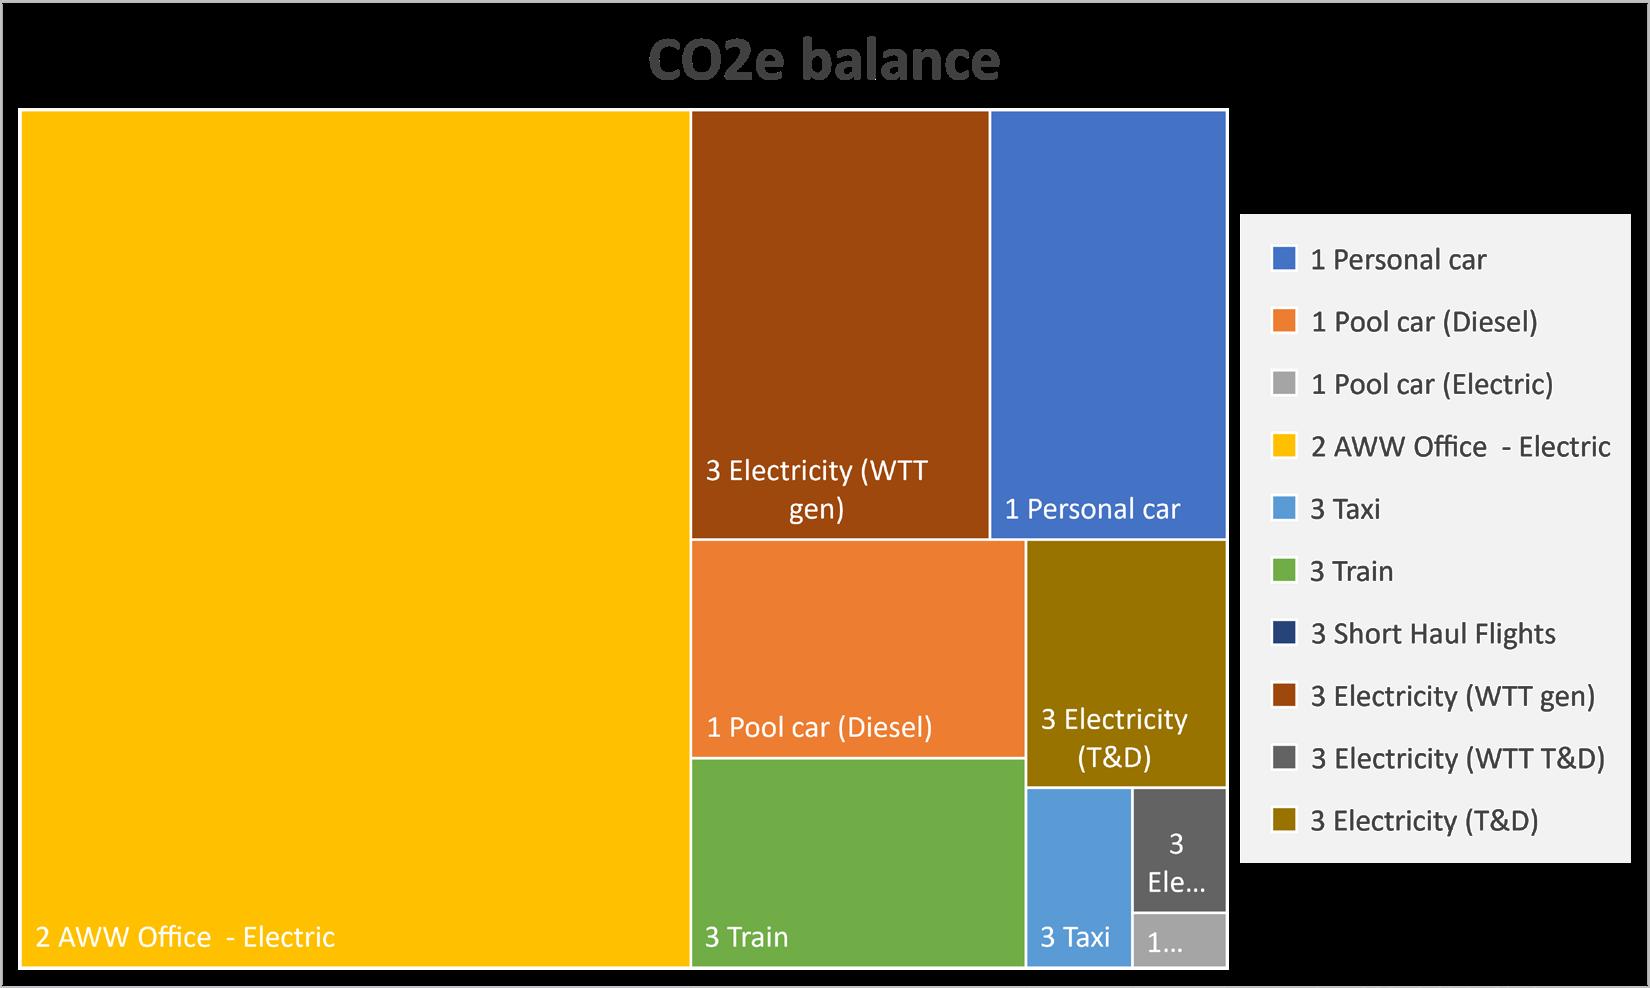
AWW Carbon Footprint 2022-23: Sources distribution Scope
2 AWW Office
55.59%
Waste is a human concept, it’s not an accident, it’s largely a result of the way that things are designed.
Circular Economy
Embedding Circular Economy into building design is key to a sustainable and regenerative construction industry.
Buildings designed to be disassembled have a residual asset value that can be assessed against return on investment. Think building as material bank.
AWW approach to CE is:
• Advocate building re-use.
• Agree CE strategy with client and design team at Stage 1.
• All key projects to have a CE method statement at RIBA Stage 2/3.
• Design for disassembly and use ‘Building in Layers’, communicating the disassembly strategy through the life of the project.
• Engage in industry research on CE.
AWW’s Current Research
Projects
We are currently involved in two research partnerships with universities support our goal towards net zero carbon projects and applying circular economic regenerative design principles. The research findings will be integrated into our design process and actively improve and inform how we deliver projects.
Urban Flows Observatory – Research on Circularity of Existing Building Stock using BIM information: Circular Economy in Building Design
Our collaboration with University of Sheffield’s Urban Flows Observatory is to form an understanding of the potential circularity of projects that have been completed in the last decade using BIM datasets. This research studies the amounts of building materials that may go to landfill, may be reused, or may be recycled. The benefit of this retrospective research work helps to inform our current design and specification decisions – to increase the circularity of the materials of our buildings.
“Carbon Artifacts: a socio-material approach to low and net zero carbon building design from concept to handover”
Our collaboration with University of Reading on their research on “Carbon Artifacts” will directly influence our design process and create a shared language between consultants, clients, and wider project teams on how the integrity of net-zero carbon aims is maintained throughout the design process.
SURROUNDINGENVIRONMENT
SKIN(15-60years)
STRUCTURE(60-120years)
SERVICES7-15years)
INTERIOR3-7years
STUFF(0-3years) US
designtorestore/regenerate designforeaseofrefurbishment designfordeconstruction designforlonglife/loosefit designforadaptability designforservice/sharing design for
Strategy Workshop Pre-contract Post-contract Workshop Design Construction Report Share Design Specify Cost Assessment
Review
health
Capture
04 05 take design out waste products and materials in use restore make waste
£££
Implement 01 02 03
£££
AWW Carbon Footprint Report Page 7
Carbon Balance
AWW
Our target is to halve our 2020-21 greenhouse gas emissions by 2025, and pledge to offset atleast 100% of our carbon balance annually.
20-21 emissions were 65.15 CO2e tonnes, so in 24-25 we have targetted 32.58 CO2e tonnes. This year, 22-23, marks the halfway point of our target, and we are ahead of our tragectory, achieving a 34.2% reduction to date.
All of our remaining Scope 1 and 2 emissions have been offset through the Temwa scheme, and we have gone further this year by offsetting our accounted Scope 3 emissions also.
Offsetting provides us with the opportunity for:
• Immediate positive environmental impact
• Immediate social benefit to a community
• Budget benchmarking for future years with the aim to become carbon negative.
Based in Bristol, Temwa was selected as our offset partner in 2019 as it met this criteria and aligned with our values.

is proud to be
AWW Carbon Footprint Report Page 8
AWW Climate Action Plan
Office Electricity Use
Pool Cars
This is by far the highest emission at 74% of total emissions recorded.
Significant contributor and AWW has control on reductions.
Scope 3 Data collection is limited
Establish an energy monitoring team to review and report on potential reduction measures.
On hold until we can get more accurate figures from the landlord.
Continue to request data from the landlord, and set up monitoring when this is forthcoming.
Ongoing
Reporting
Action Plan
Office use efficiency
Set targets
Commuting
Transparency and accuracy - both helping to reduce emissions further
With increased working from home, can we make better use of our offices.
To commit to further emissions reductions
Travel to work is not yet accounted for
Can we switch to renewable?
No control on this at the moment on all offices.
Consider phasing out remaining petrol car EV. To be 23-24 earliest due to lease. Lease agreed for Hybrid EV.
Increase Scope 3 reporting by finding a better way of measuring supply chain, train travel, waste streams.
Use the SME Climate Hub tools and network to improve our reporting methodology and fulfil our pledge to reduce our emissions and disclose our progress.
Continue to review subletting/office use and related energy use.
Granularise targets going forward to set realistic aims for the now more difficult to achieve reductions that remain.
Assess staff travel to make a decision going forward on how to better promote sustainable travel methods and how to account for the emissions (Scope 3)
Scope 3 business travel now accounted for.
Continue to request from the landlords for each office to make headway on this. Ongoing
Predict and monitor usage throughout year. Ongoing
Continue to collect data for additional Scope 3 emissions Ongoing
Data uploaded onto website
Sub-letting accounted for in ‘22-’23. Energy use is the same as last year despite subletting % reduction. Lack of Landlord KWh data makes analysis difficult.
Achieved 34% reduction from 2020-21. Set trajectory going forward.
Staff travel survey conducted, data collated and baseline established.
Continue to use platform and make use of the tools available. Ongoing
Continue to review subletting/office use and related energy use. KWh data is key for this. Ongoing
Monitor accounts regularly to help achieve targets.
Establish reporting method and include in 23-24 accounts. Continue to advocate and encourage sustainable travel.
Ongoing
Ongoing
“Recognising
that climate change poses a threat to the economy, nature and society-at-large, AWW commits to take action immediately in order to (as a minimum):
1. Halve our greenhouse gas emissions before 2025
2. Achieve net zero emissions before 2030
3. Disclose our progress on a yearly basis
Area Reason Action 2022-23 Status Action 2023-24 Ongoing/ Closed Office Electricity Use This is by far
highest emission at 74% of total emissions
the
recorded.
Paper usage Paper is our main material waste stream Paper-saving methods put in place including printing monitoring. Paper and printing usage is reduced by approximately 73% from pre-pandemic use. Monitoring system now in place - no further action. Closed 0 10 20 30 40 50 60 70 0 10 20 30 40 50 60 70 20-2021 2021-22 2022-23 2023-24 2024-25 AWW Carbon Account: Actual vs Target CO2e Tonnes Actual CO2e Tonnes Target
AWW Carbon Footprint Report Page 9
References
RIBA 2030 Challenge
https://www.architecture.com/about/policy/climateaction/2030-climate-challenge
Architects Declare
https://www.architectsdeclare.com/
SME Climate Hub
https://smeclimatehub.org/
SME Climate Hub
https://exponentialroadmap.org/

exponential
action towards net-zero emissions AWW Carbon Footprint Report Page 10
THE 1.5°C BUSINESS PLAYBOOK Building a strategy for
climate
aww-uk.com
Carbon Reduction Plan April 2024
Carbon Reduction Plan
Commitment to achieving Net Zero
AWW has committed to halving our 2021 greenhouse gas emissions by 2025 and achieving Net Zero Emissions by 2030.
Baseline Emissions Footprint
Baseline Year: 2020/21 (05.04.2020 - 04.04.2021)
Additional Details relating to the Baseline Emissions calculations: AWW Baseline is measured from the company’s first carbon accounting period of 5.4.2020 to 4.4.2021.
The usable data available at the time was limited to AWW business energy use, and business car travel. Since the 20/21 report was published, the data pool has been increased as a consequence of the AWW Carbon Action Plan, and includes additional Scope 3 Items.
Regardless of the later datasets being more extensive, the decision was made to continue to use the 20/21 reporting period as the baseline total tCO2e figure from which to assess future progression. Baseline
Emissions Reduction Targets
The usable data available at the time was limited to AWW business energy use, and business car travel.
Since the 20/21 report was published, the data pool has been increased as a consequence of the AWW Carbon Action Plan, and includes additional Scope 3 Items.
Regardless of the later datasets being more extensive, the decision was made to continue to use the 20/21 reporting period as the baseline total tCO2e figure from which to assess future progression.
Progress against these targets can be seen in the graph below:
Current Emissions Reporting
Reporting Year: 2022/23 (05.04.2022 - 04.04.2023)
t/a AWW
Supplier Name: Atkins Walters & Webster Ltd
Publication Date: April 2024
Year Emissions: EMISSIONS TOTAL (TCO2e) Scope 1 9.660 Scope 2 42.069 Scope 3 (Included Sources) 13.422 Total Emissions 65.151 tCO2e
EMISSIONS TOTAL (TCO2e) Scope 1 7.461 Scope 2 23.831 Scope 3 (Included Sources) 11.578 Total Emissions 42.87 tCO2e
AWW Carbon Reduction Plan Page 2
Carbon Reduction Plan
Carbon Reduction Projects
Completed Carbon Reduction Initiatives
The following environmental management measures and projects have been completed or implemented since the 2020/21 baseline. The carbon emission reduction achieved by these schemes equate to 22.28 tCO2e, a 34.2% reduction against the 2020/21 baseline and the measures will be in effect when performing the contract.
Since AWW’s first Carbon Action Plan in 2021, the following carbon reduction projects have been planned/progressed/ completed (as indicated below):
Declaration and Sign Off
This Carbon Reduction Plan has been completed in accordance with PPN 06/21 and associated guidance and reporting standard for Carbon Reduction Plans.
Emissions have been reported and recorded in accordance with the published reporting standard for Carbon Reduction Plans and the GHG Reporting Protocol corporate standard and uses the appropriate Government emission conversion factors for greenhouse gas company reporting.
Scope 1 and Scope 2 emissions have been reported in accordance with SECR requirements, and the required subset of Scope 3 emissions have been reported in accordance with the published reporting standard for Carbon Reduction Plans and the Corporate Value Chain (Scope 3) Standard.
This Carbon Reduction Plan has been reviewed and signed off by the Board of Directors.
Signed on behalf of the Supplier:

Tim Forster RIBA
Sustainability Director, AWW
Date: 25 March 2024
Scope & Description Action Progress Scope 1 Vehicle fleet Reduce by 1/3 and replace diesel/petrol with electric/ hybrid Complete Scope 2 Office premises electricity use Reduce through floorplate planning efficiencies Complete Scope 2 Office premises electricity use Reduce through efficiency improvements to server and equipment Progressed Scope 2 Office premises electricity use Changing supplier to reduce carbon factor Planned Scope 2 Office premises electricity use Introduce electricity monitor to each office to help control and limit use Planned
3 Reporting Increase accounting of Scope 3 emissions year-on-year Progressed General Increase frequency to quarterly internal reporting to evaluate data and action more regularly Complete
Scope
AWW Carbon Reduction Plan Page 3
AWW info@aww-uk.com I aww-uk.com Bristol pivot + mark 48 - 52 Baldwin Street Bristol BS1 1QB 0117 923 2535 London 106 Weston Street London SE1 3QB 020 7160 6000 AWW Carbon Footprint Report
