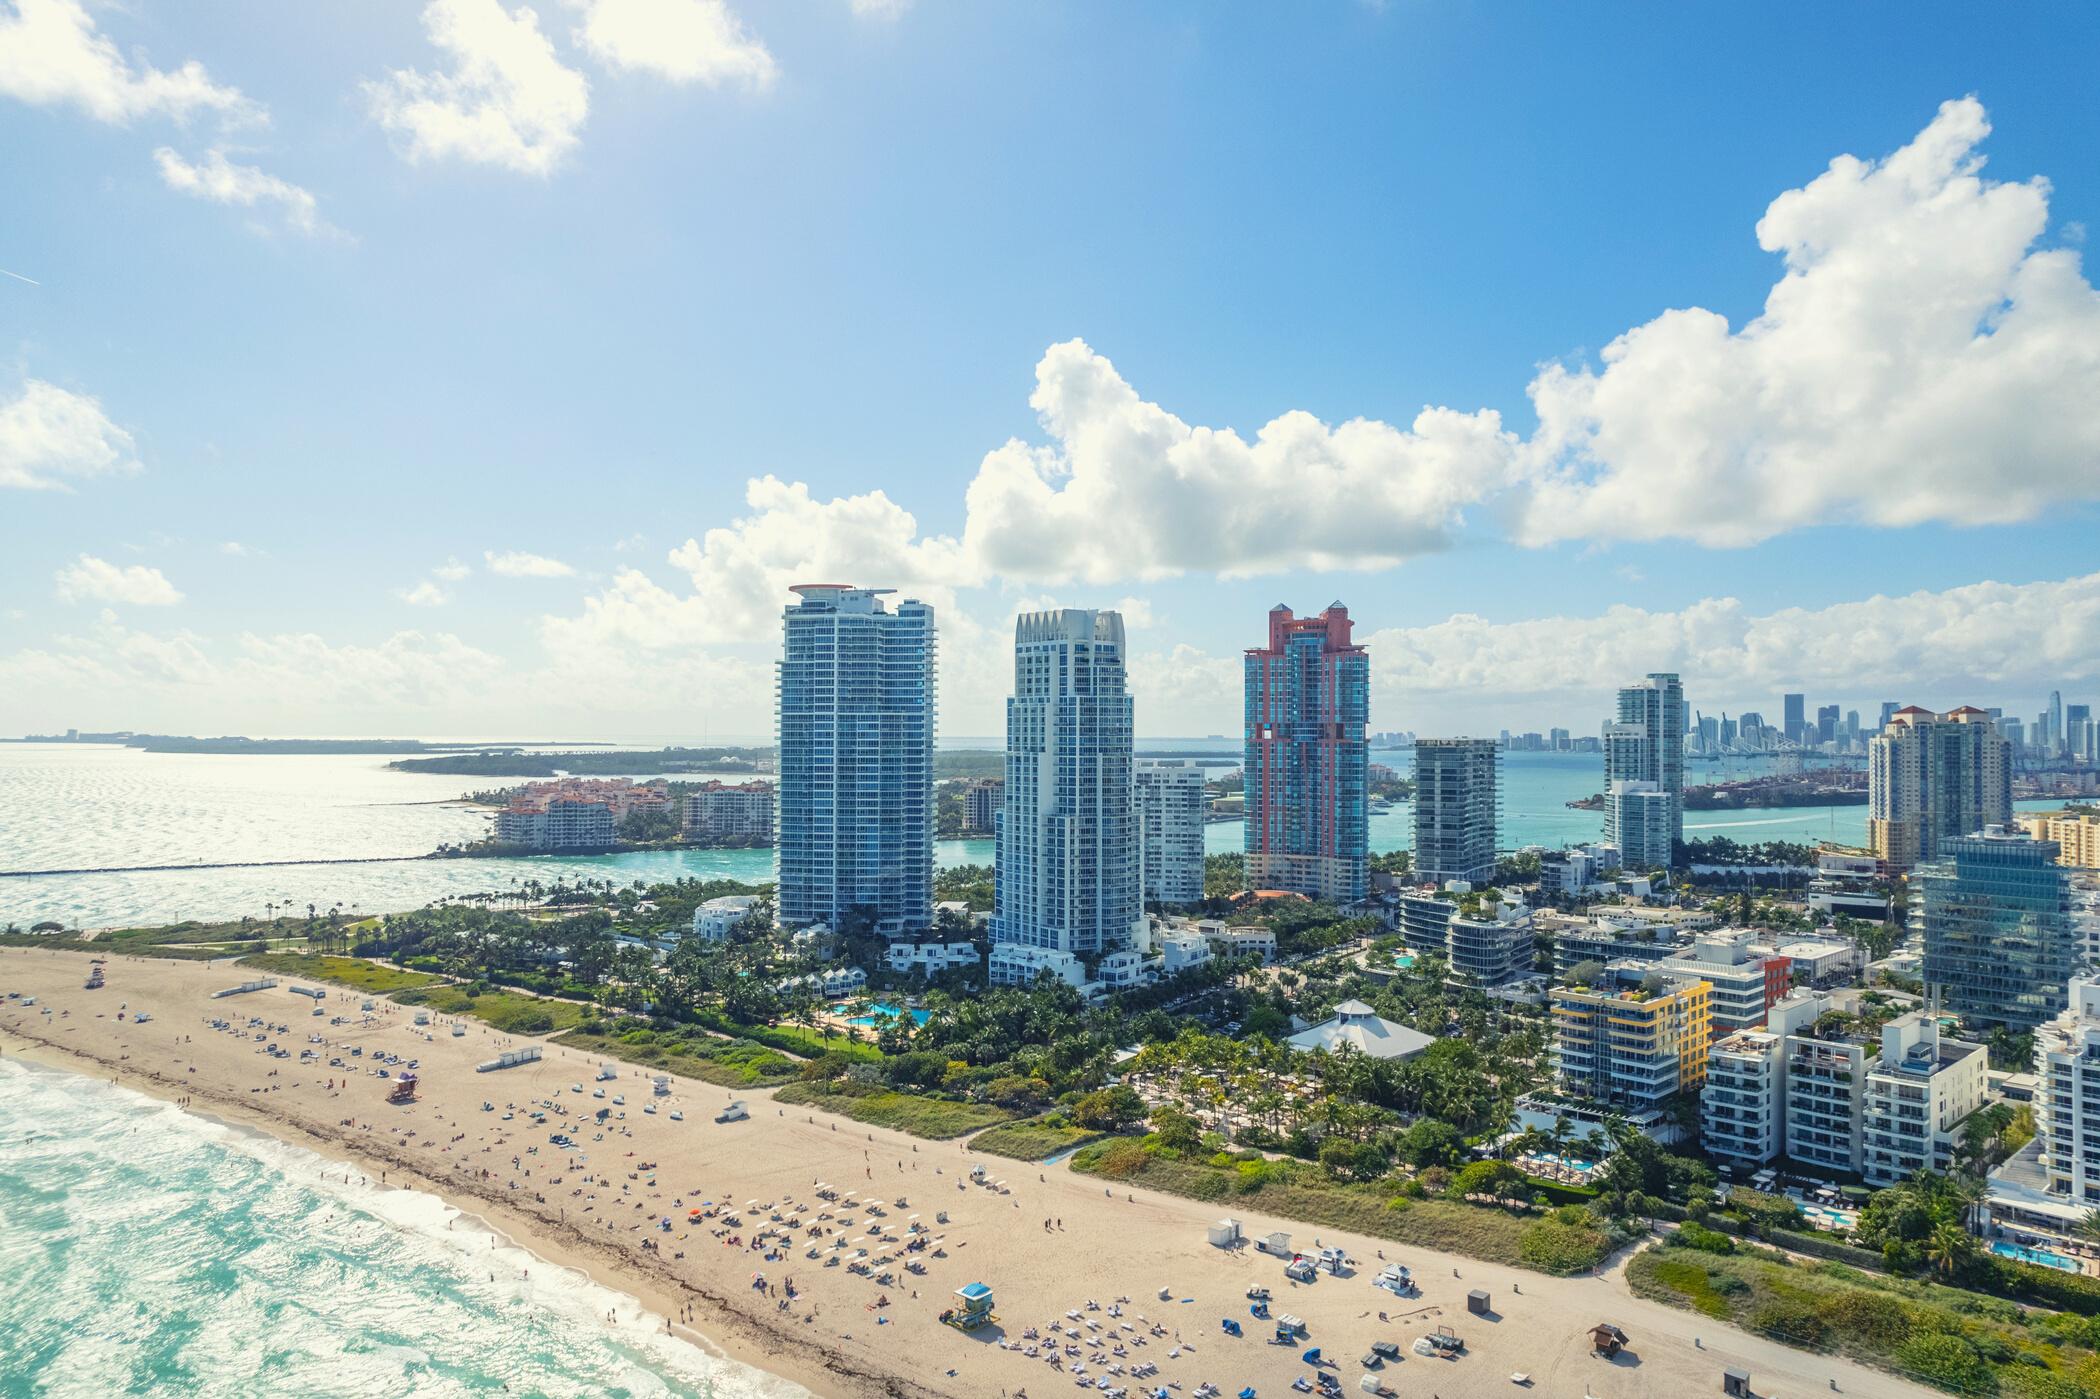
SOUTH OF FIFTH 2023 MIDYEAR MARKET REPORT
© 2023 EQUAL HOUSING OPPORTUNITY THIS IS NOT AN INTENTION TO SOLICIT LISTING FROM OTHER BROKERS ALL MATERIALS PRESENTED HEREIN IS INTENDED IS INTENDED FOR INFORMATION PURPOSES ONLY WHILE THIS INFORMATION IS BELIEVED TO BE CORRECT, IT IS REPRESENTED SUBJECT TO ERRORS, OMISSIONS, CHANGES OR WITHDRAWAL WITHOUT NOTICE
PREPARED BY THE APTTEAM AT DOUGLAS ELLIMAN
CONTENT
Jan through June average sales price 2019-2023
Y-O-Y change for homes & condos

Jan through June sales price by month
# of sales per bed count
Condo breakdown by <$1M, $1M-$2M, $5M-$10M & $10M+ with MSI
Buildings' stats & Y-O-Y with months supply of inventory
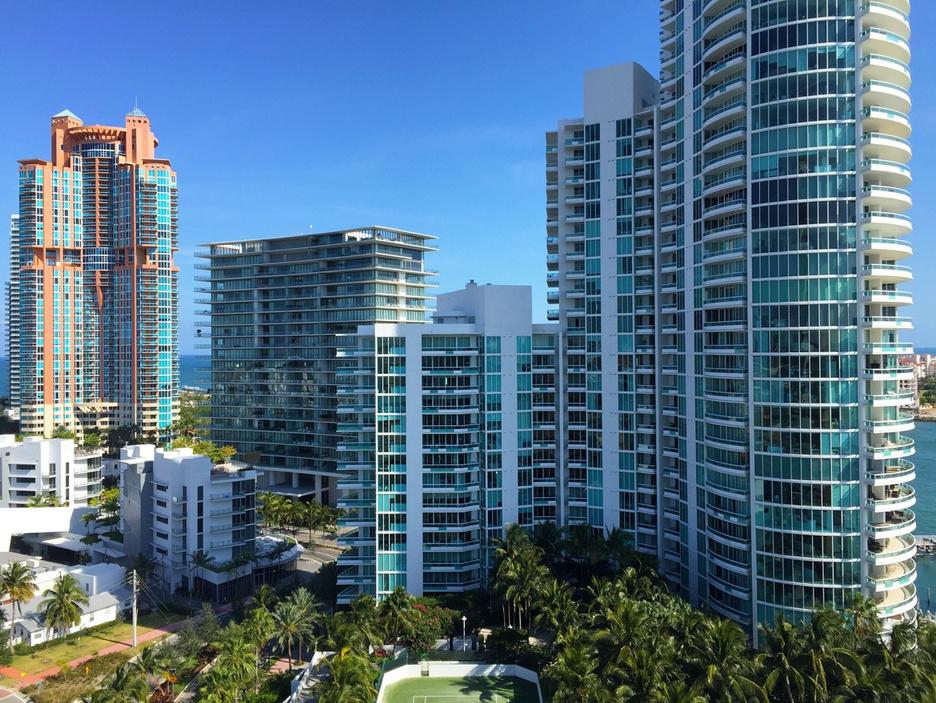
SOUTH OF FIFTH
The purpose of this study is to help you understand the dynamics of Miami's different markets and get an insight into South of Fifth's market performance and trends When considering an investment in Miami's real estate, the best decision is always a result of the best information.

Our highest priority for our clients is to preserve and protect their legacy

For forecast or projections for South of Fifth for the remainder of the year or any other specific market, please contact us.
This APT Market study was compiled from data obtained from the MLS It was made with information of sales through June 30, 2023 While it pertains to the surveyed area’s sales, it doesn’t include any off market sales The information contained herein is deemed accurate, but can’t be relied upon We are not responsible or liable for input, calculation errors and/or errors of omissions and market changes We always advise those who wish to utilize this data to corroborate such information for themselves Equal Housing Opportunity This is not an intention to solicit listing from other brokers
PAGE | 02 786.493.1388 | 786.214.0099 adriana@theaptteam.con | tracy@theaptteam.com www theaptteam com Adriana Pinto-Torres & Tracy Ferrer Realtor Associates | Directors of Luxury Sales Cofounders of The APT TEAM ABOUT THIS STUDY JAN VS. JUNE PERIOD
SOUTH OF FIFTH
PAGE | 02 MID YEAR HIGHLIGHTS
Rea cy after the The ut up 23% befo Ave Pac Pric ear-ago leve us year. The rst 6 mon
South of Fifth real estate is beginning to see its market normalize following the pandemic but still is performing better than prepandemic levels with average sales prices 23.86% more than in 2019. It is down 25.9% from Covid's peak in 2021 and 14.9% from previous year. But it is up $369,913 for the same period in 2019.
$3,000,000 $2,000,000 SOUTH OF FIFTH JAN VS. JUNE PERIOD AVG SALES PRICE 2019 2020 2021 2022 $1,550,450 $1,226,652 $2,593,713 $2 256 393
CURRENT ACTIVE:155
MONTHS SUPPLY OF INVENTORY based on closed sales: 7 2
CURRENT ACTIVE:105
MONTHS SUPPLY OF INVENTORY based on closed sales: 10
SoFi is gradually calibrating after the pandemic-era sales surge. The average sales price across all levels is down 14.9% from a year ago. But, yhis is also over 369% higher than Miami-Dade's average sales price of $409,000 for condos traded during Jan-June 2023. Average sales per square foot for all condos slipped by 5.2%. In the $1M+ sector, condos prices are trading on average 16.4% less Y-O-Y. Pace of market for $1M+ condos edged last year's pace by 1.6%.
SOUTH OF FIFTH 245 $2,256,393 $1,246 105 129 $1,920,363 $1,181 101 47% 5.2% 3.8% Jan-June 23 % Jan-June 22 AVG SALES PRICE AVG SPS/SF AVG DOM # CLOSED 14.9% 128 $3,847,080 $1,719 121 63 $3,212,954 $1,613 119 50 7% 6.2% 1 6% % AVG SALES PRICE AVG SPS/SF AVE DOM # CLOSED 16.4% ALL CONDOS $1M+ CONDOS
Jan-June
Jan-June
23
22
JANUARY VS.
Price trend indicators in SoFi in May and June is significant down year-ago levels with February, March and April trending higher than previous year. Average sales price for June of this year dropped by 53%. Condos sold in June 2023 were smaller than those sold in June 2022. The average bedroom count sold in June 2023 was 1 bed while in June 2022 was 2 beds. Sales size fell pulling condo average sales prices and sales prices per square foot lower, thus creating such a large price disparity between these two Junes.
SOUTH OF FIFTH Jan Feb March April May June $3,000,000 $2,000,000 $1,000,000 $0 2022 2023 AVG SALES PRICE BY MONTH FOR ALL CONDOS
JUNE
Jan Feb March April May June $1,639,580 $2,611,125 $2,644,133 $2,490,100 $1,291,123 $1,066,735 $2,116,199 $2,076,260 $2,558,745 $2,218,794 $2,205,582 $2,285,758 2023 2022 % -22.5% 25.7% 3.3% 12.4% -41.4% -53 3% 2 1,520 $2,285,758 $1,179 AVG # BEDS SOLD AVG SQFT 1 972 $1,066,735 $930 N/A -53.3% -21.1% June 23 % June 22 AVG SP$ AVG SP$/SF 33 # CLOSED 17 -48.4% -36% 2023 MID YEAR AVG. 2022 MID YEAR AVG. $1,920,363 $2,256,393 JUNE 2023
VS JUNE 2022
AVE. # OF SALES BY MONTH 2023
TOTAL # OF SALES 129
AVE # OF SALES BY MONTH 2022
TOTAL # OF SALES 245
The number of sales has decreased by 47% for all condos for the first 6 months of the year and 50% for $1M+ condos which can be attributed to meteoric prices of luxury and ultra luxury condos during extreme conditions of the pandemic housing boom in 2021 and 2022 and limited inventory in some price levels among other factors.
SOUTH OF FIFTH
Jan 12 March April May June Jan 48 March April May 33 20 Feb 30 18 32 17 30 Feb 52 33 49 June
The entry level into SoFi outperforms the Miami condo $409,000 average sales price by nearly 22% and yet prices in this bracket haven't dropped. Also comparisons against pre-pandemic conditions may tell us that the $10M+ price tier is adjusting its absolute prices to 2019. In 2019, there were 3 condos sold in the $10M+ range for an ave. sales price of $11.83M. However, while the $10M+ condo prices have slightly decreased, average sales price/sqft has risen to
or 24.9% Y-O-Y.
SOUTH OF FIFTH < $1M CONDOS 118 $520,253 $726 AVG SALES PRICE AVG SPS/SF AVG DOM # CLOSED 62 $523,531 $713 0 6% -47.4% -1 7% Current active: 49 MONTHS SUPPLY OF INVENTORY: Jan-June 23 % Jan-June 22 4 73 based on closed sales $1M-$2M CONDOS 45 $1,337,089 $1,130 91 AVG SALES PRICE AVG SPS/SF AVG DOM # CLOSED 36 $1,391,747 $1,154 82 4 % -20% -1 7% -10.9% Current active: 3 MONTHS SUPPLY OF INVENTORY: Jan-June 23 % Jan-June 22 5.5 based on closed sales $2M-$5M CONDOS 53 $3,173,911 $1.616 142 AVG SALES PRICE AVG SPS/SF AVG DOM # CLOSED 17 $3,103,765 $1,640 152 -2 2% -67 9% 1 4% 6.5% Current active: 41 MONTHS SUPPLY OF INVENTORY: Jan-June 23 % Jan-June 22 14.4 based on closed sales $5M-$10M CONDOS 24 $7,262,083 $2,611 100 AVG SALES PRICE AVG SPS/SF AVG DOM # CLOSED 11 $6,891,000 $2,418 166 -5.1% -54.1% -7.3% 66% Current active: 25 MONTHS SUPPLY OF INVENTORY: Jan-June 23 % Jan-June 22 13 6 based on closed sales $10M+ CONDOS 9 $12,700,000 $3,213 186 AVG SALES PRICE AVG SPS/SF AVG DOM # CLOSED 3 $12,200,000 $4,014 205 -5 1% -66.6% 24 9% 10 2% Current active: 9 MONTHS SUPPLY OF INVENTORY: Jan-June 23 % Jan-June 22 18 based on closed sales
$4,014
BY BUILDING 321 OCEAN 1 $9,000,000 $2,403 123 AVG SALES PRICE AVG SPS/SF AVG DOM # CLOSED 0 $0 $0 0 Current active: 2 MONTHS SUPPLY OF INVENTORY: Jan-June 23 % Jan-June 22 No comps for data CONTINUUM SOUTH 12 $5,185,417 $2,573 222 AVG SALES PRICE AVG SPS/SF AVG DOM # CLOSED 5 $5,229,000 $3,252 71 84% -58 3% 26 3% -68% Current active: 13 MONTHS SUPPLY OF INVENTORY: Jan-June 23 % Jan-June 22 15 6 based on closed sales ICON 19 $2,235,211 $1,228 123 AVG SALES PRICE AVG SPS/SF AVG DOM # CLOSED 9 $2,205,556 $1,302 42 -1 3% -58 3% 6% 65.8% Current active: 7 MONTHS SUPPLY OF INVENTORY: Jan-June 23 % Jan-June 22 4 6 based on closed sales CONTINUUM NORTH 16 $5,198,125 $2,558 120 AVG SALES PRICE AVG SPS/SF AVG DOM # CLOSED 5 $4,638,000 $2,834 152 -10 8% - 68 7% 10 8% 26.6% Current active: 8 MONTHS SUPPLY OF INVENTORY: Jan-June 23 % Jan-June 22 9.6 based on closed sales APOGEE 6 $11,533,333 $3,015 156 AVG SALES PRICE AVG SPS/SF AVG DOM # CLOSED 2 $12,850,000 $3,481 270 11% -66 6% 15 4% 73% Current active: 3 MONTHS SUPPLY OF INVENTORY: Jan-June 23 % Jan-June 22 9 based on closed sales N/A N/A N/A N/A MAREA 5 $2,416,555 $1,390 104 AVG SALES PRICE AVG SPS/SF AVG DOM # CLOSED 2 $2,087,500 $1,205 85 -13 6% -60% - 6% 18.2% Current active: 2 MONTHS SUPPLY OF INVENTORY: Jan-June 23 % Jan-June 22 6 based on closed sales
BY BUILDING MURANO GRANDE 13 $2,811,154 $1,310 62 AVG SALES PRICE AVG SPS/SF AVG DOM # CLOSED 7 $2,844,429 $1,224 163 Current active: 11 MONTHS SUPPLY OF INVENTORY: Jan-June 23 % Jan-June 22 9 5 OCEAN HOUSE 3 $13,516,667 $2,918 80 AVG SALES PRICE AVG SPS/SF AVG DOM # CLOSED 0 0 0 0 N/A N/A N/A N/A Current active: 0 MONTHS SUPPLY OF INVENTORY: Jan-June 23 % Jan-June 22 No comps for data PORTOFINO TOWERS 8 $2,667,500 $1,153 158 AVG SALES PRICE AVG SPS/SF AVG DOM # CLOSED 5 $4,847,080 $1,496 132 1.3% -37 5% 29 7% -16.4% Current active: 7 MONTHS SUPPLY OF INVENTORY: Jan-June 23 % Jan-June 22 8 4 based on closed sales ONE OCEAN 11 $4,366,273 $1,669 154 AVG SALES PRICE AVG SPS/SF AVG DOM # CLOSED 0 0 0 0 N/A N/A N/A N/A Current active: 6 MONTHS SUPPLY OF INVENTORY: Jan-June 23 % Jan-June 22 No comps for data MURANO AT PORTOFINO 6 $2,950,833 $1,844 75 AVG SALES PRICE AVG SPS/SF AVG DOM # CLOSED 4 $6,330,000 $2,088 177 11% -33 3% 87.3% 136% Current active: 7 MONTHS SUPPLY OF INVENTORY: Jan-June 23 % Jan-June 22 10 6 based on closed sales -46% 1.18% -6.6% 62% SOUTH POINTE TOWERS 12 $1,274,542 $1,153 171 AVG SALES PRICE AVG SPS/SF AVG DOM # CLOSED 7 $1,580,571 $1,239 132 24% -41% 7 4% -22 8% Current active: 9 MONTHS SUPPLY OF INVENTORY: Jan-June 23 % Jan-June 22 7.7 based on closed sales YACHT CLUB 15 $886,200 $864 38 AVG SALES PRICE AVG SPS/SF AVG DOM # CLOSED 11 $996,591 $1,007 78 12.4% -26.6% 16.4% 51% Current active: 5 MONTHS SUPPLY OF INVENTORY: Jan-June 23 % Jan-June 22 2 8 based on closed sales

THANK YOU
