MIAMI BEACH MIAMI BEACH

- 1 -


The purpose of this study is to help you understand the dynamics of Miami’s different markets and get an insight into Miami Beach’s market performance and trends. When considering an investment in Miami’s real estate, the best decision is always a result of the best information.
Our highest priority for our clients is to preserve and protect their legacy. No one does more research about the Miami market than us. For forecast or projections for Miami for the remainder of the year or any other specific market, please contact us.

www.theaptteam.com


This APT Market study was compiled from data obtained from the MLS. It was made with information of sales through June 30, 2023. While it pertains to the surveyed area’s sales, it doesn’t include any off market sales. The information contained herein is deemed accurate, but can’t be relied upon. We are not responsible or liable for input, calculation errors and/or errors of omissions and market changes. We always advise those who wish to utilize this data to corroborate such information for themselves. Equal Housing Opportunity. This is not an intention to solicit listing from other brokers.


- Excluding previous year boom, average sales prices are at historic levels. They are up an astounding 67% from pre-Covid 2019
- The average sales price has decreased by 2.7%, bringing it to new record levels of $5,379,743 except for the average sales prices seen during last year’s housing boom
-The average sales price per square foot for all homes slipped 5% to $1,277/SF and for $1M+ homes by 8% to $1,323/SF
- Number of home and $1M+ home sales declined year over year


Excluding previous year boom, average sales prices are at historic levels. They are up an astounding 67% from pre-Covid 2019. In the $1M+ market, they are up from 23% from 2019. In the $1M+ home category, 4 bedrooms now trade 23% higher than 5 beds did in 2019.


The average sales price for all single-family homes slipped 2.7% from previous year and 6.5% for the $1M+ sector. Average sales prices are also down but have attained unprecedented heights post pandemic frenzy. Days on the market rose.


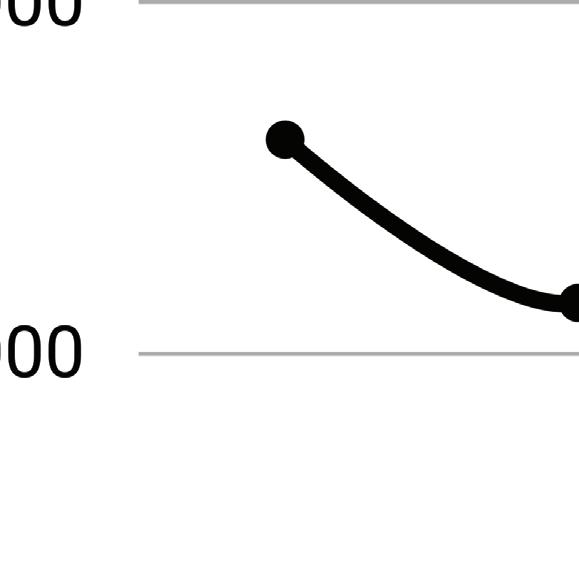
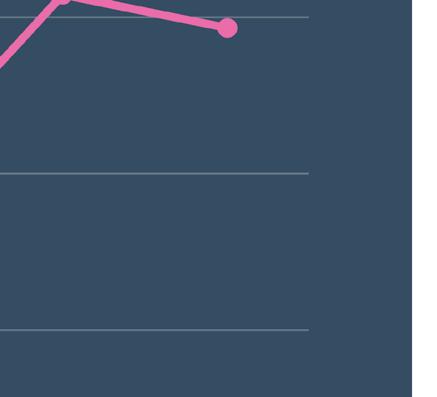
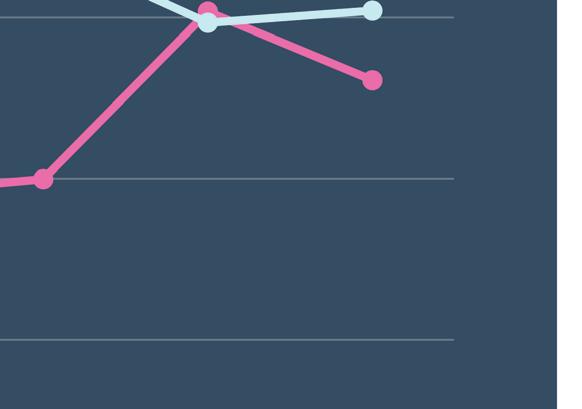
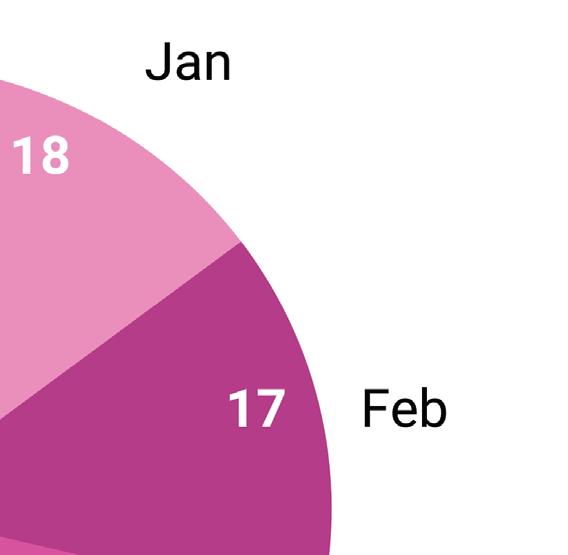
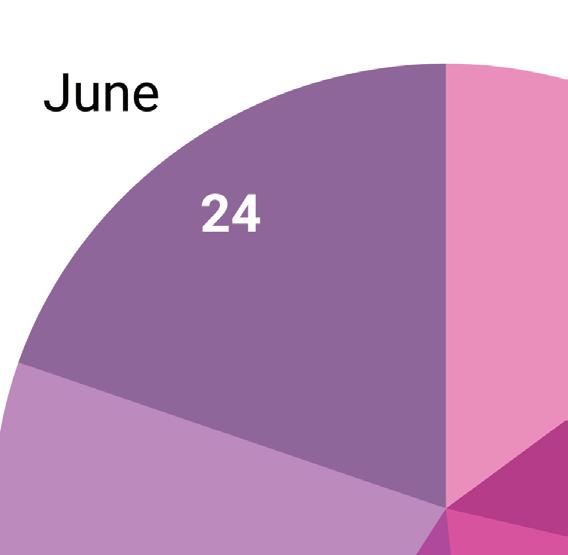
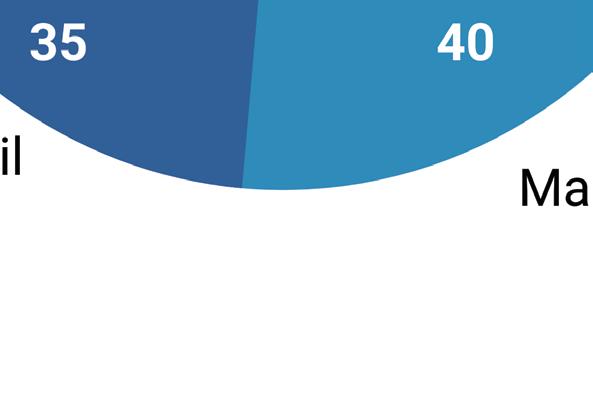
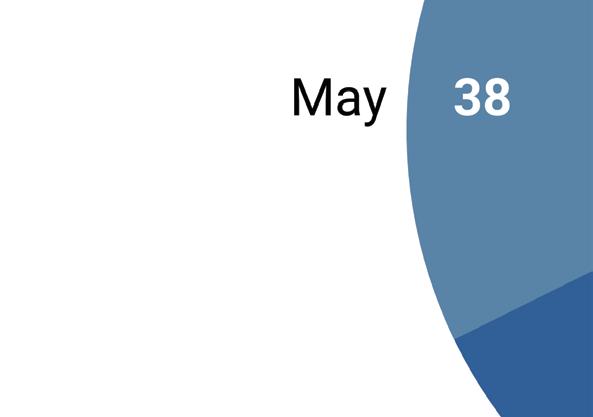
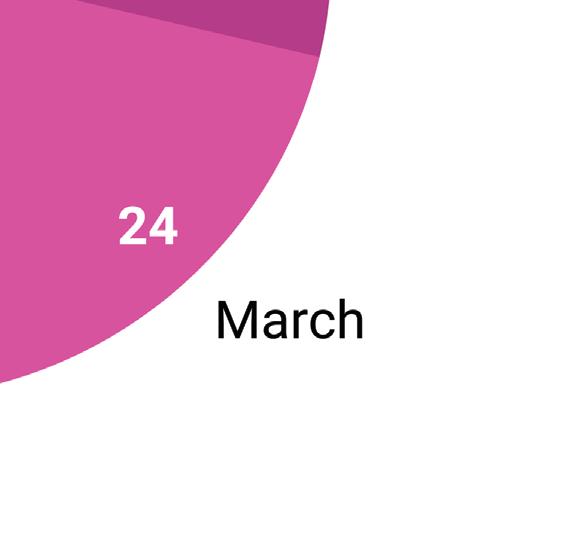
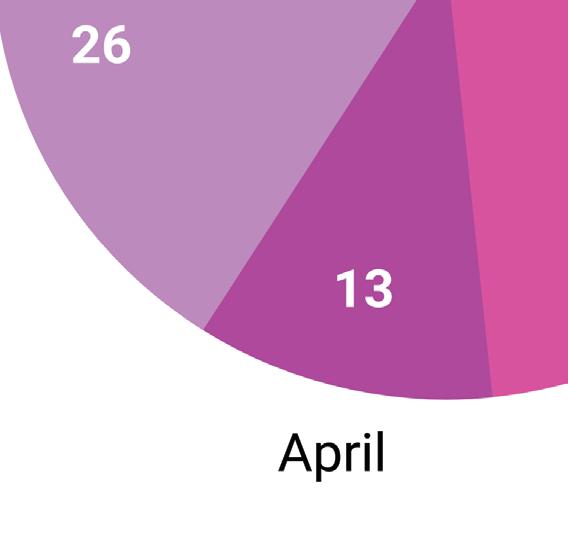
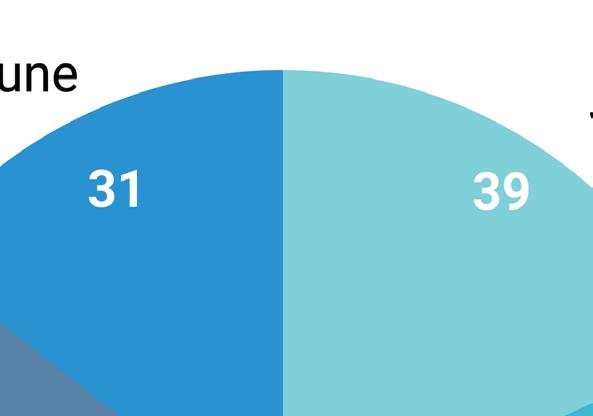
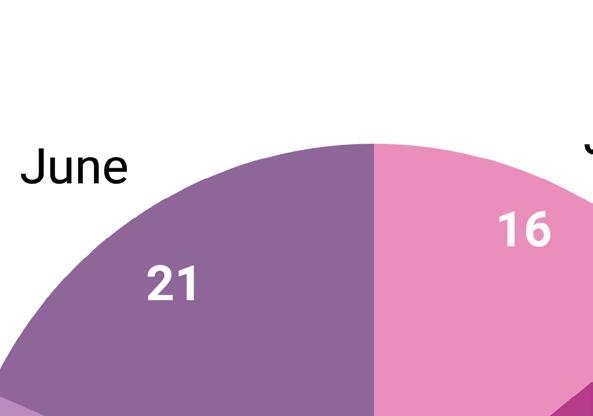
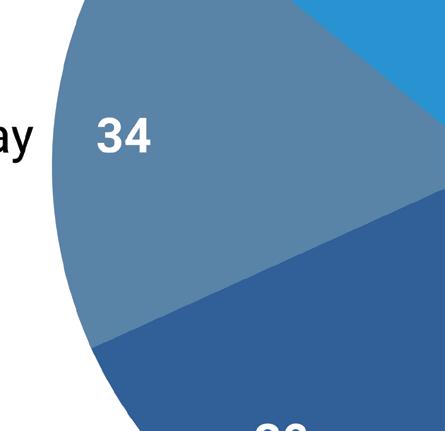
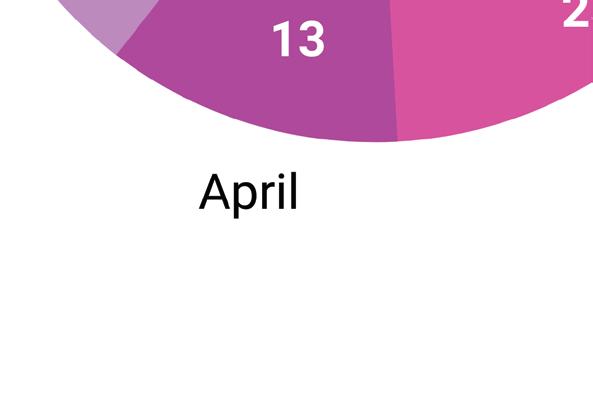
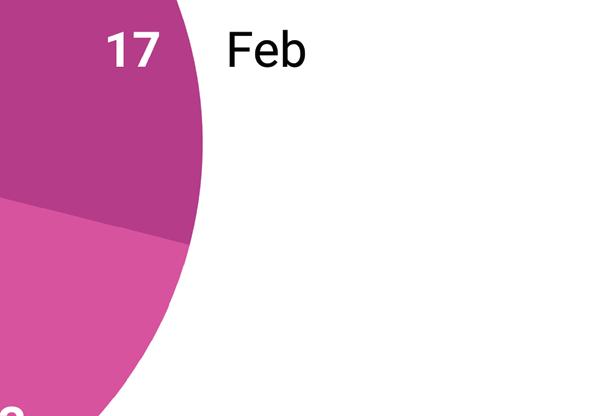
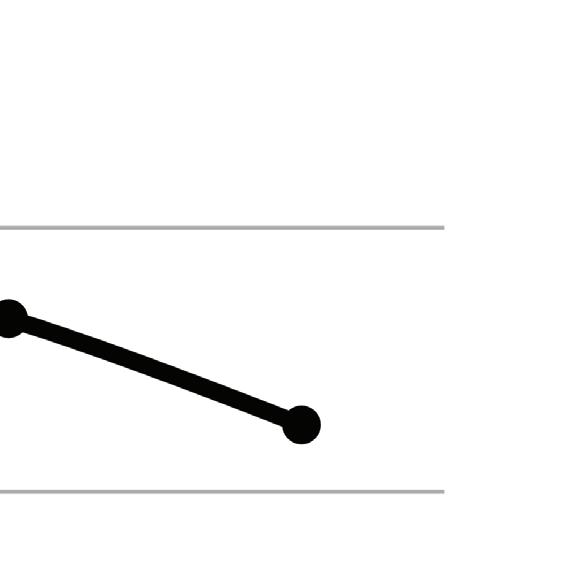
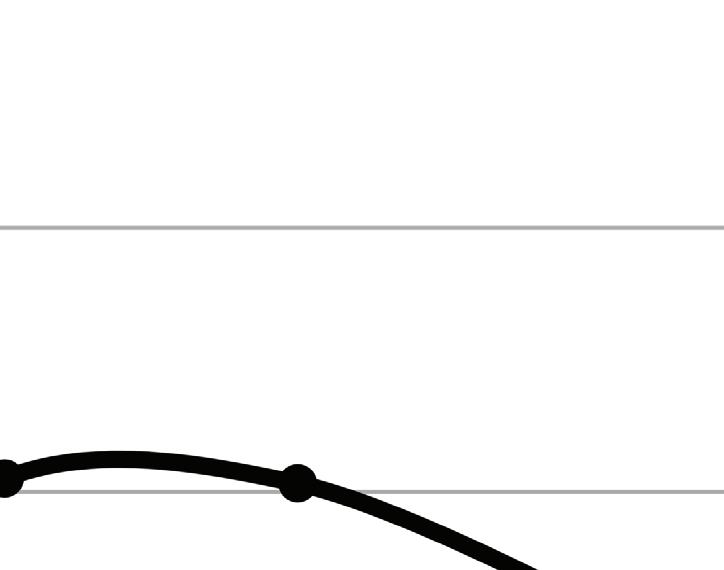
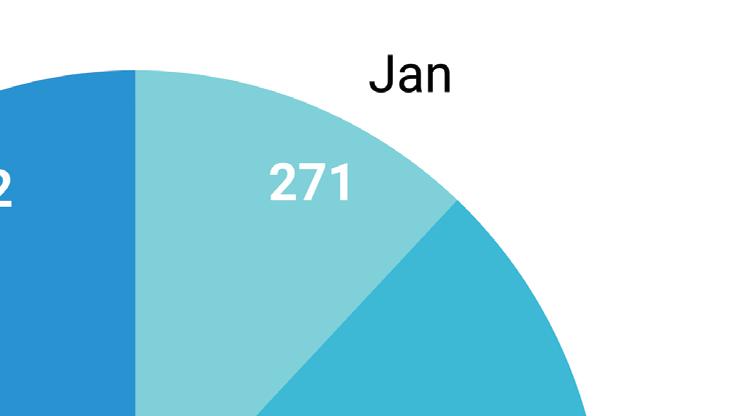
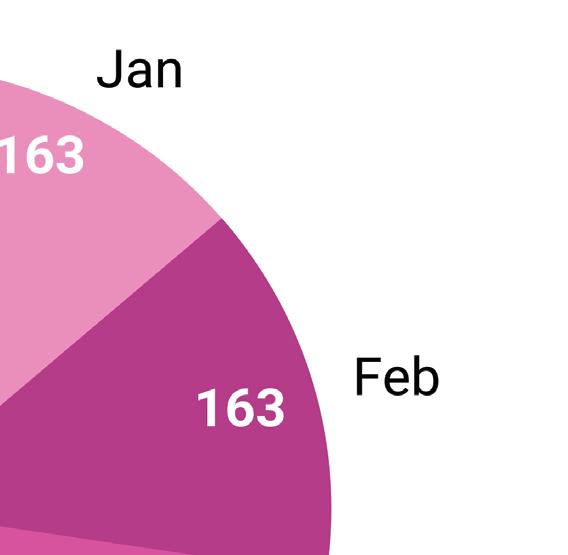
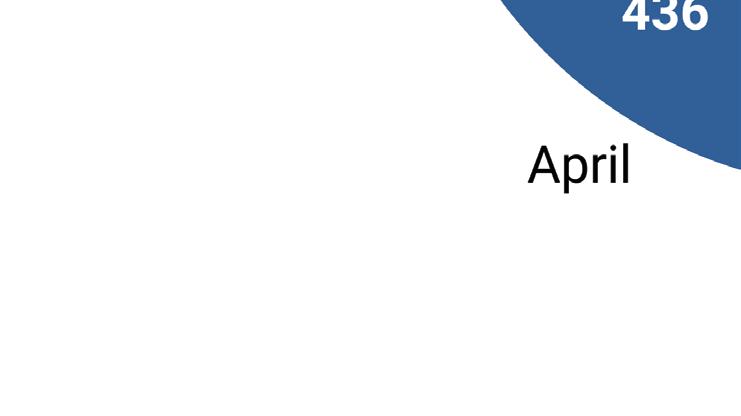
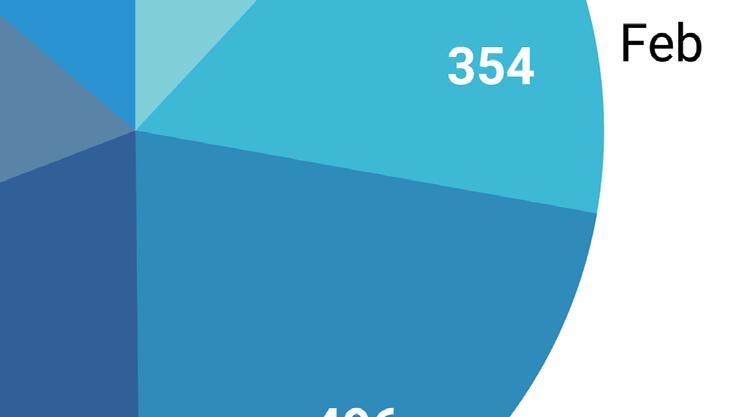
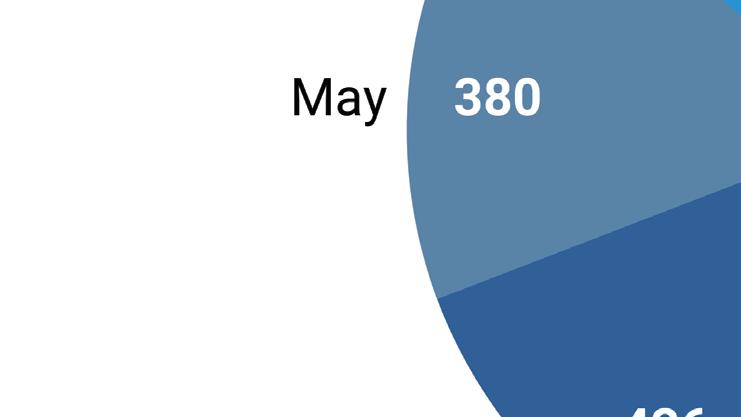
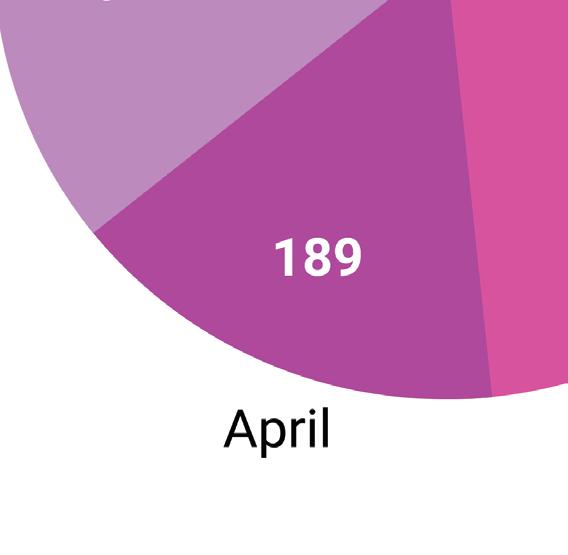
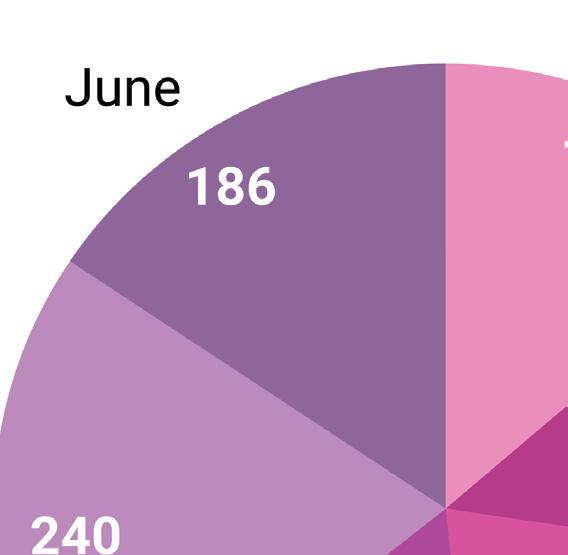
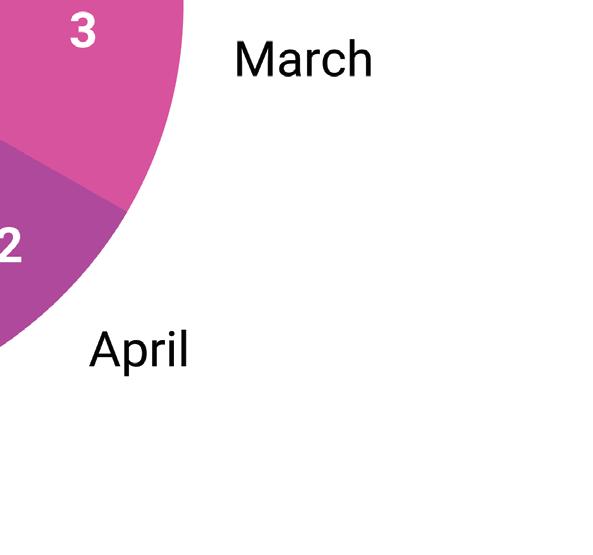
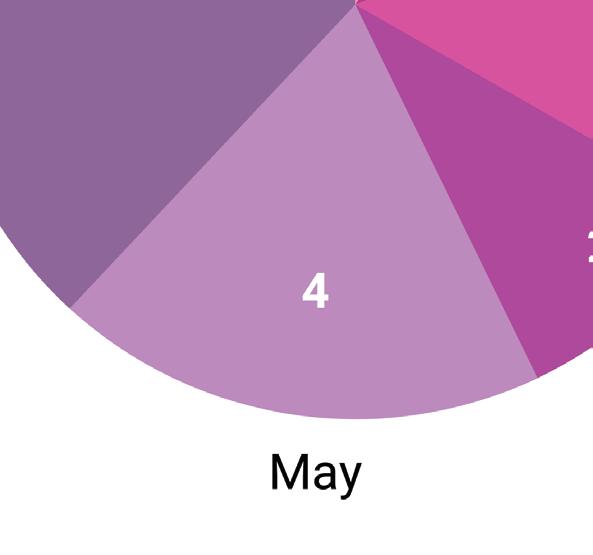
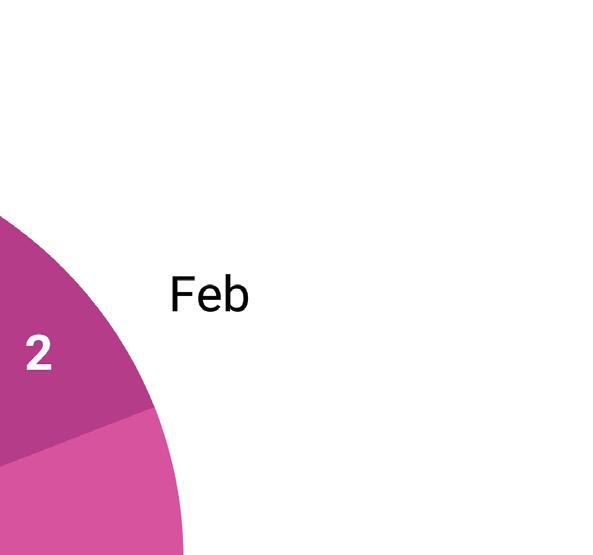
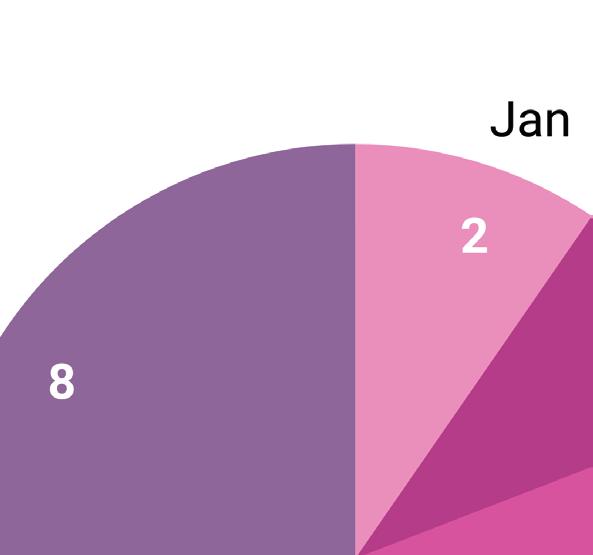
(right) February and March were the highest selling months for Miami Beach in both home categories.


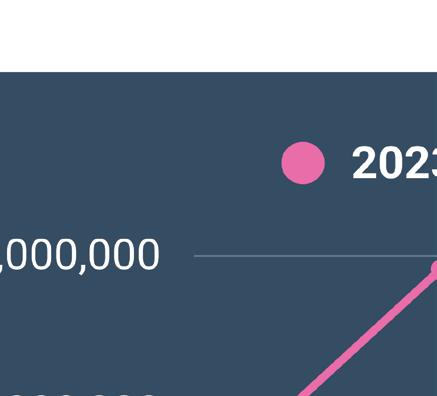


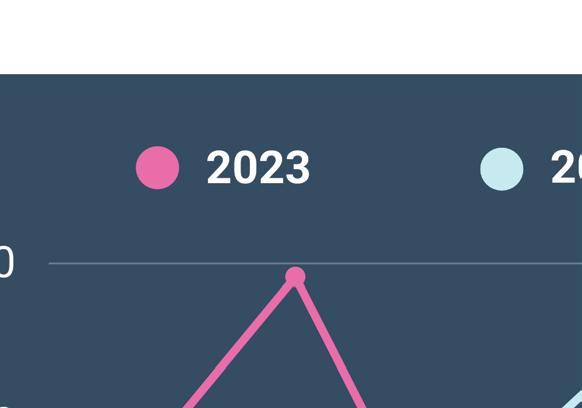


2023
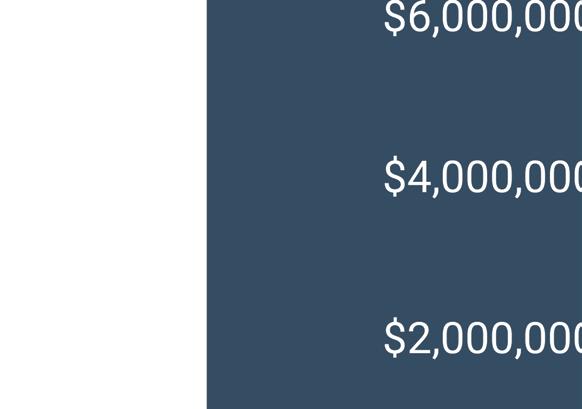
AVG. SALES BY MONTH
Total number of sales: 122
2022


AVG. SALES BY MONTH


Total number of sales: 214


2023
AVG. SALES BY MONTH
Total number of sales: 115


2022


AVG. SALES BY MONTH

Total number of sales: 192


The real estate market for condos and townhomes in Miami Beach is beginning to readjust following the impact of the pandemic, yet it continues to exceed the levels seen before the pandemic.The average sales price is now $814,000 for a one bedroom. Conversely, two bedrooms in the $1M+ condo/townhome sector now trade at $2,563,847.


Sales volume is returning to normalcy after the Covid-19 frenzy, with the number sold reduced by 50%. Pace of market for all condos has quicken, reducing the average days on market by nearly 23%. In the $1M+ category, there is a 6.7% increase in average days on market. Average sales price per square foot for all condos/townhomes sold is up 3.1% the previous period in 2022.
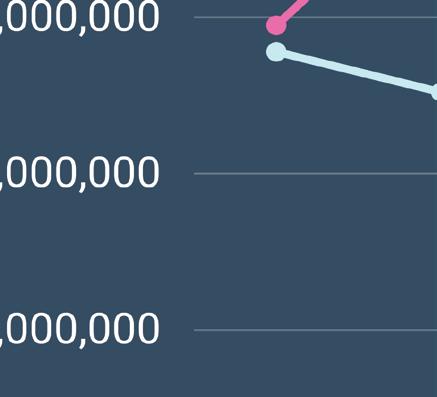
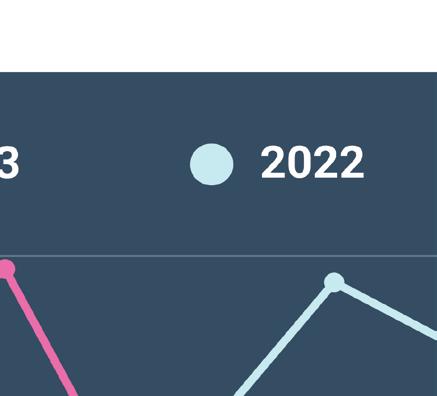
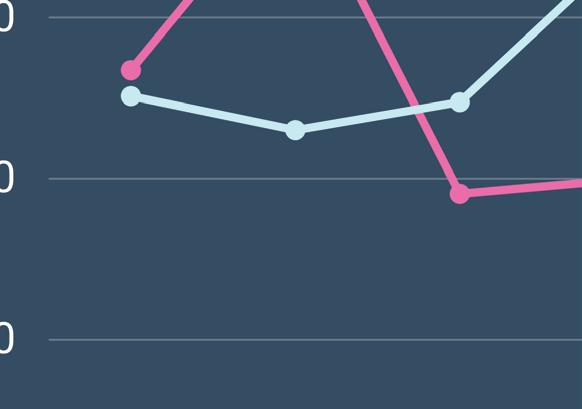
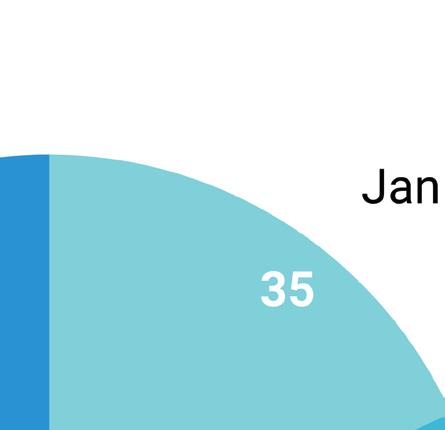
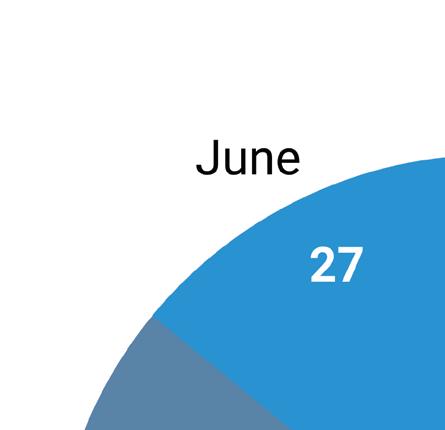
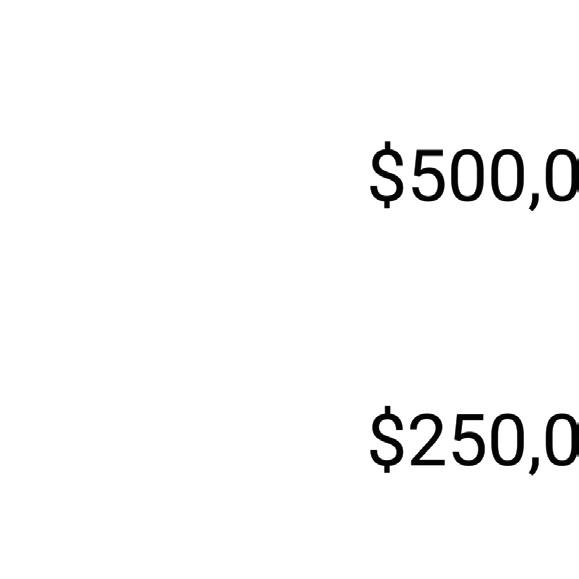
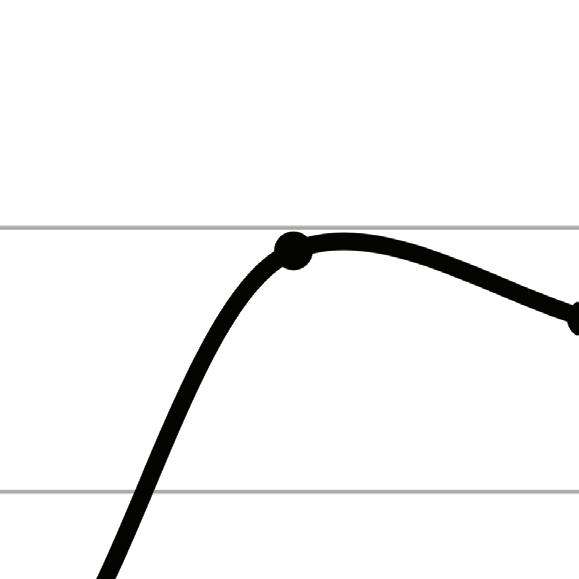
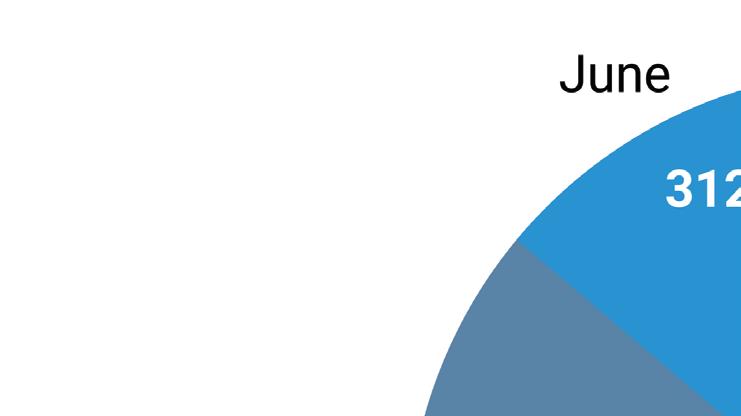
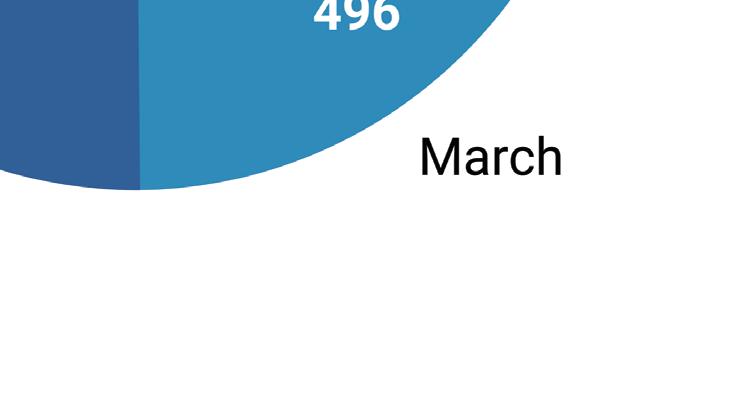
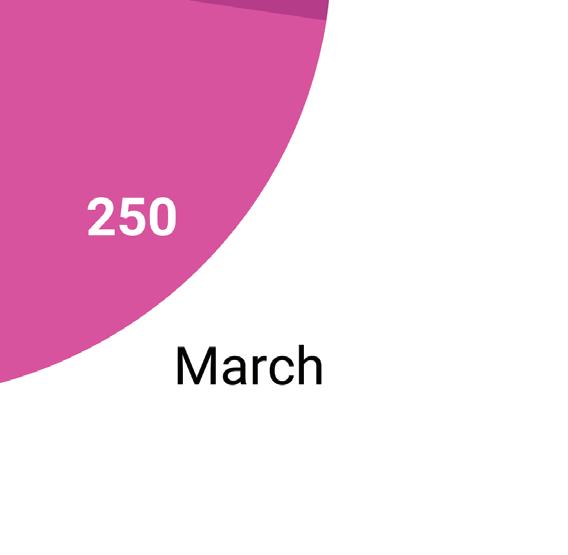
(right) Sales reached reached their peak in March, with the average price being around $1.1 million. Luxury condos priced at $1 million or more also peaked in March, with an average sales price of $3.4 million. It is worth noting that the average selling price for all Miamii-Dade county condos sold during the same period in 2023 was $409,000.


2023

AVG. SALES BY MONTH
Total number of sales: 1,191


2022
AVG. SALES BY MONTH
Total number of sales: 2,250

2023
AVG. SALES BY MONTH
Total number of sales: 21


2022


AVG. SALES BY MONTH


Total number of sales: 20


Working with The APT Team is more than just a transaction, it is a relationship built on trust and respect. We are obsessed with helping our clients achieve their real estate dreams and create a legacy that will last for generations. We believe in the power of a handshake, even in this digital age. With over $900M+ in sales and 5 languages spoken, we know that numbers are only part of the story. What matters most is you. After all, what you own is just as important as how and why you own it. The APT Team at Douglas Elliman, where your legacy is our obsession.

“WHERE YOUR LEGAGY IS OUR OBSESSION” THE APT TEAM
© 2023. Equal housing opportunity. This is not an intention to solicit listing from other brokers. We cooperate with them fully. This advertisement does not constitute an offer in the states of NY or NJ or any jurisdiction where prior regulations or other qualifications are required