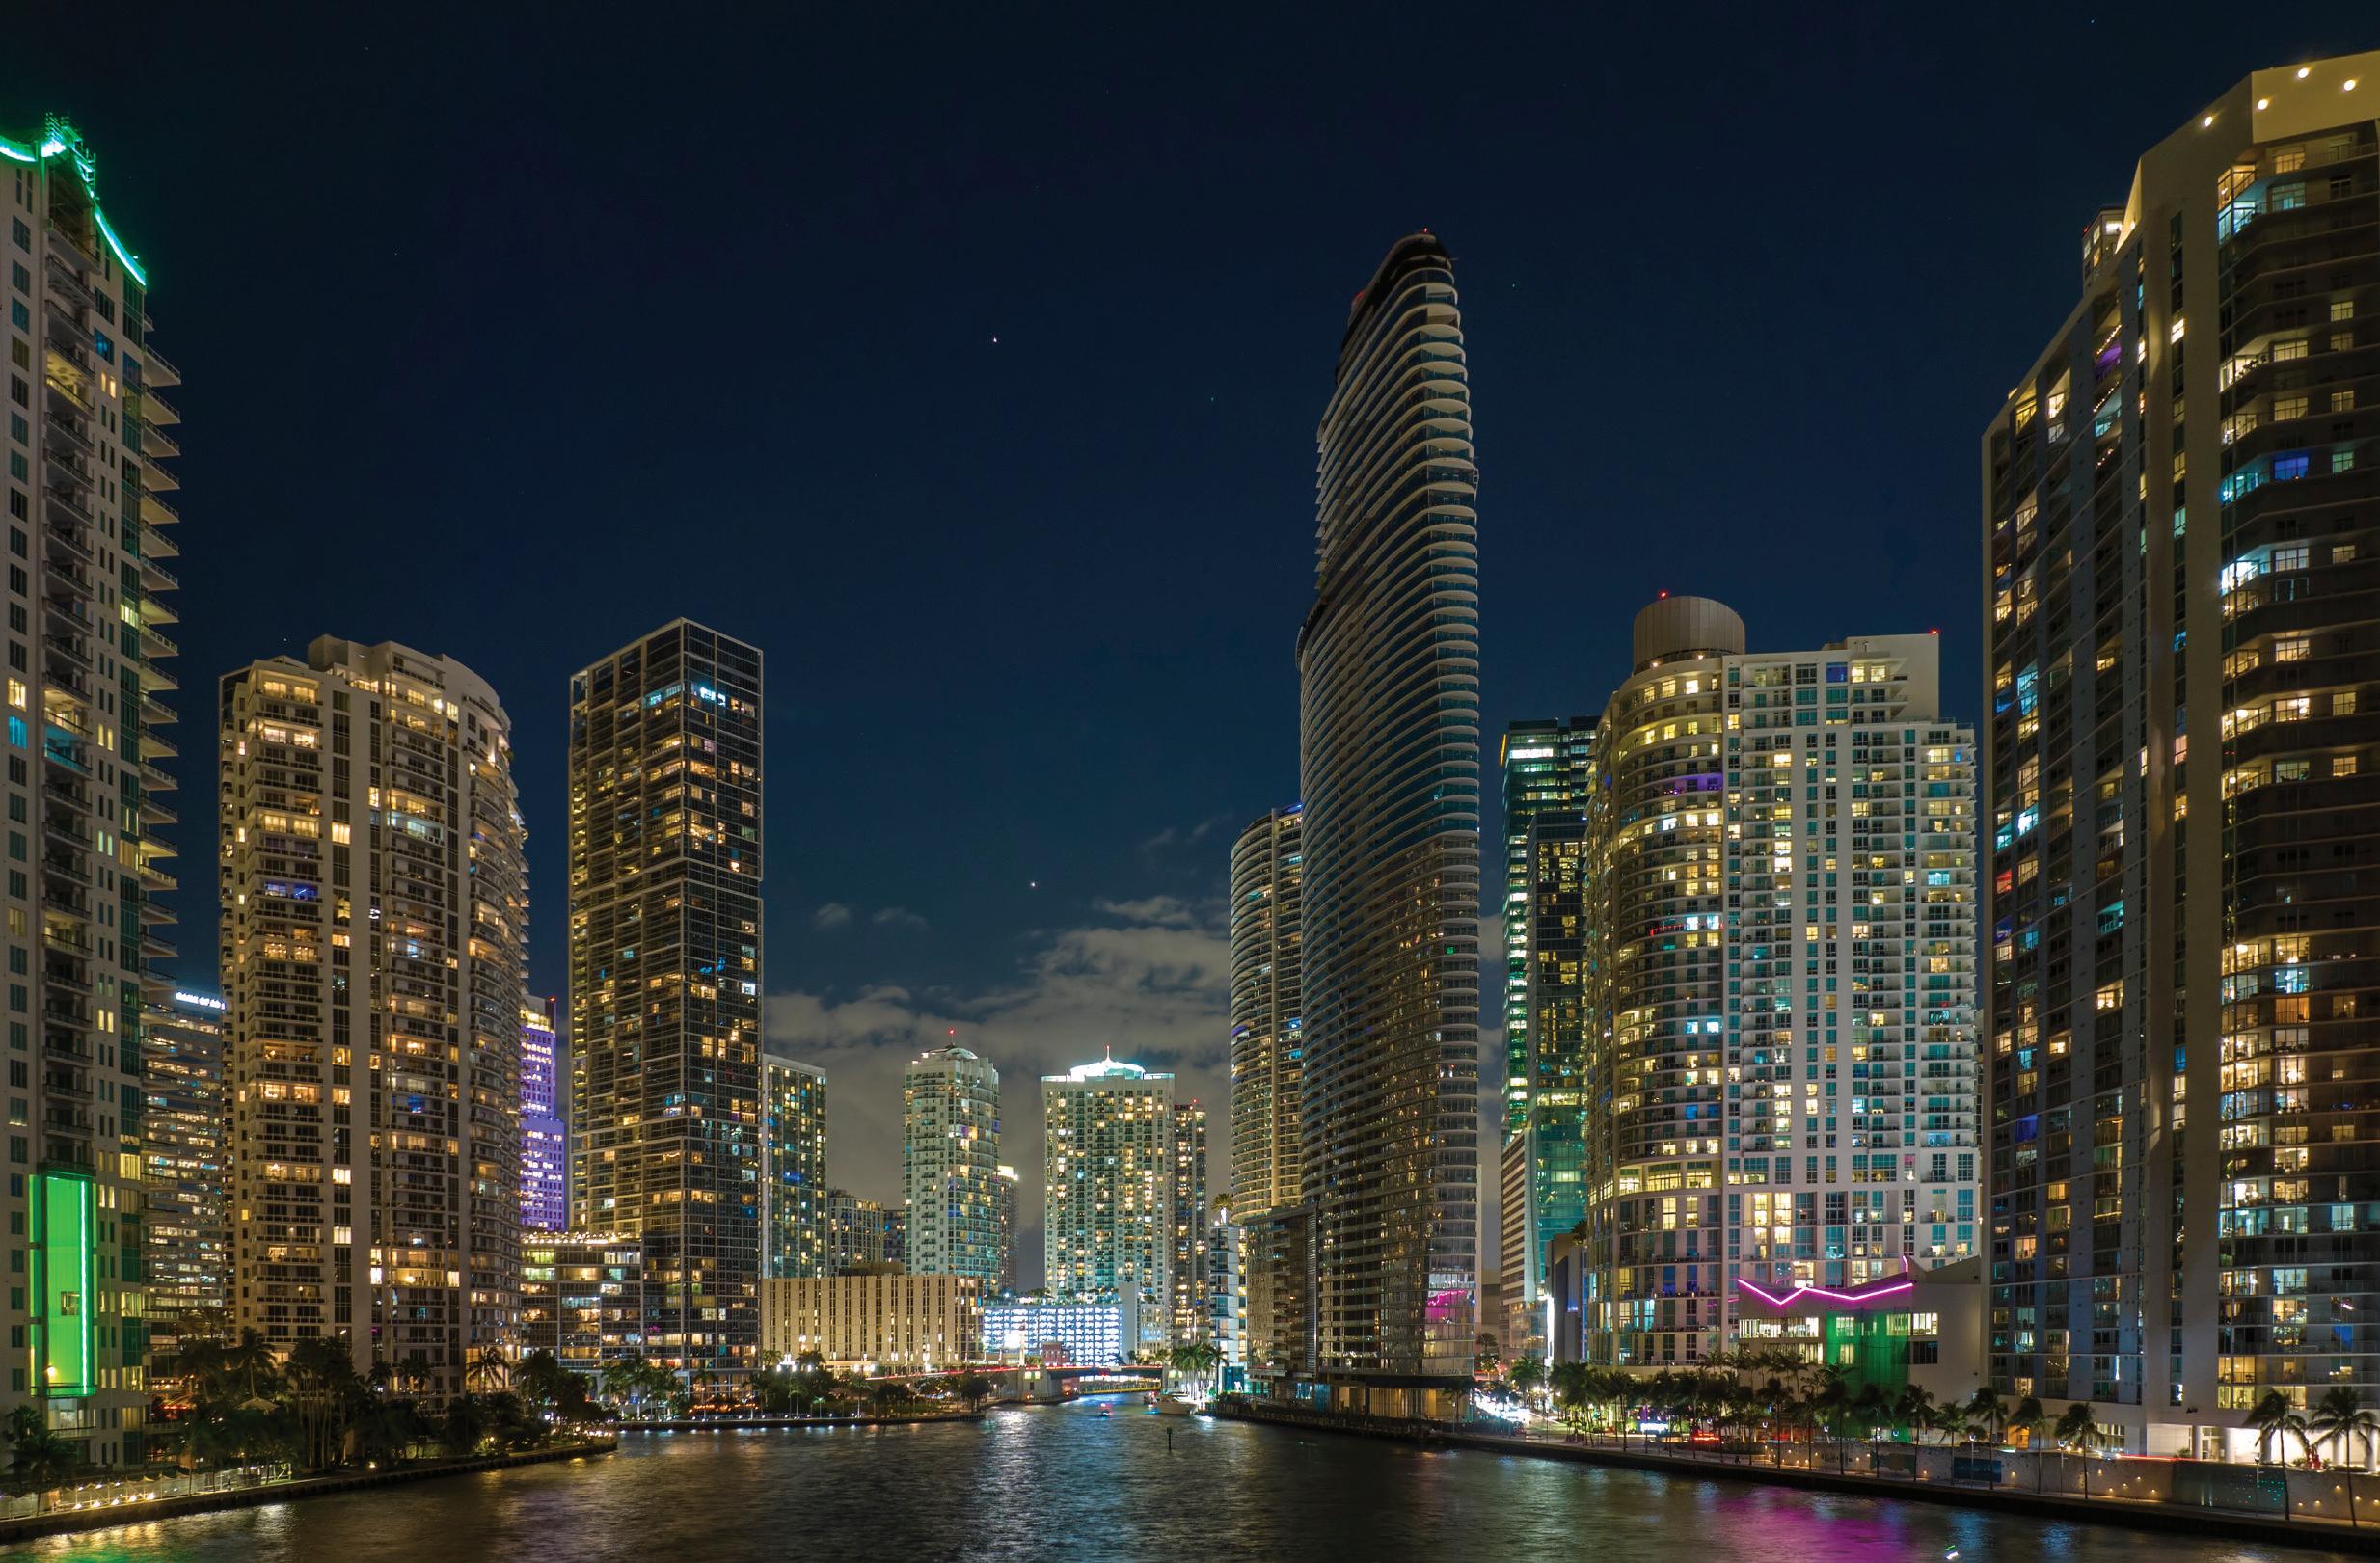
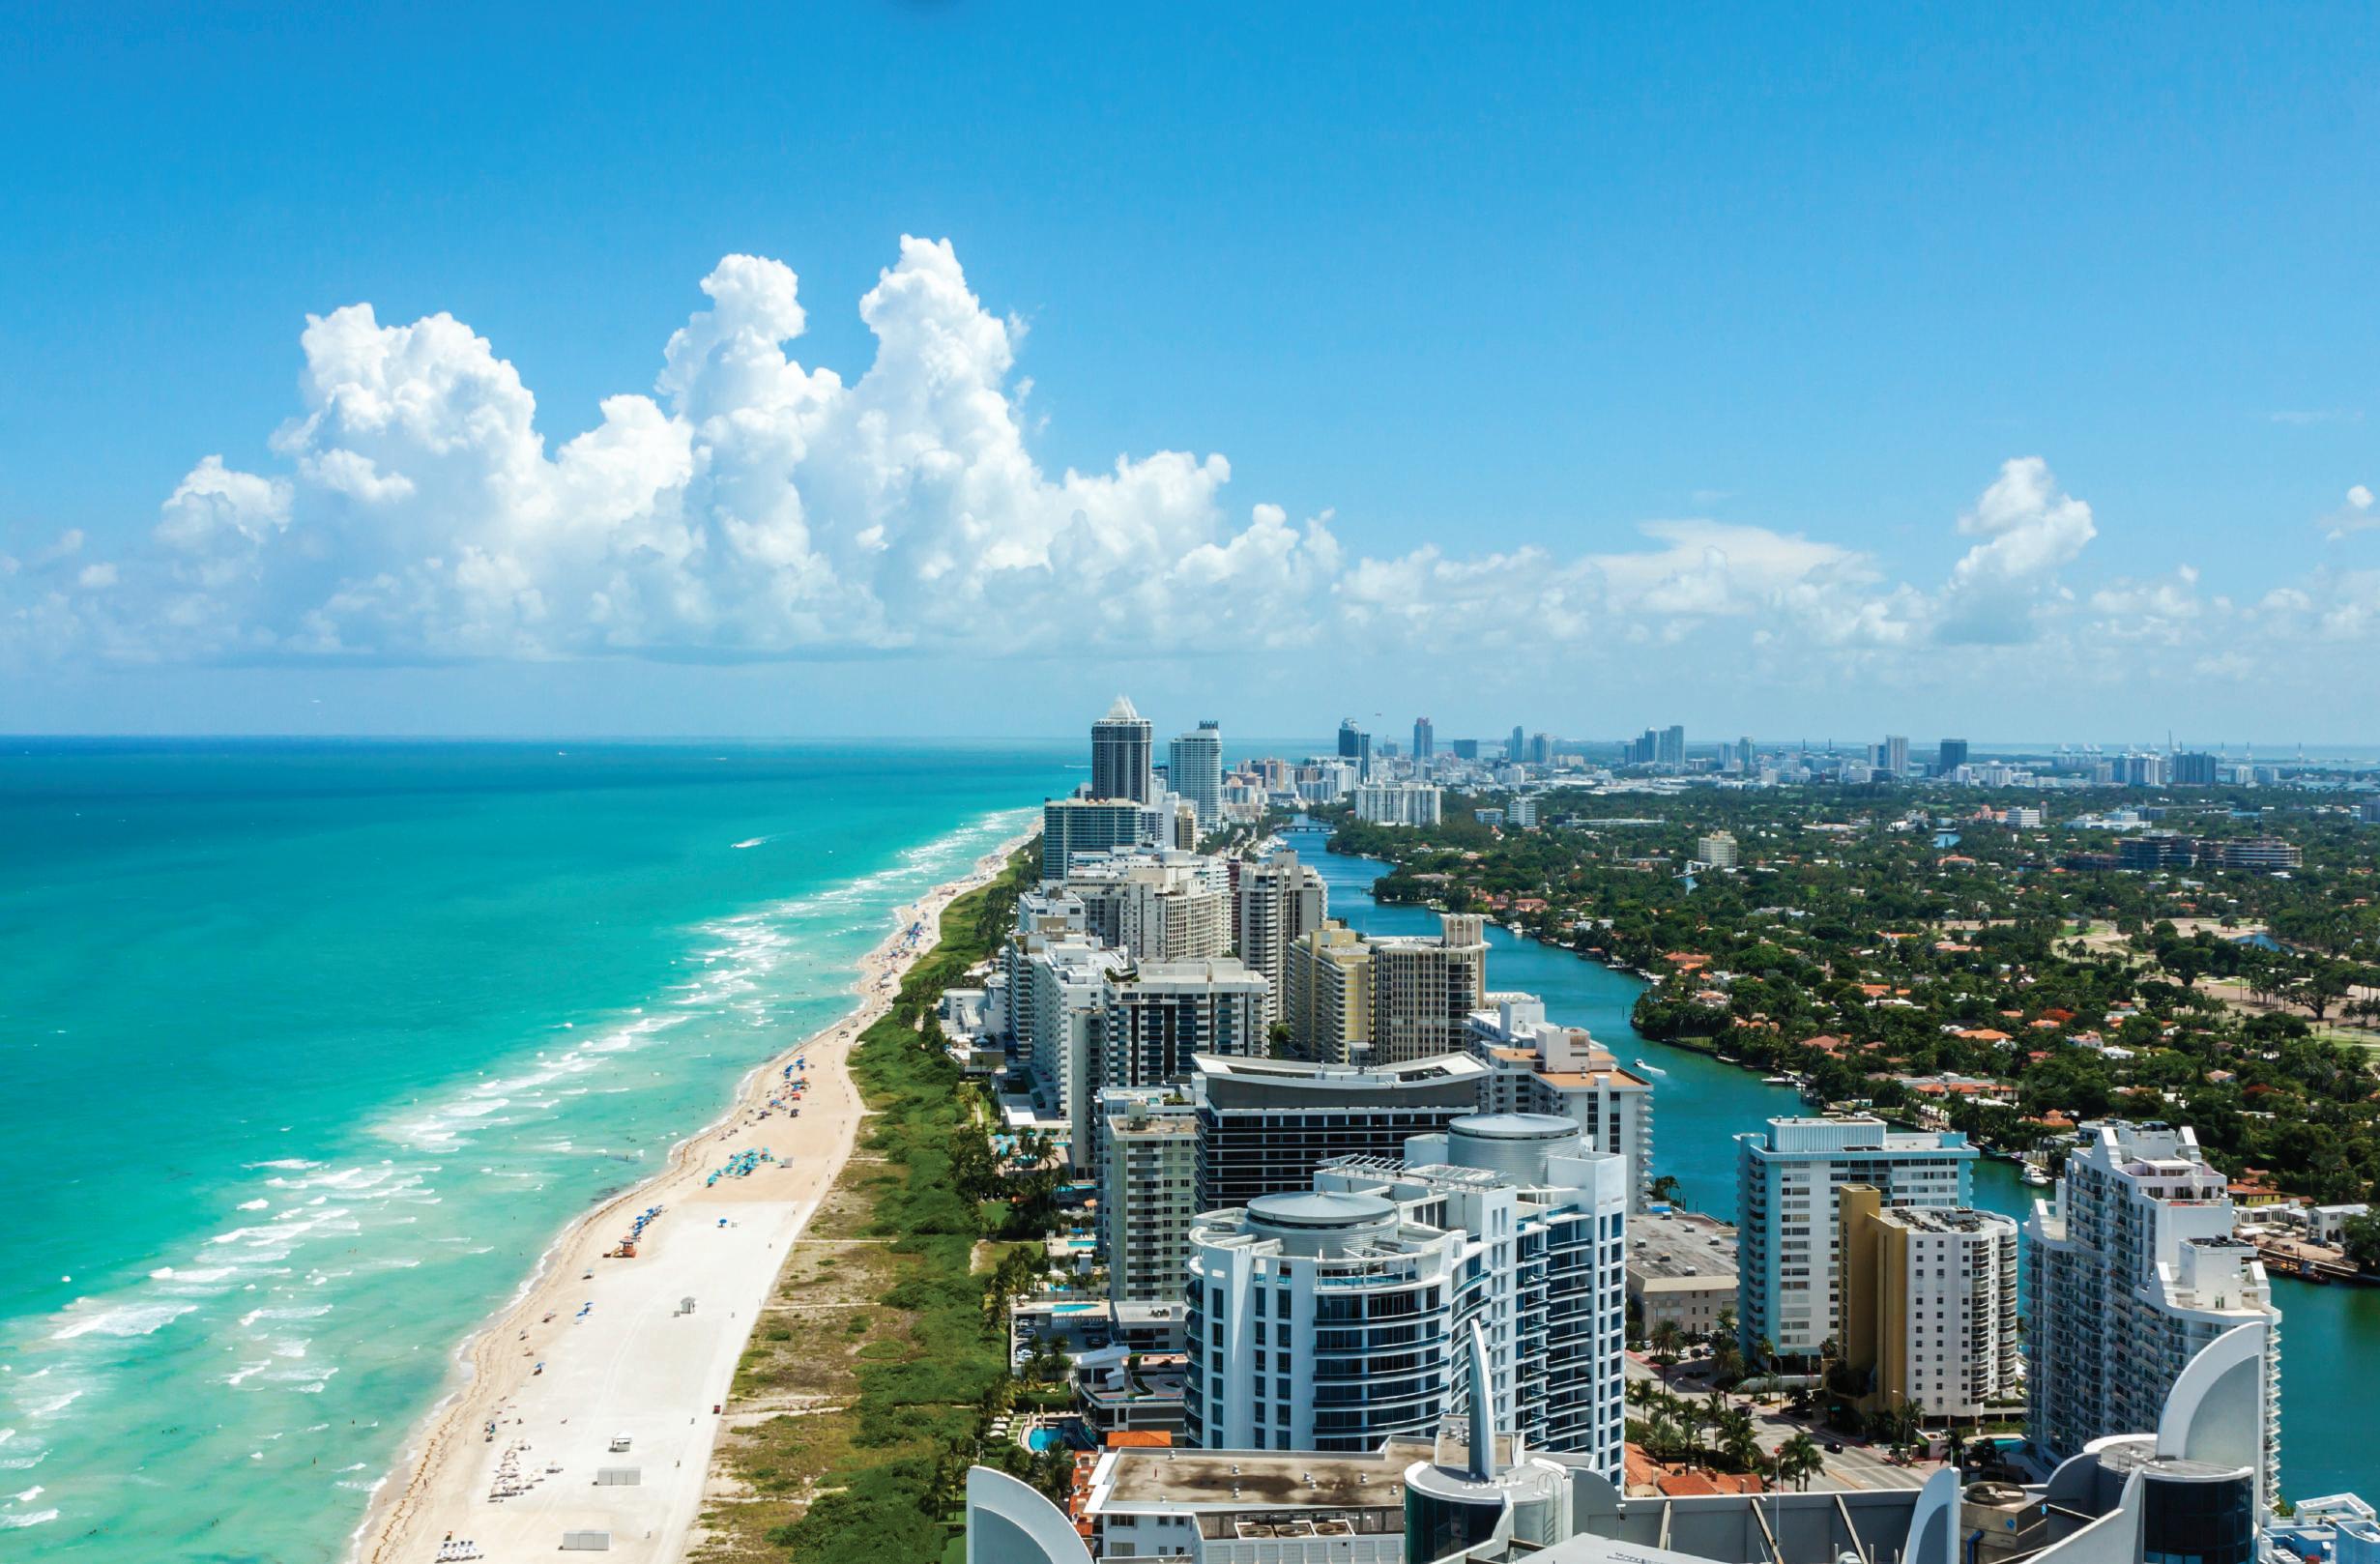
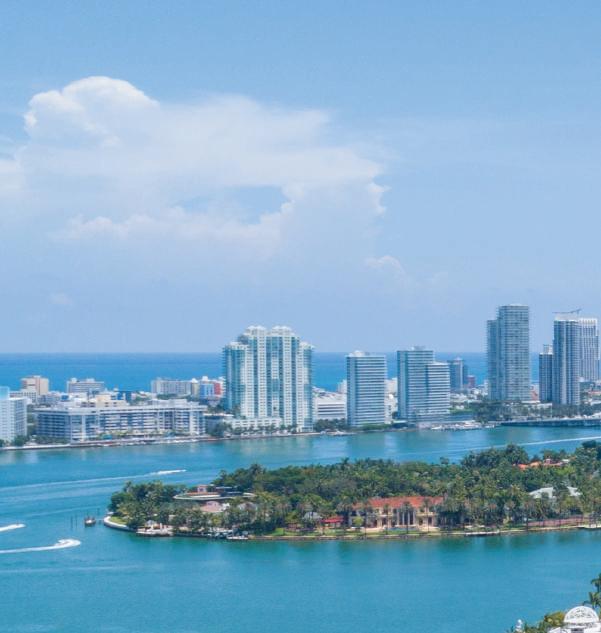
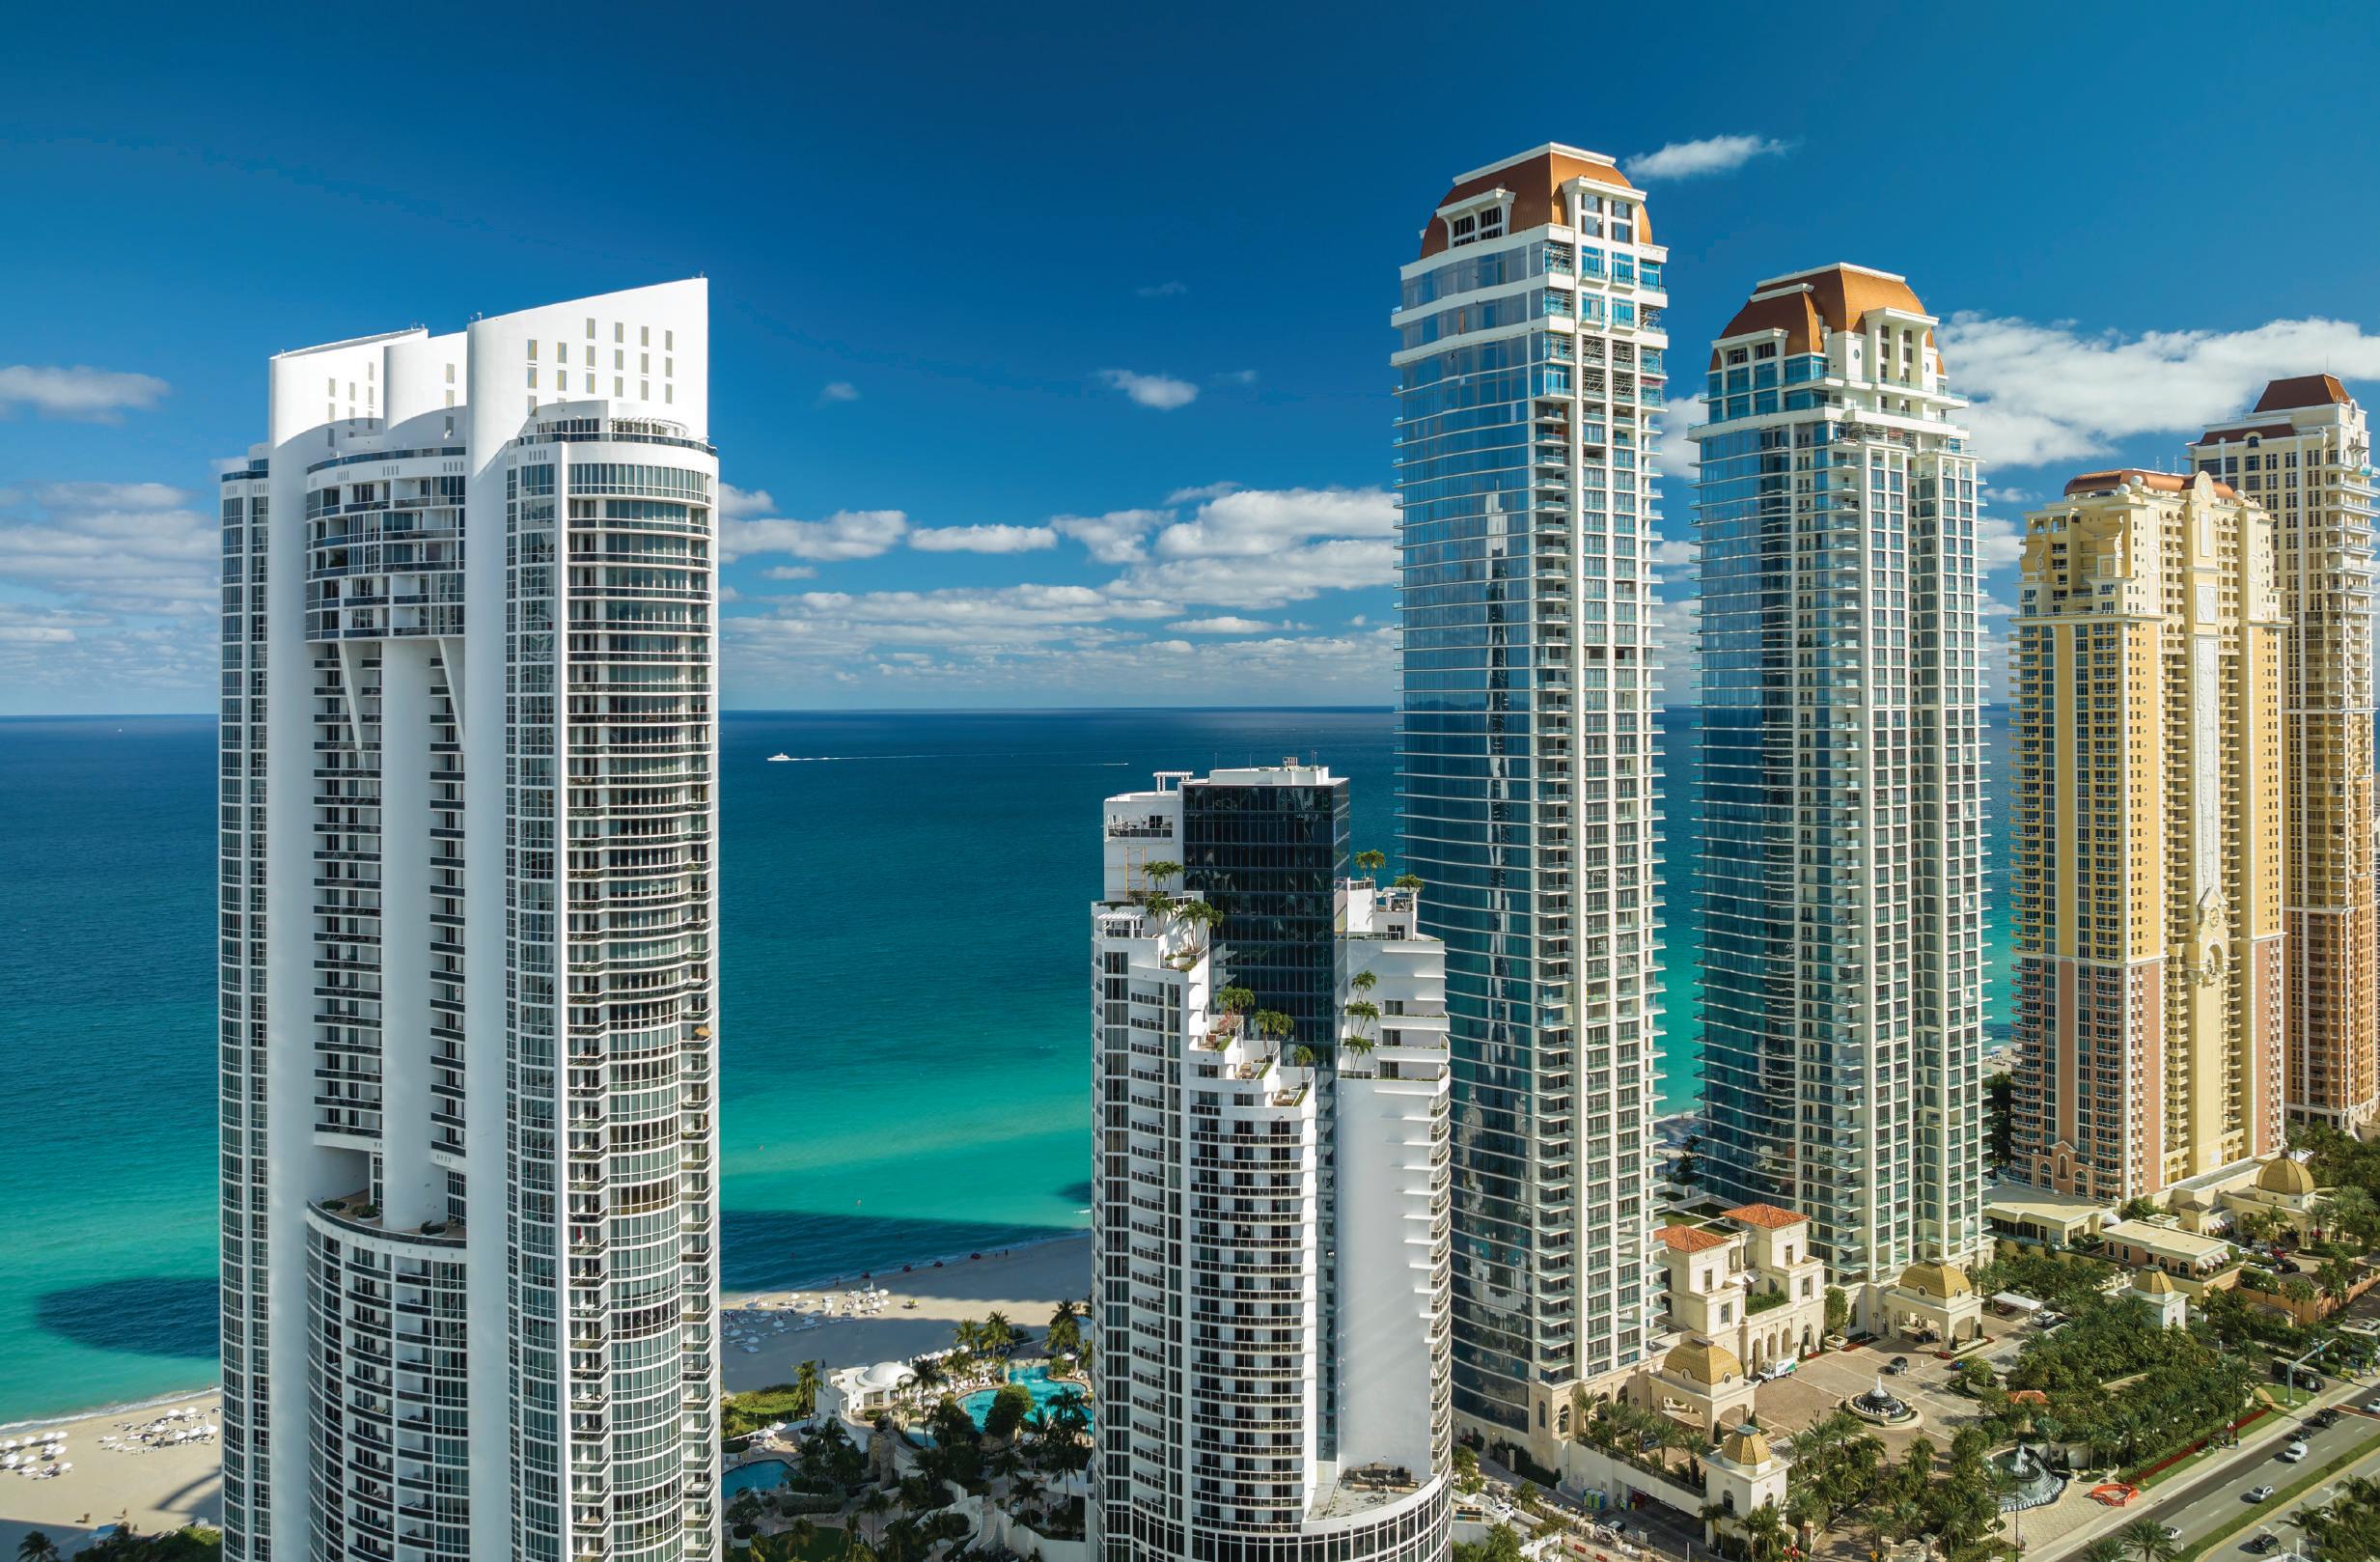
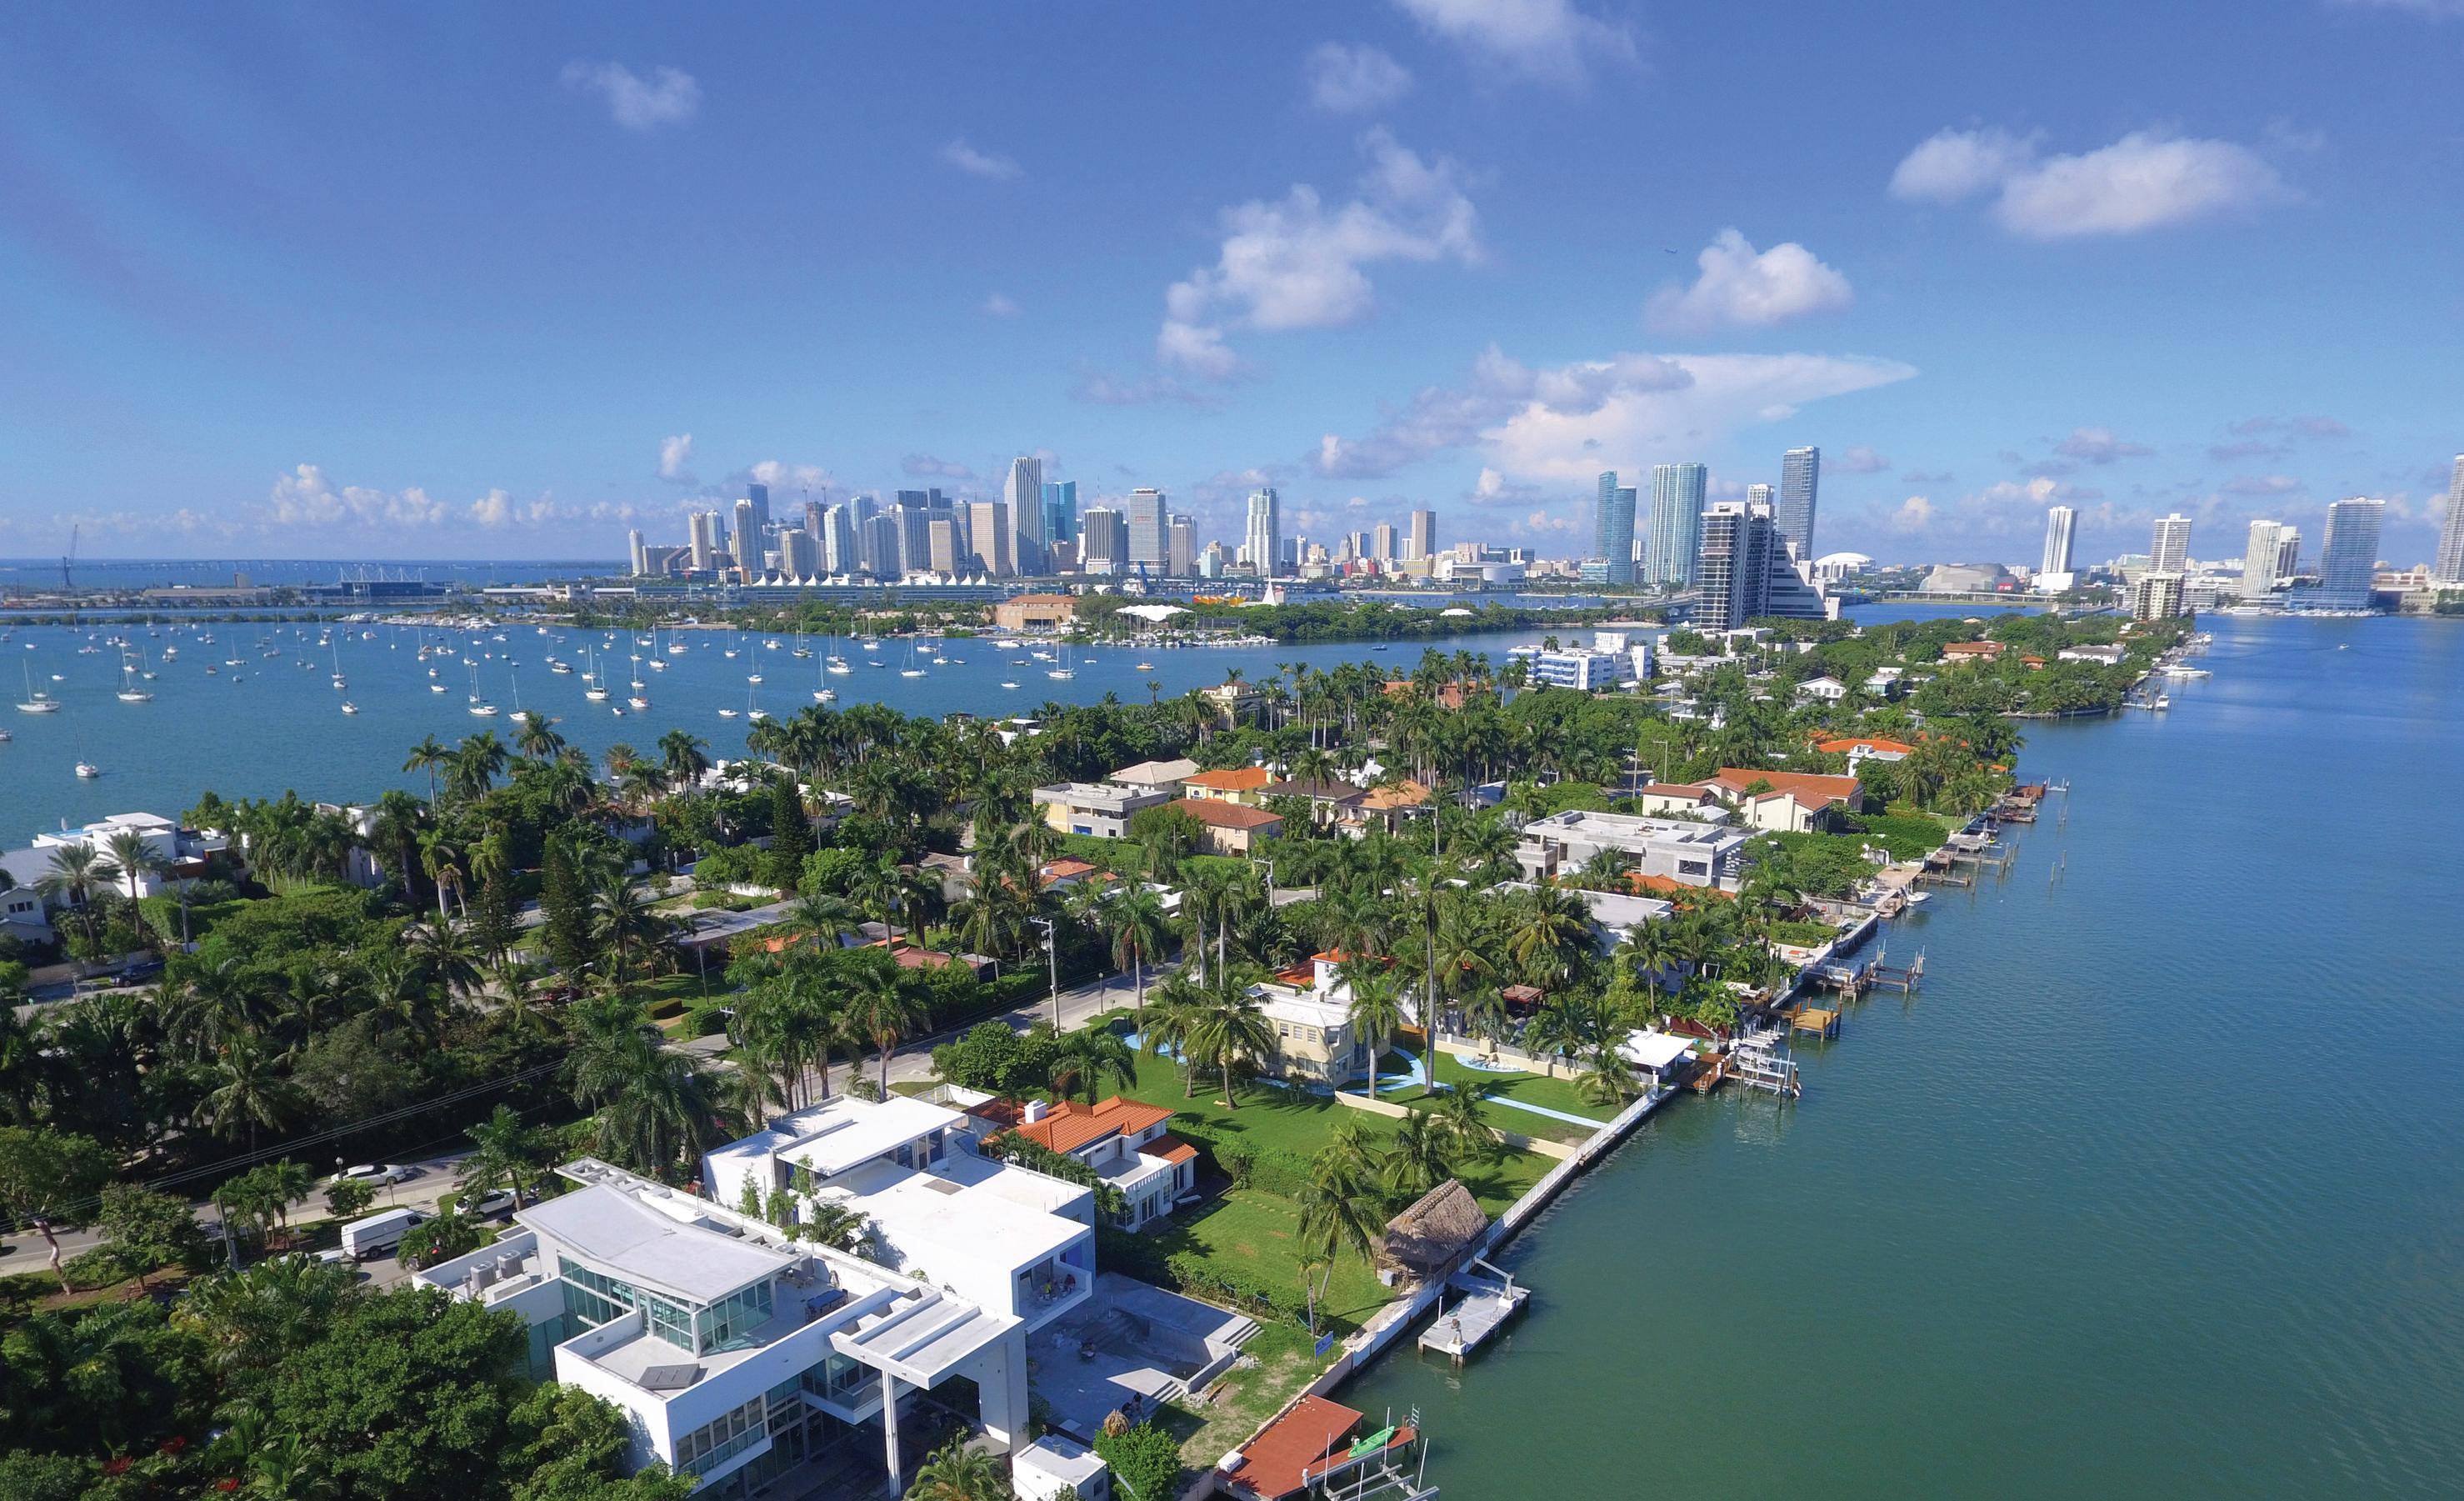
MIAMI


The purpose of this study is to help you understand the dynamics of Miami’s different markets and get an insight into Miami’s market performance and trends. When considering an investment in Miami’s real estate, the best decision is always a result of the best information.
Our highest priority for our clients is to preserve and protect their legacy. No one does more research about the Miami market than us. For forecast or projections for Miami for the remainder of the year or any other specific market, please contact us.

www.theaptteam.com


This APT Market study was compiled from data obtained from the MLS. It was made with information of sales through June 30, 2023. While it pertains to the surveyed area’s sales, it doesn’t include any off market sales. The information contained herein is deemed accurate, but can’t be relied upon. We are not responsible or liable for input, calculation errors and/or errors of omissions and market changes. We always advise those who wish to utilize this data to corroborate such information for themselves. Equal Housing Opportunity. This is not an intention to solicit listing from other brokers.


- Miami has undergone a significant shift, evolving from a destination primarily sought after by travelers for vacation homes, to an enduring market f or permanent residences
- On the whole, the average prices for sales have reached unprecedented highs and have stayed significantly above the levels seen before the pandemic
- There has been a historical and monumental wealth and talent migration into the area Miami continues to set and break records
- Although sales volumes are not as high as they were during the pandemic-induced housing boom last year, most markets have seen a significant increase in sales that exceeds the usual seasonal pattern

- The housing market is transitioning from an unprecedented boom to more normal levels of activity with surge in prices as quality inventory remains at record low levels
- Substantial price gains from 2019; single-family homes are up by 80% and condos/townhomes have surged nearly 70%
- The number of sales fell from the heightened levels of the unprecedented Covid year
- Prices remained steady or increased, while markets that saw a decrease in prices tended to also witness a shift towards smaller average sizes due to increased prices per square foot
The highlights of Miami-Dade County are meant to cover the entire county, not just the specific neighborhood or metropolitan area known as Miami. The urban landscape dominates the northern, central, and eastern areas of the county including Miami Beach, Brickell, Coconut Grove, parts of Coral Gables, Sunny Isles Beach and more. Conversely, in southern Miami-Dade County lies the Redland and Homestead regions which form an integral part of the county’s agricultural economy.
Additionally, we wanted to provide an overview of the report on a larger scale, as we have analyzed data for various neighborhoods of Miami-Dade County


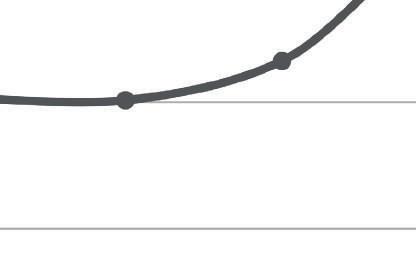
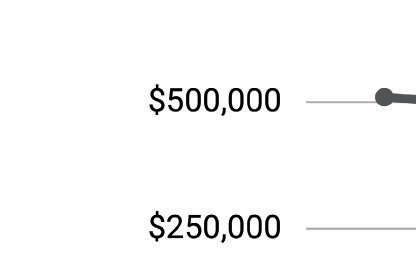
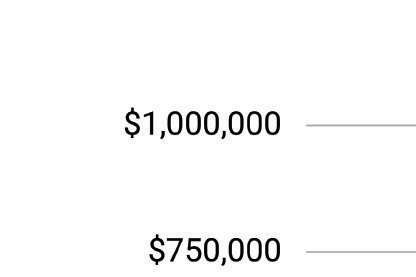
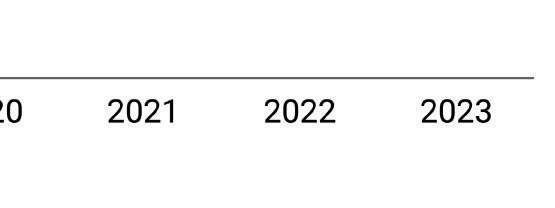
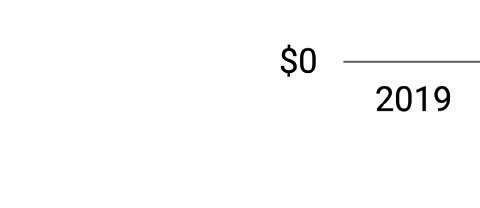
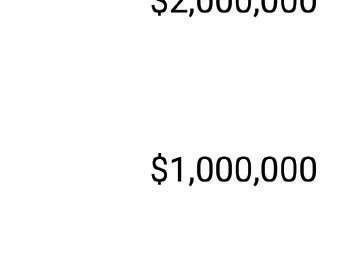
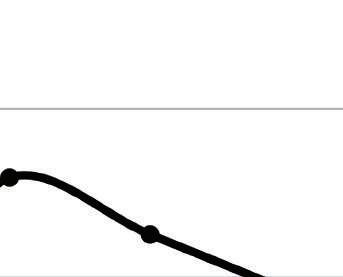
Excluding previous year boom, average sales price Miami-Dade County is at historic levels.
Single-family homes are up an astounding 80% from pre-Covid 2019.


Average sales price for condos/townhomes has surged 73% from pre-Covid 2019.


Singlle-family homes
Condos/townhomes


Excluding the exceptional growth of the previous year, the average sales price per square foot in Miami-Dade County is currently at record highs. Single-family homes have experienced a remarkable 80% increase compared to the pre-Covid levels of 2019. Similarly, the average sales price per square foot for condos and townhomes has also seen a substantial rise, reaching nearly 70%.


- Condo/townhome transactions are starting to normalize following the previous elevated levels with number of condos sold cut in half
- Overall market is way above pre-pandemic levels 61%
- The average sales price for all condos/townhomes expanded during the initial half of 2023 as number of transactions fell
- Average sales price per square foot expanded
- The $1M+ levels had an 6.4% increase in average sales prices since 2019
- Number of days it took to sell increased less than 10%
- The overall condo/townhome market has a 5 months supply of inventory (MSI) based on closed sales
The condo and townhome sector is recalibrating and yet is up from pre-pandemic year. The average sales price is now 61.7% higher compared to same period 2019. In the $1M+ condo/townhome sector, average sales price is nearly 7% more than during the first six months of 2019.

Average sales price per square foot increased for the general Brickell condo/townhome market as well as for those priced $1M and above, putting a downward pressure on overall prices for $1M+ condos/townhhomesand number of sales post heightened levels. Days on the market increased as a result.


10.2


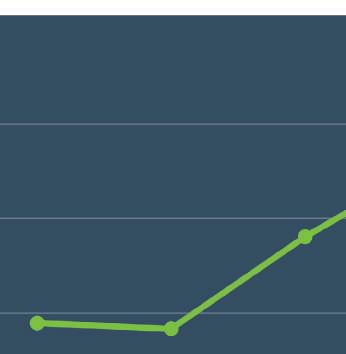
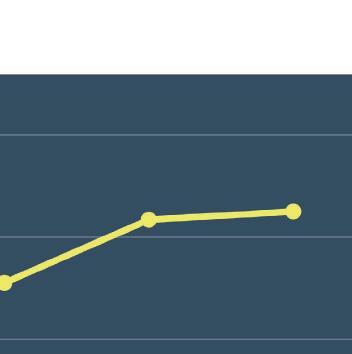
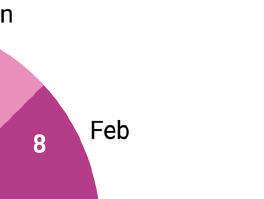
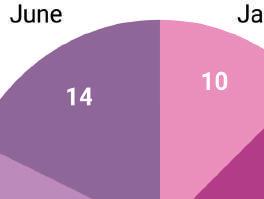
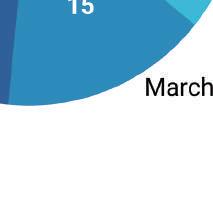
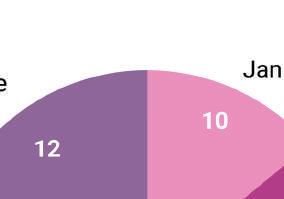
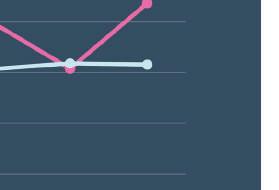
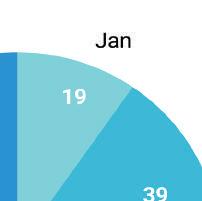
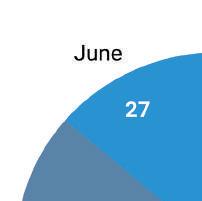
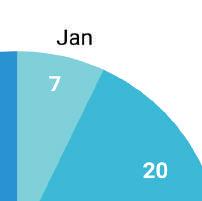
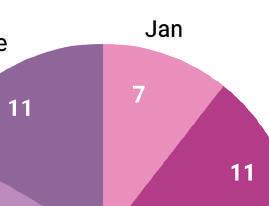
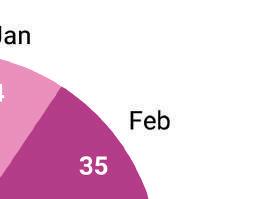
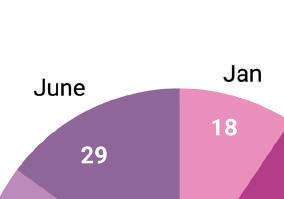
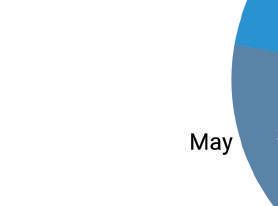
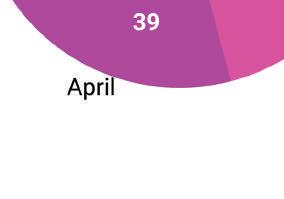
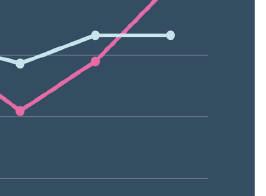
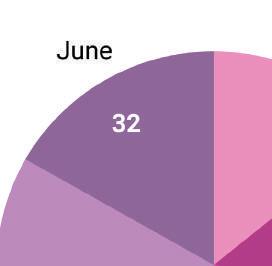
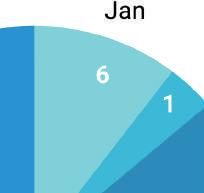
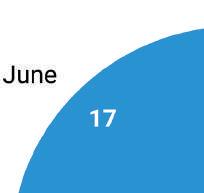
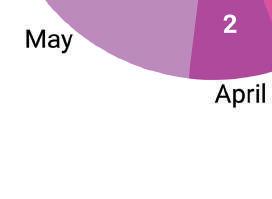
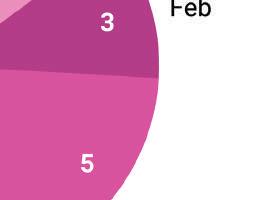
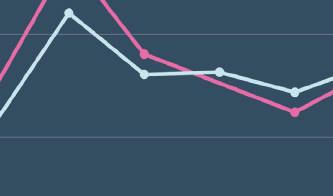
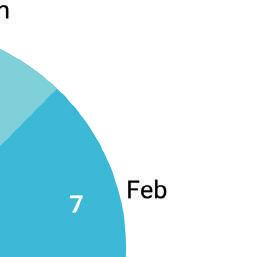
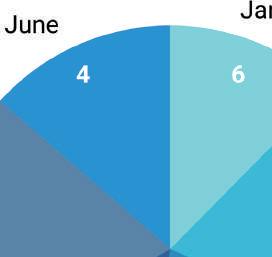
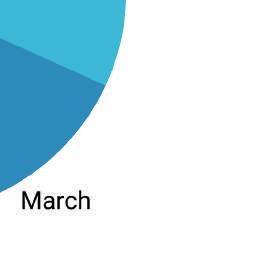
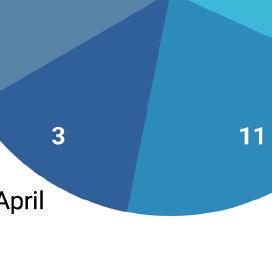
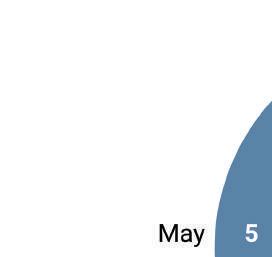
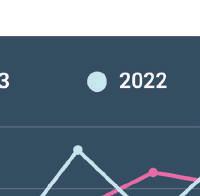
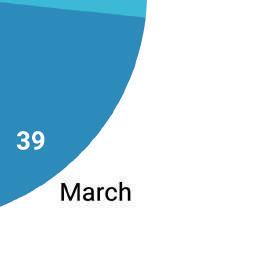
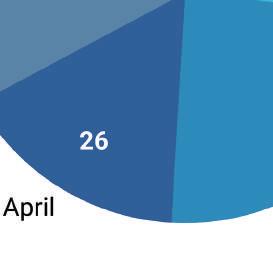
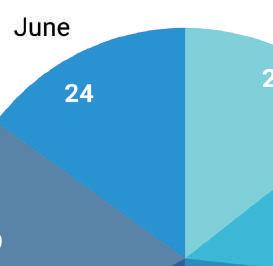
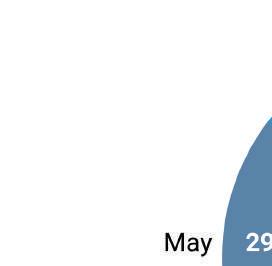
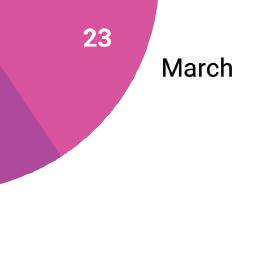
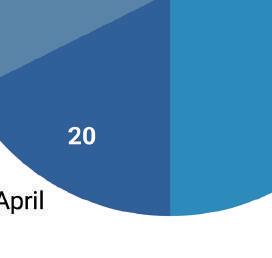
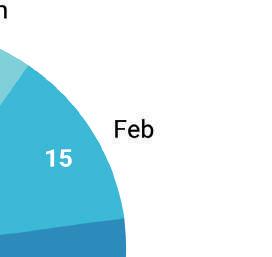
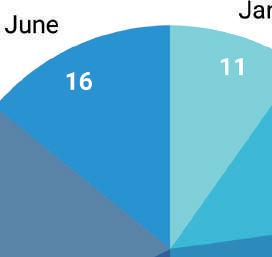
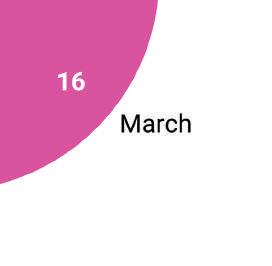
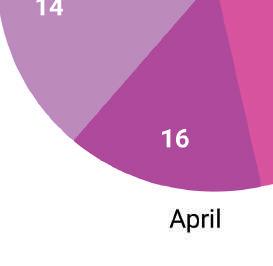
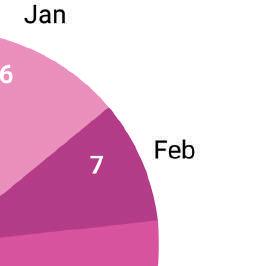
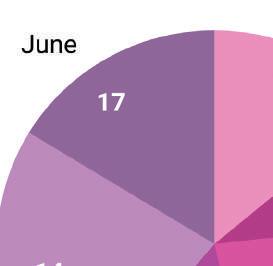
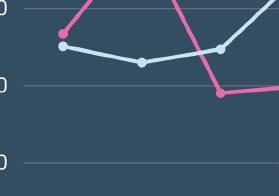
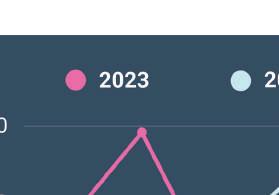
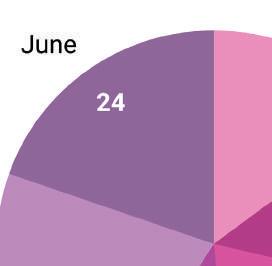
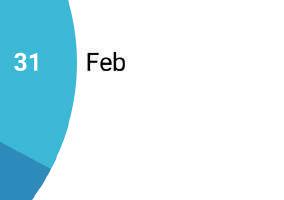
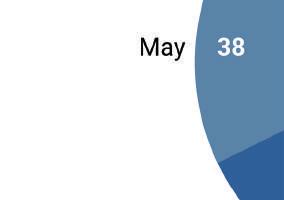
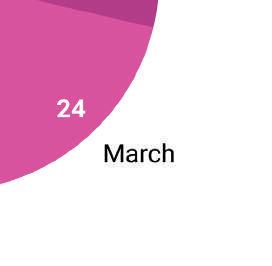
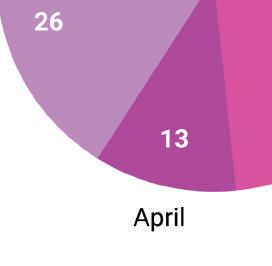
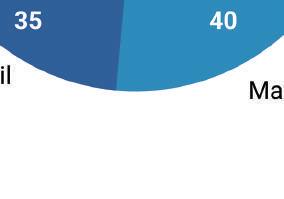
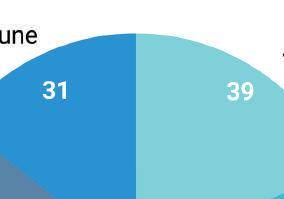
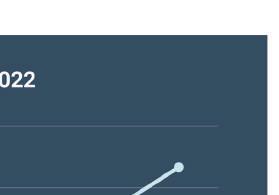
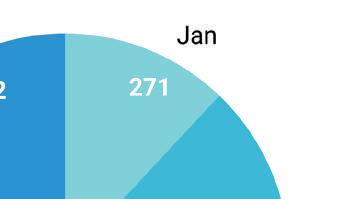
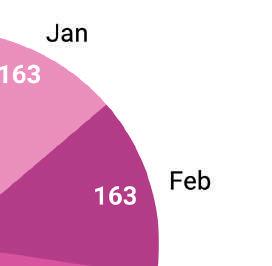
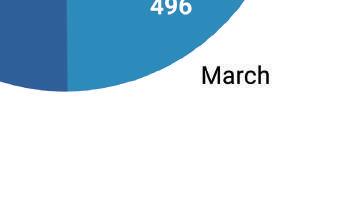
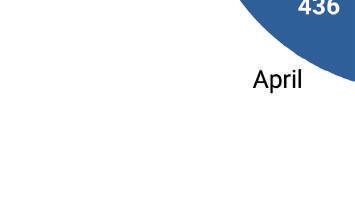
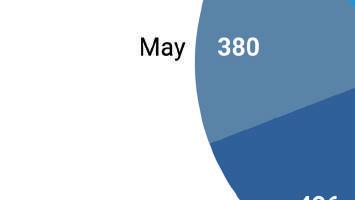
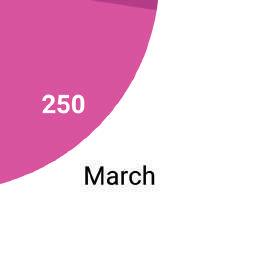
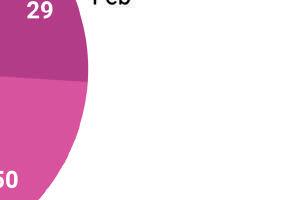
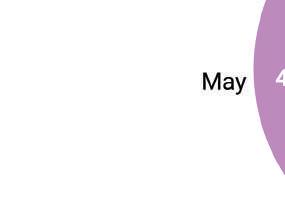
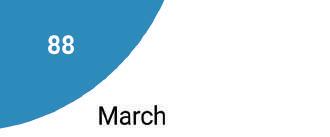
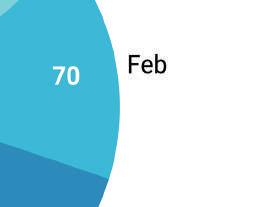
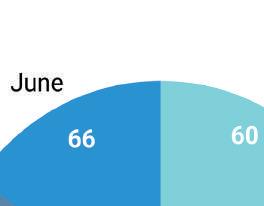
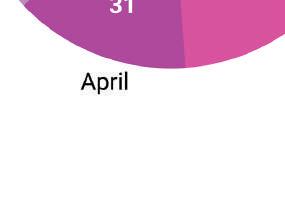
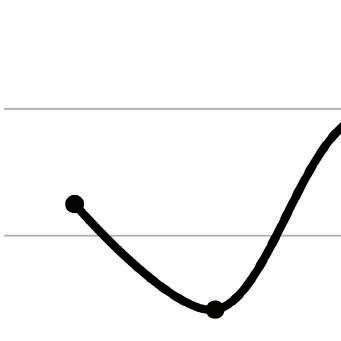
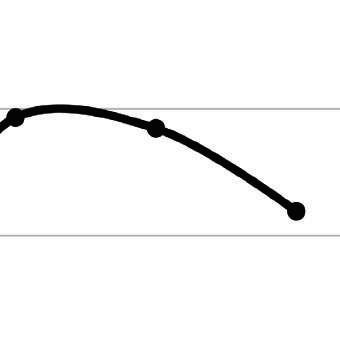
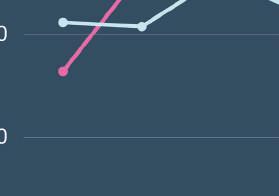
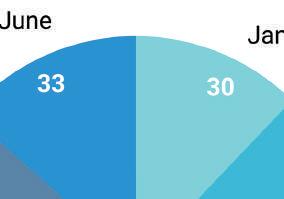
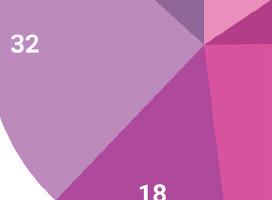
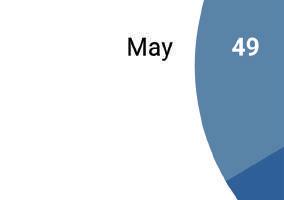
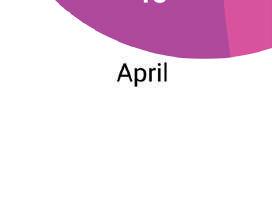
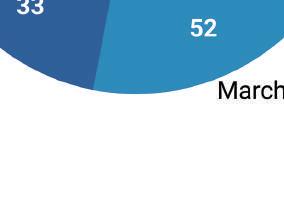
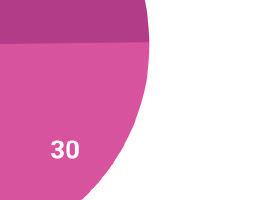
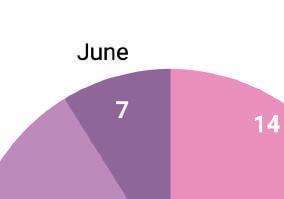
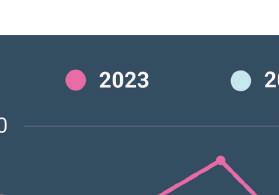
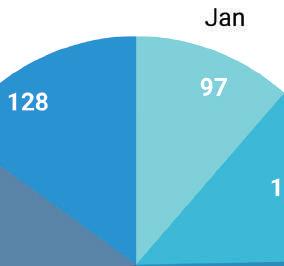
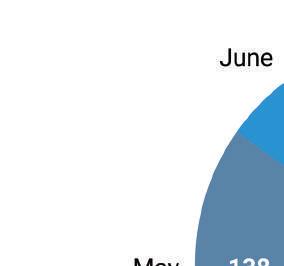
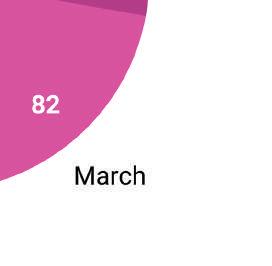
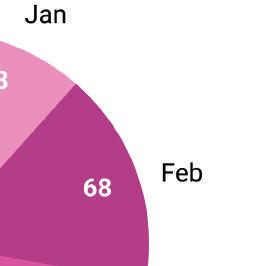
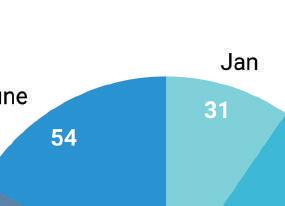
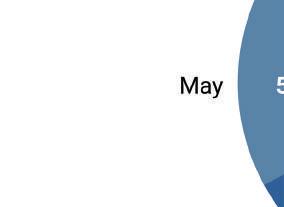
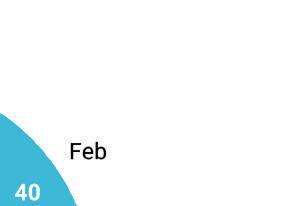
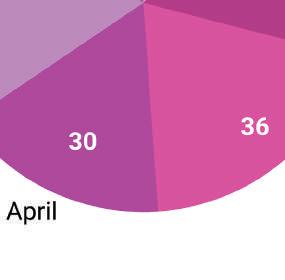
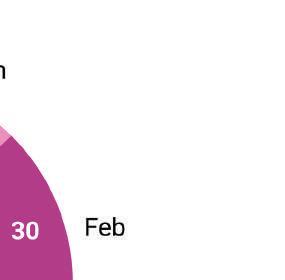
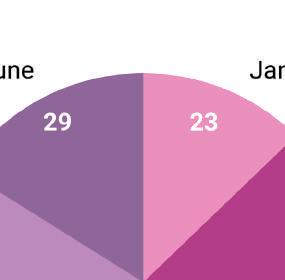
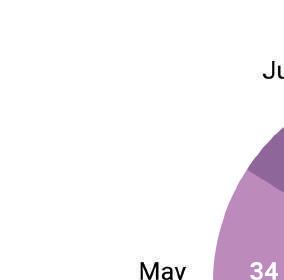
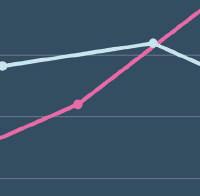
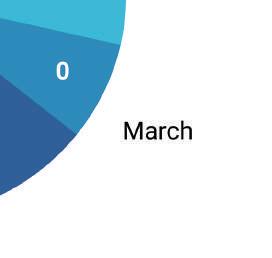
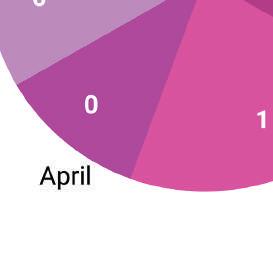
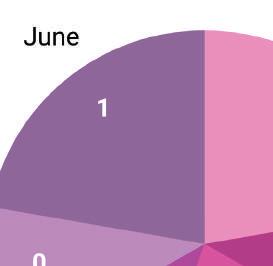
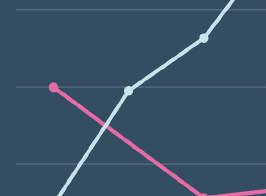
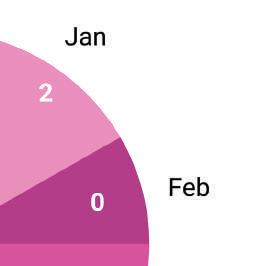
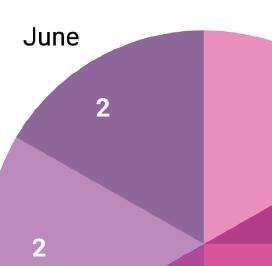
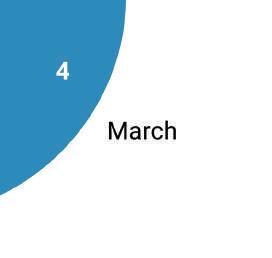
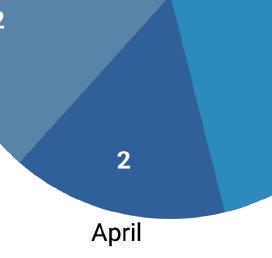
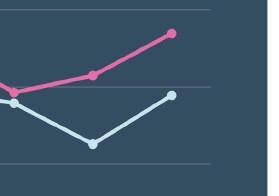
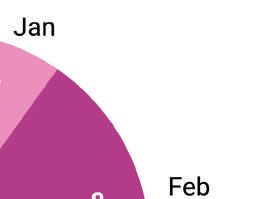
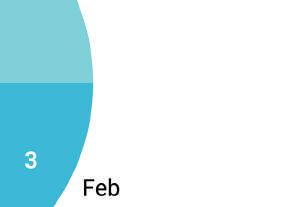
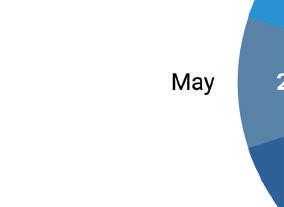
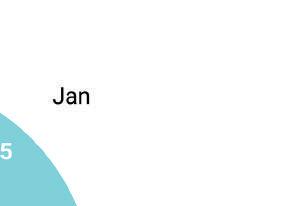
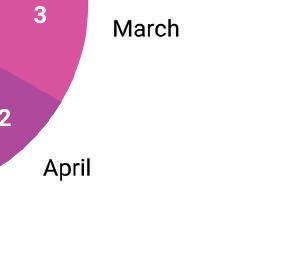
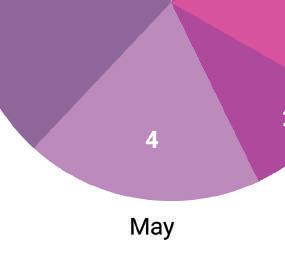
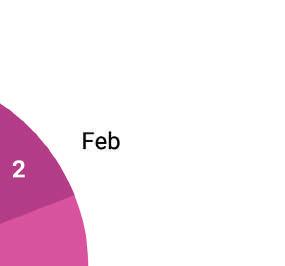
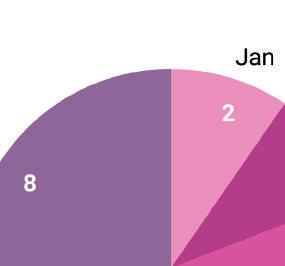
(right) In the Brickell condo/townhome market, the sales reached their highest marks in February, March and May. The $1M+ condo/townhomes had their highest average in March but its mid year dropped from 2022.


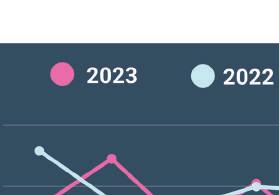


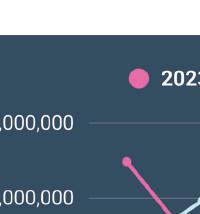
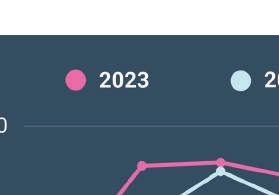
2023
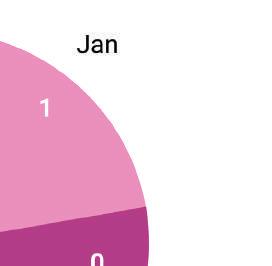
AVG. SALES BY MONTH
Total number of sales: 690


2022

AVG. SALES BY MONTH


Total number of sales: 1,391

2023
AVG. SALES BY MONTH
Total number of sales: 137


2022

AVG. SALES BY MONTH


Total number of sales: 250
- Coconut Grove has experienced a staggering percentage change since 2019. This makes it one of the most highest-gaining areas
-Single-family homes are recalibrating following the extreme record levels, outperforming pre-pandemic 2019 by 121%
-$1M+ single-family homes average salesprice is up 68% from 2019
- Sales transactions fell short of the frenzied Covid levels due to inventory shortage
- Condos/townhomes are up by 156% from 2019 & $1M+ condos/townhomes are 83% above 2019


Single-family homes outperformed pre-pandemic 2019 levels by 121% while the $1M category surpassed it by 68%


active: 76 Months
6.8


The average sales price per square foot for all homes in Coconut Grove has edged 2022 sales price by 6% to $932/SF and for $1M+ homes by 8.9%. Days on the market surged. Sales transactions are down from the historic levels due to increased prices due to inventory shortage.
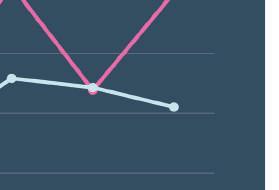
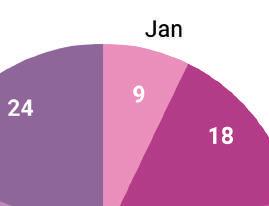
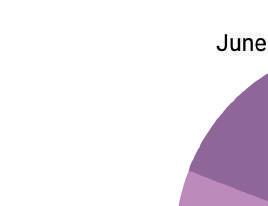
(right) Market is readjusting from the elevated thresholds and yet, June 2023 prices are trending upwards for the overall single-family home and the $1M+ home sector.


2023
AVG. SALES BY MONTH
Total number of sales: 78


2022


AVG. SALES BY MONTH

Total number of sales: 95
2023
AVG. SALES BY MONTH
Total number of sales: 67


2022

AVG. SALES BY MONTH


Total number of sales: 80


The overall condo and townhome market keeps growing steadily, increasing year over year. The average sales price is now 100 % higher compared to 2019. In the $1M+ condo/townhome sector, average sales price is up 83% from 2019 and up 29% from the first six months in 2022.


Price trend indicators has Coconut Grove performing at record levels. Pace of market for all condos has slowed from frenzied 2022. Average sales prices are up. The ongoing shortage of inventory continues to drive up prices per square footage.


(right) By in large, the average selling prices of condos/townhomes still manage to surpass previous limits month after month.


2023
AVG. SALES BY MONTH
Total number of sales: 125
2022
AVG. SALES BY MONTH

Total number of sales: 198


2023
AVG. SALES BY MONTH
Total number of sales: 66


2022
AVG. SALES BY MONTH


Total number of sales: 100
- Sales have experienced a decrease, falling below the heightened sales levels witnessed during 2021 and first 6 months of 2022
- Sales price for all single-family homes has moved to newer tiers, trading 61%
-The condo/townhome market has enjoyed great gains for 4 consecutive years, reaching new record levels
-Price trend indicators for condos/townhomes have increased compared to same period of the previous year
Save for the previous year when prices rose annually to their highest levels, the average sales price for all single-family homes has steadily appreciated since 2019. As a matter of fact, they are up 61.5% from 2019.


Inventory scarcity is still prevalent and MSI of 3 months makes Coral Gables home market in high demand.The average time it takes for a property to sell has risen but it is still just under two months. Average sales price per square foot edged out 2022’s by 3.2%. The average price per square foot for $1M homes remains virtually unchanged from the previous year at $850/SF.


(right) The entry threshold in Coral Gables has consistently risen to the point that the average sales price for all homes and for $1M+ homes are almost on the same footing.


2023
AVG. SALES BY MONTH
Total number of sales: 259


2022
AVG. SALES BY MONTH
Total number of sales: 325

2023
AVG. SALES BY MONTH
Total number of sales: 194


2022

AVG. SALES BY MONTH


Total number of sales: 221


The market for condos and townhomes has experienced significant growth over the past four years, reaching unprecedented levels.


Current active: 93 Months Supply


2.9
Average sales price is up accross all condos/townhomes and up 15% for the $1M+ condos/townhomes. Average sale price per square foot has also risen. Condo/transactions are coming down from the frenzied levels.
23
(right) Price trend indicators for condos/townhomes performed better on some months than others, with the mid year average increasing from 2022.
Current active: 35 Months Supply
Inventory
7.8


2023
AVG. SALES BY MONTH
Total number of sales: 191
2022
AVG. SALES BY MONTH
Total number of sales: 338


2023
AVG. SALES BY MONTH
Total number of sales: 27
2022
AVG. SALES BY MONTH


Total number of sales: 57


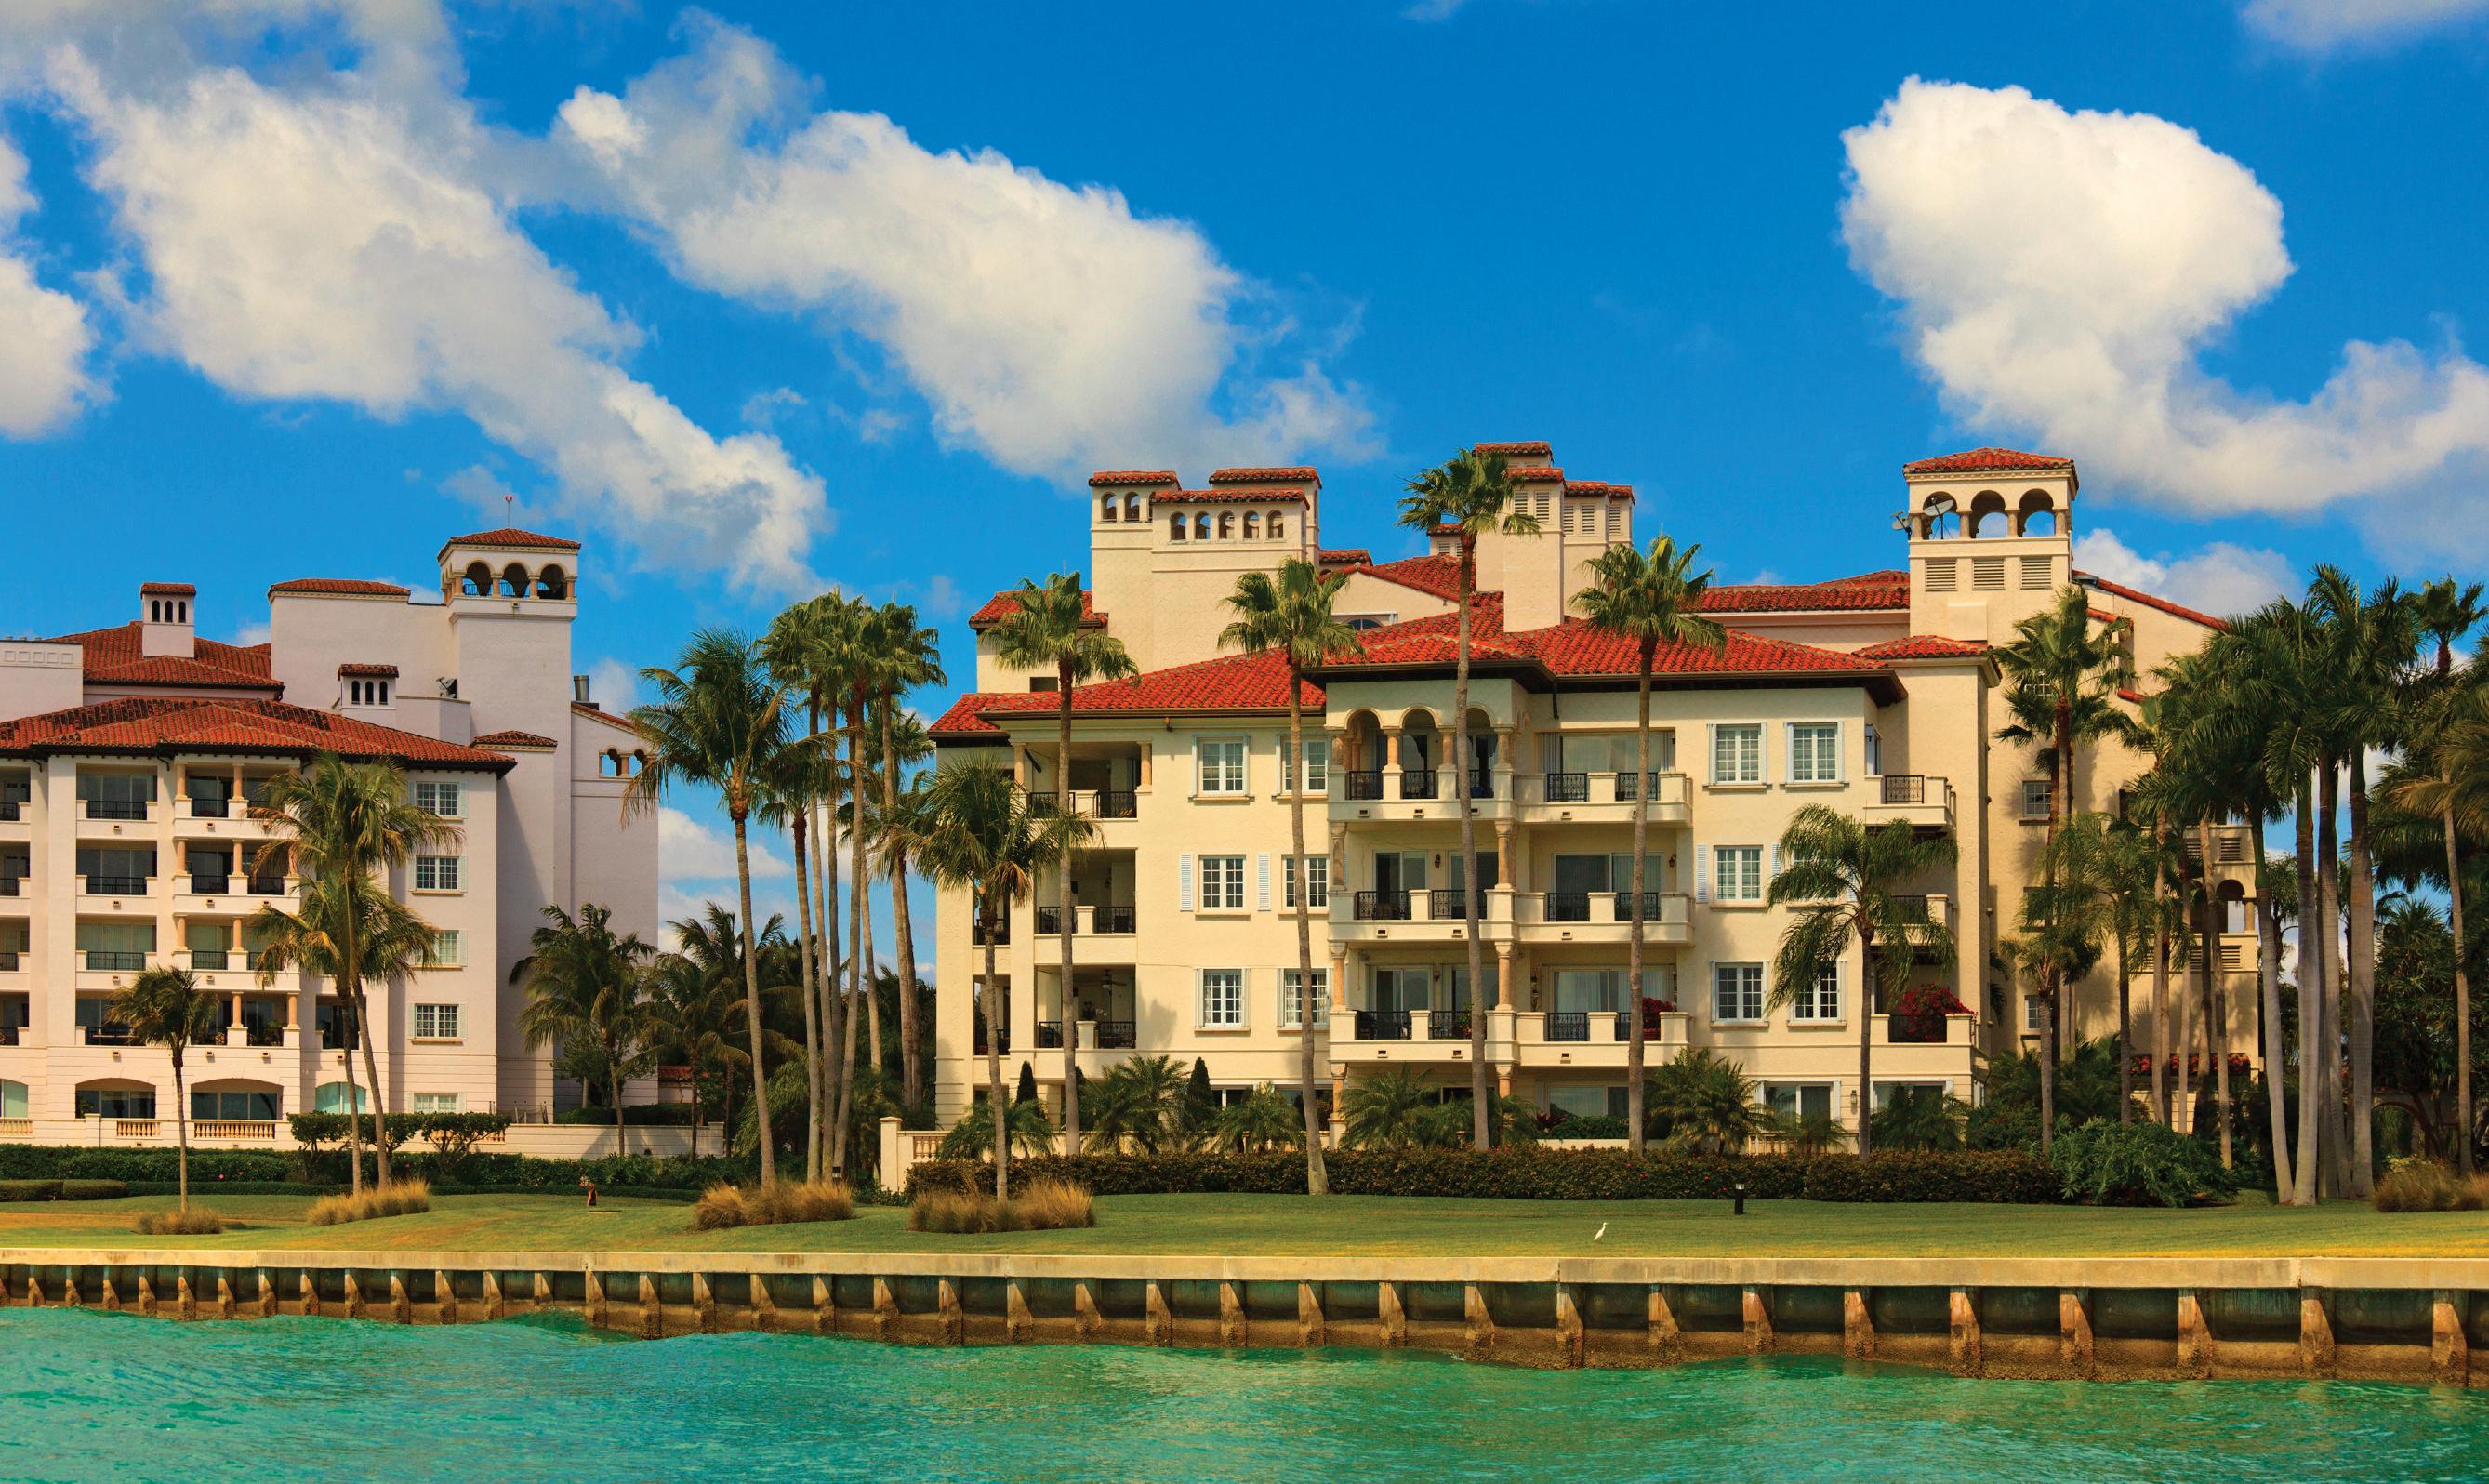
-Fisher Island’s property and its location are truly one-of-a-kind and so is its real estate performance
- With the construction of new developments throughout the years and an influx of wealthy buyers, prices on the island have soared to unprecedented levels
-This trend had been further fueled
by the pandemic, as affluent individuals sought refuge on the island
-Price trend indicators for condos/townhomes have increased compared to same period of the previous year


Fisher Island has long been recognized as one of the richest areas in the United States, and property prices continue to reach new heights as more luxurious homes are constructed and affluent buyers flocked to the island, particularly during the pandemic. They are now 120% than what they were in 2019.
9.7


Fisher Island’s average sales price and sales price per square foot have risen, even surpassing previous records. Additionally, properties on the market are being sold at a faster pace.
(Note) The majority of Fisher Island properties fall into the luxury and ultra-luxury price range, making it a singular category for comparisons.


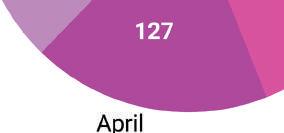
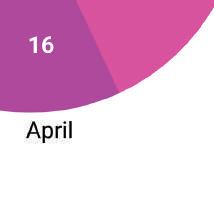
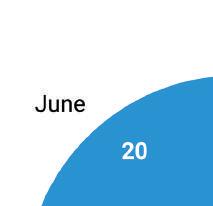
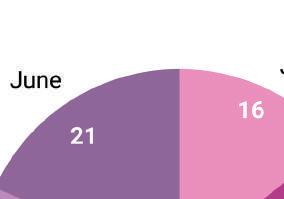
In 2023, all months except for April and May saw better performance compared to 2022. Despite already having high-priced items, Fisher Island experienced a 7.5% increase in performance compared to the previous year.

2023
AVG. SALES BY MONTH
Total number of sales: 16


2022
AVG. SALES BY MONTH

Total number of sales: 36


- The average sales price of a singlefamily home is $5 million, up 40% fromm 2019
- The data shows that the overall single-family home market and the market for homes valued at $1 million or more have same stats
-The average sales price for all homes is up 40% from 2019
- Average sales price for condos have increased 59% from 2019
-# of closed sales are starting to normalize following elevated levels of the past two years


The entry barrier into Key Biscayne is high. The average sales price for single-family homes has consistently increrased year over year with a 40% surge since 2019.
Current active: 26 Months Supply of Inventory based on closed sales: 9.7
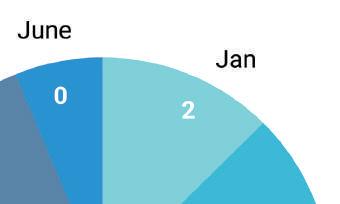
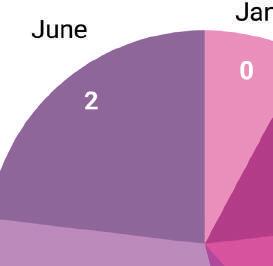
The average sales price for homes in Key Biscayne has edged 2022 sales price by 3% to $5,066,813. Average sales price per square foot was at $1,381. Pace of maket picked up with days on the market declining by 10%.


(Note) The sold statistics for both the general single-family home market and the market for homes priced at $1 million or more in 2023 are identical, so we only need to consider one set of data.

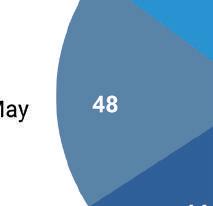
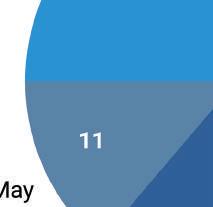
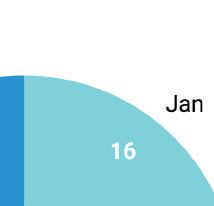
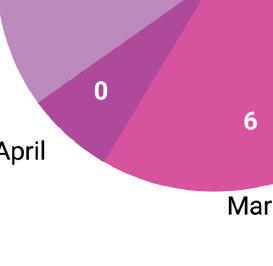
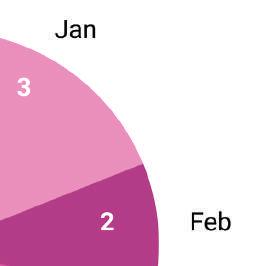
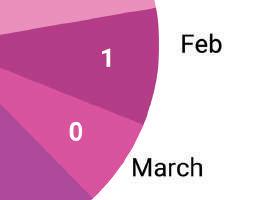
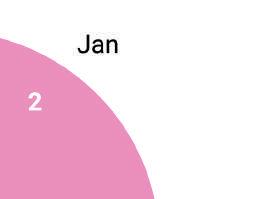
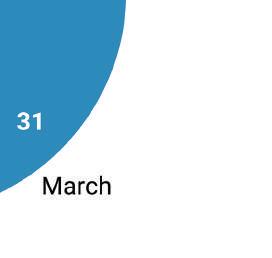
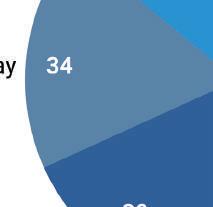
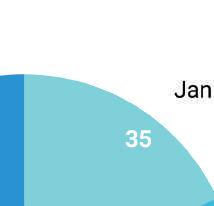
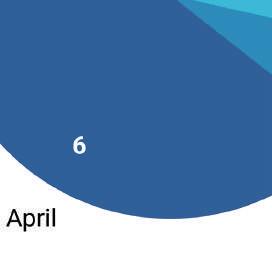
March 2023 had no recorded sales. Jan and May 2023 were the best performing months.


2023
AVG. SALES BY MONTH
Total number of sales: 16


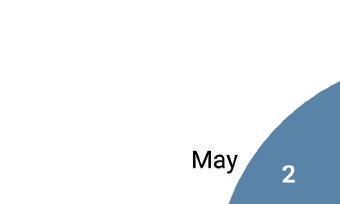
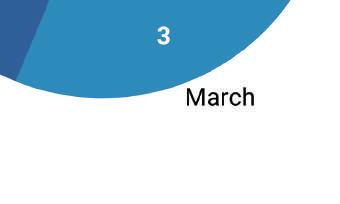
2022
AVG. SALES BY MONTH

Total number of sales: 42


Market is starting to recalibrate after the pandemic, but it is still outperforming the pre-pandemic levels. The average sales price is now 59% higher compared to 2019. In the $1M+ condo/townhome sector, average sales price is up 4.5% from 2019. The average price of luxury condos/ townhomes $1 million or more has decreased compared to the previous year due to the fact that condos sold this year were smaller with 2 beds instead of 3 beds.


Condo/townhomes transactions are starting to normalize following the peak Covid numbers with total sold down by 33% and increases in average sales price per square foot. Pace of market for all condos has slowed from frenzied 2022. The average price of luxury condos/ townhomes are recalibrating post peak.
(right) The average selling prices of condos and townhomes are gradually returning to earth following the stratospheric rise in 2022. Although they have decreased compared to 2022, they have still managed to surpass previous limits.
6.5


2023
AVG. SALES BY MONTH
Total number of sales: 108
2022
AVG. SALES BY MONTH

Total number of sales: 161

2023
AVG. SALES BY MONTH
Total number of sales: 76

2022
AVG. SALES BY MONTH


Total number of sales: 114

- Excluding previous year boom, average sales prices are at historic levels. They are up an astounding 67% from pre-Covid 2019
- The average sales price has decreased by 2.7%, bringing it to new record levels of $5,379,743 except for the average sales prices seen during last year’s housing boom
-The average sales price per square foot for all homes slipped 5% to $1,277/SF and for $1M+ homes by 8% to $1,323/SF
- Number of home and $1M+ home sales declined year over year


Excluding previous year boom, average sales prices are at historic levels. They are up an astounding 67% from pre-Covid 2019. In the $1M+ market, they are up from 23% from 2019. In the $1M+ home category, 4 bedrooms now trade 23% higher than 5 beds did in 2019.

The average sales price for all single-family homes slipped 2.7% from previous year and 6.5% for the $1M+ sector. Average sales prices are also down but have attained unprecedented heights post pandemic frenzy. Days on the market rose.
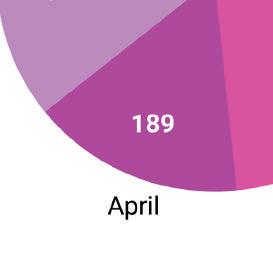
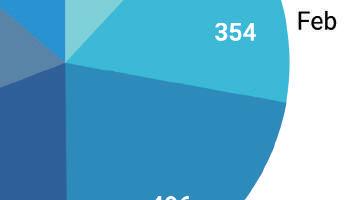
(right) February and March were the highest selling months for Miami Beach in both home categories.


2023
AVG. SALES BY MONTH
Total number of sales: 122
2022
AVG. SALES BY MONTH


Total number of sales: 214


2023
AVG. SALES BY MONTH
Total number of sales: 115


2022

AVG. SALES BY MONTH

Total number of sales: 192


The real estate market for condos and townhomes in Miami Beach is beginning to readjust following the impact of the pandemic, yet it continues to exceed the levels seen before the pandemic.The average sales price is now $814,000 for a one bedroom. Conversely, two bedrooms in the $1M+ condo/townhome sector now trade at $2,563,847.


Sales volume is returning to normalcy after the Covid-19 frenzy, with the number sold reduced by 50%. Pace of market for all condos has quicken, reducing the average days on market by nearly 23%. In the $1M+ category, there is a 6.7% increase in average days on market. Average sales price per square foot for all condos/townhomes sold is up 3.1% the previous period in 2022.
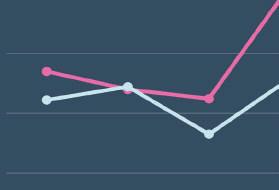
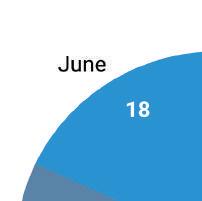
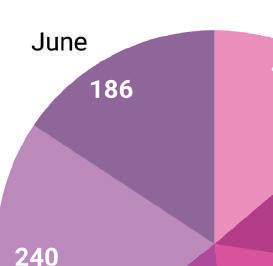
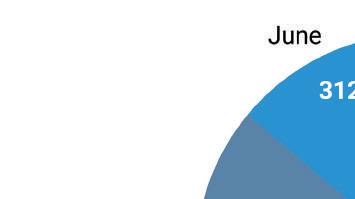
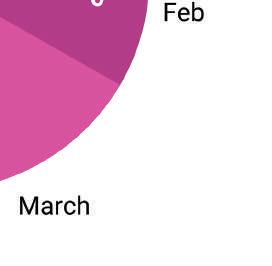
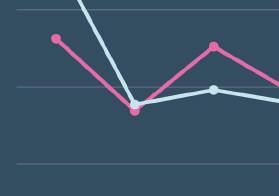
(right) Sales reached reached their peak in March, with the average price being around $1.1 million. Luxury condos priced at $1 million or more also peaked in March, with an average sales price of $3.4 million. It is worth noting that the average selling price for all Miamii-Dade county condos sold during the same period in 2023 was $409,000.


2023

AVG. SALES BY MONTH
Total number of sales: 1,191
2022
AVG. SALES BY MONTH

Total number of sales: 2,250
2023
AVG. SALES BY MONTH
Total number of sales: 219


2022

AVG. SALES BY MONTH


Total number of sales: 433

-The average sales prices is up 65% from 2022, and nearly 95% before pandemic
- A significant reduction in the average number of days it takes to sell a property of almost 70%
-Average sales price per square foot increase of 53%
- The Palm & Hibiscus Islands real estate market has seen a 37% decrease in sales due to increased price gains and limited inventory

We have narrowed down the comparisons to Palm and Hibiscus Islands. Star Island, which has just 34 estates on the island, rarely if ever has a property available for sale. When there are no sales, it’s not because the property didn’t sell, but rather because there was no inventory in the first place. As a result, there is limited data for a comprehensive analysis.

15
The trio of Palm, Hibiscus, and Star Islands, have consistently shown outstanding performance. Amidst the Covid pandemic, their value skyrocketed. The average sales price of Palm and Hibiscus Islands surged by almost 65% compared to the same period in 2022. Days on market cut by nearly 69%.
(Note) Not enough data for Star Island to provide meaningful comparables or charts.


13


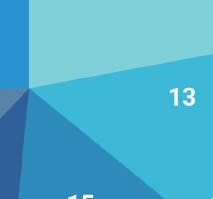
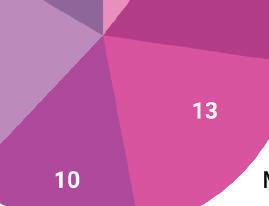
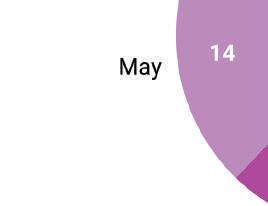
Price trend indicators for Palm & Hibiscus Islands reveal that there has been a significant 65% year-on-year increase. It is important to note that months with no sales should not be considered for comparative analysis.

2023
AVG. SALES BY MONTH
Total number of sales: 7


2022


AVG. SALES BY MONTH

Total number of sales: 11
-SoFi is calibrating after the pandemic-era sales surge.
- The average sales prices are down at all levels. But, the average sales price for all condos in SoFi is also over 78.7% higher than Miami-Dade’s average sales price of $409,000 for condos/townhomes traded during Jan-June 2023.
- Average sales per square foot for all condos slipped.
- In the $1M+ sector, condos prices are trading on average 17% less than last year’s period.


South of Fifth (SoFi) is calibrating after the pandemic. Average sales price for all condos is down by 14.9% from 2022, but up 23% pre-pandemic. Average sales per square foot for all condos slipped by 5.2%. Pace of market edged last year’s pace by 3.8%. SoFi’s $1M+ condo/townhome bracket is down nearly 18%. but always has pushed higher prices than most areas in Miami even before the pandemic.


SoFi is calibrating after the pandemic-era sales surge. The average sales prices are down at all levels. But, the average sales price for all condos in SoFi is also over 78.7% higher than Miami-Dade’s average sales price of $409,000 for condos/townhomes traded during Jan-June 2023. Average sales per square foot for all condos slipped. In the $1M+ sector, condos prices are trading on average 17% less than last year’s period.
(right) Price trend indicators for all condos/townhomes down year-ago levels with February, March and April trending higher than previous year. In the $1M+ condos/townhomes, SoFi has always pushed higher prices than many or most areas in Miami. SoFi is transitioning from a period of significant growth to a more normal level of activity.


2023
AVG. SALES BY MONTH
Total number of sales: 129


2022
AVG. SALES BY MONTH

Total number of sales: 245
2023
AVG. SALES BY MONTH
Total number of sales: 68


2022

AVG. SALES BY MONTH


Total number of sales: 128


- Average sales price for all condos/ townhomes increased 86% since 2019
-The average sales price experienced a 12.7% increase during the initial half of 2023 & 5% for the $1M+ category.
- Condo transactions are starting to normalize following the previous elevated levels with number of condos sold cut in half
- The process of selling condos/townhomes has become faster, as the number of days it takes to sell one has decreased by 20%
Average sales prices increased for both the overall condo/townhome and $1M+ tier, with 13% and 5% price gains respectively. In the first half of 2023. The average selling price per square foot for all condominiums rose by 13% compared to the corresponding period in 2022.


Average sales prices increased for both the overall condo/townhome and $1M+ tier, with 13% and 5% price gains respectively. In the first half of 2023. The average selling price per square foot for all condominiums rose by 7% compared to the corresponding period in 2022.
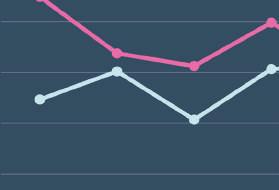
(right) In the Sunny Isles Beach condo/townhome market, the sales reached their highest point in March. The price boundaries of Sunny Isles Beach continue to rise.
active: 384 Months Supply of Inventory


12.6


2023
AVG. SALES BY MONTH
Total number of sales: 417
2022

AVG. SALES BY MONTH
Total number of sales: 846
2023
AVG. SALES BY MONTH
Total number of sales: 182
2022
AVG. SALES BY MONTH


Total number of sales: 324


-Sunset Islands has one of the highest price barriers
-It’s market has surged 115% since 2019
- The average sales price of a singlefamily home is approximately $13.89 million
- This means that the thresholds have been pushed even higher as buyers relocate to Miami
- The average sales price per square foot for homes has surged to $3,620/SF

SINGLE-FAMILY HOMES
Sunset Islands has one of the highest price barriers with average sales price of $13.89M. It’s market has surged 115% since 2019.
The average sales price per square foot for homes has surged to $3,620/SF. Days on the market has increased. Large price gains have taken averages to new heights. Inventory shortage keeps driving prices per square foot and affecting number of sales.


Current

Scarcity of inventory puts a negative pressure on number of sales, leaving some months with 0 transactions.
2023
AVG. SALES BY MONTH
Total number of sales: 3


2022
AVG. SALES BY MONTH

Total number of sales: 10
- The average sales price for single-family homes in this area is $7.3 million up 94.4%
-It’s market has surged 115% since 2019
- The average sales price per square foot for homes has surged to $3,620/ SF
- Speed of market for homes has accelerated with days on the market down by 34%
- Average price for condos/ townhomes have increased 60% pre-pandemic
The Venetian Islands have a high entry barrier, as there are no homes for under $2M. The average sales price for single-family homes in this area is $7.3 million, up 94.4%. It is worth noting that the statistics for both the general single-family home market and homes priced at $1 million or more are the same, so we only need to focus on one set of data.
Current active: 24 Months Supply of Inventory based on closed sales: 14.4


The average sales price for all homes sold is down from stratospheric numbers of 2022 settling into an incredible $7,307,500. Average sales price per square foot declined. Speed of market has increased with days on the market down by 34%.


Scarcity of inventory puts a negative pressure on number of sales, leaving some months with 0 transactions. Venetian Island’s entry threshold keeps moving higher. The entry threshold is $2.8M as inventory for new build and top-notch homes is tight.

2023
AVG. SALES BY MONTH
Total number of sales: 10
2022


AVG. SALES BY MONTH
Total number of sales: 12


The general condo and townhome market has experienced a robust price increase in average sales price since 2019 calibrating post elevated 2022 heights to a 60% surge. The market for luxury condos and townhomes priced over $1 million has reached a point of stability


The condo and townhome market has experienced strong price growth overall. Even in the luxury segment with properties priced at $1 million or more, the price per square foot has increased despite the average prices stabilizing.
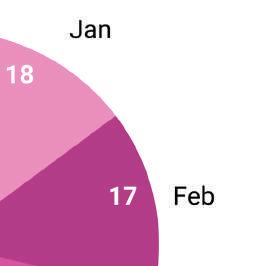
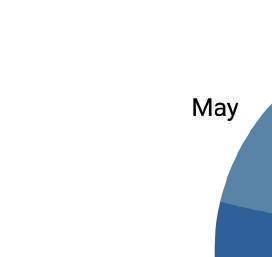
(right) Sales reached their highest point in March, with the average price being around $1.26 million and the $1M+ market at $3.36M.


active: 18 Months


2023
AVG. SALES BY MONTH
Total number of sales: 41


2022
AVG. SALES BY MONTH
Total number of sales: 60
2023
AVG. SALES BY MONTH
Total number of sales: 21


2022

AVG. SALES BY MONTH


Total number of sales: 20

Working with The APT Team is more than just a transaction, it is a relationship built on trust and respect. We are obsessed with helping our clients achieve their real estate dreams and create a legacy that will last for generations. We believe in the power of a handshake, even in this digital age. With over $900M+ in sales and 5 languages spoken, we know that numbers are only part of the story. What matters most is you. After all, what you own is just as important as how and why you own it. The APT Team at Douglas Elliman, where your legacy is our obsession.


“WHERE YOUR LEGAGY IS OUR OBSESSION” THE APT TEAM
ABOUT US
© 2023. Equal housing opportunity. This is not an intention to solicit listing from other brokers. We cooperate with them fully. This advertisement does not constitute an offer in the states of NY or NJ or any jurisdiction where prior regulations or other qualifications are required