MIAMI 2023 MIDYEAR MARKET REPORT

PREPARED BY THE APTTEAM AT DOUGLAS ELLIMAN © 2023 EQUAL HOUSING OPPORTUNITY THIS IS NOT AN INTENTION TO SOLICIT LISTING FROM OTHER BROKERS ALL MATERIALS PRESENTED HEREIN IS INTENDED IS INTENDED FOR INFORMATION PURPOSES ONLY WHILE THIS INFORMATION IS BELIEVED TO BE CORRECT, IT IS REPRESENTED SUBJECT TO ERRORS, OMISSIONS, CHANGES OR WITHDRAWAL WITHOUT NOTICE
CONTENT
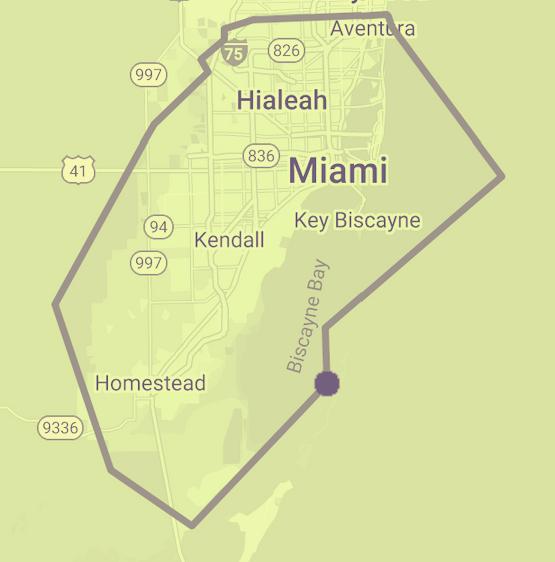
Miami-Dade County highlights
Jan through June average sales price 2019-2023
Y-O-Y change for homes & condos/townhomes
Jan through June sales price by month
# of sales per month
Months supply of inventory (MSI)
NEIGHBORHOODS
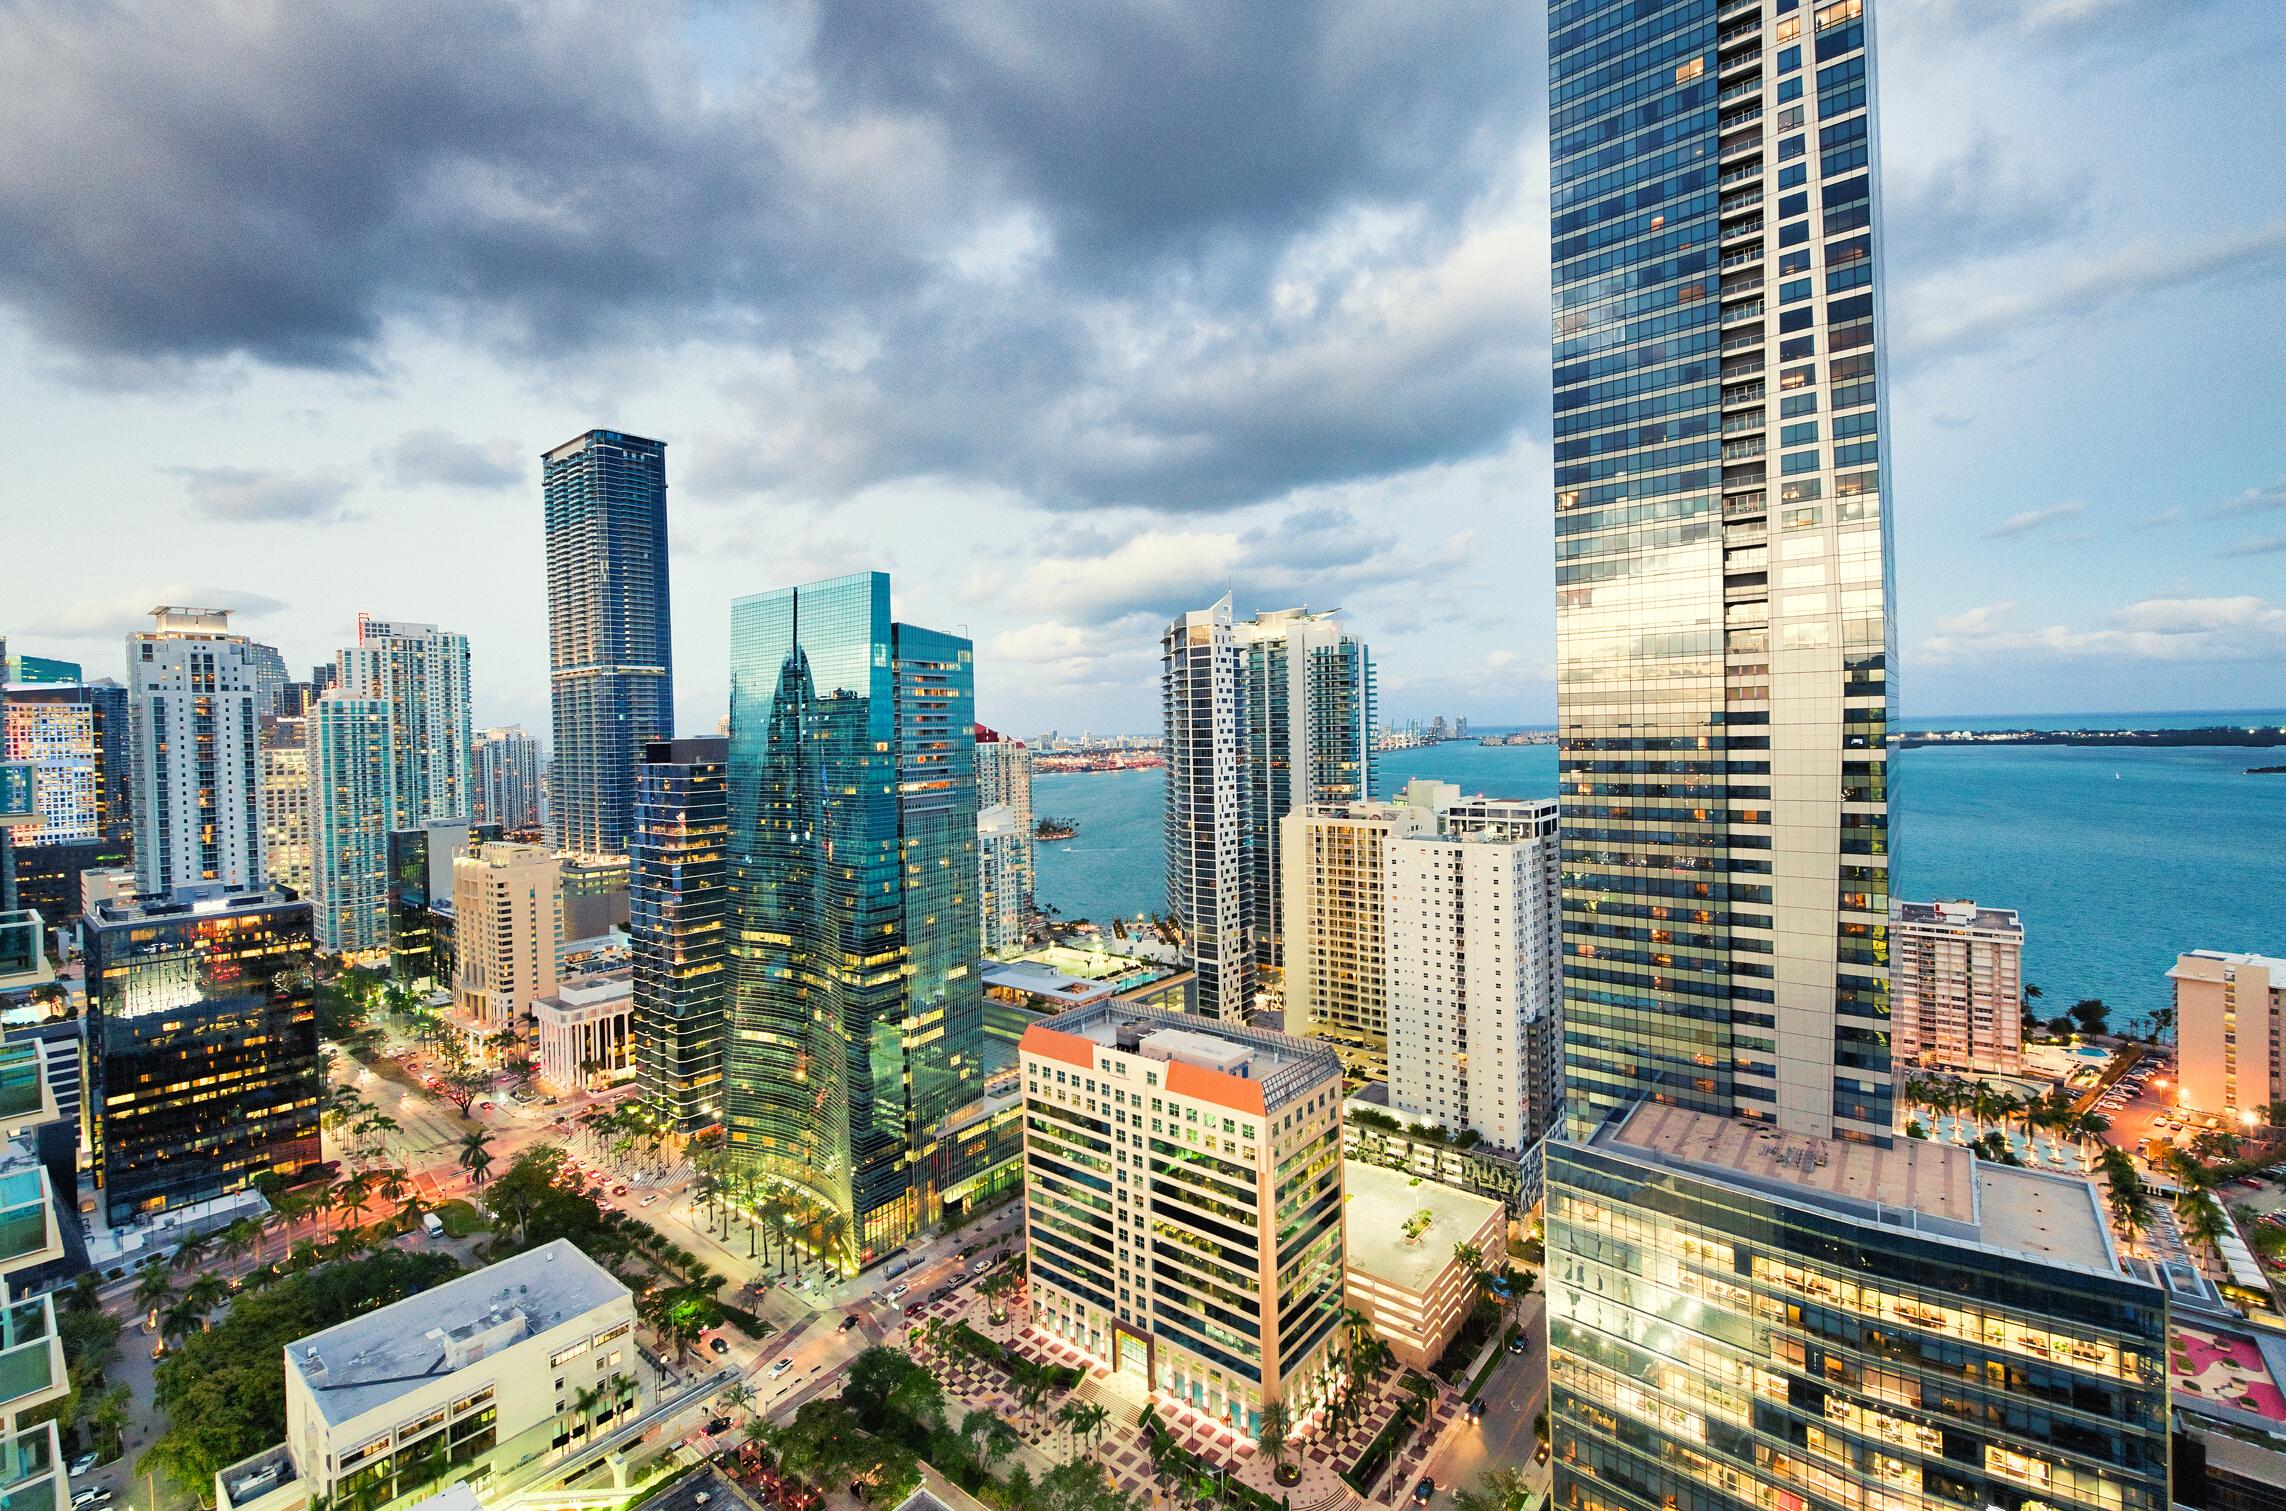
Brickell
Coconut Grove
Coral Gables
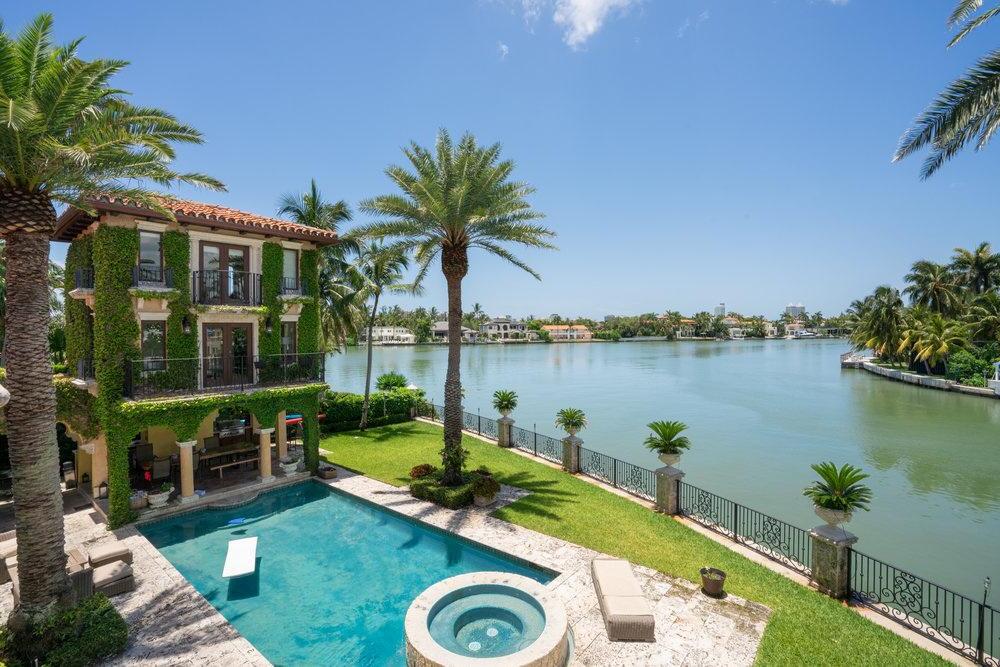
Fisher Island
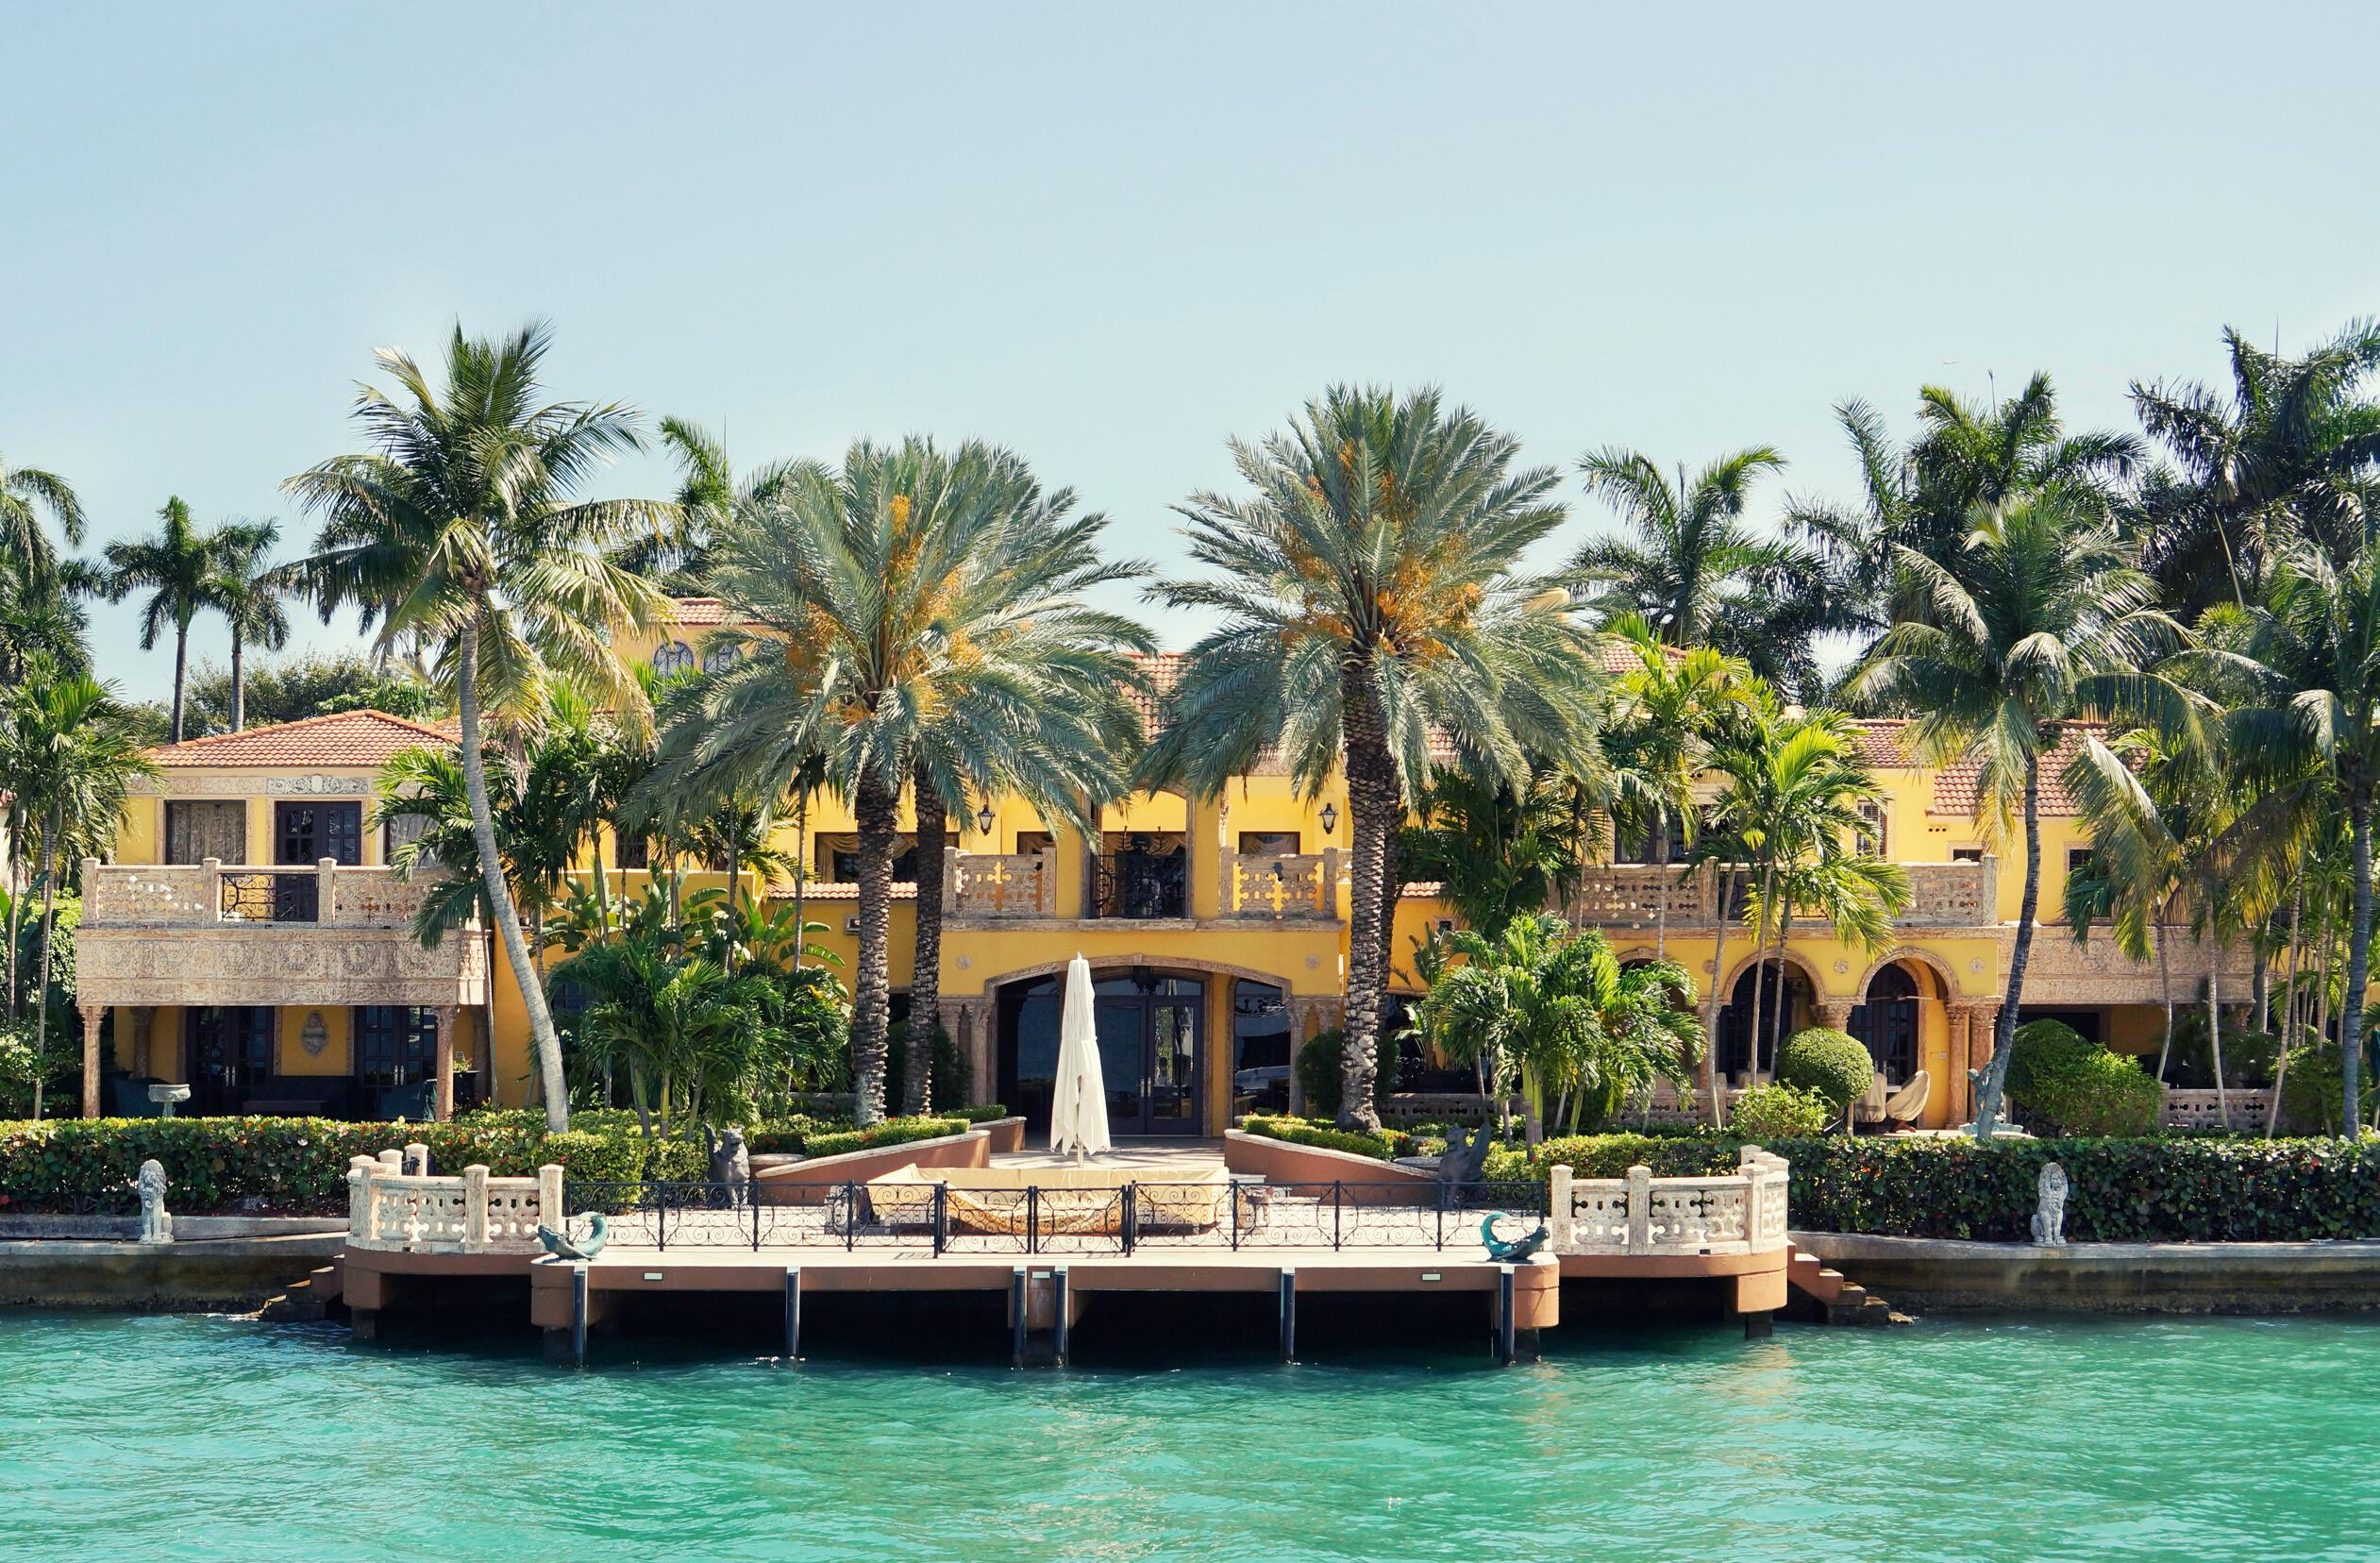
La Gorce Island
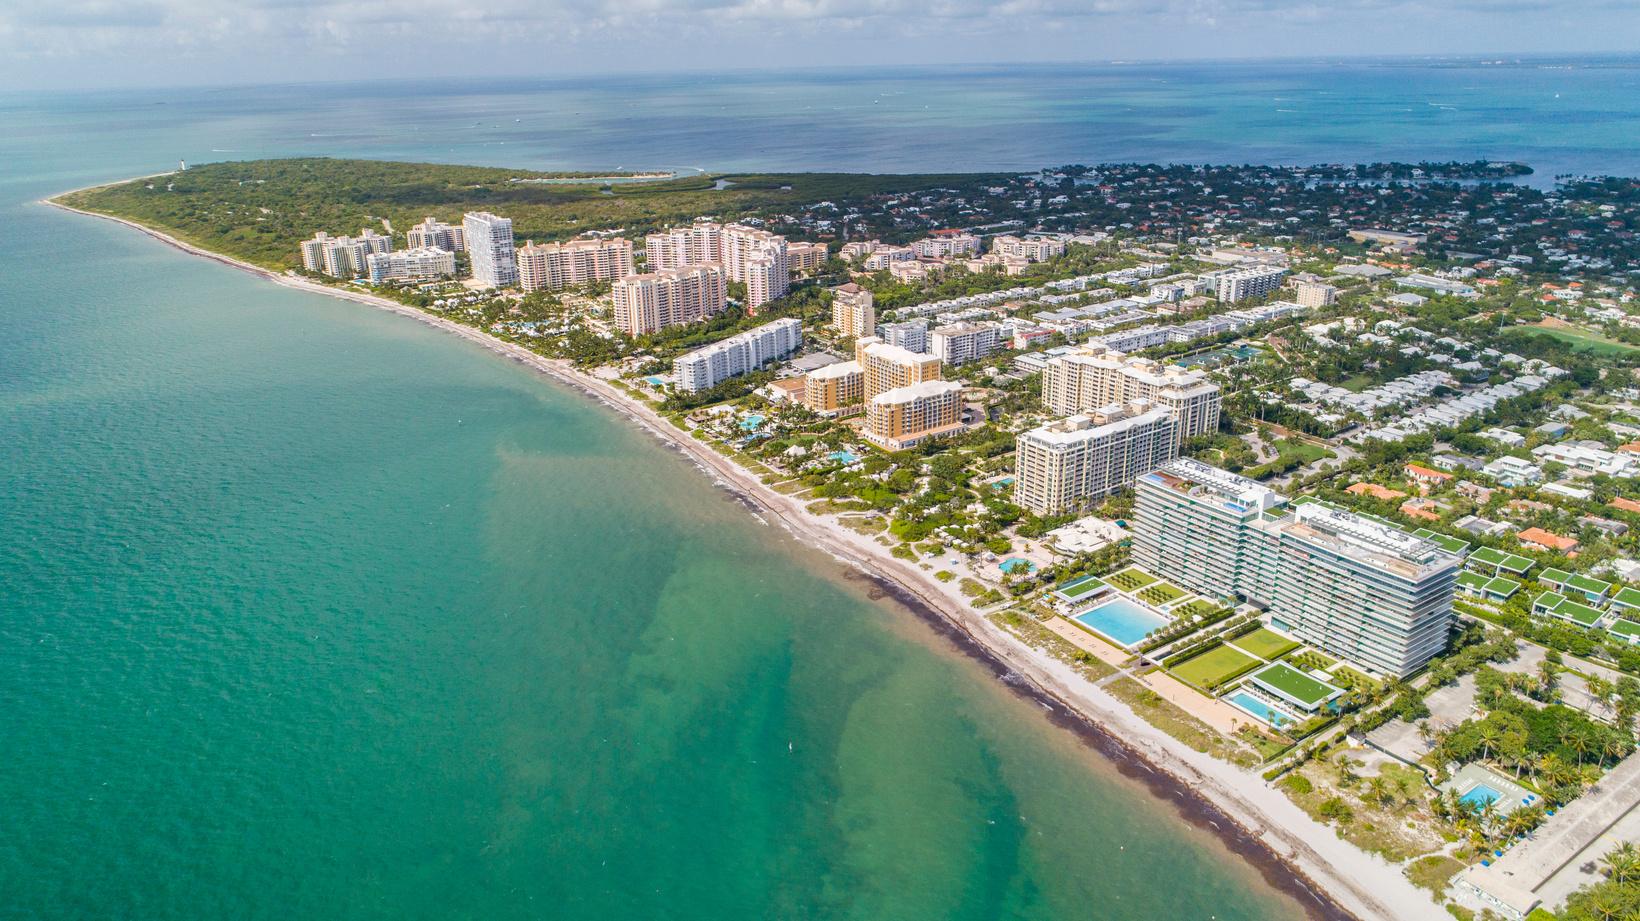
Key Biscayne
Miami Beach
Palm, Hibiscus & Star Islands
South Beach

South of Fifth
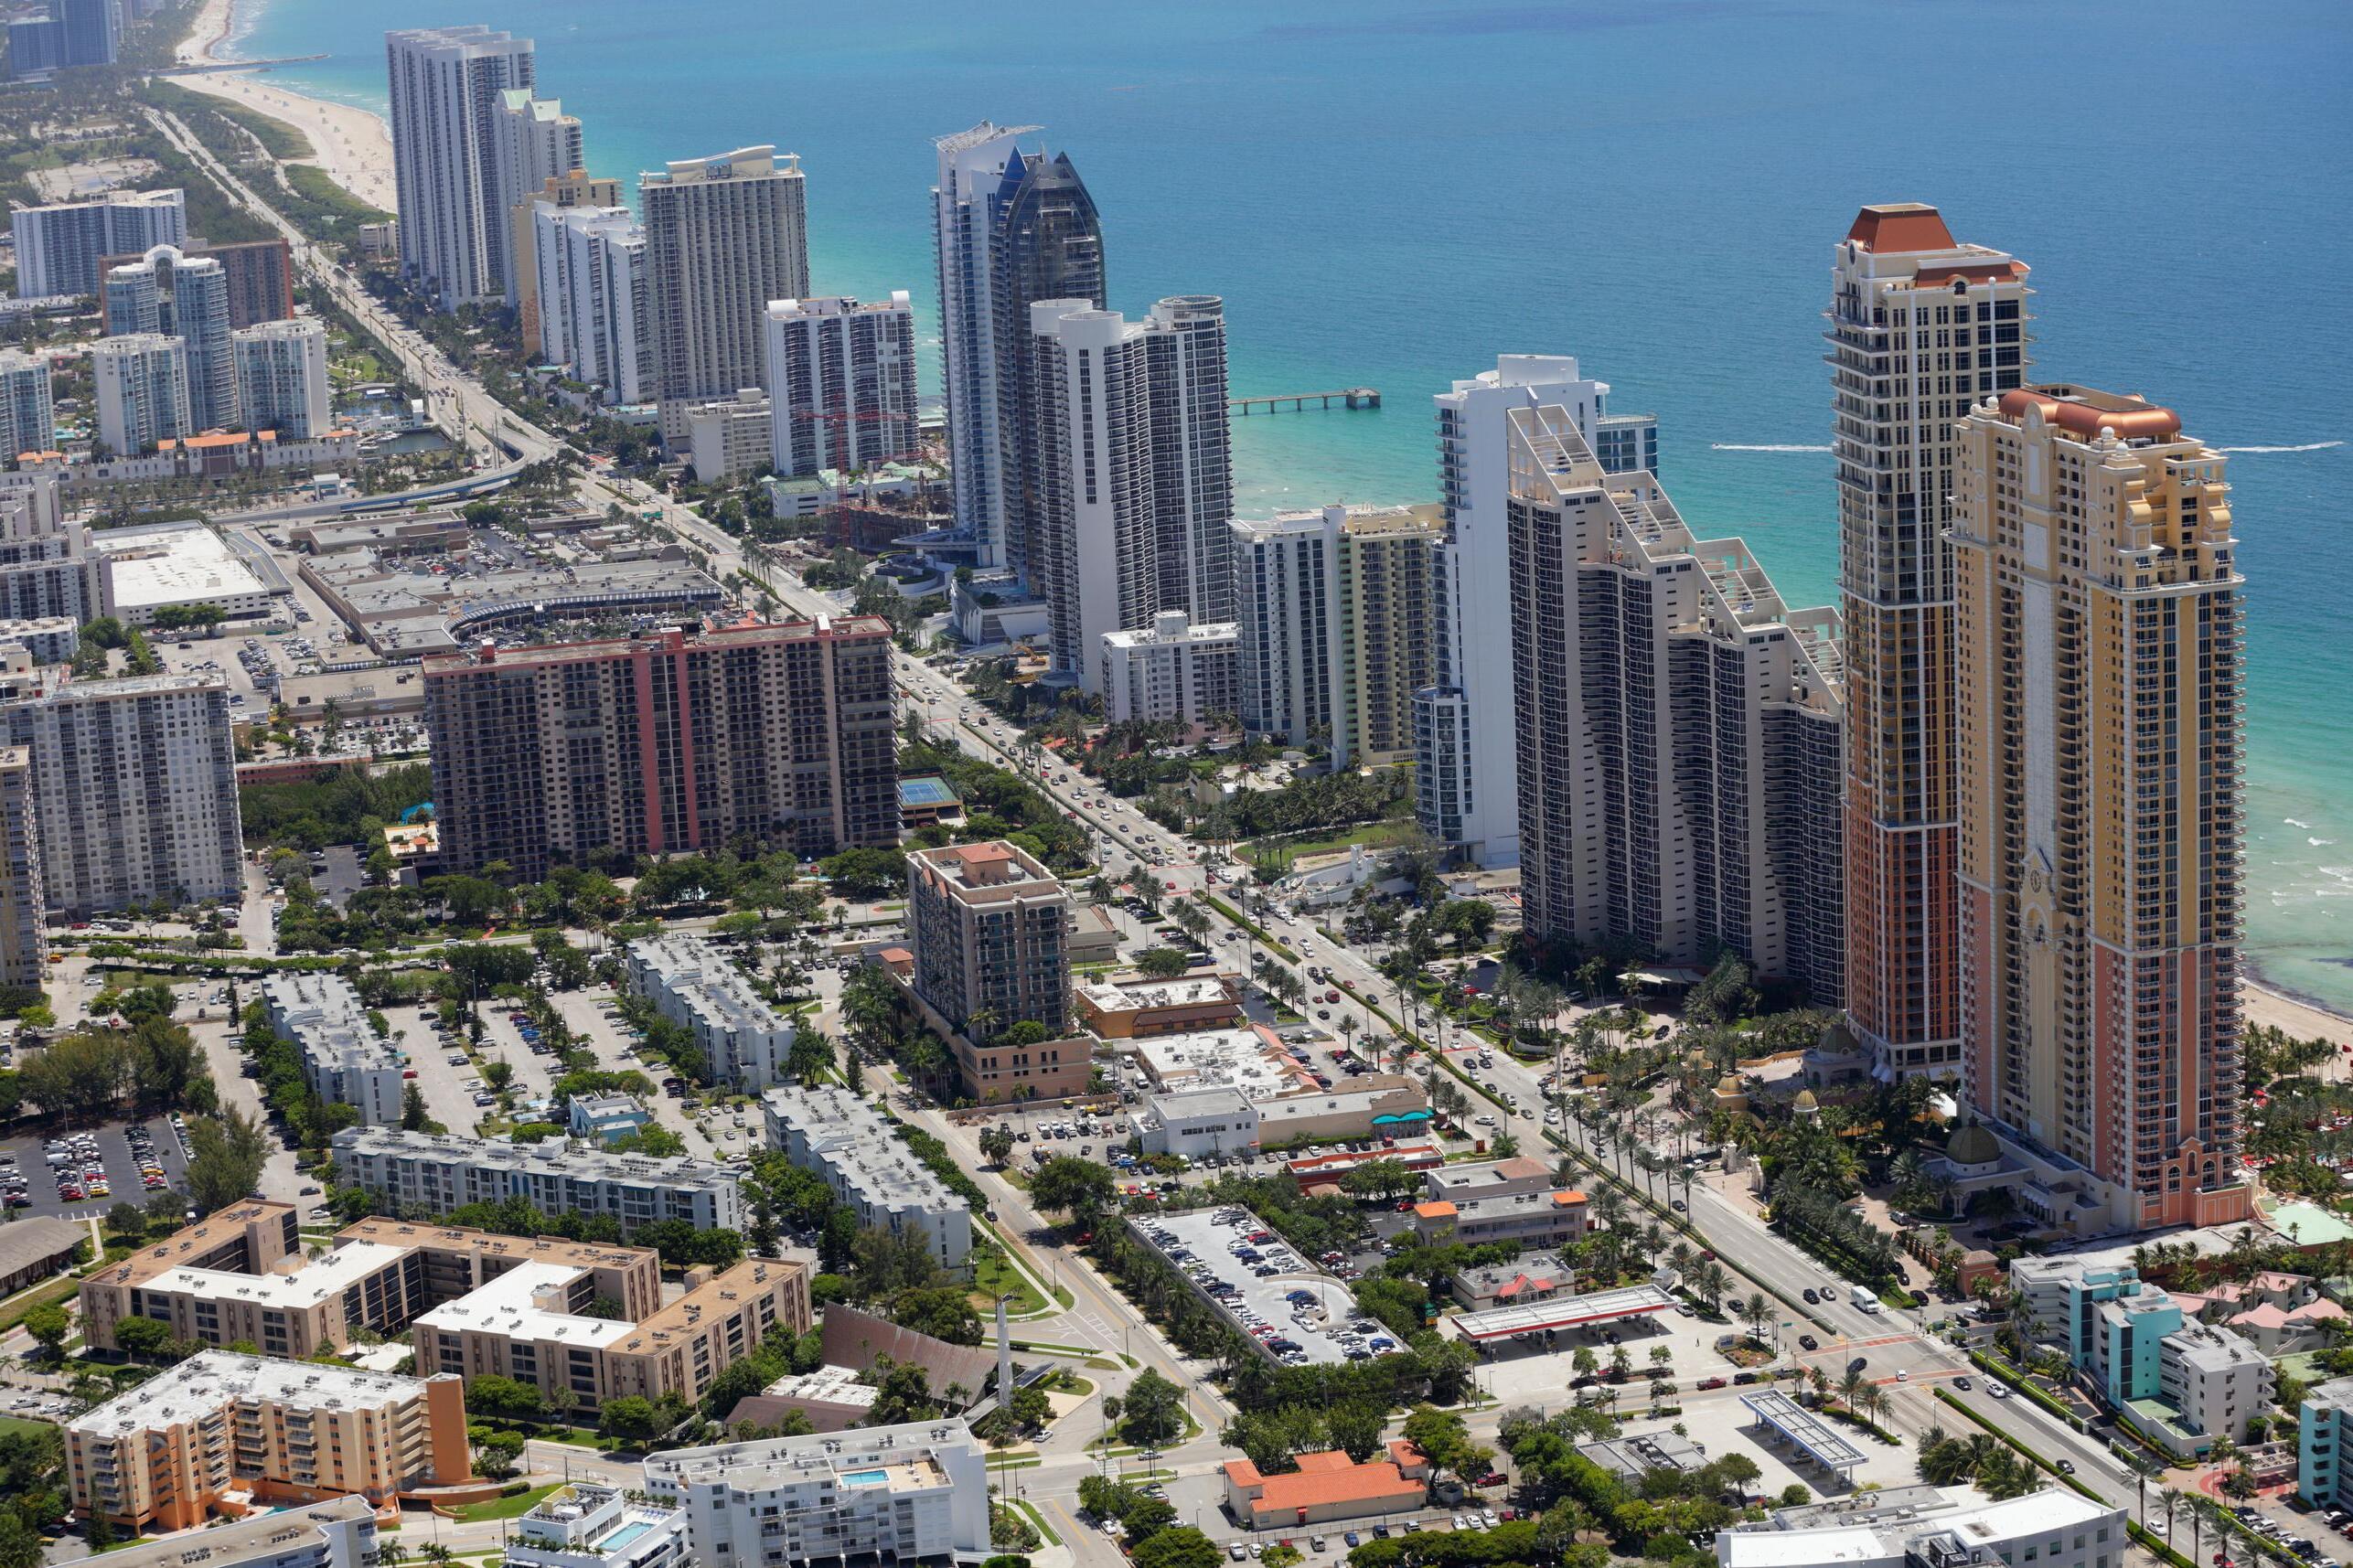
Sunny Isles Beach
Sunset Islands
Venetian Islands
MIAMI-DADE
The purpose of this study is to help you understand the dynamics of Miami's different markets and get an insight into Miami's market performance and trends When considering an investment in Miami's real estate, the best decision is always a result of the best information.

Our highest priority for our clients is to preserve and protect their legacy. No one does more research about the Miami market than us.


For forecast or projections for Miami for the remainder of the year or any other specific market, please contact us
This APT Market study was compiled from data obtained from the MLS It was made with information of sales through June 30, 2023 While it pertains to the surveyed area’s sales, it doesn’t include any off market sales The information contained herein is deemed accurate, but can’t be relied upon We are not responsible or liable for input, calculation errors and/or errors of omissions and market changes We always advise those who wish to utilize this data to corroborate such information for themselves Equal Housing Opportunity This is not an intention to solicit listing from other brokers
PAGE | 02 786.493.1388 | 786.214.0099 adriana@theaptteam.con | tracy@theaptteam.com www theaptteam com Adriana Pinto-Torres & Tracy Ferrer Realtor Associates | Directors of Luxury Sales Cofounders of The APT TEAM ABOUT THIS STUDY JAN VS. JUNE PERIOD
MIAMI-DADE COUNTY

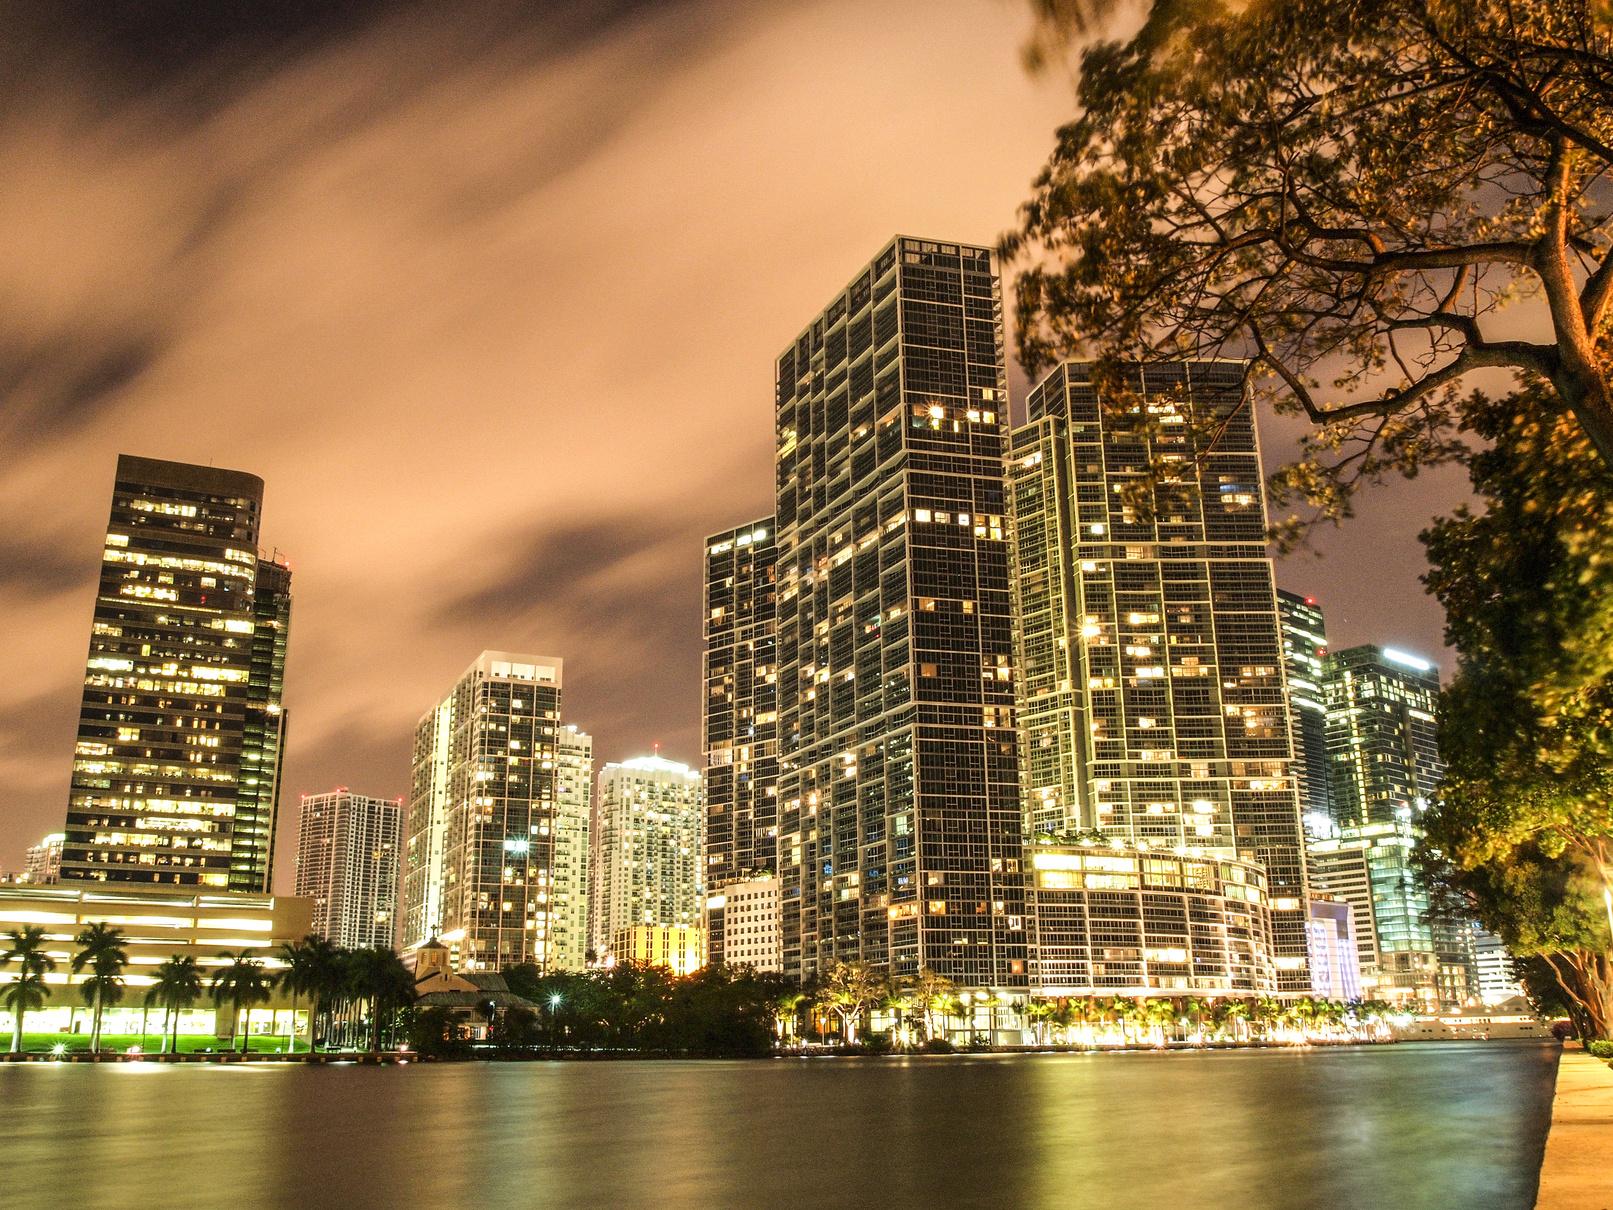
Miami has undergone a significant shift, evolving from a destination primarily sought after by travelers for vacation homes, to an enduring market for permanent residences
There has been a historical and monumental wealth and talent migration into the area
Miami continues to set and break records
Although sales volumes are not as high as they were during the pandemicinduced housing boom last year, most markets have seen a significant increase in sales that exceeds the usual seasonal pattern
The housing market is transitioning from an unprecedented boom to more normal levels of activity with surge in prices as quality inventory remains at
PAGE | 02 MID YEAR HIGHLIGHTS
MIAMI-DADE COUNTY


On the whole, the average prices for sales have reached unprecedented highs and have stayed significantly above the levels seen before the pandemic Substantial price gains from 2019; single-family homes are up by 80% and condos/townhomes have surged nearly 70% The number of sales fell from the heightened levels of the unprecedented Covid year
Prices remained steady or increased, while markets that saw a decrease in prices tended to also witness a shift towards smaller average sizes due to increased prices per square foot
NOTE
PAGE | 02 MID YEAR HIGHLIGHTS
SINGLE-FAMILY HOMES
CONDOS/TOWNHOMES
Excluding previous year boom, average sales price for the entire MiamiDade County is at historic levels. Single-family homes are up an astounding 80% from pre-Covid 2019. Average sales price for condos/townhomes has surged 73%.

2019 2020 2021 2022 2023 $1,250,000 $1,000,000 $750,000 $500,000 $250,000 $0
AVG SALES PRICE 2019 2020 2021 2022 2023 $534,323 $548,117 $976,994 $1,027,287 $966,323 % 80%
MIAMI-DADE JAN VS. JUNE PERIOD
2023
2019 PRICES 2019 2020 2021 2022 2023 $404,335 $410,511 $621,609 $724,605 $699,801 % 73% 2023 VS 2019 PRICES
VS
2019 2020 2021 2022 2023 $750,000 $500,000 $250,000 $0
MIAMI-DADE COUNTY
Excluding the exceptional growth of the previous year, the average sales price per square foot in Miami-Dade County is currently at record highs. Single-family homes have experienced a remarkable 80% increase compared to the pre-Covid levels of 2019. Similarly, the average sales price per square foot for condos and townhomes has also seen a substantial rise, reaching nearly 70%.
2019 2020 2021 2022 2023 $500/SF $400/SF $300/SF $200/SF $100/SF $0/SF AVESALESPRICE/SF
2019 2020 2021 2022 2023 $236/SF $252/SF $355/SF $417/SF $425/SF 2022 2023 ALL MIAMI-DADE COUNTY SINGLE-FAMILY HOMES AVG SALES PRICE % 2023 VS 2019 80% 2019 2020 2021 2022 2023 $500/SF $400/SF $300/SF $200/SF $100/SF $0/SF AVESALESPRICE/SF ALL MIAMI-DADE COUNTY CONDOS/TOWNHOMES 2019 2020 2021 2022 2023 $290/SF $284/SF $381/SF $483/SF $492/SF % 2023 VS 2019 69 6%
BRICKELL 2023 MIDYEAR MARKET REPORT

CONTENT
Jan through June average sales price 2019-2023
Y-O-Y change for condos/townhomes

Jan through June sales price
by month
# of sales per month
Months Supply of inventory (MSI)
BRICKELL
PAGE | 02 MID YEAR HIGHLIGHTS
BRICKELL
PAGE | 02 MID YEAR HIGHLIGHTS
BRICKELL
ALL
and townhome sector is recalibrating and yet is up from prepandemic year. The average sales price is now 61.7% higher compared to same period 2019. In the $1M+ condo/townhome sector, average sales price is nearly 7% more than during the first six months of 2019.
The
2019 2020 2021 2022 2023 $1,000,000 $750,000 $500,000 $250,000 $0 BRICKELL JAN VS. JUNE PERIOD AVG SALES PRICE 2019 2020 2021 2022 2023 $510,184 $503,793 $581,481 $815,810 $825,260 % 61 7%
condo
2019 2020 2021 2022 2023 $2,000,000 $1,500,000 $1,000,000 $500,000 $0 $1M+ CONDOS & TOWNHOMES 2019 2020 2021 2022 2023 $1,637,767 $1,873,925 $1,747,122 $1,910,030 $1,743,187 % 6.4% 2 2 2 2 2 AVG # BEDS SOLD 2023 VS 2019 PRICES 2023 VS 2019 PRICES 3 3 3 3 3 AVG # BEDS SOLD
CONDOS & TOWNHOMES
CURRENT ACTIVE:592
$1M+ CONDOS/TOWNHOMES
MONTHS SUPPLY OF INVENTORY based on closed sales: 5 1 Jan-June 23 Jan-June 22
CURRENT ACTIVE:235
MONTHS SUPPLY OF INVENTORY based on closed sales: 10 2
Average sales price per square foot increased for the general Brickell condo/townhome market as well as for those priced $1M and above, putting a downward pressure on overall prices for $1M+ condos/townhhomes and number of sales post heightened levels. Days on the market increased as a result.
BRICKELL 1,391 $815,617 $630 83 689 $825,260 $679 90 50.4% 7% 8.4% Jan-June 23 % Jan-June 22 AVG SALES PRICE AVG SPS/SF AVG DOM # CLOSED 1 1% 250 $1,910,030 $867 99 137 $1,743,187 $905 108 45.2% 4.3% 9% % AVG SALES PRICE AVG SPS/SF AVE DOM # CLOSED -8.7% ALL CONDOS/TOWNHOMES
JANUARY VS.
In the Brickell condo/townhome market, the sales reached their highest marks in February, March and May. The $1M+ condo/townhomes had their highest average in March but its mid year dropped from 2022.
BRICKELL Jan Feb March April May June $1,000,000 $750,000 $500,000 $250,000 $0 2022 2023 AVG SALES PRICE BY MONTH
JUNE
Jan Feb March April May June $645,727 $889,566 $863,945 $761,574 $863,773 $804,584 $767,486 $814,036 $807,513 $841,901 $856,307 $798,324 2023 2022 % -15.8% -9.2% -6.9% -9.5% 0.08% 0 07% 2023 MID YEAR AVG. 2022 MID YEAR AVG. $825,260 $815,810 Jan Feb March April May June $3,000,000 $2,000,000 $1,000,000 $0 2022 2023 Jan Feb March April May June $1,830,520 $2,223,588 $1,678,291 $2,023,125 $1,548,014 $1,583,668 $2,289,552 $1,880,550 $1,823,579 $1,997,148 $1,955,792 $1,619,784 2023 2022 % -20% 18.2% -7 9% -1 3% -20.8% -2.2% 2023 MID YEAR AVG. 2022 MID YEAR AVG. $1,743,187 $1,910,030 ALL CONDOS/TOWNHOMES $1M+ CONDOS/TOWNHOMES
BRICKELL AVE. # OF SALES BY MONTH 2023 TOTAL # OF SALES 689 AVE # OF SALES BY MONTH 2022 TOTAL # OF SALES 1,391 Jan 93 March April May June Jan 220 March April May 188 69 Feb 141 127 127 133 219 Feb 281 242 241 June ALL CONDOS/TOWNHOMES Jan 17 March May June Jan 40 April May 37 8 Feb 34 16 35 27 29 Feb 52 44 48 June March April AVE. # OF SALES BY MONTH 2023 TOTAL # OF SALES 137 AVE # OF SALES BY MONTH 2022 TOTAL # OF SALES 250 $1M+ CONDOS/TOWNHOMES
COCONUT GROVE 2023 MIDYEAR MARKET REPORT
CONTENT
Jan through June average sales price 2019-2023
Y-O-Y change for homes & condos/townhomes
Jan through June 2023 sales price by month
# of sales per month
Months Supply of inventory (MSI)
COCONUT GROVE
COCONUT GROVE
Coconut Grove has experienced a significant increase in prices, with a stagg most highe Singl levels, outp $1M+
PAGE | 02 MID YEAR HIGHLIGHTS
COCONUT GROVE

Sales transactions fell short of the frenzied Covid levels due to inventory shortage
Condos/townhomes are up by 156% from 2019
$1M+ condos/townhomes are 83% above 2019
$1M condos/townhomes average sales price is up 29% from 2022
PAGE | 02 MID YEAR HIGHLIGHTS
SINGLE-FAMILY HOMES
COCONUT GROVE
Single-family homes outperformed pre-pandemic 2019 levels by 121% while the $1M category surpassed it by 68%
2019 2020 2021 2022 2023 $4,000,000 $3,000,000 $2,000,000 $1,000,000 $0 2019 2020 2021 2022 2023 $1,313,383 $1,287,116 $2,424,618 $3,225,573 $2,902,972 % 2023 VS 2019 PRICES 121%
2019 2020 2021 2022 2023 $4,000,000 $3,000,000 $2,000,000 $1,000,000 $0 2019 2020 2021 2022 2023 $1,934,214 $1,700,786 $2,971,653 $3,695,618 $3,259,149 % 68.4% $1M+ SINGLE-FAMILY HOMES 4 4 4 4 4 4 4 4 4 4 AVG # BEDS SOLD 2023 VS 2019 PRICES AVG # BEDS SOLD
The average sales price per square foot for all homes in Coconut Grove has edged 2022 sales price by 6% to $932/SF and for $1M+ homes by 8.9%. Days on the market surged. Sales transactions are down from the historic levels due to increased prices due to inventory shortage.
80 $3,695,618 $910 61 67 $3,259,149 $991 104 16 2% 8.9% 70.4% % AVG SALES PRICE AVG SPS/SF AVE DOM # CLOSED 11.8% $1M+ SINGLE-FAMILY HOMES MONTHS SUPPLY OF INVENTORY based on closed sales: 6 81 CURRENT ACTIVE: 76 Jan-June 23 Jan-June 22 95 $3,225,573 $874 59 78 $2,902,972 $932 97 17.8% 6.6% 6.4% Jan-June 23 % Jan-June 22 AVG SALES PRICE AVG SPS/SF AVG DOM # CLOSED 10% SINGLE-FAMILY HOMES CURRENT ACTIVE:79 MONTHS SUPPLY OF INVENTORY based on closed sales: 6
COCONUT GROVE
Market is readjusting from the elevated thresholds and yet, June 2023 prices are trending upwards for the overall single-family home and the $1M+ home sector.
COCONUT GROVE
Jan Feb March April May June $6,000,000 $4,000,000 $2,000,000 $0 2022 2023
SALES PRICE BY MONTH
JUNE Jan Feb March April May June $3,199,200 $2,663,375 $2,410,000 $2,452,895 $2,946,361 $3,700,236 $5,045,857 $2,535,255 $2,733,600 $2,777,910 $3,903,333 $2,370,208 2023 2022 % -36.5% 5% -11.8% --11.7% -24.5% 56 1% 2023 MID YEAR AVG. 2022 MID YEAR AVG. $2,902,972 $3,225,573 Jan Feb March April May June $7,500,000 $5,000,000 $2,500,000 $0 2022 2023 Jan Feb March April May June $3,199,200 $3,818,000 $2,410,000 $2,666,471 $3,574,250 $4,185,125 $6,405,313 $2,850,301 $3,042,615 $2,458,789 $4,175,000 $2,710,150 2023 2022 % -50% 33.9% -20 7% -8 4% -14.3% 54.4% 2023 MID YEAR AVG. 2022 MID YEAR AVG. $3,259,149 $3,695,618
SINGLE-FAMILY HOMES
SINGLE-FAMILY HOMES
AVG
JANUARY VS.
ALL
$1M+
AVE. # OF SALES BY MONTH 2023 TOTAL # OF SALES 78 AVE # OF SALES BY MONTH 2022 TOTAL # OF SALES 95 Jan 8 March April May June Jan March April May 10 Feb 9 19 18 14 21 Feb 10 12 24 June ALL SINGLE-FAMILY HOMES 13 15 AVE # OF SALES BY MONTH 2023 TOTAL # OF SALES 67 AVE # OF SALES BY MONTH 2022 TOTAL # OF SALES 80 Jan 5 March May June Jan March May 10 Feb 9 17 14 12 16 Feb 9 11 20 June 11 13 $1M+ SINGLE-FAMILY HOMES April April
COCONUT GROVE
ALL CONDOS & TOWNHOMES
The overall condo and townhome market keeps growing steadily, increasing year over year. The average sales price is now 100 % higher compared to 2019. In the $1M+ condo/townhome sector, average sales price is up 83% from 2019 and up 29% from the first six months in 2022.
$2,000,000 $1,500,000 $1,000,000 $500,000 $0 COCONUT GROVE JAN
AVG
PRICE 2019 2020 2021 $712,350 $822,140 $1,172,058
VS. JUNE PERIOD
SALES
2019 2020 2021 2022 2023 $3,000,000 $2,000,000 $1,000,000 $0 % 83% 2 2 2 AVG # BEDS SOLD S 2023 VS 2019 PRICES G # DS SOLD
CURRENT ACTIVE: 80
$1M+ CONDOS/TOWNHOMES
MONTHS SUPPLY OF INVENTORY based on closed sales:3
CURRENT ACTIVE: 67
MONTHS SUPPLY OF INVENTORY based on closed sales: 6
Price trend indicators has Coconut Grove performing at record levels. Pace of market for all condos has slowed from frenzied 2022. Average sales prices are up. The ongoing shortage of inventory continues to drive up prices per square footage.
COCONUT GROVE 198 $1,426,330 $766 51 125 $1,828,177 $850 61 36.8% 10.9% 19.6% Jan-June 23 % Jan-June 22 AVG SALES PRICE AVG SPS/SF AVG DOM # CLOSED 28% 100 $2,268,387 $920 67 66 $2,931,026 $1,056 81 33% 14 7% 20.8% % AVG SALES PRICE AVG SPS/SF AVE DOM # CLOSED 29.2% ALL CONDOS/TOWNHOMES
Jan-June 22
Jan-June 23
COCONUT GROVE
Jan Feb March April May June $2,500,000 $2,000,000 $1,500,000 $1,000,000 $500,000 $0 2022 2023 AVG SALES PRICE BY MONTH JANUARY VS. JUNE Jan Feb March April May June $2,242,722 $1,687,722 $1,563,136 $1,989,728 $1,536,537 $2,181,017 $1,234,505 $1,511,465 $1,035,400 $1,533,651 $1,589,800 $1,577,852 2023 2022 % 81.6% 11.6% 50.9% 29% -3.3% -38 2% 2023 MID YEAR AVG. 2022 MID YEAR AVG. $1,828,177 $1,426,330 Jan Feb March April May June $5,000,000 $4,000,000 $3,000,000 $2,000,000 $1,000,000 $0 2022 2023 Jan Feb March April May June $2,701,429 $2,401,091 $2,245,769 $4,135,620 $2,388,231 $4,012,545 $2,225,000 $2,446,282 $1,654,351 $2,585,525 $2,432,842 $2,107,484 2023 2022 % 21% 18.4% 35 7% 59 9% -18.3% 90.3% 2023 MID YEAR AVG. 2022 MID YEAR AVG. $2,931,026 $2,268,387 ALL CONDOS/TOWNHOMES $1M+ CONDOS/TOWNHOMES
By in large, the average selling prices of condos/townhomes still manage to surpass previous limits month after month.
COCONUT
AVE. # OF SALES BY MONTH 2023 TOTAL # OF SALES 125 AVE # OF SALES BY MONTH 2022 TOTAL # OF SALES 198 Jan 18 March April May June Jan 39 March April May 27 9 Feb 22 25 27 24 19 Feb 34 43 35 June ALL CONDOS/TOWNHOMES Jan 11 March May June Jan 20 April May 18 7 Feb 13 10 14 11 7 Feb 15 20 19 June March April AVE. # OF SALES BY MONTH 2023 TOTAL # OF SALES 66 AVE # OF SALES BY MONTH 2022 TOTAL # OF SALES 100 $1M+ CONDOS/TOWNHOMES
GROVE
CORAL GABLES
2023 MIDYEAR MARKET REPORT
CONTENT
Jan through June average sales price 2019-2023
Y-O-Y change for homes & condos/townhomes

Jan through June 2023 sales price by month
# of sales per month
Months Supply of inventory (MSI)
PAGE | 02 CORAL GABLES
CORAL GABLES
Miami has experienced a remarkable change transitioning from a popular
PAGE | 02 MID YEAR HIGHLIGHTS
secon Sales es levels witne Sales ding 61% highe
CORAL GABLES
The condo/townhome market has enjoyed great gains for 4 consecutive years, reaching new record levels
Price trend indicators for condos/townhomes have increased compared to same period of the previous year
PAGE | 02 MID YEAR HIGHLIGHTS
Save for the previous year when prices rose annually to their highest levels, the average sales price for all single-family homes has steadily appreciated since 2019. As a matter of fact, they are up 61.5% from 2019.
2019 2020 2021 2022 2023 $2,500,000 $2,000,000 $1,500,000 $1,000,000 $500,000 $0 CORAL GABLES JAN VS JUNE PERIOD AVG SALES PRICE 2019 2020 2021 2022 2023 $1,313,383 $1,443,521 $1,840,886 $2,423,722 $2,122,311 % 2023 VS 2019 PRICES 61.5%
HOMES 2019 2020 2021 2022 2023 $4,000,000 $3,000,000 $2,000,000 $1,000,000 $0 2019 2020 2021 2022 2023 $2,487,081 $2,914,562 $2,625,899 $3,210,771 $2,594,072 % 4.3% $1M+ SINGLE-FAMILY HOMES 4 4 4 4 4 4 4 4 4 4 AVG # BEDS SOLD 2023 VS 2019 PRICES AVG # BEDS SOLD
SINGLE-FAMILY
HOMES
CURRENT ACTIVE: 122
$1M+ SINGLE-FAMILY HOMES
MONTHS SUPPLY OF INVENTORY based on closed sales: 2 8
CURRENT ACTIVE:98
MONTHS SUPPLY OF INVENTORY based on closed sales:3
In the Coral Gables market for single-family homes, there is a limited supply of available properties, but a high demand from buyers. The average time it takes for a property to sell has risen but it is still just under two months. Average sales price per square foot edged out 2022's by 3.2%. The average price per square foot for $1M homes remains virtually unchanged from the previous year at $850/SF. Inventory scarcity is still prevalent and MSI of 3 months makes Coral Gables home market in high demand.
CORAL GABLES
325 $2,423,722 $745 48 259 $2,123,287 $769 73 20.3% 3.2% 52% Jan-June 23 % Jan-June 22 AVG SALES PRICE AVG SPS/SF AVG DOM # CLOSED 12.4% 221 $3,210,771 $852 49 194 $2,592,943 $850 75 12 2% 0.02% 53% % AVG SALES PRICE AVG SPS/SF AVE DOM # CLOSED 19.2%
ALL SINGLE-FAMILY
Jan-June 23 Jan-June 22
The entry threshold in Coral Gables has consistently risen to the point that the average sales price for all homes and for $1M+ homes are almost on the same footing.
Jan Feb March April May June $3,000,000 $2,000,000 $1,000,000 $0 2022 2023 AVG SALES PRICE BY MONTH JANUARY VS. JUNE Jan Feb March April May June $2,802,875 $1,761,874 $1,970,807 $2,478,852 $1,892,441 $2,097,845 $1,829,175 $2,008,069 $2,746,982 $2,658,759 $2,856,042 $2,045,151 2023 2022 % 53.2% -12.2% -28.2%-6.7% -33.7% 2 5% 2023 MID YEAR AVG. 2022 MID YEAR AVG. $2,123,287 $2,423,722 Jan Feb March April May June $4,000,000 $3,000,000 $2,000,000 $1,000,000 $0 2022 2023 Jan Feb March April May June $3,484,389 $2,250,654 $2,429,114 $3,009,628 $2,227,896 $2,493,802 $2,289,429 $2,960,936 $3,647,254 $3,562,263 $3,705,277 $2,575,351 2023 2022 % 52% -23.9% -33 3% -15 5% -39.8% -3.1% 2023 MID YEAR AVG. 2022 MID YEAR AVG. $2,592,943 $3,210,771 ALL SINGLE-FAMILY HOMES $1M+ SINGLE-FAMILY HOMES
CORAL GABLES
CORAL GABLES AVE. # OF SALES BY MONTH 2023 TOTAL # OF SALES 259 AVE # OF SALES BY MONTH 2022 TOTAL # OF SALES 325 Jan 35 March April May June Jan 46 March April May 53 24 Feb 64 51 48 37 40 Feb 83 48 55 June ALL SINGLE-FAMILY HOMES Jan 24 March May June Jan 27 April May 37 18 Feb 47 39 37 29 28 Feb 57 33 39 June March April AVE. # OF SALES BY MONTH 2023 TOTAL # OF SALES 194 AVE # OF SALES BY MONTH 2022 TOTAL # OF SALES 221 $1M+ SINGLE-FAMILY HOMES
The market for condos and townhomes has experienced significant growth over the past four years, reaching unprecedented levels.
2019 2020 2021 2022 2023 $800,000 $600,000 $400,000 $200,000 $0 CORAL GABLES JAN VS. JUNE PERIOD AVG SALES PRICE 2019 2020 2021 2022 2023 $470,633 $467,253 $490,040 $739,106 $746,935 % 58 7%
CONDOS & TOWNHOMES 2019 2020 2021 2022 2023 $2,500,000 $2,000,000 $1,500,000 $1,000,000 $500,000 $0 $1M+ CONDOS & TOWNHOMES 2019 2020 2021 2022 2023 $1,560,300 $1,418,529 $1,729,653 $1,949,148 $2,247,593 % 44% 2 2 2 2 2 AVG # BEDS SOLD 2023 VS 2019 PRICES 2023 VS 2019 PRICES 3 3 4 3 3 AVG # BEDS SOLD
ALL
CORAL GABLES
CURRENT ACTIVE:93
$1M+ CONDOS/TOWNHOMES
23
MONTHS SUPPLY OF INVENTORY based on closed sales: 2 9
CURRENT ACTIVE:35
MONTHS SUPPLY OF INVENTORY based on closed sales:7 7
Price trend indicators for condos/townhomes have increased compared to same period of the previous year. Average sales price is up accross all condos/townhomes and up 15% for the $1M+ condos/townhomes. Average sale price per square foot has also risen. Condo/transactions are coming down from the frenzied levels.
338 $739,106 $505 50 191 $746,935 $534 67 43.7% 5.9% 34% Jan-June 23 % Jan-June 22 AVG SALES PRICE AVG SPS/SF AVG DOM # CLOSED 1% 57 $1,949,148 $686 93 27 $2,247,593 $771 128 52 6% 12.3% 37.6% % AVG SALES PRICE AVG SPS/SF AVE DOM # CLOSED 15.3% ALL CONDOS/TOWNHOMES
Jan-June
Jan-June
22
CORAL GABLES
JANUARY VS. JUNE
Price trend indicators for condos/townhomes performed better on some months than others, with the mid year average increasing from 2022.
Jan Feb March April May June $1,250,000 $1,000,000 $750,000 $500,000 $250,000 $0 2022 2023 AVG SALES PRICE BY MONTH
Jan Feb March April May June $776,815 $659,622 $754,458 $523,224 $724,513 $1,033,547 $643,566 $602,322 $798,176 $715,582 $829,531 $829,682 2023 2022 % 20.7% 9.5% 5.4% -26.8% -12.6% 24 5% 2023 MID YEAR AVG. 2022 MID YEAR AVG. $746,935 $739,106 Jan Feb March April May June $5,000,000 $4,000,000 $3,000,000 $2,000,000 $1,000,000 $0 2022 2023 Jan Feb March April May June $2,264,250 $1,916,667 $2,447,000 $1,117,500 $2,104,800 $2,610,500 $1,890,667 $4,850,000 $2,401,999 $1,938,333 $1,548,077 $1,818,555 2023 2022 % 19.7% -60.4% 1 8% -42 3% 35.9% 43.5% 2023 MID YEAR AVG. 2022 MID YEAR AVG. $2,247,593 $1,949,148 ALL CONDOS/TOWNHOMES $1M+ CONDOS/TOWNHOMES
CORAL GABLES AVE. # OF SALES BY MONTH 2023 TOTAL # OF SALES 191 AVE # OF SALES BY MONTH 2022 TOTAL # OF SALES 338 Jan 26 March April May June Jan 59 March April May 67 27 Feb 36 29 41 32 44 Feb 66 55 47 June ALL CONDOS/TOWNHOMES Jan 3 March May June Jan 11 May 17 4 Feb 5 2 5 8 6 Feb 9 13 June April April AVE. # OF SALES BY MONTH 2023 TOTAL # OF SALES 27 AVE # OF SALES BY MONTH 2022 TOTAL # OF SALES 57 ALL CONDOS/TOWNHOMES 1 March
FISHER ISLAND 2023 MIDYEAR MARKET REPORT
CONTENT
Jan through June average sales price 2019-2023
Y-O-Y change for Fisher Island residences
Jan through June 2023 sales price by month
# of sales per month
Months Supply of inventory (MSI)
PAGE | 02 FISHER ISLAND
FISHER ISLAND
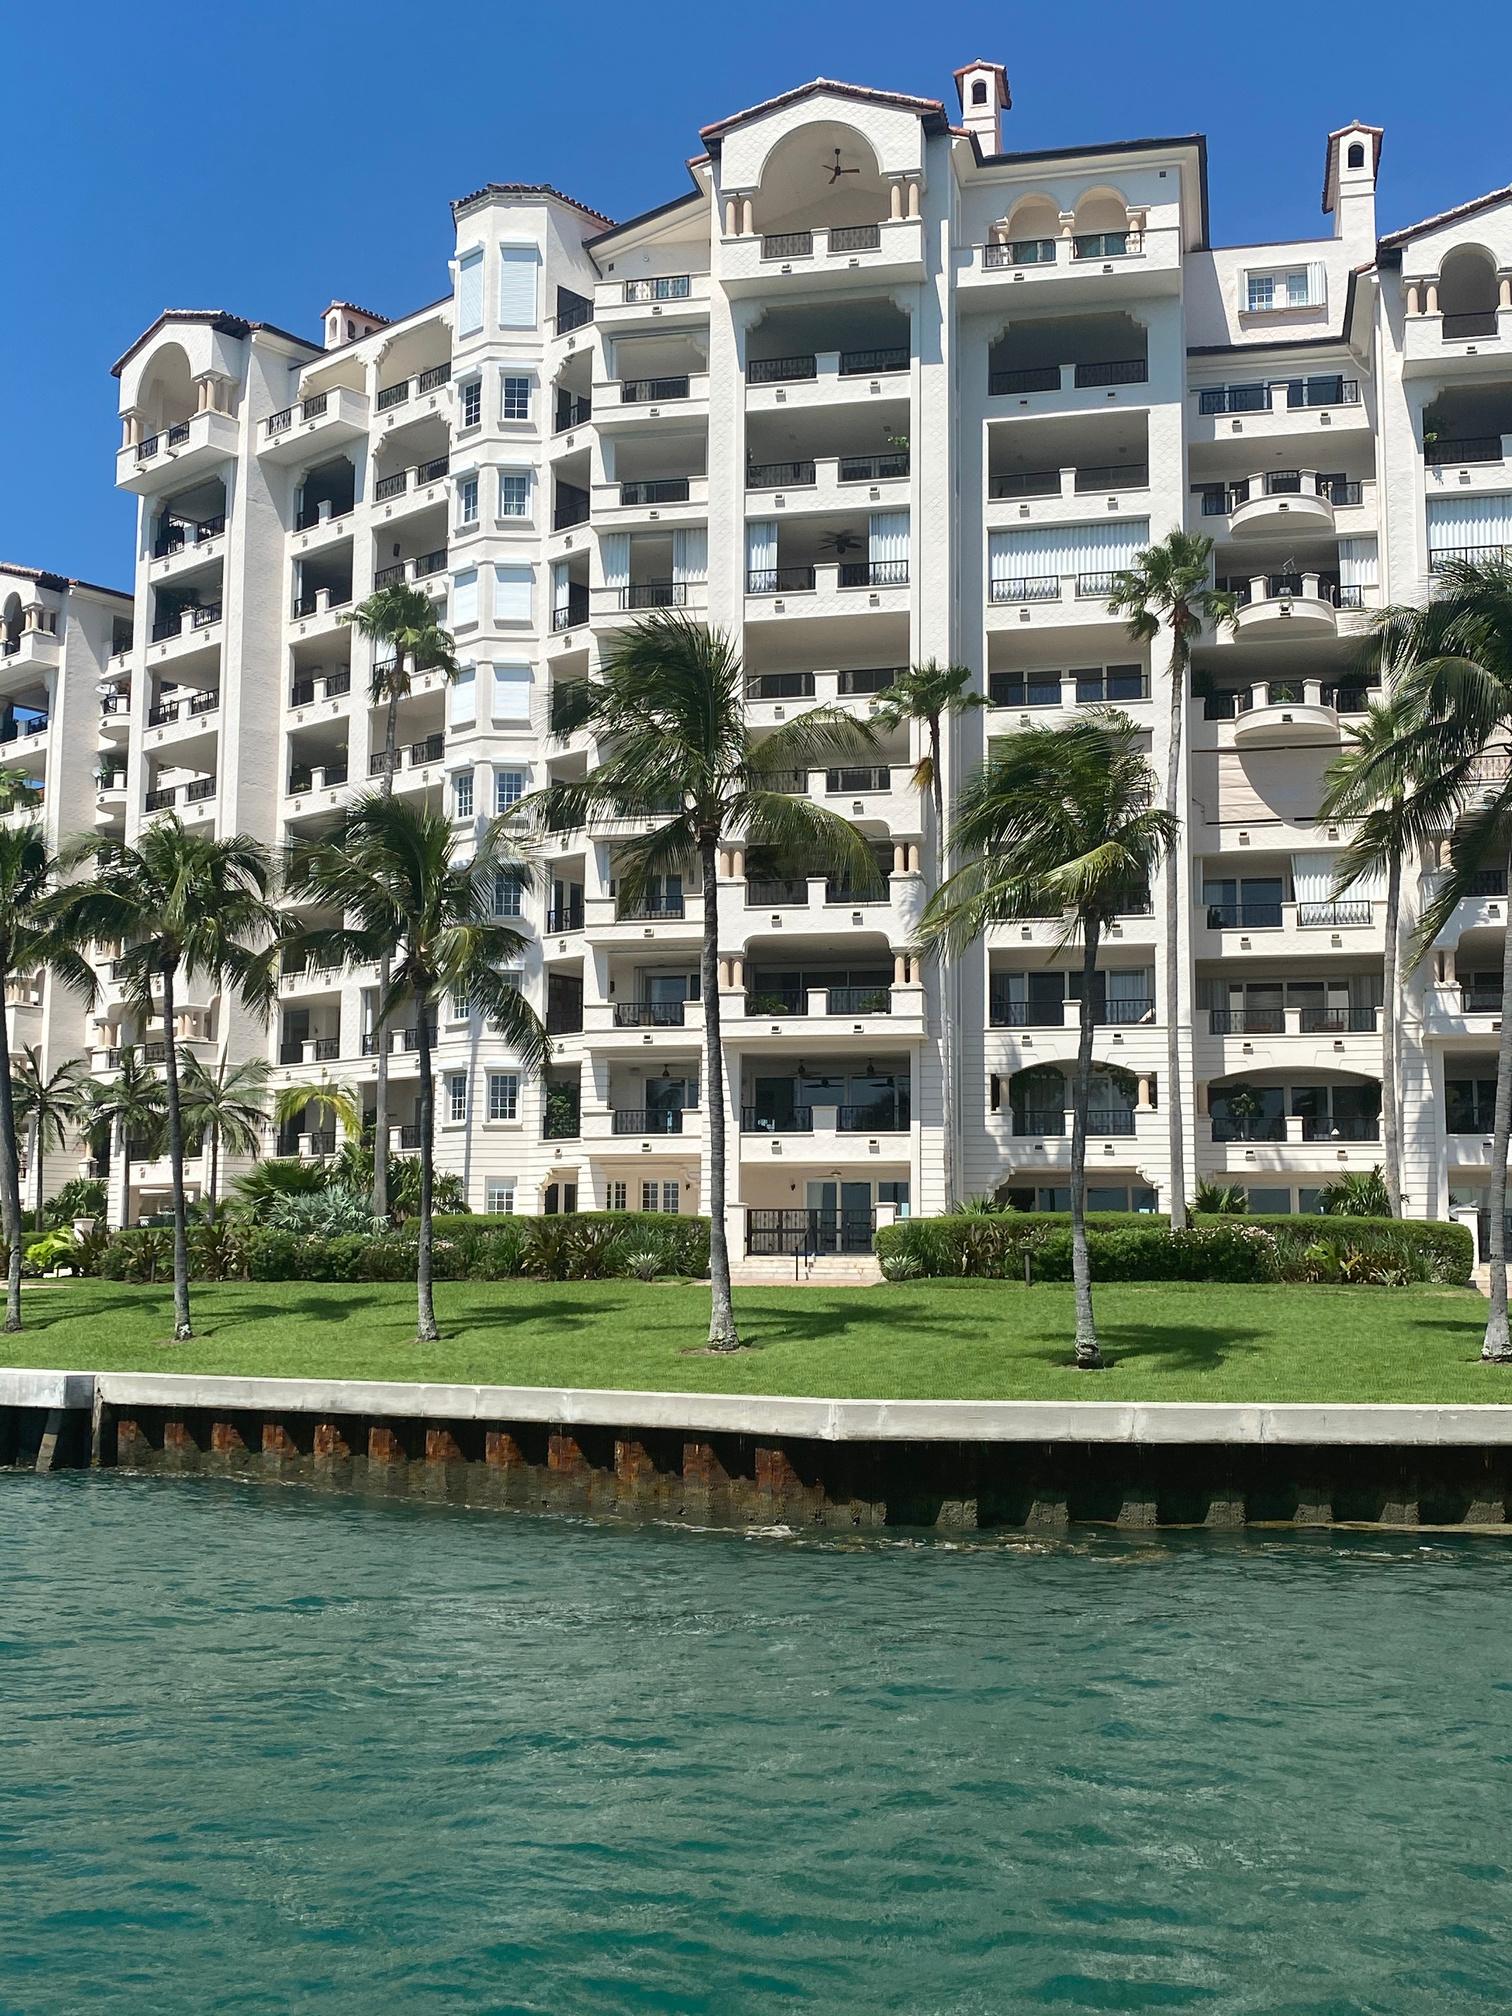
Fisher Island's property and its location are truly one-of-a-kind and so is its real estate performance

With the construction of new developments throughout the years and an influx of wealthy buyers, prices on the island have soared to unprecedented levels
This trend had been further exacerbated by the pandemic, as affluent individuals sought refuge on the island
PAGE | 02 MID YEAR HIGHLIGHTS
FISHER ISLAND
The average sales price and price per square foot on Fisher Island have increased, surpassing previous records.
Properties are selling at a faster rate.
Average sales price is now 120% more than what it was in 2019
Average sales price per square foot increased 11% from same period in 2022 to $2,314/SF
PAGE | 02 MID YEAR HIGHLIGHTS
Fisher Island has long been recognized as one of the richest areas in the United States, and property prices continue to reach new heights as more luxurious homes are constructed and affluent buyers flocked to the island, particularly during the pandemic. They are now 120% than what they were in 2019.
$10,000,000 $7,500,000 $5,000,000 $2,500,000 $0 FISHER ISLAND JAN VS JUNE PERIOD AVG SALES PRICE 2019 2020 2021 2022 2023 $3,987,059 $6,323,912 $6,566,483 $8,150,944 $8,768,750 % 2023 VS 2019 PRICES 119 9%
FISHER ISLAND RESIDENCES 3 4 3 3 3 AVG # BEDS SOLD
CURRENT ACTIVE:26
MONTHS SUPPLY OF INVENTORY based on closed sales:9 7
Fisher Island's average sales price and sales price per square foot have risen, even surpassing previous records. Additionally, properties on the market are being sold at a faster pace.
FISHER ISLAND 36 $8,150,944 $2,079 146 16 $8,768,750 $2,314 122 55.5% 11.3% 16.4% Jan-June 23 % Jan-June 22 AVG SALES PRICE AVG SPS/SF AVG DOM # CLOSED 7.5%
ISLAND RESIDENCES
FISHER
In 2023, all months except for April and May saw better performance compared to 2022. Despite already having high-priced items, Fisher Island experienced a 7.5% increase in performance compared to the previous year.
FISHER ISLAND Jan Feb March April May June $15,000,000 $10,000,000 $5,000,000 $0 2022 2023 AVG SALES PRICE BY MONTH JANUARY VS. JUNE Jan Feb March April May June $7,291,667 $13,712,500 $9,025,000 0 $6,200,000 $8,150,000 $5,593,333 $11,021,429 $8,039,545 $8,146,667 $7,169,800 $6,960,000 2023 2022 % 30.3% 24.4% 12.2%-13.5% 17% 2023 MID YEAR AVG. 2022 MID YEAR AVG. $8,768,750 $8,150,944 ALL SINGLE-FAMILY HOMES
Jan 2 March June 3 Feb 6 0 2 6 FISHER ISLAND AVE # OF SALES BY MONTH 2023 TOTAL # OF SALES 16 AVE # OF SALES BY MONTH 2022 TOTAL # OF SALES 36 April May Jan 7 March April May 4 6 Feb 11 3 5 June FISHER
RESIDENCES 3 2 6 0 2 3
ISLAND
KEY BISCAYNE 2023 MIDYEAR MARKET REPORT

CONTENT
Jan through June average sales price 2019-2023
Y-O-Y change for homes & condos/townhomes

Jan through June 2023 sales price by month
# of sales per month
Months Supply of inventory (MSI)
PAGE | 02 KEY BISCAYNE
KEY BISCAYNE
In Key Biscayne, the average sales price of a single-family home is approximately $5 million.
The data shows that the overall single-family home market and the market for homes valued at $1 million or more have same stats
This means that the thresholds have been pushed higher in Key Biscayne for single-family homes.
The average sales price for all homes is up 40% from 2019
PAGE | 02 MID YEAR HIGHLIGHTS
KEY BISCAYNE

Average sales price for condos have increased 59% from 2019 # of closed sales are starting to normalize following elevated levels of the past two years
The average sales price of luxury condominiums and townhomes priced at $1 million or higher has dropped in comparison to the previous year. # of closed sales are starting to normalize following elevated levels of the past two years
PAGE | 02 MID YEAR HIGHLIGHTS
JAN VS JUNE PERIOD
SINGLE-FAMILY HOMES
The entry barrier into Key Biscayne is high. There are no homes under $1M. According to sales and price indicators, the average sales price for single-family homes in Key Biscayne is around $5 million. The statistics for both the general single-family home market and the market for homes priced at $1 million or more are identical, so we only need to consider one set of data.
2019 2020 2021 2022 2023 $6,000,000 $4,000,000 $2,000,000 $0 KEY BISCAYNE
AVG SALES PRICE 2019 2020 2021 2022 2023 $3,626,388 $2,933,397 $3,697,890 $4,891,474 $5,066,813 % 2023 VS 2019 PRICES 39.7%
5 5 5 4 5 AVG # BEDS SOLD
SINGLE-FAMILY
CURRENT ACTIVE:29
MONTHS SUPPLY OF INVENTORY based on closed sales:11
The average sales price for homes in Key Biscayne has edged 2022 sales price by 3% to $5,066,813. Average sales price per square foot was at $1,381. Days on the market declined by 10% Sales transactions are down due to increased prices and inventory shortage.
KEY BISCAYNE 42 $4,891,474 $1,371 124 16 $5,066,813 $1,381 111 61.9% 0.07% -10.4% Jan-June 23 % Jan-June 22 AVG SALES PRICE AVG SPS/SF AVG DOM # CLOSED 3.5%
HOMES
JANUARY VS.
March 2023 had no recorded sales. Jan and May 2023 were the best performing months.
2022 AVG SALES PRICE
MONTH
KEY BISCAYNE
BY
JUNE
Jan Feb March April May June $6,700,000 $2,400,000 0 $3,481,250 $6,680,800 $4,485,000 $3,907,500 $5,898,000 $3,613,571 $5,221,667 $5,370,000 $5,229,555 2023 2022 % 71.4% -59.3% -33.3% 24.4% 14 2% 2023 MID YEAR AVG. 2022 MID YEAR AVG. $5,066,813 $4,891,474 Jan Feb March April May June $7,500,000 $5,000,000 $2,500,000 $0 2022 2023 ALL SINGLE-FAMILY HOMES
KEY BISCAYNE AVE # OF SALES BY MONTH 2023 TOTAL # OF SALES 16 AVE # OF SALES BY MONTH 2022 TOTAL # OF SALES 42 Jan 1 March April May June Jan March April May 2 Feb 0 4 5 4 8 Feb 6 8 8 June ALL SINGLE-FAMILY HOMES 5 7
ALL CONDOS & TOWNHOMES
The condo and townhome market is starting to recalibrate after the pandemic, but it is still outperforming the pre-pandemic levels. The average sales price are now 59% higher compared to 2019. In the $1M+ condo/townhome sector, average sales price is up 4.5% from 2019. The average price of luxury condos/ townhomes $1 million or more has decreased compared to the previous year due to the fact that condos sold this year were smaller with 2 beds instead of 3 beds.
2019 2020 2021 2022 2023 $2,000,000 $1,500,000 $1,000,000 $500,000 $0
JAN
AVG SALES PRICE 2019 2020 2021 2022 2023 $1,193,416 $1,232,135 $1,317,380 $1,995,313 $1,906,207 % 59 7%
KEY BISCAYNE
VS. JUNE PERIOD
2019 2020 2021 2022 2023 $3,000,000 $2,000,000 $1,000,000 $0 $1M+ CONDOS & TOWNHOMES 2019 2020 2021 2022 2023 $2,291,399 $2,050,370 $2,166,588 $2,555,178 $2,395,704 % 4.5% 2 2 2 2 2 AVG # BEDS SOLD 2023 VS 2019 PRICES 2023 VS 2019 PRICES 3 3 3 3 2 AVG # BEDS SOLD
CURRENT ACTIVE:104
$1M+ CONDOS/TOWNHOMES
MONTHS SUPPLY OF INVENTORY based on closed sales: 5 81 Jan-June 23
CURRENT ACTIVE: 84
MONTHS SUPPLY OF INVENTORY based on closed sales: 6 6
Condo/townhomes transactions are starting to normalize following the peak Covid numbers with total sold down by 33% and increases in average sales price per square foot. Pace of market for all condos has slowed from frenzied 2022. The average price of luxury condos/ townhomes are recalibrating post peak.
161 $1,995,313 $948 61 108 $1,906,207 $958 88 32.9% 1% 44.2% Jan-June 23 % Jan-June 22 AVG SALES PRICE AVG SPS/SF AVG DOM # CLOSED 4.4% 114 $2,555,178 $1,068 67 76 $2,395,704 $1,093 103 33 3% 2.3% 53.7% % AVG SALES PRICE AVG SPS/SF AVE DOM # CLOSED 6.2% ALL CONDOS/TOWNHOMES
KEY BISCAYNE
Jan-June 22
KEY BISCAYNE
The average selling prices of condos/townhomes are gradually returning to earth following the stratospheric rise in 2022. Although they have decreased compared to 2022, they have still managed to surpass previous limits.
Jan Feb March April May June $2,500,000 $2,000,000 $1,500,000 $1,000,000 $500,000 $0 2022 2023 AVG SALES PRICE BY MONTH JANUARY VS. JUNE Jan Feb March April May June $1,668,500 $1,603,000 $1,830,560 $2,132,260 $2,026,642 $1,907,800 $1,445,348 $1,526,045 $2,314,198 $1,732,462 $2,289,645 $2,324,333 2023 2022 % 16.8% 5% -20.8% 23% -11.4% -17 9%% 2023 MID YEAR AVG. 2022 MID YEAR AVG. $1,906,207 $1,995,313 Jan Feb March April May June $4,000,000 $3,000,000 $2,000,000 $1,000,000 $0 2022 2023 Jan Feb March April May June $2,089,750 $2,233,143 $2,286,188 $2,390,121 $3,101,432 $2,097,765 $2,253,636 $1,816,333 $2,744,301 $2,093,250 $2,934,048 $3,168,875 2023 2022 % -7.2% 22.9% -16 6% 14% 5.7% -33.8% 2023 MID YEAR AVG. 2022 MID YEAR AVG. $2,395,704 $2,555,178 ALL CONDOS/TOWNHOMES $1M+ CONDOS/TOWNHOMES
KEY BISCAYNE AVE. # OF SALES BY MONTH 2023 TOTAL # OF SALES 108 AVE # OF SALES BY MONTH 2022 TOTAL # OF SALES 161 Jan 12 March April May June Jan 20 March April May 24 9 Feb 23 19 25 20 23 Feb 39 26 29 June ALL CONDOS/TOWNHOMES Jan 7 March May June Jan 15 April May 16 6 Feb 16 16 14 17 11 Feb 31 20 21 June March April AVE. # OF SALES BY MONTH 2023 TOTAL # OF SALES 76 AVE # OF SALES BY MONTH 2022 TOTAL # OF SALES 114 $1M+ CONDOS/TOWNHOMES
GORCE ISLAND 2023 MIDYEAR MARKET REPORT
LA
CONTENT
Jan through June average sales price 2019-2023
Y-O-Y change for homes

Jan through June 2023 sales price by month
# of sales per month
Months Supply of inventory (MSI)
PAGE | 02 KEY BISCAYNE
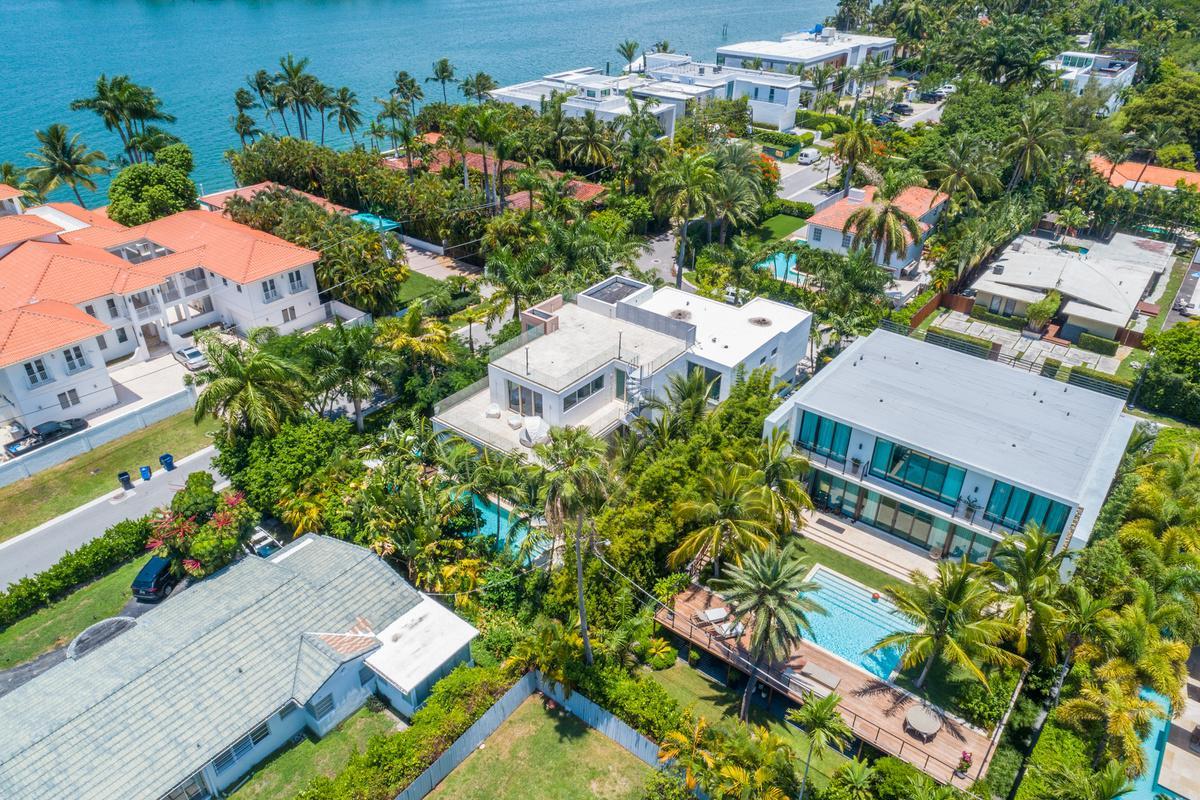
LA GORCE ISLAND
LA GORCE ISLAND
With 247% change since 2019, La Gorce has enjoyed one of the biggest price gains in Miami.
2019 2020 2021 2022 2023 $7,500,000 $5,000,000 $2,500,000 $0 LA GORCE ISLAND JAN VS JUNE PERIOD AVG SALES PRICE 2019 2020 2021 2022 2023 $2,050,000 $2,762,500 $4,209,000 $6,281,250 $7,125,000 % 2023 VS 2019 PRICES 247%
SINGLE-FAMILY HOMES 6 4 5 4 5 AVG # BEDS SOLD
SINGLE-FAMILY
CURRENT ACTIVE: 2
MONTHS SUPPLY OF INVENTORY based on closed sales: 6
Average sales price has surpassed the average obtained during the elevated levels of 2022. Average sales price and average sales price per square foot were up by 13.4% Days on the market has increased.
4 $6,281,250 $1,455 38 2 $7,125,000 $1,650 178 50% 13.4% 368.4% Jan-June 23 % Jan-June 22 AVG SALES PRICE AVG SPS/SF AVG DOM # CLOSED 13.4%
LA GORCE ISLAND
HOMES
The shortage of properties negatively impacts the number of sales, resulting in a low number of completed transactions.
2022 AVG SALES PRICE BY MONTH
JUNE
LA GORCE ISLAND
JANUARY VS.
Jan Feb March April May June 0 0 0 0 0 $7,125,000 $4,400,000 $4,850,000 $10,500,000 $5,375,000 2023 2022 % 2023
Jan Feb March April May June $12,500,000 $10,000,000 $7,500,000 $5,000,000 $2,500,000 $0 2022 2023 ALL SINGLE-FAMILY HOMES
MID YEAR AVG. 2022 MID YEAR AVG. $7,125,000 $6,281,250
AVE # OF SALES BY MONTH 2023 TOTAL # OF SALES 2 AVE # OF SALES BY MONTH 2022 TOTAL # OF SALES 4 Jan Feb March April June Jan March April May 0 0 1 Feb 0 1 June ALL SINGLE-FAMILY HOMES 1 May 0 0 2 0 0 1 LA GORCE ISLAND
MIAMI
BEACH 2023 MIDYEAR MARKET REPORT
CONTENT
Jan through June average sales price 2019-2023
Y-O-Y change for homes & condos/townhomes
Avg # of beds sold for homes & condos from 2019 - 2023
Jan through June sales price by month
# of sales per month
MSI
MIAMI BEACH
MIAMI BEACH

The average sales price has decreased by 2.7%, bringing it to new record levels of $5,379,743 except for the average sales prices seen during last year's housing boom
The average sales price per square foot for all homes slipped 5% to $1,277/SF and for $1M+ homes by 8% to $1,323/SF
Number of home and $1M+ home sales declined year over year
Excluding previous year boom, average sales prices are at historic levels They are up an astounding 67% from pre-Covid 2019.
PAGE | 02 MID YEAR HIGHLIGHTS
MIAMI BEACH
In the condominium and townhome sector, the average sales price per square foot increased to $692/SF.
The number of condominium/townhomes sales has declined compared to the previous year's frenzy
Pace of market picked up for condos/townhomes, with days on the market reduced by 22%
PAGE | 02 MID YEAR HIGHLIGHTS
Excluding previous year boom, average sales prices are at historic levels They are up an astounding 67% from pre-Covid 2019. In the $1M+ market, they are up from 23% from 2019. In the $1M+ home category, 4 bedrooms now trade 23% higher than 5 beds did in 2019.
2019 2020 2021 2022 2023 $6,000,000 $4,000,000 $2,000,000 $0 MIAMI BEACH
AVG SALES PRICE 2019 2020 2021 2022 2023 $3,215,969 $2,287,865 $4,216,160 $5,531,039 $5,379,743 % 67 2%
JAN VS. JUNE PERIOD
4 4 4 4 4 AVG # BEDS SOLD 2023 VS 2019 PRICES 2019 2020 2021 2022 2023 $7,500,000 $5,000,000 $2,500,000 $0 2019 2020 2021 2022 2023 $4,350,079 $3,124,622 $5,069,116 $6,074,732 $5,665,779 % 30.2% 5 4 5 4 4 AVG # BEDS SOLD 2023 VS 2019 PRICES
SINGLE-FAMILY HOMES
CURRENT ACTIVE:209
$1M+ SINGLE-FAMILY HOMES
MONTHS SUPPLY OF INVENTORY based on closed sales:10
Jan-June 23 Jan-June 22
CURRENT ACTIVE:203
MONTHS SUPPLY OF INVENTORY based on closed sales: 10 6
The average sales price for all single-family homes slipped 2.7% from previous year and 6.5% for the $1M+ sector. Average sales prices are also down but have attained unprecedented heights post pandemic frenzy. Days on the market rose.
214 $5,531,039 $1,345 79 122 $5,379,742 $1,277 111 42.9% 5% 45% Jan-June 23 % Jan-June 22 AVG SALES PRICE AVG SPS/SF AVG DOM # CLOSED 2.7% 192 6,047,732 $1,440 82 115 $5,655,779 $1,323 116 40 1% 8.1% 41.4% % AVG SALES PRICE AVG SPS/SF AVE DOM # CLOSED 6.5% ALL SINGLE-FAMILY HOMES
MIAMI BEACH
JANUARY VS. JUNE
The average selling price for single-family houses remains relatively steady, aligning closely with properties valued at $1 million or above. This means that prices for single-family homes are at unprecedented heights.
Jan Feb March April May June $8,000,000 $6,000,000 $4,000,000 $2,000,000 $0 2022 2023 AVG SALES PRICE BY MONTH
MIAMI BEACH
Jan Feb March April May June $5,349,928 $7,834,588 $3,817,542 $3,998,846 $6,076,274 $5,224,292 $5,082,296 $4,607,352 $4,953,407 $6,862,162 $5,937,933 $6,087,955 2023 2022 % 5% 70% -22.9% -42.8% 2.3% -14 1%
MID YEAR AVG. 2022 MID YEAR AVG. $5,379,742 $5,531,039 Jan Feb March April May June $8,000,000 $6,000,000 $4,000,000 $2,000,000 $0 2022 2023 Jan Feb March April May June $5,895,607 $7,834,588 $3,947,652 $3,998,846 $6,285,915 $5,861,810 $5,556,587 $5,041,354 $5,166,899 $7,662,450 $6,555,867 $6,671,617 2023 2022 % -6.1% 55% -23 5% -47 8% -4.1% -12.1% 2023 MID YEAR AVG. 2022 MID YEAR AVG. $5,655,779 $6,047,731
SINGLE-FAMILY HOMES
SINGLE-FAMILY HOMES
2023
ALL
$1M+
MIAMI BEACH AVE. # OF SALES BY MONTH 2023 TOTAL # OF SALES 122 AVE # OF SALES BY MONTH 2022 TOTAL # OF SALES 214 Jan 17 March April May June Jan 31 March April May 30 18 Feb 24 13 26 24 39 Feb 40 34 38 June ALL SINGLE-FAMILY HOMES Jan 17 March May June Jan 28 April May 27 16 Feb 23 13 25 21 35 Feb 38 30 34 June March April AVE. # OF SALES BY MONTH 2023 TOTAL # OF SALES 115 AVE # OF SALES BY MONTH 2022 TOTAL # OF SALES 192 $1M+ SINGLE-FAMILY HOMES
The real estate market for condos and townhomes in Miami Beach is beginning to readjust following the impact of the pandemic, yet it continues to exceed the levels seen before the pandemic.The average sales price is now $814,000 for a one bedroom. Conversely, two bedrooms in the $1M+ condo/townhome sector now trade at $2,563,847.
2019 2020 2021 2022 2023 $1,000,000 $750,000 $500,000 $250,000 $0 MIAMI BEACH JAN VS. JUNE PERIOD AVG SALES PRICE 2019 2020 2021 2022 2023 $633,454 $542,084 $978,297 $914,217 $814,009 % 2023 VS 2019 PRICES 28 5%
ALL CONDOS & TOWNHOMES 2019 2020 2021 2022 2023 $4,000,000 $3,000,000 $2,000,000 $1,000,000 $0 $1M+ CONDOS & TOWNHOMES 2019 2020 2021 2022 2023 $2,685,784 $2,011,229 $3,050,534 $3,032,210 $2,563,847 % 4.5% AVG # BEDS SOLD 1 2 2 1 1 AVG # BEDS SOLD 3 2 3 3 2 2023 VS 2019 PRICES
CURRENT ACTIVE:1,309
$1M+ CONDOS/TOWNHOMES
MONTHS SUPPLY OF INVENTORY based on closed sales: 6 59 Jan-June 23
CURRENT ACTIVE:395
MONTHS SUPPLY OF INVENTORY based on closed sales: 10 8
Condo/townhomes sales are gradually returning to normalcy after the peak of the Covid-19 frenzy, with the number sold now reduced by 50%. Pace of market for all condos has quicken, reducing the average days on market by nearly 23%. In the $1M+ category, the pace is slightly slower with a 6.7% increase in average days on market. The average sales price per square foot for all condos/townhomes sold in the first 6 months of 2023 is up 3.1% the previous period in 2022.
2,250 $914,217 $671 105 1,191 $814,006 $692 81 47% 3.1% 22.8% Jan-June 23 % Jan-June 22 AVG SALES PRICE AVG SPS/SF AVG DOM # CLOSED 10.9% 433 $3,032,210 $1,418 118 219 $2,563,847 $1,369 110 49 4% 3.4% 6.7% % AVG SALES PRICE AVG SPS/SF AVE DOM # CLOSED 15.4% ALL CONDOS/TOWNHOMES
MIAMI BEACH
Jan-June 22
MIAMI BEACH
JANUARY VS. JUNE
In the condominium/townhome market, the sales reached their highest point in March, with the average price being around $1.1 million. Additionally, the luxury condos priced at $1 million or more also peaked in March, with an average price of $3.3 million. For comparison purposes, it is worth noting that the average selling price for all properties in Miami-Dade county during the same period in 2023 was $409,000. This figure is 107% lower than the average price for condos in South Beach.
Jan Feb March April May June $1,250,000 $1,000,000 $750,000 $500,000 $250,000 $0 2022 2023
SALES PRICE
AVG
BY MONTH
Jan Feb March April May June $725,631 $770,489 $1,053,871 $819,528 $754,049 $686,337 $889,527 $886,876 $887,144 $885,581 $878,444 $1,082,974 2023 2022 % 18.4% -13.1% -18.7% -7.4% -14.1% -36 6% 2023 MID YEAR AVG. 2022 MID YEAR AVG. $814,009 $914,217 Jan Feb March April May June $4,000,000 $3,000,000 $2,000,000 $1,000,000 $0 2022 2023 Jan Feb March April May June $2,150,714 $2,340,121 $3,450,420 $2,839,716 $2,114,967 $2,025,106 $2,668,389 $2,814,478 $3,056,669 $3,184,743 $2,837,932 $3,626,915 2023 2022 % -19.4% -16.8% 12 8% --10 8% -25.4% -44.1% 2023 MID YEAR AVG. 2022 MID YEAR AVG. $2,563,847 $3,032,210 ALL CONDOS/TOWNHOMES
CONDOS/TOWNHOMES
$1M+
AVE. # OF SALES BY MONTH 2023 TOTAL # OF SALES 1191 AVE # OF SALES BY MONTH 2022 TOTAL # OF SALES 2250 Jan 163 March April May June Jan 354 March April May 312 163 Feb 250 189 240 186 271 Feb 496 436 381 June ALL CONDOS/TOWNHOMES Jan 29 March May June Jan 70 April May 66 28 Feb 50 31 48 33 60 Feb 88 76 73 June March April AVE. # OF SALES BY MONTH 2023 TOTAL # OF SALES 219 AVE # OF SALES BY MONTH 2022 TOTAL # OF SALES 433 $1M+ CONDOS/TOWNHOMES
MIAMI BEACH
PALM, HIBISCUS & STAR ISLANDS
2023 MIDYEAR MARKET REPORT

CONTENT
Jan through June average sales price 2019-2023
Y-O-Y change for homes

Jan through June 2023
sales price by month
# of sales per month
Months Supply of inventory (MSI)
STAR, PALM & HIBISCUS
PALM, HIBISCUS & STAR ISLANDS
The average sales prices is up 65% from 2022, and nearly 95% before pandemic.
A significant reduction in the average number of days it takes to sell a property of almost 70%
Average sales price per square foot increase of 53%
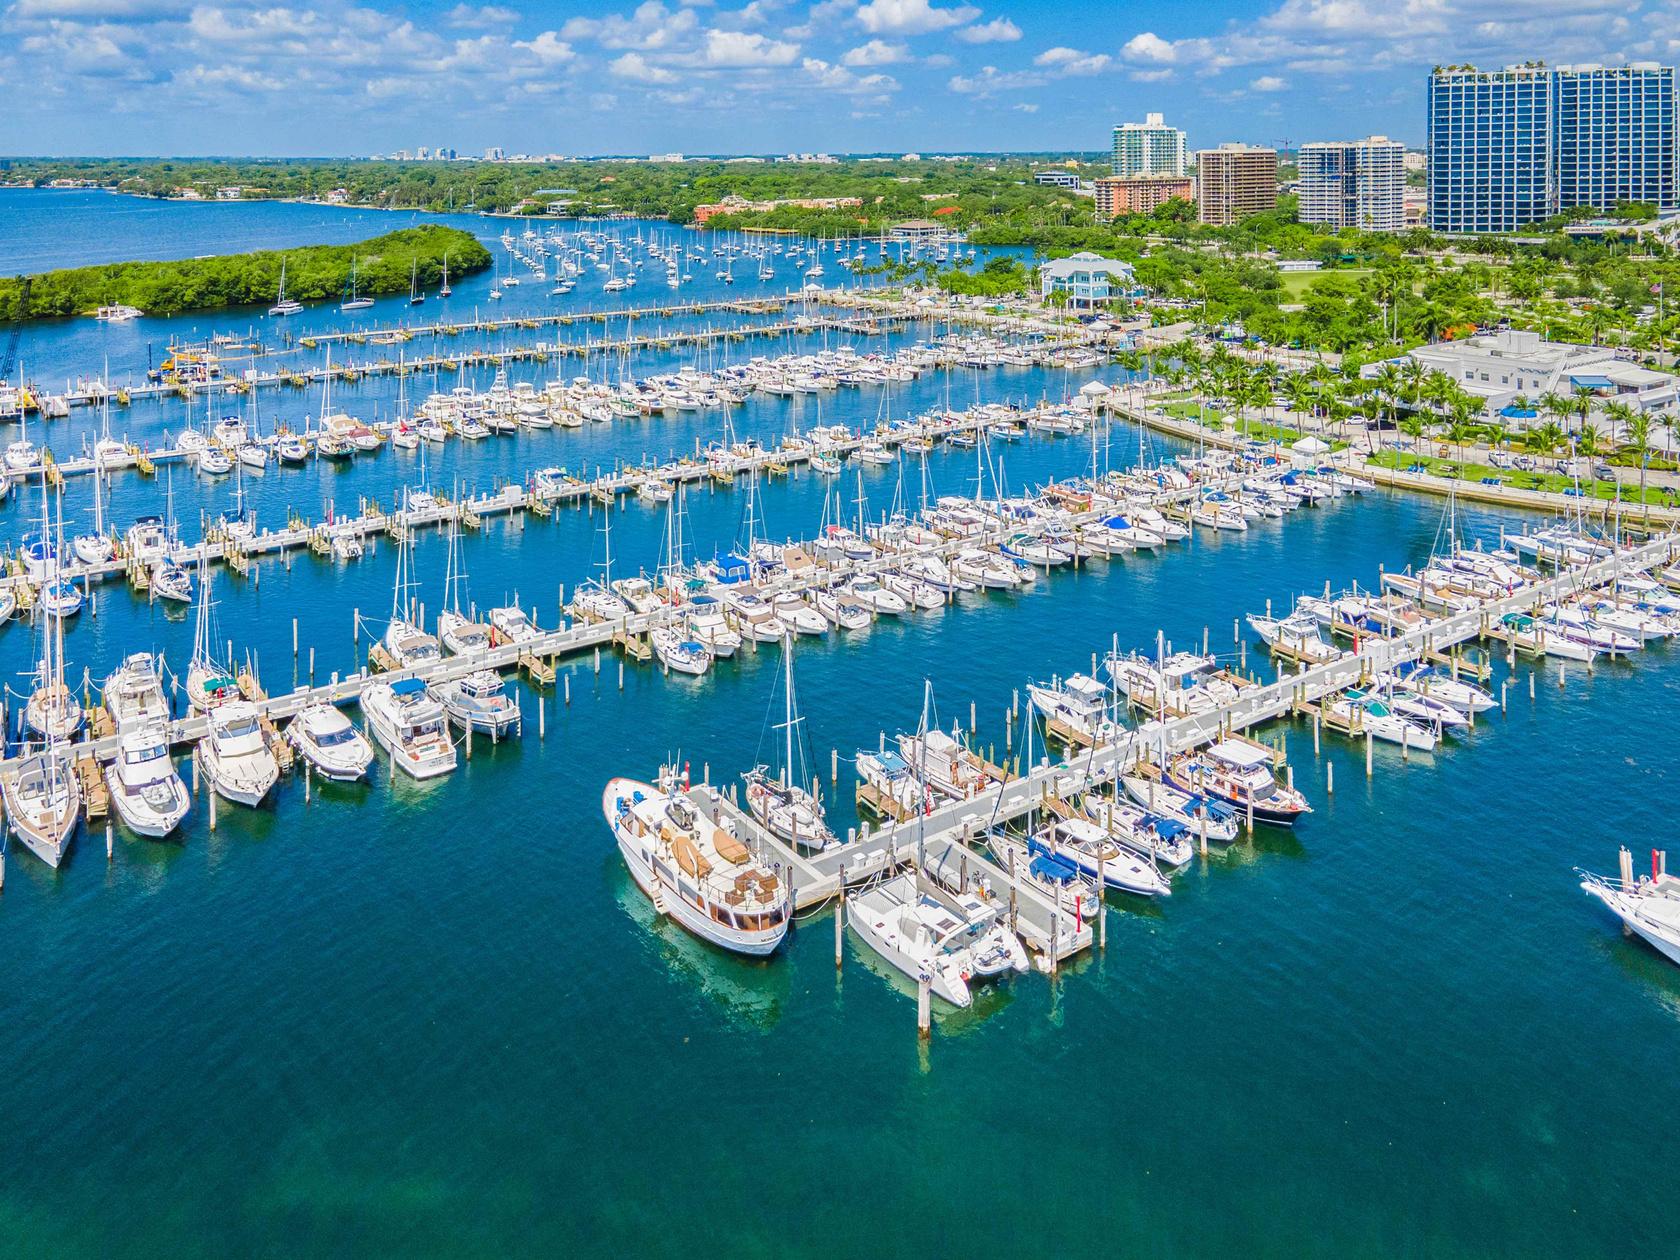
The Palm & Hibiscus Islands real estate market has seen a 37% decrease in sales due to increased price gains and limited inventory
PAGE | 02 MID YEAR HIGHLIGHTS
PALM, HIBISCUS & STAR ISLANDS
Star Island, with its limited number of only 34 estates, almost never has a property up for sale. Due to the lack of comparable properties, meaningful data is not available and therefore excluded

Miami experienced a notable transformation due to the pandemic. It shifted from being a popular vacation spot for affluent tourists to becoming a preferred choice for permanent living
Many of the buyer sought & still seek larger homes
PAGE | 02 MID YEAR HIGHLIGHTS
STAR ISLAND NOT ENOUGH COMPS TO PROVIDE A MEANINGFUL CHART
We have narrowed down the comparisons to Palm and Hibiscus Islands. Star Island, which has just 34 estates on the island, rarely if ever has a property available for sale. When there are no sales, it's not because the property didn't sell, but rather because there was no inventory in the first place. As a result, there is limited data for a comprehensive analysis. Star Island properties are large estates that can fetch upwards of a start price of $35,000,000.
$15,000,000 $10,000,000 $5,000,000
PALM &
AVG SALES PRICE 2019 2020 2021 2022 2023 $7,516,214 $5,296,063 $6,281,333 $8,834,333 $14,617,858
PALM & HIBISCUS + STAR ISLANDS JAN VS. JUNE PERIOD
HIBISCUS ISLANDS
5 5 AVG # BEDS SOLD
5 6 5
CURRENT ACTIVE:15
Jan-June 23
MONTHS SUPPLY OF INVENTORY based on closed sales:13
Jan-June 22
CURRENT ACTIVE:0
MONTHS SUPPLY OF INVENTORY based on closed sales:0
The trio of Palm, Hibiscus, and Star Islands, which are linked to the MacArthur Causeway by bridges, have consistently shown outstanding performance. Amidst the Covid pandemic, their value skyrocketed. The average sales price of Palm and Hibiscus Islands surged by almost 65% compared to the same period in 2022. Pace of the market accelerated, with days on market cut by nearly 69%.
11 $8,834,091 $1,940 319 7 $14,617,857 $2,970 100 36.3% 53% 68.6% Jan-June 23 % Jan-June 22 AVG SALES PRICE AVG SPS/SF AVG DOM # CLOSED 65.4% 1 $30,000,000 $5,462 230 0 0 0 0 % AVG SALES PRICE AVG SPS/SF AVE DOM # CLOSED PALM & HIBISCUS ISLANDS STAR ISLAND
PALM & HIBISCUS + STAR ISLANDS
Price trend indicators for Palm & Hibiscus Islands reveal that there has been a significant 65% year-on-year increase. It is important to note that months with no sales should not be considered for comparative analysis.
Jan Feb March April May June $20,000,000 $15,000,000 $10,000,000 $5,000,000 $0 2022 2023 AVG SALES PRICE BY MONTH FOR ALL SINGLE-FAMILY HOMES JANUARY VS. JUNE
Jan Feb March April May June 0 SALES $15,716,667 $7,500,000 0 SALES $17,200,000 $15,237,500 $3,812,500 $15,500,000 $5,600,000 $10,075,000 $10,800,000 0 SALES 2023 2022 % 1.4% 33.9% 59 2% 2023 MID YEAR AVG. 2022 MID YEAR AVG. $14,617,857 $8,834,091
PALM & HIBISCUS + STAR ISLANDS
AVE. # OF SALES BY MONTH 2023 TOTAL # OF SALES 7 AVE # OF SALES BY MONTH 2022 TOTAL # OF SALES 11 Jan 12 March April May June Jan 2 March April May 0 20 Feb 30 18 32 17 2 Feb 3 2 2 June 0 3 0 1 2 1
& HIBISCUS
PALM
+ STAR ISLANDS
SOUTH BEACH 2023 MIDYEAR MARKET REPORT

CONTENT
Jan through June average sales price 2019-2023

Y-O-Y change for homes & condos/townhomes
Jan through June 2023 sales price by month
# of sales per month
Months Supply of inventory (MSI)
SOUTH BEACH
SOUTH BEACH
The average sales price for all homes has reached parity with the average sales price for homes priced at $1 million and above
This suggests the pandemic caused a significant shift in Miami, leading to an increase in wealthy buyers from within the country, which in turn has pushed prices for single-family homes to unprecedented heights.

The single-family home average sales price has decreased 2% compared to last year but it is at record level of $8.9M or 69% from 2019
Average sales price square foot for all homes has slipped by 1.6% as did days on market
PAGE | 02 MID YEAR HIGHLIGHTS
SOUTH BEACH

Condos/townhomes transactions are starting to normalize following the peak Covid frenzy with number of condos sold cut in half
Average sales price for all condos/townhomes are down
The average sales price per square foot for all condos/townhomes sold in the first 6 months of 2023 remains unchanged
The process of selling condos/townhomes has become faster, as the number of days it takes to sell one has decreased by 20%
PAGE | 02 MID YEAR HIGHLIGHTS
SINGLE-FAMILY HOMES
The average sales price for all single-family homes slipped 2% from previous year but we can see that the appreciation has been steady and robust. They are up an astounding 69% from pre-Covid
2019 2020 2021 2022 2023 $10,000,000 $7,500,000 $5,000,000 $2,500,000 $0
JAN VS JUNE PERIOD AVG SALES PRICE 2019 2020 2021 2022 2023 $5,273,630 $3,242,067 $6,864,683 $9,105,720 $8,907,143 % 2023 VS 2019 PRICES 68.9%
SOUTH BEACH
2019.
2019 2020 2021 2022 2023 $10,000,000 $7,500,000 $5,000,000 $2,500,000 $0 2019 2020 2021 2022 2023 $5,697,786 $3,252,068 $7,240,207 $9,644,515 $8,907,143 % 68.9% $1M+ SINGLE-FAMILY HOMES 4 4 5 5 5 4 4 5 5 5 AVG # BEDS SOLD 2023 VS 2019 PRICES AVG # BEDS SOLD
CURRENT ACTIVE:46
$1M+ SINGLE-FAMILY HOMES
Jan-June 23
MONTHS SUPPLY OF INVENTORY based on closed sales: 13
Jan-June 22
CURRENT ACTIVE:105
MONTHS SUPPLY OF INVENTORY based on closed sales: 10
In the South Beach single-family market, the average sales price for all homes sold is the same as the average sales price for homes sold in the $1M and above category. This is a unique occurrence where the single-family market is showing uniformity across the board and at considerable $8.9M price point. Days on market has decreased for the home segment. For the $1M sector, it is has increased from previous year record velocity of 13 days to a very quick 46 days.
34 $9,105,720 $1,958 179 21 $8,907,143 $1,926 98 38% 1.6% 45% Jan-June 23 % Jan-June 22 AVG SALES PRICE AVG SPS/SF AVG DOM # CLOSED 2.1% 34 $9,644,515 $2,079 13 21 $8,907,143 $1,926 46 38 2% 7.3% 48% % AVG SALES PRICE AVG SPS/SF AVE DOM # CLOSED 7.6% ALL SINGLE-FAMILY HOMES
SOUTH BEACH
In this intriguing phenomenon, we observe that the average selling price for single-family homes is consistent with homes priced at $1 million or more. This suggests the pandemic caused a significant shift in Miami, leading to an increase in wealthy buyers from within the country, which in turn has pushed prices for single-family homes to unprecedented heights.
Jan Feb March April May June $20,000,000 $15,000,000 $10,000,000 $5,000,000 $0 2022 2023 AVG SALES PRICE BY MONTH
SOUTH BEACH
JANUARY VS. JUNE
Jan Feb March April May June $8,250,000 $15,716,667 $3,981,250 $3,350,000 $11,750,000 $8,145,833 $7,077,500 $10,750,000 $8,987,500 $14,800,000 $8,318,495 $6,960,000 2023 2022 % 16.5% 46% -55.7% -77.3% 41.2% 17% 2023 MID YEAR AVG. 2022 MID YEAR AVG. $8,907,143 $9,105,726 Jan Feb March April May June $20,000,000 $15,000,000 $10,000,000 $5,000,000 $0 2022 2023 Jan Feb March April May June $8,250,000 $15,716,667 $3,981,250 $3,350,000 $11,750,000 $8,145,833 $8,350,000 $10,750,000 $8,987,500 $14,800,000 $9,662,411 $6,960,000 2023 2022 % -1.1% 46% -55 7% -77 3% 21.6% 17% 2023 MID YEAR AVG. 2022 MID YEAR AVG. $8,907,143 $9,644,515 ALL SINGLE-FAMILY HOMES
SINGLE-FAMILY HOMES
$1M+
SOUTH BEACH AVE. # OF SALES BY MONTH 2023 TOTAL # OF SALES 21 AVE # OF SALES BY MONTH 2022 TOTAL # OF SALES 34 Jan 3 March April May June Jan 4 March April May 5 3 Feb 4 1 4 6 6 Feb 8 4 7 June
Jan 3 March May June Jan 4 April May 5 3 Feb 4 1 4 6 5 Feb 8 4 6 June March April
# OF SALES BY MONTH 2023
# OF SALES 21
# OF SALES BY MONTH 2022
# OF SALES 32
ALL SINGLE-FAMILY HOMES
AVE.
TOTAL
AVE
TOTAL
$1M+ SINGLE-FAMILY HOMES
The condo and townhome market in South Beach is starting to recalibrate after the pandemic, but it is still outperforming the prepandemic levels. The average sales price is now 24% higher compared to 2019, although there has been a 12% decrease from the same time last year. In the $1M+ condo/townhome sector, average sales price is down by 16%.
2019 2020 2021 2022 2023 $1,250,000 $1,000,000 $750,000 $500,000 $250,000 $0 SOUTH BEACH JAN VS. JUNE PERIOD AVG SALES PRICE 2019 2020 2021 2022 2023 $668,030 $607,224 $1,192,173 $944,947 $829,375 % 24 1%
ALL CONDOS
2019 2020 2021 2022 2023 $4,000,000 $3,000,000 $2,000,000 $1,000,000 $0 $1M+ CONDOS & TOWNHOMES 2019 2020 2021 2022 2023 $2,835,646 $2,888,394 $3,398,475 $3,052,189 $2,561,895 % 7.6% 2 1 2 1 1 AVG # BEDS SOLD 2023 VS 2019 PRICES 2023
2019 PRICES 2 2 3 2 2 AVG # BEDS SOLD
& TOWNHOMES
VS
SOUTH BEACH
CURRENT ACTIVE:650
MONTHS SUPPLY OF INVENTORY based on closed sales: 6 Jan-June 23
Jan-June 22
CURRENT ACTIVE:221
MONTHS SUPPLY OF INVENTORY based on closed sales: 10 2
In the South Beach single-family market, the average sales price for all homes sold is the same as the average sales price for homes sold in the $1M and above category. This is a unique occurrence where the single-family market is showing uniformity across the board and at considerable $8.9M price point. Days on market has decreased for the home segment. For the $1M sector, it is has increased from previous year record velocity of 13 days to a very quick 46 days.
1,215 $944,947 $737 101 644 $829,375 $735 80 -46.9% 0.02% 20.7% Jan-June 23 % Jan-June 22 AVG SALES PRICE AVG SPS/SF AVG DOM # CLOSED 12.2% 254 $3,052,189 $1,526 103 129 $2,561,895 $1,475 113 49 2% 3.3% 9.7% % AVG SALES PRICE AVG SPS/SF AVE DOM # CLOSED 16% ALL CONDOS
CONDOS/TOWNHOMES
$1M+
SOUTH BEACH
JANUARY VS. JUNE
IIn the South Beach condo/townhome market, the sales reached their highest point in March, with the average price being around $1.1 million. Additionally, the luxury condos/townhomes priced at $1 million or more also peaked in March, with an average price of $3.3 million. For comparison purposes, it is worth noting that the average selling price for all condos/townhomes in Miami-Dade county during the same period in 2023 was $409,000 or 107% lower than the average price for those in South Beach.
Jan Feb March April May June $1,250,000 $1,000,000 $750,000 $500,000 $250,000 $0 2022 2023 AVG SALES PRICE BY MONTH
Jan Feb March April May June $714,735 $819,704 $1,114,259 $853,020 $758,781 $647,739 $1,018,169 $920,602 $973,911 $944,879 $906,285 $896,042 2023 2022 % -29.8% -10.9% 14.4% -9.7% -17.3% -27 7%% 2023 MID YEAR AVG. 2022 MID YEAR AVG. $829,375 $944,947 Jan Feb March April May June $4,000,000 $3,000,000 $2,000,000 $1,000,000 $0 2022 2023 Jan Feb March April May June $1,987,778 $3,190,292 $3,367,600 $3,162,368 $2,025,497 $1,741,257 $2,729,521 $2,927,855 $3,313,276 $3,760,444 $2,802,678 $2,757,917 2023 2022 % -27% 8.9% 1 6% -15 9% -27.7% -36.8% 2023 MID YEAR AVG. 2022 MID YEAR AVG. $2,561,895 $3,052,189
CONDOS/TOWNHOMES
CONDOS/TOWNHOMES
ALL
$1M+
SOUTH BEACH AVE. # OF SALES BY MONTH 2023 TOTAL # OF SALES 644 AVE # OF SALES BY MONTH 2022 TOTAL # OF SALES 1,215 Jan 81 March April May June Jan 199 March April May 173 94 Feb 126 113 132 98 148 Feb 267 219 209 June ALL CONDOS/TOWNHOMES Jan 12 March May June Jan 40 April May 37 18 Feb 30 19 29 21 41 Feb 54 36 46 June March April AVE. # OF SALES BY MONTH 2023 TOTAL # OF SALES 129 AVE # OF SALES BY MONTH 2022 TOTAL # OF SALES 254 $1M+ CONDOS/TOWNHOMES
SOUTH OF FIFTH 2023 MIDYEAR MARKET REPORT
CONTENT
Jan through June average sales price 2019-2023
Y-O-Y change for condos/townhomes
Jan through June 2023 sales price by month
# of sales per month
Months Supply of Inventory (MSI)
SOUTH OF FIFTH
SOUTH OF FIFTH
Real estate in the South of Fifth area is slowly returning to normalcy after the pandemic
The average sales prices for all condos is down by 14.9% from 2022, but up 23% pre-pandemic
Average sales per square foot for all condos slipped by 5.2%
Pace of market for all condos edged last year's pace by 3.8%
PAGE | 02 MID YEAR HIGHLIGHTS
SOUTH OF FIFTH
SoFi's $1M+ condo/townhome market has always pushed higher prices than most areas in Miami even before the pandemic

It went into overdrive in 2022 and now its pivoting back to more normalized levels
The number of sales has decreased by 47%
Price trends remained mixed. The average sales price for the overall condo/townhome market is up 23% from 2019 but the $1M+ condo/townhome bracket is down 17%
PAGE | 02 MID YEAR HIGHLIGHTS
JAN VS. JUNE PERIOD AVG SALES PRICE
Price trends remained mixed. The average sales price for the overall condo/townhome market is up 23% from 2019 but the $1M+ condo/townhome bracket is down nearly 18%.
SOUTH OF FIFTH
2019 2020 2021 2022 2023 $3,000,000 $2,000,000 $1,000,000 $0 2019 2020 2021 2022 2023 $1,550,450 $1,226,652 $2,593,713 $2,256,393 $1,918,668 % 23 7% ALL CONDOS & TOWNHOMES 2019 2020 2021 2022 2023 $4,000,000 $3,000,000 $2,000,000 $1,000,000 $0 $1M+ CONDOS & TOWNHOMES 2019 2020 2021 2022 2023 $3,247,810 $2,412,203 $3,933,696 $3,847,080 $3,190,704 % 17.5% 2 2 2 2 2 AVG # BEDS SOLD 2023 VS 2019 PRICES 2023 VS 2019 PRICES 2 3 3 3 2 AVG # BEDS SOLD
CURRENT ACTIVE:155
$1M+ CONDOS & TOWNHOMES
MONTHS SUPPLY OF INVENTORY based on closed sales: 7 2
Jan-June 23 Jan-June 22
CURRENT ACTIVE:101
MONTHS SUPPLY OF INVENTORY based on closed sales: 8 9
The SoFi market is gradually calibrating after the pandemic-era sales surge with the $1M+ tier being down from pre-pandemic numbers. The average sales prices are down at all levels. But, the average sales price for all condos in SoFi is also over 78.7% higher than Miami-Dade's average sales price of $409,000 for condos/townhomes traded during JanJune 2023. Average sales per square foot for all condos slipped. In the $1M+ sector, condos prices are trading on average 17% less Y-O-Y. Pace of market for $1M+ condos edged last year's pace.
SOUTH OF FIFTH 245 $2,256,393 $1,246 105 129 $1,920,363 $1,181 101 47% 5.2% 3.8% Jan-June 23 % Jan-June 22 AVG SALES PRICE AVG SPS/SF AVG DOM # CLOSED 14.9% 128 $3,847,080 $1,719 121 68 $3,190,704 $1,602 120 46 8% 6.8% 0.08% % AVG SALES PRICE AVG SPS/SF AVE DOM # CLOSED 17% ALL CONDOS & TOWNHOMES
Price trend indicators for all condos/townhomes in SoFi is down year-ago levels with February, March and April trending higher than previous year. The average bedroom count sold in June 2023 was 1 bed while in June 2022 was 2 beds. Sales size fell pulling condo average sales prices and sales prices per square foot lower, thus creating such a large price disparity between these two Junes. As for the $1M+ condos/townhomes, SoFi has always pushed higher prices than many or most areas in Miami. SoFi is transitioning from a period of significant growth to a more normal level of activity.
SOUTH OF FIFTH Jan Feb March April May June $3,000,000 $2,000,000 $1,000,000 $0 2022 2023 AVG SALES PRICE BY MONTH
JUNE
JANUARY VS.
Jan Feb March April May June $1,639,580 $2,611,125 $2,644,133 $2,490,100 $1,291,123 $1,066,735 $2,116,199 $2,076,260 $2,558,745 $2,218,794 $2,205,582 $2,285,758 2023 2022 % -22.5% 25.7% 3 3% 12 4% -41.4% -53.3% 2023 MID YEAR AVG. 2022 MID YEAR AVG. $1,920,363 $2,256,393 Jan Feb March April May June $6,000,000 $4,000,000 $2,000,000 $0 2022 2023 Jan Feb March April May June $2,101,071 $3,688,438 $4,439,438 $4,471,111 $2,253,627 $2,161,667 $3,173,765 $3,685,326 $4,247,750 $5,193,750 $3,647,778 $3,596,526 2023 2022 % -33.7% 0.008% 4.5% -38 2% -38 2% -39.8% 2023 MID YEAR AVG. 2022 MID YEAR AVG. $3,190,704 $3,847,080 ALL CONDOS/TOWNHOMES $1M+ CONDOS/TOWNHOMES
of sales has decreased by 47% for all condos/townhomes for the first the year and 50% for $1M+ condos which can be attributed to ces of luxury and ultra luxury condos during extreme conditions of c housing boom in 2021 and 2022 and limited inventory in some price g other factors.
OF
SOUTH
FIFTH
AVE # OF SALES BY MONTH 2023 TOTAL # OF SALES 129 AVE # OF SALES BY MONTH 2022 TOTAL # OF SALES 245 Jan 12 March April May June April May 33 20 Feb 30 17 33 17 30 52 33 49 June ALL CONDOS/TOWNHOMES Jan 8 Feb May June Jan April May 19 14 Feb 16 16 15 6 18 29 12 27 June April AVE # OF SALES BY MONTH 2023 TOTAL # OF SALES 68 AVE # OF SALES BY MONTH 2022 TOTAL # OF SALES 128 $1M+ CONDOS/TOWNHOMES Jan Feb March 48 May 9 March 23
SUNNY ISLES BEACH
2023 MIDYEAR MARKET REPORT
CONTENT
Jan through June average sales price 2019-2023
Y-O-Y change for homes & condos/townhomes
Jan through June sales price by month
# of sales per month
Months Supply of inventory (MSI)
PAGE | 02 SUNNY ISLES BEACH
SUNNY ISLES BEACH
Condo transactions are starting to normalize following the previous elevated levels with number of condos sold cut in half
Average sales price for all condos/townhomes increased 86% since 2019
The average sales price experienced an increase during the initial half of 2023
The average sales price per square foot was also up
PAGE | 02 MID YEAR HIGHLIGHTS
SUNNY ISLES BEACH

The average sales price per square foot was also up
The average sales price per square foot for all condos/townhomes sold in the first 6 months of 2023 remains unchanged
The process of selling condos/townhomes has become faster, as the number of days it takes to sell one has decreased by 20%
PAGE | 02 MID YEAR HIGHLIGHTS
The
and townhome sector is recalibrating and yet is up from prepandemic year. The average sales price is now 86% higher compared to same period 2019. In the $1M+ condo/townhome sector, average sales price is 17% than the first six months of 2019.
2019 2020 2021 2022 2023 $1,500,000 $1,000,000 $500,000 $0 SUNNY ISLES BEACH
VS. JUNE PERIOD AVG SALES PRICE 2019 2020 2021 2022 2023 $790,980 $625,276 $952,785 $1,299,506 $1,469,465 % 85 7%
JAN
condo
2019 2020 2021 2022 2023 $3,000,000 $2,000,000 $1,000,000 $0 $1M+ CONDOS & TOWNHOMES 2019 2020 2021 2022 2023 $2,383,706 $1,756,552 $2,245,027 $2,653,662 $2,788,987 % 17% 2 2 2 2 2 AVG # BEDS SOLD 2023 VS 2019 PRICES 2023 VS 2019 PRICES 3 3 3 3 3 AVG # BEDS SOLD
ALL CONDOS & TOWNHOMES
CURRENT ACTIVE:743
$1M+ CONDOS/TOWNHOMES
Jan-June 23
MONTHS SUPPLY OF INVENTORY based on closed sales:10 7
Jan-June 22
CURRENT ACTIVE: 384
MONTHS SUPPLY OF INVENTORY based on closed sales: 12 66
Average sales prices increased for both the overall condo/townhome and $1M+ tier, with 13% and 5% price gains respectively. In the first half of 2023, the average selling price per square foot for all condominiums rose by 13% compared to the corresponding period in 2022. For the $1M+ sector, it was up 7.3% and its days on the market shortened.
846 $1,299,506 $661 100 417 $1,465,465 $708 106 50.7% 7.1% 6% Jan-June 23 % Jan-June 22 AVG SALES PRICE AVG SPS/SF AVG DOM # CLOSED 12.7% 324 $2,653,662 $1,042 130 182 $2,788,987 $1,056 126 43.8% 7.3% 3.1% % AVG SALES PRICE AVG SPS/SF AVE DOM # CLOSED 5% ALL CONDOS/TOWNHOMES
SUNNY ISLES BEACH
SUNNY ISLES BEACH
In the Sunny Isles Beach condo/townhome market, the sales reached their highest point in March. The price boundaries of Sunny Isles Beach continue to rise.
Jan Feb March April May June $2,000,000 $1,500,000 $1,000,000 $500,000 $0 2022 2023 AVG SALES PRICE BY MONTH
JUNE
JANUARY VS.
Jan Feb March April May June $1,370,559 $1,479,936 $1,776,946 $1,261,697 $1,453,723 $1,363,561 $961,557 $1,314,981 $1,383,591 $1,293,345 $1,281,591 $1,410,165 2023 2022 % 42.5% 12.5% 28.4% -2.4% 13.4% 3 3% 2023 MID YEAR AVG. 2022 MID YEAR AVG. $1,465,465 $1,299,506 Jan Feb March April May June $4,000,000 $3,000,000 $2,000,000 $1,000,000 $0 2022 2023 Jan Feb March April May June $2,351,109 $2,829,133 $3,458,017 $2,376,450 $2,889,235 $2,573,460 $2,057,000 $2,868,260 $2,683,777 $2,658,876 $2,612,811 $2,735,204 2023 2022 % 14.2% 1.3% 22 3% -10 6% 10.5% -5.9% 2023 MID YEAR AVG. 2022 MID YEAR AVG. $2,788,989 $2,653,662 ALL CONDOS/TOWNHOMES $1M+ CONDOS/TOWNHOMES
AVE. # OF SALES BY MONTH 2023 TOTAL # OF SALES 417 AVE # OF SALES BY MONTH 2022 TOTAL # OF SALES 846 Jan 68 March April May June Jan 112 March April May 128 48 Feb 82 71 82 66 97 Feb 201 170 138 June ALL CONDOS/TOWNHOMES Jan 30 March May June Jan 40 April May 54 23 Feb 36 30 34 29 31 Feb 83 63 53 June March April AVE. # OF SALES BY MONTH 2023 TOTAL # OF SALES 182 AVE # OF SALES BY MONTH 2022 TOTAL # OF SALES 324 $1M+ CONDOS/TOWNHOMES
SUNNY ISLES BEACH
SUNSET
ISLANDS
2023 MIDYEAR MARKET REPORT
CONTENT
Jan through June average sales price 2019-2023
Y-O-Y change for homes
Jan through June 2023 sales price by month
# of sales per month
Months Supply of inventory (MSI)
SUNSET ISLANDS
SUNSET ISLANDS
Sunset Islands has one of the highest price barriers
The average sales price of a single-family home is approximately $13.89 million
This means that the thresholds have been pushed even higher as buyers relocate to Miami
It's market has surged 115% since 2019
PAGE | 02 MID YEAR HIGHLIGHTS
SUNSET ISLANDS
The average sales price per square foot for homes has surged to $3,620/SF

The ongoing shortage of inventory continues to drive up prices per square foot and support a decrease in the number of sales
PAGE | 02 MID YEAR HIGHLIGHTS
Sunset Islands has one of the highest price barriers with average sales price of $13.89M. It's market has surged 115% since 2019.
2019 2020 2021 2022 2023 $20,000,000 $15,000,000 $10,000,000 $5,000,000 $0
JAN VS JUNE PERIOD AVG SALES PRICE 2019 2020 2021 2022 2023 $6,461,750 $7,684,028 $9,712,396 $15,021,500 $13,899,607 % 2023 VS 2019 PRICES 115%
SUNSET ISLANDS
SINGLE-FAMILY HOMES 5 5 5 4 5 AVG # BEDS SOLD
SINGLE-FAMILY
CURRENT ACTIVE: 5
MONTHS SUPPLY OF INVENTORY based on closed sales:10
The average sales price per square foot for homes has surged to $3,620/SF. Days on the market has increased. Large price gains have taken averages to new heights. Inventory shortage keeps driving prices per square foot and affecting number of sales.
SUNSET ISLANDS 10 $15,021,500 $2,590 50 3 $13,899,667 $3,620 170 7% 39.7% 240% Jan-June 23 % Jan-June 22 AVG SALES PRICE AVG SPS/SF AVG DOM # CLOSED 7.5%
HOMES
Scarcity of inventory puts a negative pressure on number of sales, leaving some months with 0 transactions.
SUNSET ISLANDS 2022 AVG SALES PRICE
MONTH
JUNE
BY
JANUARY VS.
Jan Feb March April May June $5,700,000 0 $10,999,000 0 0 $25,000,000 $13,915,000 $14,100,000 $15,950,000 $13,250,000 2023 2022 % 59% 2023 MID YEAR AVG. 2022 MID YEAR AVG. $13,889,668 $15,021,500 Jan Feb March April May June $25,000,000 $20,000,000 $15,000,000 $10,000,000 $5,000,000 $0 2022 2023 ALL SINGLE-FAMILY HOMES
SUNSET ISLANDS AVE # OF SALES BY MONTH 2023 TOTAL # OF SALES 3 AVE # OF SALES BY MONTH 2022 TOTAL # OF SALES 10 Jan Feb March April June Jan March April May 0 1 1 Feb 6 2 June ALL SINGLE-FAMILY HOMES 0 May 0 1 0 1 1 0
VENETIAN ISLANDS
2023 MIDYEAR MARKET REPORT
CONTENT
Jan through June average sales price 2019-2023
Y-O-Y change for homes & condos/townhomes

Jan through June 2023 sales price by month
# of sales per month
Months Supply of inventory (MSI)
VENETIAN ISLANDS
VENETIAN ISLANDS
It is worth noting that the statistics for both the general single-family home market and homes priced at $1 million or more are the same, so we only need to focus on one set of data.
Entry level into Venetian Homes is more than $2.6M The average sales price for single-family homes in this area is $7.3 million, up 94.4%
PAGE | 02 MID YEAR HIGHLIGHTS
VENETIAN ISLANDS
Average sales price per square foot for single-family home declined
Speed of market for homes has accelerated with days on the market down by 34%.
The overall market for condos and townhomes in Venetian Islands has seen a significant rise in average sales prices since 2019

Average price for condos/townhomes have increased 60% pre-pandemic
After reaching its peak in 2022, prices have now stabilized, particularly for luxury properties priced over $1 million
PAGE | 02 MID YEAR HIGHLIGHTS
VENETIAN ISLANDS
JAN VS JUNE PERIOD AVG SALES PRICE
SINGLE-FAMILY HOMES
The Venetian Islands have a high entry barrier, as there are no homes for under $2M. The average sales price for single-family homes in this area is $7.3 million, up 94.4%. It is worth noting that the statistics for both the general single-family home market and homes priced at $1 million or more are the same, so we only need to focus on one set of data.
2019 2020 2021 2022 2023 $6,000,000 $4,000,000 $2,000,000 $0
2019 2020 2021 2022 2023 $3,757,500 $4,091,750 $8,177,878 $13,324,956 $7,307,500 % 2023 VS 2019 PRICES 94.4%
5 5 5 4 5
AVG # BEDS SOLD
CURRENT ACTIVE:24
MONTHS SUPPLY OF INVENTORY based on closed sales: 14 4
The average sales price for all homes sold is down from stratospheric numbers of 2022 settling into an incredible $7,307,500. Average sales price per square foot declined. Speed of market has increased with days on the market down by 34%.
VENETIAN
12 $13,324,956 $2,457 126 10 $7,307,500 $1,477 83 16.6% 39.9% 34% Jan-June 23 % Jan-June 22 AVG SALES PRICE AVG SPS/SF AVG DOM # CLOSED 45% ALL SINGLE-FAMILY HOMES
ISLANDS
VENETIAN ISLANDS
JANUARY VS. JUNE
Venetian Island's entry threshold keeps moving higher. The entry threshold is $2.8M as inventory for new build and top-notch homes is tight.
Jan Feb March April May June $20,000,000 $15,000,000 $10,000,000 $5,000,000 $0 2022 2023
SALES PRICE
AVG
BY MONTH
Jan Feb March April May June $9,975,000 0 $2,808,333 $3,350,000 $13,100,000 $7,575,000 $2,375,000 $9,750,000 $13,162,000 $19,525,000 $13,712,234 $14,325,000 2023 2022 % 320% -78.6% -82.8% -4.4%% -47% 2023
MID YEAR AVG. 2022 MID YEAR AVG. $7,307,500 $13,324,956
2022 2023
ALL
SINGLE-FAMILY HOMES
ALL SINGLE-FAMILY HOMES
VENETIAN ISLANDS AVE. # OF SALES BY MONTH 2023 TOTAL # OF SALES 10 AVE # OF SALES BY MONTH 2022 TOTAL # OF SALES 12 Jan 0 March April May June Jan 4 March April May 2 2 Feb 3 1 2 1 Feb 2 2 June
2 1
ALL CONDOS & TOWNHOMES
The general condo and townhome market in Venetian Islands has experienced a robust price increase in average sales price since 2019 calibrating post elevated 2022 heights to a 60% surge. The market for luxury condos and townhomes priced over $1 million has reached a point of stability.
2019 2020 2021 2022 2023 $1,250,000 $1,000,000 $750,000 $500,000 $250,000 $0 VENETIAN ISLANDS JAN VS. JUNE PERIOD AVG SALES PRICE 2019 2020 2021 2022 2023 $704,876 $753,227 $844,897 $970,500 $1,129,592 % 60 2%
2019 2020 2021 2022 2023 $3,000,000 $2,000,000 $1,000,000 $0 $1M+ CONDOS & TOWNHOMES 2019 2020 2021 2022 2023 $1,714,786 $1,322,500 $1,280,722 $1,634,200 $1,538,048 % 10.3% 2 2 2 2 2 AVG # BEDS SOLD 2023 VS 2019 PRICES 2023 VS 2019 PRICES 2 2 2 2 2 AVG # BEDS SOLD
CURRENT ACTIVE: 32
$1M+ CONDOS/TOWNHOMES
Jan-June 23
MONTHS SUPPLY OF INVENTORY based on closed sales: 4 68
Jan-June 22
CURRENT ACTIVE: 18
MONTHS SUPPLY OF INVENTORY based on closed sales: 5 1
The condo and townhome market has experienced strong price growth overall. Even in the luxury segment with properties priced at $1 million or more, the price per square foot has increased despite the average prices stabilizing.
VENETIAN
60 $970,500 $687 65 41 $1,129,592 $826 69 31.6% 20.2% 6.1% Jan-June 23 % Jan-June 22 AVG SALES PRICE AVG SPS/SF AVG DOM # CLOSED 16.4% 20 $1,634,200 $870 50 21 $1,538,048 $958 78 5% 10% 56% % AVG SALES PRICE AVG SPS/SF AVE DOM # CLOSED 5.8% ALL CONDOS/TOWNHOMES
ISLANDS
VENETIAN ISLANDS
In the Venetian Islands condo/townhome market, the sales reached their highest point in March, with the average price being around $1.26 million and the $1M+ market at $3.36M. Additionally, the luxury condos/townhomes priced at $1 million or more also peaked in March, with an average price of $3.3 million.
Jan Feb March April May June $2,000,000 $1,500,000 $1,000,000 $500,000 $0 2022 2023 AVG SALES PRICE BY MONTH JANUARY VS. JUNE Jan Feb March April May June $1,313,000 $846,938 $1,262,125 $965,000 $1,074,094 $1,346,375 $1,841,000 $887,182 $981,727 $895,722 $631,000 $946,722 2023 2022 % -28.6% -4.5% 28.5% 7.7% 70.2% 42 2% 2023 MID YEAR AVG. 2022 MID YEAR AVG. $1,129,592 $970,5000 Jan Feb March April May June $3,000,000 $2,000,000 $1,000,000 $0 2022 2023 Jan Feb March April May June $1,987,778 $3,190,292 $3,367,600 $3,162,368 $2,025,497 $1,741,257 $2,729,521 $2,927,855 $3,313,276 $3,760,444 $2,802,678 $2,757,917 2023 2022 % -27% 8.9% 1 6% -15 9% -27.7% -36.8% 2023 MID YEAR AVG. 2022 MID YEAR AVG. $1,538,048 $1,634,200 ALL CONDOS/TOWNHOMES $1M+ CONDOS/TOWNHOMES
VENETIAN ISLANDS AVE. # OF SALES BY MONTH 2023 TOTAL # OF SALES 41 AVE # OF SALES BY MONTH 2022 TOTAL # OF SALES 60 Jan 8 March April May June Jan 11 March April May 9 4 Feb 8 5 8 8 7 Feb 11 9 13 June ALL CONDOS/TOWNHOMES Jan 2 March May June Jan 3 April May 4 2 Feb 3 2 4 8 5 Feb 4 2 2 June March April AVE. # OF SALES BY MONTH 2023 TOTAL # OF SALES 21 AVE # OF SALES BY MONTH 2022 TOTAL # OF SALES 20 $1M+ CONDOS/TOWNHOMES
THANK YOU